


Abstract
This study investigates the selection and scaling of recorded strong ground motions in the time-domain spectral matching framework to realistically represent the seismic demands on the superstructure and secondary systems in the seismic design of complex facilities such as marine ports. The time-domain spectral matching method iteratively adjusts the original record in the time domain by adding wavelets with limited durations and specific period ranges to achieve compatibility with the specified target acceleration response spectrum. A site-specific probabilistic seismic hazard analysis (PSHA) was performed for a port facility in İskenderun Bay, an area affected by the 6 February 2023 earthquakes. Horizontal Ground-Motion Response Spectra (GMRS) were derived for different return periods. Based on the hazard deaggregation, recorded ground motions compatible with the seismotectonic context of the region and the site conditions were selected. These records were then processed using time-domain spectral matching (TDSM) to match their elastic response spectra with the target GMRS over specific period ranges. The method utilizes spectral matching in the time domain to improve the match with the target spectrum while preserving the phase information and non-stationary nature of the records. The results show that the mean spectral acceleration curves of the scaled records are highly consistent with the target GMRS over a wide range of periods and that near-fault pulse-like characteristics, when present, are reasonably preserved. These results confirm that time-domain spectral matching provides a reliable framework for the performance-based assessments of complex port infrastructures by achieving high compatibility with the target spectra while preserving the physical characteristics of the waveforms
1. Introduction
Seaports are structures of strategic importance for supply chains and emergency logistics, ensuring the continuity of functions of facilities by reducing earthquake risk to critical structures and contributing to sustainability. In other words, considering the life cycle cost, it is also extremely important to establish a feasible design framework to minimize repair costs. In recent years, devastating earthquakes in various parts of the world, including Turkiye, have clearly demonstrated the importance of designing seaports that are resistant to seismic impacts in active fault zones.
Severe earthquakes not only have effects near the epicenter, but also in more distant areas, such as ground deformation and soil liquefaction, which significantly affect the performance of coastal and port structures. In the Hyogoken-Nanbu earthquake (Japan, 1995), 240 berths in the port were damaged to varying degrees; the quay walls shifted sideways towards the sea, meaning that the port could not function for about two years [1]. The great Sumatra earthquake (2004) caused considerable damage to coastal structures due to liquefaction [2]. In the Haiti earthquake (2010), part of the coastal land was lost, a large part of the delta liquefied and many coastal structures were damaged [3]. In the Maule earthquake (Chile, 2010), damage to numerous coastal structures was observed over a north–south extension of around 1000 km [4]. In the Kaikōura earthquake in New Zealand (2016), gravel and sand accumulations in connection with liquefaction were observed near the harbor entrance; a pier sank below the water surface and the foundation connections of piers and quays were damaged [5]. During the earthquake in Sulawesi (Indonesia) in 2018, extensive liquefaction occurred in areas close to the coast [6].
In the last three decades, two major earthquakes in the Marmara and Eastern Anatolia regions have demonstrated how critical earthquake-induced destruction can be for Turkiye’s seaports. The 1999 Gölcük and Adapazarı earthquakes in the Marmara region caused significant damage to coastal structures and quays. Some structures shifted towards the sea, the seabed subsided, and as a result, certain maritime structures including port facilities used by the Navy—suffered severe damage [7]. In the large area affected by the earthquakes on 6 February 2023 (the Kahramanmaraş earthquake), Hatay province—especially the port city of Iskenderun—was exposed to liquefaction-induced ground deformations. Liquefaction effects observed in Iskenderun included seaward lateral spreading and damage to coastal protection structures, especially piers and port facilities [8].
As seaports are subject to complex interactions, there is a need for effective and advanced design approaches when designing critical infrastructure, such as performance-based designing methods that can cover multiple hazard scenarios. When applying a performance-based design approach for the seismic design of ports, one of the fundamental issues in seismic performance assessment procedures is the selection and scaling of ground motions required for nonlinear time history analysis. The literature identifies three main sources for obtaining the acceleration time histories required for such analyses. The first is the generation of artificial recordings that are compatible with a design response spectrum (e.g., SMSIM developed by Boore [9,10]). Such recordings are created by deriving a power spectral density function from a smoothed response spectrum corresponding to the target response spectrum and adding random phase angles to generate sinusoidal signals. The second source is simulated recordings generated with a general physics-based simulation algorithm that considers seismological source models as well as path and site effects (e.g., the EMPSYN developed by Hutchings [11] and implemented in the Marmara Sea by Mert et al. [12]). The third source is the actual strong ground motion acceleration recordings taken from seismic monitoring networks. These recordings provide comprehensive information on the nature of ground shaking, covering all ground motion characteristics such as amplitude, frequency content, energy distribution, duration and phase characteristics. In addition, the acceleration time series reflect many features related to the source, wave propagation path and local site conditions.
In recent years, the increasing availability of strong ground motion records has made the use of real recorded acceleration data an important research topic in this field. However, although global strong ground motion databases are expanding rapidly, it is often not possible to comprehensively capture the full range of possible combinations of seismicity parameters such as magnitude, fault mechanism, source-to-site distance, and soil class. Conversely, seismic design codes generally place greater emphasis on compatibility with a target response spectrum than on seismological parameters. Therefore, in practice, record selection is usually based on strong motion parameters such as peak ground acceleration (PGA), peak ground velocity (PGV), and duration. The selected records are scaled to match the specified design response spectrum or Uniform Hazard Spectrum (UHS). Studies in the literature have examined how these methods affect the probabilistic nature of seismic hazards and the correlation among spectral accelerations at different periods (Hancock et al., 2006 [13]; Haselton et al., 2011 [14]). Recent research on the selection and scaling of ground motions exhibiting near-fault effects and velocity pulses indicates that such records can increase seismic demand levels, particularly in flexible systems and under weak soil conditions (Alavi & Krawinkler, 2004 [15]; Kalkan & Kunnath, 2006 [16]; Iervolino et al., 2010 [17]).
Ground motion selection and scaling are critically important for the seismic assessment and design of structures and require the use of ground motion (GM) records tailored to the dynamic response characteristics of the structure. Although no full consensus has yet been reached on a unified methodology in this regard, a substantial body of research has emerged in recent years. Bradley (2010) [18] proposed the Generalized Conditional Intensity Measure (GCIM) approach, which simultaneously accounts for multiple intensity measures that influence seismic response, thereby providing a holistic and statistically consistent framework for ground motion selection. Subsequently, Ghotbi and Taciroglu (2021) [19] further advanced the GCIM-based ground motion selection methodology by introducing multi-IM conditioning that emphasizes different ground motion content characteristics and by advocating the selection of hazard-consistent ground motion records.
Ground motion scaling generally involves the conversion of strong ground motion records recorded at any station during any earthquake into a GMRS obtained from PSHA or into a design spectrum defined by a short period and 1 s ordinates in seismic design codes. There are numerous approaches to scaling ground motions in the current literature. The linear amplitude scaling of a ground motion record in the time domain is one such approach. In this approach, the recorded ground motion is scaled with a constant scaling factor to find the best match with the target spectrum within a certain period range without changing the frequency content. In other words, the ground motion is scaled so that the ordinate of the spectral acceleration matches the design spectral acceleration at the fundamental period of the structure in the loading direction. The linear amplitude scaling can be done by multiplying the entire time series of the recording by a scaling factor. Therefore, it is a very simple approach to apply. This method preserves the original waveform of the recording while increasing or decreasing its amplitude. However, this simple scaling method does not guarantee that the spectral shape of the recording will completely match the target spectrum. This type of scaling is not practically used in current practice.
In today’s practice, more advanced scaling methods, i.e., spectral matching techniques, are preferred to ensure the reliability of nonlinear time history analysis in performance-based design. The concept of spectral matching is to modify the original acceleration time series to match the target spectrum over a desired bandwidth with minimal changes in the velocity and displacement characteristics of the recording. Spectral matching can be performed in both the time and frequency domain. Spectral matching in the frequency domain is performed by changing the Fourier amplitude spectrum (FAS) of the original ground motion, while spectral matching in the time domain is performed by adding wavelets to the original ground motion. Compared to the frequency-domain methods, the time-domain methods cause less distortion and better preserve the non-stationary properties of the original ground motion (Al Atik, L. and Abrahamson, N., 2010 [20], Nie, J et al., 2023 [21]).
Spectral matching in the time domain was first proposed by Kaul [22] and later developed by Lilhanand and Tseng [23] for matching time histories that are compatible with the spectra of multiple damping responses. However, the adjustment wavelet function used by this algorithm cannot preserve the non-stationary characteristics of the original ground motion because it causes drifts in the velocity and displacement time histories. To preserve the non-stationary features of the acceleration time series without causing drifts in the velocity and displacement time histories, Atik and Abrahamson [20] proposed the convolved cosine wavelet function (conic cosine) and developed the RSPMatch09 algorithm.
In this study, spectral matching in the time domain was used, which is more complex than the scaling method in the frequency domain, but retains the general phase characteristics and the time-varying (i.e., non-stationary) characteristics of the ground motion. The objective is to demonstrate the advantages of the time-domain spectral matching method in the performance-based design of structures subject to numerous complex effects (such as maritime ports), especially when modeling structural and non-structural components with different dynamic properties. Spectral matching in the time domain matches the spectra of the recordings over the desired period range to the targeted design spectrum, while adequately preserving the non-stationarity characteristics and the energy/frequency content of the original time-history records. This is important because the code-based design spectrum or a GMRS is a spectrum that represents the sum of multiple earthquake scenarios. A ground motion that matches a uniform seismic hazard spectrum (or code-based design spectrum) attempts to simulate the hazard resulting from the combination of multiple earthquake events in a single data set. For this reason, the use of spectrum-compatible earthquake records in design to represent the seismic hazards associated with a code-based design spectrum (or with GMRS) remains very complex and a topic on which full consensus has not yet been reached.
The key elements that represent the main motivation for this study are the following:
Selection and spectral matching earthquake records to the site-specific GMRS for the port area in order to accurately capture the seismic demands on the port structure (superstructure) and the secondary systems of the port structure, while preserving the non-stationary characteristics of the records. The term superstructure refers to the primary load-bearing components of the seaport, such as the supporting columns, beams, platform slabs of the wharf or jetty, dolphins (mooring structures), and pile foundations. In contrast, secondary systems do not directly contribute to the structural load-bearing capacity during an earthquake but are essential for the operational functionality of the port facility. These systems include crane systems, pipelines, equipment support structures, electrical panels, cable installations, and storage tanks.
This study aims to develop spectrum-compatible ground motions using a time-domain spectral matching method, which offers a more realistic representation of seismic demands than traditional frequency-domain scaling approaches and can be effectively applied in the performance-based design of complex structures such as marine ports. The findings indicate that this method, which preserves phase relationships, energy distribution, and the time-dependent (nonlinear) characteristics of recorded ground motions, can realistically model near-fault effects, particularly velocity pulses. Previous studies on near-fault pulse-like ground motions have shown that long-period velocity pulses concentrate seismic energy around the pulse and can lead to highly adverse consequences, especially for flexible systems (Chen, G. et al., 2023) [24]. It has also been demonstrated that long-period velocity pulses increase liquefaction potential, particularly in weak or liquefiable soil layers, and that post-liquefaction lateral displacements and ground settlements can be significantly amplified (Wu, Q. et al., 2021) [25]. In this context, the present study emphasizes that realistically modeling these near-fault effects is critical for a reliable performance-based assessment of port structures. Furthermore, by using a site-specific GMRS for the port area, a set of earthquake records appropriately scaled for components with different dynamic characteristics has been obtained, enabling more reliable time-history analyses of port structures. Additionally, acceleration records from near-fault stations during the 6 February 2023 earthquakes have been transformed, using the proposed approach, into scaled motions suitable for use in performance-based design. Overall, this study enhances performance-based earthquake design methods and makes a significant scientific contribution to the existing literature by strengthening the link between the representation of seismic hazard and the assessment of structural performance.
2. Seismotectonic and Site Characteristics of the Research Area
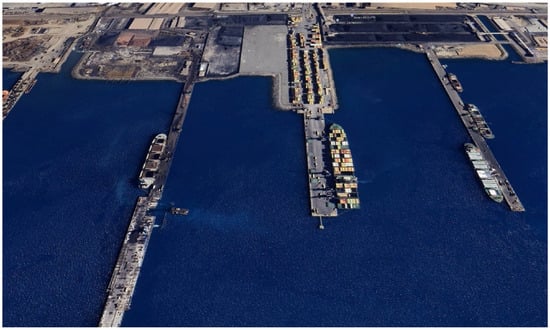
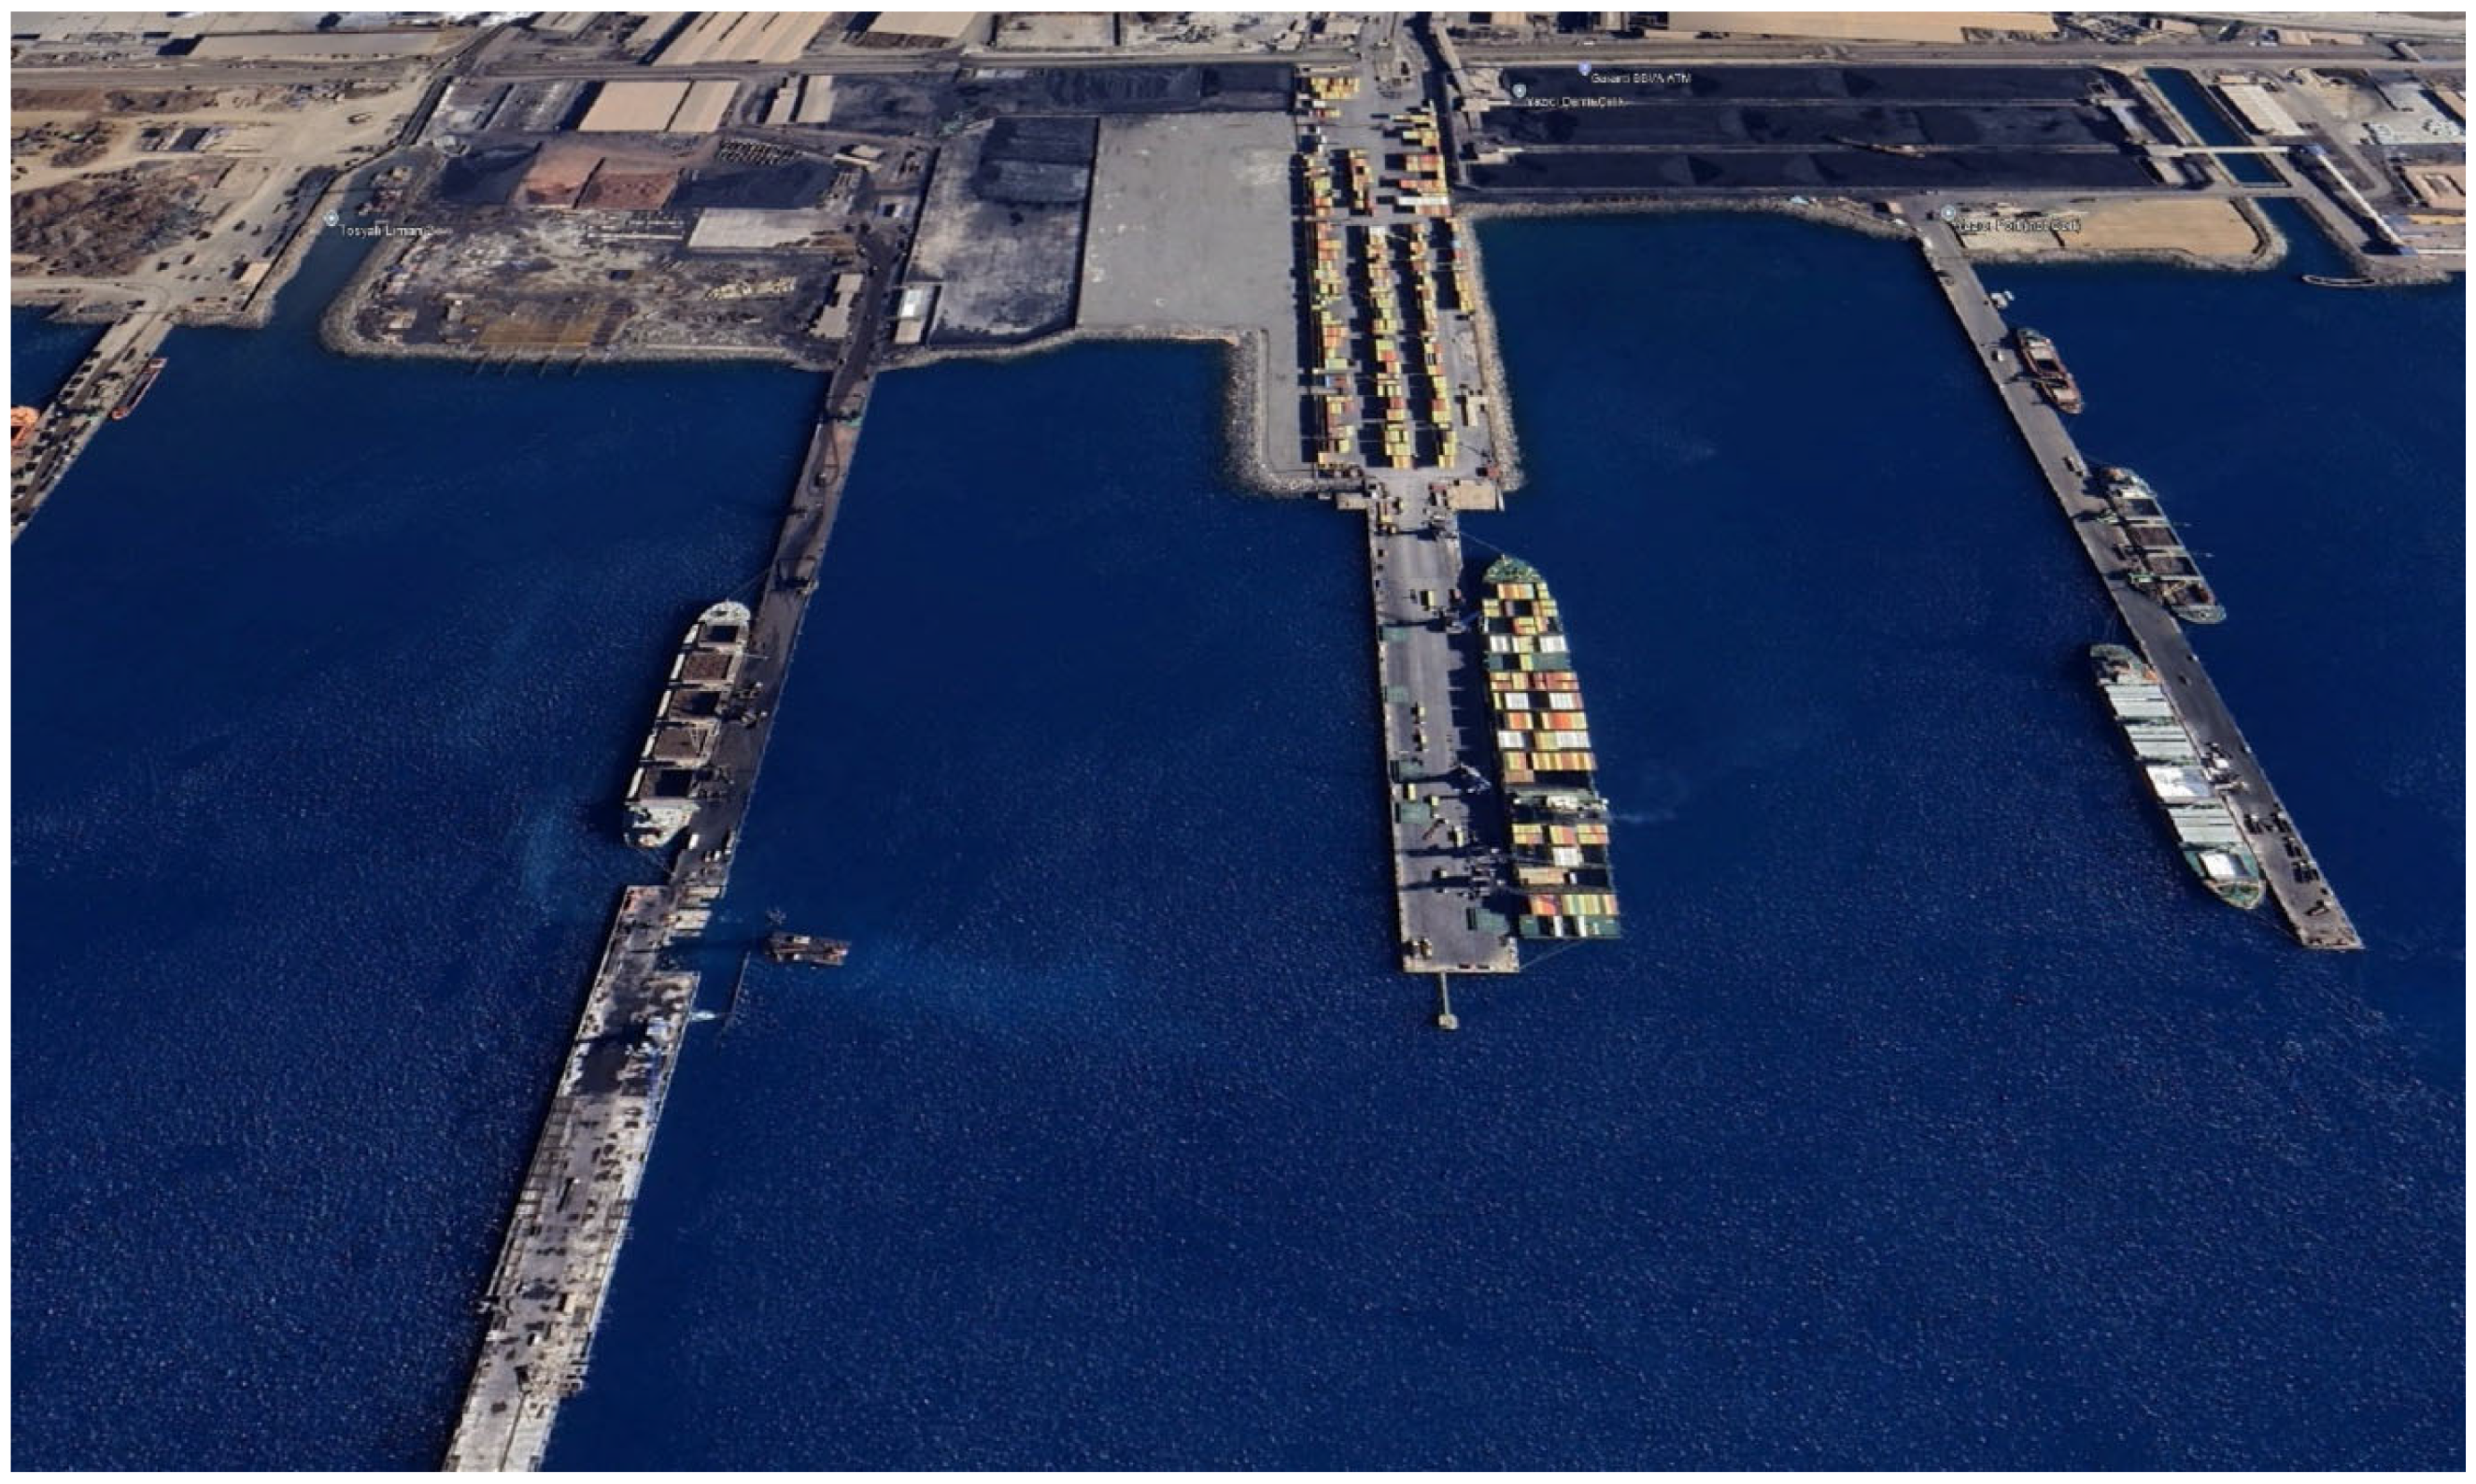
The Gulf of İskenderun, which extends in the northeast of the eastern Mediterranean, is a semi-enclosed basin between the mouths of the Strait of Hurma and Cape Hınzır, which runs in a northeast–southwest direction and is about 20 miles wide and 40 miles long. In the Gulf of İskenderun, Assan Port Operations (K36.686457° E36.201786°), a container terminal with a capacity of 400,000 TEU, was put into operation at the end of 2010 (Figure 1).
Figure 1.
General view of the Assan Port.
The existing pier consists of a total of four berths separated by expansion joints, each with a width of 45.00 m and a length of 91.55 m, which corresponds to a total length of 366 m. A total of 672 piles—12 piles in each typical axis—are embedded in the ground and connected at an angle with 1.75 m high and 2.00 m wide end beams. The reinforced concrete superstructure is supported by steel piles with dimensions Ø 965.2/12. The piles were constructed with an inclination of 1 V/4 H to give the system rigidity against lateral loads. To prevent the inclined piles from colliding with each other, the horizontal inclination directions were designed at different angles. The connection between the piles and the superstructure was created by constructing reinforced concrete plugs. The pile lengths vary along the longitudinal section of the pier.
According to the General Directorate of Mineral Research and Exploration (MRE) fault map (2012) [26], the port facility affected by the earthquakes on 6 February 2023 is located about 1.5 km from the nearest fault trace, the Payas segment of the İskenderun Fault. The present-day geodynamics of the eastern Mediterranean results from the relative movements of the Eurasian, African and Arabian plates [27,28,29]. After the opening of the Red Sea in the middle Miocene, the Arabian Block, which had separated from Africa along the left-lateral Dead Sea Fault Zone, collided with the southern margin of Eurasia in the middle to late Miocene, forming the Bitlis Fold Belt. As a result of this collision, the Anatolian Plate shortened and thickened and began to move westward [27,28,29]. The Gulf of İskenderun is a subsidence basin bounded to the west by the Misis Mountains and to the east by the Dumanlı and Boz Mountains, the northern extensions of the Amanos Mountains, and contains thick Neogene sediments. Schiettecatte (1971) [30] states that tectonic activity in the region continued into the Holocene and attributes the present-day geomorphology of the Gulf of İskenderun to normal Holocene faulting.
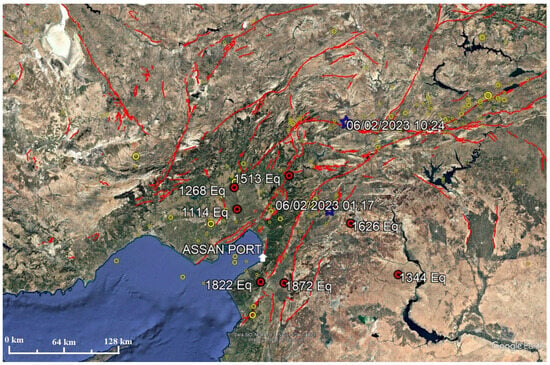
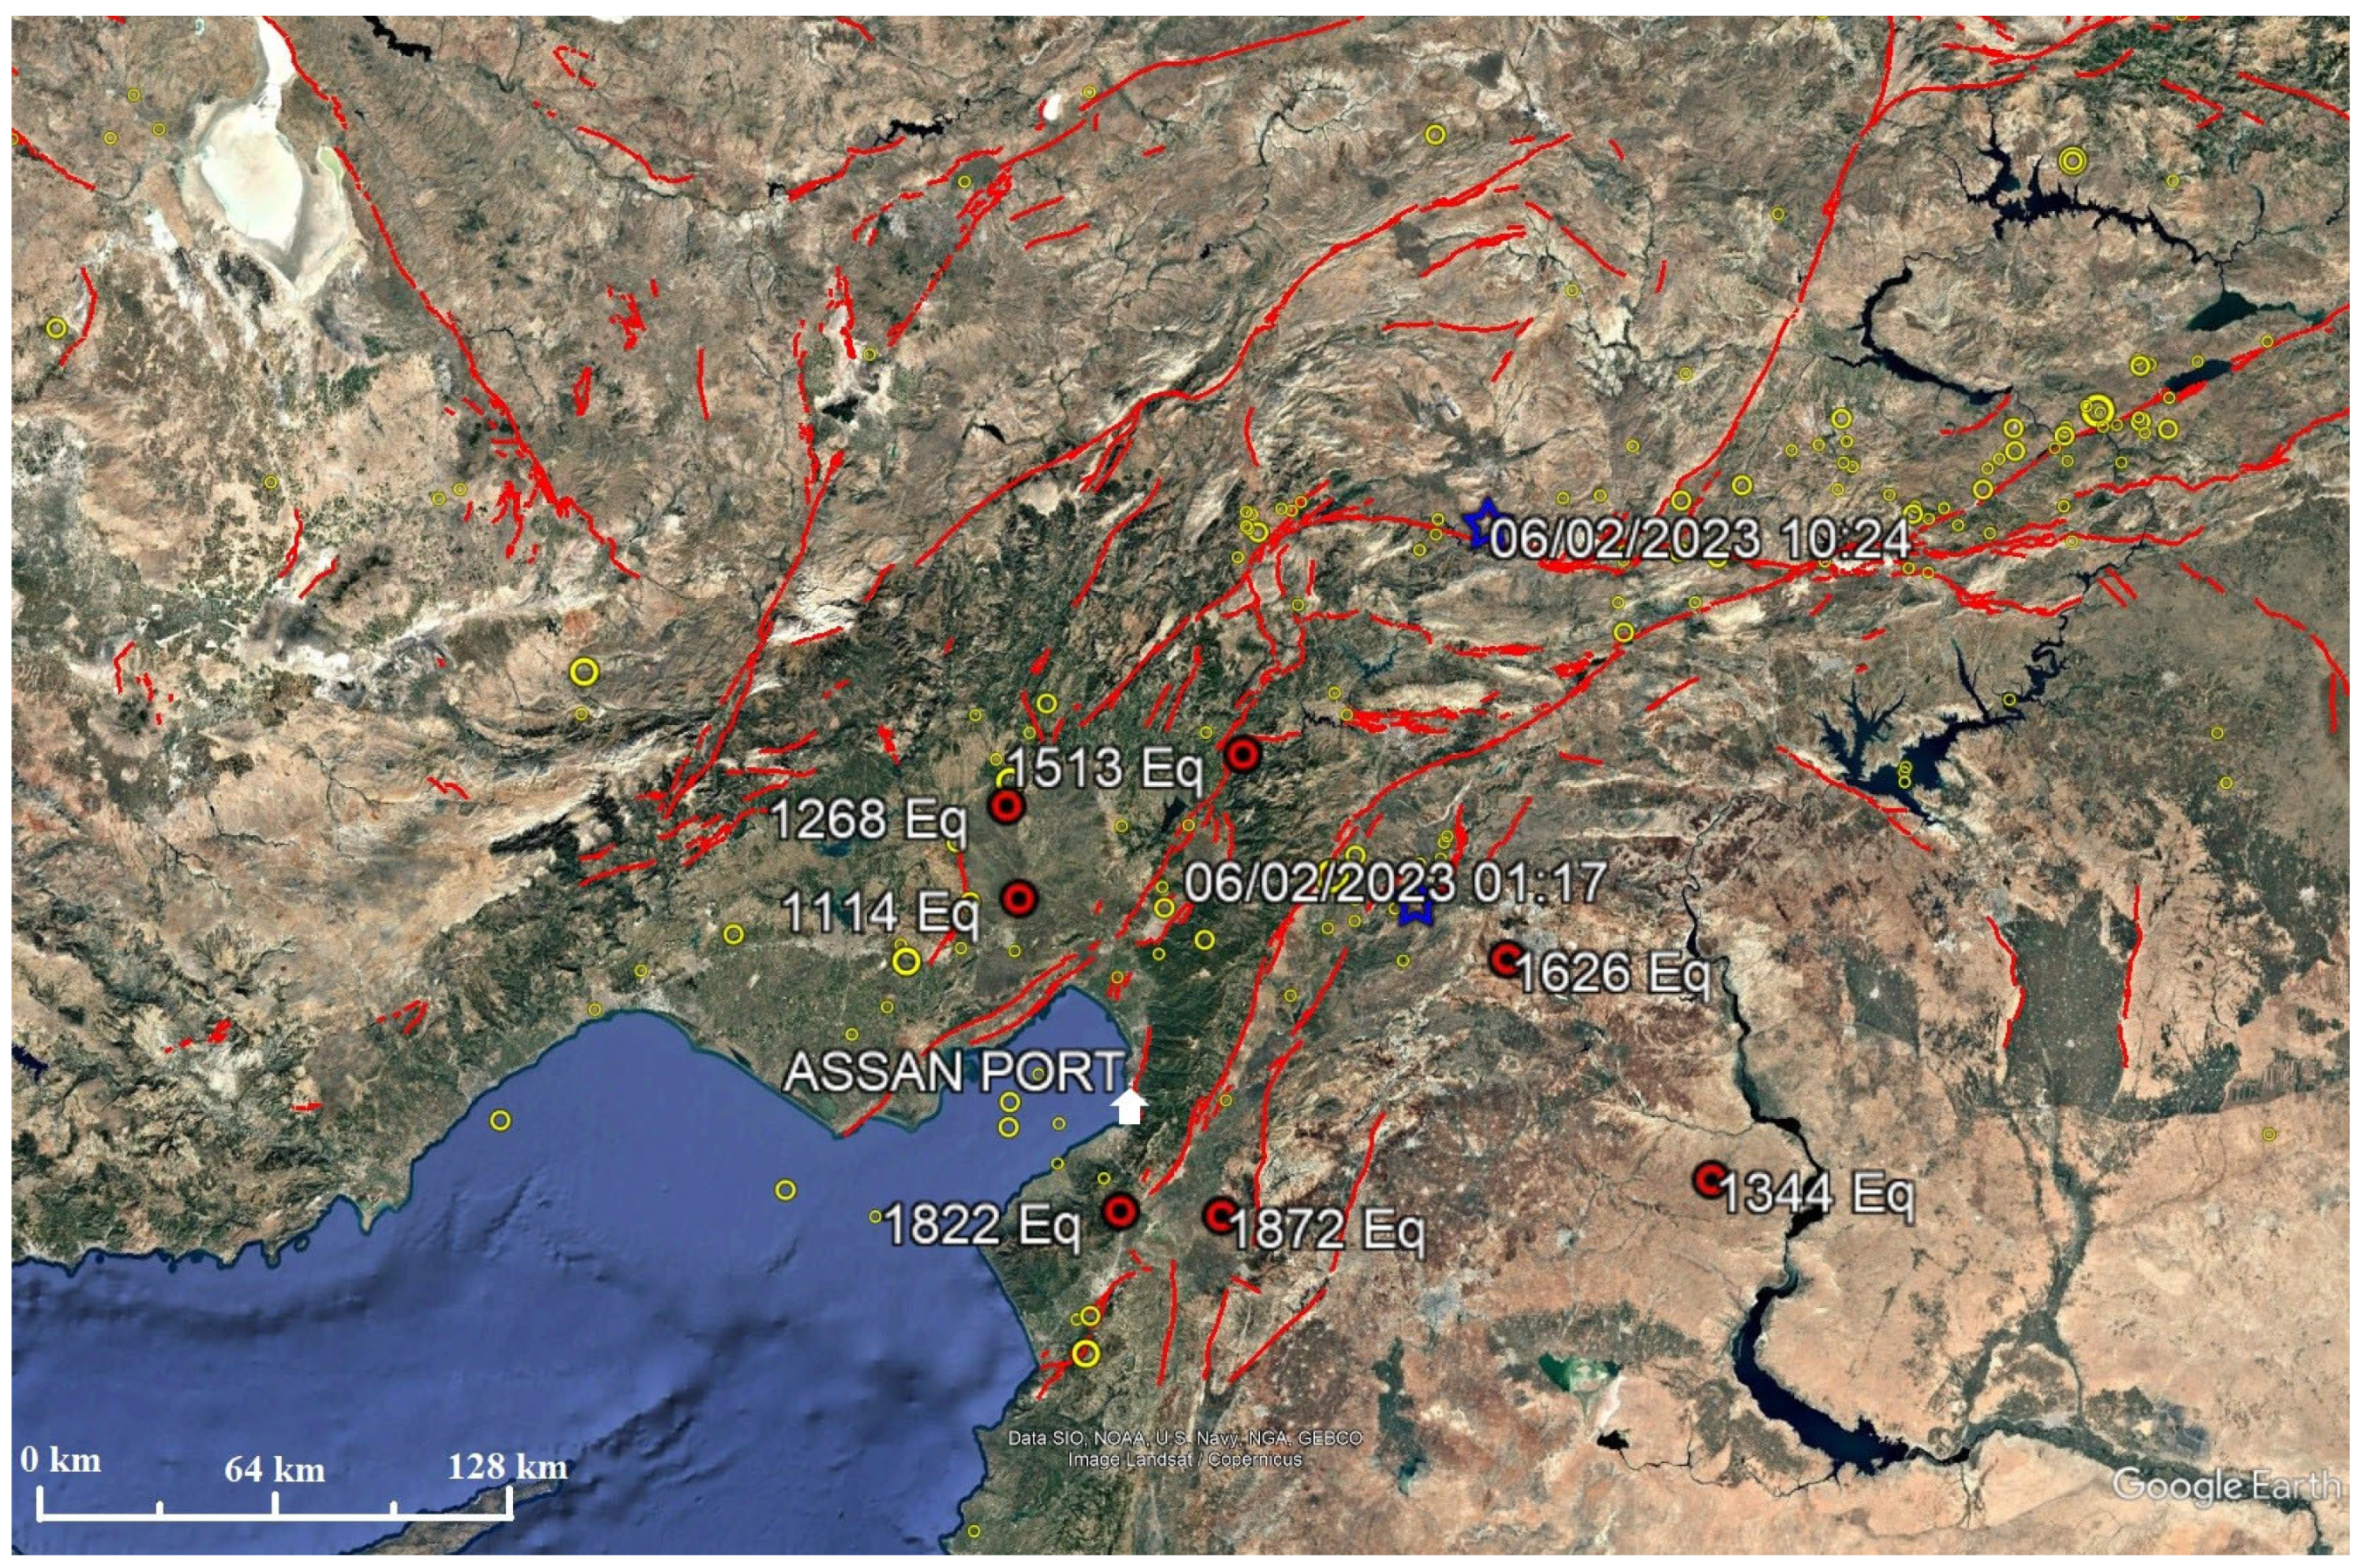
İskenderun has been repeatedly struck by severe earthquakes throughout history. Information about these events can be found in many ancient sources. Scientific excavations in Antakya have uncovered stratigraphic layers that indicate post-earthquake reconstruction, suggesting that the reports in the ancient sources are supported by solid scientific evidence. Plotting the observed epicenters of historical earthquakes on the fault map of the region does not show a uniform distribution along the fault zones, but rather a clustering around Aleppo, Latakia, Kilis and Antakya. According to the data from the Kandilli observatory, a total of 138 earthquakes with a moment magnitude Mw ≥ 5 occurred within a radius of 300 km around the study area during the instrumental period (1900 to the present) (Figure 2).
Figure 2.
Earthquakes that occurred within a radius of 300 km around the study area during the historical and instrumental period (1900 to present). In the figure, red lines indicate faults according to the MTA Fault Map (2012) [26]; red circles indicate the most destructive earthquakes that occurred in the region during the historical period; and yellow circles indicate earthquakes with a moment magnitude Mw ≤ 5 that occurred during the instrumental period. The two navy blue stars mark the epicenters of the 6 February 2023 earthquakes.
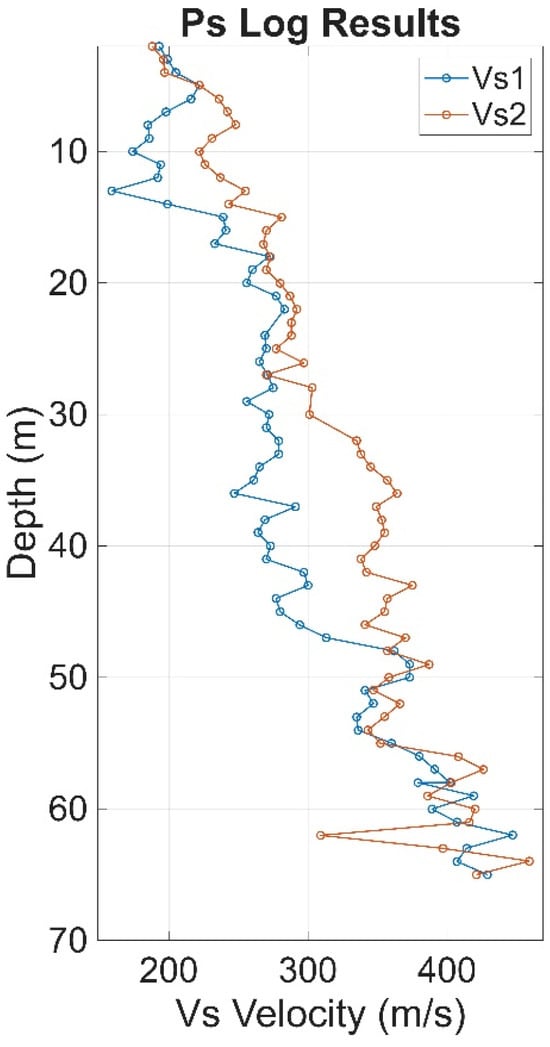
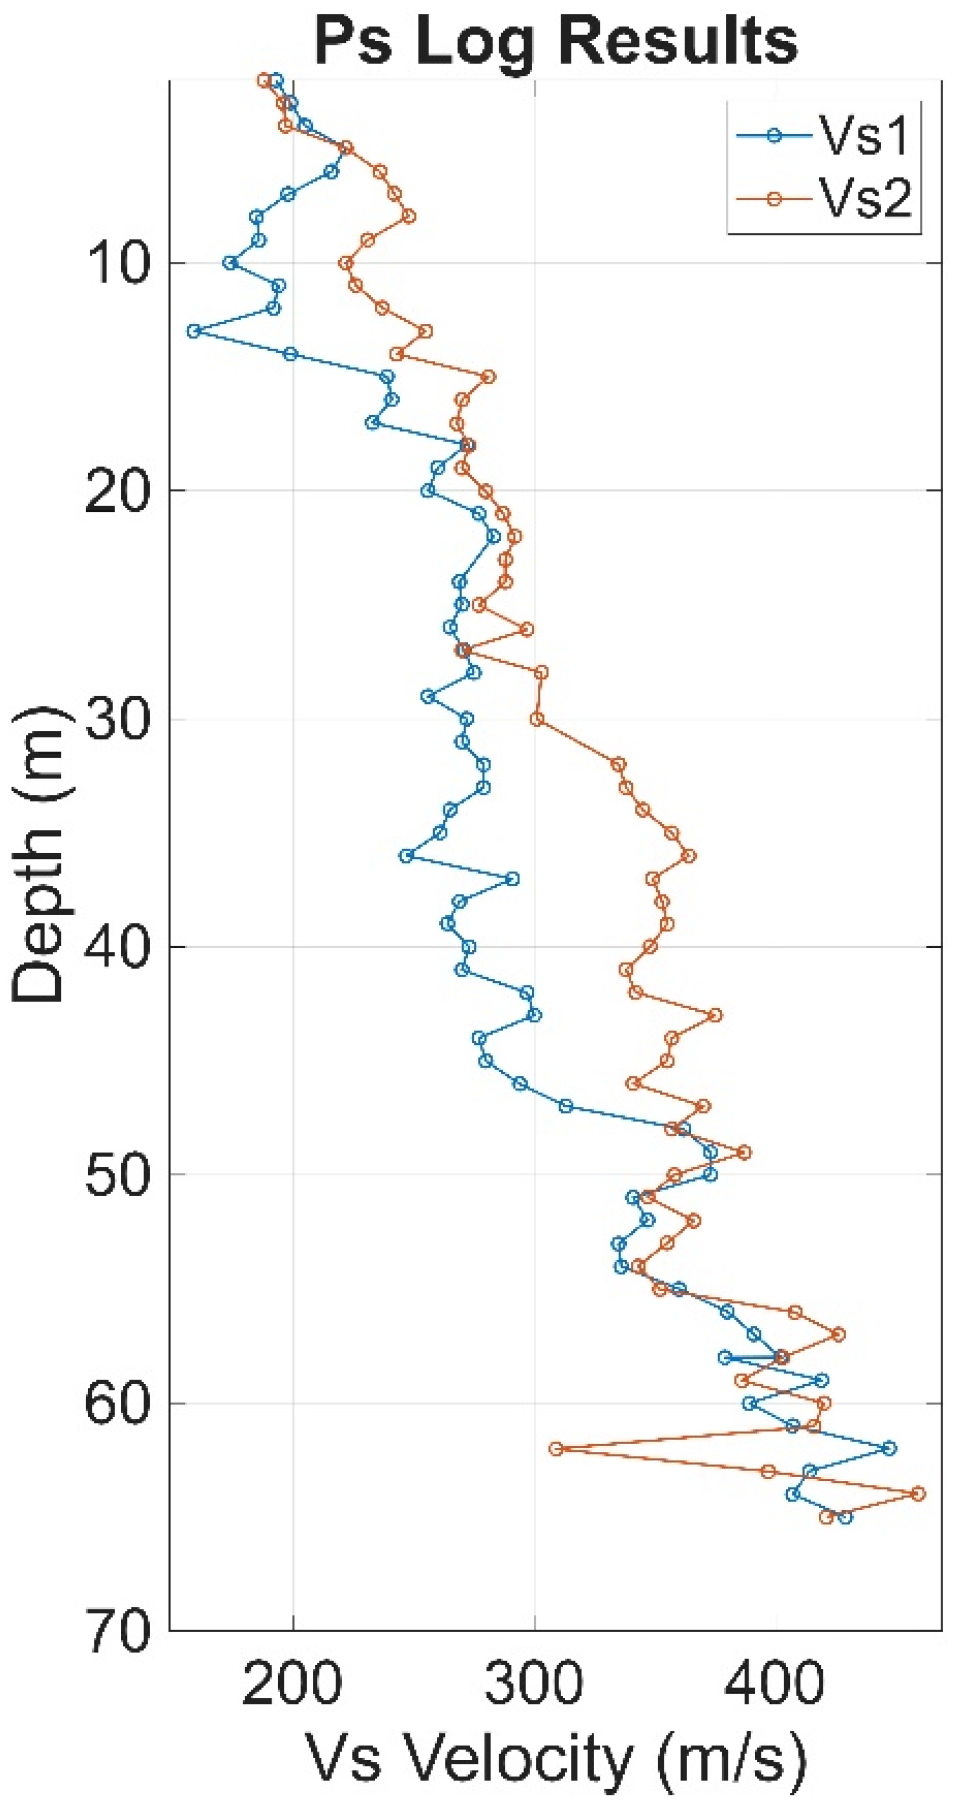
To determine the geotechnical engineering parameters for design, detailed and comprehensive site investigations were conducted at various times within the project area. Borehole drilling was performed, along with Standard Penetration Tests (SPTs), Cone Penetration Tests (CPTs), and PS logging, to characterize the subsurface soil profile with depth. These investigations provided detailed characterization of fundamental geotechnical parameters for the encountered soil units, including unit weight, cohesion, internal friction angle, and coefficient of consolidation. The engineering properties determined for each soil unit are summarized in Table 1, and the S-wave velocity profile from PS logging measurements is shown in Figure 3. A combined evaluation of the geotechnical data and PS log results indicates that at a depth of 65 m—adopted as the reference depth for the site-specific Probabilistic Seismic Hazard Analysis (PSHA)—the site is classified as soil class ZC. At this depth, the average S-wave velocity was determined to be 400 m/s, and this value was used in the subsequent design stages.
Table 1.
Engineering parameters of the soil units encountered on site.
Figure 3.
S-wave velocity profiles obtained from PS logging performed in two boreholes at the project site.
3. Materials and Methods
3.1. Probabilistic Seismic Hazard Analysis (PSHA)
PSHA is a method for quantitatively assessing the probability that a given ground motion intensity measure (e.g., PGA, PGV or spectral acceleration Sa(T)) will be exceeded at a given site within a given time period by systematically integrating the contributions and associated uncertainties of all potential seismic sources. The basic principle is to map the probability space of magnitude–distance pairs (M, R) derived from seismic sources to the site ground motions using an appropriate ground motion prediction equation (GMPE) set (considering epistemic uncertainties) and then integrate these contributions according to the total probability theorem. In this way, the annual exceedance rate function H(a) is calculated. This function allows the derivation of relationships between the exceedance probability and return period, and characterizes the distribution of annual maxima.
The pioneering formulation by Cornell (1968) [31] uses a Poisson process for the temporal occurrence of earthquakes, a truncated exponential/Gutenberg–Richter (GR) distribution for the magnitudes and stochastic representations for the source areas. McGuire (1976) [32] further developed the computational aspects of PSHA by providing an algorithmic framework for dealing with detailed source zones, magnitude–distance integrations, and multiple model configurations. The seismic hazard calculations can be represented as an application of the total probability theorem by the following equation:
In this formulation, the hazard function H(a) represents the annual frequency of earthquakes expected to generate ground motion amplitudes A that exceed a specified threshold value a. The amplitude A corresponds to an intensity measure, typically expressed as the spectral pseudo-acceleration Sa(T) at a given vibration period T.
- Vi: annual occurrence rate for source i (often defined for earthquakes wit M ≥ M0i).
- fM,i(m): magnitude distribution for source i; in practice usually a Gutenberg–Richter model with upper truncation, or tapered GR variant
- fR∣M,i(r/m): conditional distance distribution driven by source-site geometry and the selected distance metric (e.g., Rjb, Rrup, Repi)
P(A > a/m,r,θ): exceedance probability, given by the GMPE; here θ denotes model parameters (e.g., regional attenuation terms, site condition such as VS30, directivity, damping ratio) as well as residual variabilities.
3.2. Spectral Matching
The time-domain spectral matching (TDSM) method was used to match the elastic response spectra of the recorded real earthquake ground motions within certain tolerances to the site-specific GMRS (target spectrum) determined by PSHA. The main objective of this method is to iteratively correct spectral amplitude/energy deficits or excesses observed at target periods (typically around the fundamental period T of the structure and the critical lower and upper bounds for performance) using windowed (narrowband) sinusoid/wavelet functions (adjustment wavelets). The first basic assumption of the algorithm is that the peak times of the structural response do not change when adjustment wavelets are added. The method is based on the RSPMatch algorithm, which was first proposed by Kaul (1978) [22] and later further developed by Lilhanand & Tseng (1988) [23]. Theoretically, the difference between the target spectrum and the existing spectrum (spectral mismatch) is formulated as the amount to be matched in the peak response times of single-degree-of-freedom oscillators for different period–damping pairs. Assuming that a small adjustment will not change the peak time, the adjustment signal δa(t) is written as a linear combination of selected wavelet basis functions, and the contribution of each wavelet to the corresponding oscillator is determined by a convolution integral which can be calculated in closed form.
The original formulation by Lilhanand & Tseng [23] aimed to preserve the non-stationary character (time-varying envelope) of the recording while reducing the discrepancy between the elastic spectrum and the target spectrum by adding localized, narrow-band wavelets. However, drifts were observed in the velocity and displacement time series. This not only undermines physical realism, but also poses unacceptable risks for performance-based designs. To eliminate these problems, Al Atik & Abrahamson (2010) [20] proposed a cosine Gaussian wavelet (convolved cosine) approach with integral properties that provides net-zero contributions to velocity and displacement. This approach removes the drift at its source and makes the solution both computationally more efficient and numerically more stable. As a result, close match to the target spectrum was achieved over a large period range, while adequately preserving the Fourier amplitude, normalized Arias intensity, significant duration, and overall non-stationary character of the waveform.
Thus, similar to other approaches in the literature (e.g., Nie, J., Graizer, V., and Seber, D. (2023) [14]), the method has become a reliable tool for generating modified ground motions that meet spectral targets and preserve the physical consistency of the waveform for engineering analysis.
In this study, computations were performed using the 2009 version of the RSPMatch software developed by Al Atik and Abrahamson (2010) [20]. To enable the automatic assignment of various software parameters (such as the maximum number of iterations, tolerance for maximum mismatch, convergence damping, etc.) and to prepare the earthquake records for compatibility with the software, a dedicated MATLAB 2025a script was developed. The MATLAB script also converts acceleration records into velocity and displacement time histories, computes response spectra, and facilitates the visualization and graphical presentation of the results. This implementation has improved the applicability of the RSPMatch algorithm and made the overall analysis process more efficient, integrated, and automated.
4. Results and Discussion
4.1. PSHA Results
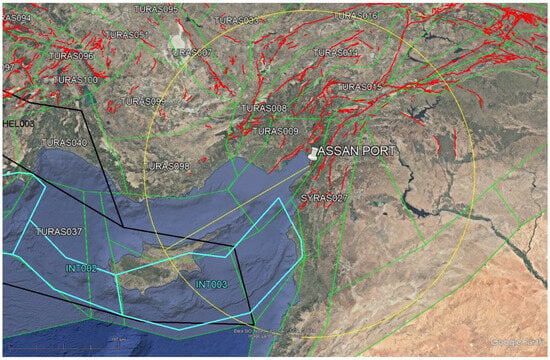
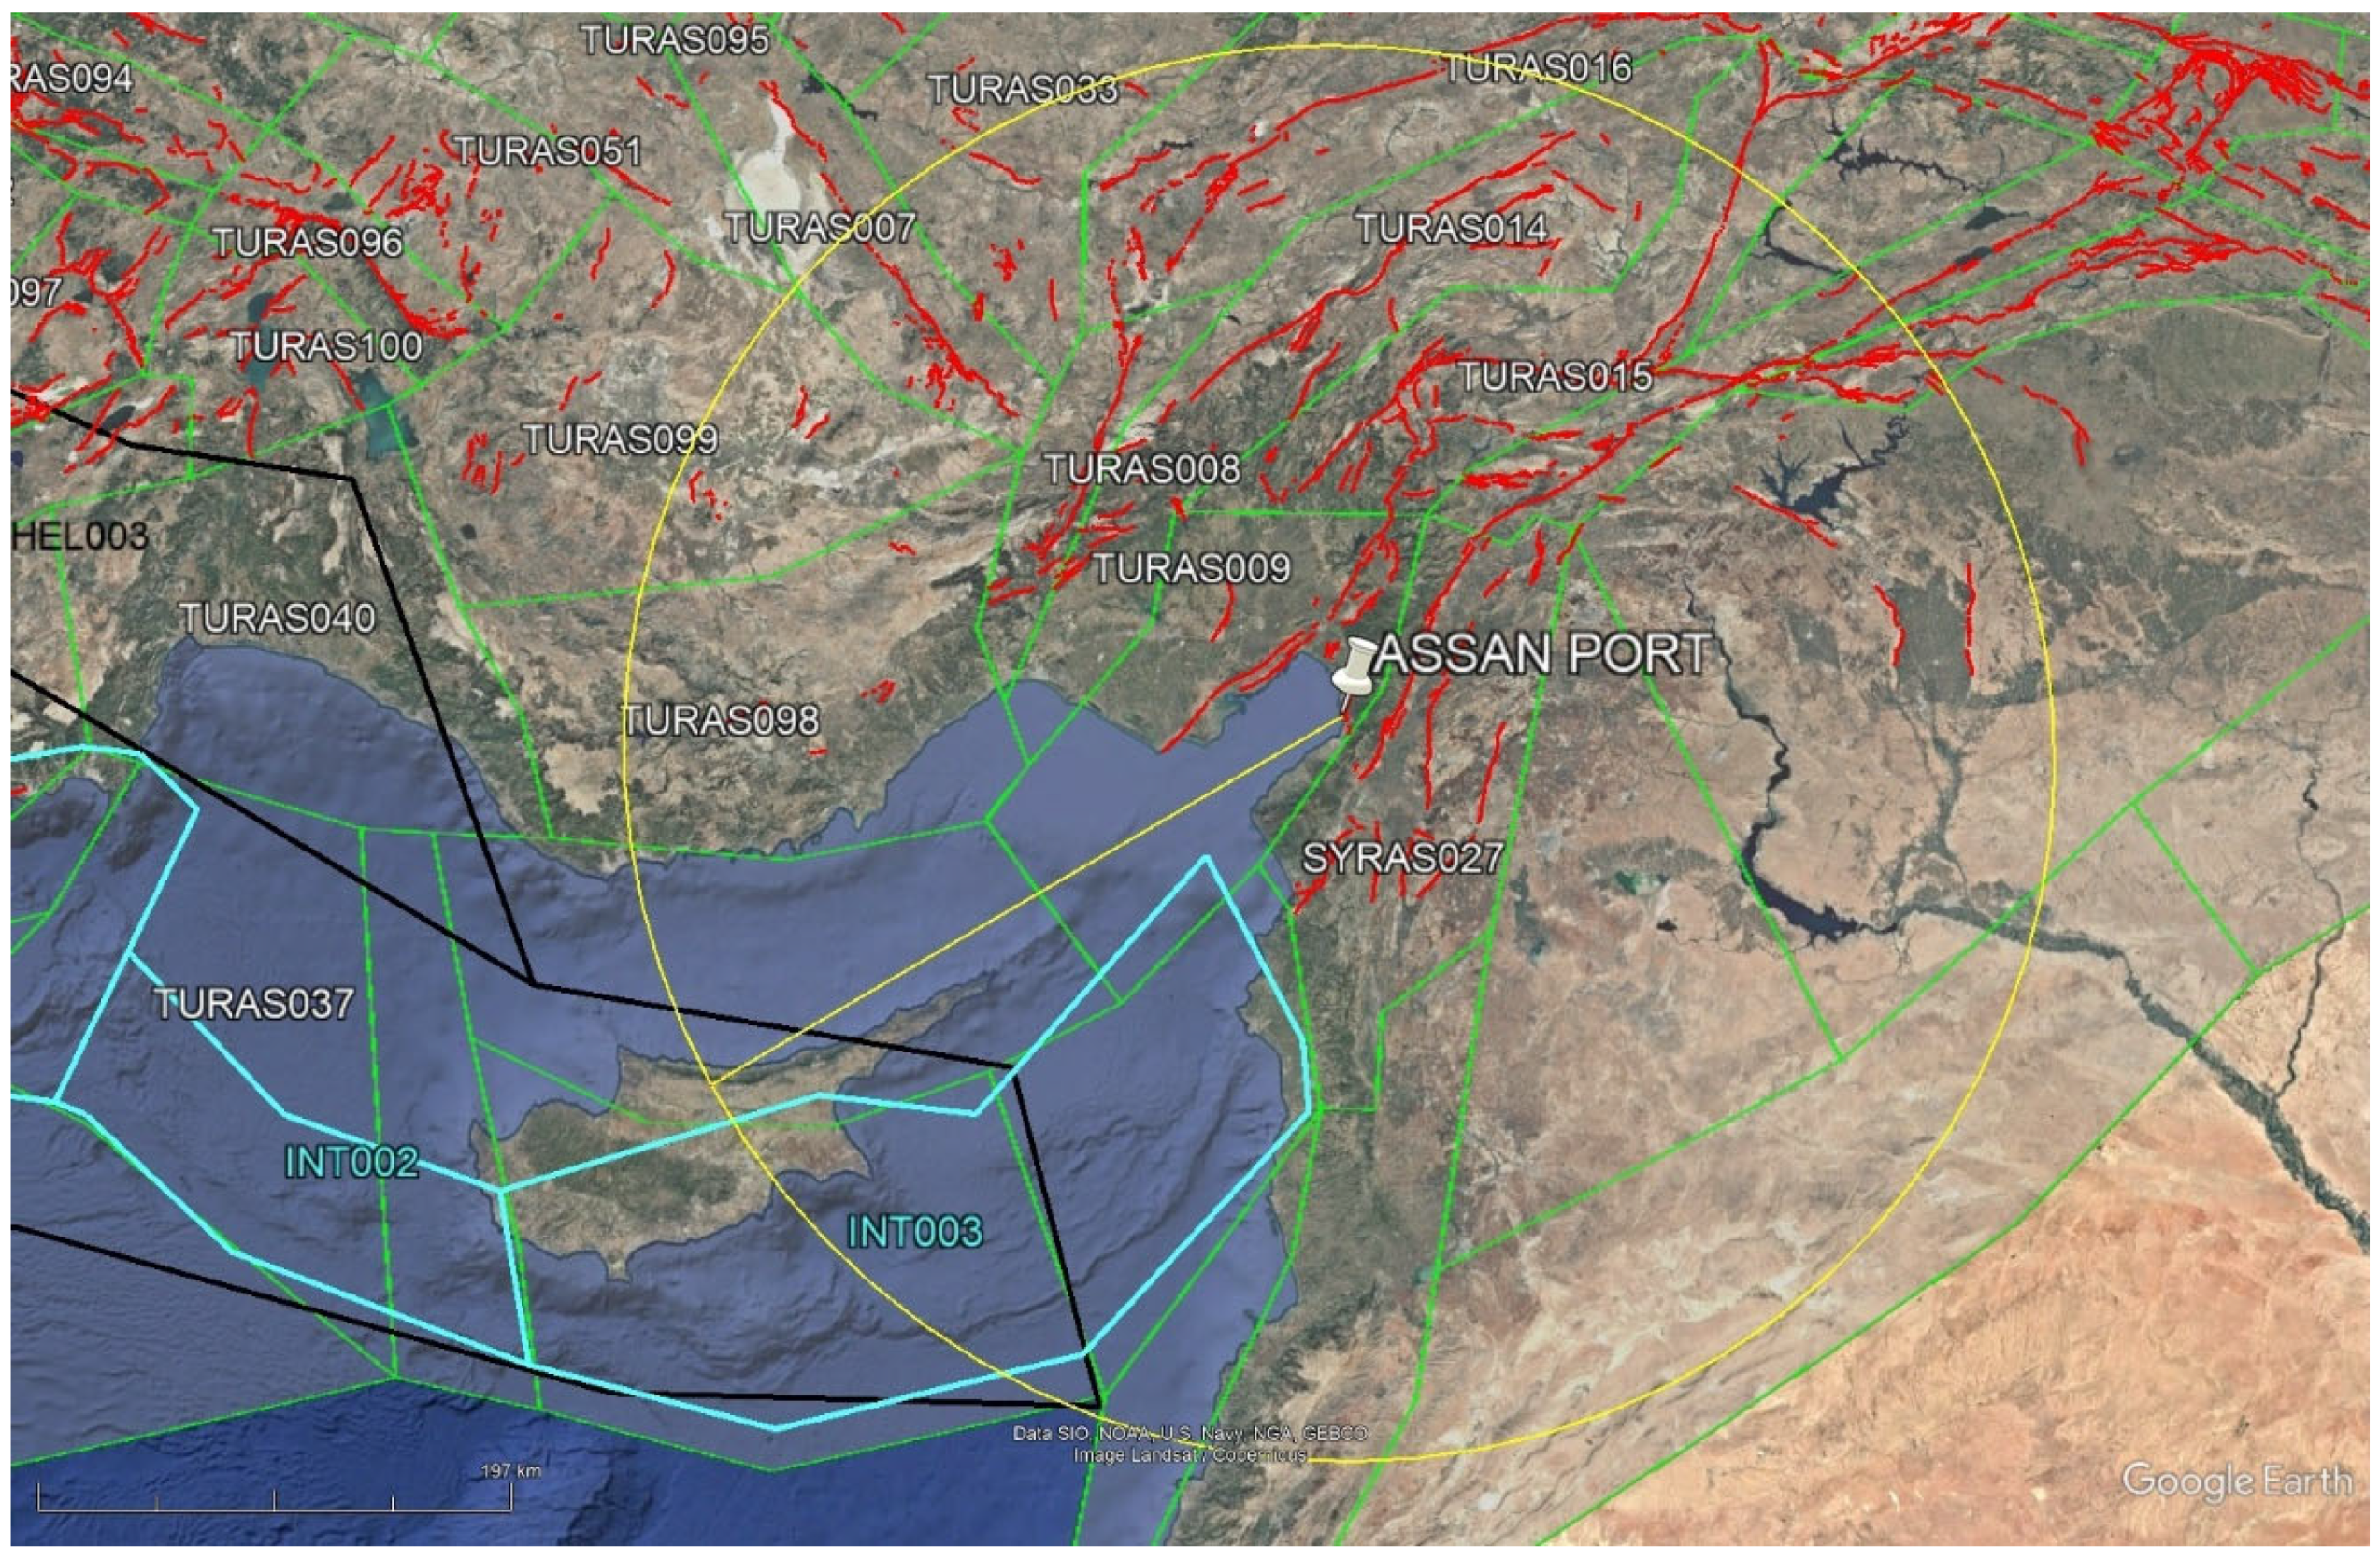
The first problem to be solved in determining the probabilistic seismic hazard is the zonation of seismic sources. In this context, seismo-tectonic maps based on macro-seismic data and paleo-seismic information are considered the most important tools to show the relationships between fault lines and earthquakes. In the analyses carried out to quantify seismic hazard, seismic sources were identified based on the characteristics of tectonic units and the spatial distribution of earthquake events. The “Update of the Seismic Hazard Map of Turkiye (UDAP-Ç-13-06)” [33] project served as the basis for these determinations, and the seismic source zonation for the study area was evaluated within this framework (Figure 4). Two different source models—linear sources (faults) and areal sources—were used in the seismic hazard calculations, and the final hazard estimates were determined by an integrated approach combining the results of these two models. In addition to areal sources which represent active earthquakes in the shallow crust throughout Turkiye, source models were also defined separately for events at the subduction boundary and in the Earth’s crust by considering deep earthquakes in the eastern Mediterranean region.
Figure 4.
Seismotectonic framework and seismic source zonation in the study area (on the map, the white pin indicates the location of the port facility. Red lines indicate fault traces—line sources based on 2012 MRE data; green lines indicate area sources; the blue line represents sources at the subduction interface; the black line indicates in-slab sources; and the yellow circle marks the region within a radius of 300 km.
The analyses were carried out in a circle with a radius of 300 km around the project coordinates. The earthquake-generating potentials of the seismic sources were determined and magnitude–recurrence relationships were established using the Gutenberg–Richter (GR) framework. New Generation Attenuation (NGA) relationships were used for the site-specific horizontal GMRS calculations. The attenuation relationships used in this study are those presented by Chiou and Youngs (2008) [34], Abrahamson and Silva (2008) [35], Campbell and Bozorgnia (2008) [36], and Boore and Atkinson (2008) [37]. The suitability of these attenuation relationships for seismic hazard calculations in Turkiye has been investigated in numerous scientific projects and publications, including the SHARE project (ESHM13; Woessner et al., 2015) [38], the EMME project (Danciu et al., 2018 [39]; Danciu et al., 2016 [40]; Akkar et al., 2014 [41]), the GEM project and the UDAP-C-13-06 project (Demircioğlu et al., 2017 [33]).
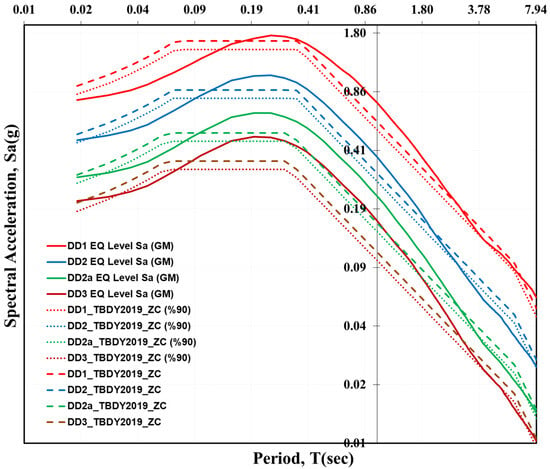
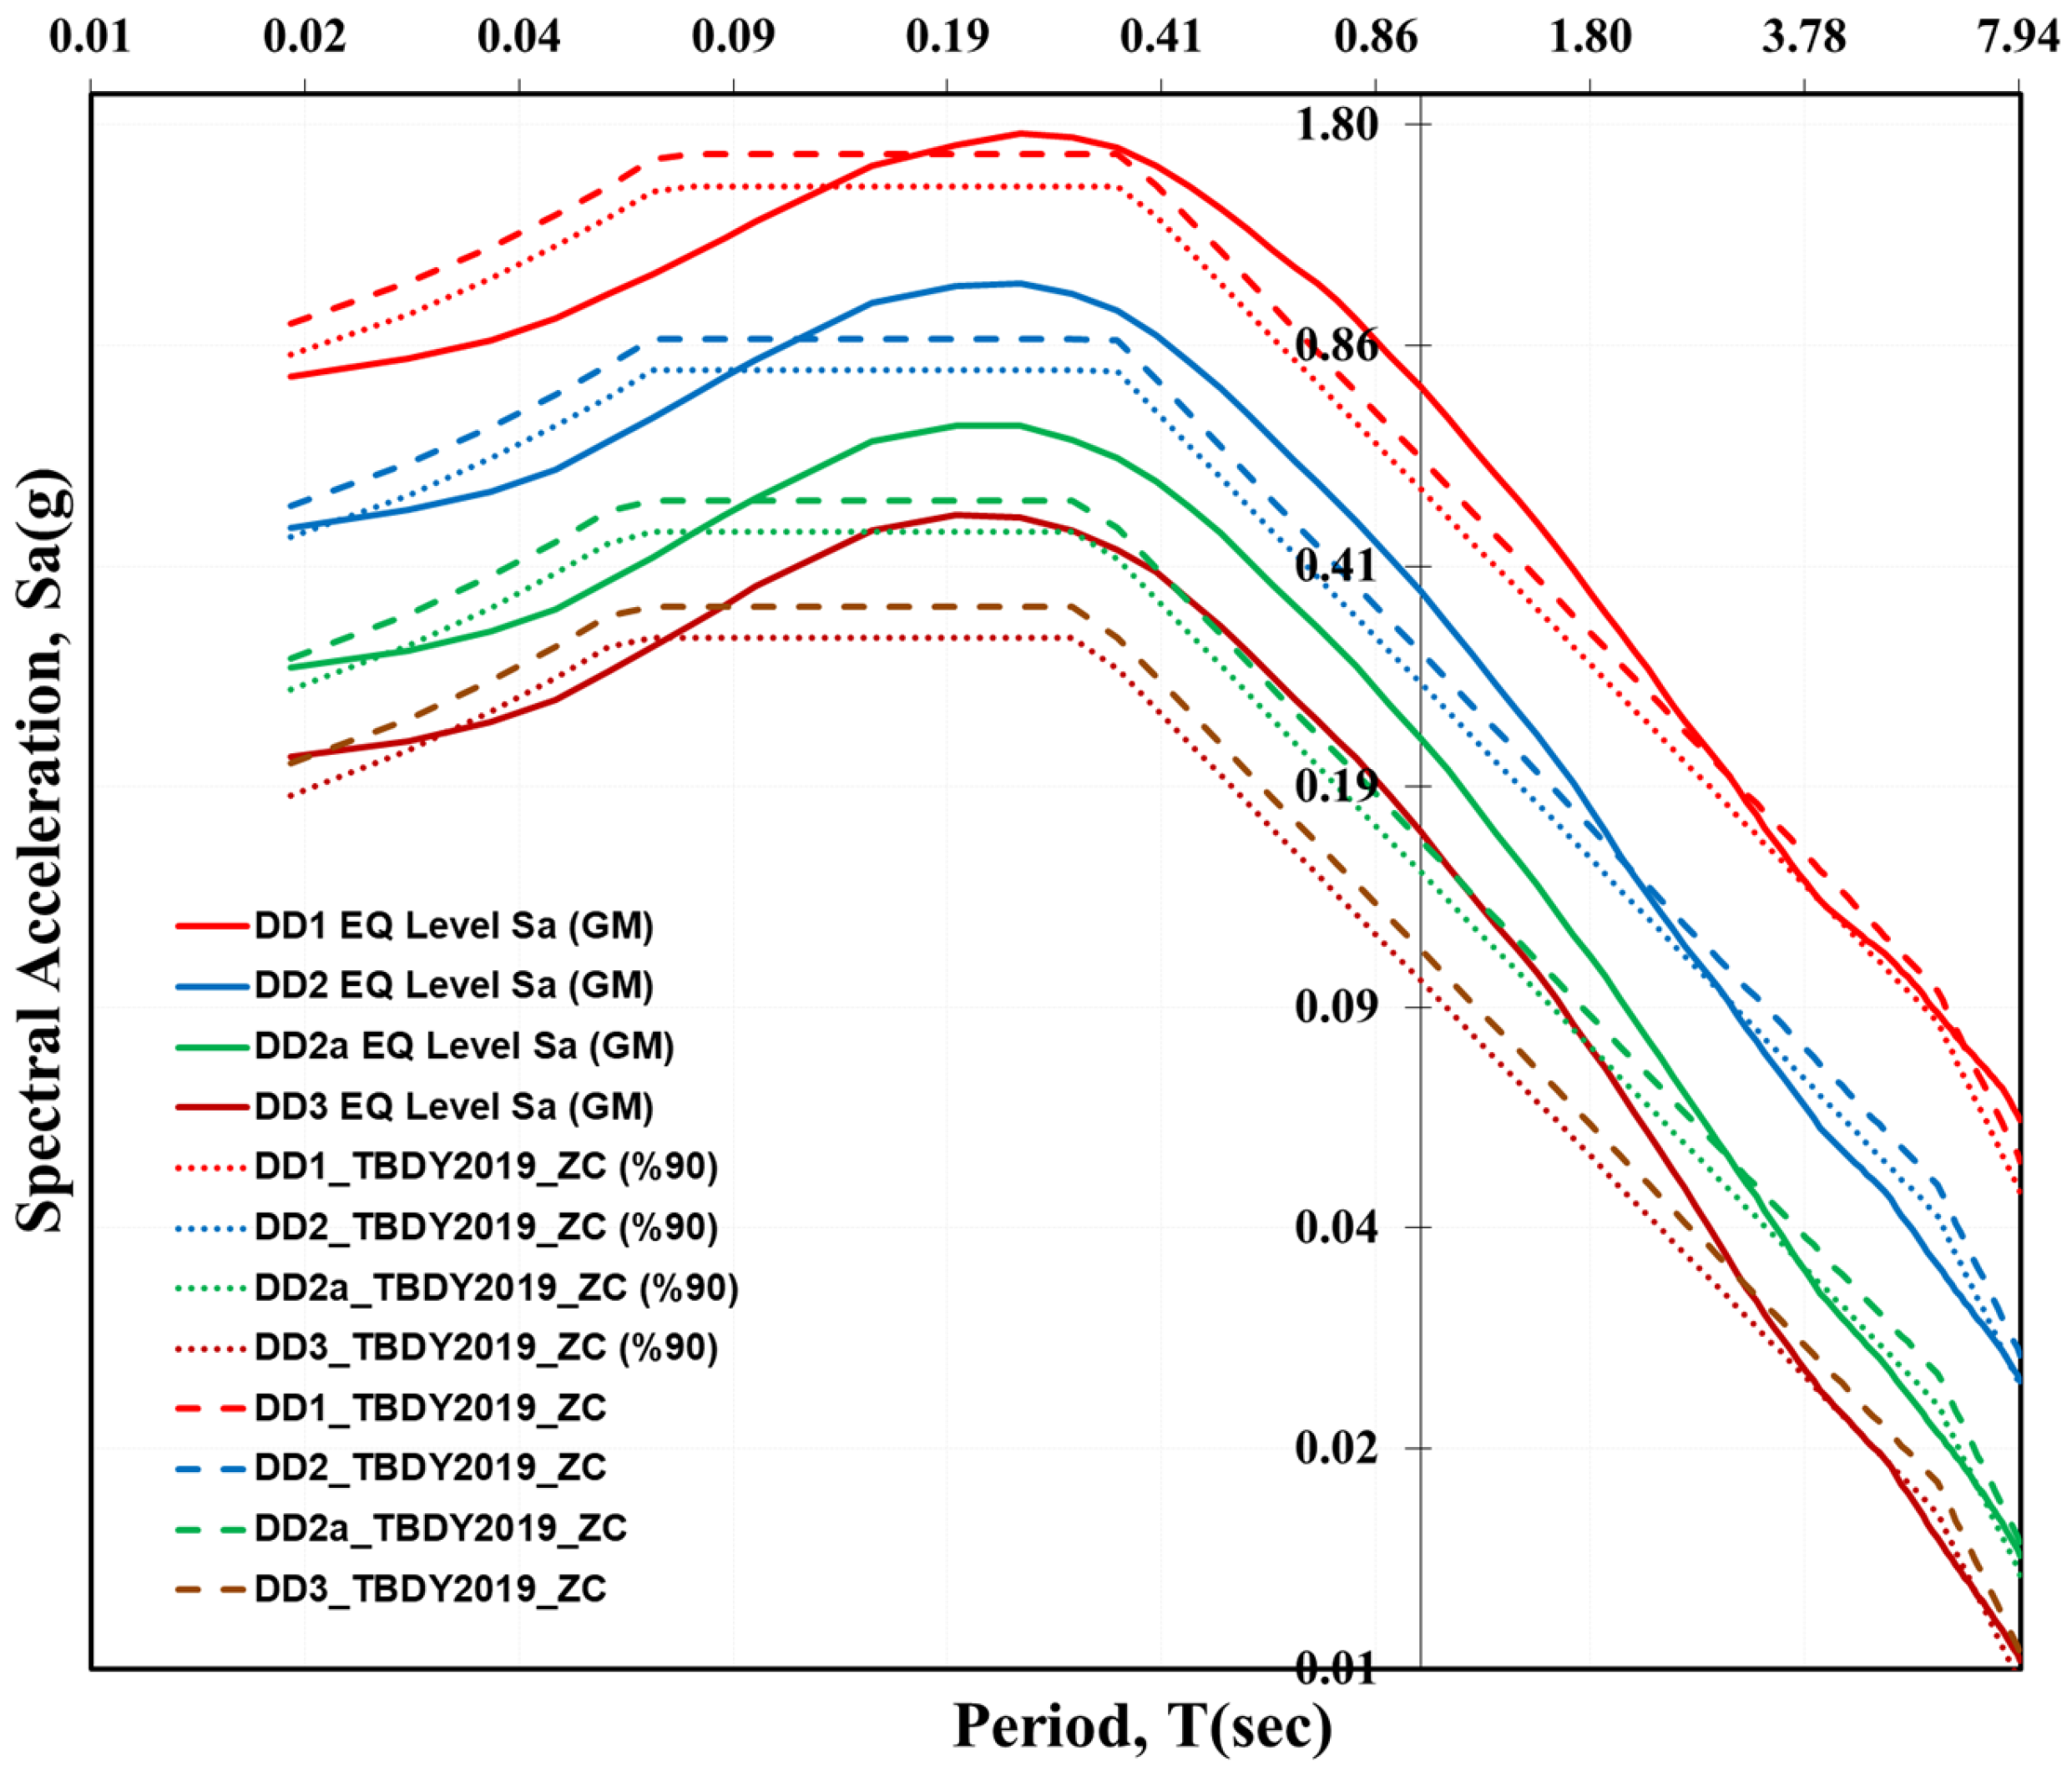
Site class ZC (Vs30 = 400 m/s), according to the Turkish Coastal and Port Structures Earthquake Code (TCPEC, 2020) [42], was selected for the performance-based assessment of the port facility. A site-specific probabilistic seismic hazard analysis (PSHA) was carried out using the EZ-FRISK software (Risk Engineering, 2015) [43], and the GMRSs were determined for four earthquake levels. For DD-1, DD-2, DD-2a and DD-3, the horizontal GMRS values with 5% damping over the period of 0.01–8.0 s are given in Figure 5 and Table 2 as geometric mean values (GeoMean). Figure 5 shows the calculated GMRS values for the study area compared to the spectra provided by the interactive web application Turkish Seismic Hazard Maps (TSHM) (tdth.afad.gov.tr (accessed on 6 June 2025)) [44] for the same location. Based on the deaggregation of the probabilistic seismic hazard results, the deterministic earthquake scenario corresponding to the 2% exceedance level in 50 years for the spectral acceleration of 1 s was calculated for the left-lateral Amanos segment with magnitude Mw = 7.8, a distance between source and site of 22.50 km and a standard deviation of ε = 1.68.
Figure 5.
Comparison of the calculated horizontal GMRS (geometric mean) and AFAD spectra in the study area (Vs30 = 400 m/s). The solid red line shows the calculated horizontal GMRS for the DD-1 earthquake level in this study. The red dashed line represents the Turkish Seismic Hazard Maps (TSHM) spectrum for the DD-1 level, and the red dotted line indicates 90% of the TSHM spectrum. The blue, green and brown curves represent the corresponding spectra for earthquake levels DD-2, DD-2a and DD-3, respectively, as described above.
Table 2.
Calculated horizontal probabilistic peak ground acceleration values and spectral acceleration values at 0.2 s and 1 s in the project site (Vs30 = 400 m/s).
4.2. Selection and Scaling of Earthquake Records (Spectral Matching)
The reliability of nonlinear time history analyses in performance-based design depends crucially on the appropriate selection and proper scaling of real earthquake records. Therefore, special attention was paid to specific considerations when selecting the earthquake records. First, records compatible with the seismotectonic characteristics of the study area (moment magnitude, fault mechanism) and site conditions (VS30/site class, basin effects, source–receiver distance, near-fault directivity) were selected, and matching was performed according to these criteria. The digital quality of the records (sampling rate, filtering, baseline correction procedures) and the completeness of the components (two horizontal and vertical) were checked; records with features that could systematically misrepresent nonlinear requirements were not considered. A data set was compiled that was suitable for the design level and statistically representative of the target spectra. An important consideration in determining the appropriate record set is the ratio between the spectra of the selected earthquake records and the target spectrum for the specified target period, i.e., the scaling ratio. Although there are different opinions on this topic in the literature, there is no doubt that this ratio should ideally be as close to one as possible. As shown in Table 3, the scaling ratios of the selected records—with the exception of the Elbistan and Landers earthquakes—are between 0.84 and 1.34. For the Landers earthquake this ratio is 2.30 and for the Elbistan earthquake 3.01. These two earthquakes show that the method still provides very good results when the scaling ratio reaches values of 2 or even 3.
Table 3.
Characteristic properties of the ground motions selected for the DD-1 earthquake level.
Real earthquake records are usually selected to match either the site-specific GMRS derived from an earthquake scenario—where the minimum parameters are magnitude, distance and local site conditions—or the elastic design spectrum for a single degree of freedom specified in seismic design codes. According to TCPEC (2020) [42], for time-history analyses, at least seven sets of ground motions must be selected (acceleration records for two orthogonal horizontal components), and these records must be scaled to the GMRS (or the design spectrum defined in the code) within the target period range of 0.2 T–1.5 T, where T is the fundamental period of the structure. In this study, seven sets of ground motions were selected considering earthquake magnitudes, fault distances, source mechanisms, and local site conditions which are consistent with the design ground motions. The selected ground motions and their characteristics for earthquake level DD-1 are listed in Table 3.
The site conditions of the stations from which the selected earthquake records originate were set to site class ZC according to TCPEC (2020) [42] and arranged in such a way that they represent different values within the range VS30 = 360–760 m/s. The moment magnitudes of the selected earthquakes were determined to correspond to the magnitude of the deterministic scenario earthquake expected for the region based on the hazard deaggregation results. The fault mechanisms were selected as strike-slip in accordance with the seismotectonic characteristics of the region. Since the deterministic earthquake scenario assumes a distance between source and site of 20–25 km, the distances between the event and two of the recording stations were set to approximately Rjb = 25 km (Landers Eq, Darfield Eq). However, since an important focus of this study is to evaluate the performance of the scaling algorithm for earthquake records exposed to near-field effects, the remaining records were specifically selected from the region near the faults. Another important aspect is the inclusion of records obtained during the 6 February 2023 earthquakes. One of the most notable aspects of this pair of earthquakes is the spectral characteristics observed at the stations near the fault. Therefore, the selected records for these events were specifically compiled from stations near the fault.
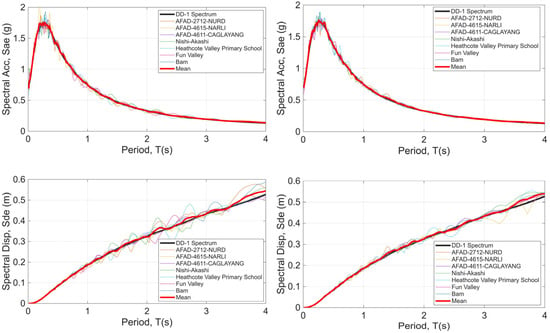
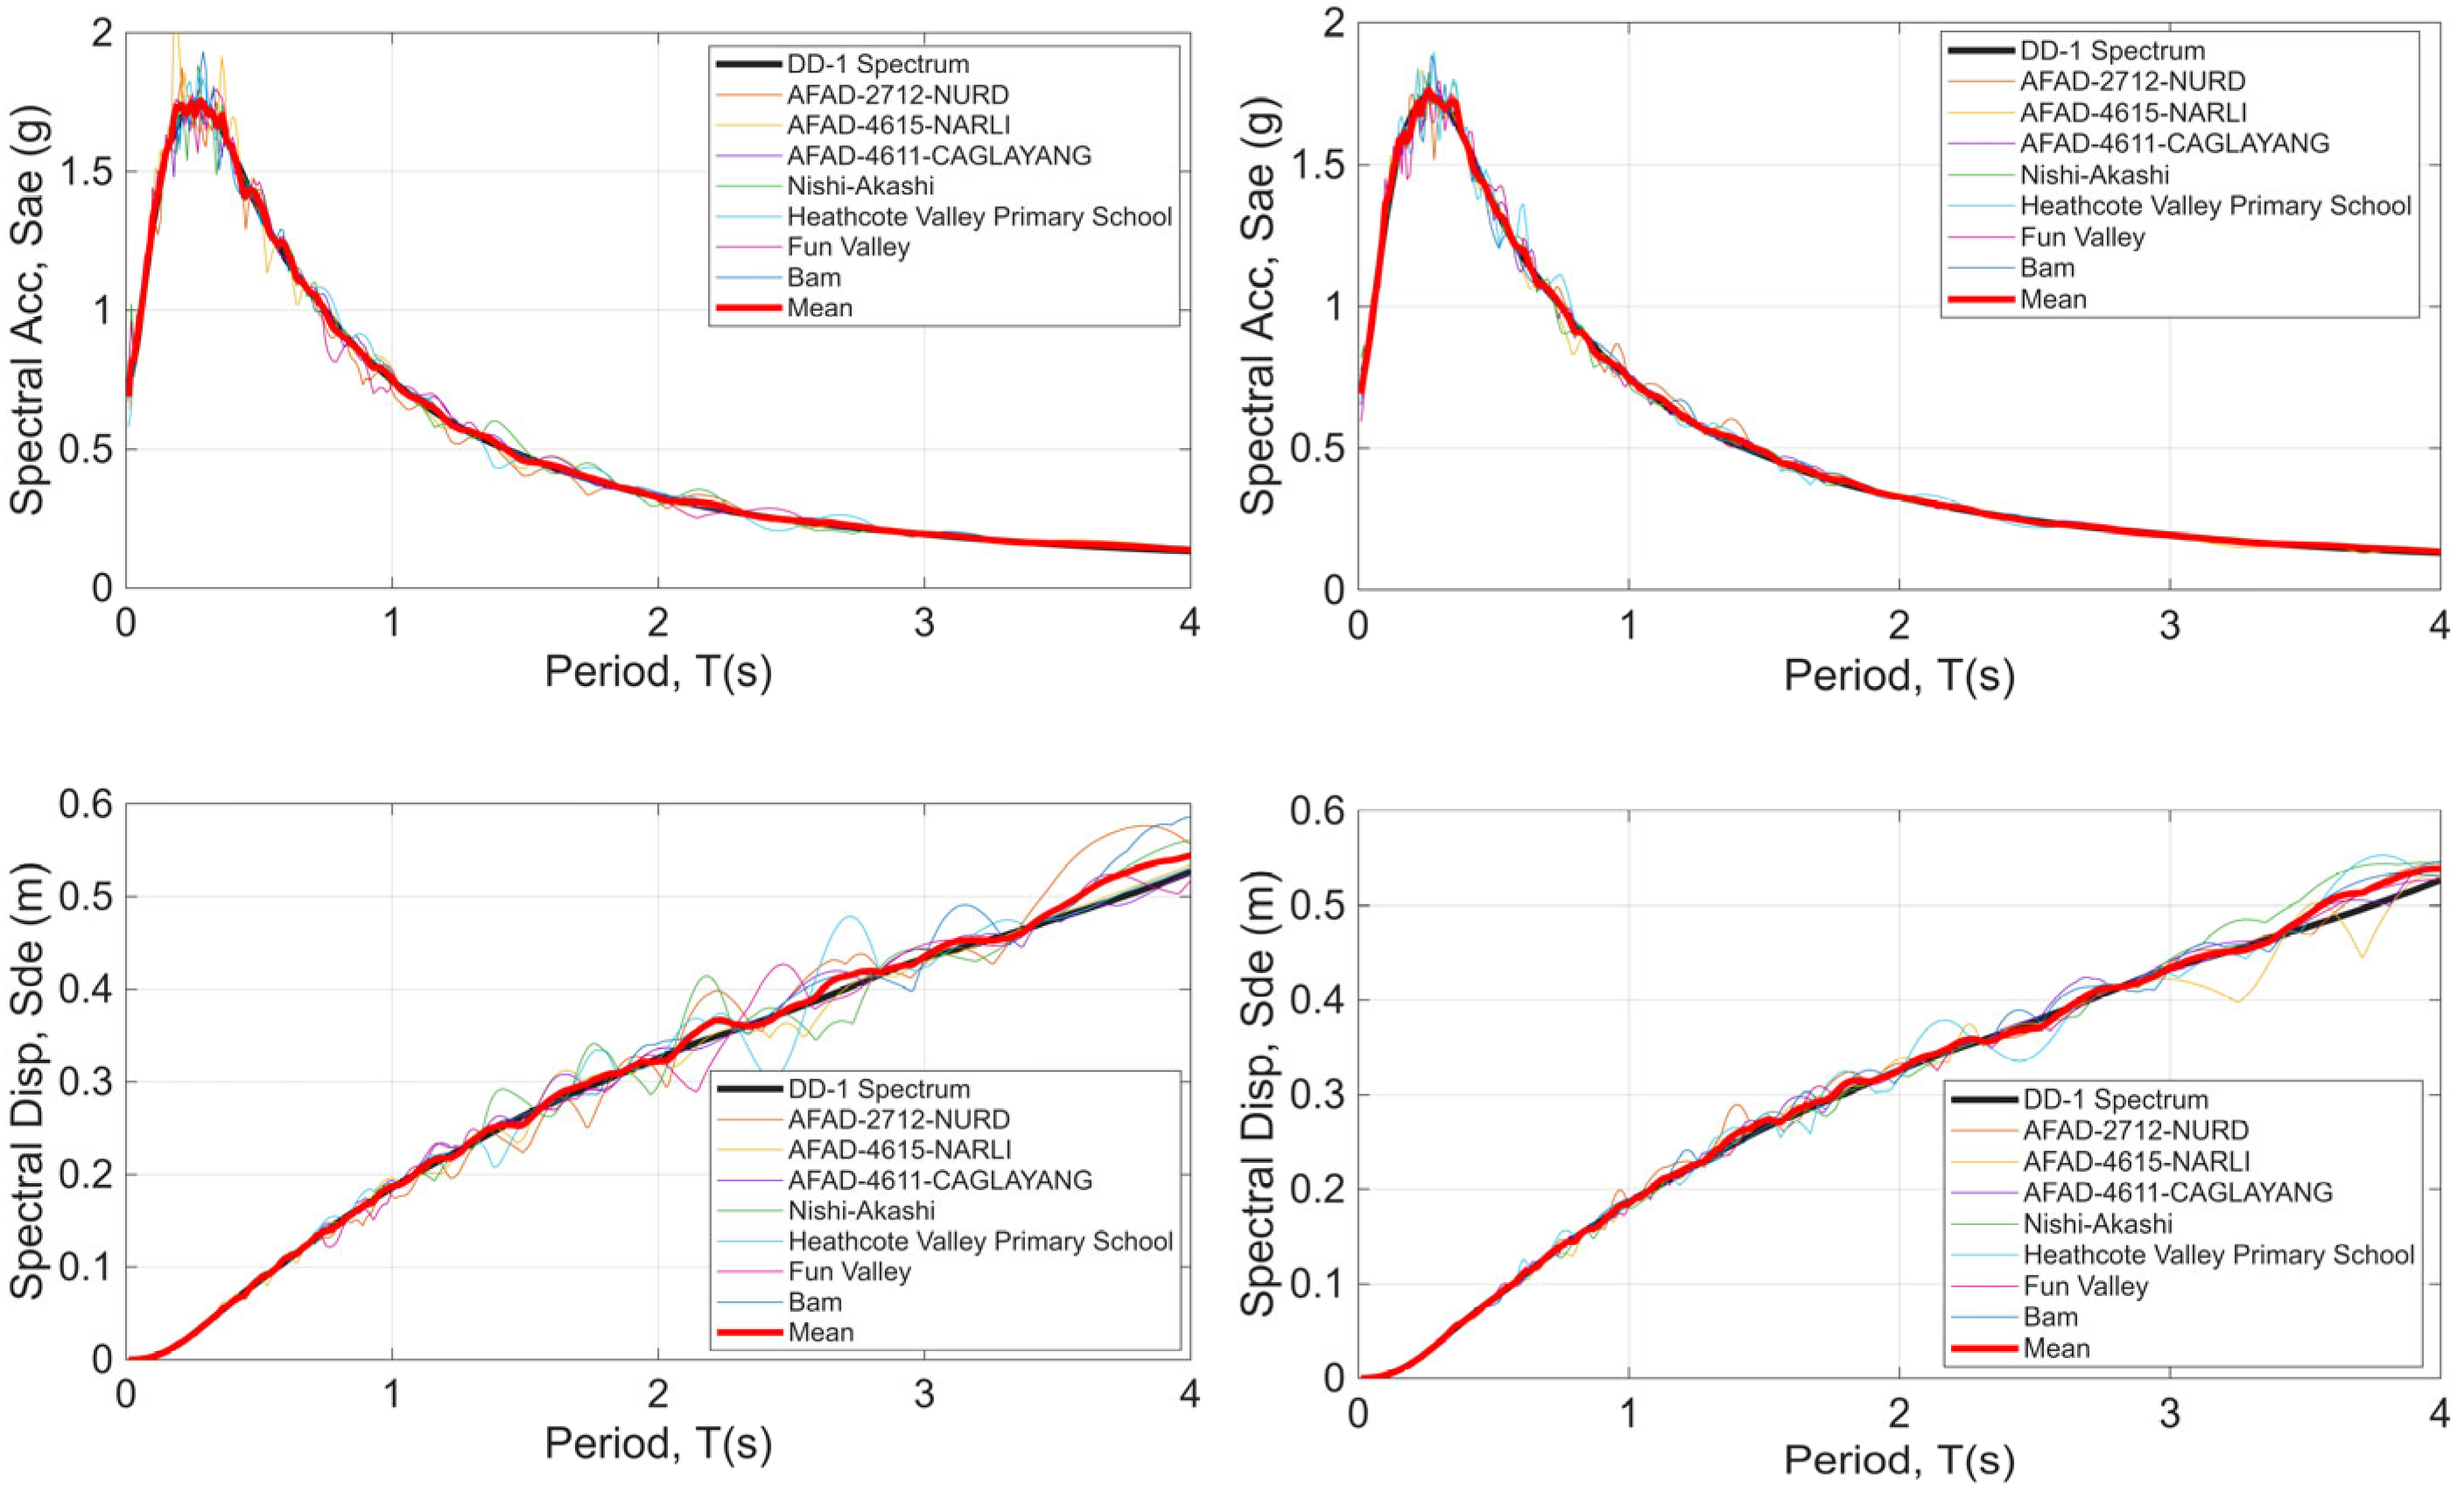
The vibration period of the first mode of the existing port structure was determined to be T = 1.2 s. Accordingly, the spectra of the selected earthquake records were scaled to the target spectrum within the period band of 0.24–1.8 s, which corresponds to the range of 0.2 T–1.5 T, taking into account the criteria of TCPEC (2020) [42]. A time-domain spectral matching procedure was used for the scaling, which preserves the overall phase characteristics and non-stationary features of the ground motion. The aim is to demonstrate the advantages of time-domain spectral matching in the performance-based design of infrastructures such as ports where multiple complex effects occur, especially when modeling structural and non-structural components with different dynamic properties. The method adequately preserves the spectral stationarity, energy and frequency content of the original time histories while matching their spectra to the targeted hazard spectrum over the selected period range. For the seven earthquakes, the results of the spectral matching indicate a high degree of agreement between the matched ground motion spectra and the target spectrum (Figure 6), confirming the robustness of the algorithm used. Figure 6 shows the spectral acceleration (SA) and spectral displacement (SD) spectra and their mean values for both horizontal components at the DD-1 earthquake level. Although individual acceleration or displacement spectra show limited, record-specific deviations, the mean acceleration and displacement spectra show almost excellent agreement with the target GMRS within the relevant period range.
Figure 6.
Selected ground motions (scaled for earthquake level DD-1), spectral acceleration and displacement spectra and their mean values (both horizontal components).
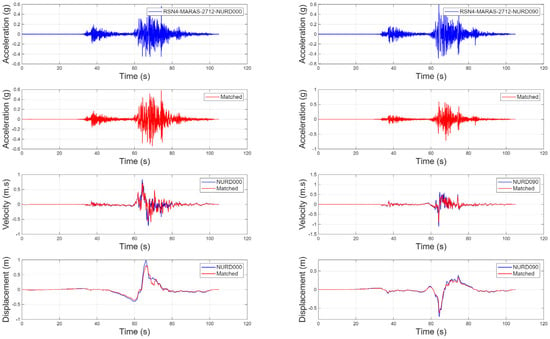
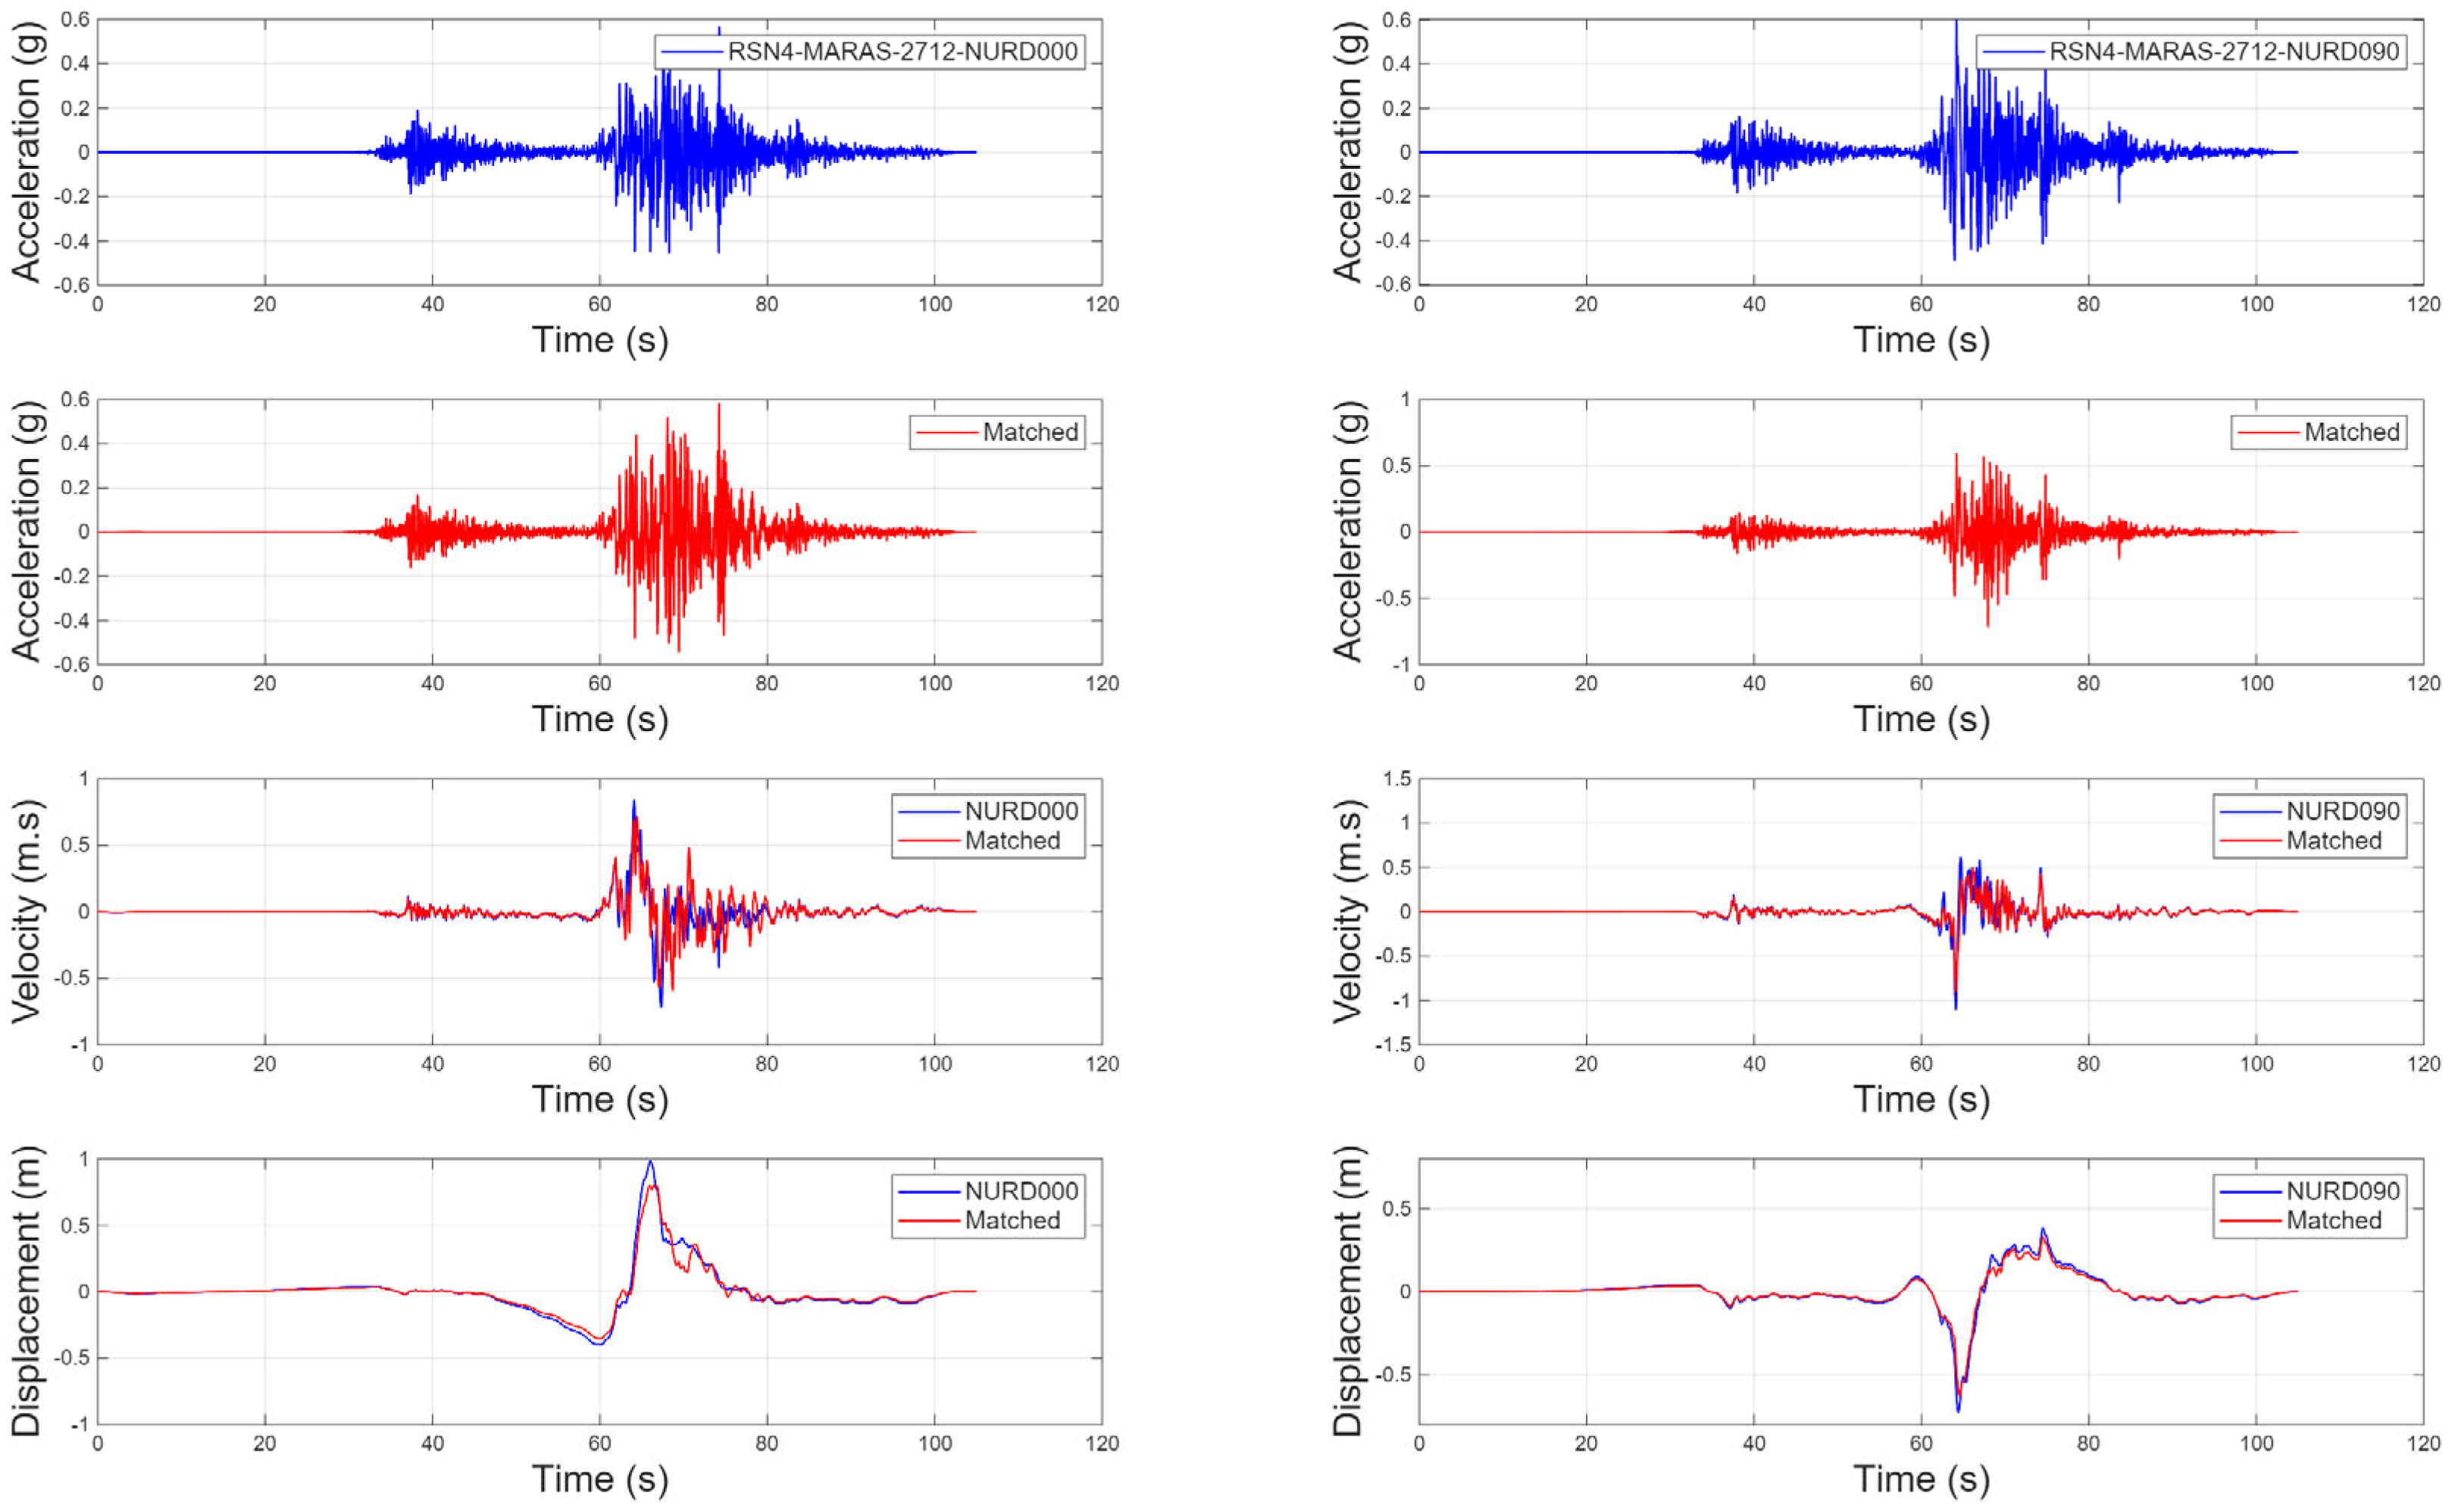
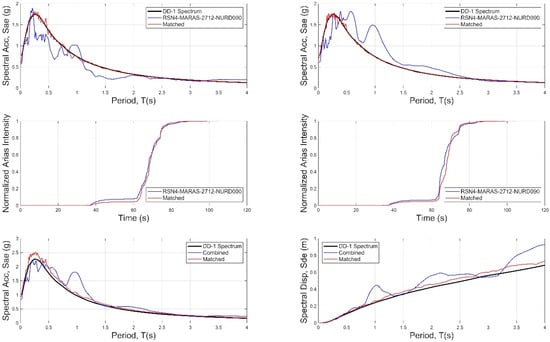
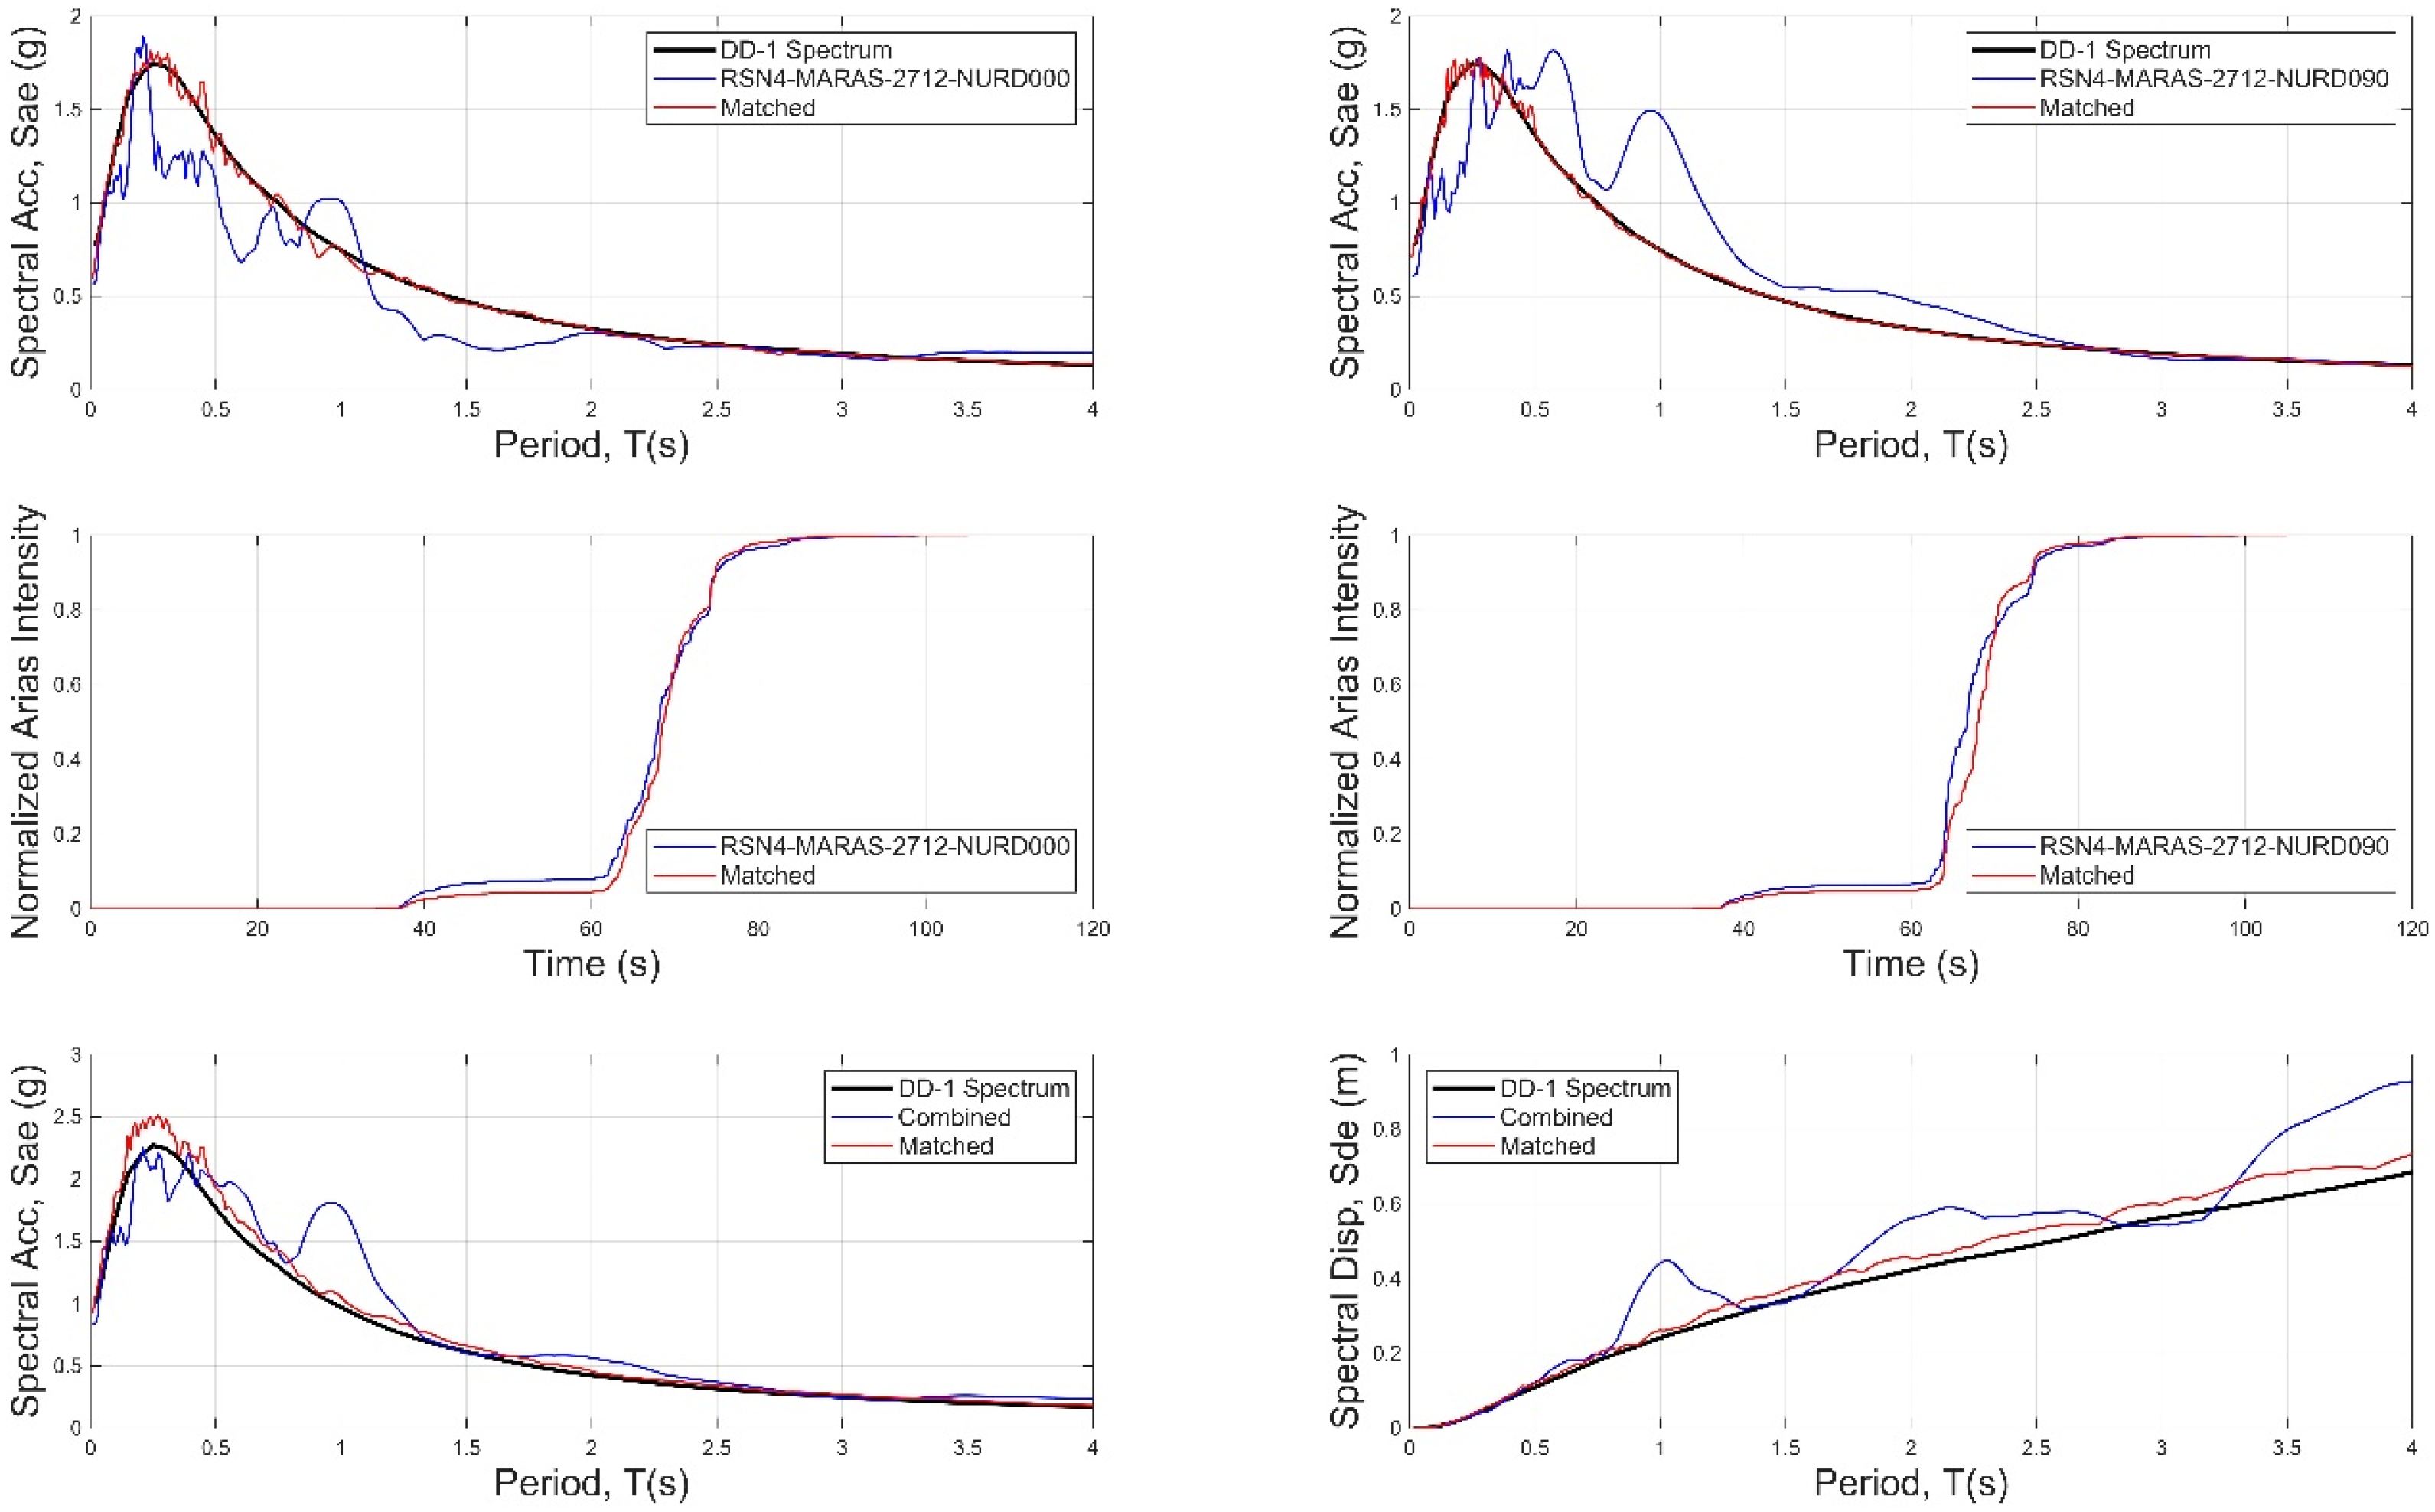
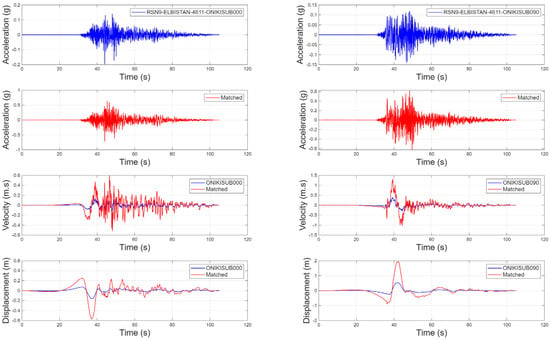
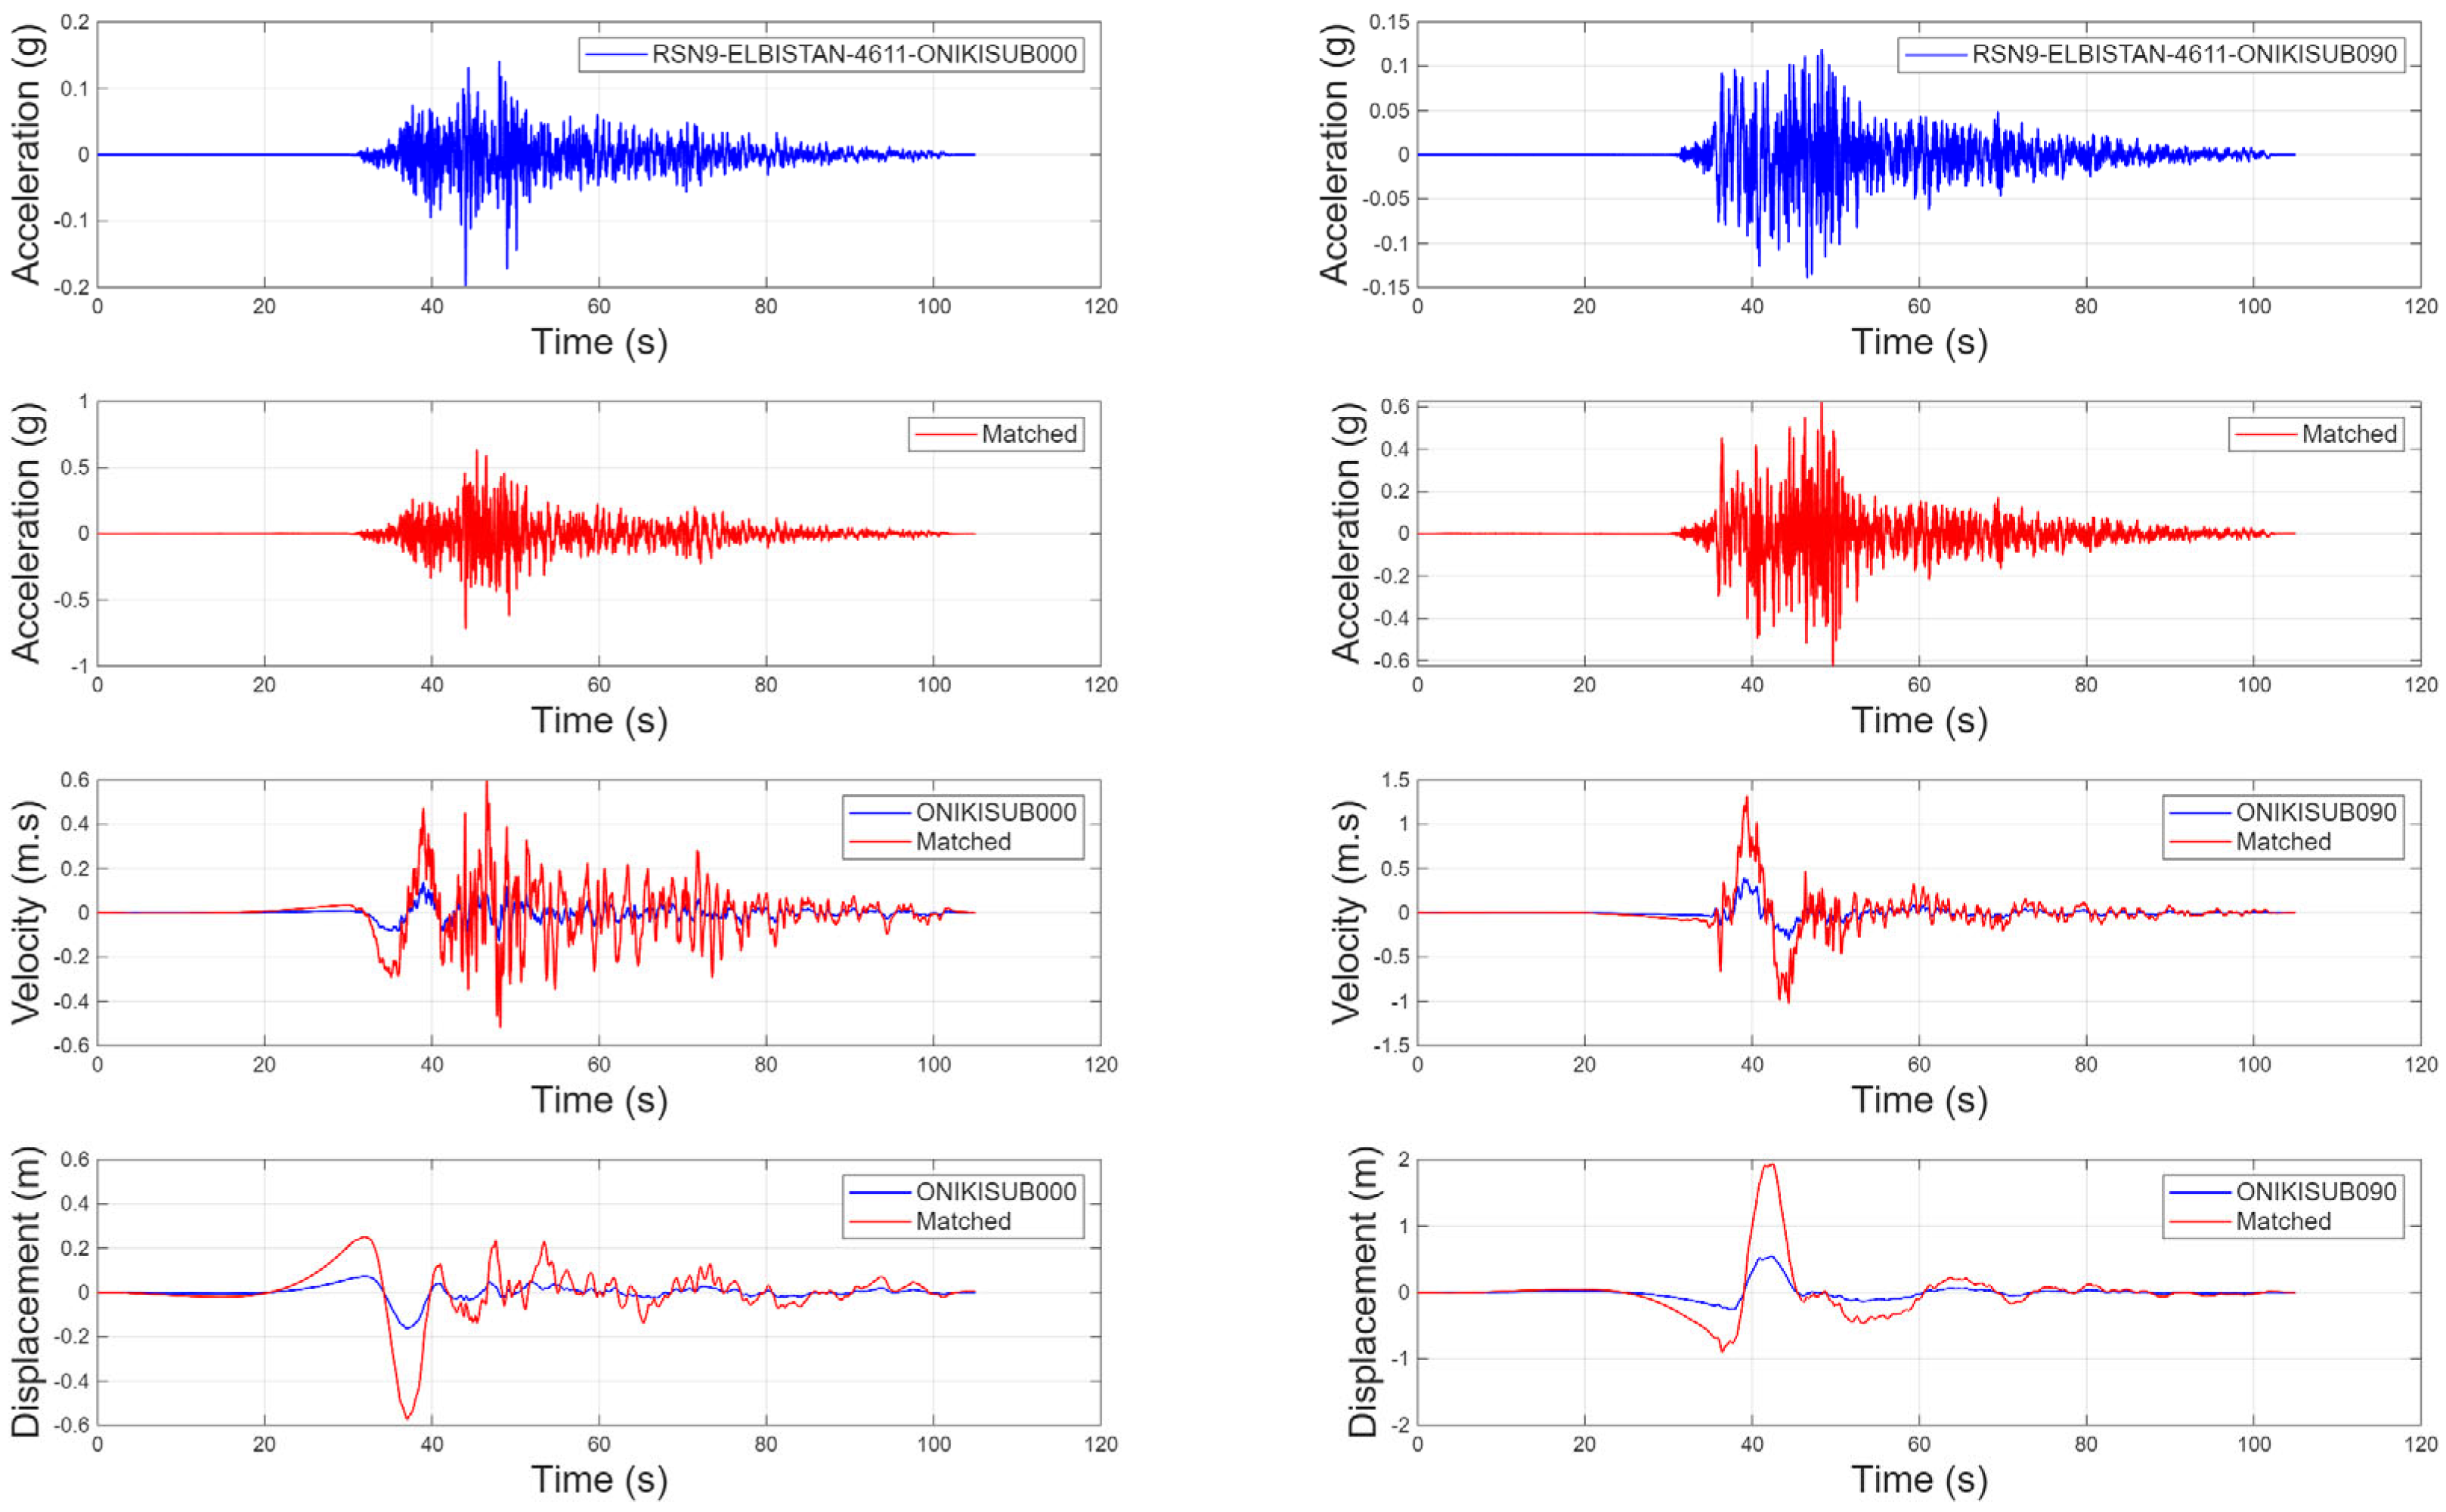
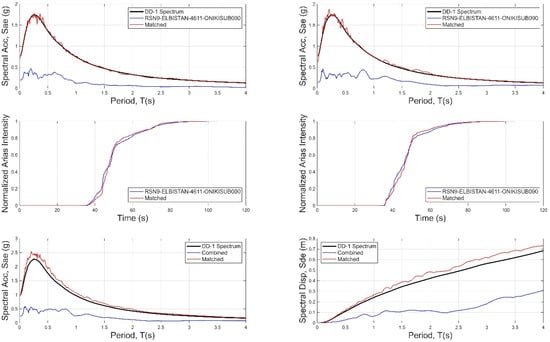
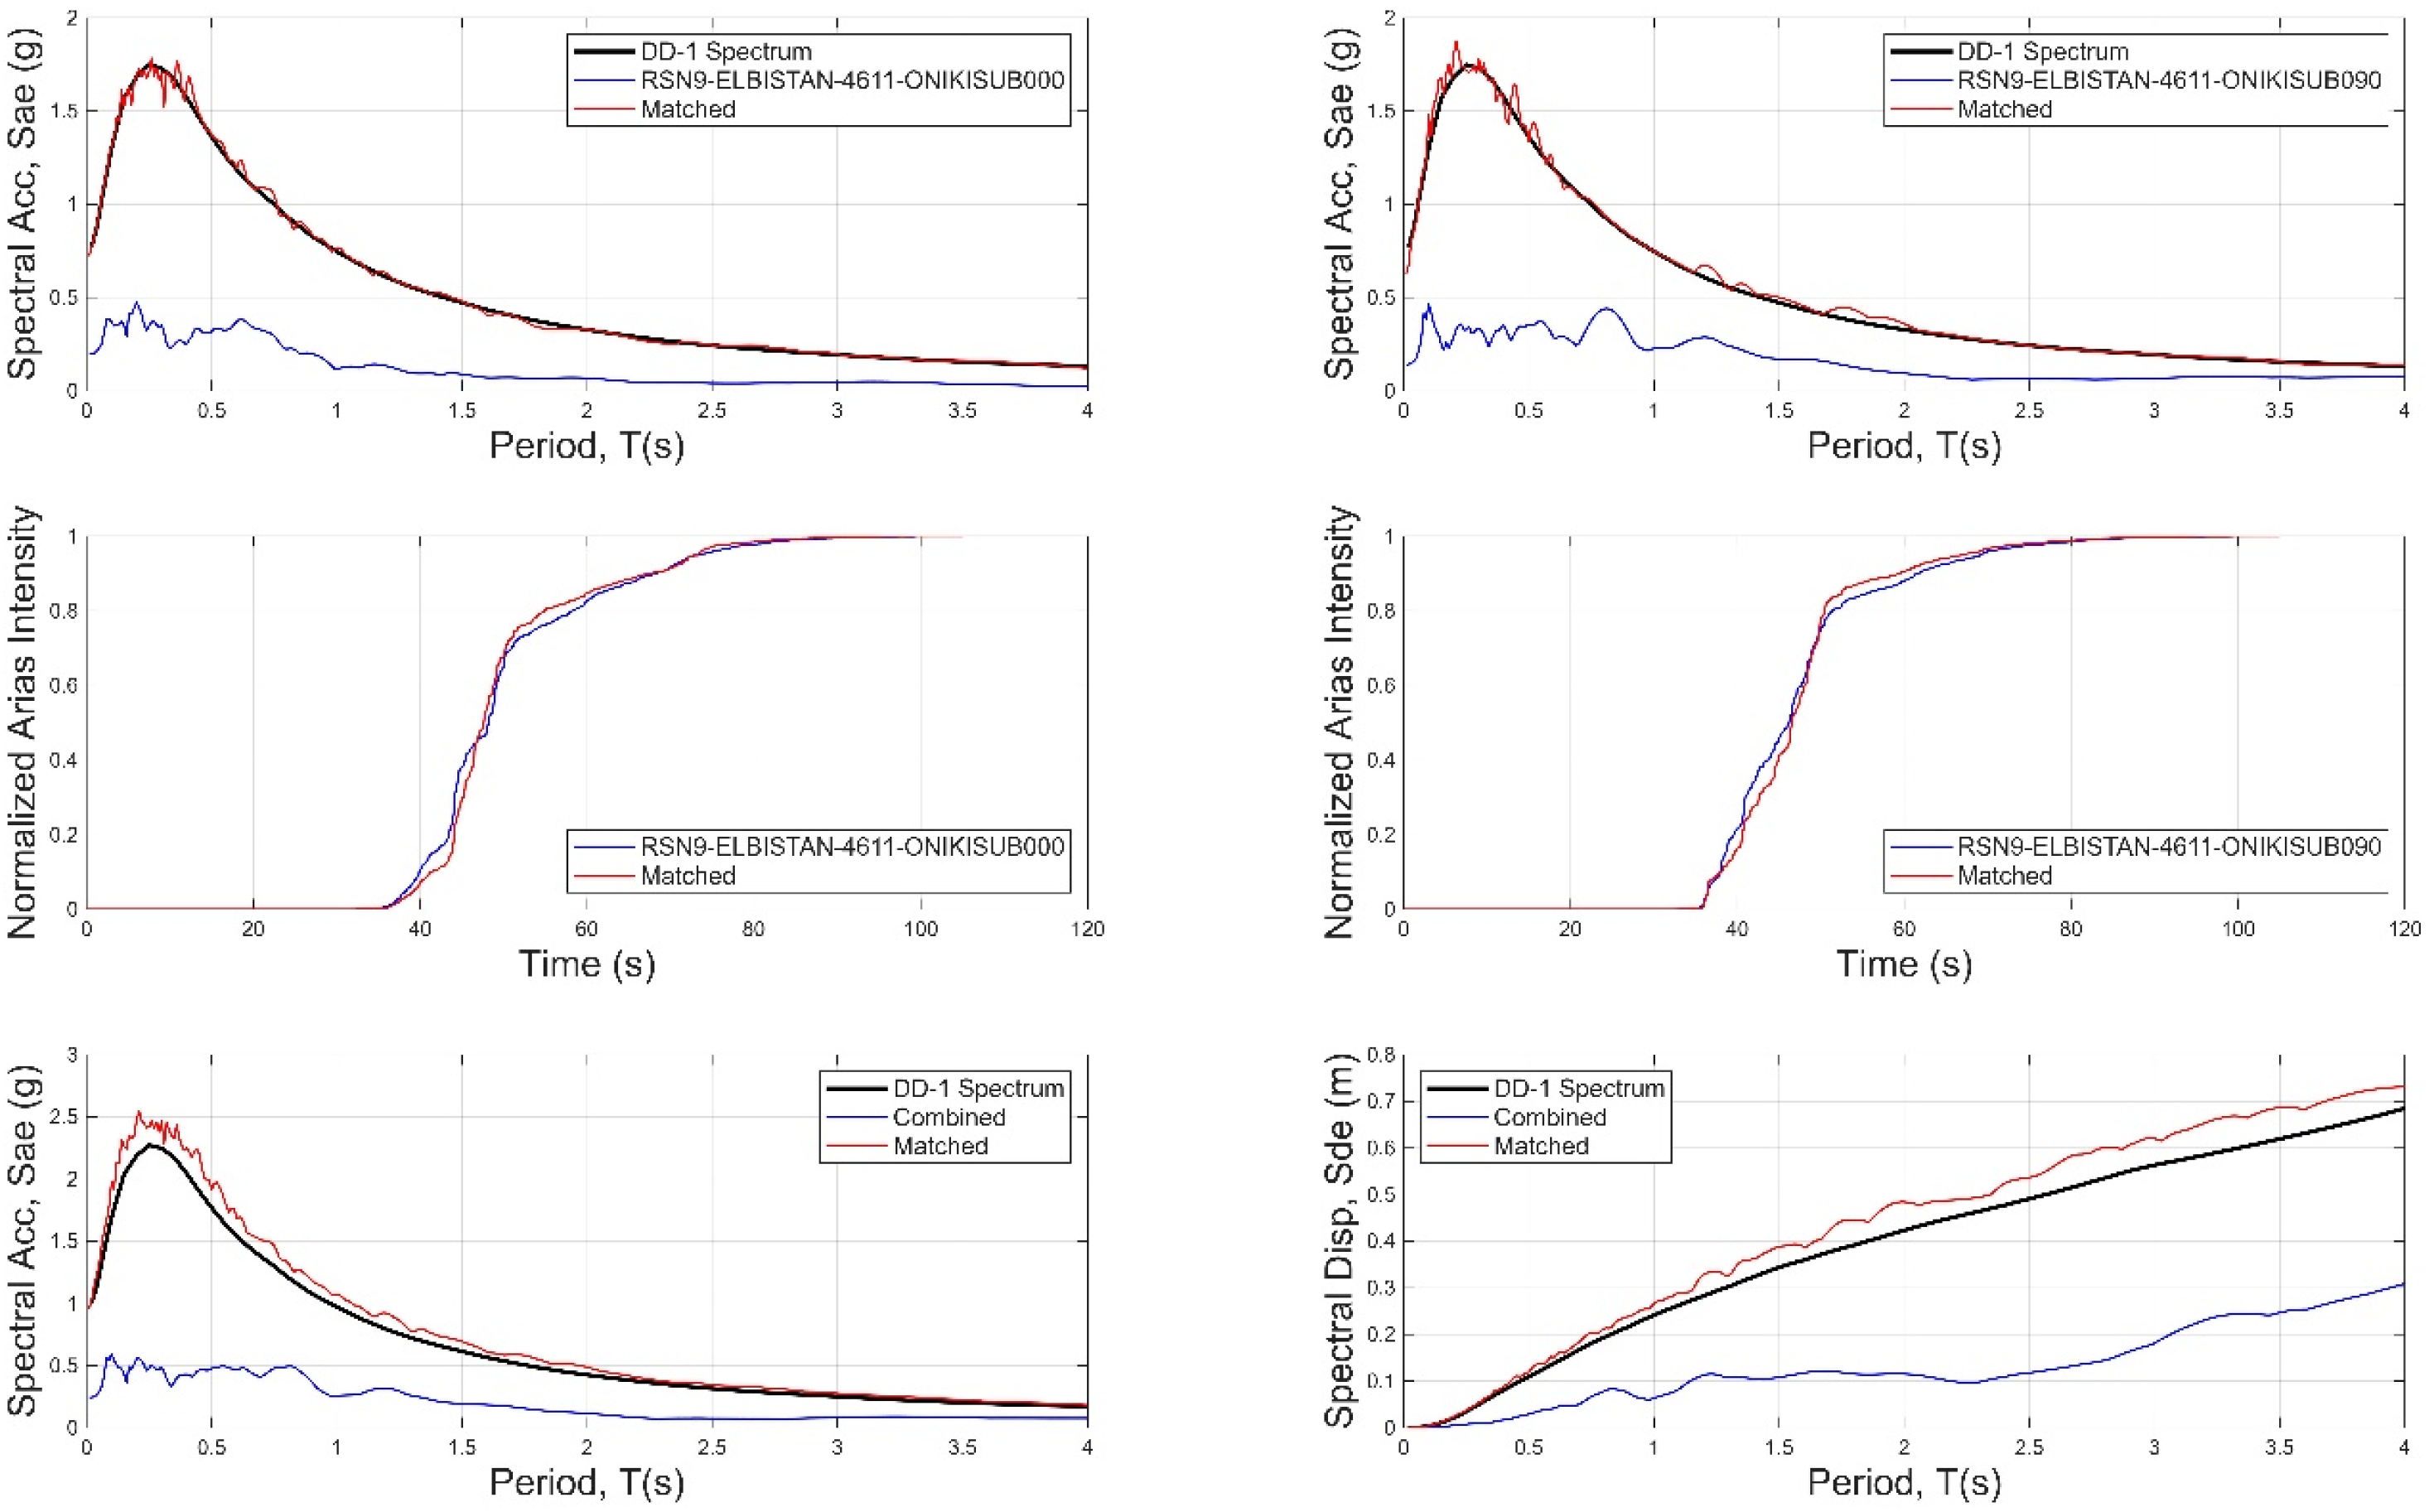
The acceleration, velocity, and displacement time histories before and after spectrum matching for station AFAD-2712 are presented in Figure 7. The original and scaled spectral acceleration, spectral displacement, and Arias intensity curves for the same station are shown in Figure 8. Similarly, the acceleration, velocity, and displacement time histories before and after spectrum matching for station AFAD-4611 are presented in Figure 9, while the corresponding original and scaled spectral acceleration, spectral displacement, and Arias intensity spectra are given in Figure 10.
Figure 7.
Original and scaled (e.g., spectral matching) acceleration, velocity, and displacement time histories of the Kahramanmaraş earthquake recorded at the AFAD-2712 station. In the figure, blue lines represent the original earthquake records, while red lines denote the scaled earthquake records.
Figure 8.
Original (blue lines) and scaled (red lines) spectral acceleration, spectral displacement and normalized Arias intensity of the Kahramanmaraş earthquake recorded at station AFAD-2712. In the figure, black lines represent the target spectrum.
Figure 9.
Original and scaled (e.g., spectral matching) acceleration, velocity, and displacement time histories of the Kahramanmaraş earthquake recorded at station AFAD-4611. The blue curves indicate the original records, while the red curves represent the scaled records.
Figure 10.
Original (blue lines) and scaled (red lines) spectral acceleration, spectral displacement, and normalized Arias intensity of the Kahramanmaraş earthquake recorded at station AFAD-4611. In the figure, black lines represent the target spectrum.
For the ground motion recorded at station AFAD-2712, there are no significant differences between the time histories before and after the matching in terms of acceleration, velocity and displacement (Figure 7). There is also no significant deviation between the spectrum of the original ground motion to be scaled (blue curve in Figure 8) and the target spectrum (black curve in Figure 8). The main reason for this is that the scaling ratio between the spectrum of the selected record set and the target spectrum is close to one (scaling ratio = 0.86). Due to this compatibility, it is not necessary to add a large number of adjustment wavelets in the time domain to achieve matching, and consequently, no pronounced differences occur between the time histories before and after the match. Figure 8 shows a clear correspondence between the target spectrum (black curve) and the amplitudes of spectral acceleration and spectral displacement of the scaled record (red curves). On the other hand, observation of the velocity component in Figure 7 shows velocity pulses with amplitudes of over 1 m/s. The algorithm used successfully scales the records while preserving many salient features, including pulse-like waveforms, that are a characteristic feature of near-fault ground motions.
The ground motion recorded at station AFAD-4611 shows clear differences between the time histories before and after scaling in terms of acceleration, velocity and displacement (Figure 9). There are also clear discrepancies between the spectrum of the original ground motion to be scaled (blue curve in Figure 10) and the target spectrum (black curve in Figure 10). The main reason for this is that the ratio between the spectrum of the selected record spectrum to the target spectrum is about 3 (scaling ratio = 3.01). This discrepancy makes it necessary to add a larger number of adjustment wavelets in the time domain to achieve matching, which in turn leads to differences between the time histories before and after scaling. As can be seen in Figure 9, the amplitudes of displacement, velocity and acceleration in the scaled records increase to a certain degree in both the short- and long-period bands. Figure 10 shows that there are no significant differences between the target spectrum (black curve) and the amplitudes of spectral acceleration and spectral displacement of the scaled recordings (red curves). The acceleration and displacement spectra of the record match the target spectrum as intended. This result confirms the success of the algorithm used, but also shows that certain aspects should be checked before scaling the selected records (e.g., the scaling ratio). For this purpose, the following approach is recommended:
The selected original ground motions should be subjected to preliminary selection against the target response spectrum (e.g., to ensure that the scaling ratio is within a certain threshold range). Then, the spectral matching algorithm is applied to make only the necessary and limited adjustments to the time histories to obtain ground motions that ultimately match the target spectrum. Although TCPEC (2020) [42] does not impose any explicit limitations in this respect, there are different recommendations in the literature: some sources recommend an upper limit of 4 for linear–elastic structural analyses [45,46] while other sources recommend scaling ratios in the range of 0.5 to 2.0 for nonlinear analyses [47]. In this study, the upper limit of the scaling ratio was set to 3, as this represents a reasonable compromise between these recommendations.
The basic principle of the time-domain spectral matching algorithm is to achieve spectral compatibility through small-scale modification in the time-domain content of the scaled ground motion. Therefore, large-scale adjustments to the time-domain characteristics may lead to results that contradict the basic philosophy of the algorithm. Although the time-domain spectral matching algorithm can effectively improve the consistency between the spectrum of the scaled record and the design spectrum, careful selection of the original ground motions is still essential. This is particularly important for the performance-based design of structures subjected to multiple complex actions, such as port facilities, where structural and non-structural components with different dynamic properties need to be modeled appropriately.
An examination of the other earthquake records shows that conclusions similar to those summarized above can be drawn for the time histories of acceleration, velocity, and displacement before and after the match, as well as for spectral parameters such as spectral acceleration, spectral displacement, and Arias intensity. According to the spectral matching results, the spectra of the matched ground motions show a high degree of agreement with the target spectrum, which further confirms the effectiveness of the proposed algorithm.
5. Conclusions
This study shows that the time-domain spectral matching method offers a more physically realistic and robust approach for generating spectrum-compatible ground motions than conventional frequency-domain scaling techniques. By preserving the phase relationships and non-stationary (time-varying) characteristics of recorded ground motions, this method maintains critical features such as energy distribution, frequency content, and near-fault effects (e.g., velocity pulses). As a result, it enables a more reliable assessment of seismic demands in the performance-based seismic design of complex structures, such as maritime ports.
Within this framework, a detailed spectral matching process based on the site-specific GMRS for the port area was conducted. Using recorded earthquake motions with diverse spectral and time-domain characteristics, the study produced scaled ground motions applicable to components with different dynamic properties, suitable for time-history analysis of port structures. This approach allows for the simultaneous and consistent evaluation of the seismic responses of both primary structural elements (e.g., piles, decks, and foundation systems) and secondary systems (e.g., cranes, pipelines, equipment supports, and storage units).
Another novel and key contribution of this research is in converting multiple ground motion recordings from near-fault stations during the 6 February 2023 earthquakes into scaled records suitable for performance-based design through a time-domain spectral matching approach. This demonstrates the method’s capability to realistically reproduce distinct near-fault ground motion features, particularly velocity pulses, and to generate scaled motions that can be reliably applied to components with varying dynamic characteristics. In this regard, the study makes a significant scientific contribution by bridging the gap between seismic hazard representation and structural performance assessment in complex engineering systems such as maritime port facilities.
This study demonstrates strong potential for generating realistic, site-specific, spectrum-compatible ground motions; however, it also identifies several areas for future research and methodological improvement. In particular, incorporating advanced soil–structure interaction models and developing three-component scaled ground motions—including the vertical component—for use in three-dimensional nonlinear dynamic analyses would enable a more comprehensive assessment of structural responses. Furthermore, addressing the challenges of representing complex soil conditions and broadband ground motion characteristics is crucial for enhancing the applicability of the proposed approach to diverse geotechnical and seismotectonic settings. Additionally, evaluating the physical consistency of energy distribution and phase relationships during the spectral matching process would improve the realism of the matched records in reflecting actual earthquake behavior. Future studies should focus on refining the mathematical modification algorithms used in time-domain spectral matching methods, ensuring more accurate representation of energy spectra and phase continuity, and examining the combined effects of varying fault mechanisms and soil conditions in an integrated manner.
Funding
This research was funded by the Scientific Research Projects Coordination Unit of Istanbul Technical University grant number 44126.
Data Availability Statement
The datasets generated and analyzed during the current study are available from the corresponding author on reasonable request.
Conflicts of Interest
The author declare no conflicts of interest.
References
- Werner, S.D.; Dickenson, S.E.; Taylor, C.E. Seismic risk reduction at ports: Case studies and acceptable risk evaluation. J. Waterw. Port Coast. Ocean. Eng. 1997, 123, 337–346. [Google Scholar] [CrossRef] [Scilit]
- Mondal, G.; Rai, D.C. Need for earthquake-resistant design of harbour structures in India in view of their performance during the 2004 Sumatra earthquake. Curr. Sci. 2006, 91, 1134–1138. [Google Scholar]
- Pierre, J.R. A review of soil liquefaction in the Caribbean Greater and Lesser Antilles in reconsidering the ground motion effect of the M7. 0 2010 Haiti earthquake in the Port-au-Prince Seaport and Léogâne Plain. Earthq. Spectra 2023, 39, 2613–2643. [Google Scholar] [CrossRef] [Scilit]
- Elnashai, A.S.; Gencturk, B.; Kwon, O.S.; Al-Qadi, I.L.; Hashash, Y.; Roesler, J.R.; Kim, S.J.; Jeong, S.H.; Dukes, J.; Valdivia, A. The Maule (Chile) earthquake of 27 February 2010: Consequence assessment and case studies. In MAE Center Report No. 10-04; MAE Center: Washington, DC, USA, 2010. [Google Scholar]
- Dizhur, D.; Giaretton, M.; Ingham, J.M. Damage observations following the Mw 7.8 2016 Kaikoura earthquake. In International Conference on Earthquake Engineering and Structural Dynamics; Springer International Publishing: Cham, Switzerland, 2017; pp. 249–261. [Google Scholar]
- Benazir, S.; Luthfi, M. Assessment on damages of harbor complexes due to impacts of the 2018 palu-donggala tsunami, indonesia. In International Conference on Asian and Pacific Coasts; Springer: Singapore, 2019; pp. 257–260. [Google Scholar]
- Sumer, B.M.; Ansal, A.; Cetin, K.O.; Damgaard, J.; Gunbak, A.R.; Hansen, N.-E.O.; Sawicki, A.; Synolakis, C.E.; Yalciner, A.C.; Yuksel, Y.; et al. Earthquake-induced liquefaction around marine structures. J. Waterw. Port Coast. Ocean. Eng. 2007, 133, 55–82. [Google Scholar] [CrossRef] [Scilit]
- Bassal, P.; Papageorgiou, E.; Moug, D.M.; Bray, J.D.; Cetin, K.O.; Şahin, A.; Kubatko, E.J.; Nepal, S.; Toth, C.; Kendır, S.B.; et al. Liquefaction ground deformations and cascading coastal flood hazard in the 2023 Kahramanmaraş earthquake sequence. Earthq. Spectra 2024, 40, 1845–1869. [Google Scholar] [CrossRef] [Scilit]
- Boore, D.M. SMSIM--Fortran Programs for Simulating Ground Motions from Earthquakes: Version 2.0.—A Revision of OFR 96-80-A (No. 2000-509); US Geological Survey: Reston, VA, USA, 2000. [Google Scholar]
- Boore, D.M. Comparing stochastic point-source and finite-source ground-motion simulations: SMSIM and EXSIM. Bull. Seismol. Soc. Am. 2009, 99, 3202–3216. [Google Scholar] [CrossRef] [Scilit]
- Hutchings, L. Kinematic earthquake models and synthesized ground motion using empirical Green’s functions. Bull. Seismol. Soc. Am. 1994, 84, 1028–1050. [Google Scholar]
- Mert, A.; Fahjan, Y.; Pınar, A.; Hutchıngs, L. Strong Ground Motion Simulations Around Prince Islands Fault. Tek. Dergi 2014, 25, 1757–1783. [Google Scholar]
- Hancock, J.; Watson-Lamprey, J.; Abrahamson, N.A.; Bommer, J.J.; Markatis, A.; McCOYH, E.; Mendis, R. An improved method of matching response spectra of recorded earthquake ground motion using wavelets. J. Earthq. Eng. 2006, 10, 67–89. [Google Scholar] [CrossRef] [Scilit]
- Haselton, C.B.; Liel, A.B.; Deierlein, G.G.; Dean, B.S.; Chou, J.H. Seismic collapse safety of reinforced concrete buildings. I: Assessment of ductile moment frames. J. Struct. Eng. 2011, 137, 481–491. [Google Scholar] [CrossRef] [Scilit]
- Alavi, B.; Krawinkler, H. Behavior of moment-resisting frame structures subjected to near-fault ground motions. Earthq. Eng. Struct. Dyn. 2004, 33, 687–706. [Google Scholar] [CrossRef] [Scilit]
- Kalkan, E.; Kunnath, S.K. Effects of fling step and forward directivity on seismic response of buildings. Earthq. Spectra 2006, 22, 367–390. [Google Scholar] [CrossRef] [Scilit]
- Iervolino, I.; Cornell, C.A. Record selection for nonlinear seismic analysis of structures. Earthq. Spectra 2005, 21, 685–713. [Google Scholar] [CrossRef] [Scilit]
- Bradley, B.A. A generalized conditional intensity measure approach and holistic ground-motion selection. Earthq. Eng. Struct. Dyn. 2010, 39, 1321–1342. [Google Scholar] [CrossRef] [Scilit]
- Ghotbi, A.R.; Taciroglu, E. Ground motion selection based on a multi-intensity-measure conditioning approach with emphasis on diverse earthquake contents. Earthq. Eng. Struct. Dyn. 2021, 50, 1378–1394. [Google Scholar] [CrossRef] [Scilit]
- Al Atik, L.; Abrahamson, N. An improved method for nonstationary spectral matching. Earthq. Spectra 2010, 26, 601–617. [Google Scholar] [CrossRef] [Scilit]
- Nie, J.; Graizer, V.; Seber, D. A greedy algorithm for wavelet-based time domain response spectrum matching. Nucl. Eng. Des. 2023, 410, 112384. [Google Scholar] [CrossRef] [Scilit]
- Kaul, M.K. Spectrum-consistent time-history generation. J. Eng. Mech. Div. 1978, 104, 781–788. [Google Scholar] [CrossRef] [Scilit]
- Lilhanand, K.; Tseng, W.S. Development and application of realistic earthquake time histories compatible with multiple-damping design spectra. In Proceedings of the 9th WCEE Tokyo-Kyoto Japan, Tokyo-Kyoto, Japan, 2–9 August 1988; Volume 2, pp. 819–824. [Google Scholar]
- Chen, G.; Liu, Y.; Beer, M. Identification of near-fault multi-pulse ground motion. Appl. Math. Model. 2023, 117, 609–624. [Google Scholar] [CrossRef] [Scilit]
- Wu, Q.; Li, D.-Q.; Liu, Y.; Du, W. Seismic performance of earth dams founded on liquefiable soil layer subjected to near-fault pulse-like ground motions. Soil Dyn. Earthq. Eng. 2021, 143, 106623. [Google Scholar] [CrossRef] [Scilit]
- MTA Fault Map 2012. General Directorate of Mineral Research and Exploration (MTA), Turkey. Available online: https://www.mta.gov.tr (accessed on 8 June 2025).
- McKenzie, D.P. Active tectonics of the Mediterranean region. Geophys. J. Int. 1972, 30, 109–185. [Google Scholar] [CrossRef] [Scilit]
- Dewey, J.F.; Pitman, W.C., III; Ryan, W.B.; Bonnin, J. Plate tectonics and the evolution of the Alpine system. Geol. Soc. Am. Bull. 1973, 84, 3137–3180. [Google Scholar] [CrossRef] [Scilit]
- Şengör, A.M.C.; Görür, N.; Şaroğlu, F. Strike-slip faulting and related basin formation in zones of tectonic escape: Turkey as a case study. In Strike-Slip Deformation, Basin Formation, and Sedimentation; Biddle, K.T., Christie-Blick, N., Eds.; Society for Sedimentary Geology (SEPM) Special Publication: Claremore, OK, USA, 1985; Volume 37, pp. 227–264. [Google Scholar]
- Schiettecatte, J.P. Geology of the Misis Mountains. In Geology and History of Turkey, Tripoli, Libya; Petroleum Exploration Society: Victoria, Australia, 1971; pp. 305–312. [Google Scholar]
- Cornell, C.A. Engineering seismic risk analysis. Bull. Seismol. Soc. Am. 1968, 58, 1583–1606. [Google Scholar] [CrossRef] [Scilit]
- McGuire, R.K. FORTRAN computer program for seismic risk analysis. In U.S. Geological Survey Open-File Report 76-67; USA Geological Survey: Reston, VA, USA, 1976. [Google Scholar]
- Demircioğlu, M.B.; Sesetyan, K.; Duman, T.Y.; Zünbül, S. A regional probabilistic seismic hazard assessment for Turkey in the framework of the UDAP-Ç-13-06 project. Bull. Earthq. Eng. 2017, 15, 2413–2432. [Google Scholar] [CrossRef] [Scilit]
- Chiou, B.S.-J.; Youngs, R.R. An NGA model for the average horizontal component of peak ground motion and response spectra. Earthq. Spectra 2008, 24, 173–215. [Google Scholar] [CrossRef] [Scilit]
- Abrahamson, N.A.; Silva, W.J. Summary of the Abrahamson Silva NGA ground-motion relations. Earthq. Spectra 2008, 24, 67–97. [Google Scholar] [CrossRef] [Scilit]
- Campbell, K.W.; Bozorgnia, Y. NGA ground motion model for the geometric mean horizontal component of PGA, PGV, PGD and 5% damped linear elastic response spectra. Earthq. Spectra 2008, 24, 139–171. [Google Scholar] [CrossRef] [Scilit]
- Boore, D.M.; Atkinson, G.M. Ground-motion prediction equations for the average horizontal component of PGA, PGV, and 5% damped PSA at spectral periods between 0.01 s and 10.0 s. Earthq. Spectra 2008, 24, 99–138. [Google Scholar] [CrossRef] [Scilit]
- Woessner, J.; Laurentiu, D.; Giardini, D.; Crowley, H.; Cotton, F.; Grünthal, G.; Valensise, G.; Arvidsson, R.; Basili, R.; Demircioglu, M.B.; et al. The 2013 European seismic hazard model: Key components and results. Bull. Earthq. Eng. 2015, 13, 3553–3596. [Google Scholar] [CrossRef] [Scilit]
- Danciu, L.; Kale, Ö.; Akkar, S. The 2014 Earthquake Model of the Middle East: Ground motion model and uncertainties. Bull. Earthq. Eng. 2018, 16, 3497–3533. [Google Scholar] [CrossRef] [Scilit]
- Danciu, L.; Sesetyan, K.; Demircioglu, M.; Erdik, M.; Giardini, D. OpenQuake İnput Files of the Seismogenic Source Model of the 2014 Earthquake Model of the Middle East (EMME-Project). 2016. Available online: https://hazard.efehr.org/en/Documentation/specific-hazard-models/middle-east/hazard-computation-input/ (accessed on 28 January 2026).
- Akkar, S.; Sandıkkaya, M.A.; Bommer, J.J. Empirical ground-motion models for point-and extended-source crustal earthquake scenarios in Europe and the Middle East. Bull. Earthq. Eng. 2014, 12, 359–387. [Google Scholar] [CrossRef] [Scilit]
- TCPEC. Turkish Coastal and Port Structures Earthquake Code; Ministry of Transport and Infrastructure: Ankara, Turkey, 2020. [Google Scholar]
- Risk Engineering. EZ-FRISK: Seismic Hazard Analysis Software, (Version 8.x); Risk Engineering, Inc.: Louisville, CO, USA, 2015; Available online: https://www.riskeng.com (accessed on 28 January 2026).
- TSHM/AFAD. Turkish Seismic Hazard Maps Interactive Web Application, AFAD. Available online: https://tdth.afad.gov.tr (accessed on 28 January 2026).
- Vanmarcke, E. State-of-the-Art for Assessing Earthquake Hazards in the United States: Representation of Earthquake Ground Motion: Scaled Accelerograms and Equivalent Response Spectra; US Army Engineer Waterways Experiment Station: Vicksburg, MS, USA, 1979. [Google Scholar]
- Krinitzsky, E.L.; Chang, F.K.; Walper, J.L.; Nuttli, O.W. State-of-the-Art for Assessing Earthquake Hazards in the United States US Army Engineer Waterways Experiment Station, Soils and Pavements Laboratory; US Army Engineer Waterways Experiment Station: Vicksburg, MS, USA, 1973; Volume 20. [Google Scholar]
- Fahjan, Y.M. Selection and scaling of real earthquake accelerograms to fit the Turkish design spectra. Tek. Dergi 2008, 19, 4423–4444. [Google Scholar]

Disclaimer/Publisher’s Note: The statements, opinions and data contained in all publications are solely those of the individual author(s) and contributor(s) and not of MDPI and/or the editor(s). MDPI and/or the editor(s) disclaim responsibility for any injury to people or property resulting from any ideas, methods, instructions or products referred to in the content. |
© 2026 by the author. Licensee MDPI, Basel, Switzerland. This article is an open access article distributed under the terms and conditions of the Creative Commons Attribution (CC BY) license.