


Abstract
The distribution of contact stresses beneath shallow foundations governs both structural demand within the footing and the deformation response of the supporting soil. Although numerous analytical and numerical studies have investigated soil–foundation interaction, the combined influence of foundation geometry and embedment ratio on contact stress distribution, settlement behavior, stress bulb development, and foundation rigidity has not been systematically evaluated within a unified numerical framework. This study presents a comprehensive finite element investigation of shallow foundations with circular, square, and strip geometries subjected to four embedment ratios (Df/B, where Df denotes the embedment depth and B the footing width) of 0.25, 0.50, 0.75, and 1.00, considering six representative soil profiles ranging from soft clay to dense sand. A total of 216 numerical simulations were performed using PLAXIS 2D (version 2024.1) under drained conditions, employing the Mohr–Coulomb constitutive model. The numerical setup was checked against classical analytical stress and settlement solutions under corresponding idealized conditions. The results demonstrate that increasing embedment consistently reduces peak contact stresses, decreases foundation settlement, and produces shallower stress bulbs over the investigated range of Df/B. Within the adopted 2D numerical framework, the circular-footing representation exhibits the most uniform contact stress distribution and the lowest settlements, whereas the strip-footing representation develops the highest stress concentrations and deepest influence zones. In addition, a depth-adjusted formulation of the Relative Stiffness Factor is proposed to account for the increase in operative soil stiffness associated with embedment, providing a framework for evaluating the relative rigidity of embedded foundations. The findings provide quantitative insight into the influence of foundation geometry and embedment depth on stress transfer and settlement performance, thereby supporting the comparative assessment of shallow foundation behavior within the investigated conditions.
1. Introduction
Shallow foundations are among the most widely adopted foundation systems for buildings, bridges, and industrial structures owing to their structural simplicity, economic efficiency and ease of construction. Their performance depends fundamentally on the interaction between the foundation and the supporting soil, which governs both the structural response of the footing and the deformation behavior of the ground. Within this interaction, the distribution of contact stresses at the soil–foundation interface plays a critical role because it controls the internal forces developed within the footing while simultaneously influencing the magnitude and spatial distribution of settlements beneath the loaded area. Consequently, an accurate assessment of the contact stress distribution is essential for achieving safe, serviceable, and economical foundation designs, particularly where differential settlements or stress concentrations may compromise structural performance. Although these principles are well established in foundation engineering, recent numerical investigations continue to demonstrate that realistic prediction of contact stresses remains a key challenge in the analysis and design of shallow foundations, particularly when soil nonlinearity and soil–structure interaction are explicitly considered [1,2,3].
The theoretical framework for analyzing stress distribution beneath shallow foundations was established through the pioneering work of Boussinesq and further developed in [4] and other researchers in bearing capacity and settlement theory. These formulations remain the basis of contemporary design procedures incorporated into international standards [5,6]. Nevertheless, practical design frequently relies on simplified assumptions, including uniform or linearly varying contact pressure distributions, to facilitate structural calculations. While these assumptions are adequate for many routine applications, numerous experimental and numerical investigations have shown that the actual contact stress distribution is inherently non-uniform and depends on several interacting factors, including foundation geometry, soil stiffness, embedment conditions and foundation rigidity. Consequently, finite element methods are widely used to investigate realistic soil–foundation interaction and improve the prediction of contact stresses and settlements under practical loading conditions [2,3,5,6,7].
Foundation geometry is one of the principal factors governing the response of shallow foundations because it directly influences the stress-transfer mechanism between the footing and the supporting soil. Circular, square and strip footings generate different stress fields due to their distinct geometrical characteristics and loading conditions. Circular foundations generally promote a more uniform redistribution of stresses and eliminate corner stress concentrations, whereas square foundations may develop localized stress concentrations near the footing edges. Strip foundations, commonly analyzed under plane-strain conditions, tend to generate deeper stress bulbs and larger zones of influence within the supporting soil. These differences significantly affect contact stress distribution, settlement patterns and the overall efficiency of load transfer, making footing geometry an important consideration in foundation design [1,8,9,10].
Over the past decade, numerical modelling has considerably improved the understanding of how footing geometry affects the mechanical response of shallow foundations. Recent investigations have demonstrated that the influence of footing shape extends beyond bearing capacity and also governs the development of contact stress distributions, settlement mechanisms and failure patterns under different loading conditions. Finite element studies also indicate that the interaction between footing geometry and soil properties becomes increasingly significant in non-homogeneous soils and under embedded foundation conditions, where confinement effects modify both stress redistribution and deformation behavior. Despite these advances, many published studies focus on a single footing geometry or compare only a limited number of configurations. Comprehensive assessments based on consistent modelling assumptions therefore remain relatively uncommon [2,3,9,11].
Foundation embedment is another key parameter controlling soil–foundation interaction because it modifies both the stress state of the surrounding soil and the mechanisms through which loads are transferred to the supporting ground. Increasing the embedment depth generally enhances soil confinement, mobilizes interface shear resistance along the sides of the foundation and increases the operative stiffness of the supporting soil mass. Together, these effects can reduce contact stress concentrations, limit settlements and improve the overall stability of shallow foundations. The embedment ratio (Df/B, where Df is the embedment depth and B is the footing width) is therefore an important parameter in both analytical and numerical investigations of shallow foundations [5,9,12,13].
Recent numerical and experimental studies have confirmed that increasing embedment depth influences not only bearing capacity but also settlement behavior, stress bulb development, and the distribution of contact pressures beneath shallow foundations. However, most available investigations have focused on specific foundation geometries, individual soil conditions or isolated embedment depths, often reflecting practical construction scenarios rather than systematic parametric analyses. Direct comparisons between footing geometries across a range of embedment ratios are therefore still limited, especially when consistent constitutive models and boundary conditions are required [9,11,12,14].
In addition to foundation geometry and embedment ratio, the relative stiffness of the footing with respect to the supporting soil governs the manner in which loads are transferred across the soil–foundation interface. This interaction is commonly characterized by the Relative Stiffness Factor (Kr), which relates the flexural rigidity of the foundation to the deformability of the supporting soil and provides a practical basis for classifying foundations as flexible, semi-flexible, semi-stiff or stiff. The rigidity classification strongly influences the resulting contact stress distribution, differential settlements and internal bending moments developed within the footing, and therefore represents an essential component of realistic soil–structure interaction analyses. Although the concept of relative stiffness has long been established in foundation engineering, its evaluation remains important for predicting shallow foundation behaviour under realistic loading conditions [15,16,17,18].
Despite the widespread use of the Relative Stiffness Factor in foundation engineering, existing rigidity classifications have generally been developed assuming surface foundations and constant soil properties beneath the footing. In practice, however, embedment modifies the stress state within the surrounding soil, increases confinement and changes the effective stiffness mobilized beneath the foundation. Thus, two geometrically identical foundations constructed at different embedment depths may exhibit different mechanical responses despite having identical material properties and geometric dimensions. While recent studies have recognized the importance of foundation stiffness for soil–structure interaction, the combined influence of embedment and operative soil stiffness on rigidity classification has received comparatively limited attention, particularly in numerical studies covering different footing geometries and soil conditions [16,17,19].
Although analytical, experimental and numerical studies have substantially improved the understanding of shallow foundation behavior, three issues remain relevant to the present investigation. First, many published studies investigate individual footing geometries or isolated embedment conditions, making direct comparisons between different foundation configurations difficult under consistent modelling assumptions. Second, although the beneficial influence of embedment has been widely recognized, relatively few studies have systematically examined its combined effect with footing geometry across multiple soil profiles using a unified finite element framework. Third, existing rigidity classifications generally neglect the increase in operative soil stiffness associated with embedment, despite its potential influence on contact stress distribution and settlement behavior. These limitations define the specific scope addressed in this study.
Based on these gaps, this study presents a comprehensive finite element investigation of the combined influence of foundation geometry, embedment ratio and soil properties on the behavior of shallow foundations. A parametric numerical program comprising 216 PLAXIS 2D simulations was performed considering circular, square and strip footings, four embedment ratios (Df/B = 0.25, 0.50, 0.75 and 1.00), and six representative soil profiles ranging from soft clay to dense sand. The analyses evaluate contact stress distribution, settlement behavior, stress bulb development and foundation rigidity within a consistent numerical framework based on the Mohr–Coulomb constitutive model.
The study provides a comparative assessment of footing geometry and embedment effects on contact stress distribution and settlement behavior under consistent modelling conditions. It also examines how foundation rigidity evolves with embedment depth and how this affects stress redistribution and structural response. A further contribution is the proposed depth-adjusted formulation of the Relative Stiffness Factor, which accounts for the increase in operative soil stiffness associated with embedment and adapts the conventional rigidity classification for embedded shallow foundations. The results provide quantitative insight into the influence of foundation geometry and embedment depth on stress transfer and settlement performance within the investigated conditions.
2. Numerical Methodology
2.1. Numerical Modelling Strategy
The mechanical behavior of shallow foundations was investigated using the finite element method (FEM), which provides a robust framework for analyzing the nonlinear interaction between foundations and supporting soils while accounting for stress redistribution and deformation under applied loading. Compared with conventional analytical approaches, finite element modelling enables a more realistic representation of soil–foundation interaction by simultaneously evaluating contact stress distribution, settlement behavior and stress bulb development under controlled boundary conditions. FEM is therefore widely used to investigate shallow foundation performance and to conduct parametric studies involving several interacting variables [2,3,7].
The numerical analyses were performed using PLAXIS 2D 2024.1 (Bentley Systems, Delft, The Netherlands), which is extensively used in geotechnical engineering to model soil–structure interaction problems. PLAXIS was selected because it incorporates advanced constitutive models, interface elements, and staged construction procedures within a well-established computational framework. Its previous application to analytical, experimental and field-based geotechnical problems also supports its use in comparative numerical investigations of shallow foundation behavior [2,7,20,21].
The three footing geometries were tested on the following two dimensional (2D) numerical formulations: (i) Circular footings: modelled with the axisymmetric formulation which has the ability to accurately capture the stress distribution in the radial direction [2,3,7,9]. (ii) Strip Footings: which are modelled under plane-strain conditions, the typical condition for infinitely long continuous footings [5,6]. (iii) Square footing (equal area-axisymmetric idealization; req = B/√π = ~0.564 B; plan area, total load and average contact pressure are identical). The results of a sensitivity analysis performed on the actual elastic solution for a square footing [22] showed that the difference between the settlement of the center point of the footing was less than 0.7%. This idealization does not include 3-dimensional edge/corner effects. It should be noted that all the shape-comparison conclusions have to be drawn in the context of the adopted 2D numerical representations and cannot be drawn as a direct quantitative comparison of mechanically equivalent 3D geometries. Further work (Section 4.4) will involve independent 3D FE analysis, e.g., PLAXIS 3D.
Although three-dimensional numerical analyses provide the most realistic representation of isolated shallow foundations, two-dimensional modelling remains widely accepted for systematic parametric investigations because it provides an appropriate balance between computational efficiency and predictive capability. In the present study, strip footings were analyzed under plane-strain conditions, whereas circular foundations were modelled using the axisymmetric formulation available in PLAXIS 2D. Square foundations were represented using an equivalent two-dimensional idealization consistent with established numerical procedures reported in the literature.
It should be noted that the circular, square-equivalent and strip-footing representations are not strictly mechanically equivalent. Classical bearing-capacity formulations demonstrate that footing shape affects load transfer through shape-dependent factors [23,24,25,26]. Moreover, three-dimensional edge and corner effects associated with an actual square footing cannot be reproduced exactly by an axisymmetric two-dimensional idealization. Accordingly, comparisons among the three footing configurations should be interpreted within the limitations of the adopted numerical representations rather than as exact reproductions of three-dimensional footing-shape effects.
The same numerical procedures and boundary conditions were maintained throughout the analyses to provide a consistent basis for assessing the influence of foundation geometry, embedment ratio and soil profile on contact stress distribution and settlement behavior [2,9,10].
Figure 1 illustrates the representative finite element model adopted throughout the numerical investigation. The computational domain extends 5B in the horizontal direction and 4B in the vertical direction to minimize boundary effects, consistent with recommendations reported in the literature for shallow foundation analyses. The footing is modelled as a linear elastic reinforced concrete body resting on a Mohr–Coulomb soil medium, while interface elements are introduced along the soil–foundation contact to reproduce the reduction in interface shear strength. A strength reduction factor of Rint = 0.67, commonly adopted for concrete–soil interfaces in PLAXIS analyses, was used throughout the investigation to account for reduced interface strength while avoiding full-bond conditions [20,21,27].
Figure 1.
Representative PLAXIS 2D finite element model showing the computational domain, mesh, footing geometry, interface elements and boundary conditions for a circular footing at Df/B = 0.50.
The soil domain was discretized using 15-noded triangular finite elements with local mesh refinement beneath the footing, where the highest stress gradients were expected. This mesh configuration provided sufficient resolution of the stress field without excessive computational demand.
The boundary conditions comprise a fully fixed base (ux = uy = 0), roller boundaries along the vertical sides (ux = 0), and an axis of symmetry for the axisymmetric analyses.
This model was used throughout the parametric program to assess the effects of foundation geometry, embedment ratio and soil properties on contact stress distribution and settlement behavior.
2.2. Foundation Geometry and Parametric Program
To evaluate the combined influence of foundation geometry, embedment ratio and soil characteristics (Table 1) on the behavior of shallow foundations, a comprehensive parametric numerical program was developed. Three commonly adopted footing geometries, namely strip, square and circular foundations, were investigated because they represent common configurations in engineering practice and allow the influence of footing geometry on load transfer behavior to be comparatively assessed. For each footing geometry, the numerical analyses considered three paired footing width–thickness configurations, four embedment ratios and six representative soil profiles, resulting in a total of 216 finite element simulations performed under identical modelling assumptions. This approach allows the analyzed variables to be compared using the same numerical procedures and boundary conditions.
Table 1.
Soil profile properties.
The material and geometric parameters adopted in the numerical program are summarized in Table 1 and Table 2. Six representative soil profiles, covering a broad range of stiffness and strength characteristics commonly encountered in geotechnical engineering practice, were considered together with three footing geometries and three paired width–thickness configurations for each footing geometry. The selected combinations were intended to assess the influence of soil conditions, footing geometry and embedment ratio on the stress distribution and settlement response of shallow foundations.
Table 2.
Foundation geometry and paired width–thickness parameters.
The applied pressure, q = 100 kN/m2, is kept constant in all 216 simulations (not the total applied load) because it is the physically meaningful parameter to compare the contact-stress distribution and the settlement response for different footing sizes and shapes [2,3,8,9]. For the footings, the dimensions vary from shape to shape (Table 2) because different dimensions were associated with each shape to define a practical use in engineering. The summary values reported in Table 3 and Table 4 correspond to a specified reference configuration (B = 1.0 m and T = 0.6 m for the circular and strip footing representations, with corresponding equivalent dimensions for the square-footing representation) and are not averages of the three width–thickness configurations considered in the parametric study.
Table 3.
Percentage settlement reduction (ΔS/S0) for the reference footing configuration considered in the comparative summary.
Table 4.
Peak Stress Ratio (PSR = σmax/q) at Df/B = 0.25 and 1.00 for the reference footing configuration.
As shown in Table 1, the selected soil profiles represent cohesive and cohesionless materials with Young’s modulus ranging from 8 to 65 MPa, covering conditions from very compressible soft clay to dense sand. The adopted parameters are representative of values commonly reported in the literature for numerical analyses based on the Mohr–Coulomb constitutive model and allow the influence of soil stiffness and strength on foundation behavior to be systematically evaluated.
Table 2 summarizes the geometric characteristics adopted for the three footing configurations. For each foundation shape, three paired footing width–thickness configurations were analyzed, with the corresponding B and T values listed in Table 2. The embedment ratio, Df/B, was varied from 0.25 to 1.00. The material properties of the reinforced concrete footing were kept constant throughout the investigation (Ef = 27 GPa and νf = 0.15), so that differences in the numerical response could be related to the geometric and geotechnical parameters considered.
Overall, the numerical program comprised 216 finite element simulations, corresponding to three footing geometries, three paired footing width–thickness configurations for each geometry, four embedment ratios and six soil profiles. All simulations were conducted under the same numerical procedures and loading conditions, providing a common basis for comparatively assessing the influence of foundation geometry and embedment depth on contact stress distribution, settlement behavior and relative foundation stiffness.
2.3. Constitutive Model and Material Properties
The mechanical behavior of the supporting soil was simulated using the Mohr–Coulomb (MC) constitutive model, which is one of the most widely adopted elastoplastic models for the numerical analysis of shallow foundations. The model combines linear elastic behavior prior to yielding with perfectly plastic failure governed by the Mohr–Coulomb criterion, requiring only a limited number of engineering parameters that are readily available from conventional geotechnical investigations. Owing to its robustness, computational efficiency and relatively limited parameter requirements, the MC model has been extensively employed in comparative parametric studies of soil–structure interaction and shallow foundation behavior [3,28,29].
The constitutive model was defined using five fundamental material parameters, namely Young’s modulus (Es), Poisson’s ratio (ν), effective cohesion (c), effective friction angle (ϕ) and dilatancy angle (ψ). For consistency across the comparative numerical program, the dilatancy angle was assumed equal to zero for all soil profiles. This assumption provides a simplified treatment of volumetric behavior during shearing and is consistent with the comparative purpose of the analyses [28,29].
All six soil profiles, including the clay soils, were analyzed under fully drained conditions using effective shear-strength parameters within the Mohr–Coulomb constitutive model. Consequently, the cohesion and friction-angle values adopted in the numerical analyses represent effective material properties, and the results for the clay profiles correspond to long-term consolidated behavior rather than short-term undrained response.
Because the study is intended as a comparative parametric investigation, a common drained effective-stress framework was adopted for all soil profiles, including the soft and medium clays. The drained analyses were performed using effective-stress parameters and are intended to represent an idealized end-of-consolidation state for settlement assessment. This investigation does not address short-term undrained behaviour, which would require an undrained formulation and appropriate undrained shear-strength parameters. The parameters adopted for the soft-clay profile (c′ = 48 kPa, φ′ = 18°, and Es = 8 MPa) are effective-stress parameters used within the drained Mohr–Coulomb framework. They form part of an idealized parameter set selected for comparative numerical analysis and should not be interpreted as a site-specific characterization or as undrained strength parameters. The adopted parameter ranges are supported by the geotechnical references cited in [2,3,28,29,30].
The six soil profiles considered in this study represent a broad spectrum of geotechnical conditions, ranging from very compressible soft clay to dense sand. The selected material properties cover typical stiffness and strength values encountered in engineering practice and permit the influence of soil characteristics on contact stress distribution and settlement behavior to be evaluated systematically. Although simplified, the adopted parameter ranges are representative of values commonly reported in the geotechnical literature and are therefore appropriate for comparative numerical investigations rather than site-specific design analyses.
The unit weights adopted for the six soil profiles are reported in Table 1. The groundwater table was assumed to lie below the base of the numerical domain in all analyses, while drained material behaviour was specified in PLAXIS 2D for all soil profiles. The initial stress state was generated using the K0 procedure, assuming normally consolidated conditions OCR = 1 and K0 = 1-sin φ according to Jaky’s expression. A unit weight of γc = 25 kN/m3 was adopted for the reinforced-concrete footing. A constant interface strength reduction factor of Rint = 0.67 was used for all footing–soil interfaces to maintain consistency throughout the comparative parametric programme; this value lies within the range reported for concrete–soil interfaces in [27].
The cohesion values adopted for the clay profiles (c′ = 48, 96 and 192 kPa for the soft, medium and stiff clay profiles, respectively) are effective-stress cohesion intercepts used in the drained Mohr–Coulomb analyses and should not be interpreted as undrained shear strengths. The adopted parameter sets follow the ranges used in the cited geotechnical references [28,29,30] and are intended as idealized soil profiles for comparative parametric analysis rather than as site-specific soil characterizations.
Although more advanced constitutive formulations, such as the Hardening Soil (HS) and Hardening Soil with Small-Strain Stiffness (HS-small) models, can provide a more realistic representation of stress-dependent stiffness and nonlinear deformation behavior, they require a significantly larger number of input parameters that are not always available from conventional site investigations. Since the primary objective of the present work is to compare the relative influence of foundation geometry, embedment ratio and soil stiffness under monotonic loading conditions, the Mohr–Coulomb model provides an appropriate balance between computational efficiency, robustness and predictive capability. Its use also allows the same constitutive framework to be maintained across the full parametric program [28,29].
The Mohr–Coulomb model has several limitations that are relevant to the present study. First, the soil stiffness is assumed to be independent of mean effective stress, whereas real soils generally exhibit stress-dependent stiffness. Second, the same elastic stiffness is used during loading, unloading and reloading, which simplifies the stress-path dependence associated with staged construction. Third, zero dilatancy was adopted for all soil profiles; this may underestimate volumetric response in dense sands and overconsolidated clays. Fourth, the model does not simulate the time-dependent dissipation of excess pore-water pressures and therefore cannot reproduce the consolidation process itself. Accordingly, the clay results should be interpreted as drained end-of-consolidation states rather than time-dependent consolidation predictions. More advanced constitutive models, such as the Hardening Soil, Hardening Soil with Small-Strain Stiffness, Soft Soil Creep, or Modified Cam Clay models, could be used in future studies to examine these effects more realistically.
The soil parameters adopted herein (Table 1) were selected within typical published ranges for the corresponding soil consistency or density classes, based on standard geotechnical reference data [30] and parameter ranges reported in recent studies employing the Mohr–Coulomb model [28,29].
The results should therefore be interpreted as comparative numerical trends rather than site-specific predictions. For detailed design applications involving highly nonlinear soil behavior, cyclic loading or time-dependent consolidation effects, more advanced constitutive models may provide improved predictive accuracy.
2.4. Numerical Analysis Procedure
The same three-stage construction sequence was followed for all 216 simulations. The sequence represents a shallow footing constructed within an open excavation, followed by application of the service load. Since the procedure was identical in all simulations, variations in the computed response can be attributed to the investigated parameters, such as the footing representation, embedment ratio, and soil profile, rather than to differences in the numerical procedure. The three stages and corresponding PLAXIS 2D phase settings are described below.
Stage 1—Initial geostatic stresses (Initial phase; K0 procedure): The in situ stress field was generated using the K0 procedure. All soil clusters were active, while the footing, interface elements, and external load were inactive. The unit weights given in Table 1 were used to compute the vertical stresses. The coefficient of earth pressure at rest was used to determine the horizontal stresses, assuming normally consolidated conditions (OCR = 1) and Jaky’s expression, K0 = 1 − sin(φ′). The resulting values were K0 = 0.691, 0.658, and 0.577 for the soft, medium, and stiff clays, respectively, and 0.500, 0.426, and 0.357 for the loose, medium, and dense sands, respectively. The K0 procedure is appropriate because the ground surface and soil profile are horizontal. The resulting stress field is therefore in equilibrium without requiring an additional gravity-loading phase. Since the groundwater table was set below the bottom of the model, no pore-water pressures were generated in this or any subsequent stage.
Stage 2—Excavation and footing construction (Plastic calculation; drained): the soil cluster within the excavation was deactivated to the embedment level Df. The footing cluster was then activated and assigned a linear-elastic reinforced-concrete material (Ef = 27 GPa, νf = 0.15, γc = 25 kN/m3). The interface elements along the footing base and vertical sides were also activated with a strength reduction factor Rinter = 0.67. In this stage, the self-weight of the footing was therefore applied automatically in PLAXIS 2D [20,21]. The stress state prior to application of the service load consequently reflects both the stress relief induced by excavation and the reloading caused by the footing self-weight.
Stage 3—Application of the service pressure (Plastic calculation; drained): A uniformly distributed vertical pressure was applied to the top surface of the footing. The target pressure (q = 100 kN/m2) was incremented from zero to its prescribed value using the automatic step-size procedure in PLAXIS 2D to ensure convergence of the elastoplastic solution. At the beginning of Stage 3, the “Reset displacements to zero” option was activated. Consequently, excavation-induced heave and settlement caused by the footing self-weight were excluded from the reported settlements. Thus, all settlements reported in this study are load-induced settlements associated solely with the applied service pressure q. The applied pressure therefore represents a net incremental service pressure acting on the stress state established at the end of Stage 2. If this reset were not performed, the computed settlements would include construction-induced deformations dependent on Df, T, and soil self-weight, making settlements at different embedment ratios less directly comparable.
The loading was applied as a prescribed pressure rather than a prescribed displacement. The resulting contact stress distribution beneath the footing is governed by the interaction between the soil and footing stiffness and can be interpreted within the framework of classical relative stiffness [31,32]. A target pressure of 100 kN/m2, representative of serviceability-level bearing pressures for light to medium structures [30], was maintained in all simulations.
All response variables were evaluated at the end of Stage 3. These included the maximum load-induced vertical settlement, the contact stress distribution along the footing base, the relative stiffness parameters, and the size of the stress bulb. The stress bulb was defined by the 0.1q isobar of the incremental vertical stress, Δσyy = σyy (end of Stage 3) − σyy (end of Stage 2), rather than by the total vertical stress. This definition excludes the geostatic stresses and the effects associated with excavation and footing self-weight; therefore, the computed influence depth reflects only the stress increase caused by the applied service pressure. The interface elements along the vertical sides of the embedded footings allow shear transfer between the footing and the surrounding soil, in addition to load transfer through the footing base. In the present study, the contributions of base resistance and side shear were not quantified separately.
2.5. Numerical Verification
The finite element modelling strategy was verified before the parametric analyses by examining mesh convergence, computational domain sensitivity and agreement with analytical solutions reported in the literature. The purpose was to confirm that the numerical predictions were stable and sufficiently independent of mesh and domain size.
The Boussinesq comparison is used to check the numerical tool setup (element type, mesh refinement, boundary conditions and material implementation) by reproducing the known closed-form solution. It does not validate footing–soil interaction, embedment effects, material nonlinearity, or shape-dependent behaviour. These aspects are not independently validated by the Boussinesq comparison. Additional confidence in the numerical framework is provided by the consistency of the trends observed across the full parametric dataset, the analytical settlement comparisons, and the field-based comparison described below.
A mesh convergence study was conducted using a representative numerical model corresponding to a circular footing with a width of 1.0 m, embedded at an embedment ratio of Df/B = 0.25 and founded on soft clay. Four levels of mesh refinement, ranging from approximately 450 to 1950 finite elements, were investigated. The adopted very fine mesh, comprising approximately 1950 elements and 16,200 nodes, produced changes of less than 1.8% in the predicted peak contact stress and 1.2% in the maximum settlement relative to the preceding refinement level.
The influence of the computational domain dimensions was also evaluated to minimize the effect of artificial boundary constraints on the predicted foundation response. Several domain sizes were analyzed, ranging from 3B × 3B to 6B × 5B, where B denotes the footing width. Increasing the domain beyond 5B horizontally and 4B vertically changed both the peak contact stress and maximum settlement by less than 0.4%. The 5B × 4B domain was therefore adopted for the parametric study.
Table 5 summarizes the results of the computational domain sensitivity analysis used to define the numerical model adopted throughout the investigation.
Table 5.
Model domain sensitivity analysis (circular footing, B = 1.0 m, soft clay, Df/B = 0.25).
The numerical predictions were also checked against classical analytical solutions from the geotechnical literature. The vertical stress increment along the axis beneath a uniformly loaded circular surface area resting on a homogeneous elastic half-space was compared with the corresponding Boussinesq solution under equivalent loading conditions. The maximum absolute difference for this verification case was 2.2%, as documented in Supplementary Materials S1, Figure S1. In addition, the predicted maximum settlement was compared with the classical elastic solution proposed in [30]. These comparisons are used as numerical verification checks and not as validation of footing–soil contact-pressure generation, embedment effects, or material nonlinearity.
Two further verification examples: (i) strip footing against plane-strain elastic analytical solution [6] with maximum difference 2.9%; and (ii) equivalent square footing against the elastic settlement solution of Poulos & Davis [22] with difference 3.1%. The maximum differences obtained for the circular, strip, and square-equivalent verification cases were 2.2%, 2.9%, and 3.1%, respectively (see Supplementary Materials S1, Figure S1 and Table S1).
Taken together, the mesh convergence, domain sensitivity and analytical comparisons indicate that the adopted finite element model provides stable predictions for the comparative analyses performed in this study.
As an additional check, the numerical modelling approach was compared with the independent field case reported in [33] for square spread footings on sand. The comparison indicated reasonable agreement between the finite element prediction and the reported field settlement. This field-based comparison provides supplementary support for the modelling approach beyond the mesh-convergence, domain-sensitivity and analytical verification checks described above.
2.6. Relative Stiffness Factor
The structural response of a shallow foundation depends on the relative stiffness of the footing with respect to the supporting soil. This interaction is commonly quantified using the Relative Stiffness Factor (Kr), which relates the elastic properties of the footing and supporting soil to the geometric characteristics of the foundation. The parameter provides a convenient basis for assessing foundation rigidity and has been widely employed in analytical and numerical studies to classify shallow foundations according to their structural response and to investigate soil–structure interaction [15,16,17,32].
In the present study, the Relative Stiffness Factor was calculated using the formulation adopted in previous studies on the rigidity classification of shallow foundations [15,16,34], Equation (1).
where νs and νf are the Poisson’s ratios of the soil and footing material, respectively; Es and Ef are the Young’s moduli of the soil and footing material; T is the footing thickness; and B is the full characteristic footing dimension used in the relative stiffness formulation, corresponding to the footing diameter for circular foundations, the side length for square foundations, and the width for strip foundations.
Although the conventional Relative Stiffness Factor has been successfully applied to surface foundations, it implicitly assumes that the supporting soil stiffness remains unchanged with embedment. In practice, increasing embedment enhances the confinement of the surrounding soil and may increase the operative stiffness mobilized beneath the footing. To represent this effect within the present parametric framework, a depth-adjusted effective soil modulus is proposed, Equation (2).
where Es is the initial Young’s modulus of the supporting soil, Df is the embedment depth and B is the characteristic footing width. The coefficient 0.25 was obtained by regression of the back-calculated operative stiffness ratios described below and represents an empirical adjustment intended to account for the increase in operative soil stiffness associated with embedment. Accordingly, it should be regarded as a dataset-specific parameter applicable only to the range of soil properties and embedment ratios considered in the present study. The proposed formulation was subsequently incorporated into the Relative Stiffness Factor calculations to evaluate the influence of embedment on foundation rigidity.
Equation (2) is an empirical summarising expression calibrated for the conditions of this parametric programme and does not represent a constitutively derived modulus increase within the Mohr–Coulomb model. The coefficient α was estimated from 24 selected PLAXIS 2D simulations comprising three footing representations, four soil profiles, and the two extreme embedment ratios Df/B = 0.25 and 1.00. For each simulation, the operative modulus Es,eff was back-calculated from the Stage 3 settlement response, and the ratio Es,eff/Es was regressed against Df/B using a linear model with the intercept constrained to unity. The regression yielded α = 0.2425, which was rounded to 0.25 for use in Equation (2), with R2 = 0.9353, SE = 0.0051, and a 95% confidence interval of [0.2321, 0.2530]. The detailed regression procedure, dataset, and statistical results are provided in Supplementary Materials S2. The resulting monotonic decrease of Kr with increasing Df/B is therefore a mathematical consequence of the inverse dependence of Kr on Es,eff and should not be interpreted as independent physical validation of the proposed formulation. If the proposed framework is to be applied beyond the investigated conditions, independent validation by centrifuge or field testing is required (Section 4.4).
Throughout the investigation, the elastic properties of the reinforced concrete footing were maintained constant (Ef = 27 GPa and νf = 0.15), whereas the footing geometry was varied according to the dimensions listed in Table 2. Three footing thicknesses (0.3, 0.6 and 0.9 m), the characteristic footing dimensions listed in Table 2 for each footing geometry, and three representative soil stiffness values (Es = 8, 23 and 65 MPa) were considered when calculating the Relative Stiffness Factor. These values are consistent with the parametric program described in Section 2.2.
The calculated values of the Relative Stiffness Factor were interpreted according to the conventional foundation rigidity classification reported in the literature. As shown in Table 6, foundations are classified into four categories-flexible, semi-flexible, semi-stiff and stiff-according to the magnitude of Kr. These classes provide a basis for interpreting the stiffness relationship between the footing and supporting soil in the subsequent analyses. The conventional rigidity classification adopted herein is based on the work in [34] and its subsequent application in [15].
Table 6.
Conventional Classification of Foundation Systems According to the Relative Stiffness Factor ().
The Kr formulation (Equation (2)) is an empirical tool, in that the depth adjustment is empirical. The inverse Kr—Es correlation is evident from the monotonic decrease in Kr with increasing Df/B, i.e., as the soil stiffness increases with embedment (which is consistent with decreased settlement and PSR), Kr decreases relative to the unchanging structural stiffness of the footing. This is mathematical and not physical validation of the empirical formulation. The coefficient α = 0.25 should be validated in independent conditions of engineering use, outside of those investigated (Section 4.4).
The inclusion of an embedment-dependent adjustment is qualitatively consistent with classical foundation theories, which account for the influence of foundation depth on settlement and bearing response through depth-correction factors. Examples include the depth correction proposed in [35] for elastic settlement, as subsequently incorporated into classical settlement formulations [22], and the depth factors included in the bearing-capacity formulations in [25,31]. These established formulations provide a physical basis for considering embedment in the assessment of foundation response. However, they do not constitute an independent calibration of the coefficient adopted herein, which was derived from the present numerical dataset and therefore requires further validation before application beyond the investigated ranges of Es and Df/B.
3. Results and Discussion
The finite element analyses generated a comprehensive dataset describing the influence of foundation geometry, embedment ratio and supporting soil properties on the mechanical behavior of shallow foundations. The numerical program comprised 216 simulations covering three footing geometries, three paired width–thickness configurations, four embedment ratios and six representative soil profiles, enabling the settlement response, contact stress distribution, stress bulb development and foundation rigidity to be compared within the same numerical framework.
Before examining each response parameter individually, Figure 2 presents a representative example of the stress field obtained from the finite element analyses for a circular footing embedded at Df/B = 0.50. The figure shows the redistribution of vertical stresses beneath the footing and the resulting stress bulb within the supporting soil. The highest compressive stresses occur immediately beneath the footing, while stress magnitudes decrease progressively with both depth and radial distance from the loaded area. Load transfer therefore extends beyond the footing base and mobilizes the surrounding soil mass. The stress pattern shown in Figure 2 also illustrates the role of soil confinement in redistributing the applied load beneath an embedded footing [3,9,10].
Figure 2.
Representative vertical stress contours (σyy) for a circular footing at Df/B = 0.50, showing stress bulb development beneath the foundation.
This stress field provides the basis for interpreting the contact stress, settlement and stress bulb results discussed in the following sections. The influence of embedment is examined for each footing geometry and soil profile, allowing the effects of confinement and soil stiffness to be compared across the numerical dataset.
To provide an overview of the complete numerical program before discussing each footing geometry individually, Table 3, Table 4 and Table 7 summaries the principal results obtained from the parametric analyses. Table 3 presents the percentage reduction in maximum settlement associated with increasing embedment ratio for each footing geometry and soil profile, Table 4 summarizes the Peak Stress Ratio (PSR) obtained for the analyzed configurations, and Table 7 reports representative values of the depth-adjusted Relative Stiffness Factor (Kr) calculated using the proposed effective soil modulus formulation. The detailed response of circular, square and strip footings is discussed separately in the following sections.
Table 7.
Relative Stiffness Factor (Kr) values calculated using Equation (2), with Es,eff = Es [1 + 0.25 (Df/B)].
3.1. Circular Footing
The circular footing was selected as the reference configuration because its axisymmetric geometry promotes a relatively uniform redistribution of stresses beneath the loaded area, providing a suitable basis for examining embedment and soil stiffness effects. Settlement, contact stress distribution, stress bulb development and relative stiffness are discussed below before comparison with the square and strip footings.
3.1.1. Settlement Behaviour for Circular Footing
Settlement is one of the principal serviceability criteria governing the design of shallow foundations, as excessive vertical deformation may compromise the structural performance even when the ultimate bearing capacity is not exceeded. For embedded footings, settlement is controlled by the combined influence of soil stiffness, foundation geometry and the degree of confinement provided by the surrounding ground.
Table 3 summarizes the settlement reductions for the complete numerical program, while Figure 3 shows the detailed response of the circular footing. Maximum vertical settlement is plotted against embedment ratio for the six soil profiles.
Figure 3.
Variation of maximum vertical settlement with embedment ratio (Df/B) for the circular footing founded on the six representative soil profiles analyzed.
A steady reduction in settlement occurs as Df/B increases from 0.25 to 1.00 (Figure 3). Over this range, the curves are approximately linear and broadly parallel. The largest settlements were obtained in soft clay, whereas the smallest occurred in dense sand, with the remaining soil profiles following the order of increasing stiffness. Thus, soil stiffness primarily controls the absolute magnitude of settlement, while embedment produces a similar downward trend for all six soils.
The percentage reductions in Table 3 support this observation. For the circular footing, settlement decreased by 17.3–27.1% between Df/B = 0.25 and 1.00, with the greatest percentage reduction occurring in soft clay. The lower settlement at greater embedment is consistent with increased confinement of the soil surrounding the footing and the associated change in load transfer beneath the foundation. Similar settlement trends for embedded shallow foundations have been reported in [3,9,10].
3.1.2. Contact Stress Distribution for Circular Footing
The distribution of contact stresses beneath a shallow foundation governs the transfer of structural loads from the footing to the supporting soil. For the circular footing, the axisymmetric formulation allows the radial contact pressure response to be examined without the plane-strain conditions associated with strip footings.
Figure 4 presents the normalized contact stress, σ(x)/q, for sandy and clayey soils at Df/B = 0.25, 0.50, 0.75 and 1.00. Two distinct distributions are evident. In sandy soils, the contact stresses follow a characteristic U-shaped distribution, with higher stresses developing near the footing edges and lower stresses occurring beneath the center. In contrast, clayey soils exhibit an inverted U-shaped distribution, with maximum stress beneath the footing center and lower values towards the edges. The different profiles reflect the deformation response of the two soil groups.
Figure 4.
Normalized contact stress distribution (σ(x)/q) beneath the circular footing for different embedment ratios.
In cohesionless soils, shear resistance is predominantly frictional and therefore depends strongly on the effective confining stress. Variations in confinement and local yielding beneath the footing influence the redistribution of contact pressure and produce the characteristic U-shaped profile observed in the present simulations. Increasing Df/B enhances confinement around the footing and progressively reduces the magnitude of the stress concentration, although the overall profile shape is maintained. In clayey soils, the effective cohesion term provides a component of shear resistance that is less directly dependent on confinement than in cohesionless soils. Consequently, the contact-stress distribution is more strongly influenced by the relative footing–soil stiffness Kr, together with Poisson’s ratio and the extent of the plastic zone, producing the centre-dominant inverted U-shaped profile observed in the analyses.
The loading level also influences the extent of yielding and stress redistribution; however, because the applied service pressure was maintained at q = 100 kN/m2 throughout the parametric programme, its effect was held constant while the influence of soil type, footing representation, and embedment ratio was examined.
Embedment causes relatively small changes in the shape of these distributions. The U-shaped sandy-soil profile and inverted U-shaped clayey-soil profile persist over the four Df/B values, although the magnitude of the stress concentration is moderated as embedment increases. This indicates that soil behavior largely determines the form of the contact pressure profile, whereas embedment primarily modifies its magnitude, consistent with the increased confinement associated with greater foundation depth.
Table 4 provides a complementary measure through the Peak Stress Ratio (PSR). The circular footing has the lowest PSR of the three geometries, decreasing from 1.78 at Df/B = 0.25 to 1.34 at Df/B = 1.00. This response is consistent with the radial stress redistribution of the axisymmetric footing and its comparatively low settlement response. Similar contact stress patterns have been reported for shallow foundations on cohesive and granular soils [3,8,9].
3.1.3. Influence Depth of the Stress Bulb for Circular Footing
The influence depth of the stress bulb describes the vertical extent of stress transmission into the supporting soil. In this study, it was determined from the finite element stress contours using the 0.1q isobar criterion. Figure 5 shows the normalized influence depth (Dinf/B) for three representative soil stiffnesses.
Figure 5.
Variation of the normalized influence depth (Dinf/B) beneath the circular footing with embedment ratio for three representative soil stiffnesses.
For all three stiffness values, Dinf/B decreases almost linearly as the embedment ratio increases. The largest influence depths were obtained for the soft soil (Es = 8 MPa), whereas the smallest values occurred for the stiff soil (Es = 65 MPa). At Df/B = 0.25, Dinf/B ranges from approximately 1.10 for the stiff soil to 1.60 for the soft soil. At Df/B = 1.00, the corresponding values decrease to approximately 0.88 and 1.24.
The deeper stress propagation in the softer soil is associated with its greater deformability, whereas in the stiffer soil significant stress changes are restricted to a shallower region. The similar slopes of the three curves show that the reduction in influence depth with embedment is maintained across the stiffness range considered.
This behavior is consistent with the settlement trends in Section 3.1.1. As the significant stress zone becomes shallower, less of the deeper soil mass is involved in the foundation response, while confinement around the embedded footing becomes more important. Comparable relationships between embedment and stress propagation have been reported in numerical studies of shallow foundations [3,9,10].
3.1.4. Relative Stiffness Factor for Circular Footing
The Relative Stiffness Factor (Kr) expresses the stiffness relationship between the footing and supporting soil. Figure 6 plots Kr against footing radius for the six soil profiles and three footing thicknesses, together with the rigidity classes adopted from [15,34].
Figure 6.
Variation of the Relative Stiffness Factor (Kr) with footing radius for the circular footing considering different soil profiles and footing thicknesses.
Kr decreases markedly with increasing footing radius for every soil profile and footing thickness considered. This behavior reflects the greater flexibility of larger foundations, where the increase in footing dimensions is not accompanied by a proportional increase in structural rigidity. The effect is evident over several orders of magnitude in Figure 6.
Footing thickness has the opposite effect. Increasing T from 0.30 to 0.90 m raises Kr and, in several cases, shifts the footing into a higher rigidity class. The change is most pronounced for the softer clay profiles. Foundations resting on stiffer soils generally exhibit lower Kr values for the same footing geometry and thickness, as expected from the stiffness ratio in Equation (1).
The rigidity regions in Figure 6 illustrate the combined effects of footing size, thickness and soil stiffness. Thin footings and larger radii are mainly located in the flexible or semi-flexible ranges, whereas thicker footings, particularly on softer soils, extend into the semi-stiff and stiff regions. Kr therefore provides a compact measure of the relative footing–soil stiffness for the configurations considered.
The interpretation of the depth-adjusted Kr formulation with increasing embedment is discussed later together with the comparative results.
3.2. Square Footing
Compared with the circular footing, the square footing shows a different numerical response under the adopted geometric representation and load-transfer conditions. The following results focus primarily on differences from the circular reference case, avoiding repetition of the common embedment and soil-stiffness trends already discussed in Section 3.1.
3.2.1. Settlement Behaviour for Square Footing
Figure 7 shows the maximum vertical settlement of the square footing for the six soil profiles over the investigated embedment range. As observed for the circular footing, settlement decreases steadily with increasing Df/B, while its absolute magnitude remains strongly dependent on soil stiffness.
Figure 7.
Variation of maximum vertical settlement with embedment ratio (Df/B) for the square footing founded on the six representative soil profiles analyzed in the numerical program.
Under the adopted numerical representations, the square footing develops slightly larger settlements than the circular footing for corresponding soil and embedment conditions. In soft clay, for example, settlement decreases from approximately 31.8 mm at Df/B = 0.25 to 22.5 mm at Df/B = 1.00. Dense sand shows considerably smaller values, decreasing from approximately 6.8 to 6.0 mm over the same range.
A Supplementary Materials Data file with all 216 simulation results (settlement, PSR, Dinf/B) is provided and B is defined uniformly as the full characteristic plan dimension (diameter for circular; side length for square; full transverse width for strip).
Despite the differences in settlement magnitude, the curves remain broadly parallel. Table 3 shows reductions of 18.9–29.2% for the square footing between Df/B = 0.25 and 1.00, with the largest reduction occurring in soft clay. These results indicate that the response to increasing embedment remains similar across the soil profiles, although the initial soil stiffness controls the magnitude of deformation. Comparable settlement trends for embedded shallow foundations have been reported in [3,9,10].
3.2.2. Contact Stress Distribution for Square Footing
Figure 8 presents the normalized contact stress distributions beneath the square footing for sandy and clayey soils at the four embedment ratios. The same soil-dependent profiles identified for the circular footing are evident: sandy soils show U-shaped distributions, whereas clayey soils develop inverted U-shaped profiles.
Figure 8.
Normalized contact stress distribution (σ(x)/q) beneath the square footing for different embedment ratios.
The same governing mechanisms described in Section 3.1.2 apply to the square footing: frictional confinement drives the U-shaped profile in sandy soils; cohesion-independence combined with Kr governs the inverted-U profile in clayey soils. Profile form changes little with Df/B-increasing embedment primarily moderates the magnitude of the stress concentration rather than altering the characteristic distribution.
The general form of each profile changes little with Df/B. Increasing embedment mainly reduces the magnitude of the stress concentration rather than changing the characteristic distribution associated with each soil group. This agrees with the circular-footing results and indicates that the soil response governs the overall form of the contact pressure profile within the adopted numerical framework.
A difference is evident in the PSR values reported in Table 4. For the square footing, PSR decreases from 1.92 at Df/B = 0.25 to 1.46 at Df/B = 1.00, compared with 1.78 and 1.34, respectively, for the circular footing. The square-footing representation therefore produces somewhat greater peak stress concentrations under corresponding numerical conditions. This difference is consistent with the slightly larger settlements shown in Figure 7.
The persistence of the U-shaped and inverted U-shaped profiles across the embedment range is consistent with previous studies showing the importance of soil behavior in determining contact pressure distributions [3,9,10].
3.2.3. Influence Depth of the Stress Bulb for Square Footing
Figure 9 shows Dinf/B for the square footing at Es = 8, 23 and 65 MPa. As in the circular-footing analyses, the influence depth decreases almost linearly with increasing embedment and is greatest for the softest soil.
Figure 9.
Variation of the normalized influence depth of the stress bulb (Dinf/B) with embedment ratio for the square footing considering three representative soil stiffnesses.
For Es = 8 MPa, Dinf/B decreases from approximately 2.10 at Df/B = 0.25 to 1.63 at Df/B = 1.00. The corresponding range for Es = 65 MPa is approximately 1.50–1.19. The intermediate-stiffness soil follows the same trend.
These values are consistently greater than those obtained for the circular footing. The numerical results therefore indicate a deeper zone of significant stress beneath the square-footing representation, which is consistent with its higher PSR and settlement values. The difference is attributed here to the response of the adopted footing representations rather than to three-dimensional corner effects, which are not explicitly reproduced by the 2D model.
Increasing Df/B nevertheless reduces the stress influence depth at a similar rate for all three stiffness levels. The effect of embedment on stress influence depth is therefore maintained for the square footing, although the absolute Dinf/B values differ from the circular case. Similar embedment-related reductions in stress propagation have been reported in finite element studies of shallow foundations [3,9,10].
3.2.4. Relative Stiffness Factor for Square Footing
Figure 10 plots Kr against footing half-width (B/2) for the six soil profiles and three footing thicknesses. The trends closely follow those obtained for the circular footing: Kr decreases as the footing dimension increases and rises markedly with footing thickness.
Figure 10.
Variation of the Relative Stiffness Factor (Kr) with footing half-width (B/2) for the square footing considering different soil profiles and footing thicknesses. The shaded regions indicate the stiffness classifications adopted in [15,34].
Increasing T from 0.30 to 0.90 m shifts several configurations from the flexible or semi-flexible ranges towards the semi-stiff and stiff classes. Higher Kr values are again obtained for the softer soils, consistent with the stiffness ratio in Equation (1), whereas the stiff clay and dense sand profiles generally occupy the lower rigidity ranges.
The results in Figure 10 show that footing dimension, thickness and soil stiffness jointly determine the rigidity class of the square-footing configurations. Rather than repeating the mechanisms discussed for the circular footing, the main point of comparison is that the square-footing results preserve the same Kr trends across the analyzed geometric and soil conditions.
The influence of embedment on the depth-adjusted Relative Stiffness Factor is discussed in the following sections.
3.3. Strip Footing
Unlike the circular and square footings, the strip footing was analyzed under plane-strain conditions, representing foundations that extend continuously in one direction. This formulation produces a different stress field from the isolated-footing representations considered previously. The discussion below therefore focuses on the principal differences in settlement and stress propagation, while common trends already established in Section 3.1 and Section 3.2 are treated more briefly.
3.3.1. Settlement Behaviour for Strip Footing
Figure 11 presents the maximum vertical settlement of the strip footing for the six soil profiles. Settlement decreases almost linearly with increasing Df/B in every case, while soft clay produces the largest deformation and dense sand the smallest.
Figure 11.
Variation of maximum vertical settlement with embedment ratio (Df/B) for the strip footing founded on the six representative soil profiles analyzed.
The strip footing develops the largest settlements of the three footing representations. In soft clay, settlement decreases from approximately 36.3 mm at Df/B = 0.25 to 28.4 mm at Df/B = 1.00. The corresponding values in dense sand are approximately 8.0 and 6.9 mm. This greater settlement response is consistent with the plane-strain formulation, under which the stress field differs from those obtained for the isolated-footing representations.
Despite the higher absolute settlements, the proportional reduction with embedment remains comparable to the other footing representations. Table 3 shows settlement reductions of 17.7–27.3% for the strip footing between Df/B = 0.25 and 1.00. Thus, the numerical results indicate that embedment reduces settlement across all three footing representations, whereas footing geometry and soil stiffness control the magnitude of deformation. Similar trends have been reported in numerical studies of embedded shallow foundations [3,9,10].
3.3.2. Contact Stress Distribution for Strip Footing
Figure 12 shows the normalized contact stress distributions beneath the strip footing. The soil-dependent profiles identified in Section 3.1 and Section 3.2 are again observed: sandy soils develop U-shaped distributions, whereas clayey soils show inverted U-shaped profiles.
Figure 12.
Normalized contact stress distribution (σ(x)/q) beneath the strip footing for different embedment ratios.
The form of these profiles remains largely unchanged over the four embedment ratios. As for the other footing representations, increasing Df/B modifies the magnitude of the stress concentration without changing the characteristic profile associated with each soil group. The consistency of this response across Figure 4, Figure 8 and Figure 12 indicates that soil behavior is the main factor controlling the form of the normalized contact pressure distribution in the present analyses.
The principal difference is the magnitude of the peak stress. Table 4 shows that PSR for the strip footing decreases from 2.04 at Df/B = 0.25 to 1.55 at Df/B = 1.00, the highest values among the three footing representations. This response is consistent with the larger settlements obtained in Figure 11 and the plane-strain conditions adopted for the strip-footing analyses.
Accordingly, the effect of footing representation is more evident in the magnitude and spatial extent of stress transfer than in the general shape of the normalized contact stress profile.
3.3.3. Influence Depth of the Stress Bulb for Strip Footing
Figure 13 presents Dinf/B for the strip footing at Es = 8, 23 and 65 MPa. The influence depth decreases approximately linearly with increasing Df/B for all three soil stiffnesses, following the trend observed for the circular and square footings.
Figure 13.
Variation of the normalized influence depth of the stress bulb (Dinf/B) with embedment ratio for the strip footing considering three representative soil stiffnesses.
The strip footing, however, develops the deepest stress influence zone of the three footing representations. For Es = 8 MPa, Dinf/B decreases from approximately 3.00 at Df/B = 0.25 to 2.34 at Df/B = 1.00. For Es = 65 MPa, the corresponding values are approximately 2.00 and 1.58. The intermediate soil stiffness follows the same trend.
Comparison with Figure 5 and Figure 9 shows that the strip-footing stress field extends considerably deeper into the soil. This difference is consistent with the plane-strain formulation and provides a direct explanation for the greater settlements observed in Section 3.3.1. Soil stiffness remains important, with the softer soil producing a deeper influence zone at every embedment ratio.
Increasing embedment reduces Dinf/B without eliminating the differences between the footing representations. The numerical results therefore show that increasing embedment reduces the depth of the significant stress zone, whereas the adopted footing representation and numerical formulation influence its absolute depth. Similar trends in stress propagation beneath embedded foundations have been reported in [3,9,10].
3.3.4. Relative Stiffness Factor for Strip Footing
Figure 14 presents Kr as a function of footing half-width (B/2) for the six soil profiles and three footing thicknesses. The rigidity classes adopted in [15,34] are included for comparison.
Figure 14.
Variation of the Relative Stiffness Factor (Kr) with footing half-width (B/2) for the strip footing considering different soil profiles and footing thicknesses.
The Kr trends are consistent with those shown for the other footing configurations. Increasing the footing half-width reduces Kr, whereas increasing the footing thickness from 0.30 to 0.90 m produces a marked increase. Depending on the combination of footing dimension, thickness and soil stiffness, the calculated values extend from the flexible range to the stiff range.
Softer soils produce higher Kr values for a given footing dimension and thickness, while the stiffer soil profiles yield lower values. This trend follows directly from Equation (1), in which Kr is inversely related to the soil modulus. The results therefore illustrate the combined influence of footing dimensions, structural rigidity and soil stiffness on the relative stiffness classification.
The similarity of the Kr trends in Figure 6, Figure 10 and Figure 14 is expected because the parameter is calculated from the elastic and geometric variables defined in Equation (1). The Kr results should therefore be interpreted as a stiffness classification of the analysed footing–soil combinations rather than as a direct measure of the plane-strain stress redistribution observed in the finite element analyses.
4. Comparative Assessment and Engineering Implications
The results for the three footing representations are compared in this section to identify the main mechanisms associated with embedment and their implications for shallow foundation behavior. The discussion focuses on stress redistribution, settlement and the relative response of the footing–soil system.
4.1. Governing Mechanisms of Embedded Foundation Behavior
The numerical results indicate that the response to increasing embedment is associated with changes in the stress state and stress redistribution within the surrounding soil. Increasing Df/B reduces the depth of the significant stress field beneath the foundation, consistent with the greater confinement associated with increased embedment. This effect is reflected in the progressive reduction in settlement and influence depth observed for all three footing representations. The settlement response is most pronounced in soft clay, whereas dense sand shows smaller proportional changes because of its higher initial stiffness.
Embedment also moderates peak contact stresses. Increasing Df/B is associated with a redistribution of the applied load over the footing–soil interaction zone, resulting in lower Peak Stress Ratios and shallower stress bulbs. This response is consistent with the greater lateral confinement associated with increased embedment. The reduction in PSR between Df/B = 0.25 and 1.00 is approximately 24–25% for the three footing representations (Table 4). Similar embedment-related changes in stress redistribution have been reported in previous numerical and experimental studies [3,9,10].
The relative stiffness results provide a further basis for examining the interaction between footing rigidity and soil deformability. The proposed depth adjustment is intended to represent the increase in the operative soil stiffness associated with embedment. According to the proposed formulation, this increase results in progressively lower values of the Relative Stiffness Factor (Table 7). This trend reflects an increase in the stiffness of the supporting soil relative to the unchanged structural stiffness of the footing, rather than a reduction in the footing stiffness.
Overall, the analyses show that embedment affects settlement, peak contact stress and the depth of significant stress propagation across all three footing representations. Its influence is therefore better interpreted in terms of changes in the footing–soil interaction response rather than foundation depth alone.
4.2. Evaluation of the Proposed Depth-Adjusted Relative Stiffness Framework
The conventional Relative Stiffness Factor has traditionally been evaluated using the initial elastic modulus of the supporting soil, implicitly assuming that soil stiffness remains independent of foundation embedment. For embedded foundations, however, changes in confinement may modify the operative stiffness mobilised in the soil surrounding the footing.
To account for this behaviour, the depth-adjusted effective soil modulus introduced in Section 2.6 (Equation (2)) was incorporated into the calculation of the Relative Stiffness Factor. The proposed adjustment introduces embedment explicitly into the soil stiffness term used in the Kr calculation and is intended to represent the change in operative soil stiffness associated with confinement.
Equation (2) is explicitly an empirical summarising expression. Substituting it into Kr necessarily produces monotonic decrease with Df/B, a mathematical consequence of the inverse Kr—Es relationship, reflecting increased operative soil stiffness relative to the footing. This is consistent with observed settlement and PSR reductions. The framework should be understood as a systematic accounting tool within the investigated conditions, not an independently validated predictive model.
The resulting Kr values are used to examine whether foundations with identical geometric and material properties may occupy different positions within the conventional rigidity classification when embedment is considered. According to the proposed formulation, the increase in the operative soil stiffness with embedment leads to lower values of the Relative Stiffness Factor (Table 7), reflecting the increased stiffness of the supporting soil relative to the unchanged structural stiffness of the footing.
The proposed formulation therefore examines whether the conventional Relative Stiffness framework can be adapted to account explicitly for embedment. Rather than treating soil stiffness as independent of foundation depth, the approach introduces a depth-dependent stiffness term into the Kr calculation. Its interpretation for embedded shallow foundations is discussed in relation to the settlement and contact stress results obtained from the numerical analyses.
4.3. Practical Engineering Implications
From an engineering perspective, the present investigation provides several practical observations that may assist the preliminary design of embedded shallow foundations.
Within the investigated range of foundation geometries, embedment ratios and soil properties, increasing the embedment ratio consistently reduced settlement, peak stress concentrations and the depth of significant stress propagation beneath the footing. These trends were maintained throughout the investigated range from Df/B = 0.25 to 1.00, although their absolute magnitude varied with soil stiffness and footing representation. The results therefore support embedment as an important parameter in the preliminary assessment of shallow foundation response, but the appropriate depth should be selected considering project-specific geotechnical and construction conditions.
The numerical analyses further indicate that footing representation should be considered together with embedment when interpreting foundation response. Within the adopted numerical framework, the circular-footing representation consistently produced the lowest settlements, the lowest Peak Stress Ratios and the shallowest stress bulbs. The square-footing representation exhibited only modest differences relative to the circular case, whereas the strip-footing representation consistently produced the deepest stress bulbs and the highest settlements. These differences should be interpreted as comparative trends within the adopted numerical formulations rather than as direct quantitative comparisons among mechanically equivalent three-dimensional footing geometries.
These comparative observations are valid within the adopted 2D numerical representations only. Extension to actual 3D foundation geometries—including corner effects in square footings—requires independent 3D FE analyses or experimental validation.
The proposed depth-adjusted Relative Stiffness formulation is intended to provide a framework for examining the relative footing–soil stiffness of embedded foundations. By introducing embedment into the soil stiffness term, the methodology allows its influence on the conventional flexible, semi-flexible, semi-stiff and stiff classifications to be evaluated. According to the proposed formulation, increasing embedment increases the operative soil stiffness and therefore reduces the Relative Stiffness Factor (Table 7). This behavior should be interpreted as a change in the relative footing–soil stiffness relationship, rather than as a reduction in the structural stiffness of the footing.
These observations are consistent with the serviceability-oriented principles considered in international standards [5,6], where foundation design requires the combined evaluation of settlement behavior, soil conditions and structural response rather than reliance solely on bearing capacity criteria. The results presented here provide a comparative basis for considering foundation geometry, embedment ratio and footing–soil relative stiffness during preliminary assessment of embedded shallow foundations.
4.4. Limitations and Future Research
The conclusions presented in this study are based on a finite element investigation of homogeneous soil profiles, monotonic static loading conditions and the range of footing geometries, embedment ratios and soil stiffnesses investigated. Furthermore, the numerical analyses employed the Mohr–Coulomb constitutive model, which provides a practical representation of soil behavior for comparative analyses but does not explicitly account for stress-dependent stiffness, strain hardening or time-dependent deformation.
These assumptions should be considered when extending the results to layered soil deposits, highly nonlinear constitutive behavior, cyclic loading, seismic loading or long-term consolidation problems, where additional mechanisms may influence soil–foundation interaction. In particular, the clay results represent an idealized drained end-of-consolidation state and do not cover short-term undrained behavior or the consolidation process. Moreover, the proposed depth-adjustment coefficient was derived from the numerical database analyzed in this study and should therefore be regarded as an empirical parameter requiring further validation before being applied to other soil conditions or embedment ranges.
The analytical sensitivity check showed a difference of less than 1% in centre-point settlement for the response metric considered. Nevertheless, the square footing is represented by an equal-area axisymmetric idealization, which cannot reproduce the three-dimensional edge and corner effects of an actual square footing. Accordingly, the differences among footing shapes reported in this study should be interpreted as relative trends within the adopted two-dimensional numerical representations rather than as directly comparable quantitative differences among mechanically equivalent three-dimensional footing geometries.
Three future research priorities are as follows: (a) Three-dimensional FE analyses (PLAXIS 3D) to fully separate shape effects from 2D formulation differences and enable mechanically equivalent comparison among circular, square and strip foundations. (b) Advanced constitutive models (HS, HS small) for independent validation with stress-dependent stiffness. (c) Centrifuge or field validation of the depth-adjusted Kr formulation (Equation 2) at known Df/B values.
Further assessment of the numerical framework could consider advanced constitutive models, layered soil profiles and three-dimensional analyses. Experimental or field-based comparisons would also provide an independent basis for examining the depth-adjusted Relative Stiffness formulation beyond the numerical conditions considered here.
5. Conclusions
This study investigated the influence of foundation geometry, embedment ratio and soil stiffness on the behavior of embedded shallow foundations through a finite element parametric study. Based on the numerical analyses performed, the following conclusions were obtained:
- Increasing the embedment ratio consistently reduced settlement, peak contact stresses and the depth of significant stress propagation beneath the footing for all three footing representations. These trends were maintained throughout the investigated range of Df/B = 0.25–1.00, although the magnitude of the response varied with soil stiffness and footing representation.
- The adopted footing representation influenced the numerical response within the investigated framework. The circular-footing representation exhibited the lowest settlements, the lowest Peak Stress Ratios and the shallowest stress bulbs, while the square-footing representation showed only modest differences relative to the circular case. The strip-footing representation consistently developed the largest settlements and deepest stress influence zones under the adopted plane-strain conditions.
- Although footing representation influenced the absolute numerical response, soil stiffness had a strong influence on settlement magnitude. Soft clay showed the greatest settlement reductions with increasing embedment, whereas dense sand exhibited comparatively smaller reductions because of its higher initial stiffness. The influence of embedment on settlement therefore varied with the compressibility of the supporting soil.
- The clay results represent an idealized drained end-of-consolidation state and do not cover short-term undrained behavior or the consolidation process. In addition, the square footing was represented by an equal-area axisymmetric idealization, which cannot reproduce the three-dimensional edge and corner effects of an actual square footing.
- The depth-adjusted effective soil modulus was introduced to incorporate the influence of embedment into the Relative Stiffness Factor calculation. The formulation provides a basis for examining whether the conventional rigidity classification can be adapted to embedded shallow foundations by considering changes in operative soil stiffness associated with confinement.
- The proposed methodology provides a comparative framework for the preliminary assessment of embedded shallow foundations by integrating settlement behaviour, contact stress distribution, stress bulb development and foundation rigidity within a unified numerical approach. The findings are consistent with the serviceability principles adopted in international standards [5,6] and provide a basis for examining the effects of footing representation and embedment within the investigated range of soil conditions.
Overall, the results highlight the coupled influence of embedment, soil stiffness and footing representation on the numerical response of embedded shallow foundations. The proposed depth-adjusted Relative Stiffness framework provides a basis for incorporating embedment into the assessment of footing–soil relative stiffness, while its empirical nature and the limitations of the adopted two-dimensional representations should be recognised. Further experimental, field and three-dimensional investigations are required to assess the broader applicability of the proposed approach.
Supplementary Materials
The following supporting information can be downloaded at: https://www.mdpi.com/article/10.3390/infrastructures11100361/s1, Supplementary Materials S1 provides the numerical verification details, including the Boussinesq comparison and additional analytical verification cases. Supplementary Materials S2 provides the derivation of the depth-adjustment coefficient α, including the regression dataset, statistical analysis, and sensitivity assessment.
Author Contributions
Conceptualization, A.I.M. and M.N.J.; methodology, A.I.M., M.N.J. and Q.N.A.-S.; software, A.I.M. and M.N.J.; validation, A.I.M., M.N.J. and L.F.A.B.; investigation, A.I.M., M.N.J. and Q.N.A.-S.; resources, A.D., L.J.A.P. and L.F.A.B.; data curation, A.I.M., M.N.J., Q.N.A.-S. and L.F.A.B.; writing—original draft preparation, A.I.M., M.N.J., Q.N.A.-S., A.D., L.J.A.P. and L.F.A.B.; writing—review and editing, A.I.M., M.N.J., Q.N.A.-S., A.D., L.J.A.P. and L.F.A.B.; supervision, A.D. and L.F.A.B.; project administration, A.D. and A.I.M. All authors have read and agreed to the published version of the manuscript.
Funding
This research received no external funding.
Institutional Review Board Statement
Not applicable.
Informed Consent Statement
Not applicable.
Data Availability Statement
The data supporting the findings of this study are available within the article and the accompanying Supplementary Materials S1 and S2.
Conflicts of Interest
The authors declare no conflicts of interest.
References
- Das, B.M.; Sivakugan, N. Principles of Foundation Engineering, 9th ed.; Cengage Learning: Boston, MA, USA, 2019. [Google Scholar]
- Hakro, M.R.; Kumar, A.; Ali, M.; Habib, A.F.; de Azevedo, A.R.G.; Fediuk, R.; Sabri, M.M.S.; Salmi, A.; Awad, Y.A. Numerical analysis of shallow foundations with varying loading and soil conditions. Buildings 2022, 12, 693. [Google Scholar] [CrossRef] [Scilit]
- Dasho, D.K.; Aga, B.B. Comprehensive characterization of soils with analytical and numerical simulation for bearing capacity and settlement requirements of the footing. Adv. Mater. Sci. Eng. 2023, 2023, 2290515. [Google Scholar] [CrossRef] [Scilit]
- Terzaghi, K.; Peck, R.B. Soil Mechanics in Engineering Practice, 2nd ed.; John Wiley & Sons: New York, NY, USA, 1967. [Google Scholar]
- EN 1997-1:2024; Eurocode 7: Geotechnical Design—Part 1: General Rules. European Committee for Standardization (CEN): Brussels, Belgium, 2024.
- AASHTO. LRFD Bridge Design Specifications, 10th ed.; American Association of State Highway and Transportation Officials: Washington, DC, USA, 2024. [Google Scholar]
- Hemeda, S. PLAXIS 3D numerical analysis of complex geotechnical problems of colossal built heritage. Herit. Sci. 2024, 12, 32. [Google Scholar] [CrossRef] [Scilit]
- Yamin, M.M.; Ashteyat, A.M.; Al-Mohd, I.; Mahmoud, E. Numerical study of contact stresses under foundations resting on cohesionless soil: Effects of foundation rigidity and applied stress level. KSCE J. Civ. Eng. 2017, 21, 1107–1114. [Google Scholar] [CrossRef] [Scilit]
- Raja, R.A.; Sakleshpur, V.A.; Prezzi, M.; Salgado, R. Effect of footing geometry and embedment on the bearing capacity and collapse mechanism of shallow foundations in sand. J. Geotech. Geoenviron. Eng. 2024, 150, 04024042. [Google Scholar] [CrossRef] [Scilit]
- Pantelidis, L.; Assefa, E.A.; Sachpazis, C.I. The effect of footing shape on the bearing capacity of shallow foundations: A review. Arch. Comput. Methods Eng. 2025, 32, 1597–1617. [Google Scholar] [CrossRef] [Scilit]
- Khezri, A.; Moradi, M.; Mir Mohammad Hosseini, S.M.; Park, H.; Lee, D. Effect of footing shape on the rocking behavior of shallow foundations. Buildings 2024, 14, 573. [Google Scholar] [CrossRef] [Scilit]
- Pantelidis, L. Bearing capacity of shallow foundations: A focus on the depth factors in combination with the respective N-factors. Arab. J. Geosci. 2024, 17, 169. [Google Scholar] [CrossRef] [Scilit]
- Moradi, M.; Khezri, A.; Mir Mohammad Hosseini, S.M.; Park, H.; Lee, D. Experimental investigation of embedment depth effects on the rocking behavior of foundations. Geosciences 2024, 14, 351. [Google Scholar] [CrossRef] [Scilit]
- Fioravante, V.; Giretti, D.; Masella, A.; Vaciago, G. Settlement prediction of shallow foundations for quality controls of sandy hydraulic fills. Soils Found. 2024, 64, 101408. [Google Scholar] [CrossRef] [Scilit]
- Jahanger, Z.K.; Antony, S.J.; Hirani, A. Foundation relative stiffness effects in sand under static loading. AIP Conf. Proc. 2020, 2213, 020002. [Google Scholar] [CrossRef] [Scilit]
- Tabsh, S.W.; Elemam, M. Development of relative rigidity measure for shallow foundations. Int. J. Civ. Infrastruct. 2023, 5, 17–26. [Google Scholar] [CrossRef] [Scilit]
- Pakos, W.; Helowicz, A. Theoretical and numerical modeling of a shallow foundation stiffness based on the theory of elastic half-space. Stud. Geotech. Mech. 2024, 46, 302–314. [Google Scholar] [CrossRef] [Scilit]
- Hejazi, S.A.M.; Feyzpour, A.; Khaje khabaz, M.; Eslami, A.; Fouladgar, M.; Eftekhari, S.A.; Toghraie, D. Numerical investigation of rigidity and flexibility parameters effect on superstructure foundation behavior using three-dimensional finite element method. Case Stud. Constr. Mater. 2023, 18, e01867. [Google Scholar] [CrossRef] [Scilit]
- Zampirolli, N.; Durand Farfán, A.; Maia, P.C.A. Three-dimensional numerical analysis of the effect of foundation stiffness on soil-structure interaction. Soils Rocks 2024, 47, e2024000424. [Google Scholar] [CrossRef] [Scilit]
- Bentley Systems. PLAXIS 2D 2024.1 Reference Manual; Bentley Systems: Delft, The Netherlands, 2024. [Google Scholar]
- Bentley Systems. PLAXIS 2D 2024.1 Material Models Manual; Bentley Systems: Delft, The Netherlands, 2024. [Google Scholar]
- Poulos, H.G.; Davis, E.H. Elastic Solutions for Soil and Rock Mechanics; John Wiley & Sons: New York, NY, USA, 1974. [Google Scholar]
- Terzaghi, K. Theoretical Soil Mechanics; John Wiley & Sons: New York, NY, USA, 1943. [Google Scholar]
- Meyerhof, G.G. Some recent research on the bearing capacity of foundations. Can. Geotech. J. 1963, 1, 16–26. [Google Scholar] [CrossRef] [Scilit]
- Hansen, J.B. A revised and extended formula for bearing capacity. Dan. Geotech. Inst. Bull. 1970, 28, 5–11. [Google Scholar]
- Vesic, A.S. Analysis of ultimate loads of shallow foundations. J. Soil Mech. Found. Div. ASCE 1973, 99, 45–73. [Google Scholar] [CrossRef] [Scilit]
- Shahraki, M.; Tessari, A.; Bolisetti, C.; Kurt, E.; Kim, K. Experimental study on sliding at the soil-structure interface of a shallow foundation. Geotech. Test. J. 2024, 47, 521–538. [Google Scholar] [CrossRef] [Scilit]
- Ma, H.; Hao, X.; Yang, Y.; Li, H.; Yi, L. Study on parameters of modified Mohr–Coulomb model for water-rich soft soil in Tianjin, China. SN Appl. Sci. 2023, 5, 187. [Google Scholar] [CrossRef] [Scilit]
- Tian, D.; Zheng, H. The generalized Mohr–Coulomb failure criterion. Appl. Sci. 2023, 13, 5405. [Google Scholar] [CrossRef] [Scilit]
- Bowles, J.E. Foundation Analysis and Design, 5th ed.; McGraw-Hill: New York, NY, USA, 1996. [Google Scholar]
- Vesic, A.S. Bending of beams resting on isotropic elastic solid. J. Eng. Mech. Div. ASCE 1961, 87, 35–53. [Google Scholar] [CrossRef] [Scilit]
- Brown, P.T. Numerical analyses of uniformly loaded circular rafts on deep elastic foundations. Géotechnique 1969, 19, 399–404. [Google Scholar] [CrossRef] [Scilit]
- Briaud, J.-L.; Gibbens, R.M. Behavior of five large spread footings in sand. J. Geotech. Geoenviron. Eng. 1999, 125, 787–797. [Google Scholar] [CrossRef] [Scilit]
- Çekinmez, Z. Effect of Foundation Rigidity on Contact Stress Distribution in Soils with Variable Strength/Deformation Properties. Master’s Thesis, Middle East Technical University, Ankara, Turkey, 2010. [Google Scholar]
- Fox, E.N. The mean elastic settlement of a uniformly loaded area at a finite depth. In Proceedings of the 2nd International Conference on Soil Mechanics and Foundation Engineering, Rotterdam, The Netherlands, 21–30 June 1948; Volume 1, pp. 129–132. [Google Scholar]
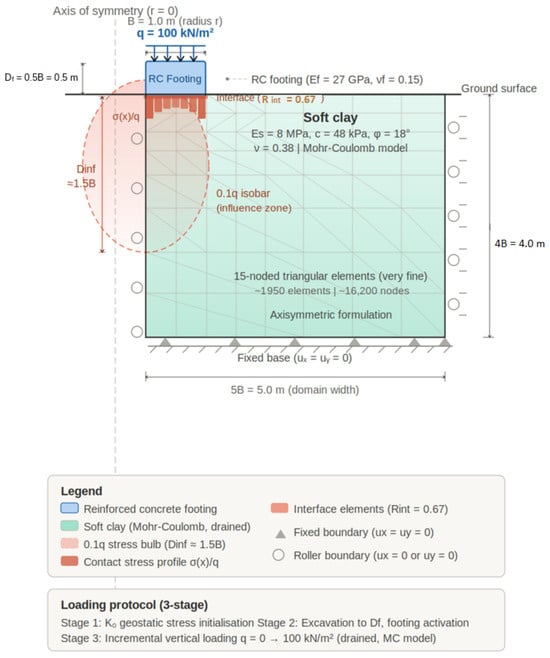
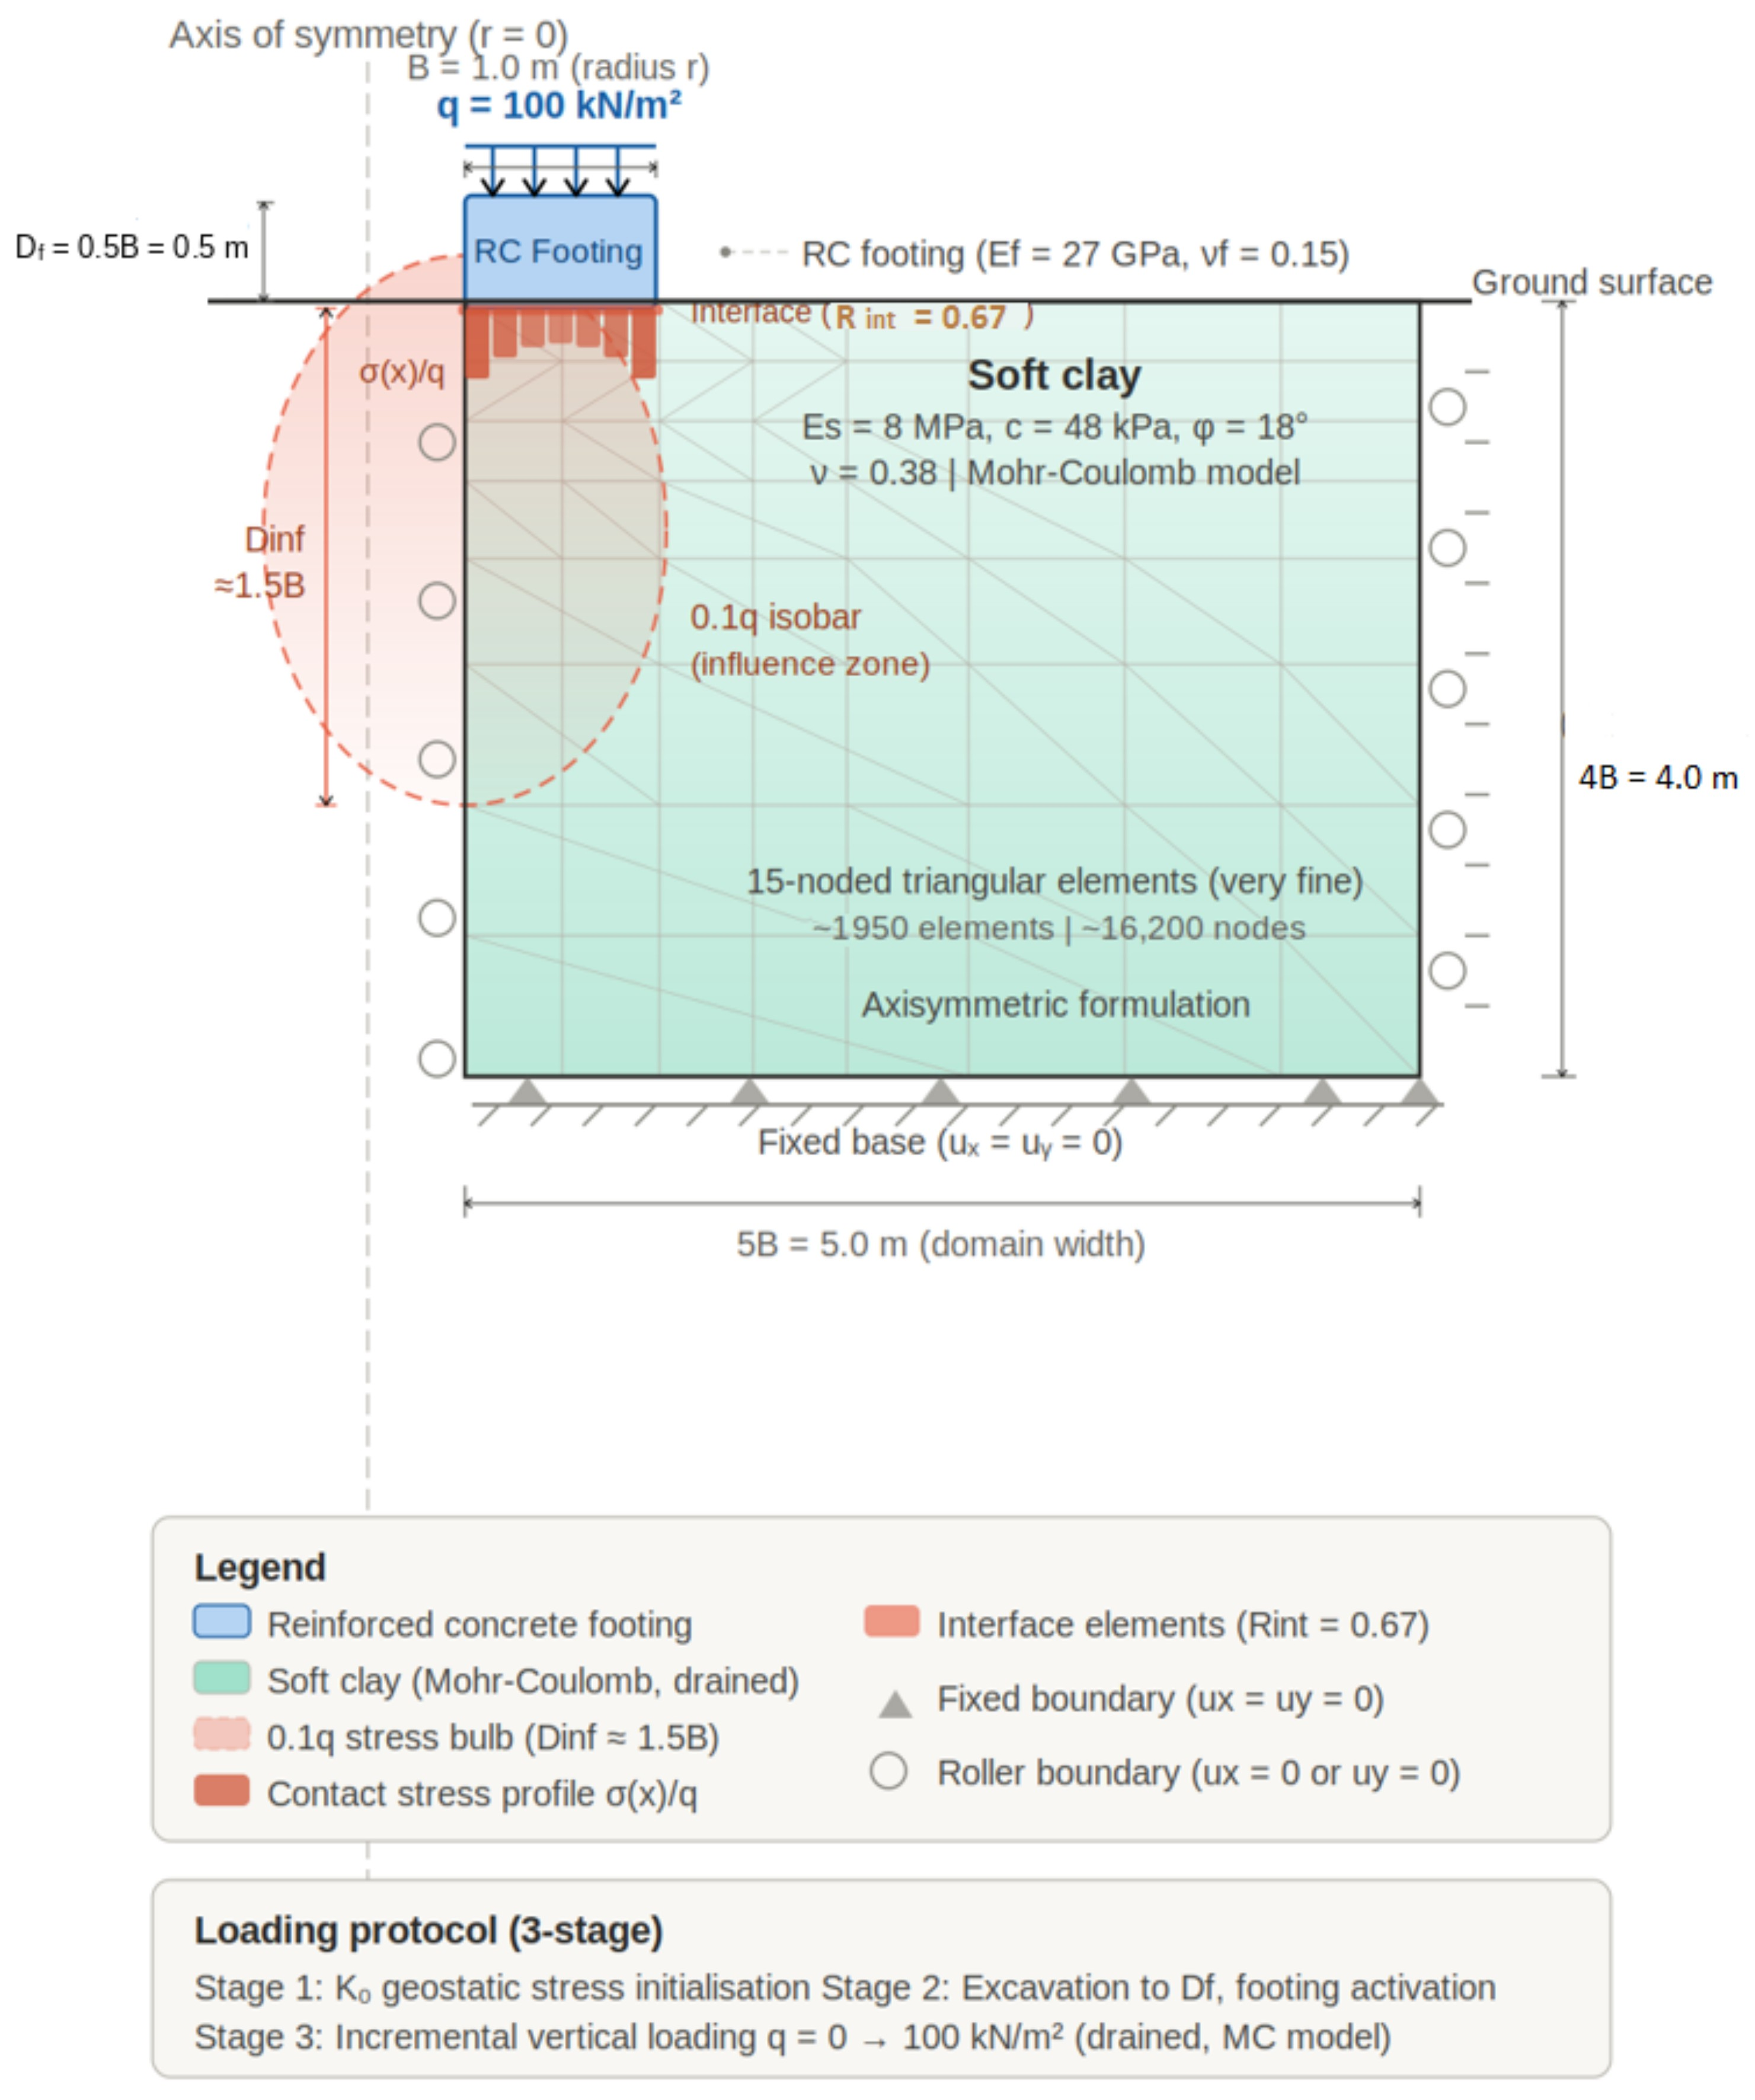
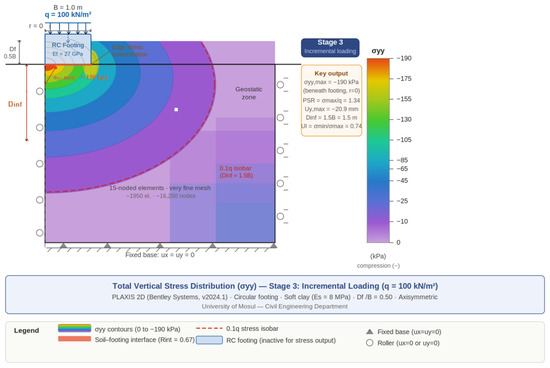
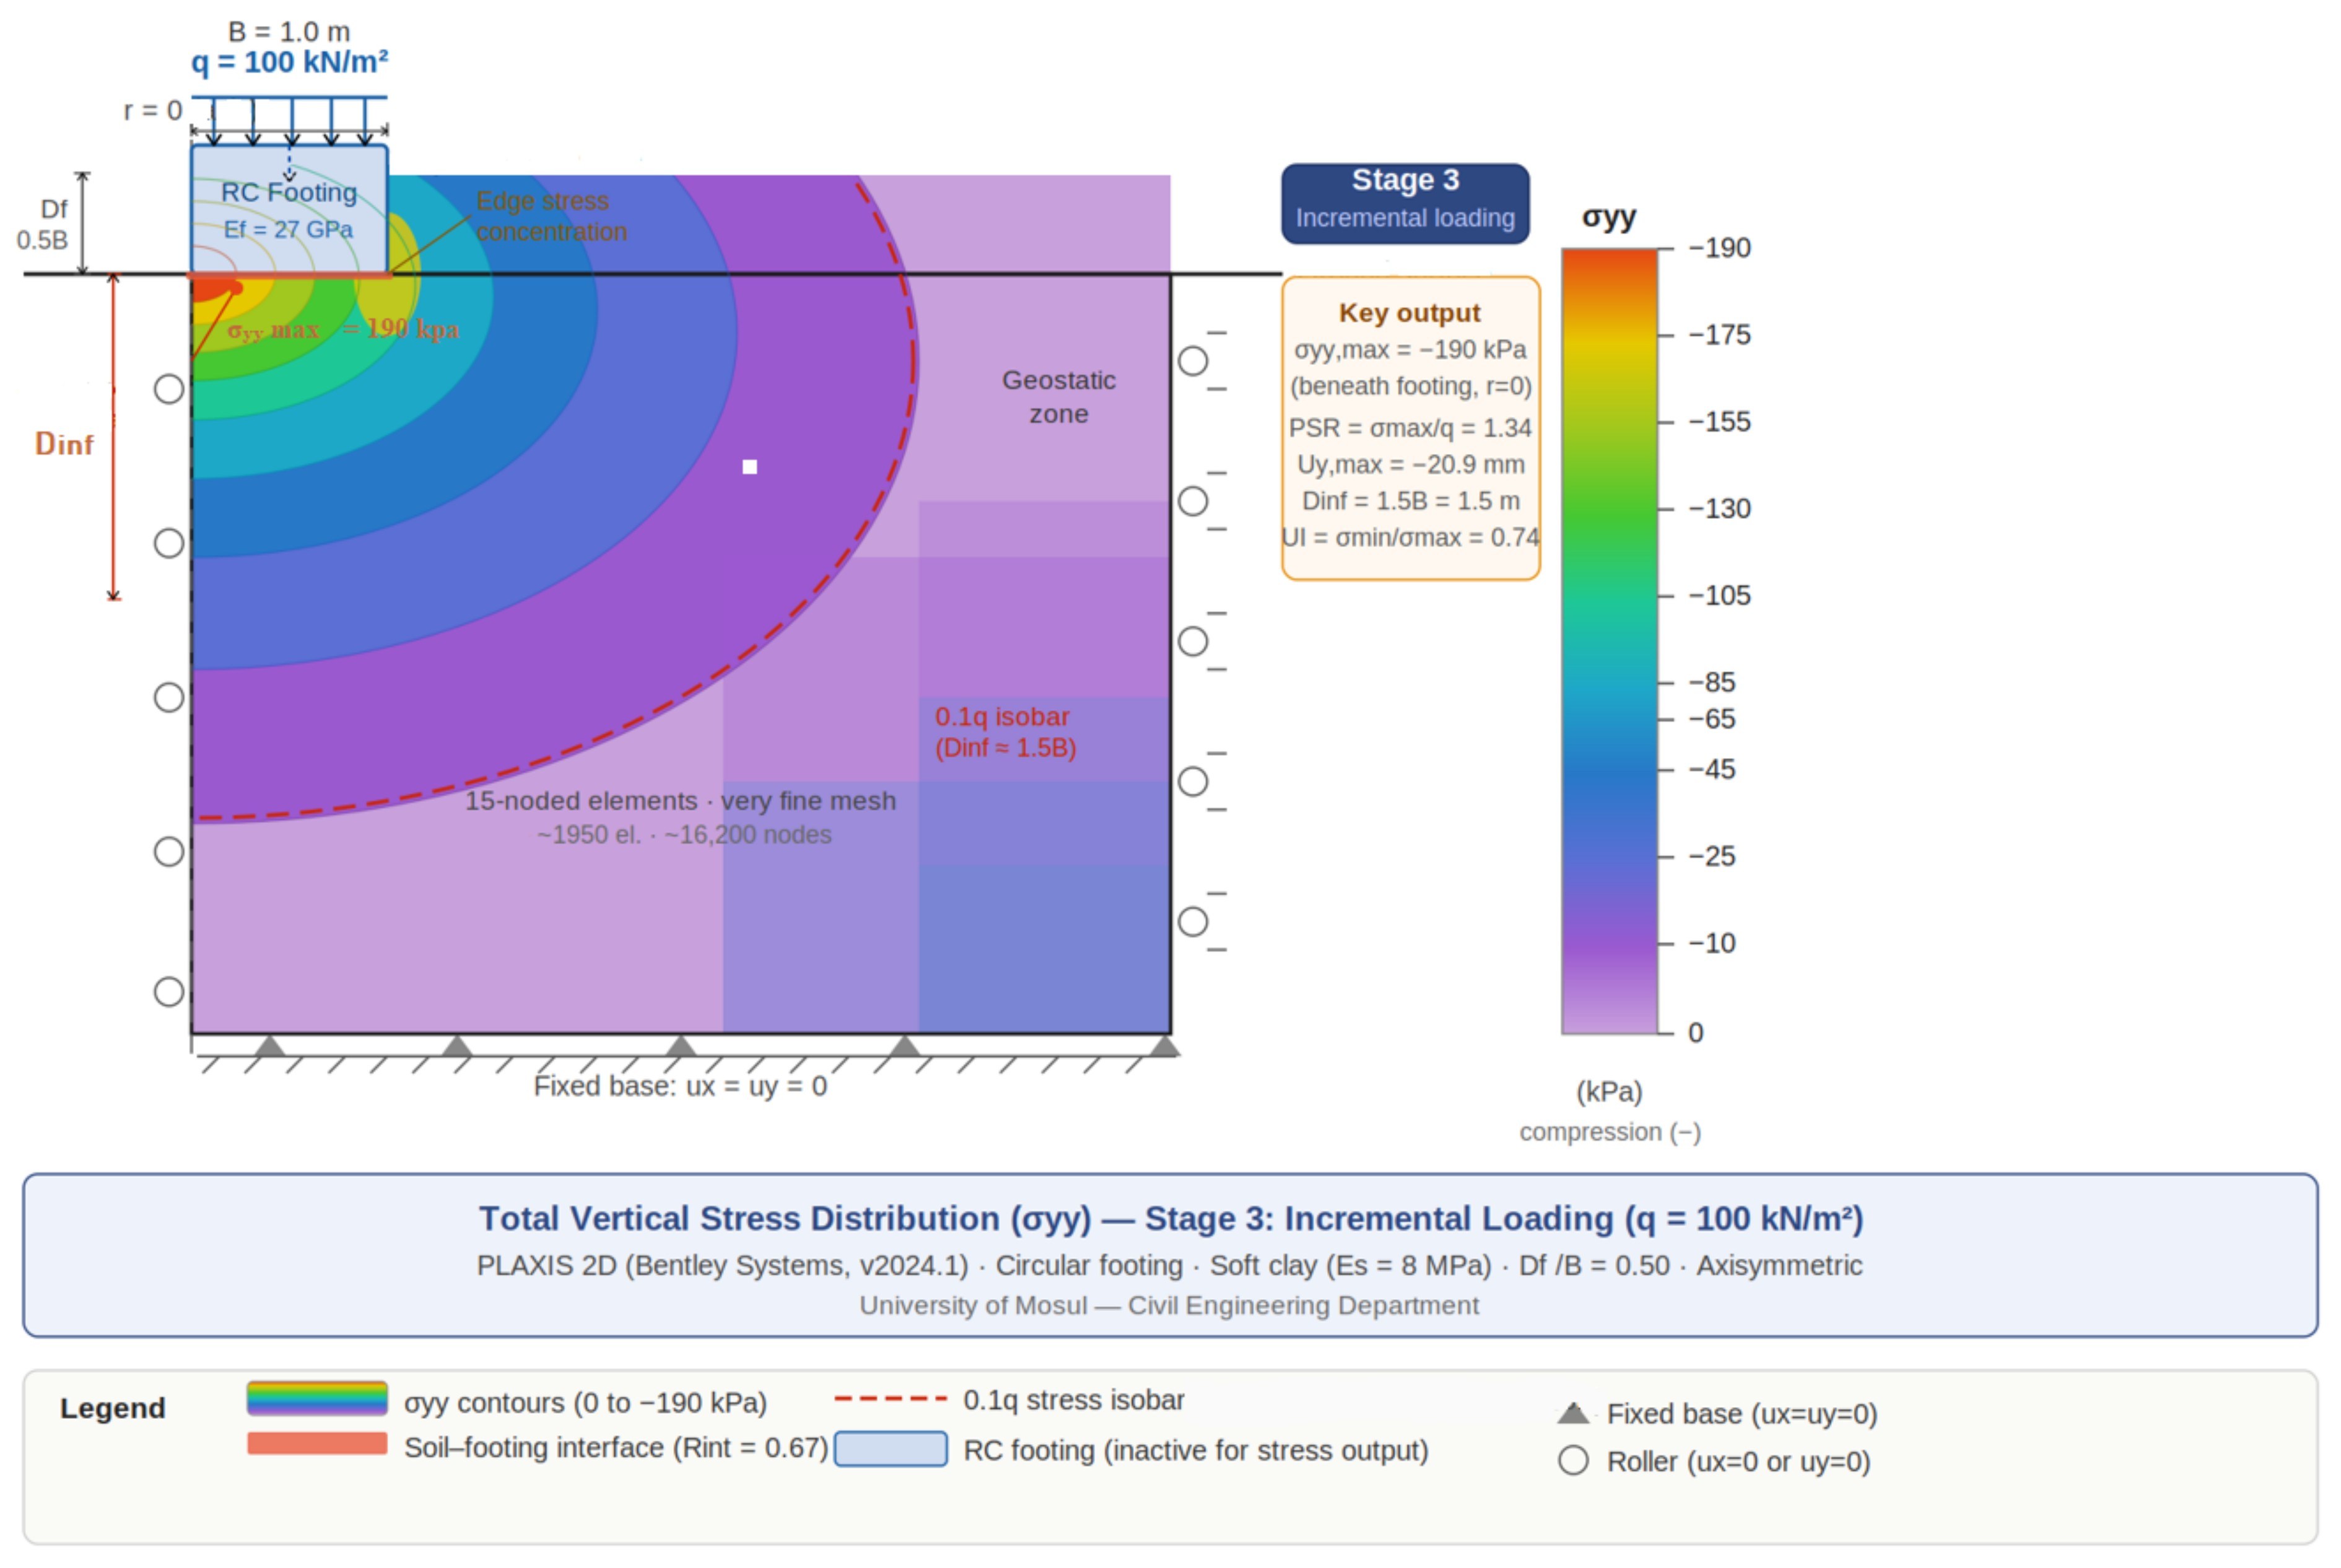
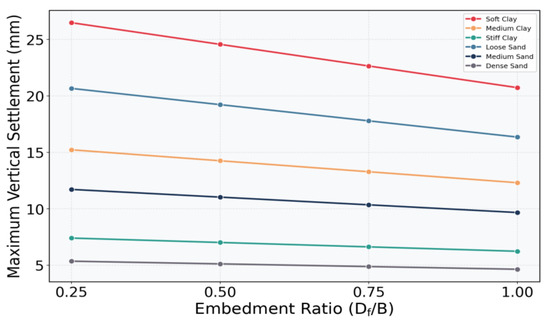
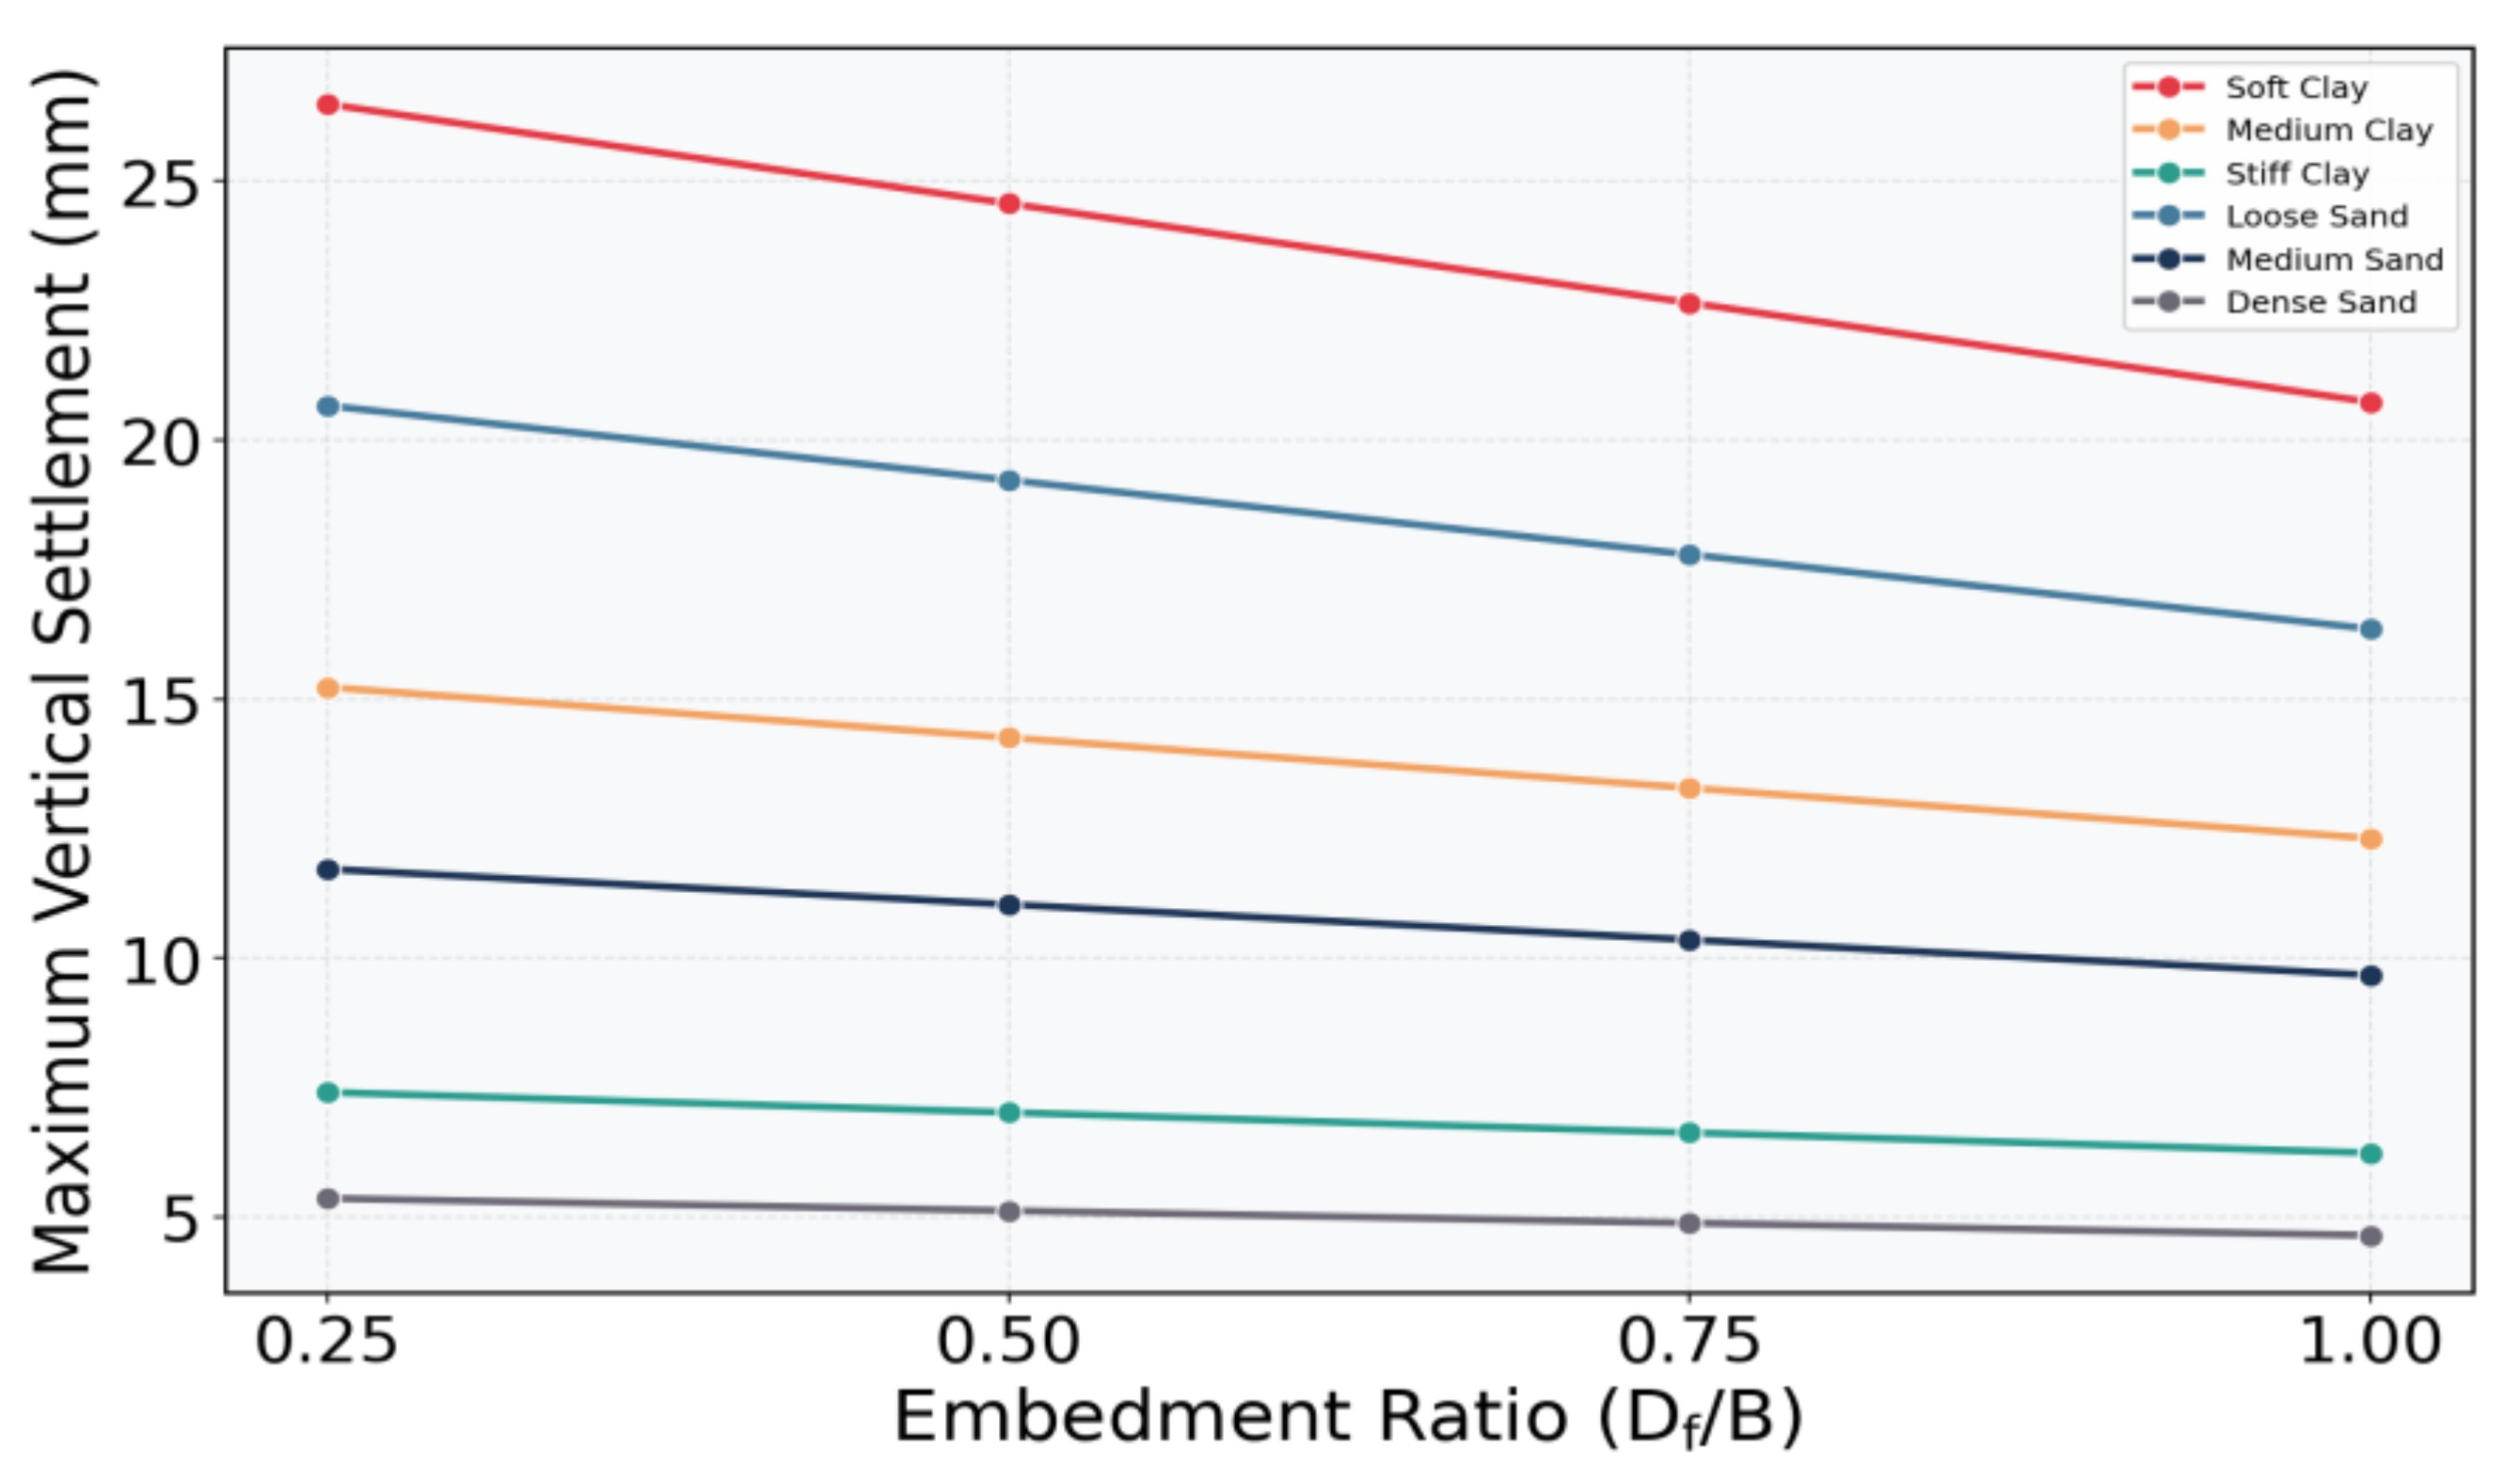
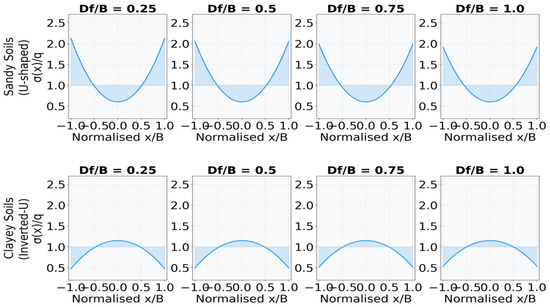
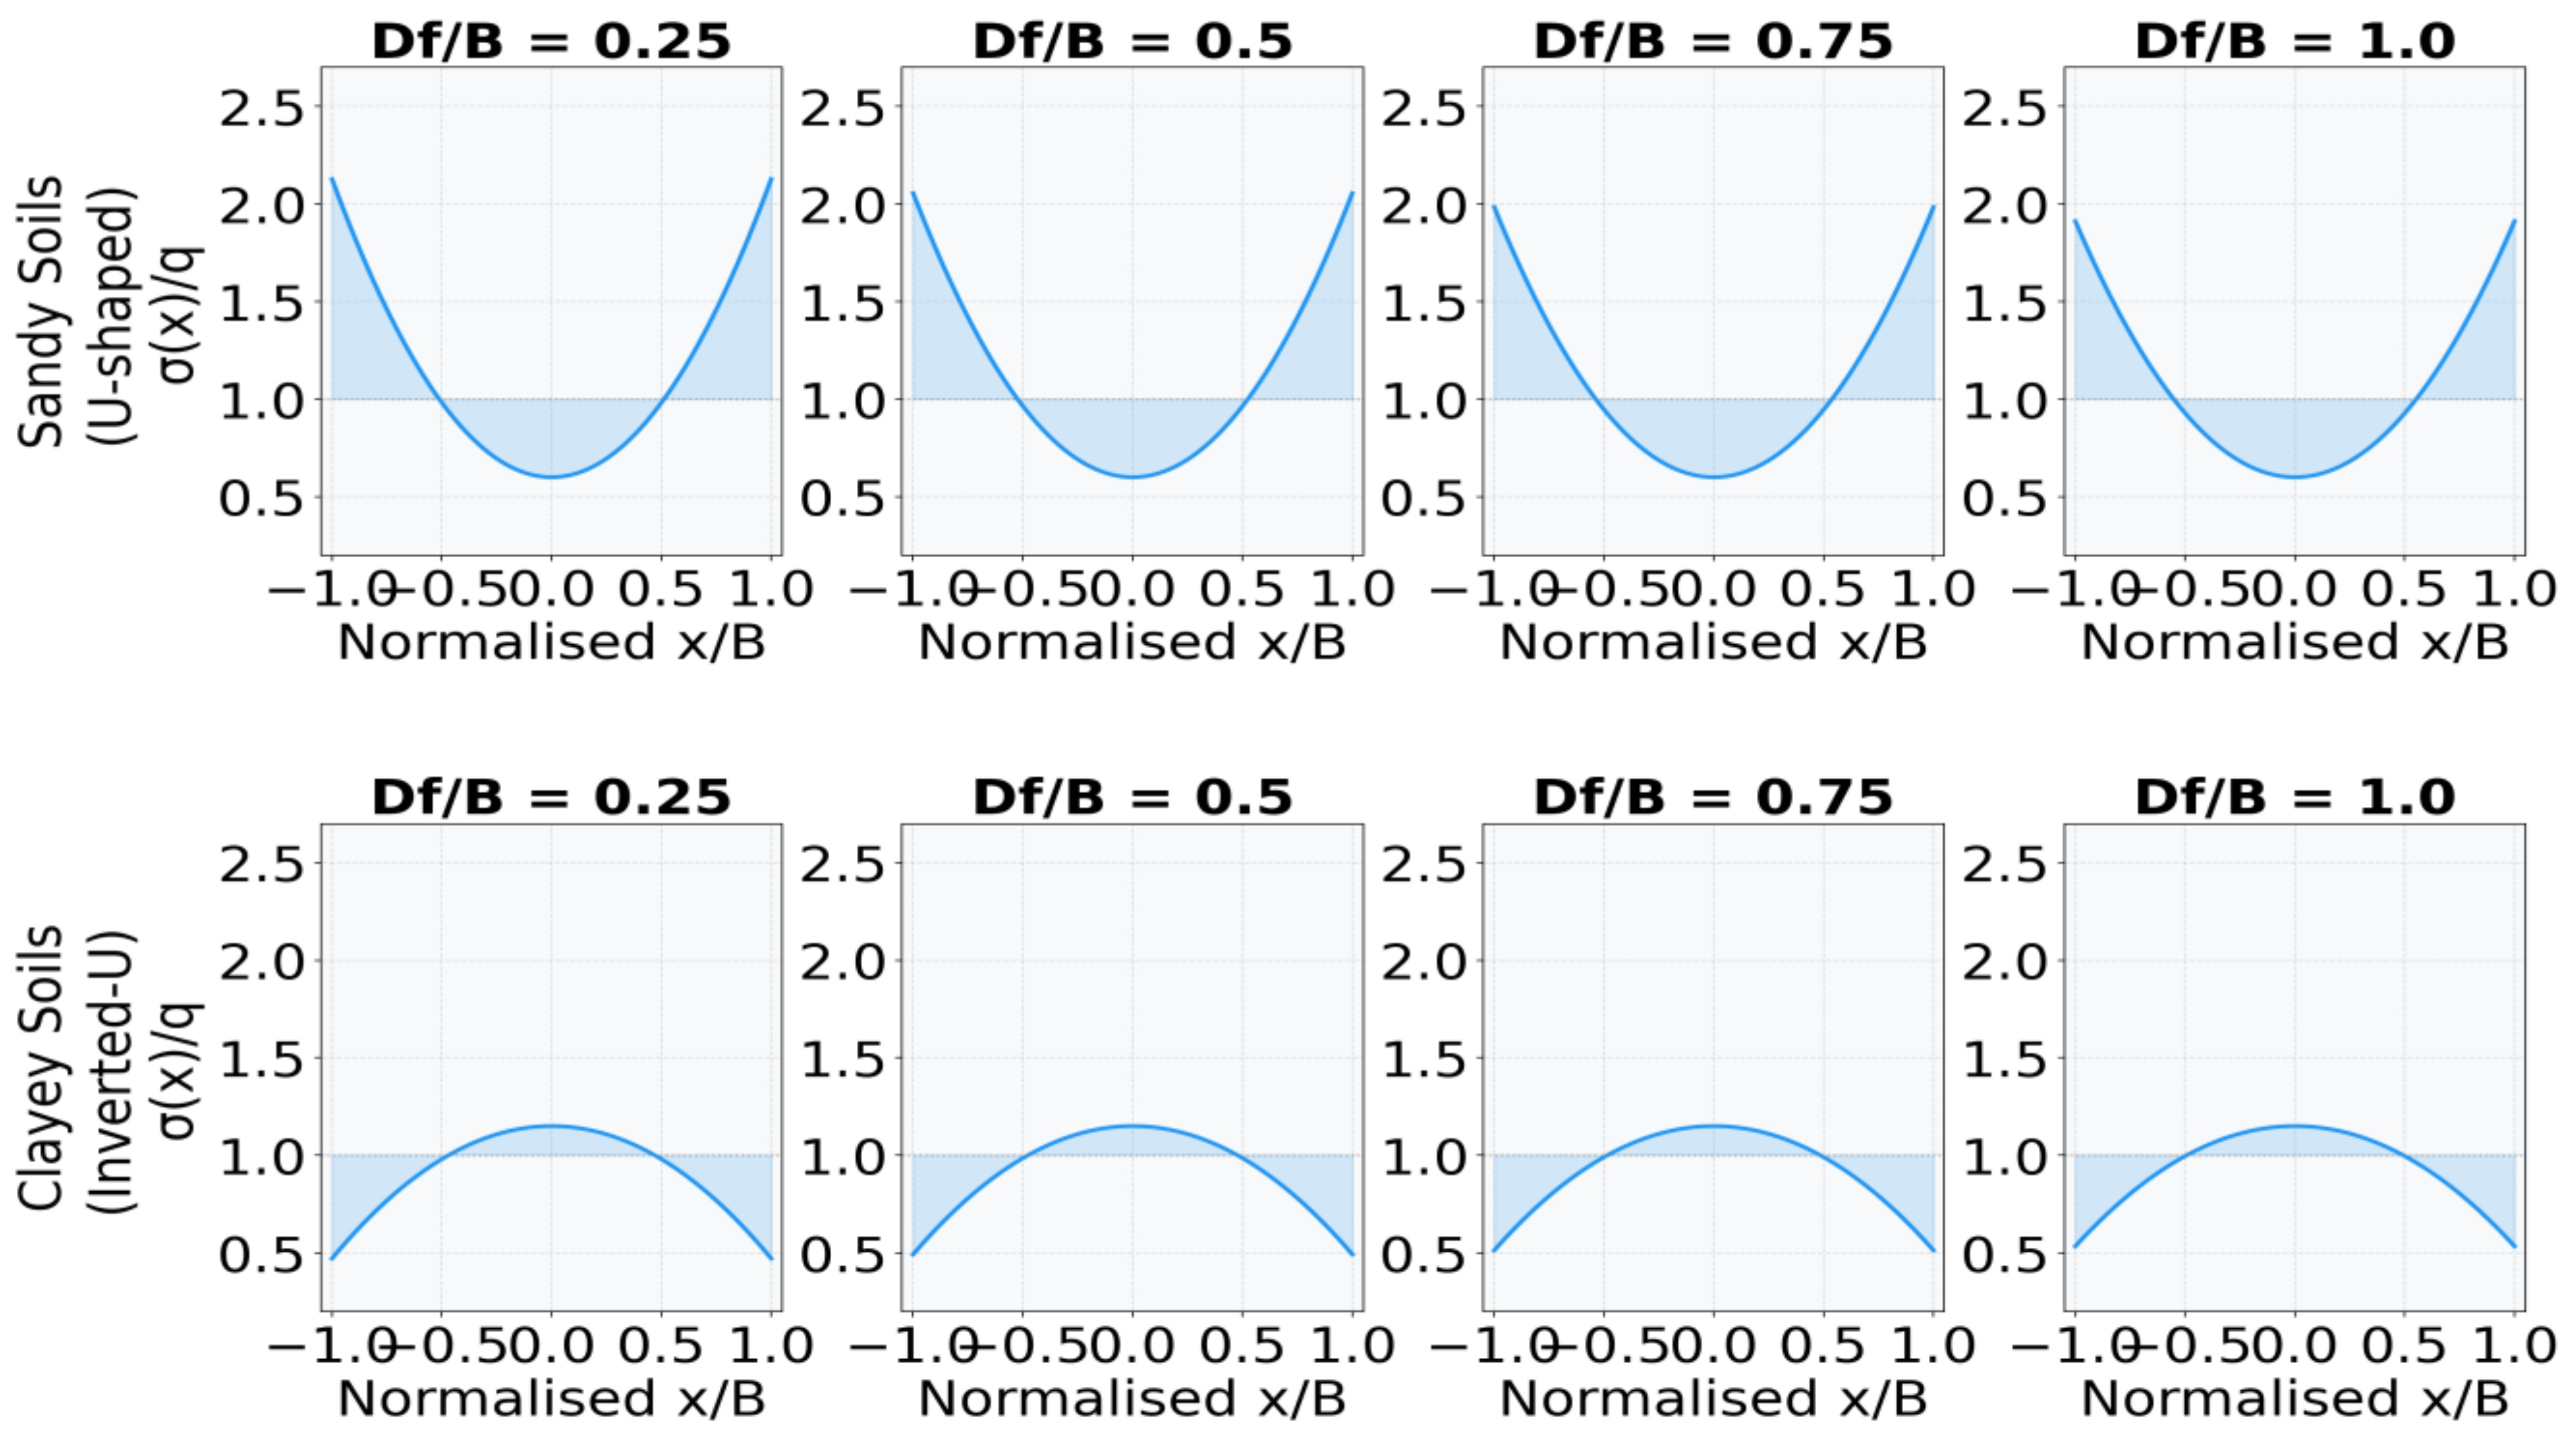
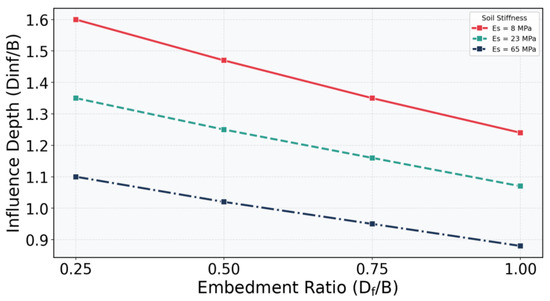
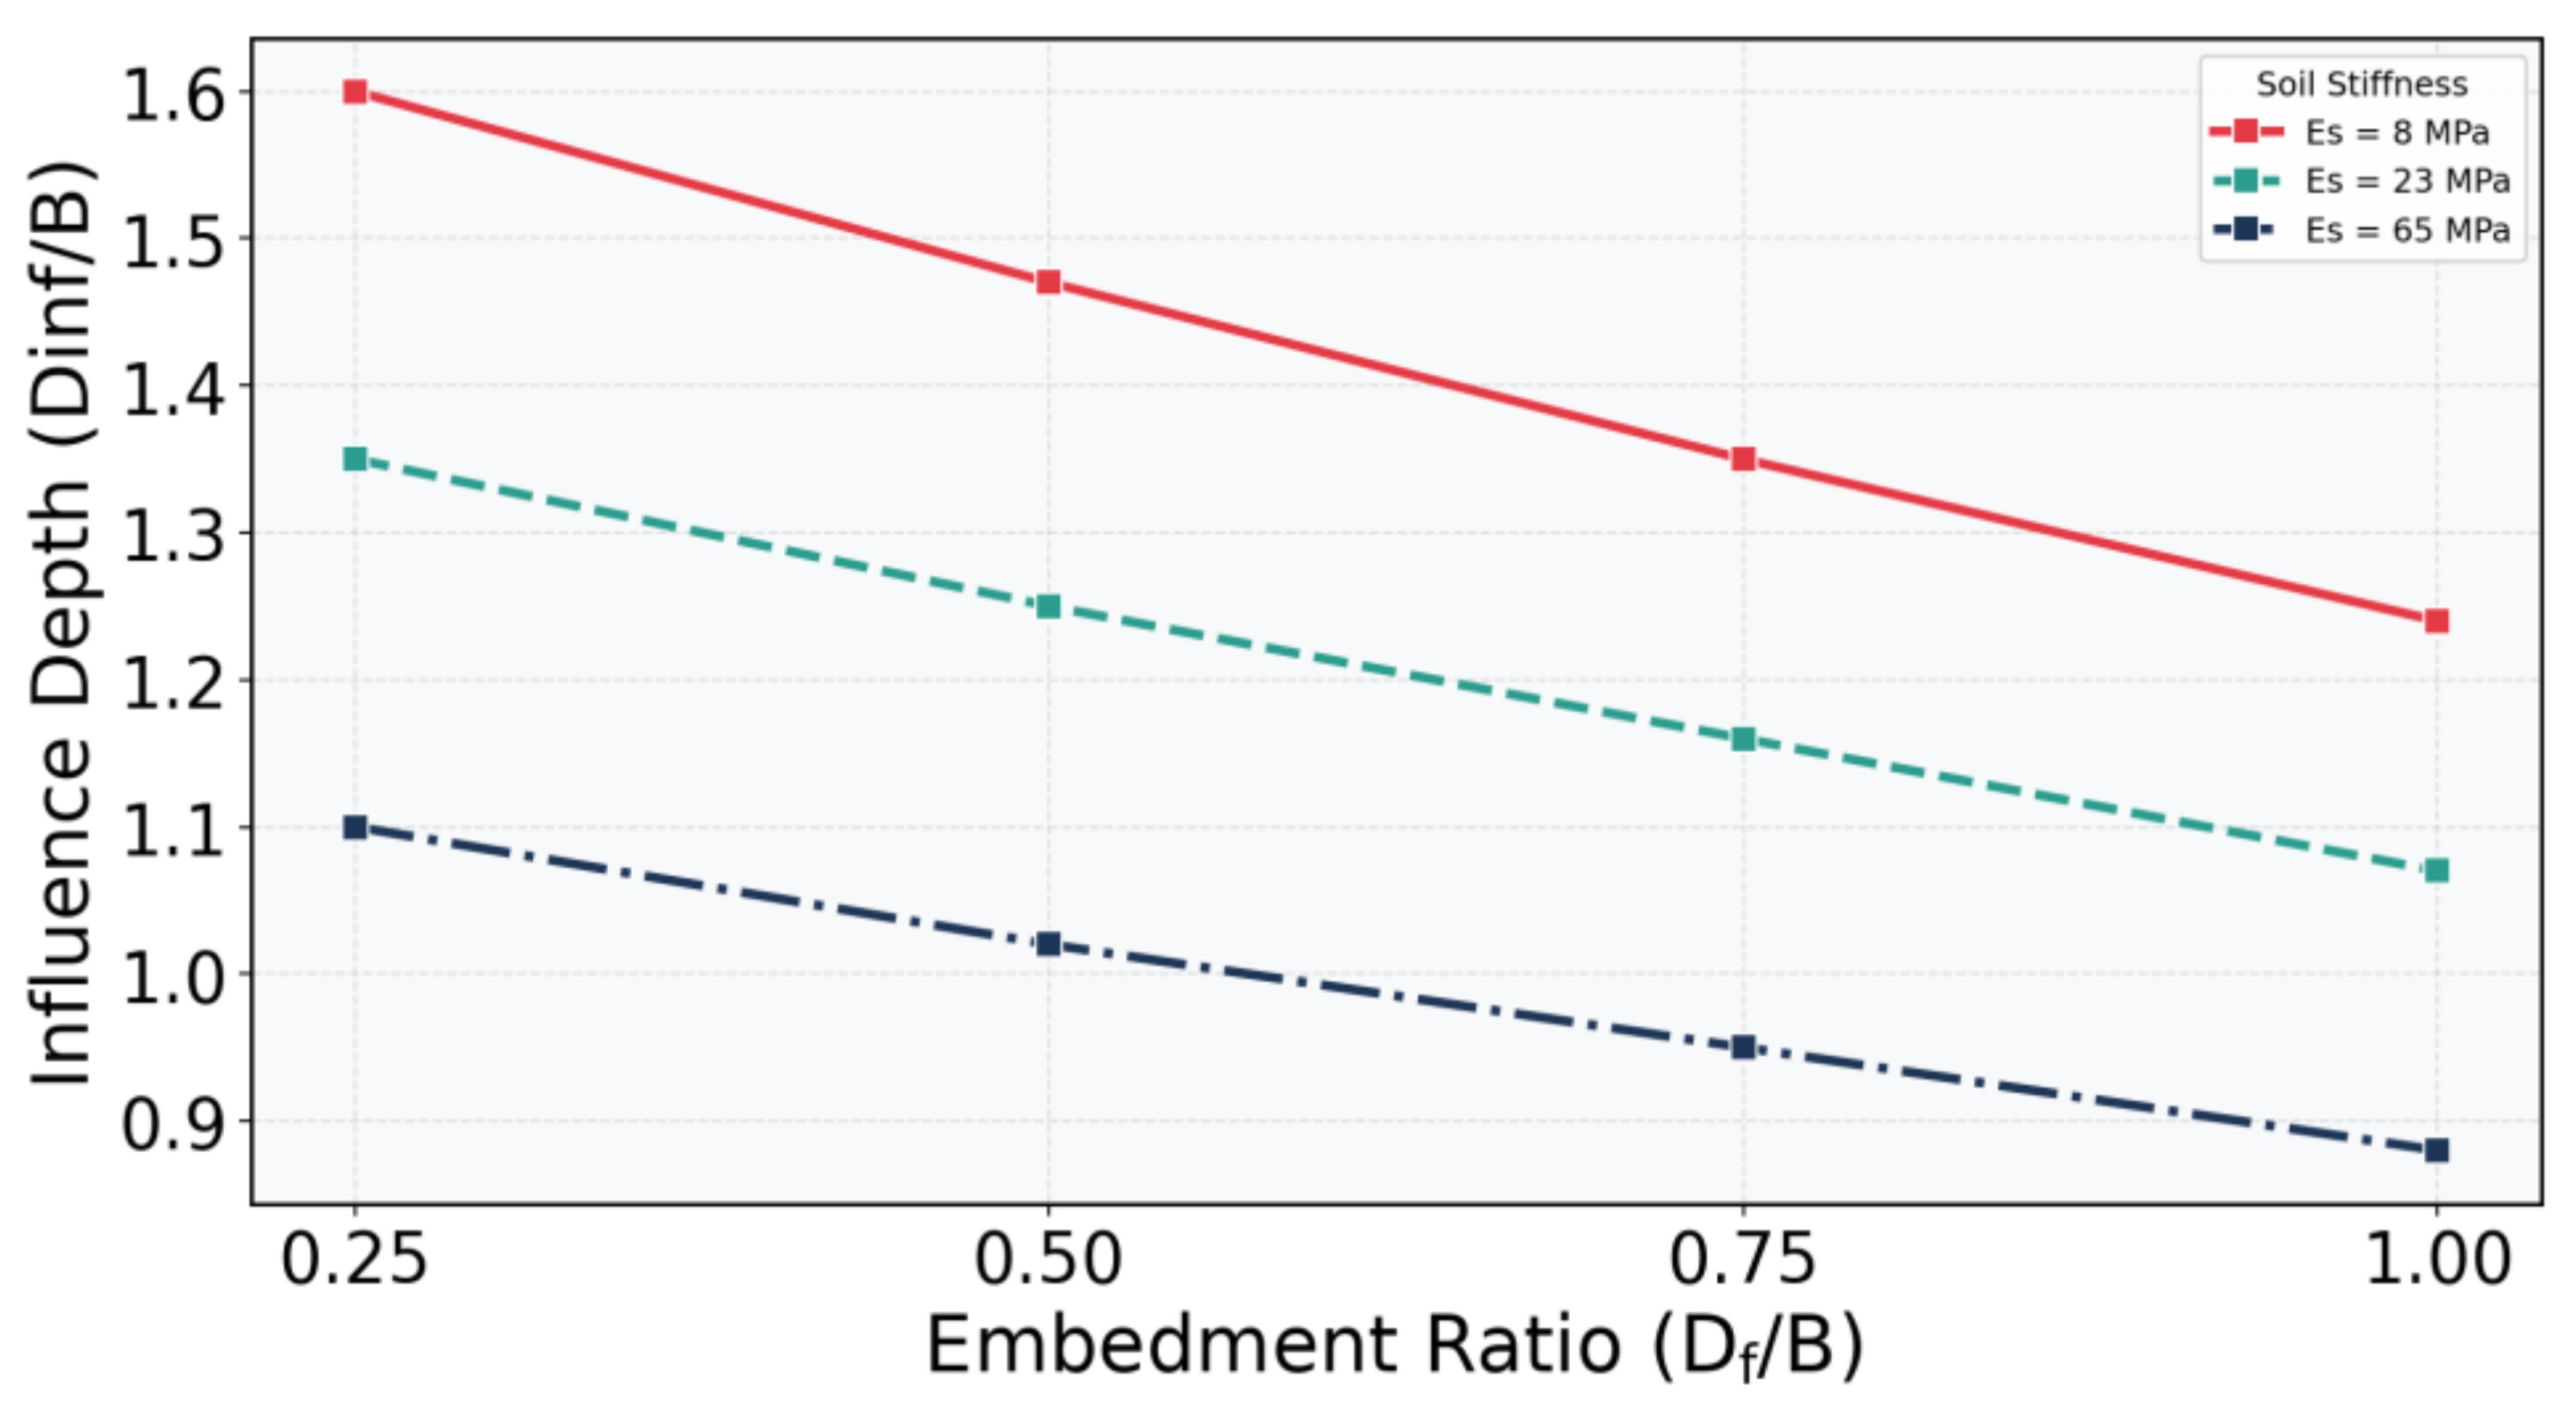
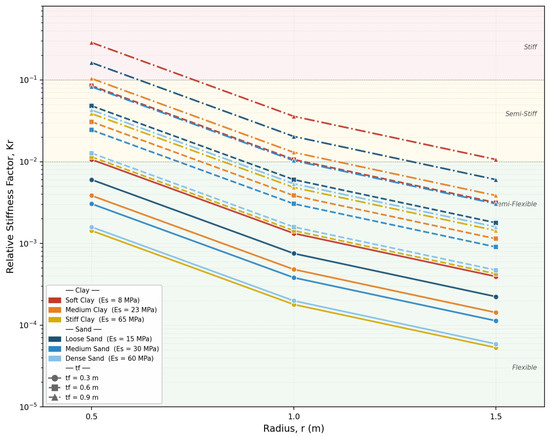
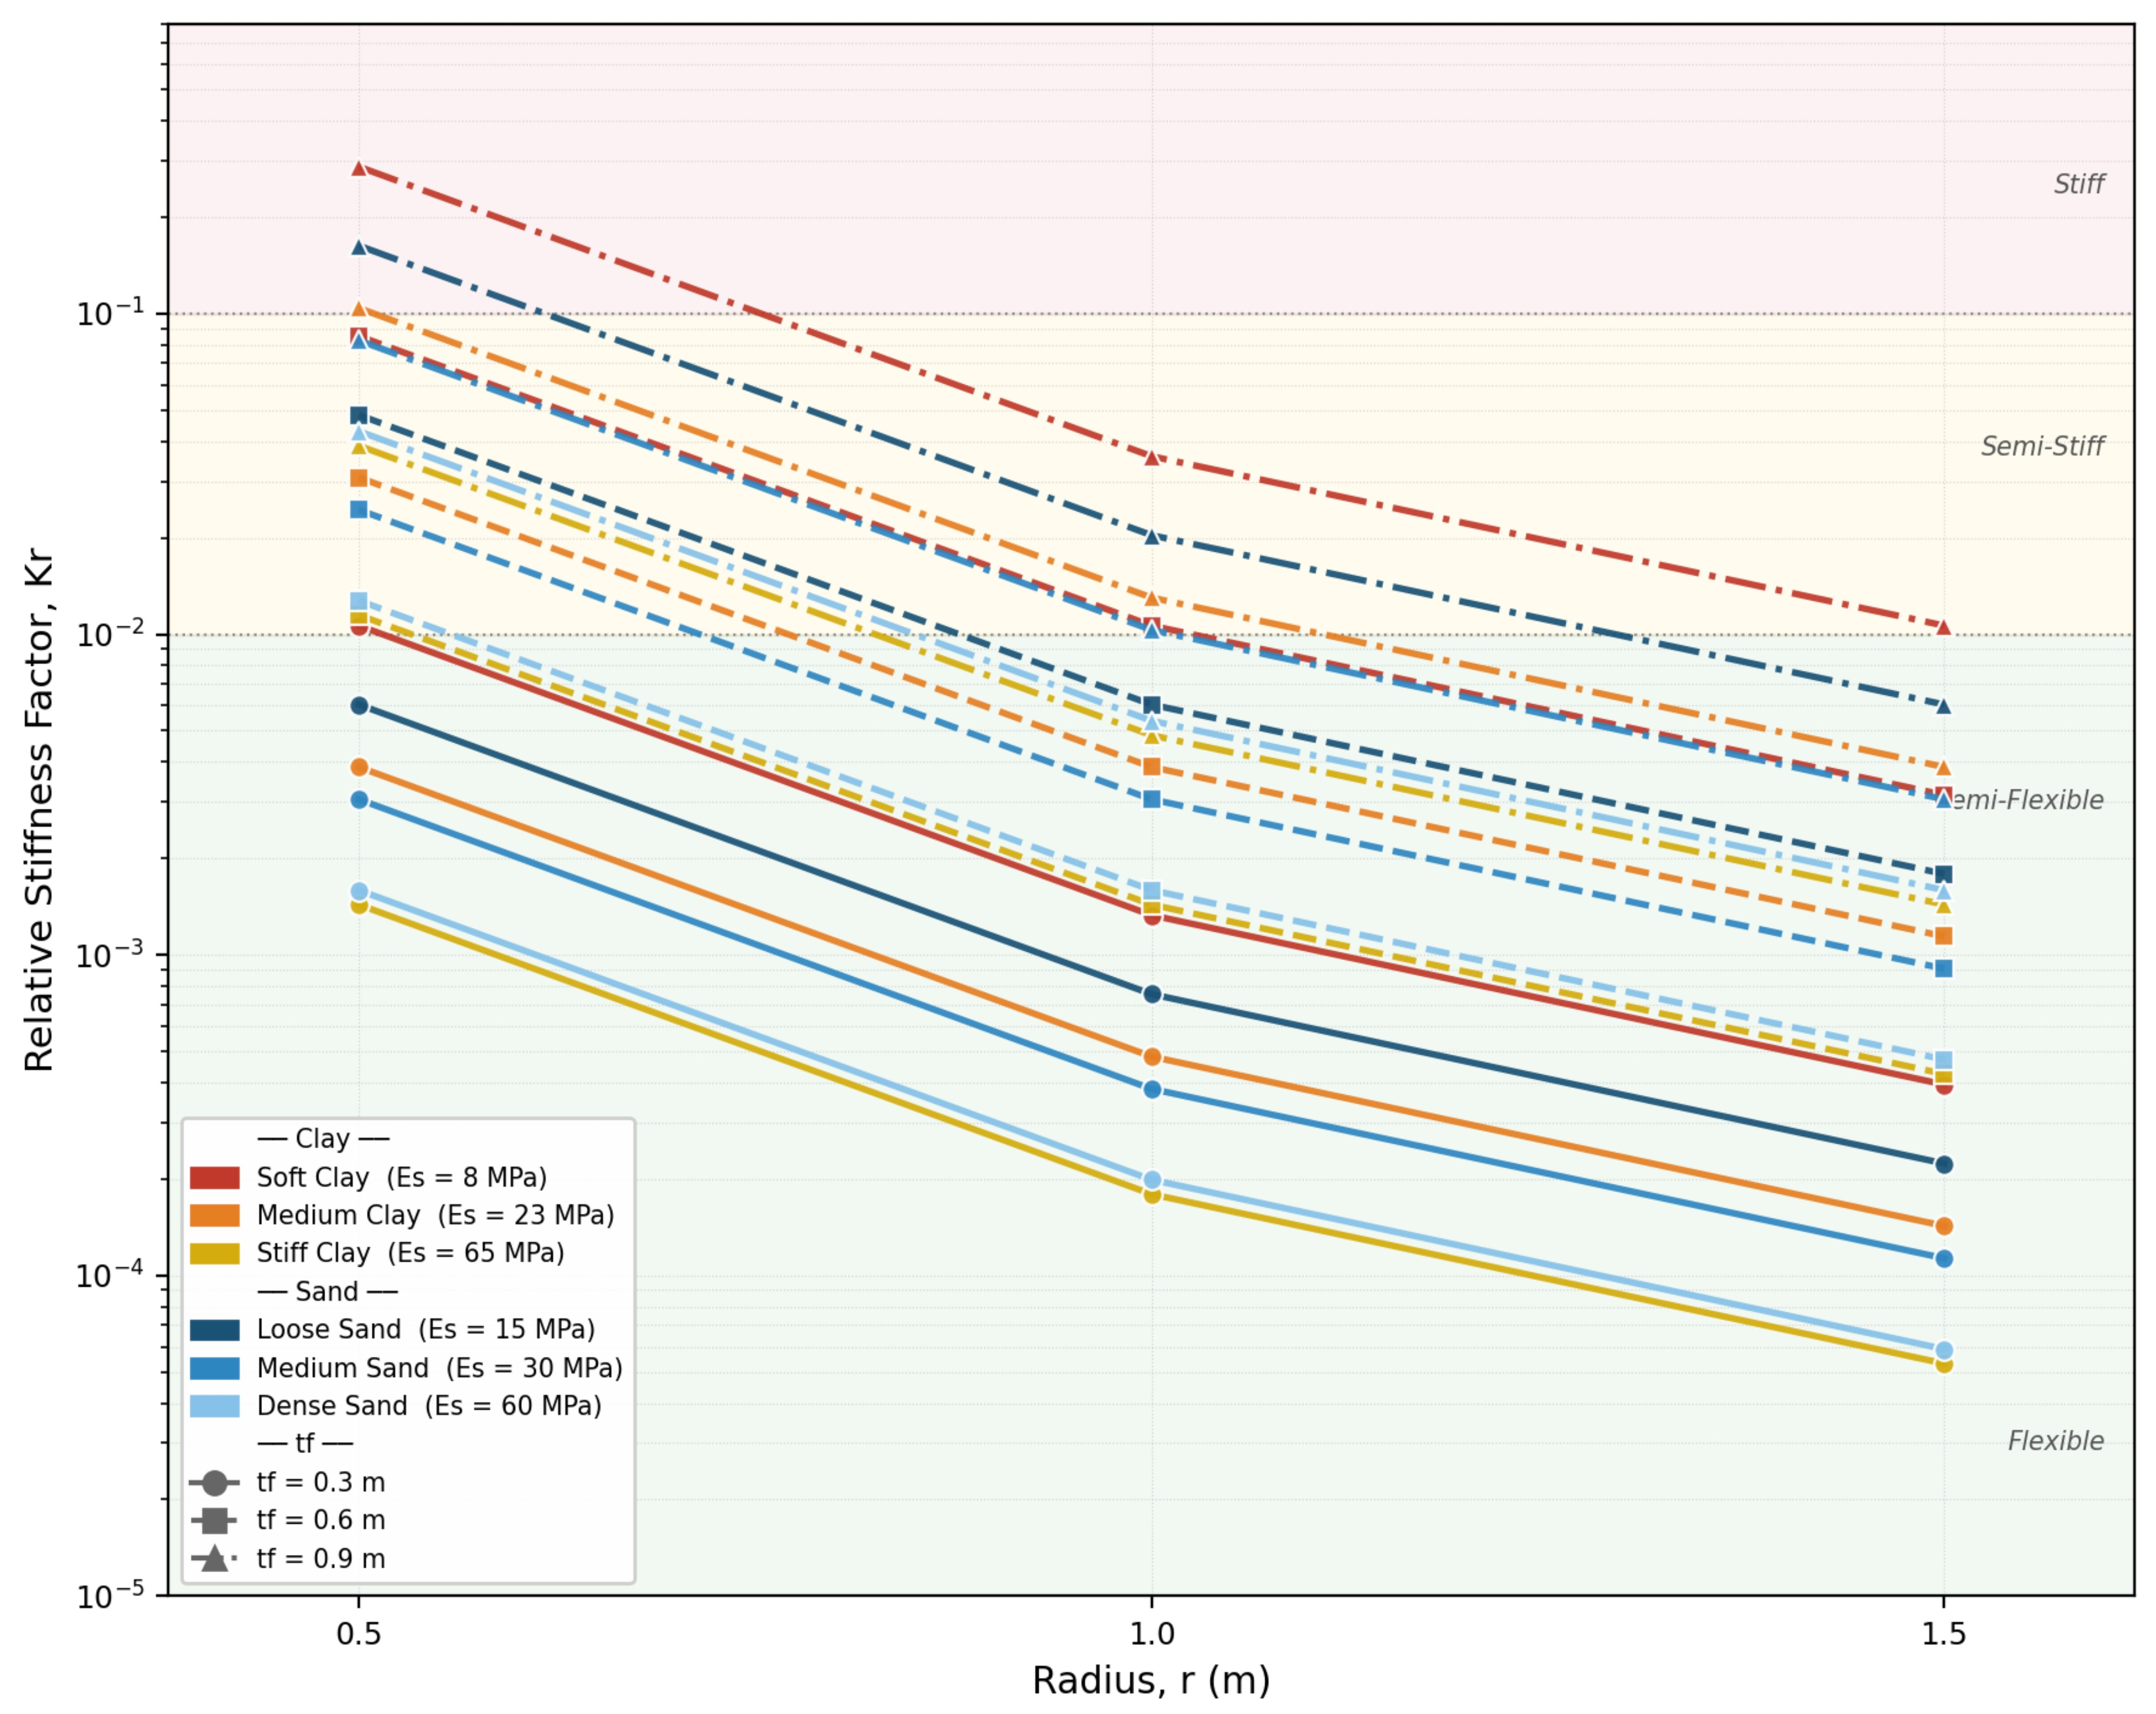
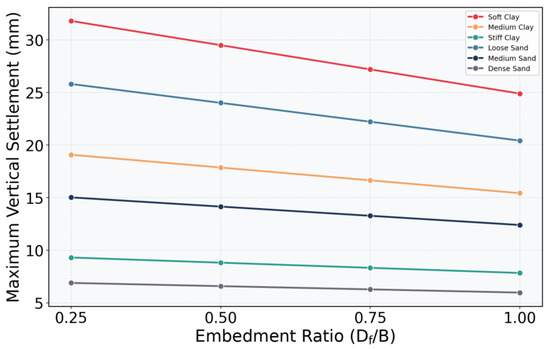
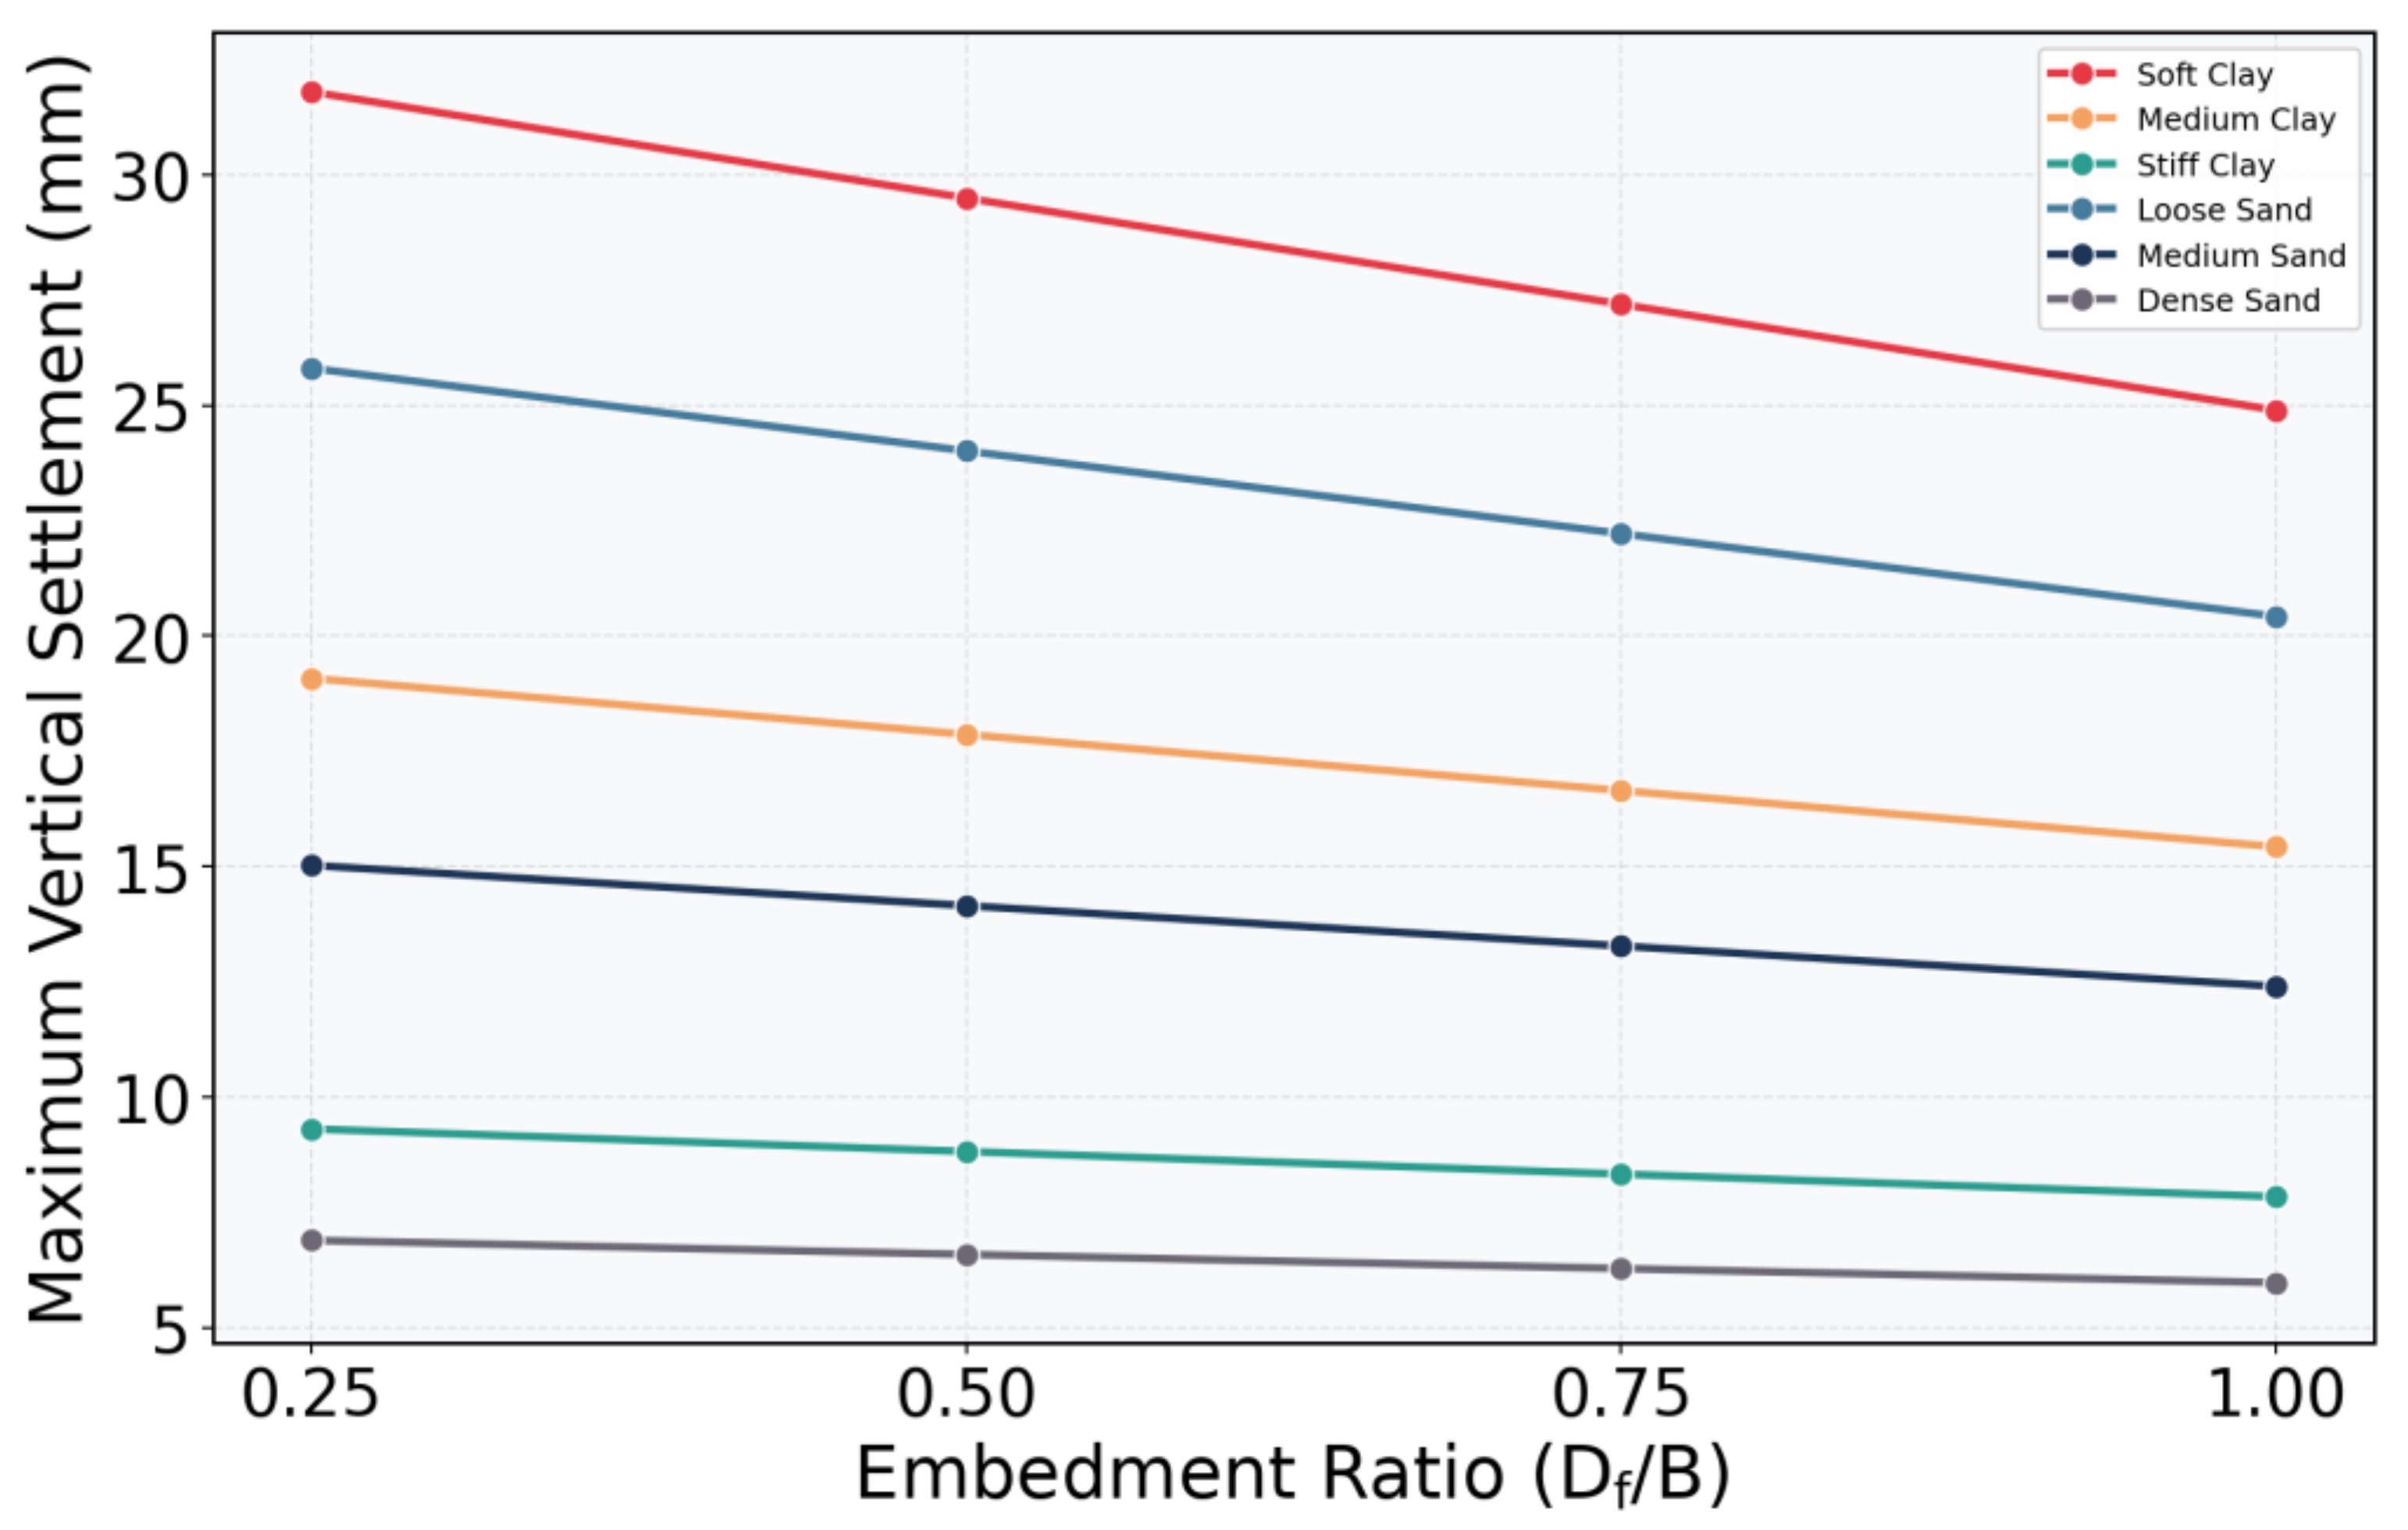
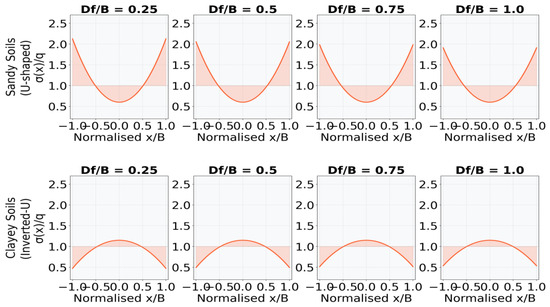
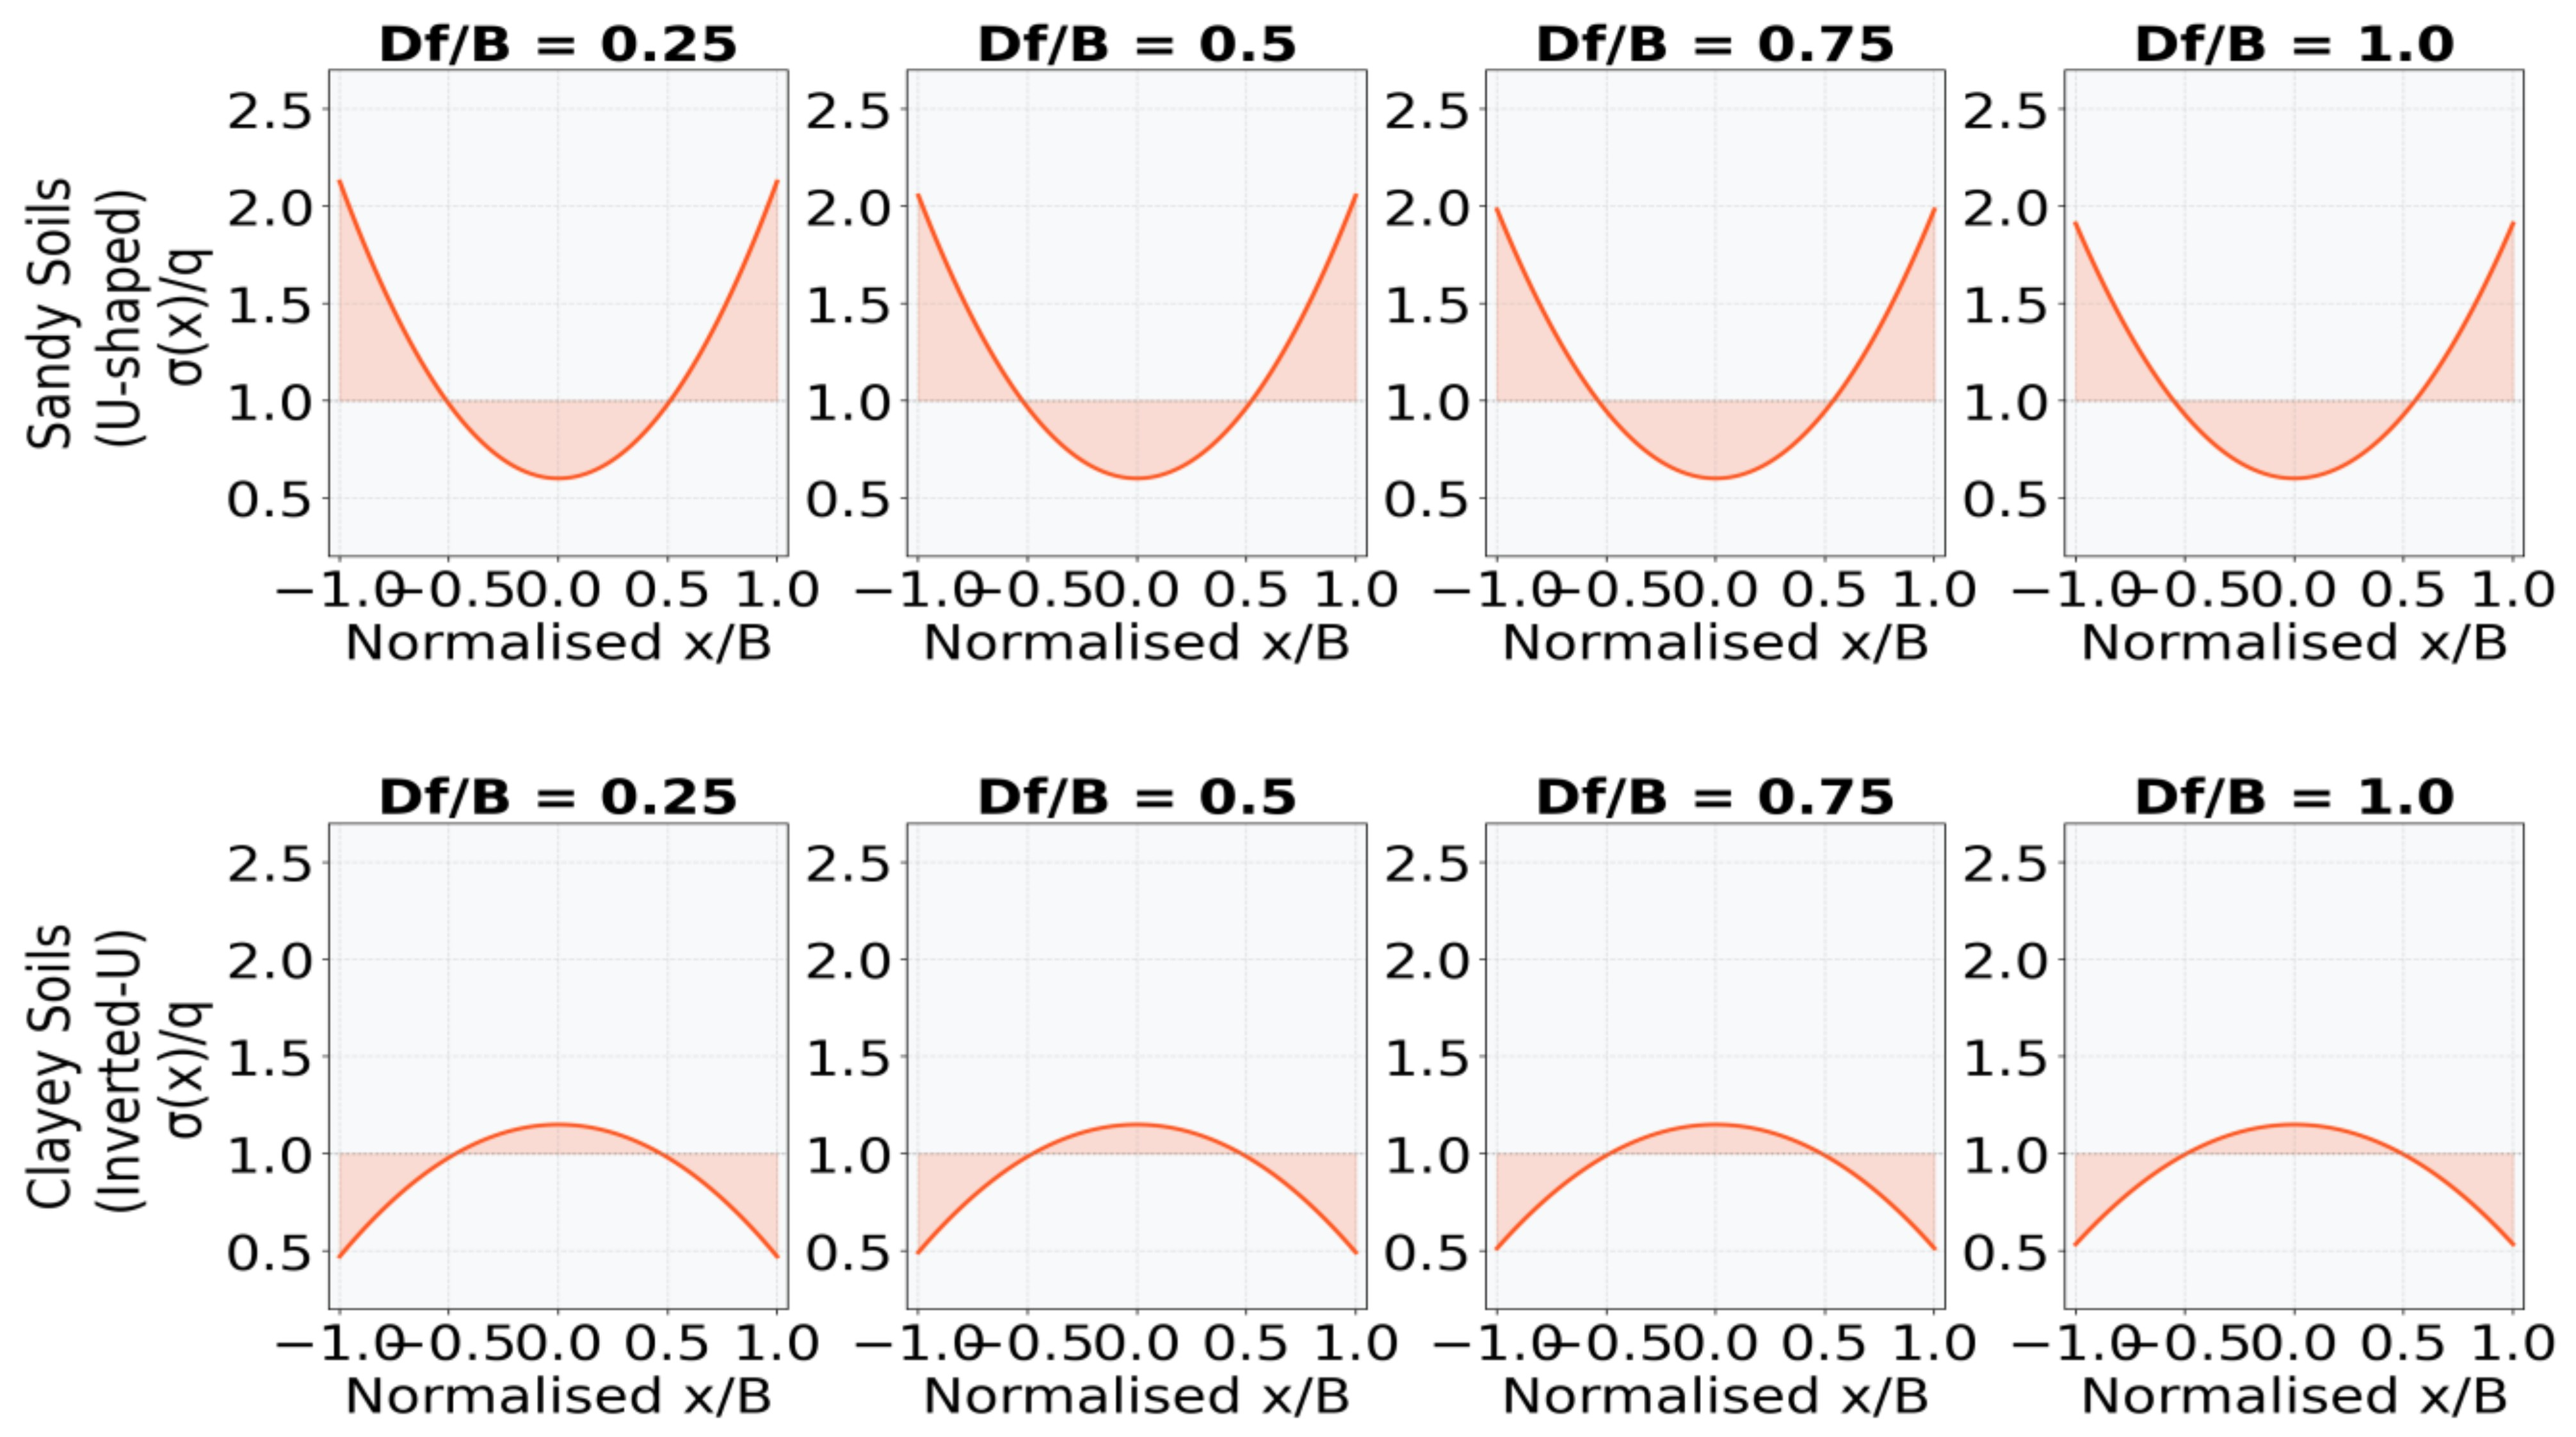
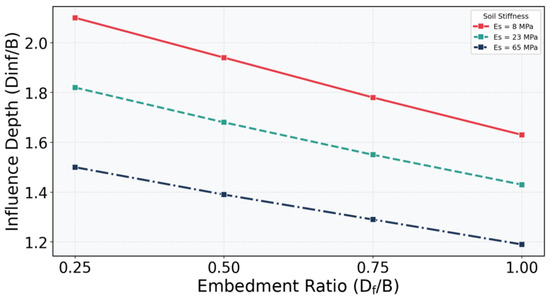
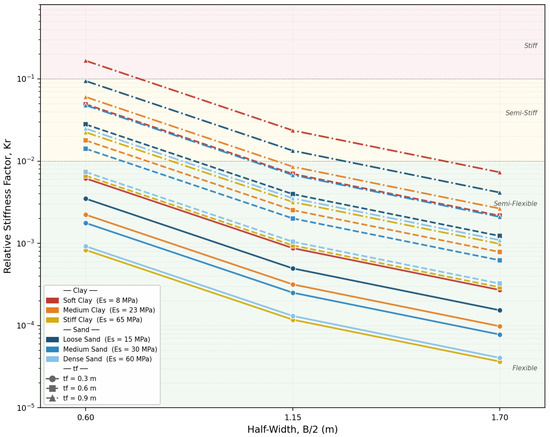
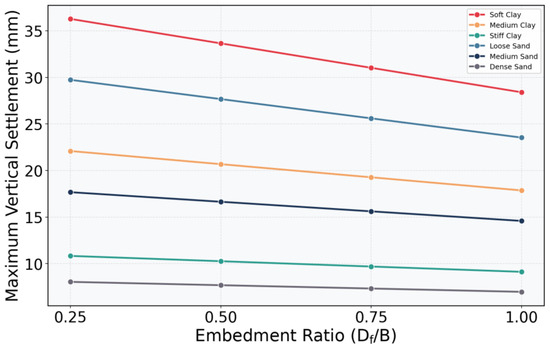
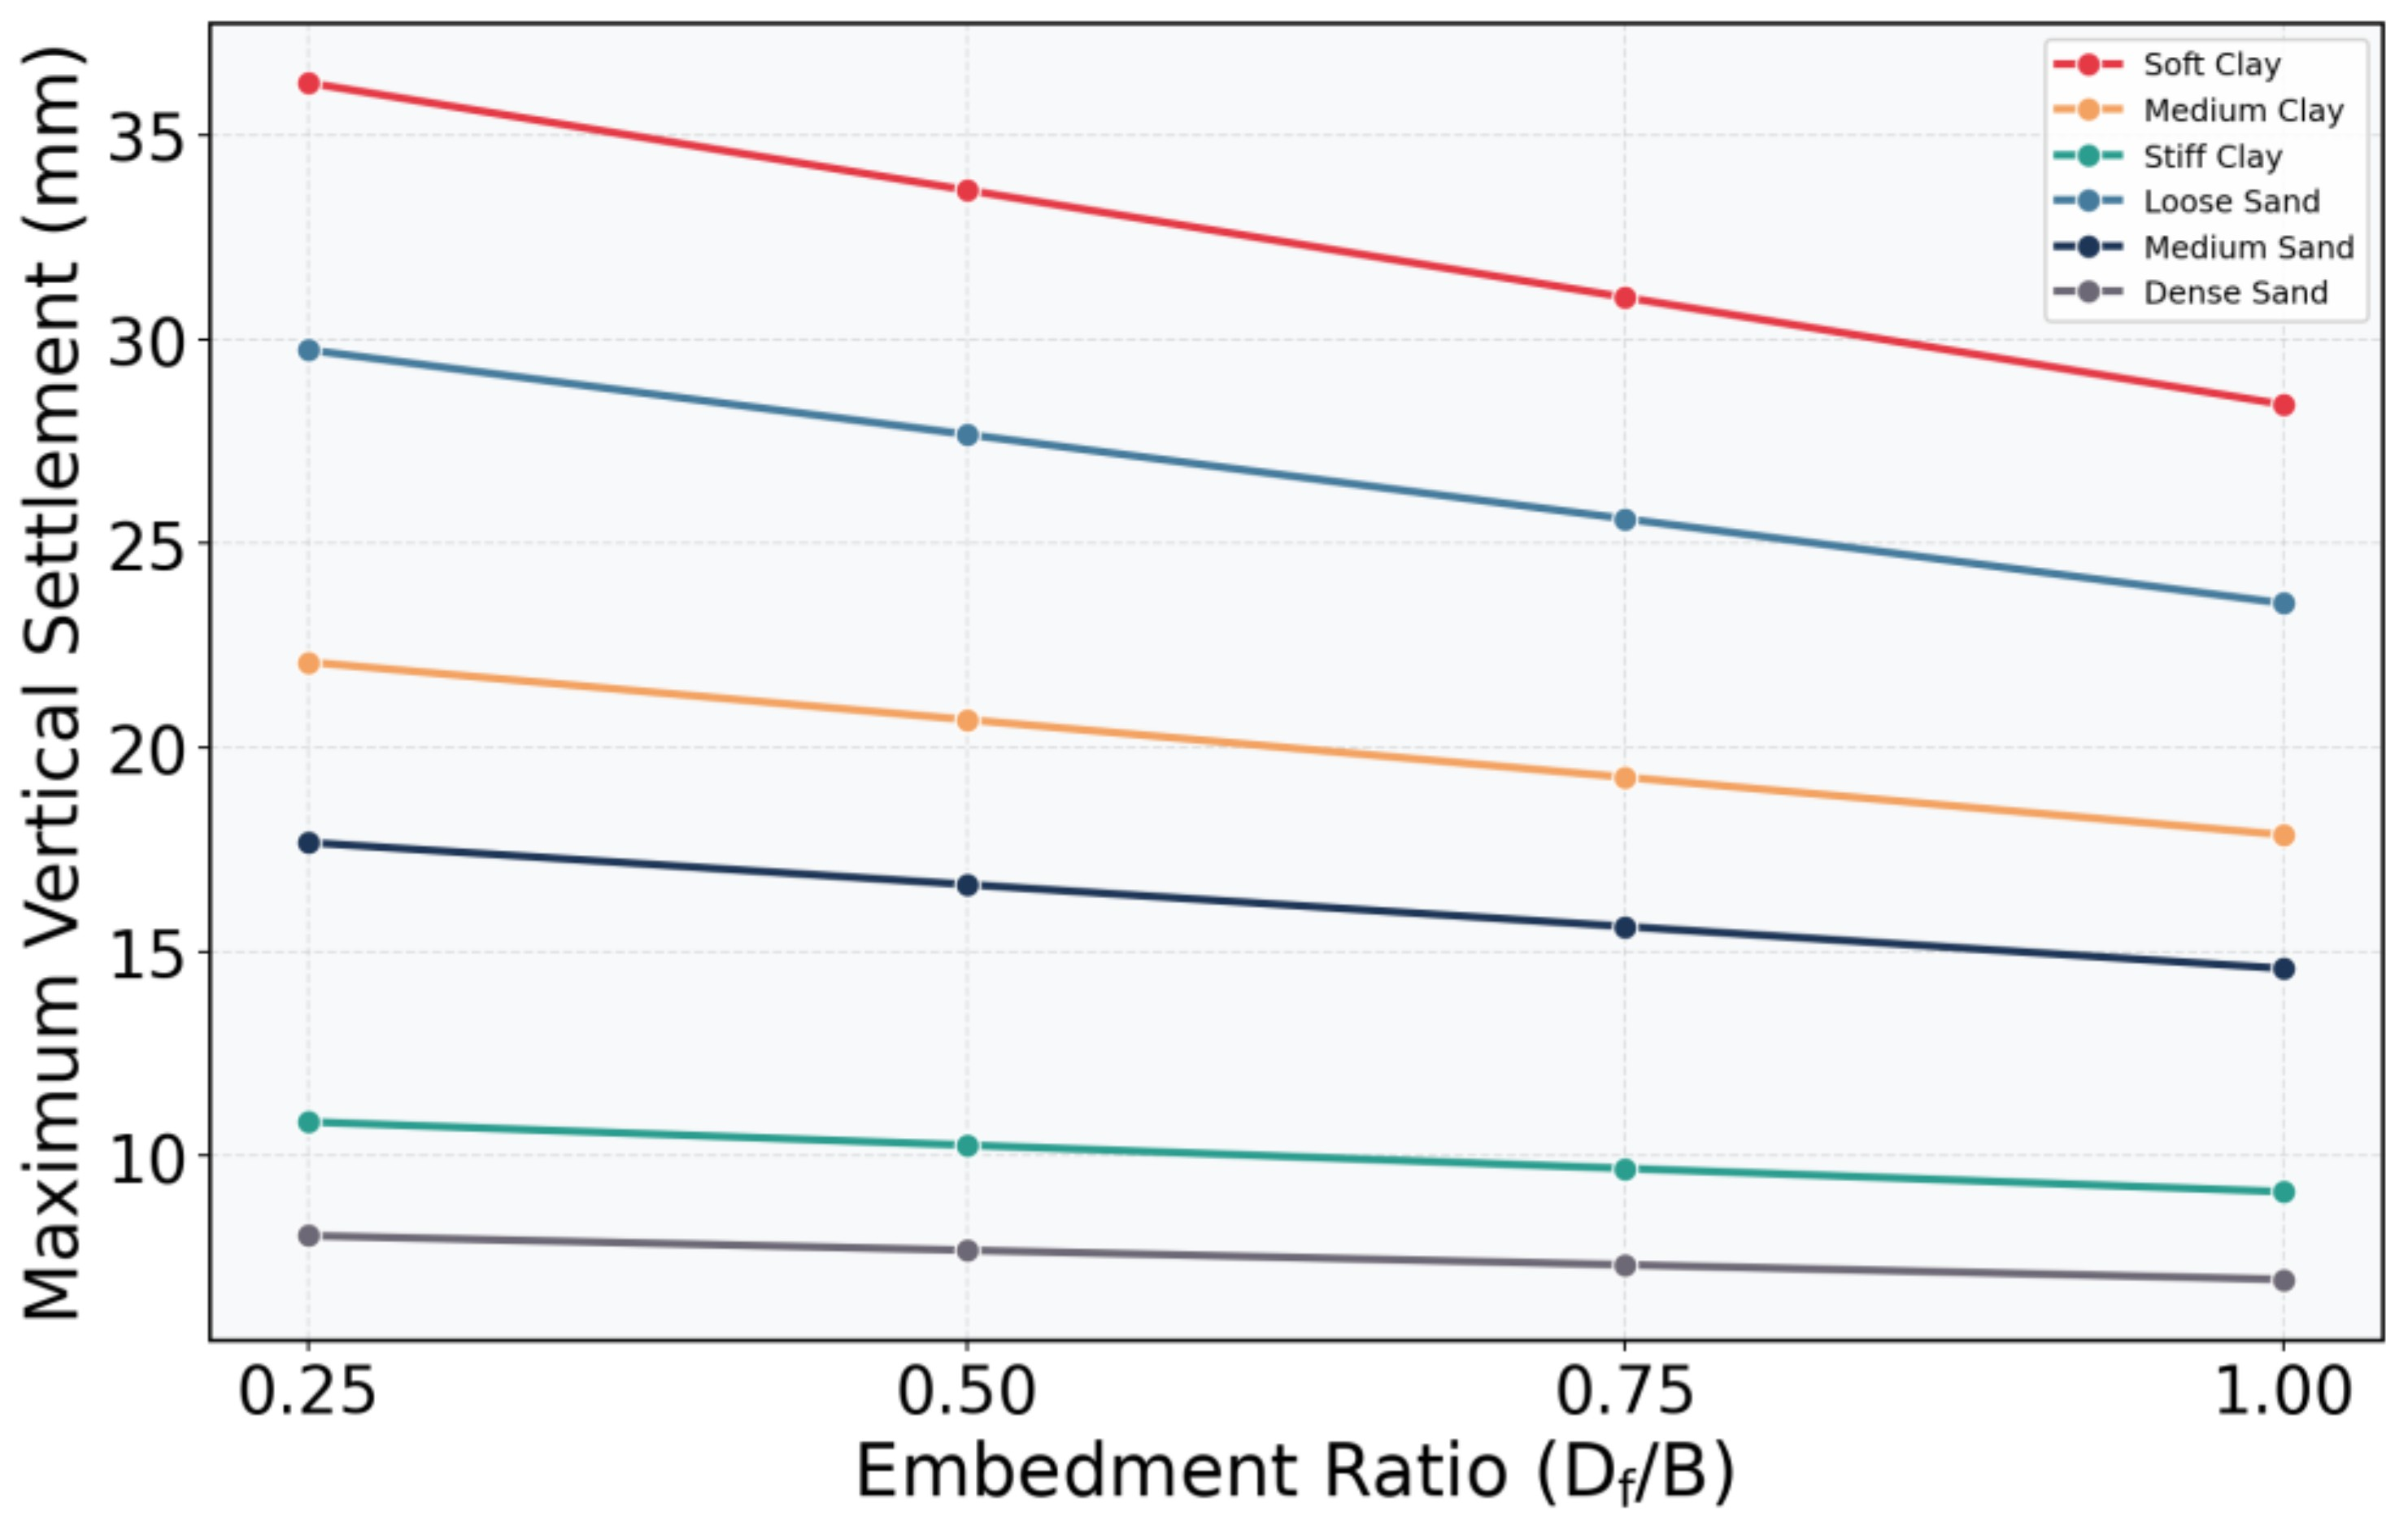
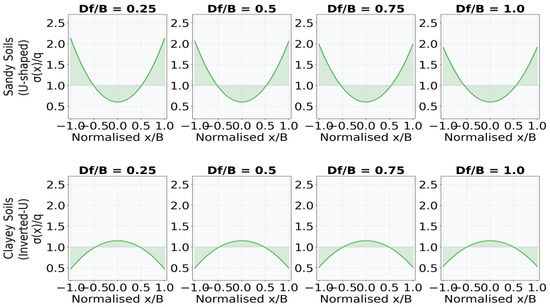
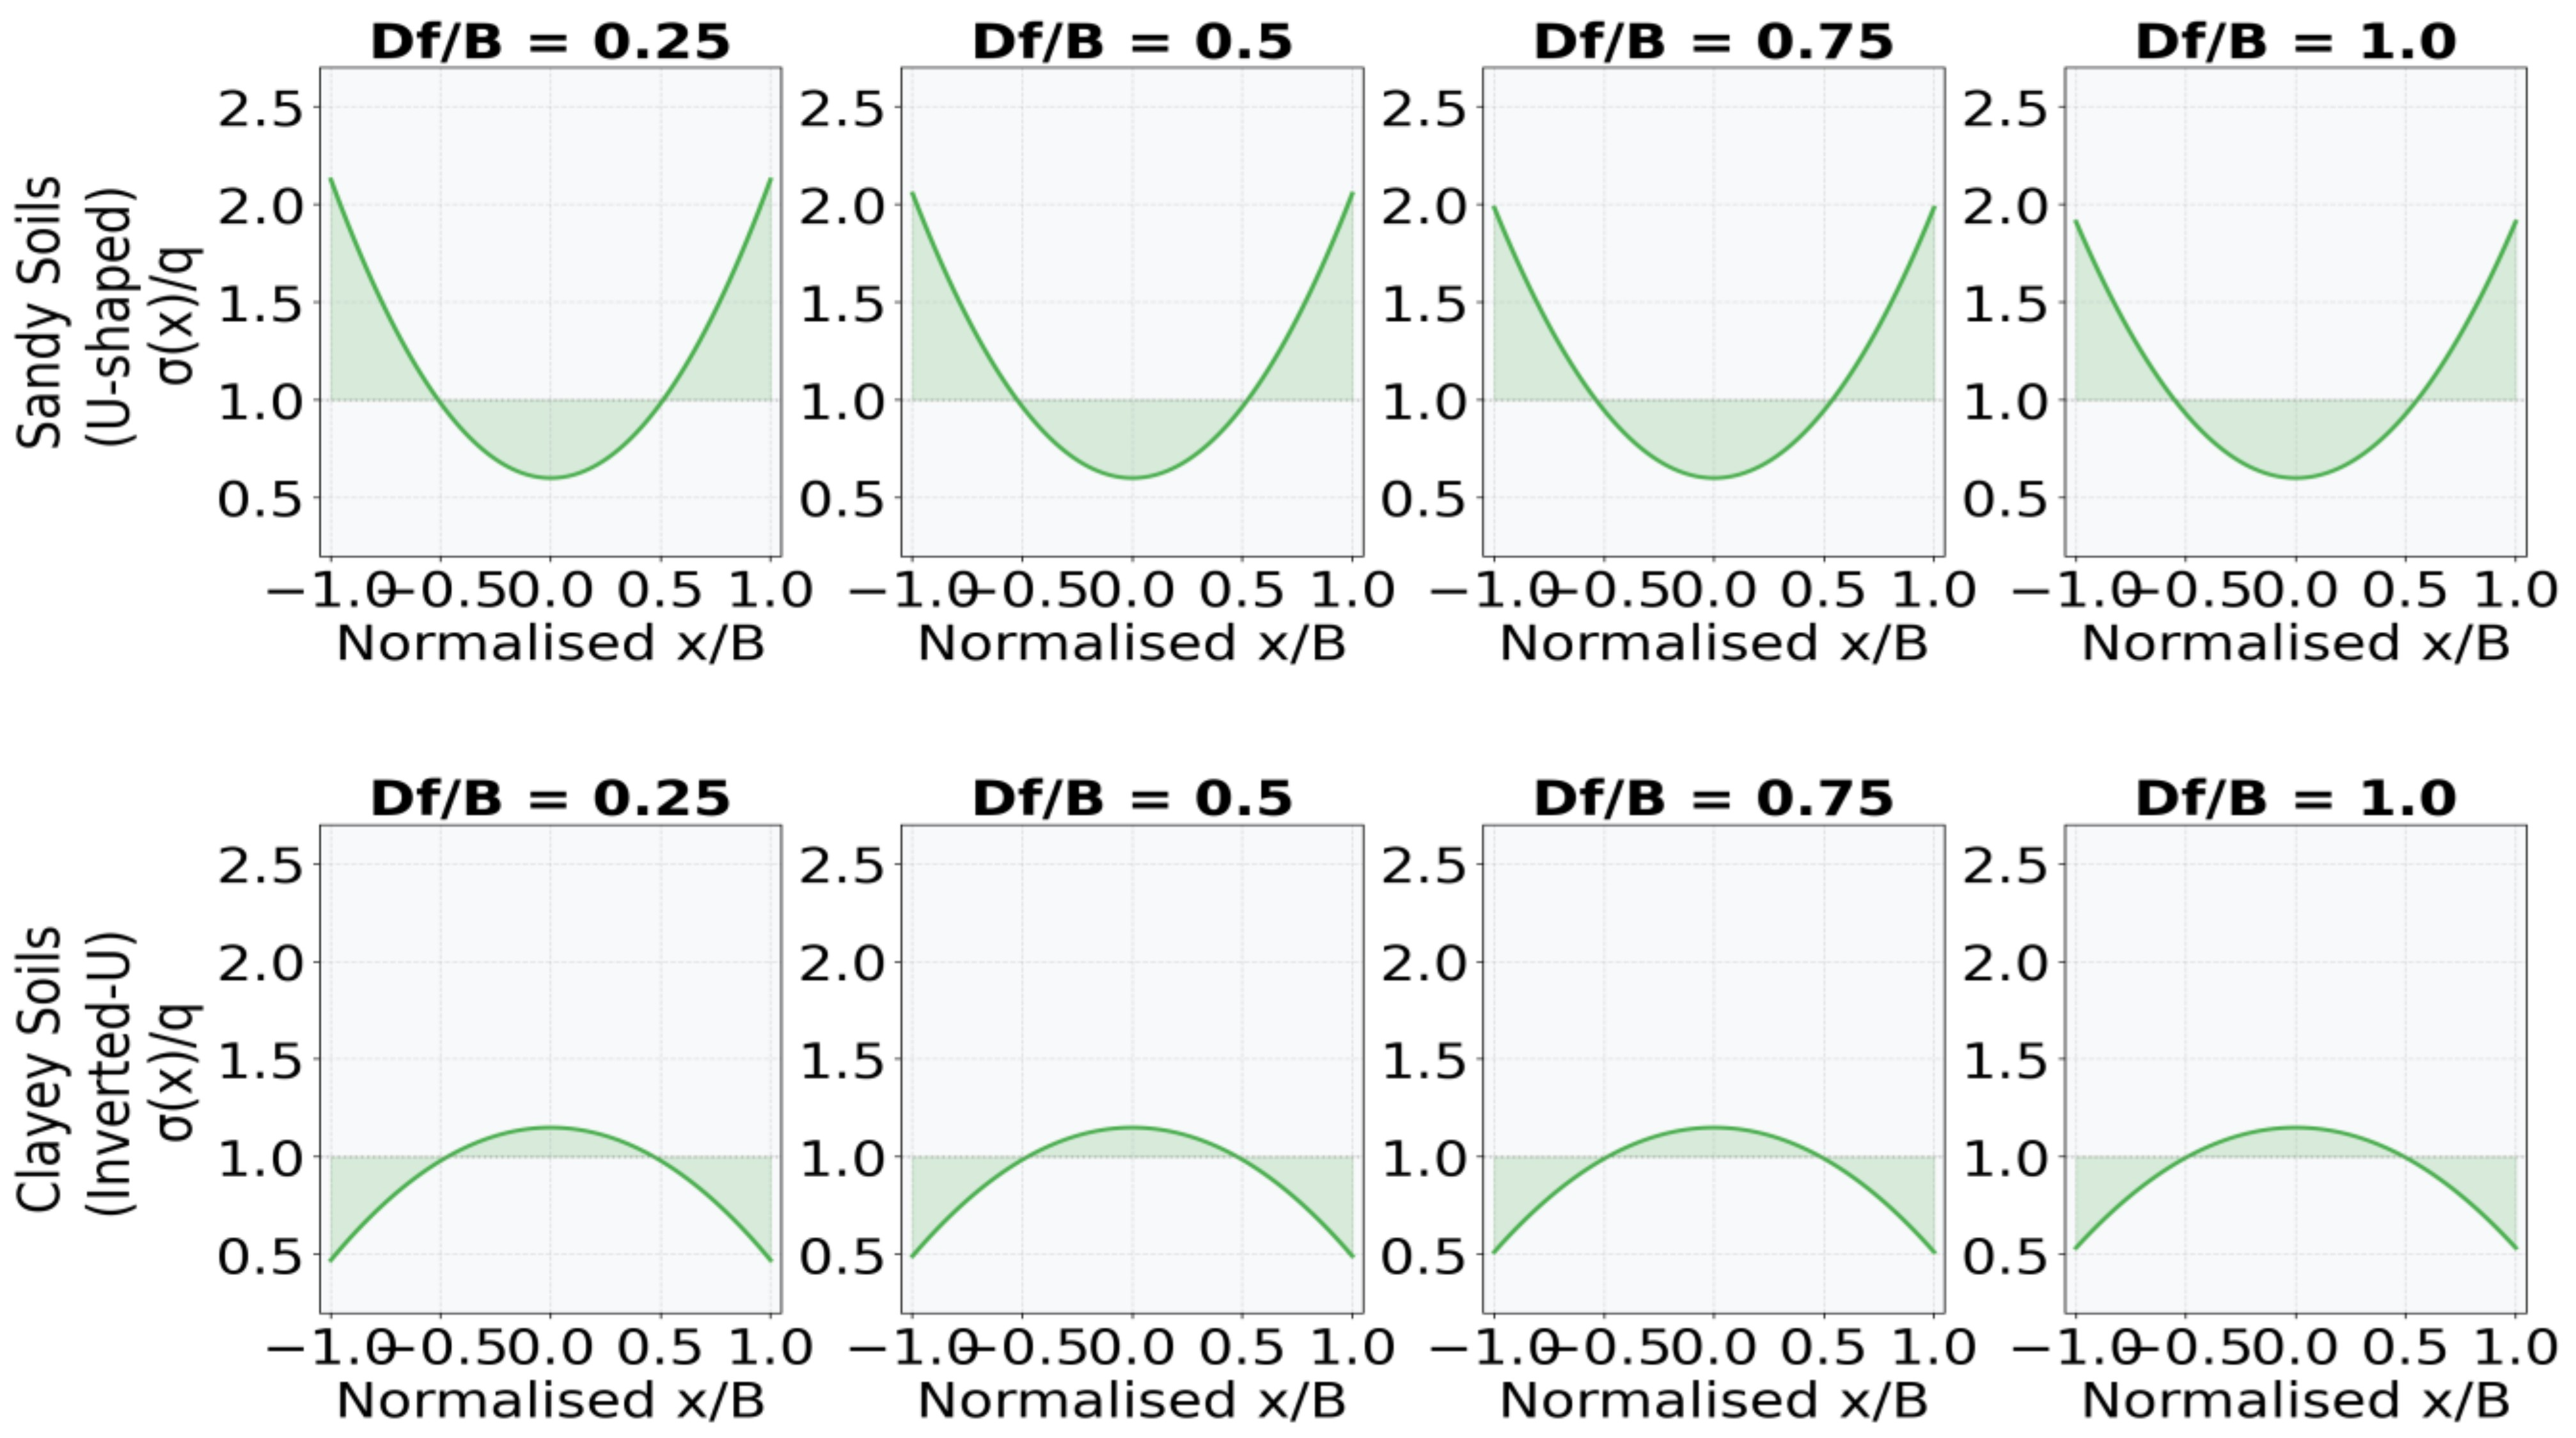
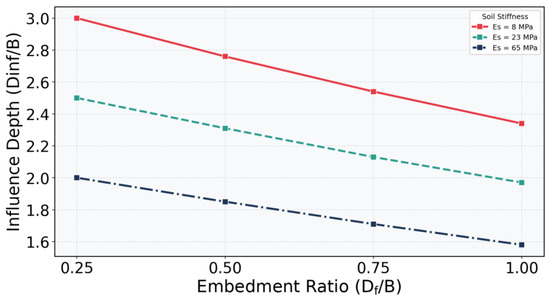
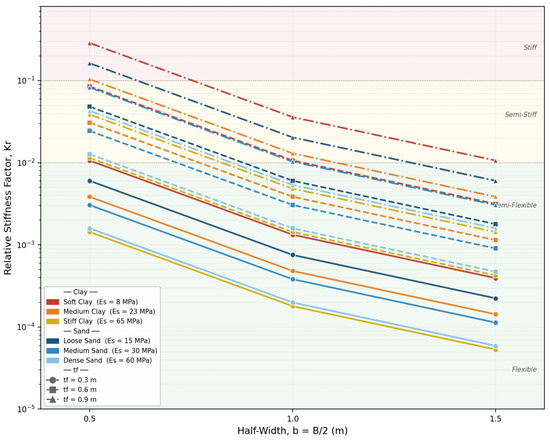

Disclaimer/Publisher’s Note: The statements, opinions and data contained in all publications are solely those of the individual author(s) and contributor(s) and not of MDPI and/or the editor(s). MDPI and/or the editor(s) disclaim responsibility for any injury to people or property resulting from any ideas, methods, instructions or products referred to in the content. |
© 2026 by the authors. Licensee MDPI, Basel, Switzerland. This article is an open access article distributed under the terms and conditions of the Creative Commons Attribution (CC BY) license.