


Abstract
Marine construction projects overrun their budgets more often and more severely than comparable onshore work, yet most prior studies rank candidate causes without connecting them to the final cost of real projects; this study closes that gap. A three-tier literature review followed by a three-round Delphi process produced 173 causes of cost overrun, organized under the eight performance domains of the PMBOK Guide (Seventh Edition). A paired probability–impact index elicited from 200 practitioners identified critical causes, a Monte Carlo simulation tested its stability, and perceptions were compared across stakeholder roles and experience bands with the Kruskal–Wallis test under a false-discovery-rate correction. The ranking was then compared with the documented results of 59 marine projects from Egypt and the Gulf, where the overruns averaged 18.7% and reached 60%. Escalation in resource prices, shortage of specialized materials, and contractor financial difficulty led the perception ranking, and the Delivery domain was the most influential of the eight. The documented record sharpened that picture: project attributes alone explained relatively little of the variation in overrun, whereas adding the breadth of documented causes substantially improved explanatory power. Resource-price escalation was the most common cause and a clear marker of larger overruns, while the worst cases were set apart by contractor-side failures and by delayed geotechnical and bathymetric surveys, a marine-specific planning failure that coincided with the highest overruns of any planning cause, although on eight projects only and with wide statistical uncertainty. Risk perception varied more with experience than with role. The findings direct attention toward contractor solvency screening and early subsurface investigation and provide a transferable model linking expressed concern to the domains where cost is actually lost.
1. Introduction
1.1. Practical Applications
Marine construction projects, including ports, breakwaters, and jetties, typically incur much greater total costs. This study examines 59 of such projects, along with the opinions of 200 construction engineers and managers from Egypt and the Gulf Region, to identify the main causes of those cost overruns. The data indicate a reminder and a warning to clients and contractors. The greatest cost inflation was associated with “business conditions” rather than with wave or weather conditions. These include rising prices for materials, equipment, and labor, shortages of specialized supplies, and contractors or owners who were in financial difficulty. There were usually multiple causes of cost inflation, with the average cost for each incremental cause being about 3 percent of the contracted work. These data describe associations between recorded problems and cost outcomes; they do not establish cause and effect. Postponing pre-construction seabed investigations may be associated with substantially higher project costs. In the limited set of projects where such investigations were deferred, some of the largest cost overruns were observed; however, the small sample size precludes the drawing of definitive conclusions. Owners have some means of control to improve their cost position by assessing financial strength of bidders and owners, stating price adjustment clausesimproving the reliability of the supply chain, and pre-construction seabed surveys as early as possible, with the surveys themselves being insurance rather than a cost of doing business.
Developing a project within its planned budget and schedule is one of the central objectives of project management and one of the basic measures of success. In marine construction, the budget is the hardest of the two to maintain, and the cost overrun is usually greater than on equivalent work onshore. This study takes project cost as an object and asks which factors drive the cost overrun in marine works the most strongly.
Oceans, rivers, lakes, and bays cover roughly two-thirds of the planet’s surface, and the economic activity they support, from trade and energy to food and recreation, is vast. Building in, on, or under water requires more engineering experience than cost and time alone. Marine assets are important economic infrastructure, and their failure can damage a national economy. Common forms include shore-protection structures, jetties, breakwaters, ports, wharves, floating oil and gas platforms, bridges, underwater pipelines, and tunnels [1]. They are built in remote locations with limited logistical support and in conditions that are severe and difficult to predict. Compared with other constructions, marine work draws on a large and complex set of resources and equipment, proceeds in a dynamic and uncertain environment, and asks several interdependent disciplines to act in step. Tam & Shen [2] attribute the distinctiveness of marine projects to weather exposure and demanding design. These features make marine projects more prone to cost overruns, time delays, and resource constraints than land projects. The consequences fall on the stakeholders: overruns disrupt the operation stage and threaten the financial viability of the project, and they are a frequent source of stakeholder dissatisfaction [3,4,5]. Deviations of this kind are especially serious in the high-risk marine setting.
Marine projects belong to the global inventory of infrastructure, yet many overrun their budgets and schedules. Substantial cost escalation is the rule rather than the exception in major infrastructure: across 258 projects in 20 nations, transport projects overran by an average of 28%, and cost estimates had not improved over the preceding 70 years [6]. Marine projects sit at the more exposed end of this range, with reported overruns of roughly 20% to 50% driven by environmental uncertainty, supply-chain disruption, and compliance difficulty [7]. The financial effect is large, eroding the economic case for projects and weakening stakeholder confidence [8]. Risk-assessment practice still leans on static, experience-based methods that adapt poorly to the moving conditions of real projects [9,10].
1.2. Research Problem
By one account, only 2.5% of projects meet their scope, cost, schedule, and business goals together [11]. Marine projects are among the most expensive and highest-risk forms of construction, and among the largest ways in which people alter the environment [1]. Bugnot et al. [12] note that the economic behavior of marine assets has drawn far less study than that of onshore assets, even though marine construction affects, on average, 1.5% (0.7 to 2.4%) of the world’s Exclusive Economic Zones, against 0.02 to 1.7% for urban construction on land. A marine project fails when cost or schedule targets are exceeded, when safety or quality is not met, when stakeholders are dissatisfied, or when environmental and other sustainability goals go unmet [13,14,15].
2. Review of the Literature
2.1. Cost Overrun as a Structural Feature of Project Delivery
Cost overruns are not anomalies. They recur with a regularity that points to something systemic in how projects are conceived and estimated. Flyvbjerg’s work on major infrastructure traces much of the difficulty to optimism bias and deliberate misrepresentation [7,14] and shows that projects designed to look best on paper tend to accumulate the largest overruns once built [16]. The incidence figures are stark. Only a small fraction of projects come close to meeting the scope, cost, schedule, and business goals together [11], and failure often occurs earlier in the control mechanisms intended to catch deviation before it compounds [8]. One claim runs through this work: the budget is fixed when the least is known, and the project spends the rest of its life paying for that asymmetry [17]. The problem is larger in developing economies, where changing markets and institutions widen the estimation error [18]. That context matters for marine construction because it means that the search for an explanation should go beyond the site to estimation and procurement.
2.2. The Marine Difference
What justifies a separate marine literature is a set of conditions that are usually absent onshore. Tam & Shen [2] describe marine projects as increasingly complex, because resources, equipment, and several disciplines must be integrated in a difficult and hazardous setting. Johnson & Tatum [1] tie that complexity to the specialized systems and technologies that marine contractors must master. Here, the environment is not a backdrop. It is an active source of disturbance. Adverse marine weather cuts productivity far more than cuts onshore, where sheltered work can absorb lost time, and a systematic review of weather and construction finds that adverse weather delays close to 45% of projects worldwide [19]. Exposure is also rising: the global footprint of marine structures keeps expanding, yet the economic behavior of these networked assets has drawn little research attention [12]. That gap is itself part of the problem.
2.3. From Cause Lists to the Limits of Cause Lists
Enumeration has been the dominant technique. Studies gather candidate variables, sort them into categories, and report which rank highest. Chidambaram et al. [3] consolidated 113 causes from 41 studies into 18 categories; Aljohani [20] assembled 173 causes in seventeen settings. The output is useful, but the method has a quiet limitation. Dominant causes shift from one country to the next, so any global list has to be generalized extensively before it fits a particular case [21]. Regional evidence makes the point. In Egypt, the leading causes are scope change, material-price fluctuation, and inadequate cost estimation, all amplified by macroeconomic and political instability [22,23,24]. In Saudi Arabia, design-interface failures and low-bid awards recur [25,26]. Across the Gulf’s oil and gas sector, governance and procurement breakdowns lead [4,27,28]. Rising raw-material prices are named the main cost factor in several studies [29,30], and a review of 48 articles involving cost overruns places price fluctuation, financial problems, and ground conditions among the most cited causes worldwide [31]. The pattern is informative and also limited. The lists grow and reorder with context, which makes comparing them hard. What is needed is not another list, but a way to read all the lists within one structure.
2.4. Evidence Specific to Marine and Offshore Settings
A smaller body of work tackles marine conditions directly. Tam & Shen (2012) flag faulty geotechnical assumptions as a recurrent overrun source and argue for pilot testing before construction begins, an early signal that uncertainty below the waterline is costly to discover late. Gu & Gudmestad [32] offer the most structured offshore treatment, sorting early-phase uncertainty into seven types (social, technical, commercial, reservoir, natural-environment, management, and HSE) and showing that early decisions govern outcomes. Joubert & Pretorius [33] operationalize the risk of a port and container terminal through a 215-item breakdown structure. Nassar & Elbisy [34] provide the closest comparator to the present study, ranking 43 factors in nine groups and finding that inflation, cost fluctuation, contractor inexperience, weak schedule planning, and contractor financing difficulty are the top of the list. Their result points two ways. It confirms the weight of the market and the contractor factors. It also exposes the question this study pursues, because those leading factors are barely marine, suggesting that the genuinely marine drivers sit lower in the ranking and may behave differently.
2.5. Methods of Criticality and What They Leave Unresolved
Methodologically, the field relies mainly on the Relative Importance Index, often supplemented by simulation. Monte Carlo methods have been used to propagate uncertainty in cost estimates in related fields [35,36,37], and machine learning is beginning to capture the non-linear interactions that static indices miss [9,10]. Demirkesen & Ozorhon [38] show that management performance affects cost indirectly, through control of scope and schedule. Hoseini et al. [39] add a complication, that is, that ranking studies tend to overlook clients and contractors read cost contingency differently, so an aggregated index can average out the very disagreement that matters most. The perception of criticality is rarely tested against the actual cost of the project, and the index becomes a target rather than a hypothesis. Cost and schedule are also frequently merged into a single “time and cost” result, which hides whether delay drives cost or the reverse. The prevailing approach remains static and experience-based, a poor fit for a fast-moving environment [34].
2.6. Synthesis and Research Gap
Together, the literature leaves three unresolved problems. Rankings rarely face documented results. Cost overruns are grouped with schedule delays. Furthermore, inventories are piecemeal, built study-by-study with no shared structure that lets evidence accumulate across contexts. The next section sets out the study designed to address these three problems.
3. Research Methodology
3.1. Research Objectives
The study aims at four objectives. The first is to identify the causes of cost overrun in marine construction and place them under one structure, the eight performance domains of PMBOK-7 [40]. The second is to establish the criticality of each cause through paired probability–impact assessment and to test the resulting ranking with stochastic simulation. The third is to determine whether the perception of these causes varies depending on the role of the stakeholder and the professional experience. The fourth and the one that separates this work from earlier ranking studies is to set perception-based criticality against documented outcomes from completed marine projects and to ask which causes accompany the projects that overran.
Five questions follow from these objectives:
- Do perceived causes of cost overruns in marine construction differ significantly between stakeholder groups (owners, contractors, designers, and consultants)?
- Does the perception of these causes differ significantly with the role of the stakeholder and the professional experience?
- Which causes the rank to be most critical, and how stable is that ranking under deterministic and stochastic treatment?
- How are the causes interrelated, and do strong associations cross the boundaries of the performance domains?
- Do the causes judged critically correspond to those observed in projects that overran, and which causes most sharply distinguish severe overruns?
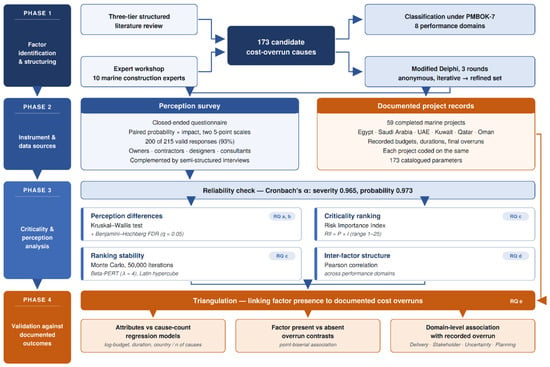
Figure 1 shows the methodology adopted to achieve the objectives of the study.
Figure 1.
Research methodology.
3.2. Identification of Cost-Overrun Factors
Drawing on previous empirical studies and applicable theories, this phase identified and categorized the cost-overrun drivers reported for marine construction. Several studies suggest that the order of the causes of cost overrun is not the same when considering different construction contexts. The same can be said regarding construction projects in different countries and cost overruns considering construction methods and associated resources and involved stakeholders.
A first draft of potential cost-overrun causes was prepared after an initial workshop with 10 marine construction experts. This draft and the literature review resulted in the identification of 173 unique cost-overrun drivers. The PMBOK 7th Edition performance domain was used to classify the identified cost-overrun drivers. The identified cost-overrun drivers were then subjected to a modified Delphi study in three rounds to understand and refine the primary and secondary cost-overrun drivers.
The eight PMBOK 7 performance domains were used to construct an overarching framework to categorize the primary cost-overrun drivers and were named Stakeholder, Team, Development Approach and Life Cycle, Planning, Project Work, Delivery, measurement and Uncertainty.
The modified Delphi study used a three-step process for each of the stakeholder groups to achieve a convergence of opinion. The anonymous and iterative format follows the guidance of McKenna [41]. The panel consisted of marine construction professionals who met the following criteria: they had at least 15 years of experience in marine construction, at least five years of experience in project performance measurement and were from the main stakeholder groups. The last criterion was to help ensure that there was no dominance of a single stakeholder group.
The experts initially received an early list of causes of cost overrun in the first round, along with a structured questionnaire, and were asked to evaluate the causes in terms of the three dimensions mentioned above. The responses collected were structured, and a feedback report was prepared and returned to the panel, together with a revised list, for the second round, which was carried out in the same way. The responses of the second round were analyzed in a similar way. Then, an updated report and a revised list were prepared for the third round. After the three rounds, the expert panel reached a final set of causative factors. The majority of the responses focused on the phrasing, definitions, and sequences of the listed causes.
3.3. Questionnaire
To ensure consistency in data collection and facilitate analysis, a closed-ended questionnaire was used. Each cause was evaluated using two five-point scales, one measuring probability and the other measuring impact, as presented in Table 1. The survey was created in Google Forms and then distributed to participants.
Table 1.
Five-point rating scale for probability and impact.
3.4. Sample Size
The sample size of the survey is the number of completed responses. It is called a sample because it represents a subset of the population [42].
- Z: The z-score is the number of standard deviations a given proportion is away from the mean.
- p: Population proportion (assume 0.5)
- E: Marginal error (assume 8.2%)
- Assume confidence level= 90%
- Z = 1.65 (based on confidence level we get z-score from table)
- q = 1 − p = 1 − 0.5 = 0.5
- Sample size = 103.
3.5. Data Collection
The questionnaire was administered to the main stakeholder groups operating within the marine construction sector. It yielded a high completion rate, with 200 of 215 participants (93.02%) providing fully complete responses. The resulting dataset comprises both pilot and main survey data, with Google Forms employed for questionnaire construction and preliminary data handling. Qualitative data was collected via semi-structured interviews, all of which were audio-recorded in full and subsequently transcribed verbatim.
At the same time, data was collected for 59 marine construction projects provided by public and private contracting entities in Egypt, Saudi Arabia, the United Arab Emirates, Kuwait, Qatar and Oman. Each of these projects was evaluated using the same set of 173 parameters applied in the survey.
3.6. Analysis Methods
3.6.1. Data Reliability
Internal consistency was assessed using Cronbach’s alpha, an index of how well a group of items reflects a single underlying construct. This coefficient assumes values between 0 and 1, with higher values denoting greater levels of internal consistency [43,44]. It is computed as shown in Equation (2):
where k is the number of items in the questionnaire, is the variance of the item, and is the total variance.
3.6.2. Kruskal–Wallis Test
For Likert-type data, and more broadly, whenever normality is doubtful, the Kruskal–Wallis test provides a justifiable nonparametric option [45]. It evaluates whether multiple groups, here stakeholder categories and experience levels, originate from a single common population, versus the alternative of at least one group being different [4]. All observations are combined and assigned ranks, with tied values receiving average ranks, and the test statistic is then calculated as in Equation (3):
where (m) is the number of groups, (ni) is the number of observations in the ith group, (N) is the total number of observations, and (Ri) is the ith group mean rank.
The analysis was performed for all 173 causes for both indices, generating 346 analyses all together. The Benjamini–Hochberg method was applied with a false-discovery rate of 0.05 [46] to control for the expected rate of false discoveries among this large number of analyses. To construct the critical values, all the p-values were sorted and then each value was compared to the critical value. Only those findings that met the adjusted p-value threshold were considered statistically significant. All the significant factor counts presented below are based on adjusted p-values. Because role and experience could be confounded, their independence was tested with a chi-square test of the role-by-experience table, confirmed by a permutation test given the small, expected counts, and then both factors were entered together in a two-way model of each respondent’s mean rating across the 173 causes, with partial eta squared as the effect-size measure [47].
3.6.3. Risk Importance Index
In this case, the index is the probability index multiplied by the severity index (impact), each assessed on a 1 to 5 ordinal scale, resulting in a composite value ranging from 1 to 25. This definition of the index is based on two assumptions. The first is that the five categories on each of the ordinal scales are equally spaced. The second is that multiplication allows a low probability to be balanced by a high impact, so that different probability–impact pairs can result in the same value. The multiplicative form of the index is retained, because it corresponds to the form of risk that is the expectation [48], and because it is only when both probability and impact are high that a cause is considered significant. A cause that is assessed as a 3 in both probability and impact is rated 9, whereas a cause that is assessed as a 1 in probability and a 5 in impact is rated 5. An additive index would result in both evaluations of both causes as 6. The index is used to prioritize causes for comparison with the documented record; it is not used to evaluate the expected monetary loss. This formulation differs from the conventional Relative Importance Index, which transforms a single weighted rating into a normalized value on the interval [0, 1]. The quantity resulting from this process is better interpreted as a probability–impact criticality metric. The index is therefore named the Risk Importance Index (RII). The explicit retention of both indices allows the distinction between the probability of a cause and the impact of that cause to be maintained. The questionnaire data was used to rank the factors from highest to lowest according to the Risk Importance Index (RII). The index and its components are given in Equations (4) to (6):
The factors were ranked from highest to lowest according to the Relative Importance Index.
3.6.4. Monte Carlo Simulation
Monte Carlo simulation quantifies risk by combining deterministic and probabilistic components in one assessment and is widely used in engineering to study how fixed and stochastic factors act together [35,36,37]. Each input variable is given a range and a probability distribution. On every iteration, a value is drawn at random from each input distribution, and the number of iterations is fixed in advance. Once the run is completed, the output set is analyzed to describe the distribution and behavior of the output variables. The approach also represents the dependencies between variables in a transparent way, which is important for robust results [37].
3.6.5. Pearson’s Correlation
Pearson’s product–moment correlation was applied to quantify both the strength and direction of linear relationships between variables, thereby identifying the principal factors driving cost overruns. The correlation coefficient r ranges from −1.0 to +1.0. Based on its absolute value, the relationships were classified as strong at 0.70 or higher, moderate from 0.30 up to but without including 0.70, and weak below 0.30. The coefficient is computed as in Equation (7):
where xi and yi are the paired observations for project or factor i, and and are the corresponding sample means.
3.6.6. Cost Overruns—Factor Association in the Documented Projects
This procedure links the presence of causes to the outcomes observed in 59 documented case studies. Each case study was coded for presence or absence of 173 pre-documented causes, yielding a binary indicator matrix along with recorded final cost overruns and the project attributes of contract value, planned duration and country. The overrun is compared with the contract value at the time of award. This is a more restrictive base line than the decision to build an estimate found in much of the literature on megaprojects [49], and therefore produces smaller percentages.
For each project, the factors contributing to the documented overrun were extracted from the project close-out report and corroborated through interviews with personnel who had held direct responsibility for the work. The research team then transcribed the causes identified by these sources into the catalog. Coding followed two fixed rules: a cause was recorded as present only where the source material matched the catalog definition and the attribution was confirmed in an interview by the person who had held direct responsibility, so that the interviews served to confirm causes rather than to add them. The transcription was performed by the first author, after which the second author reviewed the complete coding of all 59 projects against the same sources. That review altered the coding of three projects (5.09%), so that the initial coding stood unchanged for 94.91% of projects, and the three discrepant cases were settled by joint re-reading of the source documents. Neither stage was blind to the recorded overrun, which the close-out reports themselves contain, and the second stage was full verification rather than a blind independent recording. Documentary completeness was uneven across projects and countries and was not separately measured, so the recorded cause count may partly reflect documentation intensity as well as project complexity.
The joint burden of causes was measured as the count of distinct causes present in each project. Its monotonic association with overrun was tested with Spearman’s rank correlation, computed as in Equation (8):
where di is the difference between the ranks assigned to project i on the two variables and n is the number of projects.
Overrun was then regressed on the project attributes and the cause count by ordinary least squares (OLS), using the nested specification of Equation (9):
where COi is the recorded cost overrun of project i (% of contract value), CVi the contract value, Ti the planned duration, γc(i) a country fixed effect, ni the number of distinct causes present, and εi the error term. The logarithm corrects the pronounced right-skew of contract values. Standard errors are heteroskedasticity-robust (HC1) [50]; the HC3 form is not estimable because one country contributes a single project whose leverage equals one. Influence is assessed with Cook’s distance [51] and by re-estimation without the two largest overruns. The attribute benchmark is the restricted form with β3 = 0, so the change in fit between the restricted and full models, read from R2 and adjusted R2, isolates the incremental variance explained by cause breadth, while β3 estimates the mean change in overrun per additional documented cause.
Factor-level discrimination was quantified with the point-biserial correlation between each binary presence indicator and overrun, computed as in Equation (10):
where M1 and M0 are the mean overruns of projects with and without the cause, sCO the standard deviation of overrun across all projects, and n1, n0, and n the group sizes and total sample size; the statistic is equivalent to a standardized contrast between the two group means. For causes observed in only a few projects, the adjusted p-value is reported, but the contrast is read as suggestive rather than established, because a single extreme case can manufacture an association. The 26 factor-level tests were subjected to the same Benjamini–Hochberg control at a false-discovery rate of 0.05 as the perception tests, and 95% confidence intervals for the present-versus-absent mean differences were obtained by Welch’s method and by a 20,000-resample bootstrap [52]. Associations were interpreted against the thresholds of Section 3.6.5 and are reported as associations rather than causal effects.
4. Results and Discussion
4.1. Demographic Information
The sample covers key professional roles and ranges of experience in the sector (Table 2). Regarding the qualifications, 52.57% of respondents held a bachelor’s degree, 18.29% a master’s degree, and 29.14% a doctorate, meaning that 48.43% had a postgraduate qualification; in all cases, these were in civil or marine construction engineering. In terms of experience, the largest group had 15–20 years (24%), followed by those with 10–15 years (23%), more than 20 years (22%), 5–10 years (20%), and fewer than 5 years (11%). With respect to organization type, contractors formed the biggest share (27%), followed by consultants (25%), while owners and designers each represented 24%. Concerning organization size, half of the respondents (50.29%) were employed in firms with 250 or more staff, 32.57% worked in medium-sized firms, and 17.14% in small firms.
Table 2.
Participants’ demographic details.
4.2. Reliability
Reliability was evaluated using the Cronbach alpha at the level of the eight performance domains, as the 173 causes are heterogeneous by design and a single coefficient across all of them is inflated by item count and does not indicate an underlying construct [43,53]. Table 3 reports the coefficients. Every domain exceeds 0.95 on the cost-overrun severity scale and 0.98 on the probability scale, with item-counting between 13 and 32, so the ratings are internally consistent within each conceptual grouping. These coefficients indicate consistency of the ratings and not construct validity, and their size partly reflects the number of related items within each domain. The alpha computed across all 173 items exceeds 0.99 on both scales but is not interpreted for the reason just given. No single-factor structure is claimed or required: the criticality index is computed per cause, not from a summed scale score.
Table 3.
Cronbach’s alpha by performance domain.
4.3. Difference in Perception
This section addresses research questions (a) and (b), which concern whether perceived causal factors differ between stakeholder groups and as a function of professional experience.
The severity and probability indices derived from the second section of the questionnaire were compared between the stakeholder groups and the experience bands using the Kruskal–Wallis test, to assess whether the stakeholder category and the level of professional experience systematically influence the rating assigned to each cause.
Across stakeholder groups, statistically significant differences were observed for 86 causes (49.7%) with respect to cost-overrun severity and for 82 causes (47.4%) with respect to probability. These findings suggest that the identification and evaluation of cost-overrun determinants are inherently dependent on the specific roles of the stakeholders involved and the organizational frames of reference from which the assessments are conducted. From an applied standpoint, dependence on a single stakeholder group is likely to yield a biased or incomplete representation of the underlying causes, thereby reinforcing the need for a multi-stakeholder approach to their identification and prioritization.
Experience also influenced the ratings, and the pattern was consistent: more-experienced practitioners tended to assign higher ratings to the potential severity of cost overruns while assigning lower ratings to their probability of occurrence. Two complementary interpretations are plausible. First, elevated severity ratings can reflect cumulative exposure to adverse outcomes, providing experienced personnel with a richer set of reference cases to evaluate potential consequences. Second, lower probability estimates may indicate more calibrated confidence, insofar as experienced staff recognize that many theoretically possible causes of overruns are, in practice, low-frequency events or can be effectively controlled once appropriate procedures and safeguards are implemented.
The implication for assessment panels is straightforward: panels that combine members with varying levels of experience are likely to generate more comprehensive characterizations of cost-overrun risk. Less-experienced members may identify a broader range of potential hazards, including those that more-experienced practitioners have come to regard as routine or normalized, while more-experienced members may provide more accurate calibration of severity and practical likelihood.
Because roles and experience could be confounded, they were examined together. The two are close to independent in this sample: the association between role and experience band is not significant (χ2 = 9.19, df = 20, p = 0.981; Cramér’s V = 0.115), and a permutation test with 20,000 resamples, used because 12 of the 30 cells have expected counts below five, gives p = 0.984. The sampling design placed approximately equal numbers in each role-by-experience cell. Entering both factors in a two-way model of each respondent’s mean rating (Table 4) shows that experience accounts for more variance than role on both scales. On the probability scale, the role is not significant at all. The linear trend between experience bands suggests that more-experienced respondents assigned a lower impact (b = +0.059 per band, p = 0.002) and a lower probability (b = −0.275 per band, p < 0.001). This does not contradict the above per-cause results. Role differences are cause-specific and cancel in a respondent’s overall rating level, whereas experience shifts that level itself; the statement that perception varies more with experience than with role refers to the overall level of severity and probability ratings, not individual causes.
Table 4.
Two-way model of mean ratings by professional role and experience band.
Theoretical Interpretation
The pattern encourages, but does not verify, behavioral analysis. In eight projects, the highest planning-related overruns occurred with the combination of delayed geotechnical and bathymetric surveys. It is expected that bias and the planning fallacy would be eroded by the front-end investigation [7,15]. The cost of a survey is certain and immediate, and the benefit is remote and uncertain. A procurement strategy that encourages low bids would amplify the issue, as contractors that guess the conditions of the ground would be rewarded. These tendencies were not formally modeled. No preference elicitation, incentive audits, or process observations were conducted, so they are offered as possible explanations for the observed pattern. The same is true for the experience effect. It is possible that, compared to less-experienced practitioners, higher severity and lower probability ratings by experienced practitioners are the result of reference-dependent evaluation [54], but a design built to evaluate this effect would be needed to confirm this.
4.4. Criticality of Causes
The respondents were requested to evaluate, based on their professional experience and judgment, the probability and impact of each factor using a five-point Likert scale, the structure of which is described in Table 1. This procedure enabled the computation of both a severity index and a probability index for each identified cause.
4.4.1. Risk Importance Index
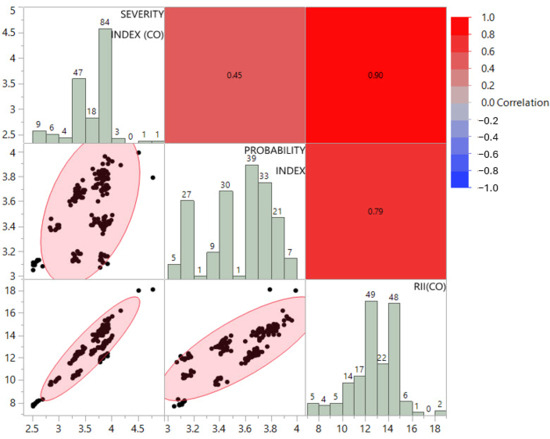
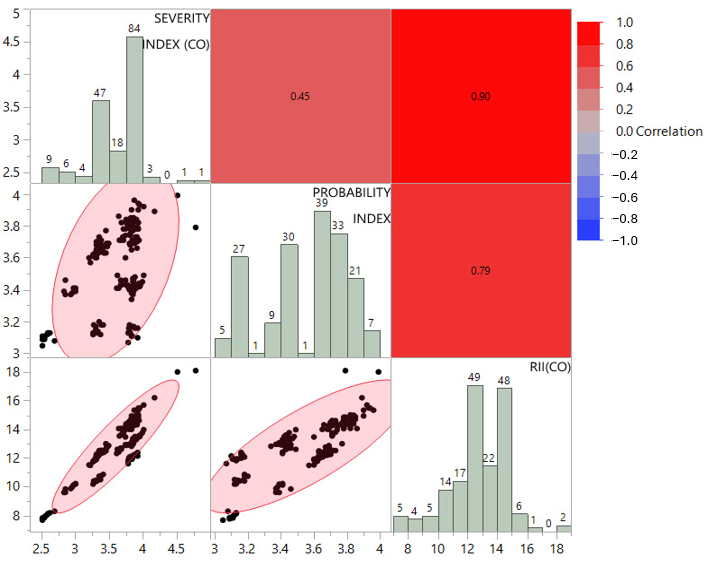
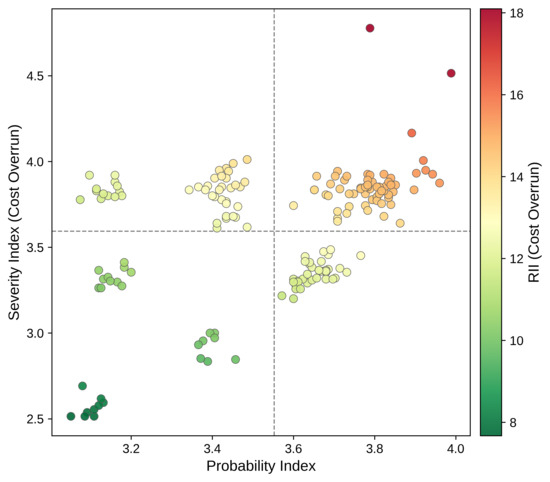
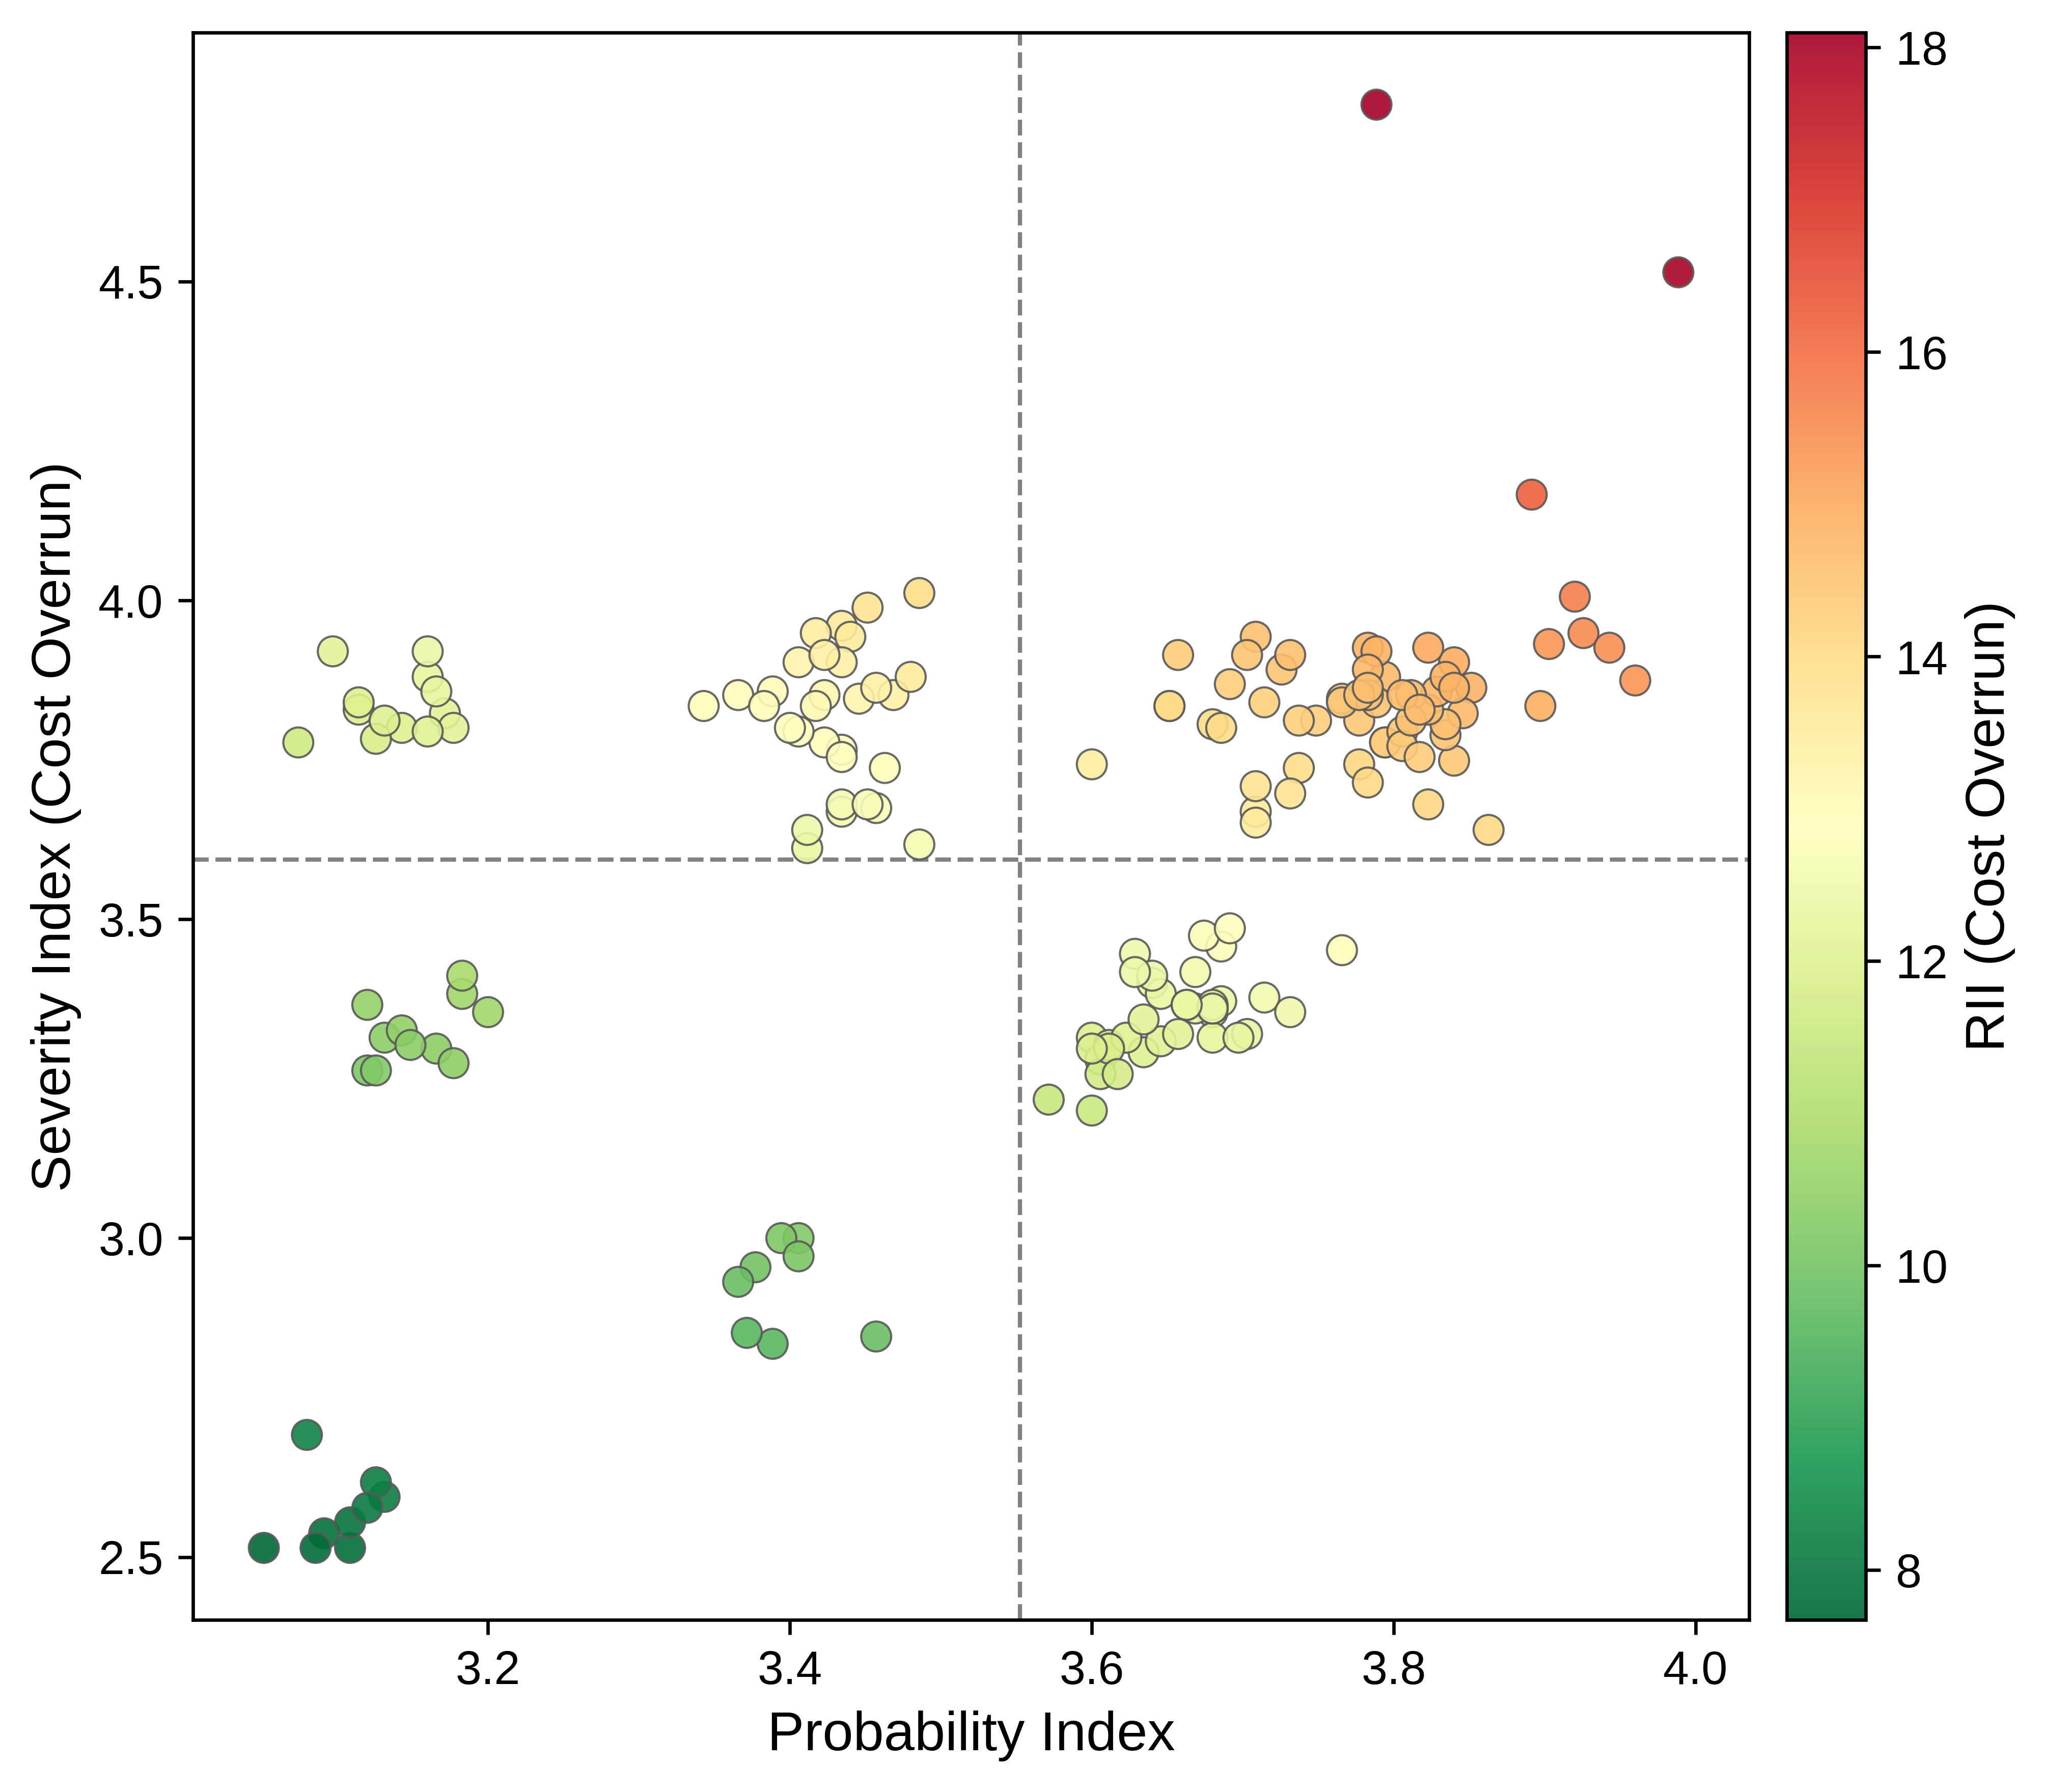
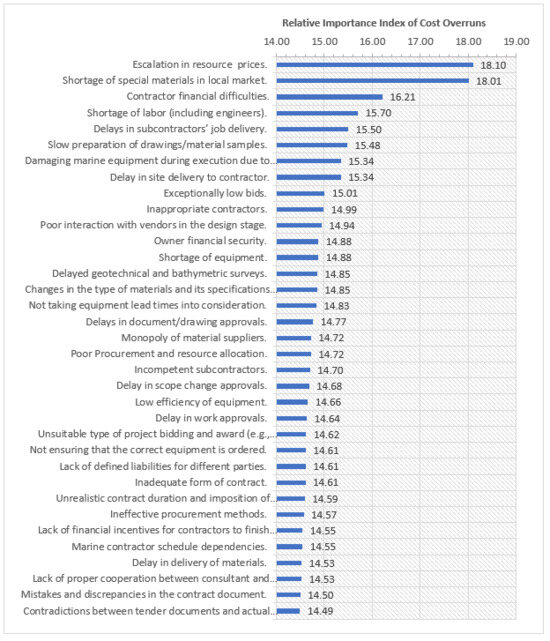
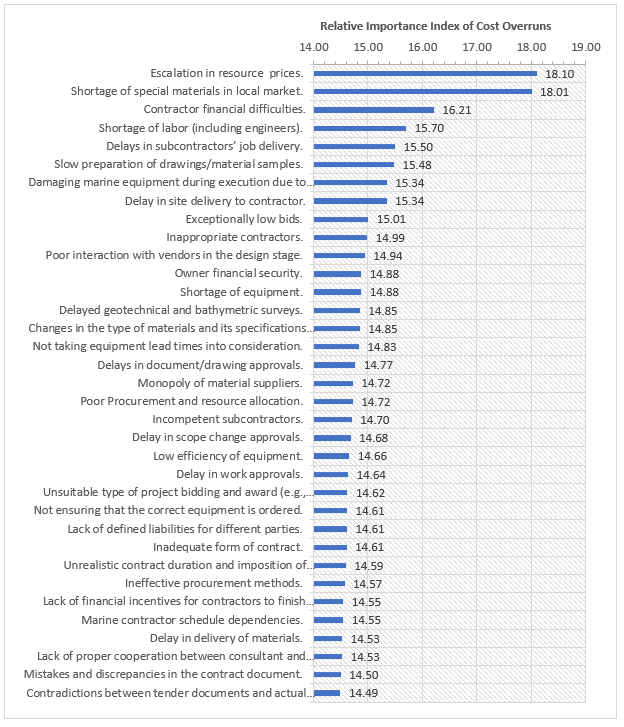
This subsection addresses the first component of the research question (c), that is, which causes are ranked as the most critical. The Risk Importance Index (RII) values for the 173 causes ran from 7.61 to 18.10 (mean 12.81, SD 1.90), a moderately spread distribution (Figure 2 and Figure 3). Figure 4 presents the upper quintile and shows that the most highly ranked causes are related to resource markets, contractor insolvency, and supply-chain disruption. The most prominent cause is escalation in resource prices, including construction materials, equipment, and labor (RII = 18.10), followed by shortage of specialized materials on the local market (RII = 18.01). Both exceed the mean RII by more than two standard deviations, indicating a structural vulnerability in the sector to fluctuations in supply and demand. This finding is consistent with work that identifies inflation and material-price escalation as a primary, and often underweight, driver of construction cost overrun [55].
Figure 2.
Correlations between severity index, probability, and relative importance of cost overruns.
Figure 3.
Matrix of severity index, probability, and relative importance of cost overruns.
Figure 4.
Risk Importance Index for the top 20 percent of causes (35 of 173), ordered from highest to lowest.
Immediately below the top two, contractor financial difficulties (RII = 16.21), labor shortages including engineers (RII = 15.70), and delays in subcontractor work (RII = 15.50) together suggest that the dominant determinant of cost performance is the contractor’s capacity and financial robustness rather than any inherent technical deficiency.
The remaining causes in the upper quintile follow the same logic: slow preparation of drawings and material samples (RII = 15.48), damage to marine equipment during execution due to inadequate safety (RII = 15.34), delay in site delivery to the contractor (RII = 15.34), exceptionally low bids (RII = 15.01), and selection of inappropriate contractors (RII = 14.99). These elements delineate the critical interface among procurement decisions, organizational capacity, and site-level operations. Aggressive low-bid practices and suboptimal contractor selection introduce systemic vulnerabilities into the project delivery framework, whereas delays in site handover and in the provision of technical documentation disrupt the timely mobilization and allocation of resources. Inappropriate safety performance further exacerbates the risk of the project by directly contributing to equipment damage and increasing the costs associated with safety measures and risk mitigation.
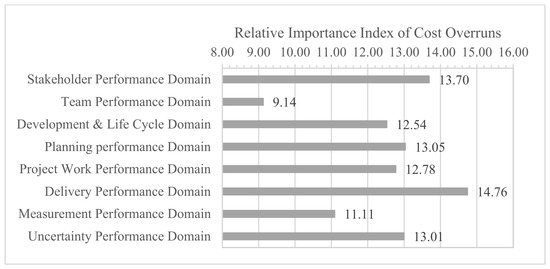
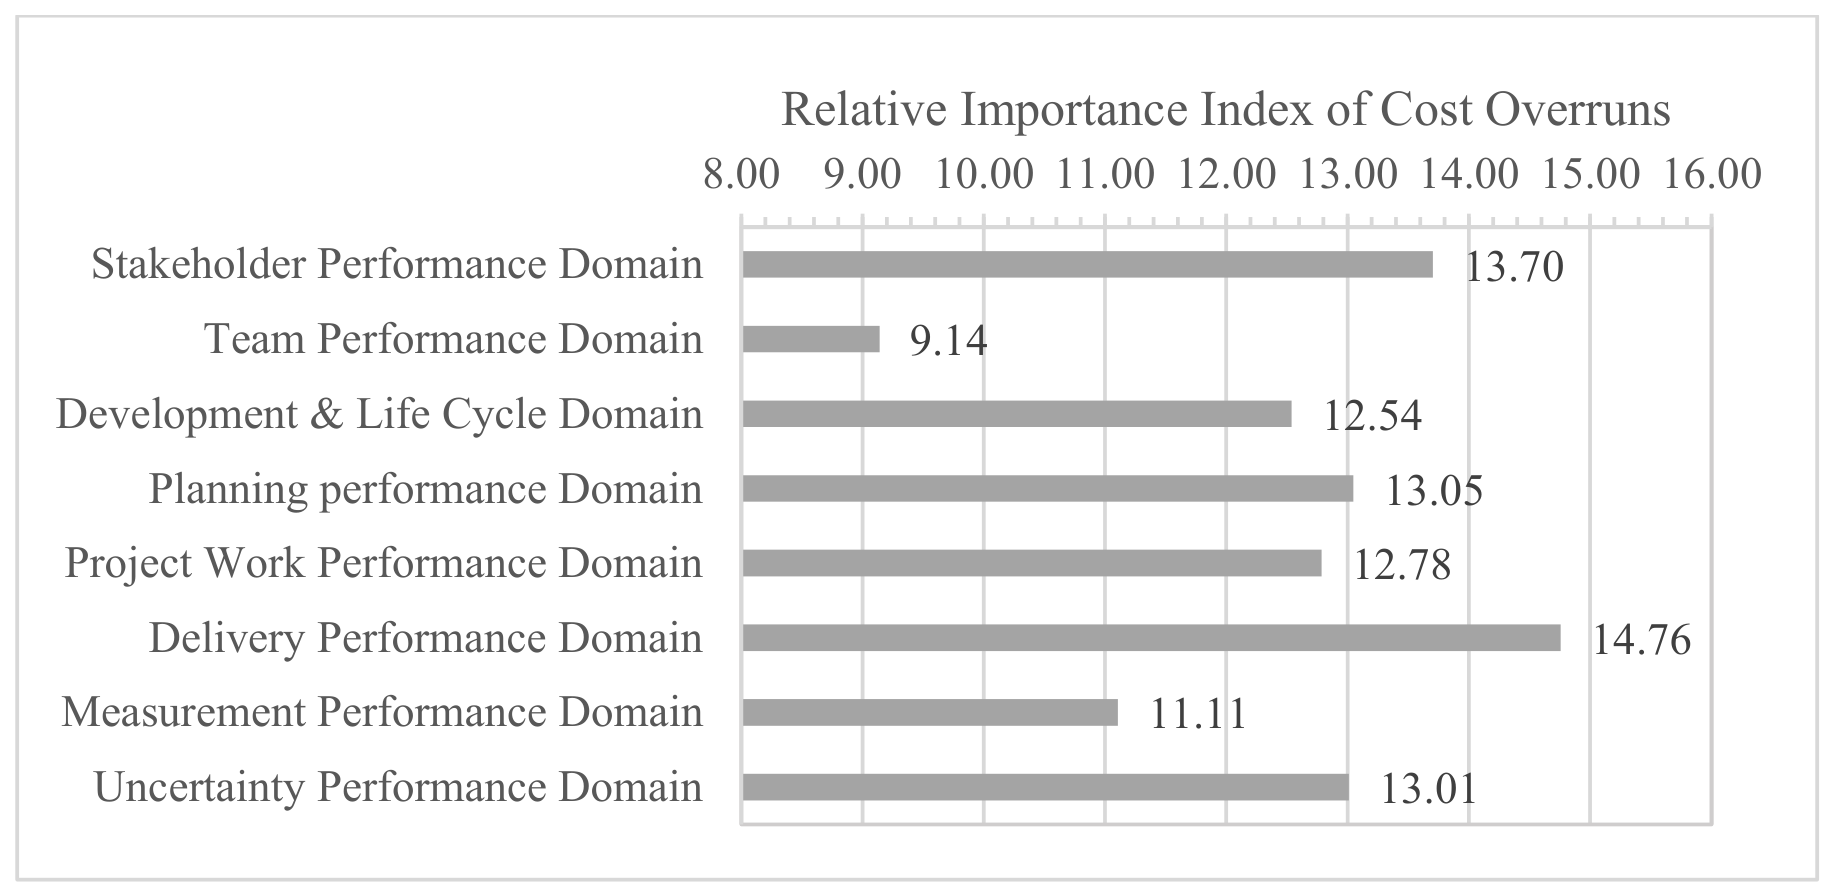
At the domain level (Figure 5), the Delivery domain is the most influential cost-related category (mean RII = 14.76), followed by Stakeholder (13.70), Planning (13.05), Uncertainty (13.01) and Project Work (12.78). Development and Life Cycle (12.54) and Measurement (11.11) show moderate effects, while Team records a much lower mean RII of 9.14. The reading is that procurement, subcontracting, and resource factors directly and heavily impact project cost, whereas team factors act more indirectly, through their effect on productivity and rework.
Figure 5.
RII of domains of cost overruns in marine construction projects.
4.4.2. Monte Carlo Simulation Method
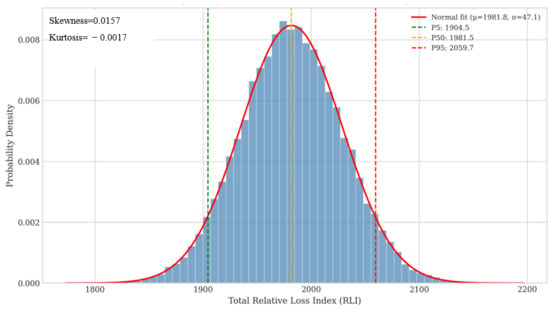
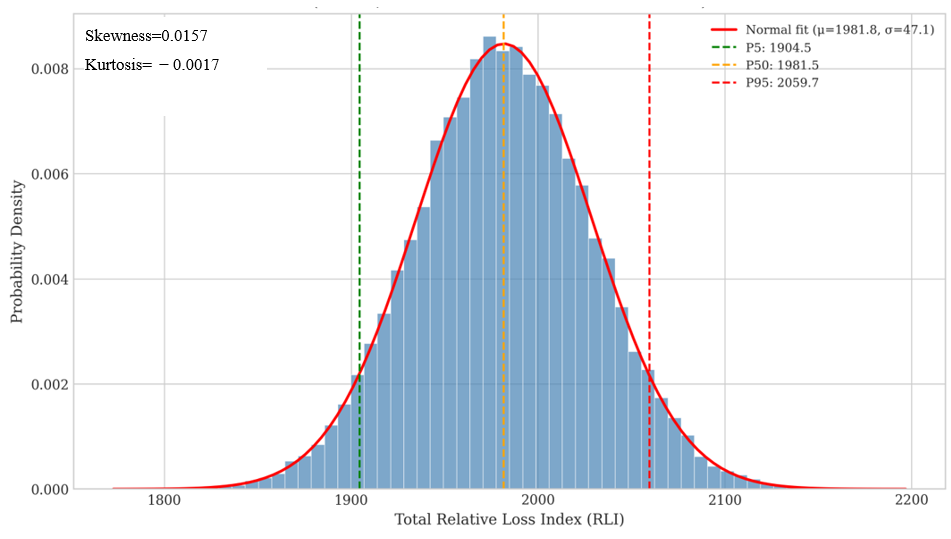
This subsection addresses the second component of the research question (c), namely: the stability of the ranking under stochastic treatment. It presents a detailed evaluation of the determinants of cost overruns in marine construction using a Monte Carlo simulation. The configuration of the Monte Carlo model is summarized in Table 5. The resulting probability distribution of the total RLI is depicted in Figure 6. This distribution is symmetric, unimodal, and exhibits strong correspondence to a Gaussian distribution.
Table 5.
Monte Carlo simulation configuration.
Figure 6.
Distribution of simulated Total Relative Loss Index for cost overrun.
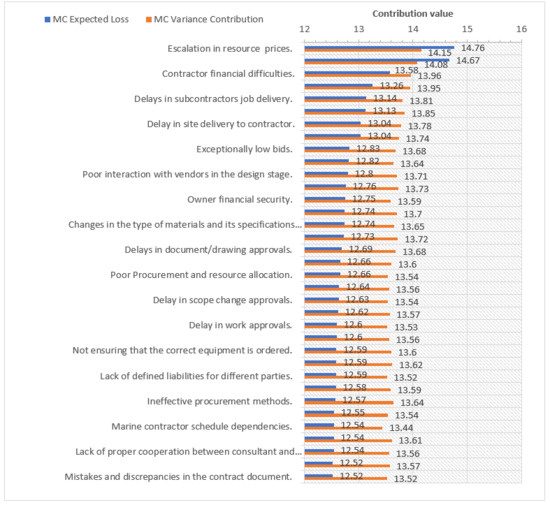
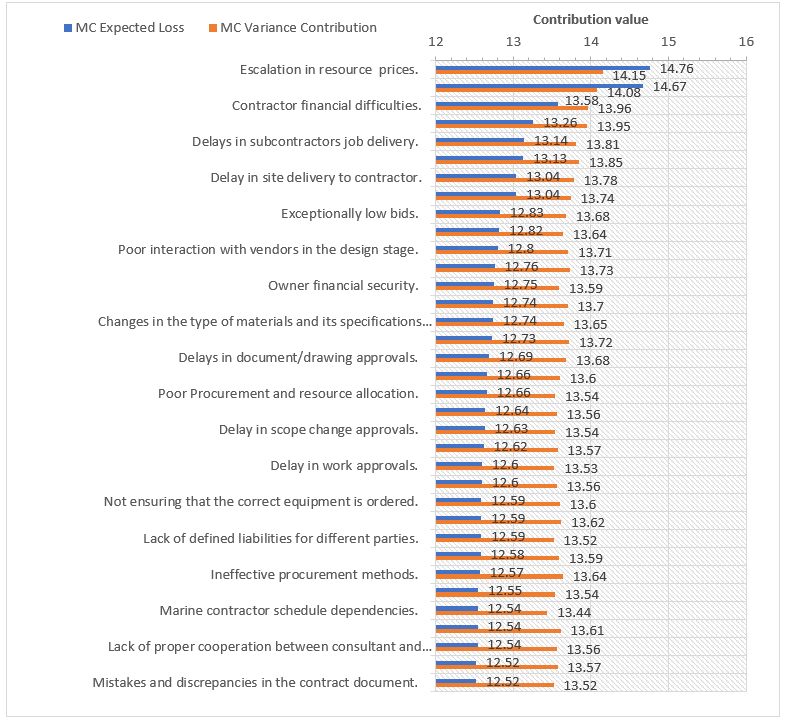
Figure 7 indicates that “escalation in the prices of resources (materials, equipment and labor)” is expected to lead to a loss of RLI of 14.76, underscoring the substantial influence of volatility in the material and labor markets on cost overruns in coastal construction projects. The five main contributors to cost overruns are “special materials shortage in the local market” (14.67), “contractor financial difficulties” (13.58), “labor shortages” (13.26) and “delays in the delivery of subcontractor jobs” (13.14). These results demonstrate that the dominant drivers of cost overruns in marine construction are supply-chain disruptions and contractor-related financial difficulties.
Figure 7.
Top 20 percent of causes of cost overruns in marine construction projects using MC simulation.
The comparative evaluation of factor significance obtained using the RII and Mc methods demonstrated that the Spearman rank correlation coefficient (ρ = 0.999) reached its theoretical maximum. Consequently, in this case, the comparison of factor importance based on the deterministic RII index and on the expected loss, which incorporates an element of stochasticity, produces almost identical ordinal rankings. This concordance of results is of substantial practical relevance. Of a total of 173 factors, 118 (68.2%) receive identical ranks according to both approaches, while the remaining 55 factors differ in rank by no more than three positions in either direction.
There is one major limitation of this concordance that requires special mention. Given that both methods utilize the same sets of probability and impact estimates, the level of agreement should be interpreted as an indication of the ranking’s stability within the stochastic framework rather than as an indication that the ranking concords with an independent evidentiary base. Under this interpretation, the simulation increases our confidence in the relative ordering of the factors, but the simulation does not provide an external validation of the criticality assessments; both methods use the same probability and impact estimates; therefore, agreement between the methods shows that the ranking is not a result of point estimates and nothing more. The role of external comparison is documented in Section 4.5. The two approaches exhibit particularly strong agreement for the highest-priority factors, several of which must be identified with maximal precision to support effective management and decision-making.
The two methods identified the same ten most important factors, with slight differences in order. Escalation in resource prices was identified as the most important cause in both methods, followed by the shortage of special materials in the local market and the financial difficulties of contractors. The only substantive change was in the case of damage to marine equipment during execution due to lack of safety and the delay in site delivery to the contractor. The two factors changed places in the two methods but remained in the highest critical group.
4.4.3. Correlation Between Causes of Cost Overruns
This subsection addresses research question (d), which concerns the interrelationships among causal factors across different performance domains.
An analysis of the 173 factors across domains shows that most pairs correlate positively: a project that scores high on one cost-overrun cause tends to score high on several others, which marks a high-risk rather than a low-risk environment.
Several strong associations cross domain boundaries. A factor in the Stakeholder domain, legal disputes between project participants, and one in the Planning domain, poor planning and management of the contractor’s schedule, correlate at r = 0.96. One reading is that weak scheduling practice and contractual disputes tend to co-occur: an absent or ineffective scheduling system can precipitate claims and conflict, and an adversarial environment can in turn degrade scheduling. A second pair links undefined contract liabilities in the Delivery domain with resource-price increase in the Uncertainty domain at r = 0.94, which suggests that where contracts do not clearly allocate the risk of cost escalation, projects are more exposed to realized increases in material or resource prices.
No strong negative correlations appeared. The most negative value was about −0.38, between inappropriate scope comprehension at bidding and delay in work approvals, a weak association at most. In practical terms, projects tend to accumulate several cost-overrun sources at once rather than trade one against another.
4.5. Documented Project Outcomes
Marine construction projects of the public and private sectors located in Egypt (n = 37, 62.71%), Saudi Arabia (n = 9, 15.25%), the United Arab Emirates (n = 6, 10.17%), Kuwait (n = 3, 5.08%), Qatar (n = 3, 5.08%), and Oman (n = 1, 1.69%), as well as 59 projects, were reviewed. Data were coded against the 173 surveyed factors. Knowing what exists allows project drivers to be extracted from the data rather than inferred.
Lead contracts ranged from USD 0.2 million to USD 1.9 billion (mean ≈ USD 237 million, median USD 25 million) within a strongly right-skewed distribution. Durations ranged from 4 months to 72 months (average 27 months) and were comparatively close to symmetric. Two features of this composition will bound the subsequent discussion. There are few megaprojects in the sample. Therefore, the observed range of overrun is more constrained than the upper tail of very large infrastructure where final cost has been reported to be several multiples of the original estimate [7]. Furthermore, because cost overun is defined at the time the contract is awarded rather than at the estimate to proceed with the project, the percentages reported are smaller than those in the literature. The findings that will follow are not influenced by the size of the average.
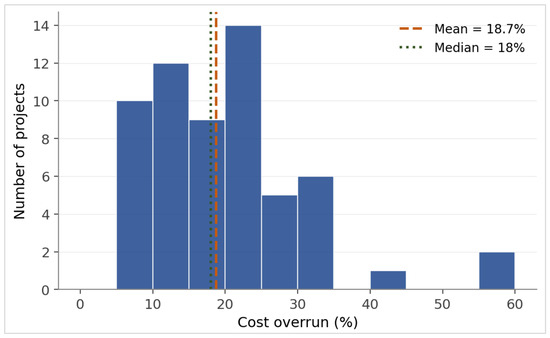
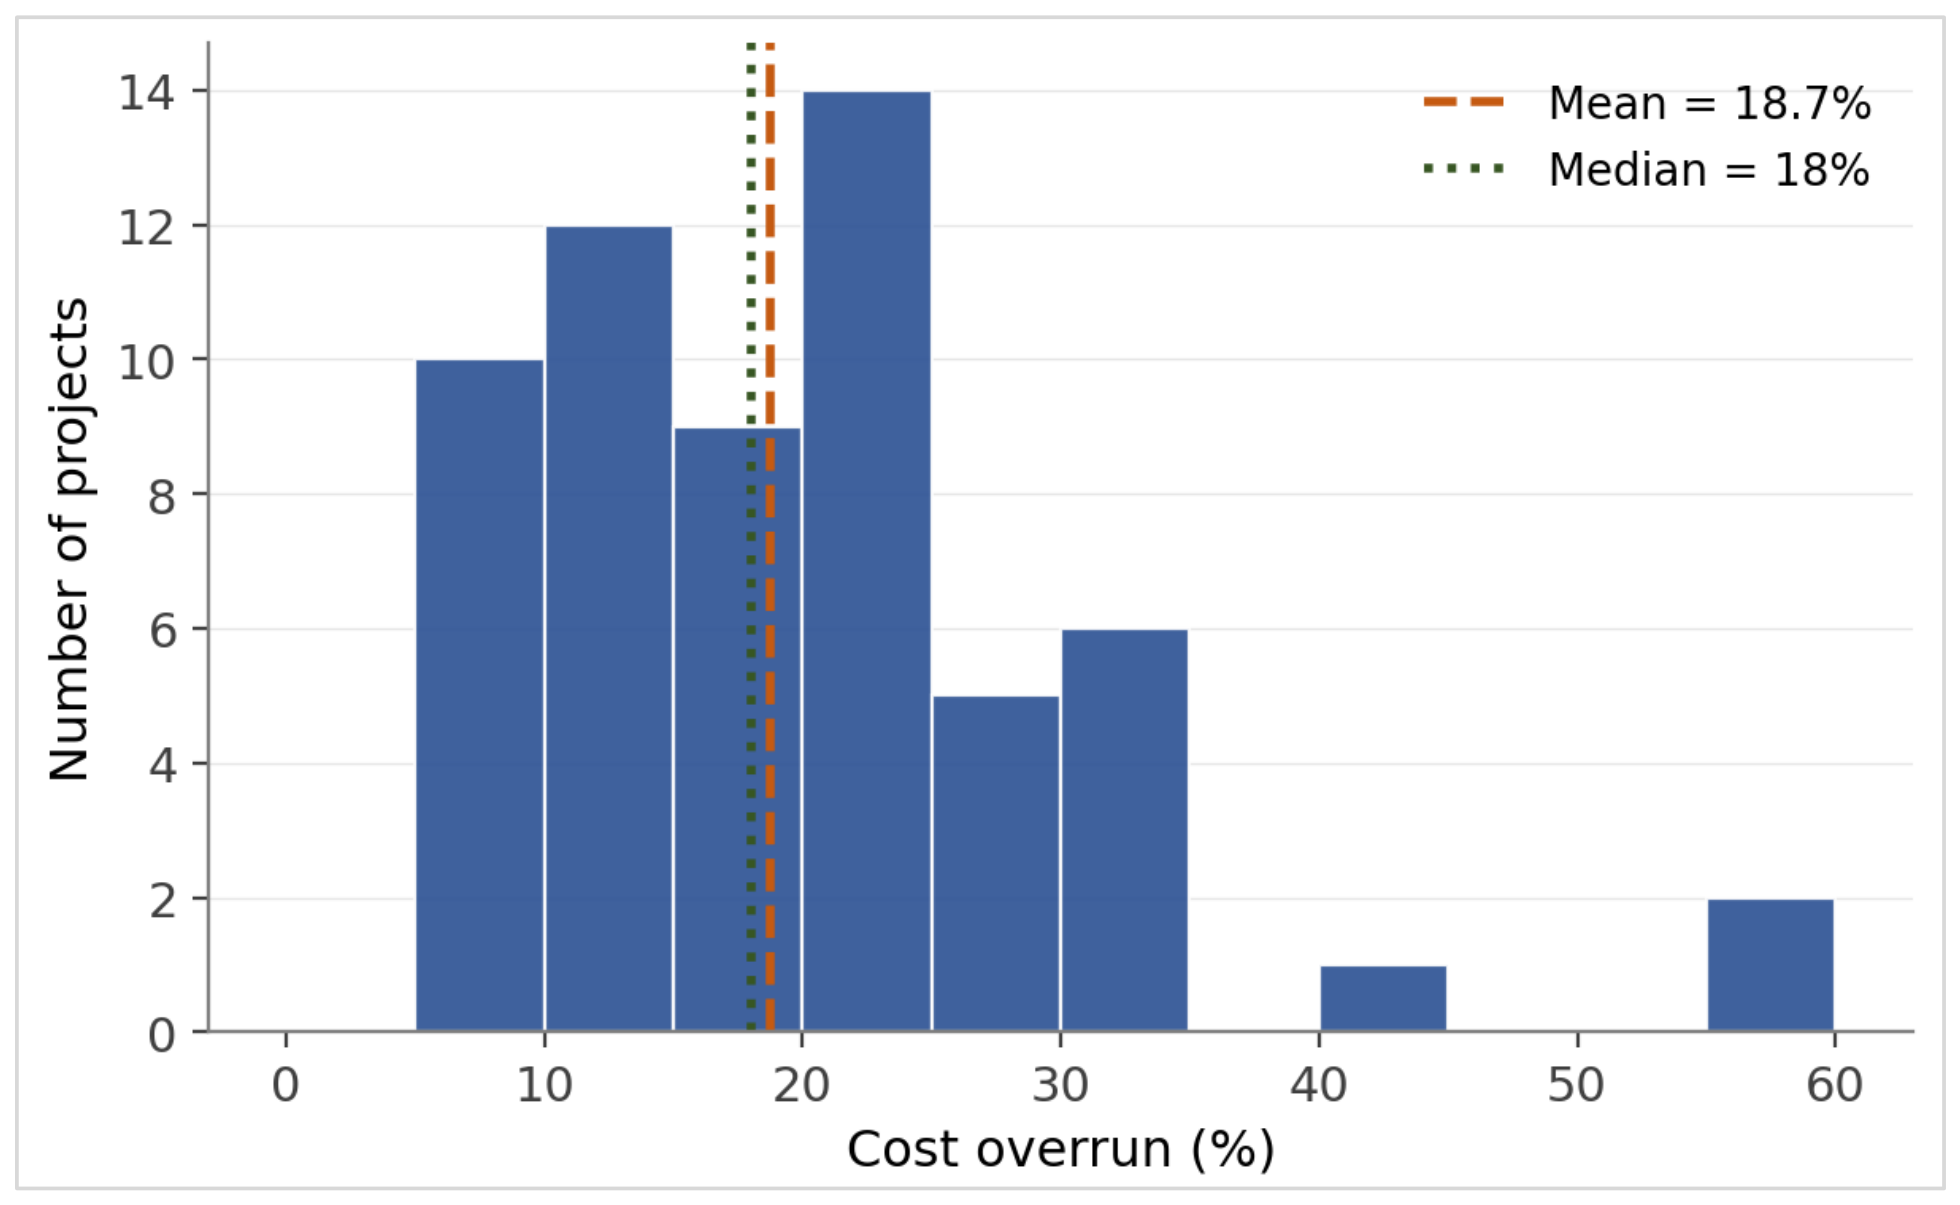
Overruns were documented in the range of 5% to 60% (Figure 8) and were positively skewed. The mean and median were 18.7% and 18.0% respectively with a standard deviation of 11.0%. Of the 59 projects, 46 (78%) were concentrated in the range from 10% to 35% overrun. The upper tail was thin, with 14 projects (23.7%) overrunning by 25% or more and 2 (3.4%) by 50% or more. The Ain Sokhna Port Development in Egypt and the Marine Facilities Upgrading Project in Kuwait are considered to be medium-sized projects by regional standards and both exhibited severe overrun of 60% and 55% respectively. These two examples also exhibit a large number of co-occurring factors, a point that will be discussed in the subsequent section.
Figure 8.
Project distribution according to cost overrun (%).
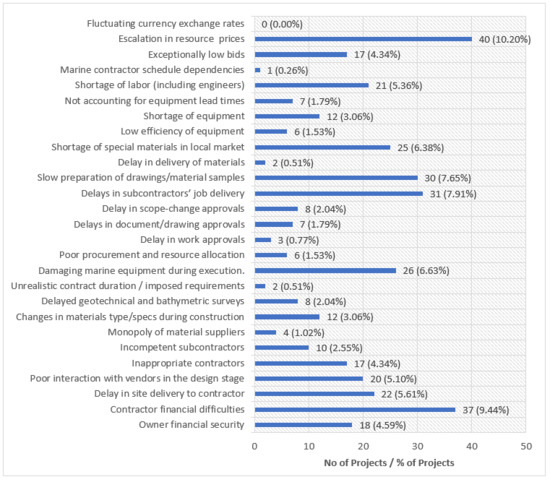
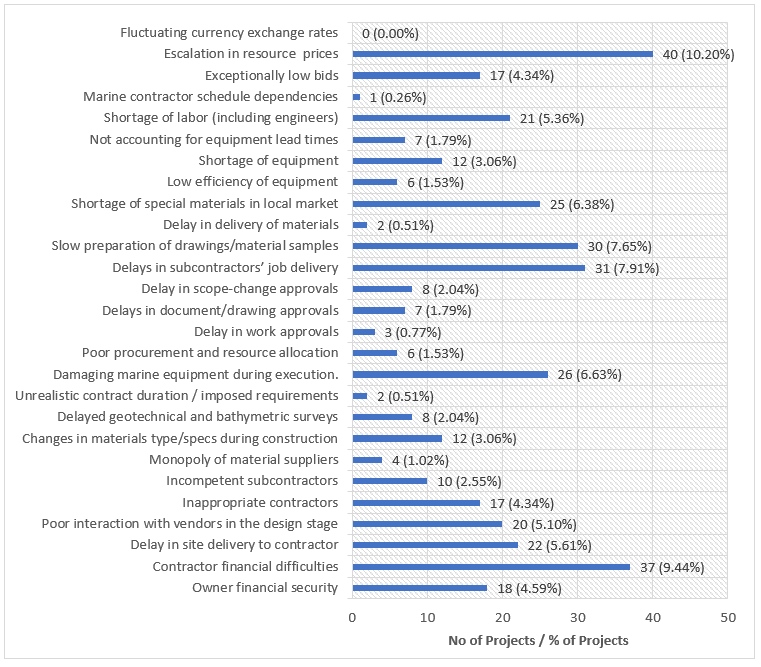
The documented citations concentrate where the perception ranking said they would. The most frequently recorded causes are largely the same ones the criticality index ranked highest (Figure 9). By domain, Delivery leads with 176 citations (44.9% of all marks), followed by Stakeholder with 128 (32.7%) and Uncertainty with 40 (10.2%); Project Work (26, 6.6%) and Planning (22, 5.6%) trail. The modest share of the Uncertainty domain is itself informative: the physical conditions of marine work, weather, sea state, and coastal erosion, together with permitting delays, register mainly as schedule risks rather than as direct drivers of cost escalation.
Figure 9.
Project frequency according to factors of cost overruns.
Linking Factor Presence with Documented Cost-Overrun Outcomes
This subsection addresses the research question (e). Criticality rankings in this field are almost entirely based on expert judgment. The documented record allows an independent check to see if the causes deemed critical are indeed associated with the money-loss projects. Applying the procedure in Section 3.6.6, only 26 of the 173 cataloged causes are contained in the project record, so the comparison is limited to the causes that are realized in this sample and ignores the rest.
By themselves, the characteristics of the project explain very little. The attribute benchmark, Equation (9) without the cause-count term, yields an R2 value of 0.263 (adjusted 0.161), and neither the contract value nor the contract duration are significant at 5% level (Table 6). Contract value becomes significant when cause count is controlled (Table 6; ln contract value = −2.21, p < 0.001). Larger projects report more causes (r = 0.36 between log contract value and cause count) and, for a given cause count, overrun a smaller percentage of the contract value, explaining the null result for attributes by themselves. This reflects two offsetting tendencies rather than the absence of any scale effect.
Table 6.
Regression of documented cost overrun (%) on project attributes and cause count (HC1 robust standard errors).
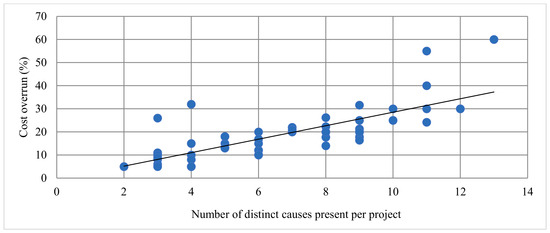
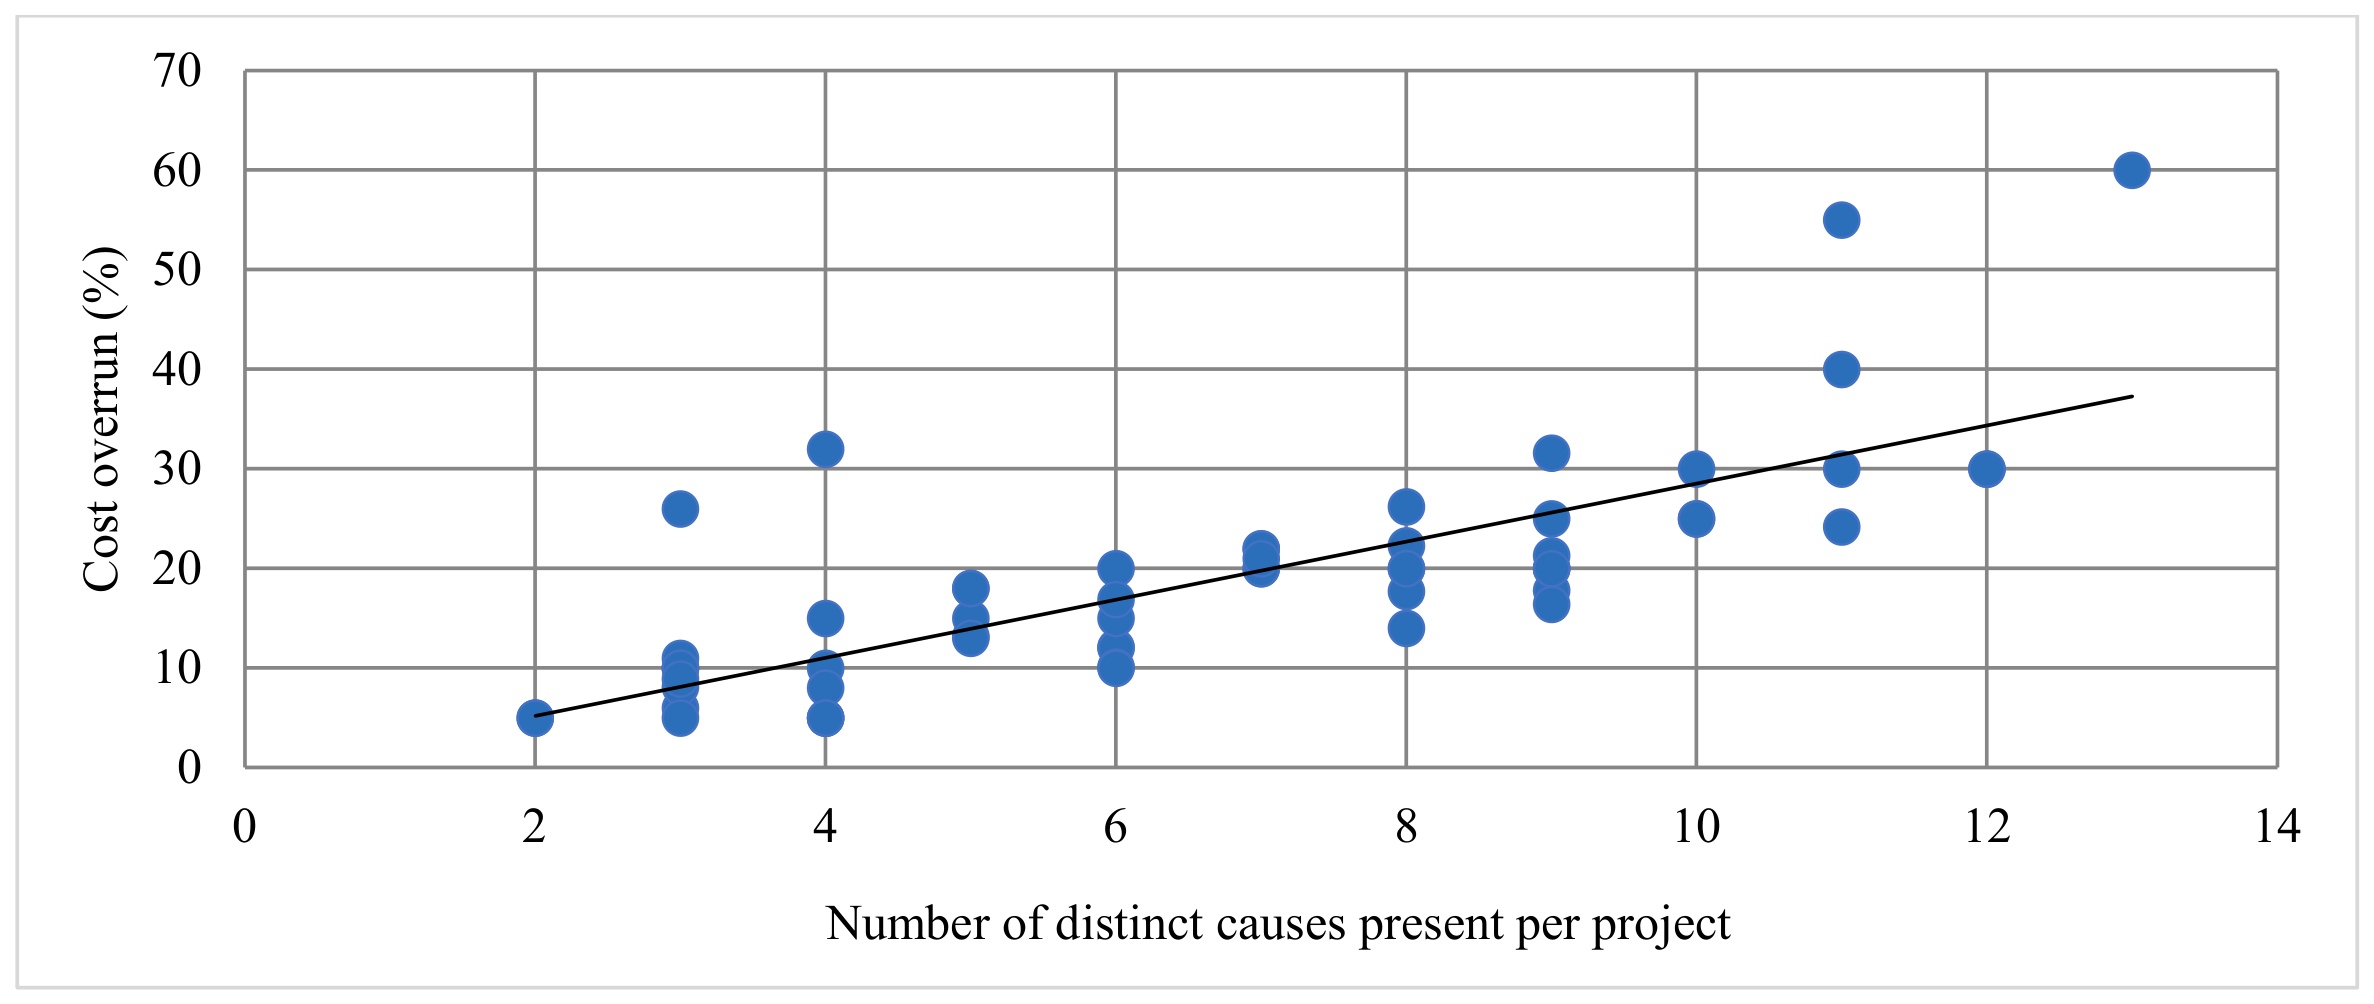
Instead of tracking the breadth of co-occurring causes, Overrun focuses on the size of the overrun. The number of distinct causes present increases monotonically with the size of the overrun (Spearman’s ρ = 0.79; Equation (8)). In its own right, that count explains 60% of the variance (R2 = 0.598; 2.92 points per cause; the fitted line in Figure 10). Restoring the cause-count term in Equation (9) improves the fit to R2 = 0.769. In this context, one additional documented cause is associated with an increase of about 3 percentage points in overrun (3.40, 95% CI 2.44 to 4.36). The association is not due to the two most extreme projects. Excluding the 55% and 60% cases, the coefficient is 2.84 (95% CI 2.36 to 3.31) with country fixed effects, and 2.71 (2.27 to 3.15) with an Egypt-versus-the-Gulf specification. It is reported as roughly 2.7 to 3.4 points across specifications. With 59 projects and six country effects, the degrees of freedom available to the fixed-effects specification are limited, so the Egypt-versus-the-Gulf model is read as an essential robustness check standing on an equal footing with the fuller model, not as a simplification of a preferred specification. The direction of the association is undefined: a larger overrun may itself generate more claims, investigations, and recorded causes. Count and severity strengthen one another in the record. Diagnostics are in Table 6: the maximum variance inflation factor is 4.02 and the Breusch–Pagan test does not reject constant variance (p = 0.389), and residuals depart from normality (Jarque–Bera p < 0.001); as a precaution for a bounded, right-skewed dependent variable in a sample of this size, I reported all estimates using robust standard errors throughout.
Figure 10.
Documented cost overrun against the number of distinct causes present per project.
The contrast between the two specifications is the substantive result: attributes explain a quarter of the variance; the breadth of co-occurring causes three-quarters. Overrun here is compositional rather than scalar. Its size reflects how many separate failure mechanisms accumulate in one project, not how large or how long that project is. Flyvbjerg et al. [15] reach a related conclusion, finding overrun magnitude weakly tied to project size once other factors are held constant, and the result sits with the broader view that interacting deficiencies, rather than any single dominant cause, drive performance loss in complex projects [8,56]. The three-point gradient is a local average, not a fixed rate: a linear term cannot capture the saturation and interaction that set in once many causes coincide.
At the domain level, as captured in the documented record, perceptions reflect the ranking. When considering what is overrun, the highest association is with the causes of delivery (r = 0.62). This is followed by the stakeholder (0.57), Uncertainty (0.48) and Planning (0.36). The same order is found in the criticality index and therefore strongly supports the domain ranking in Section 4.4. All four are still significant after the Benjamini–Hochberg control in the five domain tests (adjusted p ≤ 0.006). The Project Work (r = 0.23) is not significant (adjusted p = 0.083).
The frequency of a cause and its consequence are not the same, and the record separates them. The systemic causes are the market drivers that shift the distribution of the outcomes. Marine-related causes are rare and occur with the largest overruns. Different responses are required—contractual and procurement solutions for the first and front-end technical investments for the second. Table 7 shows the distinctions and includes 95% confidence intervals and Benjamini–Hochberg adjusted p-values for the 26 observed causes, of which nine survive correction. Associations that do not survive the correction are treated as exploratory.
Table 7.
Present-versus-absent contrasts for the leading causes (adjusted p from Benjamini–Hochberg control over 26 tests).
Among 59 projects, 40 have this cause (Escalation in resource prices), and it is a clear marker: the average overrun is 22.3% for those projects, compared to 11.1% for the others (difference 11.2 points, 95% CI 6.7 to 15.7; r = 0.48; adjusted p = 0.0015; and Equation (10)). An inappropriate contractor raises the mean from 15.4% to 27.0% (r = 0.48, adjusted p = 0.0015). Weak owner financial security means the overrun is on average 25.2% (r = 0.40, adjusted p = 0.013). Unfortunately, financial issues of the contractor, although occurring in 37 of the 59 projects, are of no practical significance in the final analysis (r = 0.26, adjusted p = 0.108) and are also treated as exploratory.
Only eight projects reference delayed geotechnical and bathymetric surveys, the marine-specific planning case, with an average of 28.1%, compared to 17.3% in the rest of the cases. The point estimate is large, but the uncertainty is large as well. The difference of 10.8% would indicate significance in an equal variance test implied by Equation (10) (95% CI 2.9 to 18.8; adjusted p = 0.027) but would not indicate significance in the Welch’s test (p = 0.163), and the bootstrap interval would include zero (−1.0 to 24.3). Group variances differ by a factor of five, and this is the source of the apparent conflict between the two results: the point-biserial statistic and its adjusted p-value assume a common variance, which understates uncertainty when the smaller group is also the more variable one, whereas the Welch test and the bootstrap allow the variances to differ and are the safer guides here. This contrast will therefore be reported as suggestive and will not be taken as an established finding. A larger sample of projects which document the timing of surveys would be required to resolve this.
The two most severe cases fit the same reading. The Ain Sokhna Port Development (60% overrun, thirteen co-occurring causes) and the Kuwait Marine Facilities Upgrading Project (55%, eleven causes) contain some of the most densely occupied causes in the sample, combining contractor financial problems and delivery schedule compression, along with several delivery-related failures. They are located at the top of the same distribution, rather than being located apart from it.
Within the bounds set out in Section 3.6.6 and on a regional sample in which Egyptian projects predominate, the record shows what perception data alone cannot: which cataloged causes actually accompany the projects that overran.
5. Conclusions
This study sets out to map the association structure behind cost overrun in marine construction, a field where cost anomalies are common but poorly understood. Working from 173 causes drawn through a structured literature synthesis and a three-round Delphi consensus and organized within the eight performance domains of PMBOK-7, the analysis combined several methods: a probability–impact criticality index, a Monte Carlo simulation of 50,000 iterations, nonparametric perception tests with false-discovery-rate control, and triangulation against 59 documented projects. The methods converged. The deterministic and stochastic grades agreed almost exactly (Spearman’s ρ = 0.999), and the inferred criticality structure was consistent with the subset of projects that overran, for the 26 causes that appear in the record.
Four findings carry the most weight. First, cost overruns concentrate on the Delivery domain and in market-driven causes: escalation in resource prices, shortage of specialized materials in the local market, and contractor financial difficulty lead the perception ranking, and these are procurement and financial matters rather than questions of marine engineering. Second, external conditions of marine work, the sea state, the weather, and the seabed, account for only about a tenth of the cost-related evidence in the project record; they register mainly as schedule risks. Third, the documented record separates frequency from consequence. Project attributes on their own did not predict overrun, but the breadth of co-occurring causes did. Resource-price escalation was the most frequent discriminator of larger overruns and, with contractor-capacity failures, the strongest, while the marine-specific planning failure, delayed geotechnical and bathymetric surveys coincided with the highest overruns of any planning cause; that contrast rests on eight projects and its interval spans zero under conservative tests, so it stands as a lead for further study rather than a result. Fourth, perception of risk varied more with the rater’s experience than with their role, a conclusion now resting on a two-way model in which the two factors are close to independent: experienced staff assigned higher impacts and lower probabilities, a pattern compatible with, though not a test of, prospect theory and reference dependence [54].
The practical reading is direct. In import-dependent high-inflation markets, owners and contractors should prioritize price-escalation clauses, vetted supply chains, and thorough solvency screening of bidders over standard technical contingency. The evidence on early geotechnical and bathymetric investigation is suggestive rather than settled, but its direction and the asymmetry of the stakes, a certain survey cost against a possible large overrun, favor treating such surveys as a cost-control measure rather than an overhead until better evidence is available.
Risk-assessment panels should combine senior and junior members because the two groups tend to focus on different things. As a result, the overall risk profile tends to be more accurate.
The evidence is regional, covering Egypt and the Gulf, and is shaped by a period of acute currency volatility, especially in Egypt, that amplified market-related causes, so transfer to stable-currency settings should be cautious. Cause presence was coded after the fact, so the associations diagnose rather than establish causation, and the number of causes recorded for a project may reflect both its actual complexity and the intensity with which it was documented, since projects with larger overruns tend to generate more claims, investigations, and records.
The Monte Carlo agreement is a check of internal robustness, not of predictive power, because both rankings rest on the same elicited estimates. Perception tests were read only after false-discovery-rate control, which guards against, but cannot eliminate, spurious findings among 346 simultaneous comparisons.
Those limits describe the next actions. A documented dataset makes a predictive turn possible. Linking the size of cost overrun to the presence of the causes and the project attributes in a larger, multi-region sample will transform this diagnostic tool into a predictive tool and assess whether the frequency–consequence gap present in this study exists elsewhere. Following this revision, two other steps exist: an independent recoding of a subsample of projects to determine inter-rater reliability, and a reclassification of the 173 causes under the eighth edition of the PMBOK Guide [57], whose Finance and Resources domains may fit the market-driven causes that feature predominantly in these results more appropriately than the seventh edition. The marine sector is not without risk registers. It is more constrained by the lack of appreciable analytical frameworks to define the risks and conditions under which these risks will become significant material financial losses.
Author Contributions
Conceptualization, A.M.E. and A.H.N.; methodology, A.M.E.; investigation, A.M.E.; formal analysis, A.M.E.; visualization, A.M.E.; writing—original draft preparation, A.M.E.; writing—review and editing, A.H.N.; supervision, A.H.N. All authors have read and agreed to the published version of the manuscript.
Funding
This research received no external funding.
Institutional Review Board Statement
According to the German University in Cairo policy, ethical review was not required for this study because it involved no procedures subject to institutional ethics review.
Informed Consent Statement
Not applicable.
Data Availability Statement
The data presented in this study are available on reasonable request from the corresponding author. The questionnaire instrument, the anonymized survey responses, and the coded project-outcome dataset are not publicly archived because they contain commercially sensitive project records.
Conflicts of Interest
The authors declare no conflicts of interest.
References
- Johnson, K.D.; Tatum, C.B. Technology in marine construction firms. J. Constr. Eng. Manag. 1993, 119, 148–162. [Google Scholar] [CrossRef] [Scilit]
- Tam, V.W.Y.; Shen, L.Y. Risk management for contractors in marine projects. Organ. Technol. Manag. Constr. Int. J. 2012, 4, 403–410. [Google Scholar] [CrossRef] [Scilit][Green Version]
- Chidambaram, R.; Narayanan, S.P.; Idrus, A.B. Construction delays causing risks on time and cost-a critical review. Australas. J. Constr. Econ. Build. 2012, 12, 37–57. [Google Scholar] [CrossRef] [Scilit]
- Ruqaishi, M.; Bashir, H.A. Causes of delay in construction projects in the oil and gas industry in the gulf cooperation council countries: A case study. J. Manag. Eng. 2015, 31, 5014017. [Google Scholar] [CrossRef] [Scilit]
- Shrivas, A.; Singla, H.K. Factors causing delay in marine construction projects in India. I-Manag. J. Civ. Eng. 2018, 8, 12. [Google Scholar] [CrossRef] [Scilit]
- Flyvbjerg, B.; Holm, M.S.; Buhl, S. Underestimating costs in public works projects: Error or lie? J. Am. Plan. Assoc. 2002, 68, 279–295. [Google Scholar] [CrossRef] [Scilit]
- Flyvbjerg, B. What you should know about megaprojects and why: An overview. Proj. Manag. J. 2014, 45, 6–19. [Google Scholar] [CrossRef] [Scilit]
- Olawale, Y.A.; Sun, M. Cost and time control of construction projects: Inhibiting factors and mitigating measures in practice. Constr. Manag. Econ. 2010, 28, 509–526. [Google Scholar] [CrossRef] [Scilit]
- Al-Mhdawi, M.K.S.; O’Connor, A.; Qazi, A. Structural equation modeling and Fuzzy set theory: Advancing risk assessment in oil and gas construction projects. Environ. Impact Assess. Rev. 2024, 109, 107622. [Google Scholar] [CrossRef] [Scilit]
- Mahdi, I.; Abdelkhaliq, A.M.; Hassan, H.M.; Tolba, E.R.; Raed, L. Impact of Project Delivery Methods on Lifecycle Risk Management of Offshore Projects. Port-Said Eng. Res. J. 2024, 28, 15–24. [Google Scholar]
- Rivera, A.; Kashiwagi, J. Identifying the state of the project management profession. Procedia Eng. 2016, 145, 1386–1393. [Google Scholar] [CrossRef] [Scilit]
- Bugnot, A.B.; Mayer-Pinto, M.; Airoldi, L.; Heery, E.C.; Johnston, E.L.; Critchley, L.P.; Strain, E.M.A.; Morris, R.L.; Loke, L.H.L.; Bishop, M.J. Current and projected global extent of marine built structures. Nat. Sustain. 2021, 4, 33–41. [Google Scholar] [CrossRef] [Scilit]
- Pinto, J.K.; Slevin, D.P. Critical success factors across the project life cycle. Proj. Manag. J. 1988, 19, 67–75. [Google Scholar]
- Flyvbjerg, B. Cost overruns and demand shortfalls in urban rail and other infrastructure. Transp. Plan. Technol. 2007, 30, 9–30. [Google Scholar] [CrossRef] [Scilit]
- Flyvbjerg, B.; Skamris Holm, M.K.; Buhl, S.L. What causes cost overrun in transport infrastructure projects? Transp. Rev. 2004, 24, 3–18. [Google Scholar] [CrossRef] [Scilit]
- Flyvbjerg, B. Survival of the unfittest: Why the worst infrastructure gets built—And what we can do about it. Oxf. Rev. Econ. Policy 2009, 25, 344–367. [Google Scholar] [CrossRef] [Scilit]
- Kaliba, C.; Muya, M.; Mumba, K. Cost escalation and schedule delays in road construction projects in Zambia. Int. J. Proj. Manag. 2009, 27, 522–531. [Google Scholar] [CrossRef] [Scilit]
- Yap, J.B.H.; Chow, I.N.; Shavarebi, K. Criticality of construction industry problems in developing countries: Analyzing Malaysian projects. J. Manag. Eng. 2019, 35, 4019020. [Google Scholar] [CrossRef] [Scilit]
- Schuldt, S.J.; Nicholson, M.R.; Adams, Y.A.; Delorit, J.D. Weather-related construction delays in a changing climate: A systematic state-of-the-art review. Sustainability 2021, 13, 2861. [Google Scholar] [CrossRef] [Scilit]
- Aljohani, A. Cost Overrun Causality Model in Saudi Arabian Public Sector Construction Projects. Ph.D. Thesis, Robert Gordon University, Aberdeen, UK, 2019. [Google Scholar]
- Allahaim, F.S.; Liu, L. Causes of cost overruns on infrastructure projects in Saudi Arabia. Int. J. Collab. Enterp. 2015, 5, 32–57. [Google Scholar] [CrossRef] [Scilit]
- Rashed, E.F.; Shaqour, E.N. Factors causing cost overrun in administrative construction projects of Egypt. J. Eng. Appl. Sci. 2014, 61, 199–215. [Google Scholar]
- Khodeir, L.M.; Mohamed, A.H.M. Identifying the latest risk probabilities affecting construction projects in Egypt according to political and economic variables. From January 2011 to January 2013. HBRC J. 2015, 11, 129–135. [Google Scholar] [CrossRef] [Scilit]
- Yakoub, W. New Approach to Control the Cost of Construction Projects in Egypt. Unpublished Master’s Thesis, Port Said University, Port Said, Egypt, 2016. [Google Scholar]
- Sha’ar, K.Z.; Assaf, S.A.; Trigunarsyah, B.; Babsail, M.; Fattah, A.A.E. Design–construction interface problems in large building construction projects. Int. J. Constr. Manag. 2017, 17, 238–250. [Google Scholar] [CrossRef] [Scilit]
- Elawi, G.S.A.; Algahtany, M.; Kashiwagi, D. Owners’ perspective of factors contributing to project delay: Case studies of road and bridge projects in Saudi Arabia. Procedia Eng. 2016, 145, 1402–1409. [Google Scholar] [CrossRef] [Scilit]
- Kassem, M.A.; Khoiry, M.A.; Hamzah, N. Assessment of the effect of external risk factors on the success of an oil and gas construction project. Eng. Constr. Archit. Manag. 2020, 27, 2767–2793. [Google Scholar] [CrossRef] [Scilit]
- El Shehabya, M.; Abdel-Hamidb, M.; El-Dashc, K. Risk Assessment for Off-Shore Petroleum and Gas Construction Projects in Egypt. Eng. Res. J. (Shoubra) 2022, 51, 61–74. [Google Scholar] [CrossRef] [Scilit]
- Kumar, S.; Thakkar, J.J. Schedule and cost overrun analysis for R&D projects using ANP and system dynamics. Int. J. Qual. Reliab. Manag. 2017, 34, 1551–1567. [Google Scholar] [CrossRef] [Scilit]
- Rui, Z.; Cui, K.; Wang, X.; Chun, J.-H.; Li, Y.; Zhang, Z.; Lu, J.; Chen, G.; Zhou, X.; Patil, S. A comprehensive investigation on performance of oil and gas development in Nigeria: Technical and non-technical analyses. Energy 2018, 158, 666–680. [Google Scholar] [CrossRef] [Scilit]
- Durdyev, S. Review of construction journals on causes of project cost overruns. Eng. Constr. Archit. Manag. 2021, 28, 1241–1260. [Google Scholar] [CrossRef] [Scilit]
- Gu, M.; Gudmestad, O.T. Treatment of uncertainties, risks and opportunities in cost and schedule estimates in the early phases of offshore projects. In Proceedings of the ISOPE International Ocean and Polar Engineering Conference, Rhodes, Greece, 19–24 June 2011. ISOPE-I. [Google Scholar]
- Joubert, F.J.; Pretorius, L. Design and construction risks for a shipping port and container terminal: Case study. J. Waterw. Port Coast. Ocean Eng. 2020, 146, 5019003. [Google Scholar] [CrossRef] [Scilit]
- Nassar, A.; Elbisy, A. Evaluation of Factors Leading to Time Delays and Cost Overruns in Marine Construction Projects. Eng. Technol. Appl. Sci. Res. 2024, 14, 16095–16102. [Google Scholar] [CrossRef] [Scilit]
- Arnold, U.; Yildiz, Ö. Economic risk analysis of decentralized renewable energy infrastructures—A Monte Carlo Simulation approach. Renew. Energy 2015, 77, 227–239. [Google Scholar] [CrossRef] [Scilit]
- Mahdiyar, A.; Tabatabaee, S.; Yahya, K.; Mohandes, S.R. A probabilistic financial feasibility study on green roof installation from the private and social perspectives. Urban For. Urban Green. 2021, 58, 126893. [Google Scholar] [CrossRef] [Scilit]
- Islam, M.S.; Mohandes, S.R.; Mahdiyar, A.; Fallahpour, A.; Olanipekun, A.O. A coupled genetic programming Monte Carlo simulation–based model for cost overrun prediction of thermal power plant projects. J. Constr. Eng. Manag. 2022, 148, 4022073. [Google Scholar] [CrossRef] [Scilit]
- Demirkesen, S.; Ozorhon, B. Impact of integration management on construction project management performance. Int. J. Proj. Manag. 2017, 35, 1639–1654. [Google Scholar] [CrossRef] [Scilit]
- Hoseini, E.; Van Veen, P.; Bosch-Rekveldt, M.; Hertogh, M. Cost performance and cost contingency during project execution: Comparing client and contractor perspectives. J. Manag. Eng. 2020, 36, 5020006. [Google Scholar] [CrossRef] [Scilit]
- Project Management Institute. A Guide to the Project Management Body of Knowledge (PMBOK Guide), 7th ed.; Project Management Institute: Newtown Square, PA, USA, 2021. [Google Scholar]
- McKenna, H.P. The Delphi technique: A worthwhile research approach for nursing? J. Adv. Nurs. 1994, 19, 1221–1225. [Google Scholar]
- Bluman, A.G. A Step by Step Approach, 9th ed.; McGraw-Hill Education: New York, NY, USA, 2014. [Google Scholar]
- Cortina, J.M. What is coefficient alpha? An examination of theory and applications. J. Appl. Psychol. 1993, 78, 98. [Google Scholar] [CrossRef] [Scilit]
- Nunnally, J.C.; Bernstein, I.H. Psychometric Theory, 3rd ed.; McGraw-Hill Series. Psychology; McGraw-Hill Companies: Columbus, OH, USA, 1994. [Google Scholar]
- Montgomery, D. Design Analysis of Experiments; Wiley: New York, NY, USA, 2008; ISBN 978-1-118-14692-7. [Google Scholar]
- Benjamini, Y.; Hochberg, Y. Controlling the false discovery rate: A practical and powerful approach to multiple testing. J. R. Stat. Soc. Ser. B (Methodol.) 1995, 57, 289–300. [Google Scholar] [CrossRef] [Scilit]
- Cohen, J. Statistical Power Analysis for the Behavioral Sciences, 2nd ed.; Lawrence Erlbaum: Hillsdale, NJ, USA, 1998. [Google Scholar]
- Aven, T. Risk assessment and risk management: Review of recent advances on their foundation. Eur. J. Oper. Res. 2016, 253, 1–13. [Google Scholar] [CrossRef] [Scilit]
- Cantarelli, C.C.; Molin, E.J.E.; van Wee, B.; Flyvbjerg, B. Characteristics of cost overruns for Dutch transport infrastructure projects and the importance of the decision to build. Transp. Policy 2012, 22, 49–56. [Google Scholar] [CrossRef] [Scilit]
- White, H. A heteroskedasticity-consistent covariance matrix estimator and a direct test for heteroskedasticity. Econometrica 1980, 48, 817–838. [Google Scholar] [CrossRef] [Scilit]
- Cook, R.D. Detection of influential observation in linear regression. Technometrics 1977, 19, 15–18. [Google Scholar] [CrossRef] [Scilit] [PubMed]
- Efron, B.; Tibshirani, R.J. An Introduction to the Bootstrap; Chapman & Hall: New York, NY, USA, 1994. [Google Scholar]
- Sijtsma, K. On the use, the misuse, and the very limited usefulness of Cronbach’s alpha. Psychometrika 2009, 74, 107–120. [Google Scholar] [CrossRef] [Scilit] [PubMed]
- Kahneman, D.; Tversky, A. Prospect theory: An analysis of decision under risk. In Handbook of the Fundamentals of Financial Decision Making: Part I; World Scientific: Singapore, 2013; pp. 99–127. [Google Scholar]
- Musarat, M.A.; Alaloul, W.S.; Liew, M.S. Impact of inflation rate on construction projects budget: A review. Ain Shams Eng. J. 2021, 12, 407–414. [Google Scholar] [CrossRef] [Scilit]
- Rolstadås, A.; Schiefloe, P.M. Modelling project complexity. Int. J. Manag. Proj. Bus. 2017, 10, 295–314. [Google Scholar]
- Project Management Institute. A Guide to the Project Management Body of Knowledge (PMBOK Guide), 8th ed.; Project Management Institute: Newtown Square, PA, USA, 2025. [Google Scholar]

Disclaimer/Publisher’s Note: The statements, opinions and data contained in all publications are solely those of the individual author(s) and contributor(s) and not of MDPI and/or the editor(s). MDPI and/or the editor(s) disclaim responsibility for any injury to people or property resulting from any ideas, methods, instructions or products referred to in the content. |
© 2026 by the authors. Licensee MDPI, Basel, Switzerland. This article is an open access article distributed under the terms and conditions of the Creative Commons Attribution (CC BY) license.