


Abstract
Localized corrosion at weathering-steel girder ends near the bearings and deck joints can necessitate recurring maintenance and premature replacement. However, span-dependent comparisons of localized protection strategies under treatment-quantity, service-life, and economic uncertainties remain limited. This study develops a probabilistic lifecycle-cost framework comparing Paint + Replace, Paint + Repaint, Metalize + Remetalize, and preventive ultra-high-performance concrete (UHPC) encapsulation. A paired Monte Carlo analysis evaluated one million simple-span girders spanning 20–200 ft (6.1–61.0 m), with costs assessed at construction and after 75 and 150 years. Uncertainties in span, unit costs, paint service life, removal costs, and discount rates were incorporated. Outputs included mean lifecycle costs, distributions, lowest-cost probabilities, sensitivity analyses, and UHPC break-even thresholds. Assuming no future maintenance of the UHPC encasement or remaining paint, UHPC had the lowest mean cost in every span group at 75 and 150 years. At 150 years, its overall mean was $67.27k/girder, compared with $67.95k/girder for metalizing. Repainting the remaining painted region increased the UHPC mean to $68.54k/girder, placing it third. The findings demonstrate the importance of maintenance assumptions and of distinguishing mean cost from lowest-cost probability. The framework provides a basis for project-specific evaluation and comparison of girder-end protection strategies using locally calibrated inputs.
1. Introduction
Weathering steel develops an adherent oxide film, or patina, under suitable wet–dry exposure conditions, reducing atmospheric corrosion without requiring a complete protective coating system. Since its first use in a U.S. highway bridge in 1964 [1], uncoated weathering steel has been widely adopted where exposure, drainage, detailing, and maintenance conditions are appropriate. A national review of 52 transportation agencies and 9492 bridges found generally favorable performance and suggested that design and maintenance practices may be as influential on the steel’s performance as broad climatic classifications [2]. Nevertheless, prolonged wetness, chloride contamination, leaking deck joints, debris accumulation, and inadequate drainage can inhibit patina formation and cause localized corrosion that require remediation [3,4,5,6,7].
Girder ends are especially vulnerable because runoff, debris, and deicing chemicals penetrate failing deck joints and accumulate at the bearings. National Cooperative Highway Research Program (NCHRP) investigations and Federal Highway Administration (FHWA) guidance identified leaking joints, salt-laden runoff, and debris as recurring causes of localized corrosion and supported painting vulnerable steel near deck joints [3,4,8]. Current practice recommends painting girder ends for approximately 1.5 times the girder depth from the bearing region [9]. A review of Connecticut’s 138 weathering-steel bridges found that leaking structures older than 30 years had average maximum section losses of approximately 0.093 in. (2.36 mm) or greater, whereas none of the 12 leaking beam ends painted before corrosion were observed exhibiting rusting [10]. These observations support targeted protection at girder ends exposed to recurrent moisture and chlorides.
Conventional protection commonly uses a multilayer coating system with a zinc-rich primer. Three-coat systems may require substantial touch-up or repainting after approximately 30 years, depending on their preparation, application quality, and exposure [11]. Metalizing applies zinc or a zinc–aluminum alloy by thermal spraying and can provide longer protection under severe coastal or salt-rich exposure, although at a higher initial cost [12]. Ultra-high-performance concrete (UHPC) encapsulation provides another localized alternative. UHPC beam-end encasement originated as a rehabilitation measure for girders with advanced section loss at the bearing. Early experimental work demonstrated that welding headed shear studs to the sound portion of a corroded web and encasing the girder end in UHPC restores bearing capacity by transferring the load around the deteriorated material [13], and subsequent testing across a range of section-loss patterns confirmed that the repaired capacity meets or exceeds that of the undeteriorated girder [14,15]. Field implementations established constructability under traffic and led to the design and construction guidance published by FHWA [16]. The attributes that make the treatment effective as a repair apply equally before deterioration occurs: the encasement excludes runoff, debris, and chloride-laden moisture from the web and bearing region, while the low-permeability matrix passivates the enclosed steel. Together, these mechanisms may reduce the need for recurring surface preparation, recoating, and containment. Applying the encasement during construction also removes the constraints that govern repair geometry, since studs and reinforcement can be shop-installed and the encasement proportioned as a bearing element rather than as a remediation [17], and recent work has addressed the associated detailing questions, including anchorage of steel diaphragms to UHPC-encased bearing stiffeners [18]. These developments support evaluating preventive UHPC encapsulation as an alternative that could reduce recurring maintenance at weathering-steel girder ends.
UHPC cost varies substantially with material supply, placement, overlays, and beam-end rehabilitation because of the differences in geometry, access, preparation, formwork, connectors, traffic control, and contractor risk [19,20,21]. Its economic viability therefore cannot be established from a single reported unit cost, and should also be evaluated using cost thresholds and probabilistic comparisons.
Previous bridge lifecycle-cost studies provide an important foundation for the present comparison. Okasha et al. [22] probabilistically compared painted carbon steel that required repainting with nominally maintenance-free ASTM A1010 steel for a fixed bridge girder. Soliman and Frangopol [23] extended that comparison to include indirect social, economic, and environmental costs associated with maintenance-related traffic disruption. Kere and Huang [24] incorporated probabilistic coating degradation and compared cyclical and condition-based maintenance strategies, including conventional and zinc-metalizing systems. These studies demonstrate the value of a probabilistic lifecycle-cost analysis but primarily examine whole-structure alternatives using one or a limited number of fixed bridge configurations.
A remaining gap is the paired, probabilistic comparison of localized weathering-steel girder-end protection strategies across a span-dependent population. Within the literature reviewed here, repainting, painting followed by replacement, renewed metalizing, and preventive UHPC encapsulation have not been evaluated together across representative girders. Their mean-cost and lowest-cost probability rankings, sensitivity to treatment quantities and service lives, and UHPC cost thresholds therefore require evaluation.
This study compares these strategies using one million paired simple-span girder realizations spanning 20–200 ft (6.1–61.0 m), evaluated at initial, 75-year, and 150-year horizons. Simplified girder generation provides span-dependent quantities for economic comparison. Outputs include cost distributions, lowest-cost probabilities, treatment-quantity and service-life sensitivities, treatment-only diagnostics, and UHPC break-even thresholds. The original scenario assigns no future maintenance to the UHPC strategy; an additional consistent-repainting scenario repaints its remaining painted region consistently with Paint + Repaint. The framework supports preliminary project screening using locally calibrated inputs and prescribed intervention schedules.
2. Methodology
2.1. Analysis Framework and System Boundary
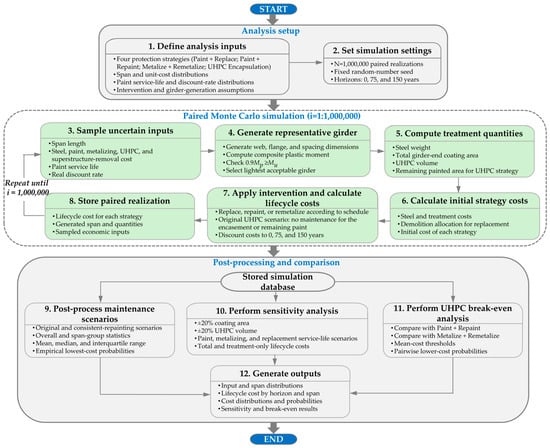
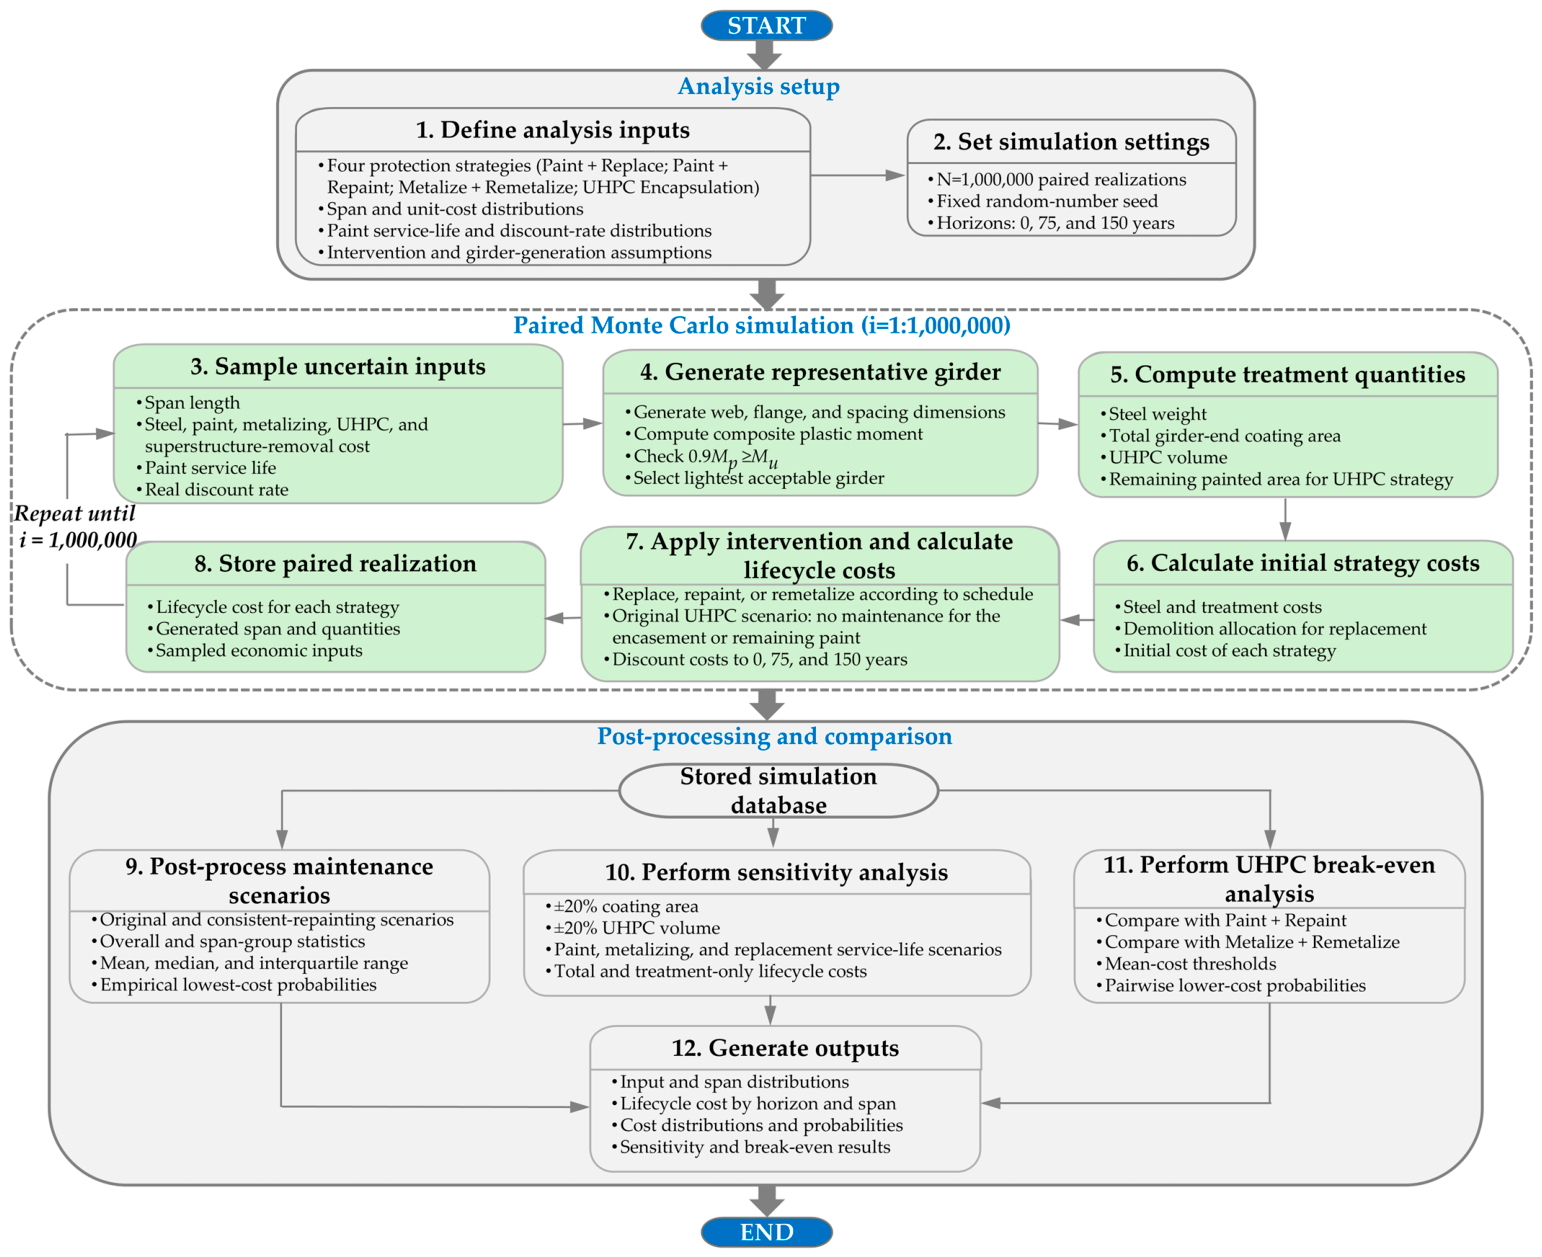
Figure 1 summarizes the paired Monte Carlo framework used to compare the lifecycle costs of four weathering-steel girder-end protection strategies. The unit of analysis was one representative girder, with protection applied at both ends. The system boundary included the girder and strategy-specific initial and future intervention costs. Costs common to all alternatives, including the deck, railing, and substructure, were excluded. For Paint + Replace, superstructure-removal cost was allocated to the modeled girder using its tributary deck area. The analysis evaluated prescribed intervention scenarios and did not explicitly simulate corrosion progression or treatment deterioration.
Figure 1.
Monte Carlo framework used to generate representative girders, sample uncertain inputs, calculate treatment quantities, evaluate lifecycle costs, and compare girder-end protection strategies.
A total of 1,000,000 paired realizations were generated using a fixed random-number seed of 1. Within each realization, the bridge geometry and uncertain inputs were sampled once, and all four strategies were evaluated using that same realization. This pairing enabled direct strategy comparisons under common bridge and economic conditions. Present-value lifecycle costs were calculated at initial construction (t = 0) and at 75 and 150 years, and were summarized overall and by the span groups. All simulations and post-processing analyses were performed in MATLAB R2026a (The MathWorks, Inc., Natick, MA, USA).
2.2. Protection Strategies and Intervention Assumptions
Four girder-end protection strategies were evaluated. Table 1 serves as the primary summary of their initial treatments, future interventions, and cost components. The assumptions supporting each strategy are described briefly below.
Table 1.
Girder-end protection strategies evaluated in the lifecycle-cost analysis.
Paint + Replace was treated as a limited-maintenance benchmark based on the 75-year bridge design life and replacement horizon identified in Connecticut Department of Transportation (CTDOT) guidance [25]. The superstructure-removal cost was allocated to the modeled girder using its tributary deck area.
Paint + Repaint represented periodic renewal of a three-coat system with a zinc-rich primer. The sampled paint service life was centered at 30 years based on reported bridge-coating performance and CTDOT lifecycle guidance [11,25].
Metalize + Remetalize represented thermal-spray metallic coating applied over the same girder-end region used for painting. The 60-year renewal interval was based on CTDOT lifecycle guidance [25] and field evidence that thermal-spray zinc duplex systems can remain serviceable for more than 40–50 years [26]. Each renewal was conservatively modeled as complete reapplication of metalizing to the area, although field maintenance may instead involve localized repair or topcoat renewal.
UHPC encapsulation was based on a girder-end repair system in which headed shear connectors engage UHPC encasement and establish an alternate load path around vulnerable or deteriorated steel. Experimental studies, field implementation, and FHWA guidance support the structural basis and constructability of this system [13,14,15,16]. In this study, the concept was adapted as a preventive treatment for new construction using an 18 in. (457 mm) longitudinal UHPC region at each girder end, with conventional paint retained over the remaining treatment length. Under the original maintenance scenario, no future intervention was assigned to the UHPC strategy within the 150-year analysis, including the remaining painted region. This favorable assumption was informed by the low permeability and long service-life projections reported for other UHPC bridge applications [27,28,29]. However, maintenance-free performance over 150 years has not been demonstrated specifically for preventive steel girder-end encapsulation; this condition was therefore treated as a modeling assumption rather than an established service life.
2.3. Model Inputs and Source Basis
Table 2 summarizes the uncertain model inputs and their source basis. Events occurring exactly at an evaluation horizon were included, and all costs were expressed in constant 2026 dollars. Inputs were sampled independently, truncated distributions were generated by rejection sampling, and reported parameters describe the parent distributions. Where empirical distributions were unavailable, variability was author-defined around the cited agency or literature values.
Table 2.
Monte Carlo input distributions.
2.3.1. Span Distribution and Validation
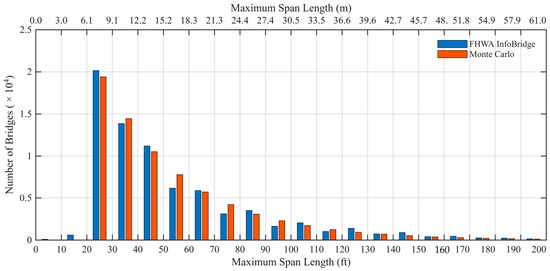
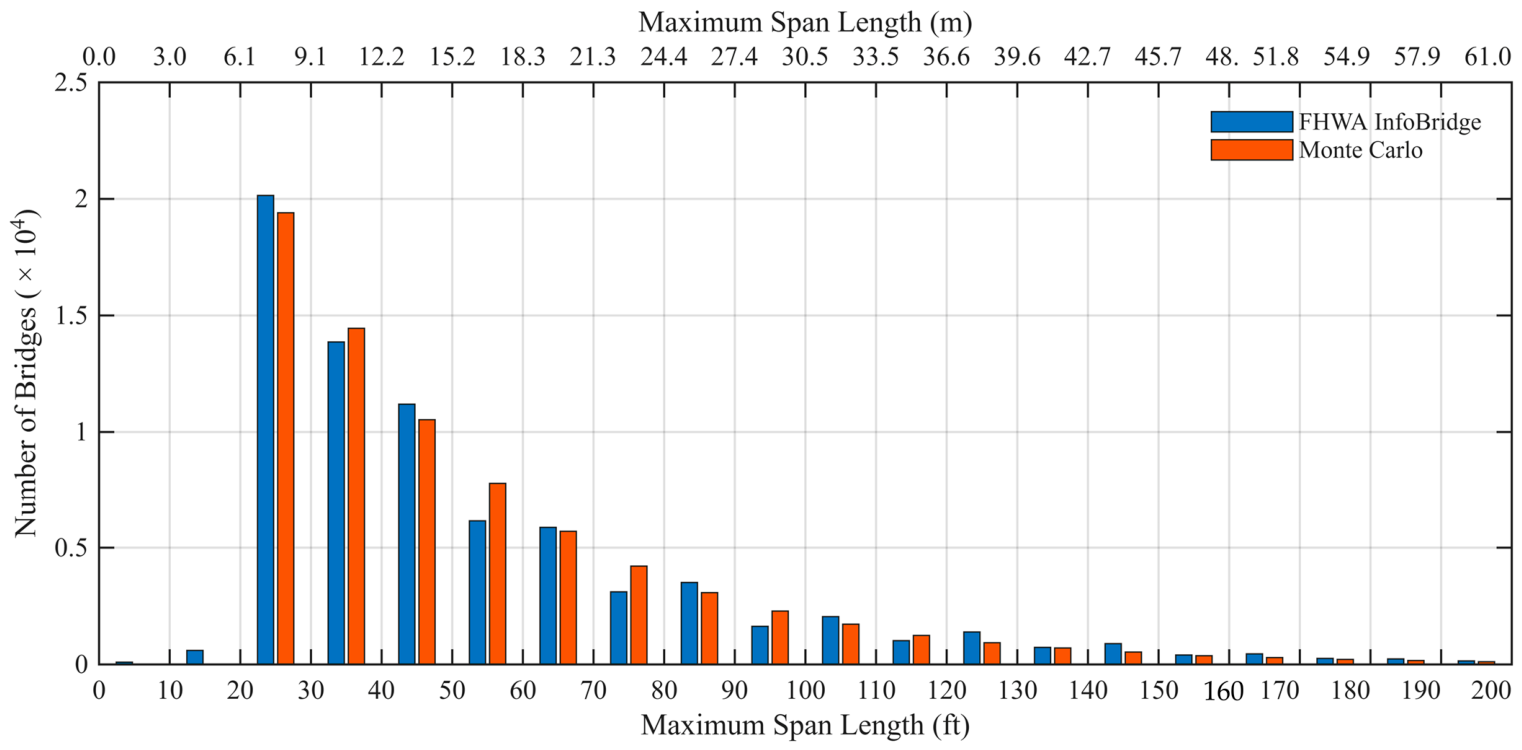
A shifted exponential distribution reproduced the right-skewed concentration of shorter simple spans in filtered Federal Highway Administration InfoBridge records [30]. Values above 200 ft (61.0 m) were rejected and resampled. Figure 2 compares these records with an equal-sized subsample selected from the completed Monte Carlo population using a separate random-number sequence.
Figure 2.
Comparison of filtered FHWA InfoBridge maximum-span records and an equal-sized subsample of the final Monte Carlo span population (n = 73,759). Source data: FHWA InfoBridge [30].
2.3.2. Economic and Service-Life Inputs
The structural-steel distribution was based on the 2026 CTDOT estimating guidance, which reports an average cost of $6.80/lb ($14.99/kg) and a value of $6.00/lb ($13.23/kg) for quantities exceeding 10,000 lb (4536 kg) under favorable conditions [31]. The shifted exponential model retained the lower value as its shift and represented higher costs through the exponential component. Paint service life was treated probabilistically because the coating performance varies with surface preparation, application quality, exposure, and maintenance conditions; its central value was based on reported bridge-coating performance and CTDOT lifecycle guidance [11,25]. Variability in paint, metalizing, and superstructure-removal costs represented differences in access, staging, preparation, application, removal difficulty, disposal, and other project-specific conditions [31]. Future costs were evaluated in constant 2026 dollars using a real annual discount rate sampled independently for each realization from a normal parent distribution with a mean of 4.0% and a standard deviation of 0.5%, truncated at zero. The central value falls within the approximately 3–5% range identified as appropriate by FHWA for lifecycle-cost analysis [32].
2.3.3. UHPC Cost Basis
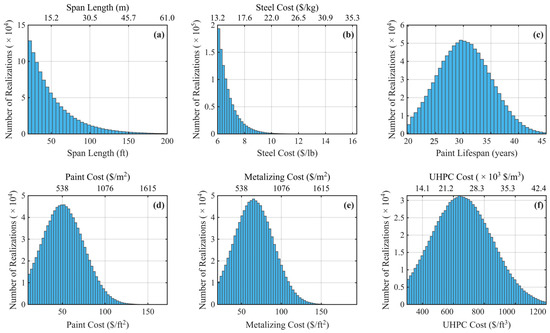
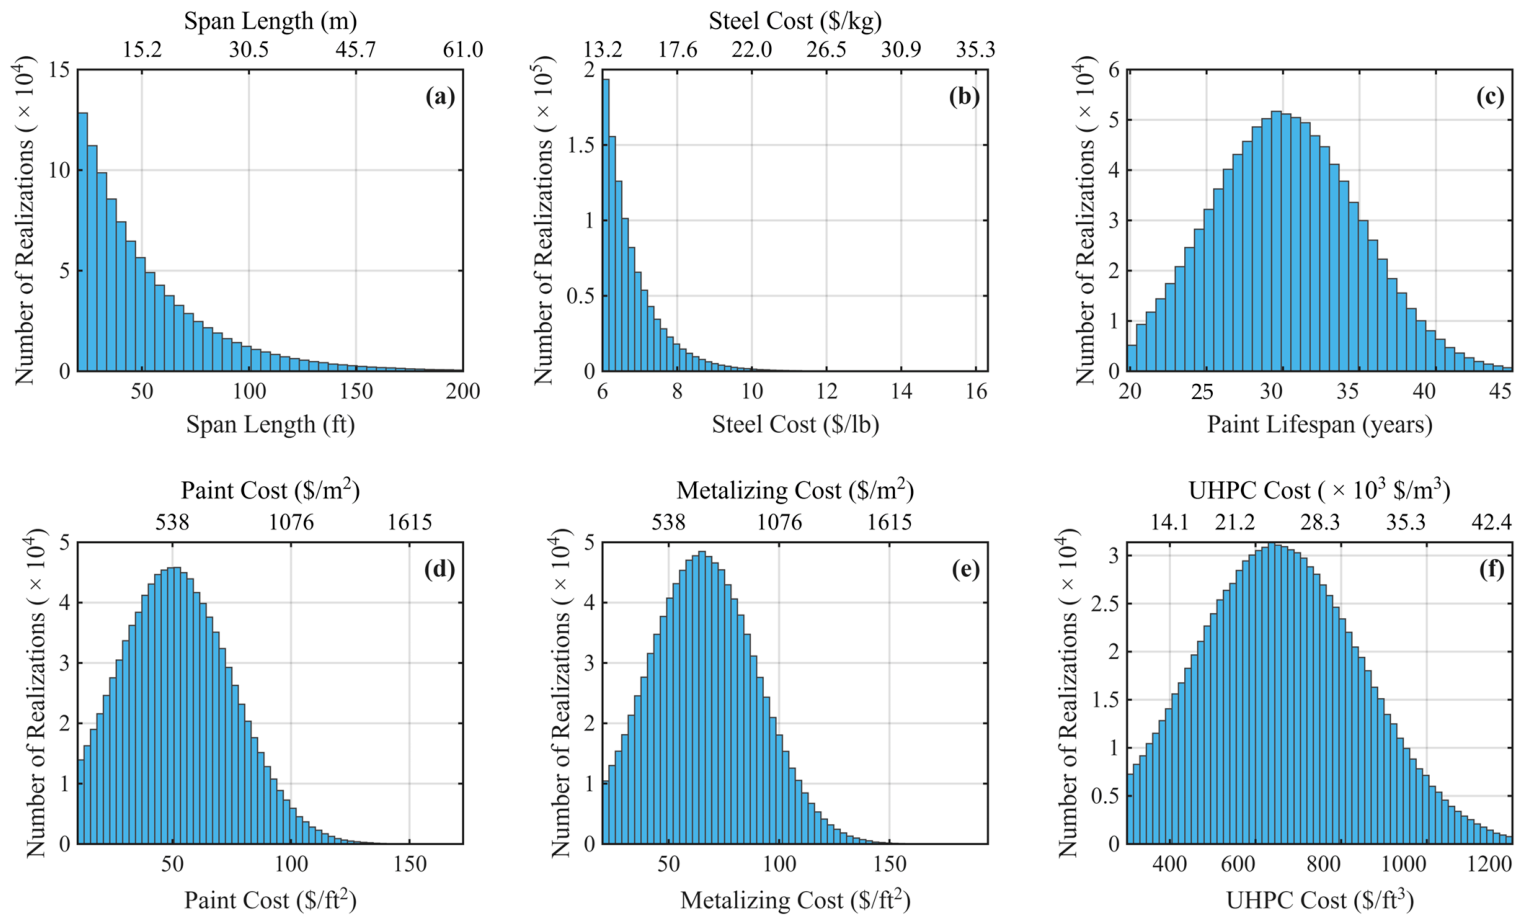
The baseline UHPC parent-mean cost of $650/ft3 ($22,955/m3) was selected from New York State Department of Transportation (NYSDOT) bid data, which reported an awarded price of $600/ft3 ($21,189/m3) and an average of $658.33/ft3 ($23,250/m3) among the three lowest bidders [19]. Other published values were treated as scope-dependent benchmarks rather than direct substitutes for the baseline input. Hossain and Chang [20] used an installed UHPC overlay cost of approximately $375/ft3 ($13,243/m3), while FHWA overlay examples reported $55–127/ft2 ($592–1367/m2), illustrating the influence of removal depth and installation configuration [33]. CTDOT reported $253/ft3 ($8935/m3) for a generic UHPC item and application-specific repair values of $1885.76–3300/ft3 (approximately $66,600–116,500/m3) [21]. Material-level values of approximately $74–89/ft3 ($2613–3143/m3) have also been reported [34,35]. These values were not treated as directly interchangeable because they represent different combinations of material supply, placement, rehabilitation, access, preparation, and project risk. The adopted distribution was intended to represent preventive encapsulation during new construction rather than rehabilitation of an existing deteriorated girder. Figure 3 summarizes the principal sampled input distributions.
Figure 3.
Distributions of the principal Monte Carlo inputs: (a) span, (b) structural-steel unit cost, (c) paint service life, (d) paint unit cost, (e) metalizing unit cost, and (f) UHPC unit cost.
2.4. Representative Girder Generation and Flexural Screening
A simplified composite girder generation and flexural-screening procedure used selected preliminary proportioning, loading, and composite-flexure provisions from the AASHTO LRFD Bridge Design Specifications [36]. Table 3 summarizes the rules used to generate span-dependent quantities for economic comparison; the procedure was not a complete project-level bridge design or demonstration of compliance with all limit states. The modeled member is a simply supported weathering-steel plate girder with an open I-section acting compositely with a concrete deck. Localized protection addresses the girder-end region, where joint leakage and moisture accumulation near bearings can promote corrosion. The analysis does not explicitly calculate corrosion probabilities; the application to box or truss girders would require geometry, treatment quantities, and exposure assumptions appropriate to those configurations.
Table 3.
Assumptions and rules used to generate representative girders.
For each sampled span, the web, flange, and spacing rules in Table 3 were applied. The preliminary depth and web-slenderness criteria were based on AASHTO LRFD Table 2.5.2.6.3-1 and Article 6.10.2.1.1; minimum dimensions, spacing, candidate sections, and rounding conventions were implementation assumptions.
Flexural demand was estimated for a simply supported girder using a 72 kip (320 kN) truck idealized at midspan, including the adopted dynamic allowance, Strength I factor, and distribution factor. The factored moment demand was obtained from the simply supported midspan point-load expression PL/4, after applying the 1.33 dynamic allowance and 1.75 Strength I factor. For each generated web, the four candidate bottom-flange widths were evaluated. Equal flange thicknesses were increased in 0.125 in. (3.2 mm) increments until 0.9Mp ≥ Mu. The composite plastic neutral axis and plastic moment were obtained from force equilibrium of the web, both flanges, and tributary concrete deck, with the neutral axis permitted to occur in the web, top flange, or deck. The acceptable section with the smallest flange area was selected; ties were resolved by retaining the section with the larger plastic moment.
The selected sections were used principally to provide span-dependent estimates of steel weight, coating area, UHPC volume, and tributary removal quantities for economic comparison. These sections were not intended to represent fully engineered girders for their corresponding spans; instead, they served as appropriately sized analogs for estimating the treatment quantities and costs evaluated herein. Girder self-weight, other dead loads, lane loading, detailed axle placement, code-based distribution, shear, fatigue, serviceability, deflection, lateral stability, construction stages, skew, continuity, and project-specific detailing were outside the model scope.
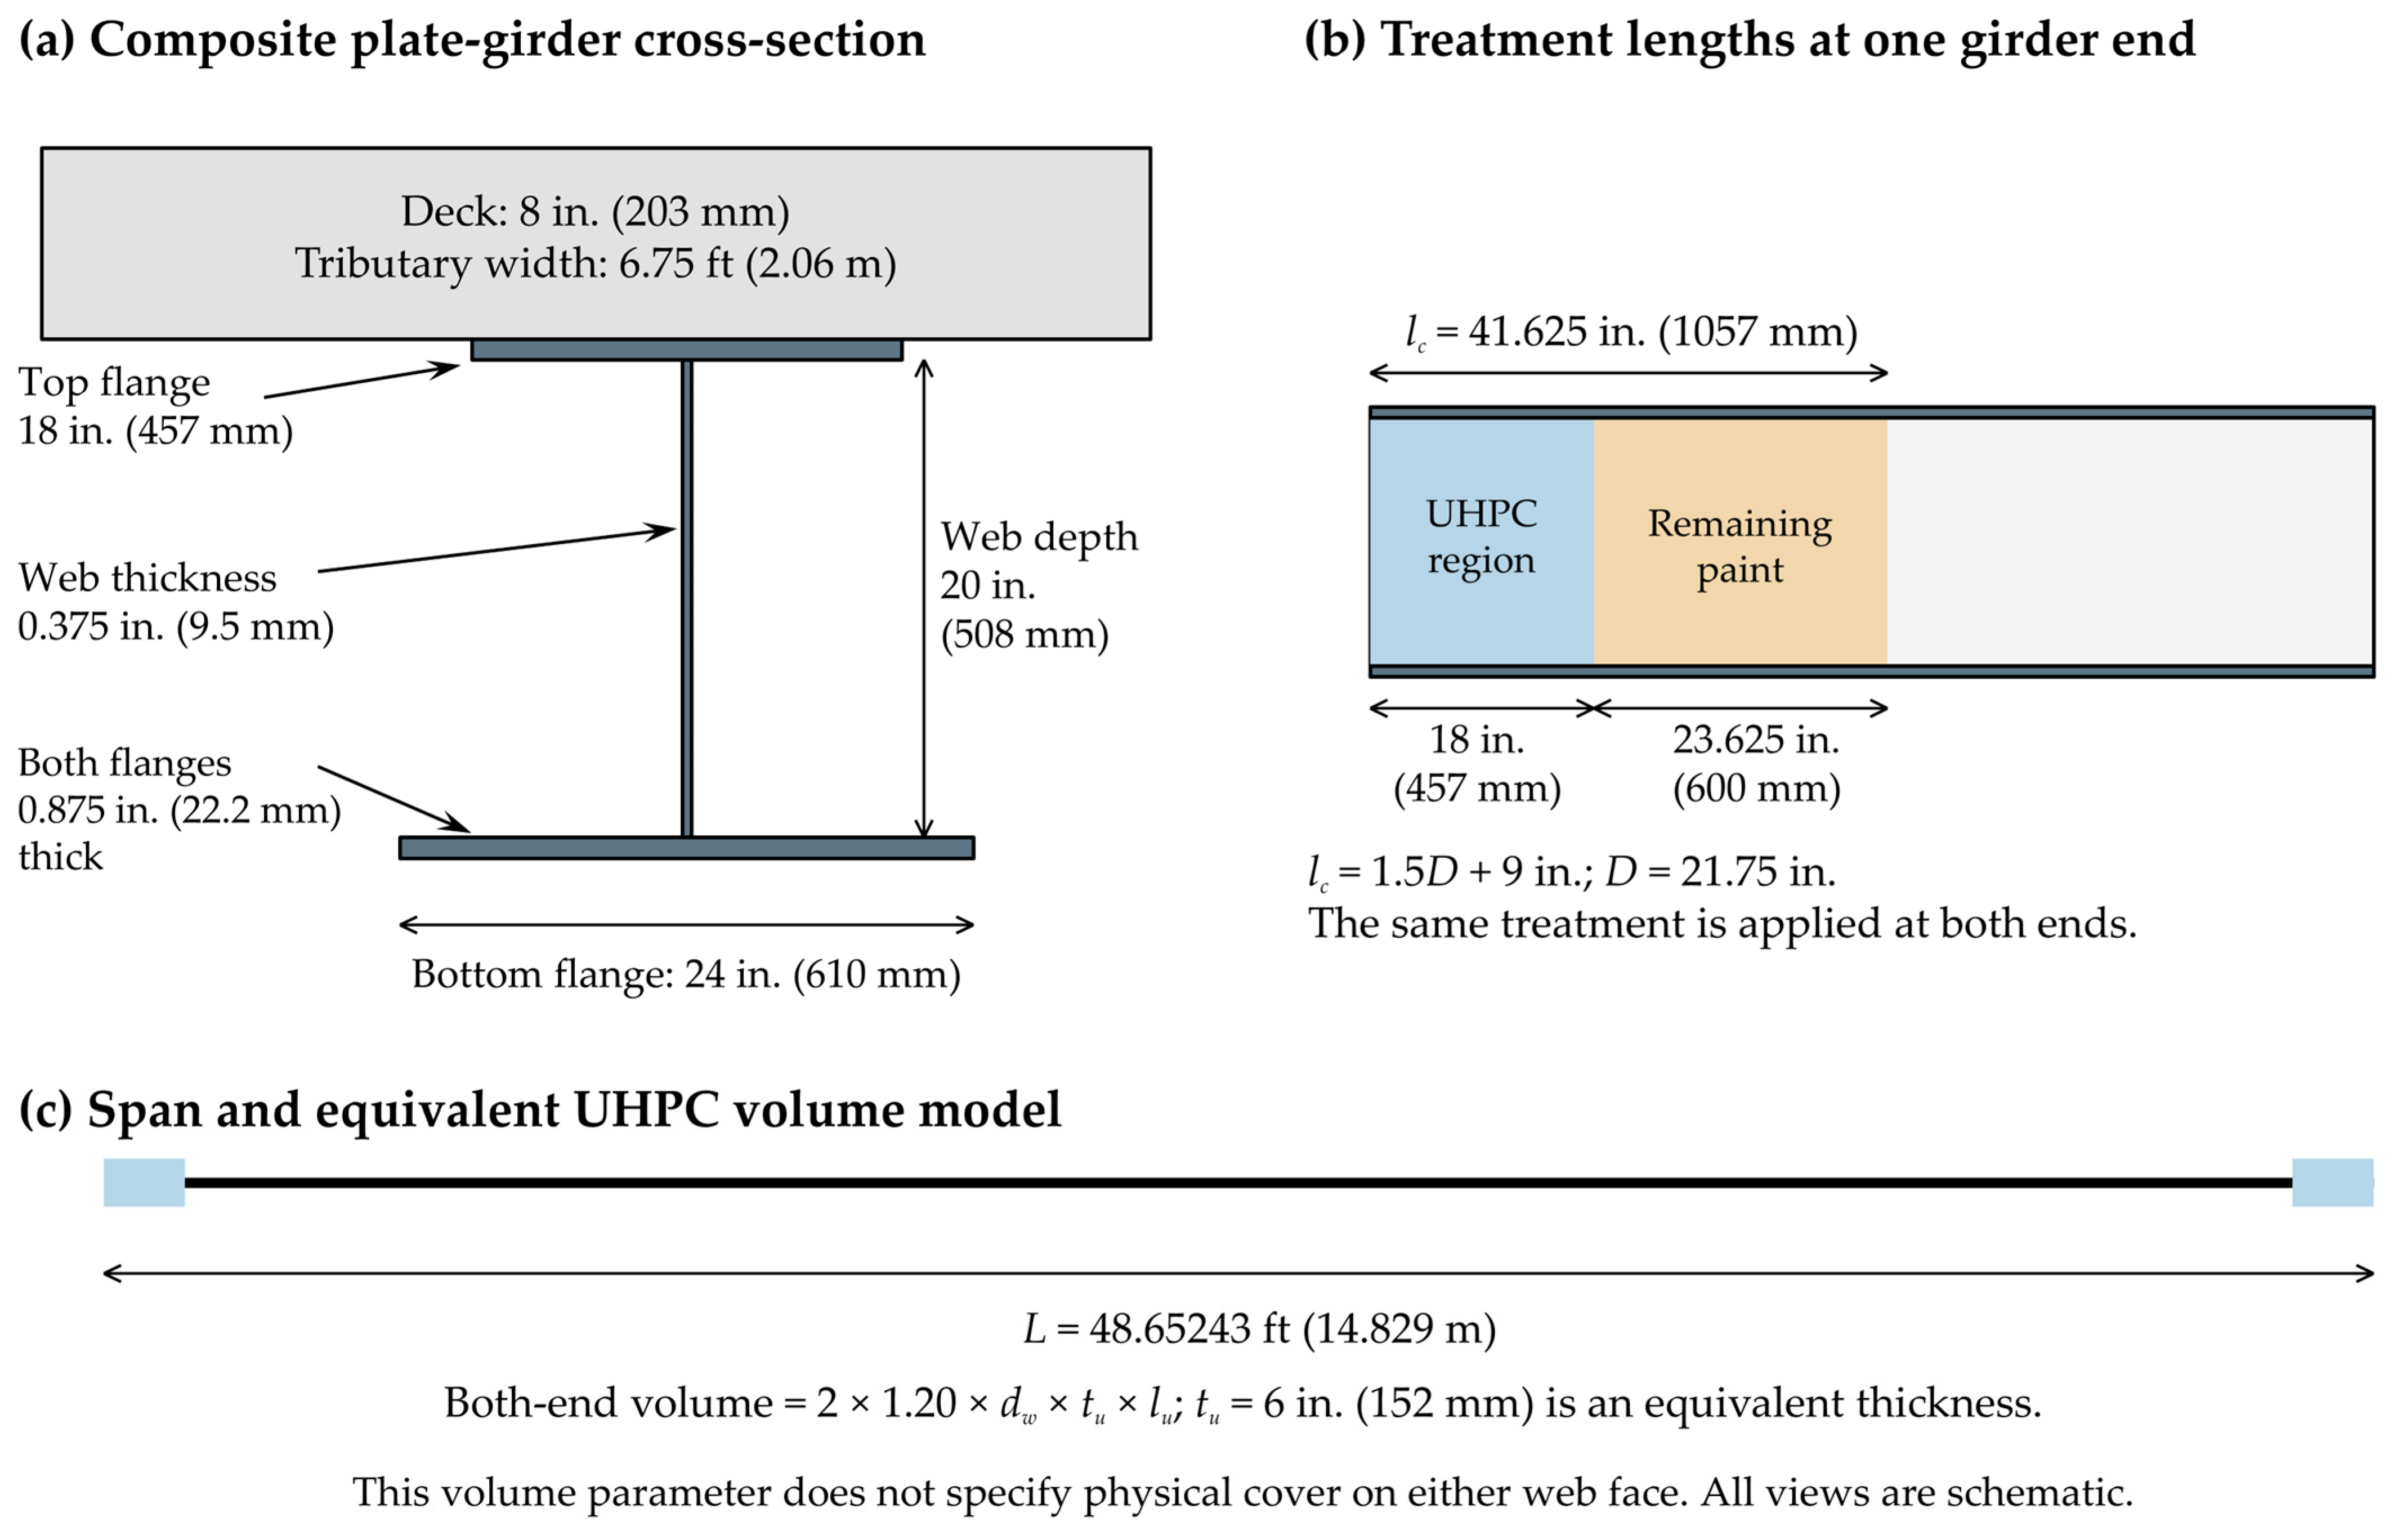
A representative composite plate girder selected from the simulated population is illustrated in Figure A1 (Appendix A). The schematic shows its principal cross-sectional dimensions, span, and deck geometry, together with the UHPC encapsulation and remaining painted lengths at each end. This example illustrates the geometry used to calculate treatment quantities; girder dimensions vary across the simulated population. Appendix A provides the corresponding treatment-quantity and lifecycle-cost calculations, with the resulting costs summarized in Table A1.
2.5. Treatment Quantities and Initial Costs
The generated girder dimensions were used to calculate steel weight, coating area, UHPC volume, remaining paint area, and the superstructure-removal quantity assigned to one girder. Calculations were performed in U.S. customary units to remain consistent with the simulation model; SI equivalents are also provided.
2.5.1. Steel and Treatment Quantities
The primary girder weight was calculated from the web area dwtw, the combined flange area 1.75bftf, and a steel density of 0.2833 lb/in3 (7842 kg/m3). For costing, the resulting girder weight was increased by 10% to represent stiffeners, diaphragms, connections, bolts, bearing stiffeners, and other steel components not modeled explicitly.
The total girder depth was D = dw + 2tf. The treatment length at each end was taken as lc = 1.5D + 9 in., where 1.5D follows recommended weathering-steel girder-end protection practice and the additional 9 in. (229 mm) extends the treatment beyond the bearing region [9]. The total coating area for both girder ends was
where Ac is expressed in ft2 and all dimensions on the right-hand side are in inches. This quantity was used for initial painting, repainting, and all metalizing.
UHPC encapsulation was represented by a full-web-depth region extending 18 in. (457 mm) along each girder end, with a 6 in. (152 mm) equivalent thickness used for volume estimation. The total UHPC volume across both ends was
where tu = 6 in., lu = 18 in., and Vu is in yd3. The equivalent thickness is counted once per girder end, rather than as cover on each web face; the factor 2 accounts for the two ends. The factor 1.20 accounts for placement around stiffeners and flange regions, geometric irregularities, formwork tolerances, and waste. These dimensions and the quantity allowance are modeling assumptions rather than universal treatment requirements.
Because the UHPC region was shorter than the full coating length, conventional paint was retained over the remaining length, calculated as max(lc − lu,0) at each end. The remaining paint area was obtained using the coating-area relationship in Equation (1) with this reduced length.
2.5.2. Initial and Replacement-Event Costs
The steel cost was calculated from the adjusted girder weight, span, and sampled steel unit cost. Paint, metalizing, UHPC, and remaining-paint costs were calculated by multiplying the corresponding quantities by their appropriate sampled unit costs.
The superstructure-removal quantity assigned to one girder was the tributary deck area, calculated as span multiplied by representative girder spacing. Its cost was obtained using the sampled removal unit cost and was applied only to Paint + Replace.
Initial strategy costs were assembled from the components listed in Table 1. Paint + Replace and Paint + Repaint included the same initial painted girder cost; Metalize + Remetalize included the steel girder and full-area metalizing; and UHPC encapsulation included the steel girder, UHPC treatment, and paint over the remaining treatment area. Each future Paint + Replace event included a new painted girder and the allocated superstructure-removal cost.
2.6. Lifecycle-Cost Formulation
All costs were expressed in constant 2026 dollars. Within each realization, the generated geometry, treatment quantities, sampled unit costs, paint service life, and real discount rate were held fixed. General inflation and changes in relative material prices were not modeled. For strategy s and evaluation horizon T, the lifecycle cost was calculated as
where Cs,0 is the initial strategy cost, Cs,j is the constant-dollar cost of intervention j, ts,j is its occurrence year, and r is the sampled real annual discount rate.
Lifecycle costs were evaluated at 0, 75, and 150 years. Paint + Replace included replacement at 75-year multiples, Paint + Repaint included interventions at successive multiples of the sampled paint service life, and Metalize + Remetalize included renewal at 60-year multiples. No future intervention was assigned to UHPC encapsulation under the original maintenance scenario. Events occurring exactly at an evaluation horizon were included, and no residual-value adjustment was applied; therefore, the full costs of terminal-year interventions were retained even when part of the resulting service life extended beyond the analysis horizon.
2.7. Statistical, Sensitivity, and Break-Even Analyses
2.7.1. Summary Statistics and Lowest-Cost Probability
Lifecycle costs were summarized for the full simulation population and for five reported span groups: 0–50, 50–75, 75–100, 100–150, and 150–200 ft (0–15.2, 15.2–22.9, 22.9–30.5, 30.5–45.7, and 45.7–61.0 m). Mean costs were calculated for each strategy at the initial, 75-year, and 150-year horizons, while medians and interquartile ranges were used to characterize the cost distributions. For span-group comparisons across the three horizons, mean costs were presented with first-to-third-quartile (Q1–Q3) ranges. The 150-year cost distributions were additionally represented using boxplots, with whiskers extending to the most extreme observations within 1.5 times the interquartile range from the first to third quartiles.
Because all four strategies were evaluated using the same bridge and economic realization, lowest-cost probabilities were calculated empirically from the paired lifecycle costs at 75 and 150 years. A strategy was counted as lowest cost when its cost was within 10−6 $/girder of the minimum value in that realization. When multiple strategies satisfied this tolerance, the probability contribution was divided equally among the tied strategies.
2.7.2. Treatment-Quantity and Service-Life Sensitivity Analysis
A one-at-a-time treatment-quantity sensitivity analysis evaluated ±20% changes in total coating area and UHPC volume at the 75- and 150-year horizons. Coating-area changes affected painting and metalizing costs and the remaining painted area in the UHPC strategy; UHPC volume changes affected only the UHPC treatment cost. The completed one million paired realizations were reused without resampling the other bridge or economic inputs.
A parallel service-life sensitivity analysis multiplied each sampled paint life by 0.8 or 1.2, used metalizing intervals of 48 and 72 years instead of the 60-year baseline, and used girder-replacement intervals of 60 and 90 years instead of the 75-year baseline. Each case was evaluated at 75 and 150 years. These cases represent sensitivity to assumed intervention life; they do not assign additional costs for poor condition, deferred maintenance, or major rehabilitation.
For both sensitivity families, the total lifecycle cost was retained as the primary measure. A secondary treatment-only cost was calculated by subtracting the common initial steel cost once from every strategy and horizon. Steel associated with future Paint + Replace events was retained because it is an additional strategy-specific replacement cost. The ±20% steel-weight cases were evaluated as an internal diagnostic but were not included in the treatment-specific sensitivity figures because only the initial steel cost is common to all strategies, whereas future replacement-member steel remains specific to Paint + Replace.
Outputs included overall and span-specific mean costs, percentage changes, lowest-cost probabilities, and changes in the lowest-mean-cost and highest-probability strategies.
2.7.3. UHPC Break-Even and Pairwise Probability Analysis
UHPC cost competitiveness was evaluated against Paint + Repaint and Metalize + Remetalize at the 75- and 150-year horizons. The assumed UHPC parent-mean cost was varied while preserving each realization’s deviation from the baseline parent mean, together with its bridge geometry, UHPC volume, remaining paint cost, and comparator inputs. This common-random-number procedure isolated the effect of changing the assumed UHPC cost.
For each comparator q, the mean-cost break-even threshold was defined by
where is the UHPC parent-mean cost at which the two overall mean lifecycle costs are equal. At each assumed UHPC parent mean, the paired probability that UHPC produced the lower lifecycle cost was also calculated directly from the realization-level comparisons. This pairwise probability differs from the four-strategy lowest-cost probability described in Section 2.7.1, and equality of mean costs does not necessarily correspond to a 50% pairwise crossover because the paired cost differences may be skewed.
The final simulation and post-processing procedures were verified by checking completion of all realizations, compliance with span limits and the flexural-screening criterion, finite lifecycle-cost values, reconstruction of the baseline UHPC costs, and numerical agreement at the calculated break-even thresholds. The sensitivity and break-even analyses reused the completed paired realizations, while figure-specific sampling was performed separately and did not affect the primary results.
2.7.4. Consistent Maintenance of the Remaining Painted Region
The consistent-repainting scenario assigned periodic repainting to the remaining painted region outside the UHPC encapsulation. For each of the original one million realizations, repainting used the same sampled paint service life, unit cost, and discount rate as Paint + Repaint. The remaining painted area defined in Section 2.5.1 determined each intervention cost, which was discounted using Equation (3), including terminal-year events. The encasement itself retained the assumption of no scheduled maintenance. Other strategy costs were unchanged. Mean costs and lowest-cost probabilities were recalculated at 75 and 150 years, overall and by span group.
3. Results
Section 3.1, Section 3.2, Section 3.3, Section 3.4 and Section 3.5 and their associated figures and tables report the original maintenance scenario, which assigns no future maintenance to either the UHPC encasement or the remaining painted region. The consistent-repainting comparison is presented separately in Section 3.6 and Appendix B (Table A2 and Table A3).
3.1. Simulation Population and Verification
The final model completed 1,000,000 Monte Carlo realizations. Simulated spans ranged from 20.00 to 200.00 ft (6.10–60.96 m), with a mean of 52.02 ft (15.86 m) and a median of 42.56 ft (12.97 m). The 95th- and 99th-percentile spans were 115.72 and 159.59 ft (35.27 and 48.64 m), respectively. All generated sections satisfied the simplified flexural-screening criterion; the minimum 0.9Mp/Mu ratio was 1.000, and no section failed. The lifecycle-cost database contained no invalid or infinite values, and the simulated costs ranged from $13,034.91 to $788,802.61 per girder.
The shifted exponential span model concentrated the simulated population in the shorter-span groups, consistent with the span length data collected from InfoBridge (Table 4) [30]. Overall statistics are consequently weighted toward shorter girders; lifecycle costs were therefore also evaluated separately by span group.
Table 4.
Distribution of Monte Carlo simulations by span range.
3.2. Lifecycle Cost by Horizon and Span
Table 5 summarizes the overall lifecycle-cost results. At initial construction, Paint + Replace and Paint + Repaint had identical mean costs, whereas UHPC encapsulation and Metalize + Remetalize had slightly higher means.
Table 5.
Overall lifecycle-cost statistics, $k/girder.
By 75 years, UHPC encapsulation had the lowest overall mean lifecycle cost, followed by Metalize + Remetalize, Paint + Repaint, and Paint + Replace; the same ordering was retained at 150 years. The 150-year mean costs were $67.27k/girder for UHPC encapsulation, $67.95k/girder for Metalize + Remetalize, $68.22k/girder for Paint + Repaint, and $71.85k/girder for Paint + Replace. Paint + Replace increased most because replacement and superstructure-removal costs were included, whereas the UHPC mean remained unchanged under the assumed no-maintenance scenario. Relative to Paint + Replace, the mean 150-year costs were 5.05% lower for Paint + Repaint, 5.43% lower for Metalize + Remetalize, and 6.37% lower for UHPC encapsulation.
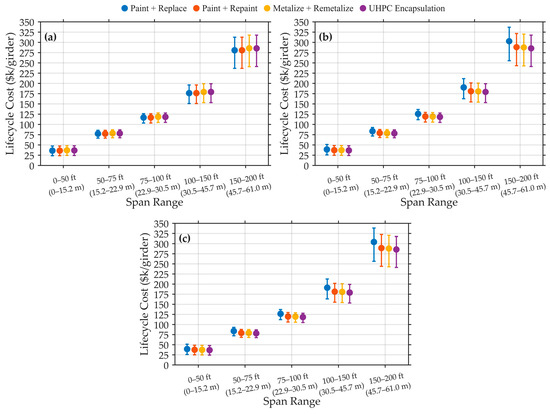
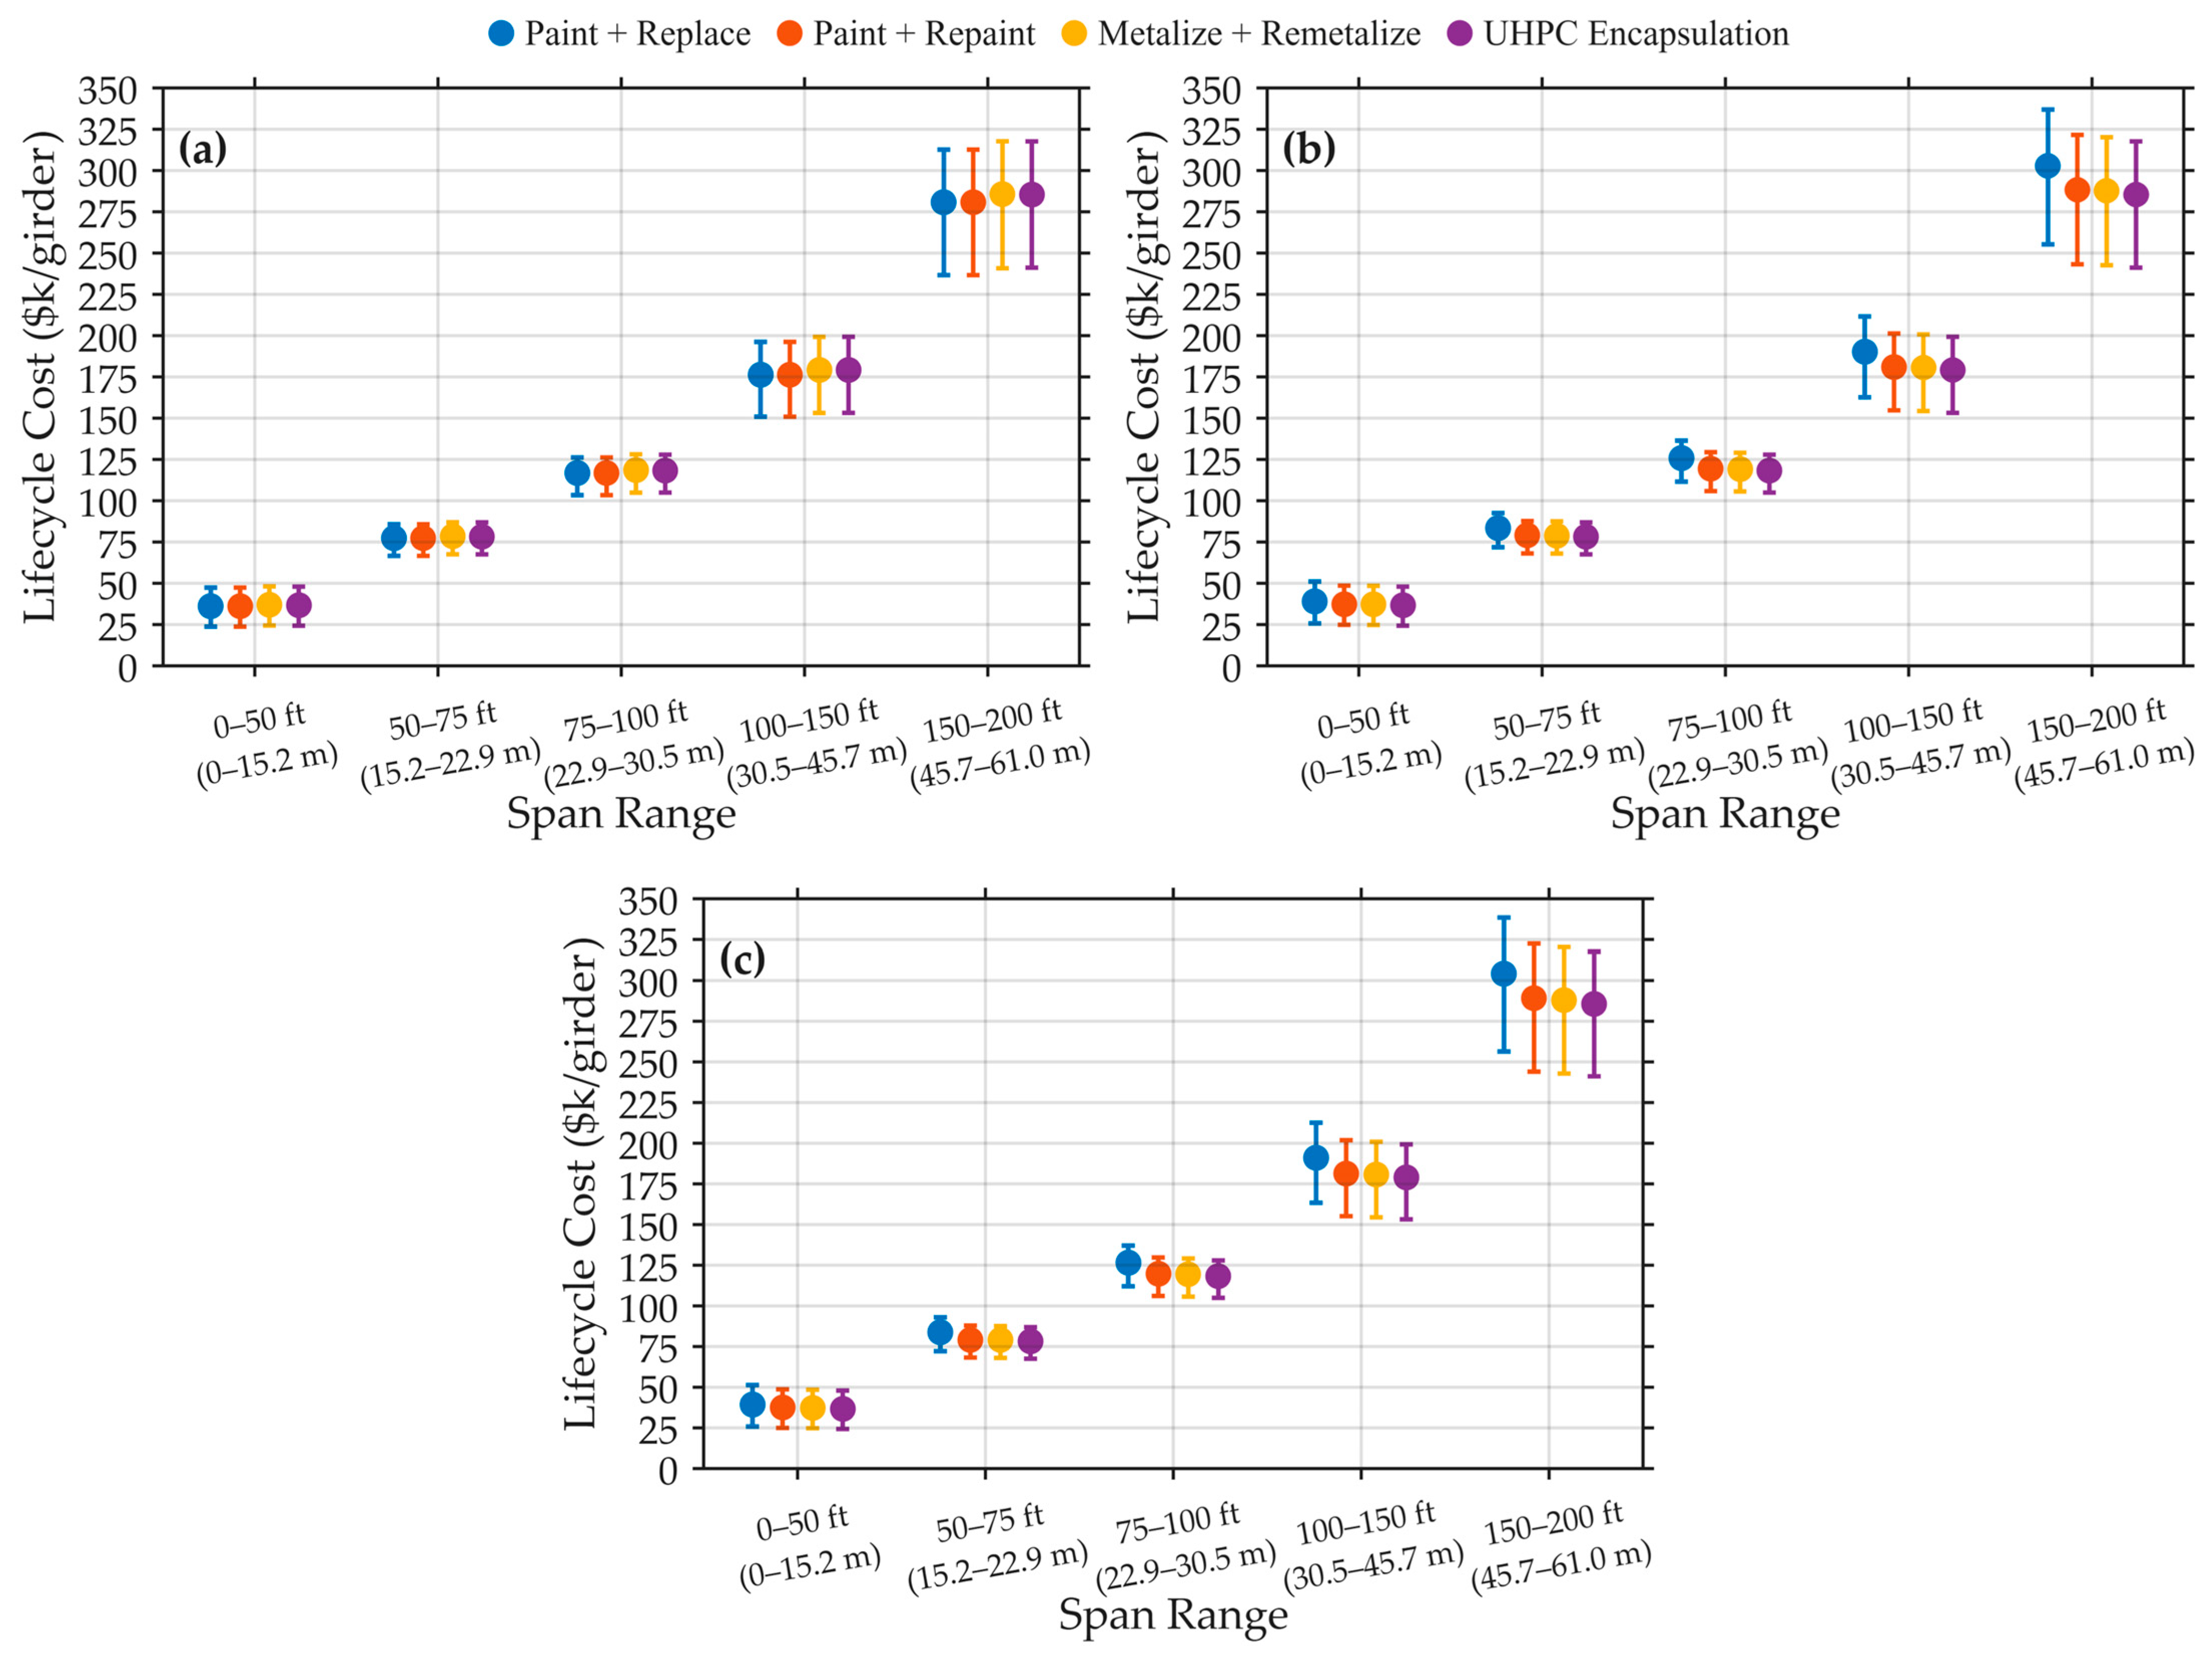
The mean lifecycle cost increased consistently with the span for all strategies and evaluation horizons (Figure 4). The Q1–Q3 ranges also widened with the span range, showing that the absolute variability increased as girders became longer. At initial construction, Paint + Replace and Paint + Repaint retained identical means in every span group. At 75 and 150 years, the mean-cost ranking was consistently UHPC encapsulation, Metalize + Remetalize, Paint + Repaint, and Paint + Replace.
Figure 4.
Mean lifecycle costs (markers) and Q1–Q3 ranges (whiskers) by span group and protection strategy at the (a) initial, (b) 75-year, and (c) 150-year evaluation horizons.
At 150 years, the mean UHPC cost increased from $36.76k/girder in the 0–50 ft (0–15.2 m) group to $285.49k/girder in the 150–200 ft (45.7–61.0 m) group. The corresponding Paint + Replace means increased from $39.26k/girder to $304.26k/girder. Exact span-specific 150-year means are provided in Table 6.
Table 6.
Mean 150-year lifecycle cost by span group, $k/girder.
3.3. Cost Distributions and Lowest-Cost Probabilities
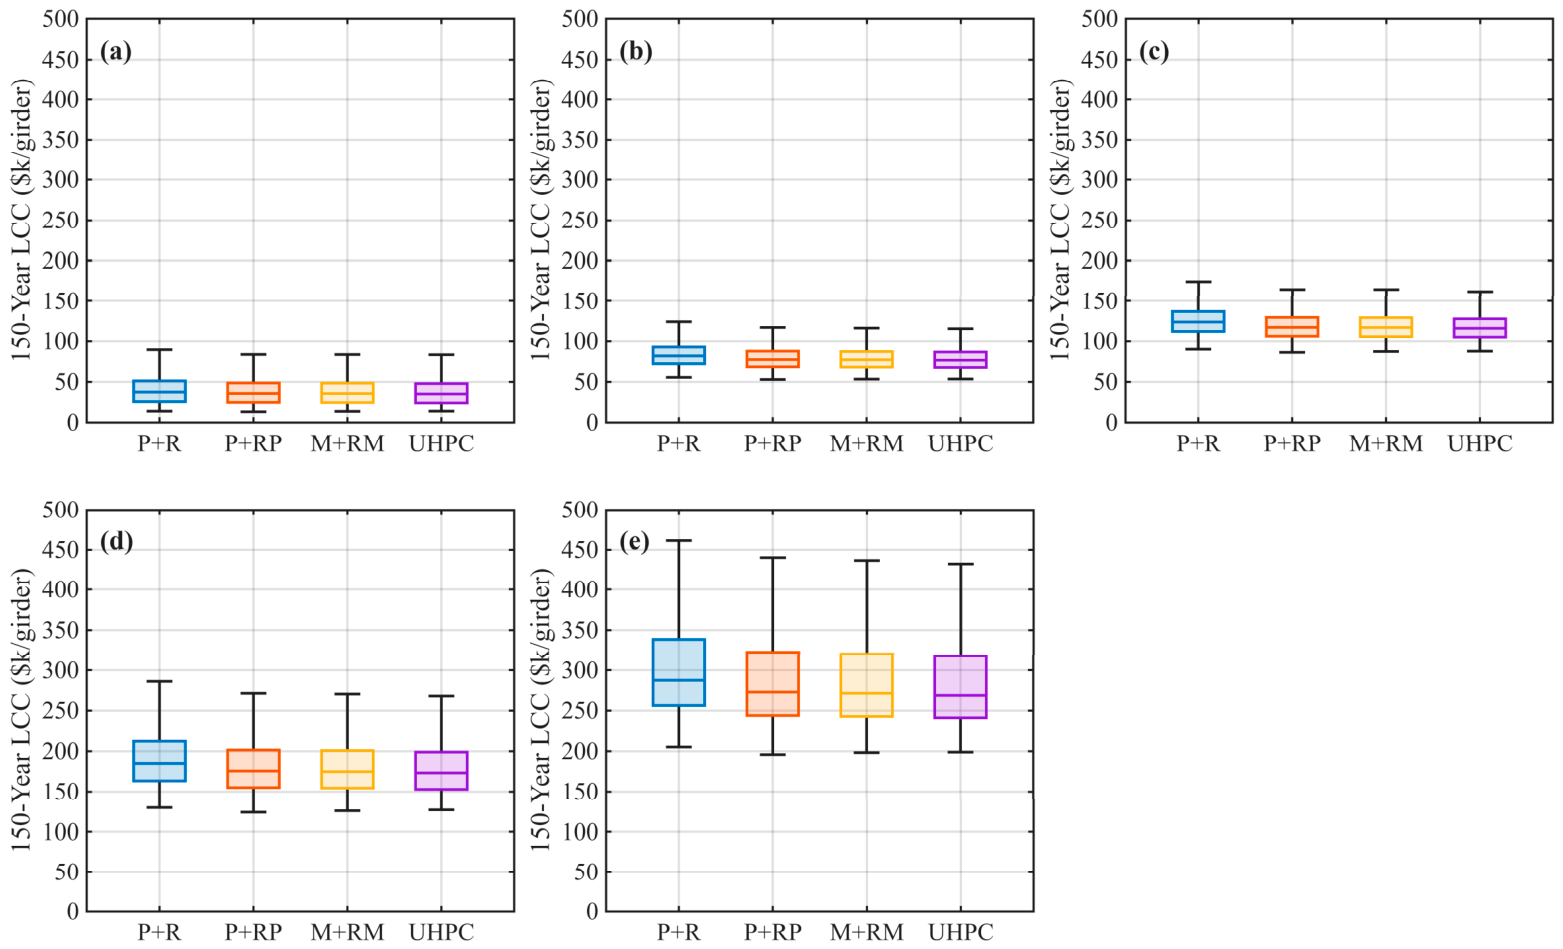
The 150-year lifecycle-cost distributions were positively skewed, with the mean exceeding the median for all four strategies (Table 5). Median cost and dispersion increased with span, and the strategy distributions overlapped substantially within each span group (Figure 5). Thus, the strategy with the lowest mean cost was not necessarily the least expensive in an individual Monte Carlo realization.
Figure 5.
Distribution of 150-year lifecycle costs by protection strategies and span ranges: (a) 0–50 ft (0–15.2 m), (b) 50–75 ft (15.2–22.9 m), (c) 75–100 ft (22.9–30.5 m), (d) 100–150 ft (30.5–45.7 m), and (e) 150–200 ft (45.7–61.0 m). Boxes represent the interquartile range, center lines indicate the median, and whiskers extend to the most extreme observations within 1.5 times the interquartile range. P + R = Paint + Replace; P + RP = Paint + Repaint; M + RM = Metalize + Remetalize.
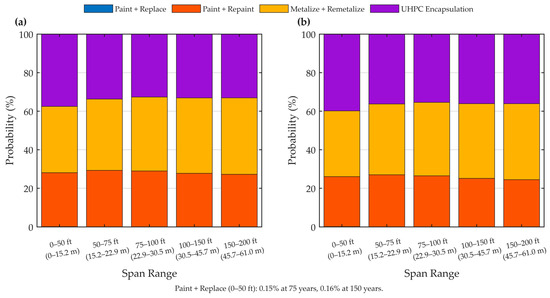
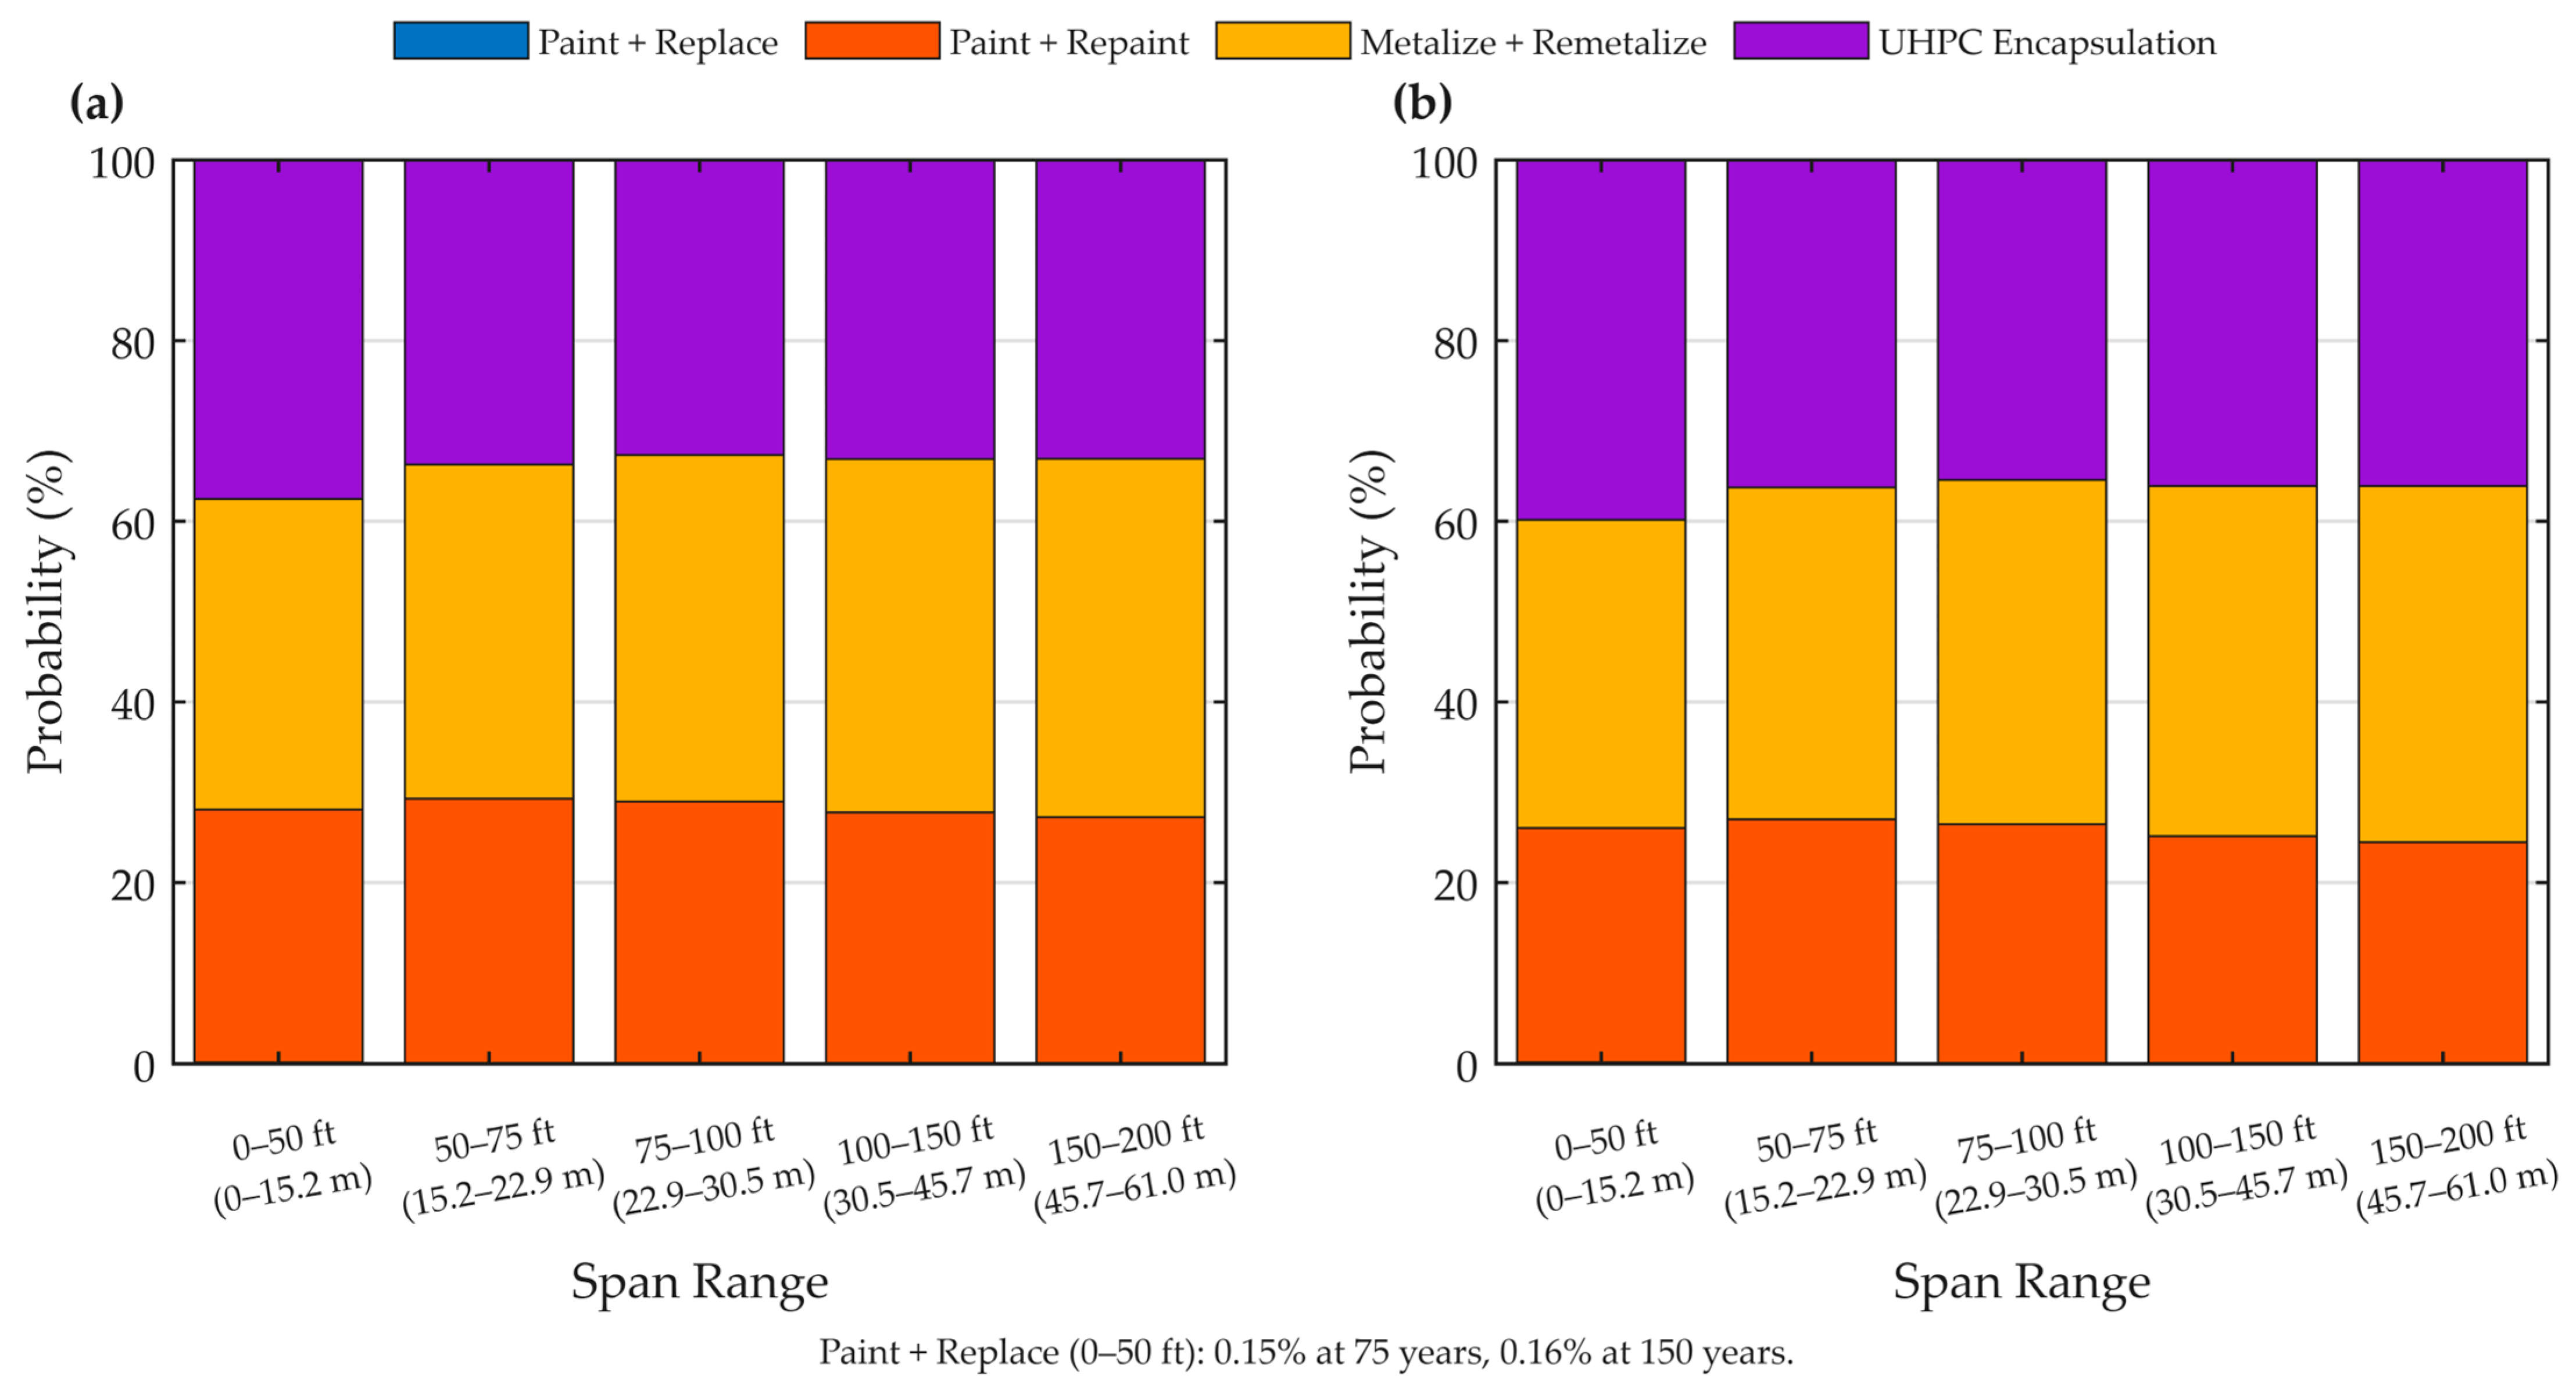
The lowest-cost probabilities showed a consistent difference between the mean-cost and realization-level rankings (Figure 6). At 75 years, UHPC encapsulation had the highest probability of being the lowest-cost strategy in the 0–50 ft (0–15.2 m) group, at 37.53%. Metalize + Remetalize had the highest probability in the remaining four groups, ranging from 36.99% to 39.67%.
Figure 6.
Empirical probability that each protection strategy produces the lowest lifecycle cost at the (a) 75-year and (b) 150-year evaluation horizons.
The same span-dependent pattern remained at 150 years. UHPC had the highest probability in the 0–50 ft group, at 39.83%, whereas Metalize + Remetalize had the highest probability in the other four groups, ranging from 36.73% to 39.42%. Across all span groups, the 150-year probabilities ranged from 35.42% to 39.83% for UHPC, 34.11% to 39.42% for Metalize + Remetalize, and 24.47% to 27.01% for Paint + Repaint. Paint + Replace had a probability of 0.16% in the shortest-span group and zero, to the reported precision, in the remaining groups.
Although UHPC had the lowest mean lifecycle cost in every span group at both the 75- and 150-year horizons, Metalize + Remetalize had the highest lowest-cost probability in the four longer-span groups. However, no strategy dominated because the maximum lowest-cost probability remained below 40%, reflecting substantial overlap among the paired cost distributions.
3.4. Treatment-Quantity, Treatment-Only, and Service-Life Sensitivity
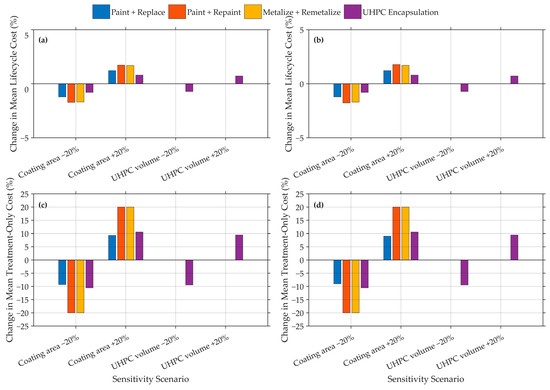
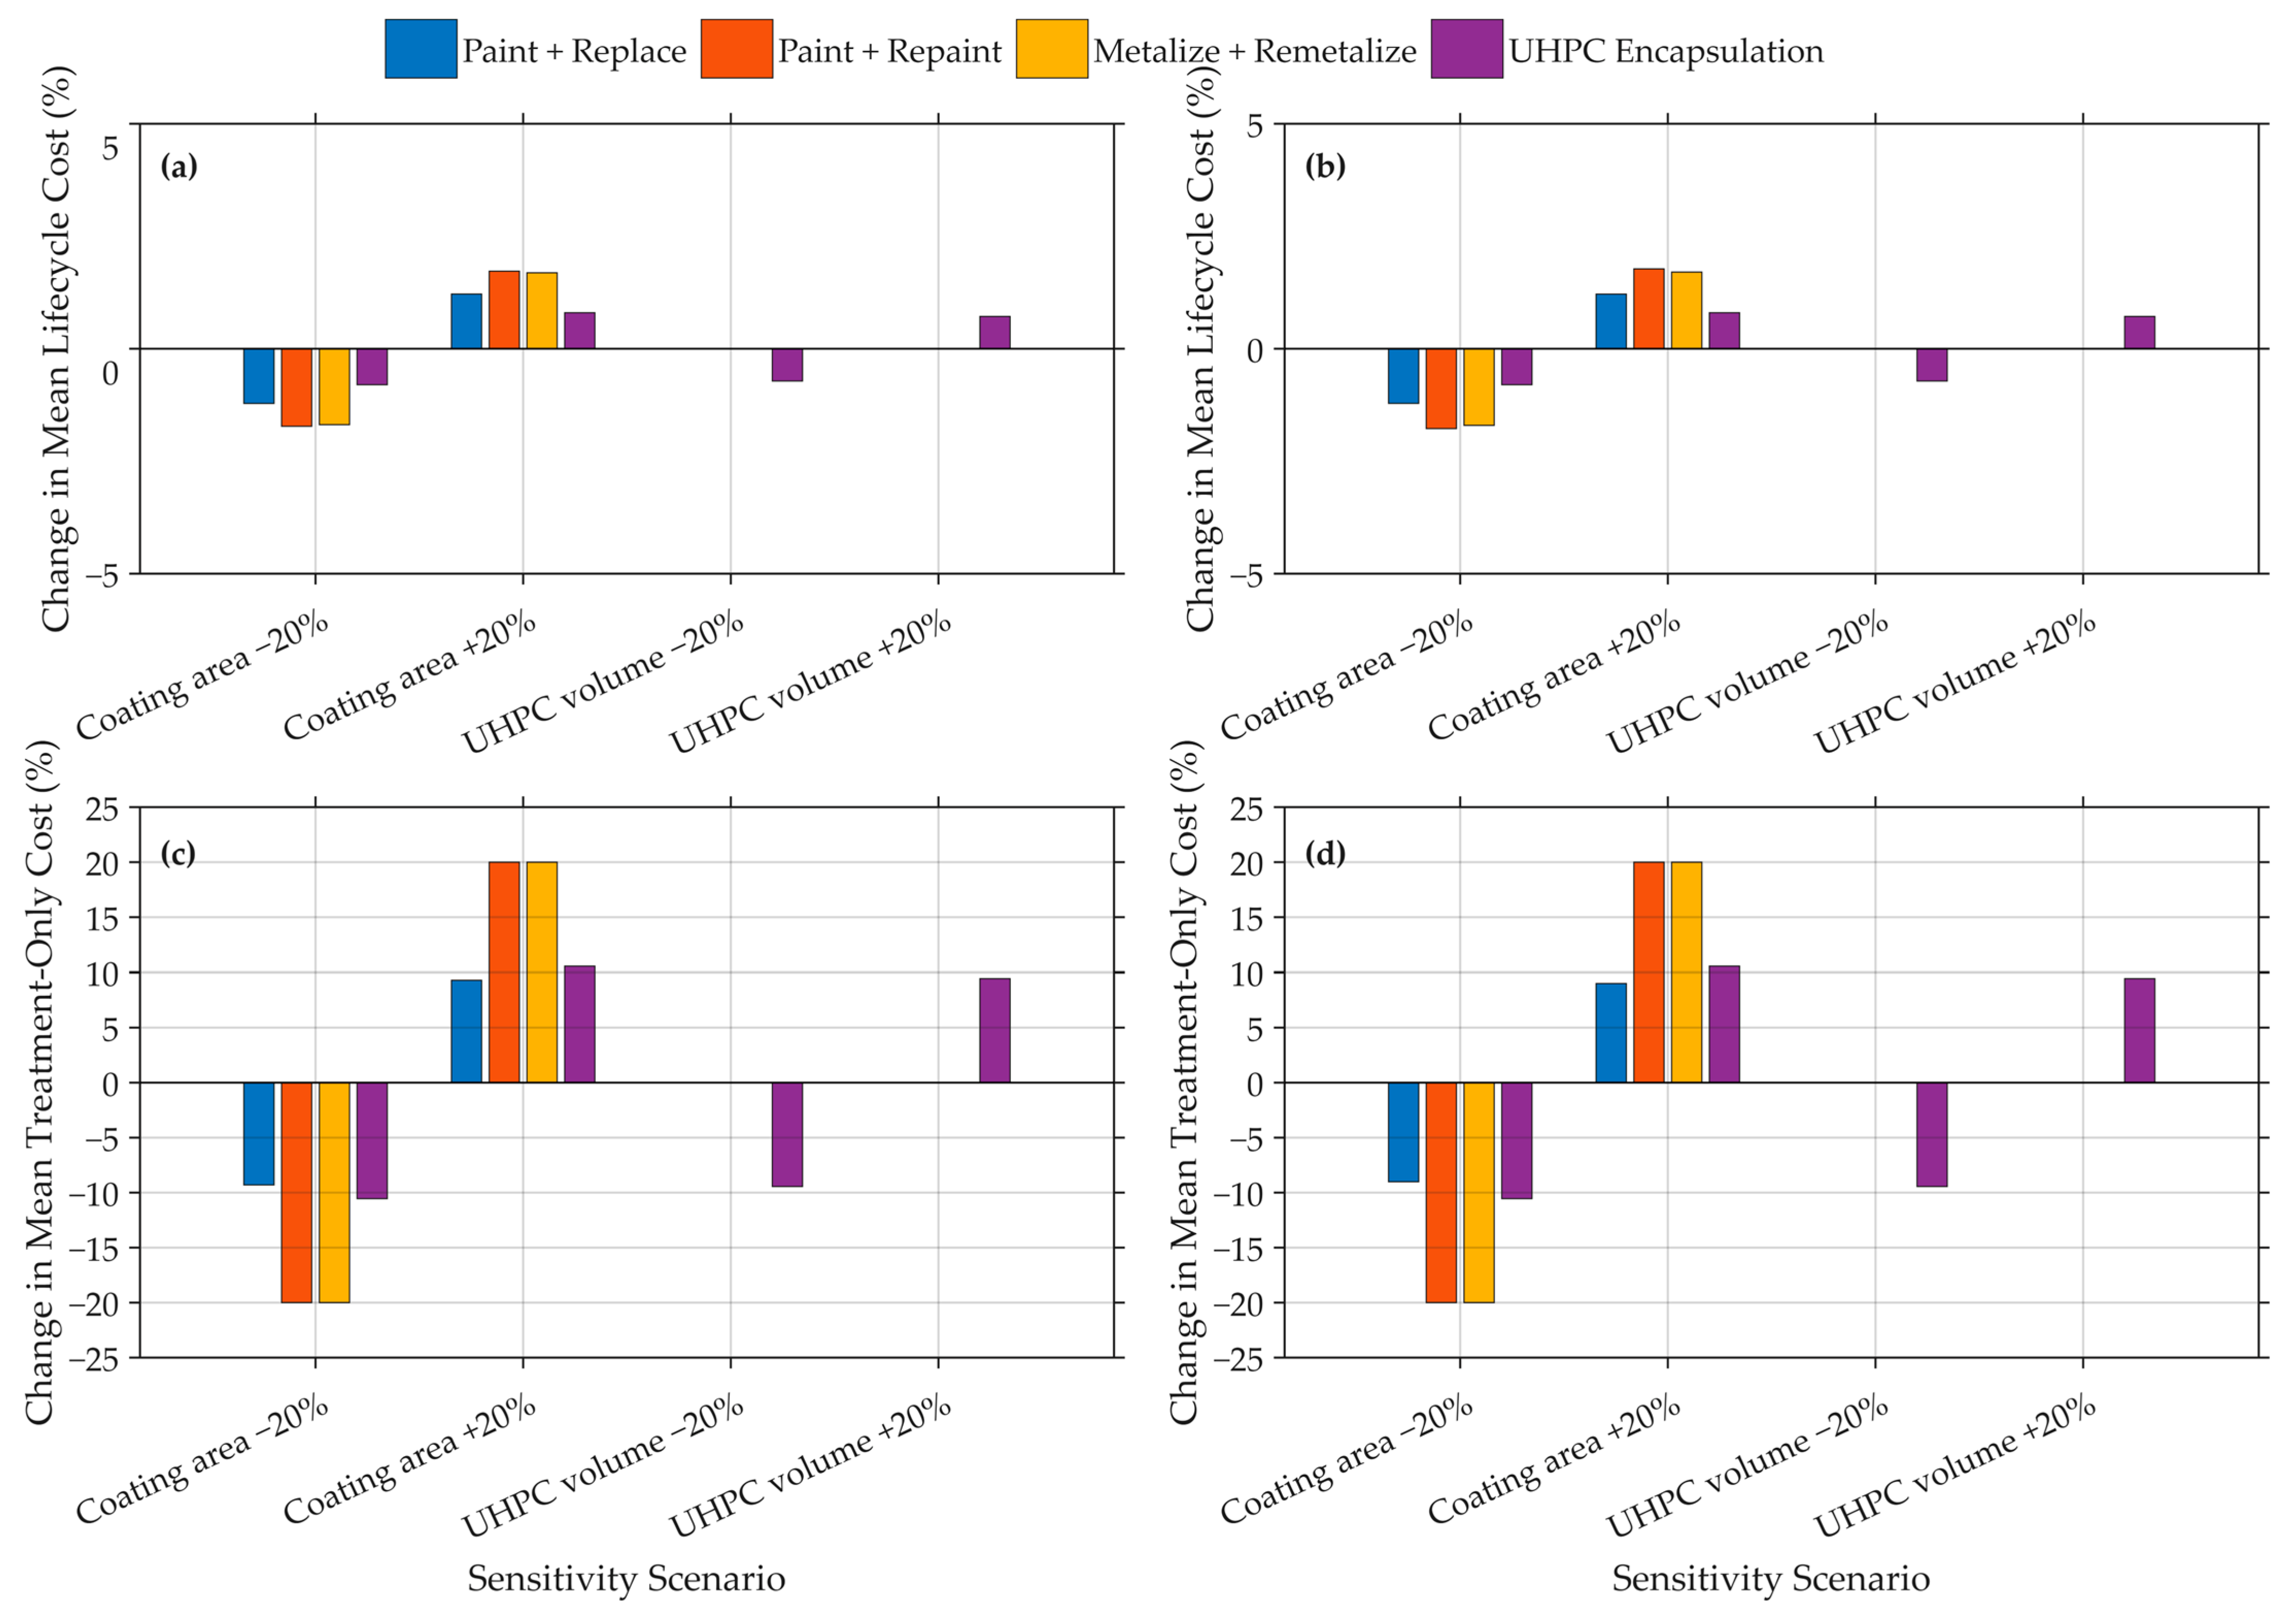
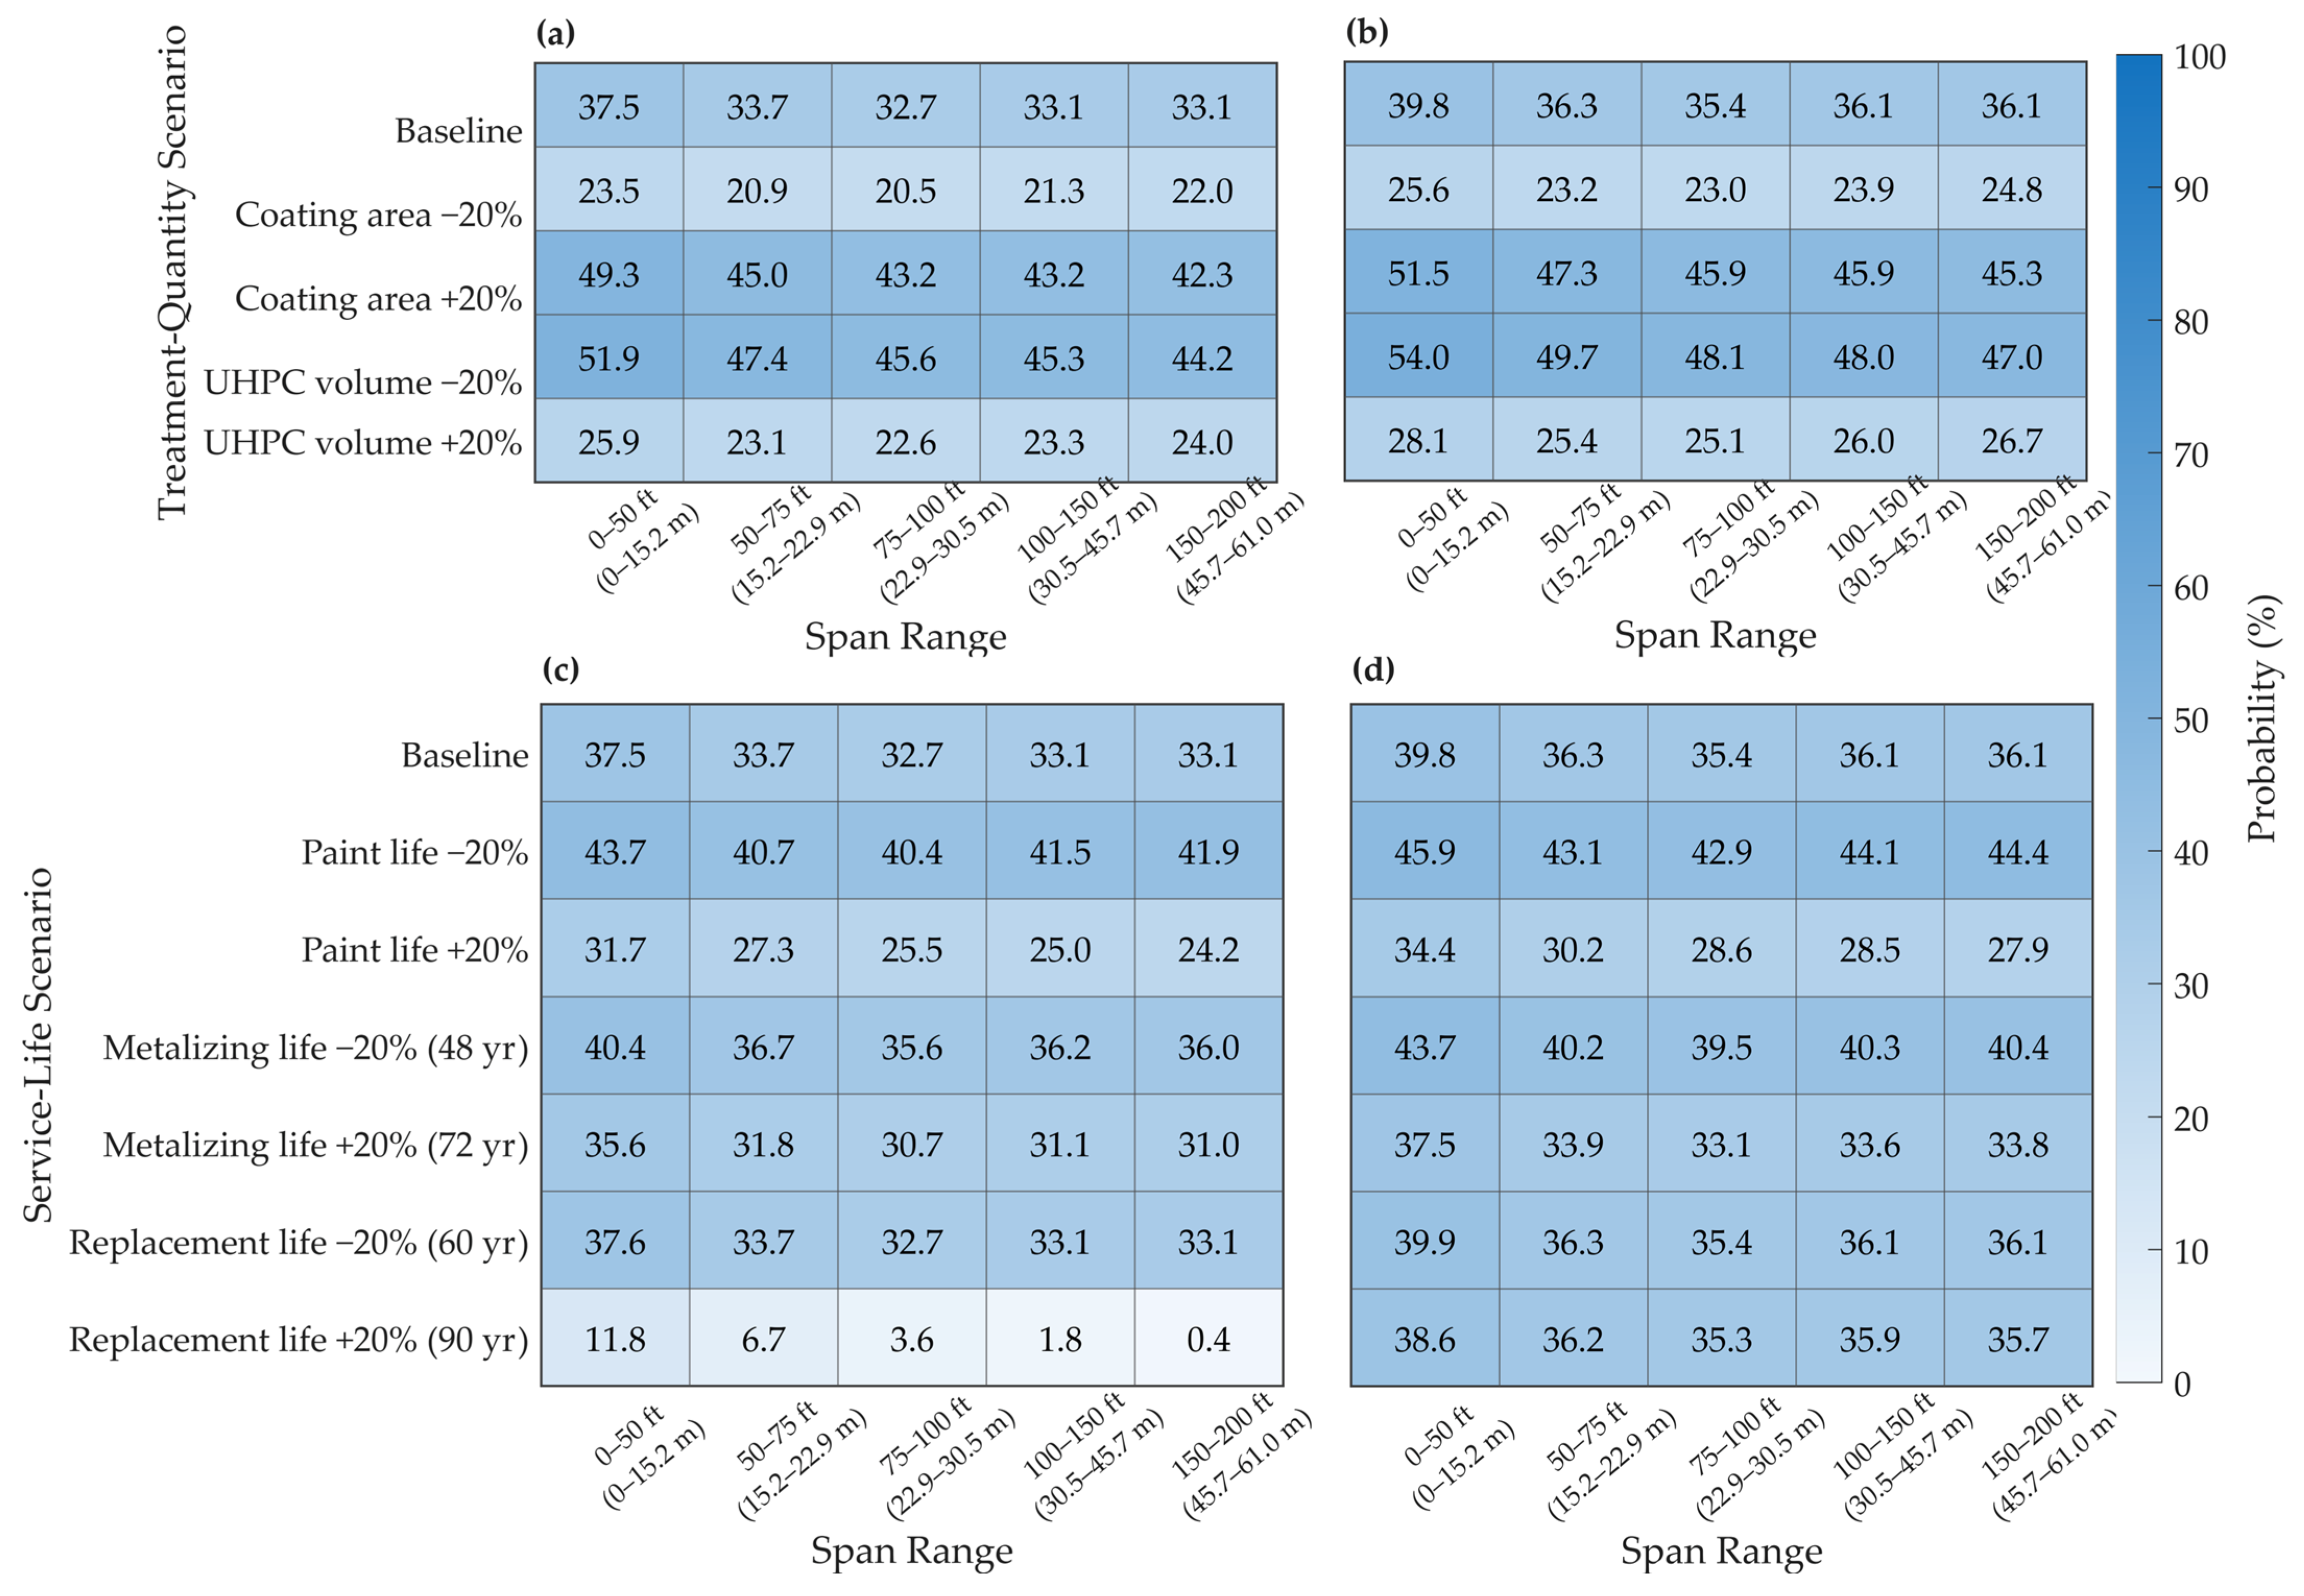
At 75 and 150 years, a ±20% change in coating area changed total mean lifecycle cost by 0.80–1.77% across the affected strategies, while a ±20% change in the UHPC volume changed the UHPC mean by 0.72% and did not affect the other strategies (Figure 7a,b). Removing the common initial steel cost made the treatment-specific effects more visible: coating-area changes produced ±20% changes for Paint + Repaint and Metalize + Remetalize and approximately 9–11% changes for Paint + Replace and UHPC encapsulation, while UHPC volume changes altered the UHPC treatment-only mean by approximately 9% (Figure 7c,d).
Figure 7.
Sensitivity of overall mean lifecycle cost to treatment-quantity variations at the (a) 75-year total-cost, (b) 150-year total-cost, (c) 75-year treatment-only, and (d) 150-year treatment-only horizons. Steel-weight cases are excluded from the primary figure.
The pooled overall mean-cost ordering remained UHPC encapsulation, Metalize + Remetalize, Paint + Repaint, and Paint + Replace in every treatment-quantity case. Reducing coating area by 20% nevertheless caused Metalize + Remetalize to marginally replace UHPC as the lowest-mean-cost strategy in the 50–75 ft (15.2–22.9 m) span group at both horizons. The highest-probability strategy also changed in one or more span groups under each coating-area and UHPC volume perturbation.
The mean common initial steel cost removed in the treatment-only analysis was $62.16k/girder. At 75 years, the treatment-only means were $9.35k/girder for Paint + Replace, $5.86k/girder for Paint + Repaint, $5.73k/girder for Metalize + Remetalize, and $5.11k/girder for UHPC encapsulation. The corresponding 150-year means were $9.68k, $6.05k, $5.79k, and $5.11k/girder. Because the same realization-specific initial steel cost was subtracted from every strategy, the treatment-only transformation did not change realization-level rankings or lowest-cost probabilities; future replacement steel remained included in Paint + Replace.
A 20% decrease in steel weight reduced the 150-year overall mean costs by 18.34% for Paint + Replace, 18.23% for Paint + Repaint, 18.30% for Metalize + Remetalize, and 18.48% for UHPC encapsulation; a 20% increase produced equal and opposite changes. Neither the lowest-mean-cost strategy nor the strategy with the highest lowest-cost probability changed.
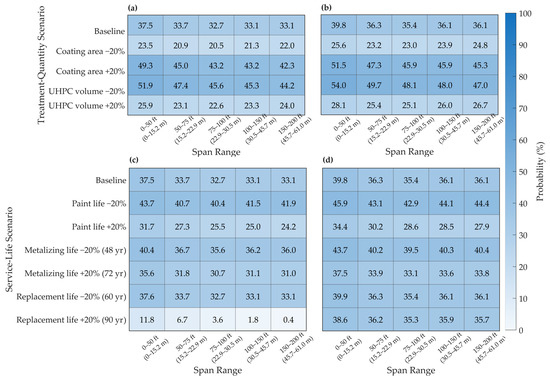
Figure 8 summarizes the span-specific lowest-cost probability results for both sensitivity families. For treatment quantity, reducing coating area or increasing UHPC volume lowered the probability that UHPC encapsulation was lowest cost in every span group, whereas increasing coating area or reducing UHPC volume raised it. These effects were similar at 75 and 150 years. For service life, shortening the paint life or metalizing interval increased UHPC’s lowest-cost probability, whereas extending those service lives decreased it. Extending the girder-replacement interval to 90 years produced the strongest horizon-dependent response: UHPC’s probability fell to 0.4–11.8% across the span groups at 75 years because no replacement occurred within that horizon, but remained close to baseline at 150 years after the 90-year replacement event was included. The 60-year replacement interval produced essentially no change in UHPC’s lowest-cost probability.
Figure 8.
Empirical probability that UHPC encapsulation produces the lowest lifecycle cost by span group under treatment-quantity sensitivity at the (a) 75-year and (b) 150-year horizons and service-life sensitivity at the (c) 75-year and (d) 150-year horizons. Treatment-quantity cases include ±20% changes in coating area and UHPC volume; service-life cases include ±20% changes in paint life, metalizing intervals of 48 and 72 years, and girder-replacement intervals of 60 and 90 years. Steel-weight cases are excluded.
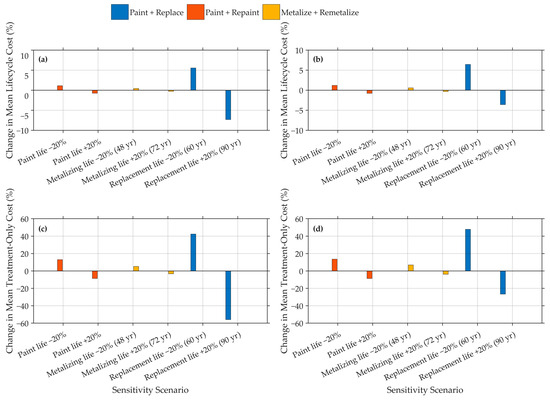
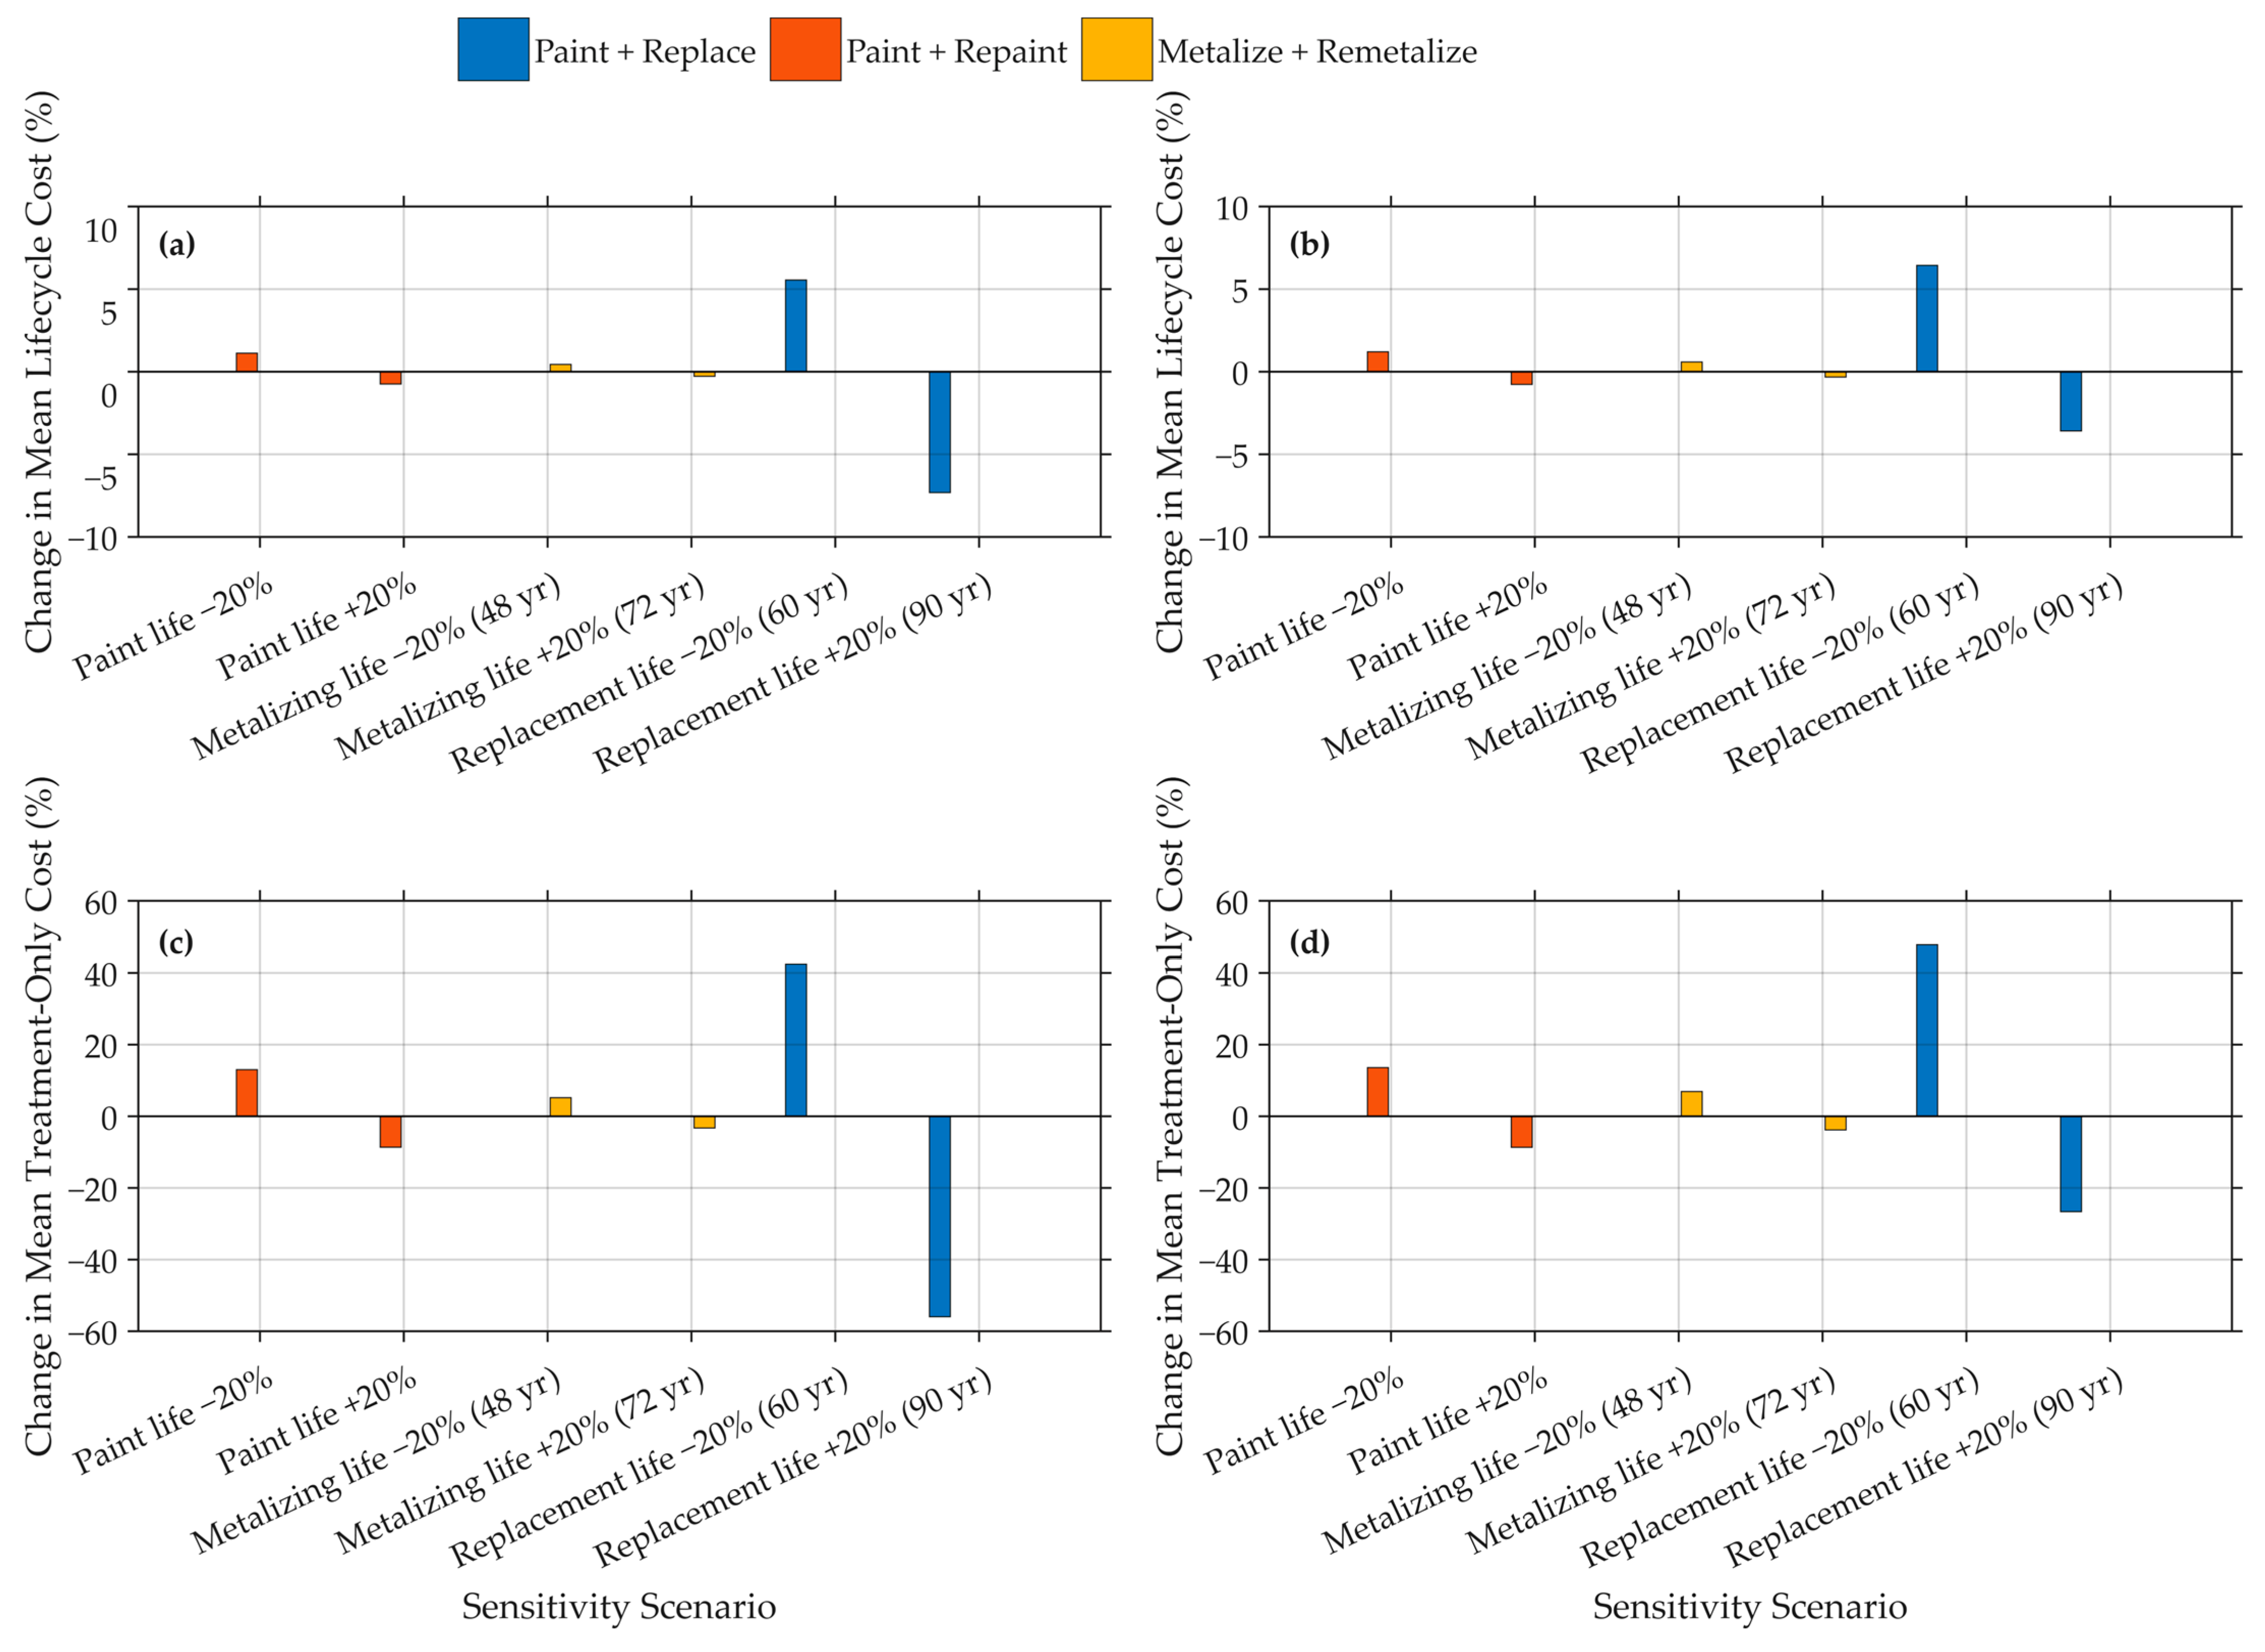
Service-life effects were strategy-specific (Figure 9). Reducing paint life by 20% increased the Paint + Repaint total mean by 1.12% at 75 years and 1.21% at 150 years, while increasing paint life by 20% reduced it by 0.74% and 0.77%. Metalizing intervals of 48 years increased the Metalize + Remetalize total mean by 0.44% and 0.59%, whereas 72-year intervals reduced it by 0.28% and 0.32%. Changing the replacement interval had the largest total-cost effect: a 60-year interval increased Paint + Replace by 5.55% and 6.44%, while a 90-year interval reduced it by 7.31% and 3.59% at the two horizons.
Figure 9.
Sensitivity of overall mean lifecycle cost to service-life assumptions at the (a) 75-year total-cost, (b) 150-year total-cost, (c) 75-year treatment-only, and (d) 150-year treatment-only horizons.
Treatment-only percentages were larger because the common initial steel cost no longer diluted the strategy-specific intervention effects. The 60-year replacement case increased Paint + Replace treatment-only cost by 42.47% at 75 years and 47.77% at 150 years; the 90-year case reduced it by 55.96% and 26.62%. With a 90-year replacement interval, Paint + Replace had the lowest overall mean cost at 75 years ($66.28k/girder), below UHPC ($67.27k/girder); UHPC remained lowest at 150 years.
3.5. UHPC Break-Even Cost and Pairwise Competitiveness
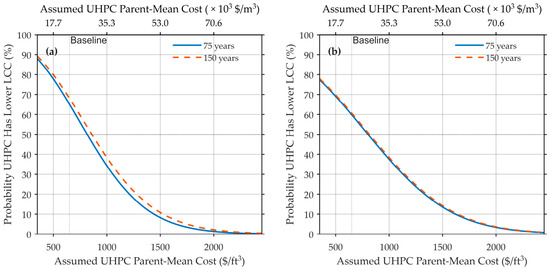
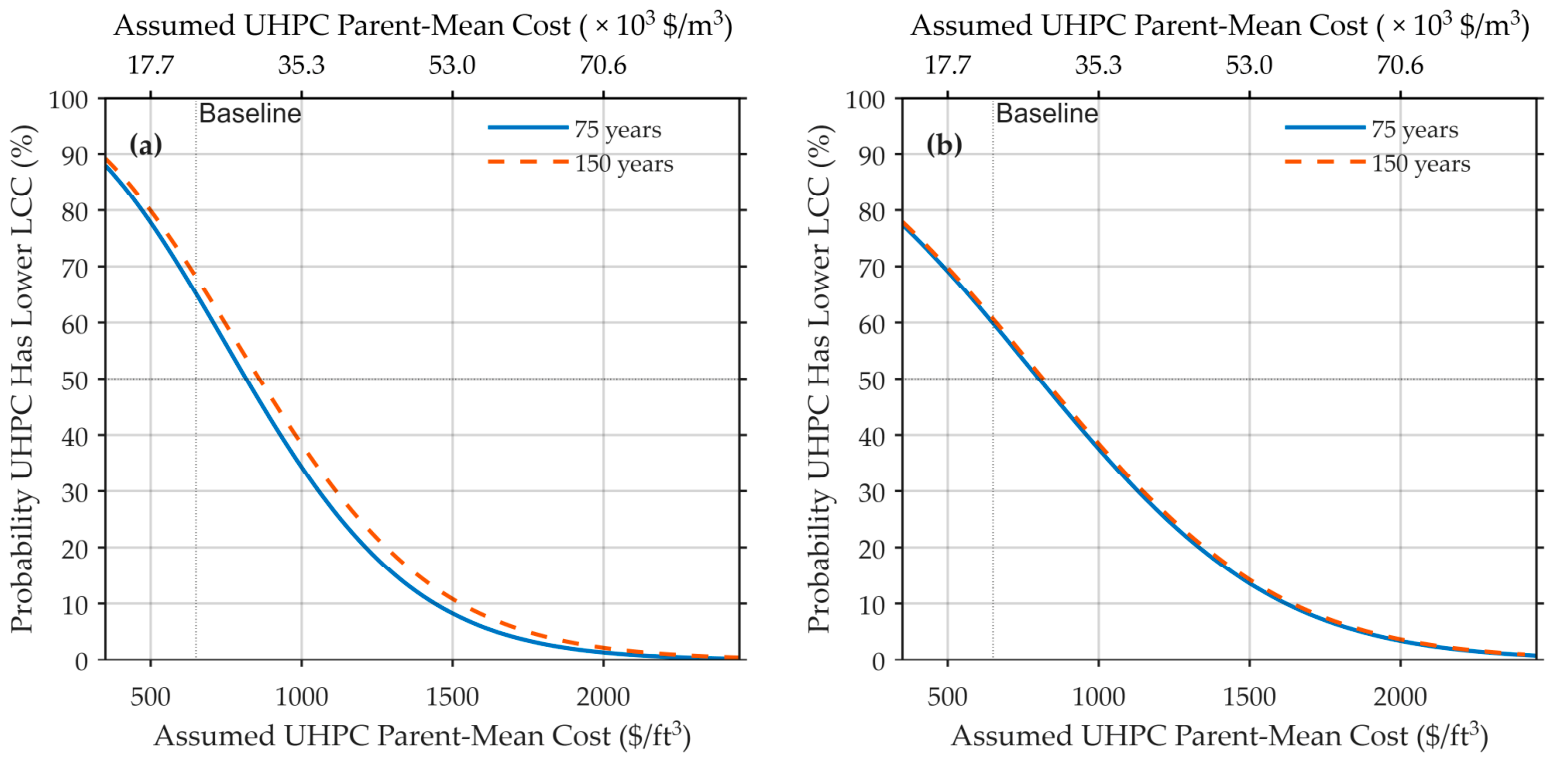
All four mean-cost break-even thresholds exceeded the baseline UHPC parent-mean unit cost of $650/ft3 ($22,955/m3), indicating that the assumed UHPC cost could increase before its overall mean lifecycle cost equaled either comparator (Table 7). The thresholds were higher at 150 years than at 75 years for both comparisons and were consistently higher against Paint + Repaint than against Metalize + Remetalize. The largest margin above baseline occurred against Paint + Repaint at 150 years, whereas the smallest occurred against Metalize + Remetalize at 75 years.
Table 7.
Mean-cost break-even UHPC unit costs relative to recurring coating strategies.
The probability that UHPC had a lower paired lifecycle cost decreased as its assumed parent-mean cost increased (Figure 10). The median realization-level break-even values, which represent the approximate 50% pairwise crossover points, were lower than the corresponding mean-cost break-even thresholds for all four comparator–horizon combinations. Therefore, equality of overall mean costs did not correspond to UHPC being less expensive in exactly half of the paired realizations. The broad interquartile ranges in Table 7 further indicate substantial realization-level variation in the UHPC cost at which the preferred alternative changed.
Figure 10.
Pairwise probability that UHPC encapsulation produces a lower lifecycle cost than (a) Paint + Repaint and (b) Metalize + Remetalize as a function of the assumed UHPC parent-mean cost.
3.6. Effect of Repainting the Remaining UHPC-Strategy Paint
Including repainting of the remaining painted region increased the overall mean UHPC lifecycle cost by $1.14k and $1.27k per girder at 75 and 150 years, respectively (Table A2). UHPC consequently ranked third in overall mean cost at both horizons, behind metalizing and repainting. Its overall lowest-cost probability decreased from 35.86% to 12.83% at 75 years and from 38.32% to 13.25% at 150 years. Metalizing had both the lowest mean cost and the highest lowest-cost probability in every span group under this scenario (Table A3). These results demonstrate the influence of maintaining the remaining painted region on UHPC’s economic competitiveness.
4. Discussion
4.1. Influence of Span and Intervention Timing
Lifecycle costs increased with the span because longer girders required more steel and larger treatment quantities. Absolute cost differences widened, although relative differences remained modest because the initial steel cost was common to all alternatives. Span therefore strongly affected total cost but had less influence on the overall mean-cost ranking.
Long-term differences also reflected intervention timing. Paint + Repaint and Metalize + Remetalize accumulated discounted renewal costs, while Paint + Replace included girder replacement and removal at 75-year intervals. Including terminal-year interventions without residual-value credit may be conservative, particularly where replacements retain service potential beyond the analysis horizon.
UHPC’s lower mean cost under the original maintenance scenario reflected the assumed absence of maintenance for both the encasement and remaining paint. Accounting for repainting shifted the overall mean-cost ranking, with metalizing first and UHPC third at both horizons (Section 3.6). These findings highlight the influence of maintenance assumptions, while maintenance-free performance over 150 years has not yet been established for preventive encapsulation.
4.2. Economic Performance Under Uncertainty
Under the original scenario, UHPC had the lowest mean lifecycle cost in every span group at both horizons, while metalizing had the highest lowest-cost probability in the four longer-span groups. Mean cost reflects the magnitude of all outcomes; lowest-cost probability measures how often a strategy is cheaper than its alternatives. UHPC could therefore achieve larger savings in some realizations while metalizing was slightly cheaper more frequently. The skewed, overlapping cost distributions support interpreting both measures together.
Under consistent repainting, metalizing led both measures in every span group. Nevertheless, its lowest-cost probability remained below 52%, indicating substantial uncertainty in realization-level outcomes. Neither scenario establishes a universally preferred treatment.
4.3. Sensitivity and UHPC Cost Thresholds
Under the original scenario, treatment-quantity changes had modest effects on total mean costs but larger effects on treatment-only costs. The overall mean-cost ordering remained unchanged across quantity cases, although selected span-specific mean-cost and probability rankings changed. Subtracting the common initial steel cost exposed treatment differences without changing realization-level rankings.
Service-life effects depended on whether interventions occurred within each horizon. Extending replacement life to 90 years made Paint + Replace the lowest-mean-cost strategy at 75 years because no replacement occurred within that horizon; this advantage disappeared at 150 years. These savings reflect assumed intervention lives and do not establish benefits from deferring maintenance, since deterioration-related condition loss, emergency work, and major rehabilitation were excluded.
The original-scenario UHPC mean-cost break-even thresholds of $822.79–911.02/ft3 ($29,057–32,172/m3) exceeded the baseline $650/ft3 ($22,955/m3). They represent equality of pooled mean costs with each comparator and not 50% pairwise crossover points or the highest four-strategy lowest-cost probability. Their applicability depends on treatment quantities, maintenance schedules, unit-cost distributions, and discount rates. They are conditional screening values and do not apply unchanged to the consistent-repainting scenario.
4.4. Practical Implications and Transferability
The span-dependent comparison extends previous fixed-configuration lifecycle-cost studies [22,23,24] by examining how treatment quantities affect mean costs and lowest-cost probabilities. Because 60.23% of realizations fell within the modeled 20–50 ft range, overall results are weighted toward shorter spans; project screening should therefore also consider the corresponding span-group results. However, the ranking change under consistent repainting shows that span alone cannot determine treatment selection. Project screening should combine expected expenditure, lowest-cost probability, and applicable cost thresholds with local geometry, bid prices, maintenance intervals, and economic assumptions.
Final selection should also consider exposure, access, traffic control, staging, contractor capability, constructability, and construction risk. Intervention intervals should reflect agency experience and observed condition.
4.5. Limitations and Future Research
The analysis used prescribed intervention schedules without explicitly modeling corrosion progression, coating degradation, UHPC deterioration, or treatment failure. Other limitations include constant real unit costs, no residual-value adjustment, and exclusion of user, inspection, detailed traffic-control, engineering, and environmental costs. The representative girder generator supplied span-dependent quantities without evaluating all structural limit states.
Shared geometry, steel cost, discount rate, and paint-related inputs induced dependence among strategy costs. However, independently sampled treatment unit costs did not explicitly capture correlations associated with shared access, surface preparation, and mobilization. Lowest-cost probabilities remain conditional on this input structure.
Alternative real discount rates could change the relative importance of future interventions, particularly over 150 years: lower rates increase their present value, whereas higher rates reduce this. Future work should incorporate field monitoring of UHPC-encapsulated ends, condition-based maintenance models, locally calibrated joint inputs, project-level designs, residual-value or equivalent-annual-cost methods, and user and environmental impacts.
5. Conclusions
This study compared four localized weathering-steel girder-end protection strategies across one million paired simple-span girder realizations spanning 20–200 ft (6.1–61.0 m). The framework links span-dependent treatment quantities and uncertain economic inputs to lifecycle costs, lowest-cost probabilities, sensitivity analyses, and UHPC cost thresholds.
Under the original maintenance scenario, which assigned no future maintenance to either the UHPC encasement or the remaining painted region, UHPC had the lowest mean cost in every span group at 75 and 150 years. Metalizing was more frequently the lowest-cost strategy in the four longer-span groups, demonstrating that mean cost and lowest-cost probability provide complementary information. Under consistent repainting, metalizing had the lowest mean cost and highest lowest-cost probability in every span group. At 150 years, repainting the remaining painted region increased the mean UHPC cost from $67.27k to $68.54k per girder, placing it behind metalizing at $67.95k/girder and Paint + Repaint at $68.22k/girder. The original UHPC advantage therefore depends on the maintenance assumption; maintenance-free performance over 150 years has not been established for this application.
Sensitivity analyses under the original maintenance scenario showed that ±20% changes in treatment quantities preserved the overall mean-cost ordering but altered selected span-specific rankings. Service-life effects depended on intervention timing: a 90-year replacement interval made Paint + Replace the lowest-mean-cost strategy at 75 years, while UHPC remained lowest at 150 years. The original-scenario UHPC mean-cost break-even thresholds ranged from $822.79 to $911.02/ft3, exceeding the baseline value of $650/ft3. These thresholds remain conditional on treatment quantities, maintenance schedules, unit-cost distributions, and discount rates.
The framework supports project-specific evaluation after local calibration, but neither maintenance scenario establishes a universally preferred treatment. Treatment selection should consider span, maintenance requirements, exposure, access, and constructability. Field-validated deterioration and maintenance models are needed to strengthen these economic comparisons.
Author Contributions
Conceptualization, S.S., A.H. and K.Z.; methodology, S.S., A.H. and K.Z.; software, S.S.; validation, S.S., A.H. and K.Z.; formal analysis, S.S.; investigation, S.S. and A.H.; resources, A.H.; data curation, S.S. and K.Z.; writing—original draft preparation, S.S.; writing—review and editing, S.S., A.H. and K.Z.; visualization, S.S. and A.H.; supervision, A.H.; project administration, A.H.; funding acquisition, A.H. All authors have read and agreed to the published version of the manuscript.
Funding
This research was supported by the Connecticut Cooperative Transportation Research Program, CCTRP 20-02: Beam End Encasement for the Construction of Maintenance-Free Steel Bridges.
Data Availability Statement
The data supporting the findings of this study, including the generated Monte Carlo simulation outputs, are available from the corresponding author upon reasonable request. Publicly available datasets and sources used to develop model inputs are cited in the article.
Acknowledgments
During the preparation of this work the authors used ChatGPT (GPT-5.6 Sol; OpenAI) in order to improve language clarity and enhance readability.
Conflicts of Interest
The author Kevin Zmetra was employed by the company CHA Consulting, Inc. The authors declare no conflicts of interest. The funders had no role in the design of the study; in the collection, analyses, or interpretation of data; in the writing of the manuscript; or in the decision to publish the results.
Appendix A
Appendix A.1. Representative Girder Geometry
Figure A1.
Representative composite plate girder selected from the simulated population: (a) cross-section and principal dimensions; (b) UHPC encapsulation and remaining painted lengths at one end; and (c) span and equivalent UHPC volume model. The treatment is applied at both girder ends. All views are schematic and not to scale.
Appendix A.2. Treatment Quantities and Initial Costs
For the girder in Figure A1, the total steel depth is D = 20 + 2 × 0.875 = 21.75 in. The treatment length at each end is lc = 1.5 × 21.75 + 9 = 41.625 in., leaving 41.625 − 18 = 23.625 in. of paint outside the UHPC region. Using the quantity relationships in Section 2.5.1, the total coating area and remaining painted area across both ends are:
The total UHPC volume, including the 1.20 quantity allowance and the 6 in. equivalent thickness, is:
The sampled steel, paint, metalizing, and UHPC unit costs are $7.107344/lb, $55.236183/ft2, $82.136154/ft2, and $639.690154/ft3, respectively. These values belong to this realization instead of representing distribution means. The steel cost, including the 10% ancillary-steel allowance, is:
Cs = 1.10 × 150.4323 × 48.6524296 × 7.107344 = $57,219.71
Multiplying treatment quantities by their unit costs gives $3688.31 for full-area painting, $5484.51 for metalizing, $1919.07 for UHPC, and $2093.37 for the remaining paint. Adding the appropriate treatment costs to the steel cost gives the initial strategy costs in Table A1. Calculations use unrounded inputs; displayed values are rounded.
Appendix A.3. Discounted Lifecycle Costs
This realization has a paint service life of 35.84503 years and a real discount rate of 4.36636%. The lifecycle cost at a given horizon (T) is calculated using Equation (3).
Paint + Repaint incurs $3688.31 at each paint-life interval, and Metalize + Remetalize incurs $5484.51 every 60 years. Paint + Replace incurs $92,325.10 every 75 years, comprising $60,908.02 for replacement steel and painting plus $31,417.08 for removal. Events occurring exactly at the horizon are included, with no residual-value adjustment.
Under the original maintenance scenario, UHPC has no future intervention costs. Under the consistent-repainting scenario, its remaining painted region incurs $2093.37 at each sampled paint-life interval. The discounted additions are $550.20 at 75 years and $575.90 at 150 years.
Table A1.
Initial and lifecycle costs for the representative girder, in constant 2026 dollars.
Appendix B
The following tables compare the original maintenance scenario with the consistent-repainting scenario, in which the remaining painted region outside the UHPC encapsulation receives periodic repainting.
Table A2.
Overall comparison of the original and consistent-repainting scenarios. Mean costs are in $k/girder.
Table A3.
Span-dependent comparison of UHPC and metalizing under the consistent-repainting scenario. Mean costs are in $k/girder.
References
- Nickerson, R.L. Performance of Weathering Steel in Highway Bridges: A Third Phase Report; American Iron and Steel Institute: Washington, DC, USA, 1995. [Google Scholar]
- McConnell, J.; Shenton, H.W.; Mertz, D.R.; Kaur, D. National Review on Use and Performance of Uncoated Weathering Steel Highway Bridges. J. Bridge Eng. 2014, 19, 04014009. [Google Scholar] [CrossRef] [Scilit]
- Albrecht, P.; Naeemi, A.H. Performance of Weathering Steel in Bridges; Transportation Research Board: Washington, DC, USA, 1984. [Google Scholar]
- Albrecht, P.; Coburn, S.K.; Wattar, F.M.; Tinklenberg, G.L.; Gallagher, W.P. Guidelines for the Use of Weathering Steel in Bridges; Transportation Research Board: Washington, DC, USA, 1989. [Google Scholar]
- McDad, B.; Laffiey, D.; Dammann, M.; Medlock, R. Performance of Weathering Steel in TxDOT Structures; Texas Department of Transportation: Austin, TX, USA, 2000.
- Gonzalez, Y.; Heymsfield, E. Evaluating Arkansas Weathering Steel Bridge Performance. J. Perform. Constr. Facil. 2023, 37, 04023041. [Google Scholar] [CrossRef] [Scilit]
- Heymsfield, E.; Gonzalez, Y. Investigating Oxide Film Degradation at Arkansas Weathering Steel Bridges. J. Perform. Constr. Facil. 2024, 38, 04024013. [Google Scholar] [CrossRef] [Scilit]
- Federal Highway Administration. Uncoated Weathering Steel in Structures; Federal Highway Administration: Washington, DC, USA, 1989.
- National Steel Bridge Alliance. Uncoated Weathering Steel Reference Guide; National Steel Bridge Alliance: Chicago, IL, USA, 2022. [Google Scholar]
- CHA Companies, Inc. Study of Corrosion Performance of Weathering Steel Bridges; Connecticut Department of Transportation: Newington, CT, USA, 2021.
- Kodumuri, P.; Lee, S.-K. Federal Highway Administration 100-Year Coating Study; Federal Highway Administration: McLean, VA, USA, 2012.
- Federal Highway Administration. FHWA Bridge Coatings Technical Note: Metallized Steel Bridge Coatings; Federal Highway Administration: Washington, DC, USA, 1997.
- Zmetra, K.M.; McMullen, K.F.; Zaghi, A.E.; Wille, K. Experimental Study of UHPC Repair for Corrosion-Damaged Steel Girder Ends. J. Bridge Eng. 2017, 22, 04017037. [Google Scholar] [CrossRef] [Scilit]
- McMullen, K.F.; Zaghi, A.E. Experimental Evaluation of Full-Scale Corroded Steel Plate Girders Repaired with UHPC. J. Bridge Eng. 2020, 25, 04020011. [Google Scholar] [CrossRef] [Scilit]
- Hain, A.; Zaghi, A.E. Learnings from the Field Implementation of a Novel Ultra-High Performance Concrete Beam End Repair on a Corroded Steel Girder Bridge in Connecticut. Transp. Res. Rec. J. Transp. Res. Board 2021, 2675, 703–714. [Google Scholar] [CrossRef] [Scilit]
- Haber, Z.B.; Foden, A.; McDonagh, M.; Ocel, J.M.; Zmetra, K.; Graybeal, B.A. Design and Construction of UHPC-Based Bridge Preservation and Repair Solutions; Federal Highway Administration, Office of Research, Development, and Technology: McLean, VA, USA, 2022.
- Lassy, B.; Hain, A.; Motaref, S. UHPC Beam End Encasement for the Design of Maintenance-Free Steel Bridges. In Bridge Maintenance, Safety, Management, Digitalization and Sustainability; CRC Press: Boca Raton, FL, USA, 2024; pp. 2245–2252. [Google Scholar]
- Lassy, B.; Hain, A. Experimental Evaluation of Steel Diaphragms Anchored to UHPC Bearing Stiffeners. In Proceedings of the International Interactive Symposium on Ultra-High Performance Concrete Papers; Iowa State University Digital Press: Ames, IA, USA, 2026; Volume 4. [Google Scholar]
- New York State Department of Transportation. NYSDOT Weighted Average Item Price Report; New York State Department of Transportation: Albany, NY, USA, 2024.
- Hossain, A.; Chang, C.M. Modeling Life Expectancy and Cost Effectiveness for UHPC Bridge Retrofitting Techniques. ABEN 2024, 5, 9. [Google Scholar] [CrossRef] [Scilit]
- Connecticut Department of Transportation. Master Item Bid List; Connecticut Department of Transportation: Newington, CT, USA, 2026.
- Okasha, N.M.; Frangopol, D.M.; Fletcher, F.B.; Wilson, A.D. Life-Cycle Cost Analyses of a New Steel for Bridges. J. Bridge Eng. 2012, 17, 168–172. [Google Scholar] [CrossRef] [Scilit]
- Soliman, M.; Frangopol, D.M. Life-Cycle Cost Evaluation of Conventional and Corrosion-Resistant Steel for Bridges. J. Bridge Eng. 2015, 20, 06014005. [Google Scholar] [CrossRef] [Scilit]
- Kere, K.J.; Huang, Q. Life-Cycle Cost Comparison of Corrosion Management Strategies for Steel Bridges. J. Bridge Eng. 2019, 24, 04019007. [Google Scholar] [CrossRef] [Scilit]
- Connecticut Department of Transportation. Life-Cycle Cost Analysis Guidance for CTDOT Bridge Projects; Connecticut Department of Transportation: Newington, CT, USA, 2021.
- Knudsen, O.Ø.; Matre, H.; Dørum, C.; Gagné, M. Experiences with Thermal Spray Zinc Duplex Coatings on Road Bridges. Coatings 2019, 9, 371. [Google Scholar] [CrossRef] [Scilit]
- Dong, Y. Performance Assessment and Design of Ultra-High Performance Concrete (UHPC) Structures Incorporating Life-Cycle Cost and Environmental Impacts. Constr. Build. Mater. 2018, 167, 414–425. [Google Scholar] [CrossRef] [Scilit]
- Morcous, G.; Tadros, M.K. UHPC Decked I-Beam for Accelerated Bridge Construction; Nebraska Department of Transportation (NDOT): Lincoln, NE, USA, 2023.
- Wang, X.Q.; Chow, C.L.; Lau, D. Multiscale Perspectives for Advancing Sustainability in Fiber Reinforced Ultra-High Performance Concrete. npj Mater. Sustain. 2024, 2, 13. [Google Scholar] [CrossRef] [Scilit]
- Federal Highway Administration. LTBP InfoBridge. Available online: https://infobridge.fhwa.dot.gov/ (accessed on 18 July 2026).
- Connecticut Department of Transportation. 2026 Estimating Guidelines; Connecticut Department of Transportation: Newington, CT, USA, 2026.
- Federal Highway Administration. Life-Cycle Cost Analysis Primer; Federal Highway Administration, Office of Asset Management: Washington, DC, USA, 2002.
- Haber, Z.B.; McDonagh, M.; Foden, A.; Sadasivam, S. Ultra-High Performance Concrete (UHPC) Overlays: An Example of Lifecycle Cost Analysis; Federal Highway Administration, Office of Research, Development, and Technology: McLean, VA, USA, 2022.
- Graybeal, B.A. Development of Non-Proprietary Ultra-High Performance Concrete for Use in the Highway Bridge Sector; Federal Highway Administration: McLean, VA, USA, 2013.
- Berry, M.; Hendricks, E.; Matteson, K. Feasibility of Non-Proprietary Ultra-High Performance Concrete (UHPC) for Use in Highway Bridges in Montana: Phase III Implementation; Montana Department of Transportation: Helena, MT, USA, 2023.
- American Association of State Highway and Transportation Officials. AASHTO LRFD Bridge Design Specifications, 9th ed.; American Association of State Highway and Transportation Officials: Washington, DC, USA, 2020. [Google Scholar]

Disclaimer/Publisher’s Note: The statements, opinions and data contained in all publications are solely those of the individual author(s) and contributor(s) and not of MDPI and/or the editor(s). MDPI and/or the editor(s) disclaim responsibility for any injury to people or property resulting from any ideas, methods, instructions or products referred to in the content. |
© 2026 by the authors. Licensee MDPI, Basel, Switzerland. This article is an open access article distributed under the terms and conditions of the Creative Commons Attribution (CC BY) license.