


Abstract
Recent earthquakes have shown that earthquake-induced landslides and liquefaction can severely disrupt transportation systems and generate significant direct and indirect losses. Still, these secondary hazards are rarely incorporated into regional road-network disruption assessments. This paper presents a scenario-based multi-hazard methodology, implemented in the OpenQuake-engine, for integrating ground shaking, earthquake-induced landslides, and liquefaction into transportation-network analysis. The workflow combines hazard modelling, component-level damage and operability assessment, and network-based performance metrics. The methodology is demonstrated for the major road network of Southern Portugal using three representative earthquake scenarios. The results show that ground shaking is the dominant driver of regional disruption, but liquefaction and landslides can contribute locally to asset non-operationality and connectivity loss, particularly where susceptible ground conditions coincide with critical network links. The results also show that multi-hazard impacts are not simply additive, because network disruption depends on the spatial configuration and overlap of affected components. Compared with ground-shaking-only analyses, the proposed approach provides a more complete representation of road-network disruption and helps identify locations where secondary hazards may compromise network redundancy and emergency accessibility.
1. Introduction
While ground-shaking is commonly regarded as the primary cause of structural damage during earthquakes, earthquake-induced ground failures, particularly landslides and liquefaction, often play a critical role in the disruption of critical lifelines. These processes can severely affect transportation networks, leading to prolonged service interruptions and reduced accessibility, especially during emergency response operations [1]. Given the essential role of road networks in emergency conditions, accounting for secondary hazards in seismic risk assessments is fundamental for capturing direct damage to the infrastructure components (e.g., bridges, tunnels, slopes) and for identifying network disruptions that may subsequently generate indirect losses, such as increased travel times, limited accessibility, and broader socio-economic impacts [2,3].
Past events have demonstrated the significant impact of secondary hazards on transportation networks worldwide. For instance, the 1964 moment magnitude (Mw) 7.5 Niigata earthquake in Japan [4] and the 1995 Mw 6.9 Kobe earthquake [5] caused widespread liquefaction, resulting in bridge failures and severe disruption to roads and port facilities. In contrast, the 2008 Mw 7.9 Wenchuan earthquake in China [6,7,8] highlighted the devastating effect of earthquake-induced landslides, with tens of thousands of slope failures blocking roads and railways and isolating entire regions for several days, thereby delaying rescue operations. More recent events, such as the 2016 Mw 7.8 Kaikōura earthquake in New Zealand [9] and the 2016–2017 seismic sequence in Central Italy [10], further confirmed the critical role of landslides in disrupting major transportation corridors.
Despite these observations, the integration of earthquake-induced hazards such as landslides and liquefaction into transportation network risk assessments remains limited. Existing studies have primarily focused on ground-shaking effects, while only a few examples incorporated secondary hazards. For example, Lo et al. [11] developed a joint probability model combining liquefaction-induced road damage with building collapse probabilities to evaluate road blockage risk in Taiwan, while Robinson et al. [12] proposed a geographic information system (GIS)-based framework to assess coseismic landslide exposure of road networks. Argyroudis et al. [13] and earlier studies by Stergiou and Kiremidjian [14] and Kiremidjian et al. [15] incorporated liquefaction and landslide effects within seismic risk assessments using the Federal Emergency Management Agency (FEMA) HAZUS-based approaches, in which hazard measures are related to infrastructure damage states through empirical fragility functions, with damage subsequently translated into component functionality or network consequences. These approaches provide a practical framework for regional assessment but often rely on simplified infrastructure classifications, generalized fragility relationships, and simplified representations of secondary-hazard effects, which can limit their applicability to multi-hazard analyses. Such simplifications may mask the spatial variability of the hazard and prevent the combined influence of different hazards on component damage and network connectivity from being evaluated consistently. An improved regional framework should therefore propagate hazard-specific intensity measures through component damage and network-performance assessment within a common workflow.
More broadly, the development of regional-scale, multi-hazard risk assessments for transportation networks presents several challenges. First, earthquake-induced landslides and liquefaction are governed by distinct physical processes and occur under different predisposing site conditions, requiring the definition of a wide range of input parameters that are often unavailable or highly uncertain at large spatial scales. This limits the possibility of applying highly detailed site-specific models consistently over large areas and requires transparent regional-scale assumptions and models compatible with spatially distributed datasets. In addition, fragility relationships for infrastructure components subjected to secondary hazards remain scarce and are often highly simplified. As a result, uncertainty arises not only from the hazard estimates but also from the translation of those hazards into component damage and functionality. For landslides, existing approaches frequently assume either complete destruction when roads intersect landslide paths [16] or define damage based on relative slope position [17,18], limiting their applicability at large scales. For liquefaction, most methodologies rely on intensity measures such as permanent ground deformation, as in HAZUS [19], or adopt threshold-based assumptions where damage is inferred directly from the occurrence of liquefaction [15,20].
In addition, transportation networks exhibit complex system behaviour, meaning that the consequences of damage cannot be adequately assessed through direct losses alone. Network-level performance can be evaluated using different approaches. Connectivity-based metrics capture changes in network topology, accessibility, and redundancy [13,21], whereas flow-based approaches coupled with traffic-assignment models provide a more detailed representation of transportation service by accounting for traffic demand, link capacity, congestion, route choice, and travel-time changes. Flow-based approaches, however, require additional data and modelling assumptions, including origin–destination demand, link capacities, and post-event traffic redistribution [22]. In the present study, a connectivity-based approach was adopted because the primary objective is to investigate the relative contribution of ground shaking, landslides, and liquefaction to road-network disruption, rather than to model post-earthquake traffic conditions explicitly. Consequently, the adopted metrics capture changes in accessibility and network connectivity, but do not explicitly represent capacity reductions, congestion, or traffic redistribution on links that remain traversable.
Finally, probabilistic regional risk analyses introduce further computational challenges, particularly when network performance must be evaluated repeatedly for multiple event realizations. Several studies have proposed strategies to reduce this burden, including the selection of representative scenarios [23], the use of reduced event sets [24], and importance sampling techniques [25]. Despite these advances, the availability of open-source tools capable of integrating multiple hazards, infrastructure damage, and network-level performance within a unified framework remains limited.
To address these limitations, this study proposes a scenario-based multi-hazard framework for assessing earthquake-induced disruption to transportation networks. The framework is implemented within the OpenQuake (OQ)-engine [26,27] and integrates ground shaking, earthquake-induced landslides, and liquefaction into a unified workflow. The methodology propagates ground-shaking fields into landslide and liquefaction estimates, translates multi-hazard damage into component operability, and evaluates the resulting degradation of road-network connectivity using connectivity-based performance metrics. Alternative landslide and liquefaction models are combined within a conceptual logic-tree framework to explore secondary-hazard model uncertainty.
The main objective of the study is to evaluate how ground shaking, earthquake-induced landslides, and liquefaction contribute, individually and in combination, to road-network disruption at the regional scale, and to assess how their relative importance varies spatially and across different earthquake scenarios. The proposed methodology is demonstrated through a case study of the major road network in Southern Portugal, considering a set of representative seismic scenarios. The analysis therefore aims not only to compare ground-shaking-only and multi-hazard disruption estimates, but also to identify which hazards dominate network disruption under different scenarios and where secondary hazards become particularly relevant for network redundancy and emergency accessibility.
2. Methodology
2.1. Overview
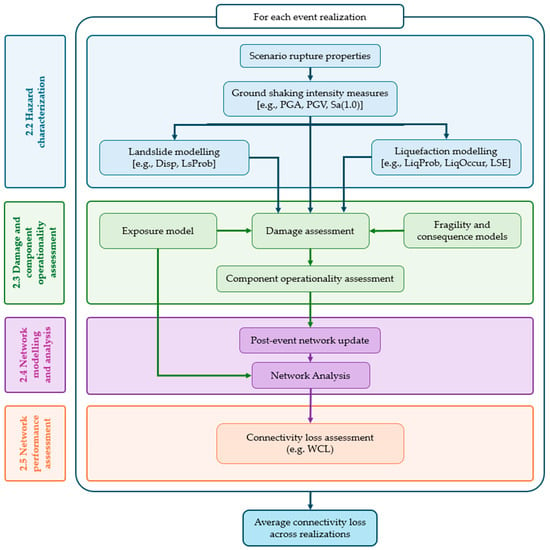
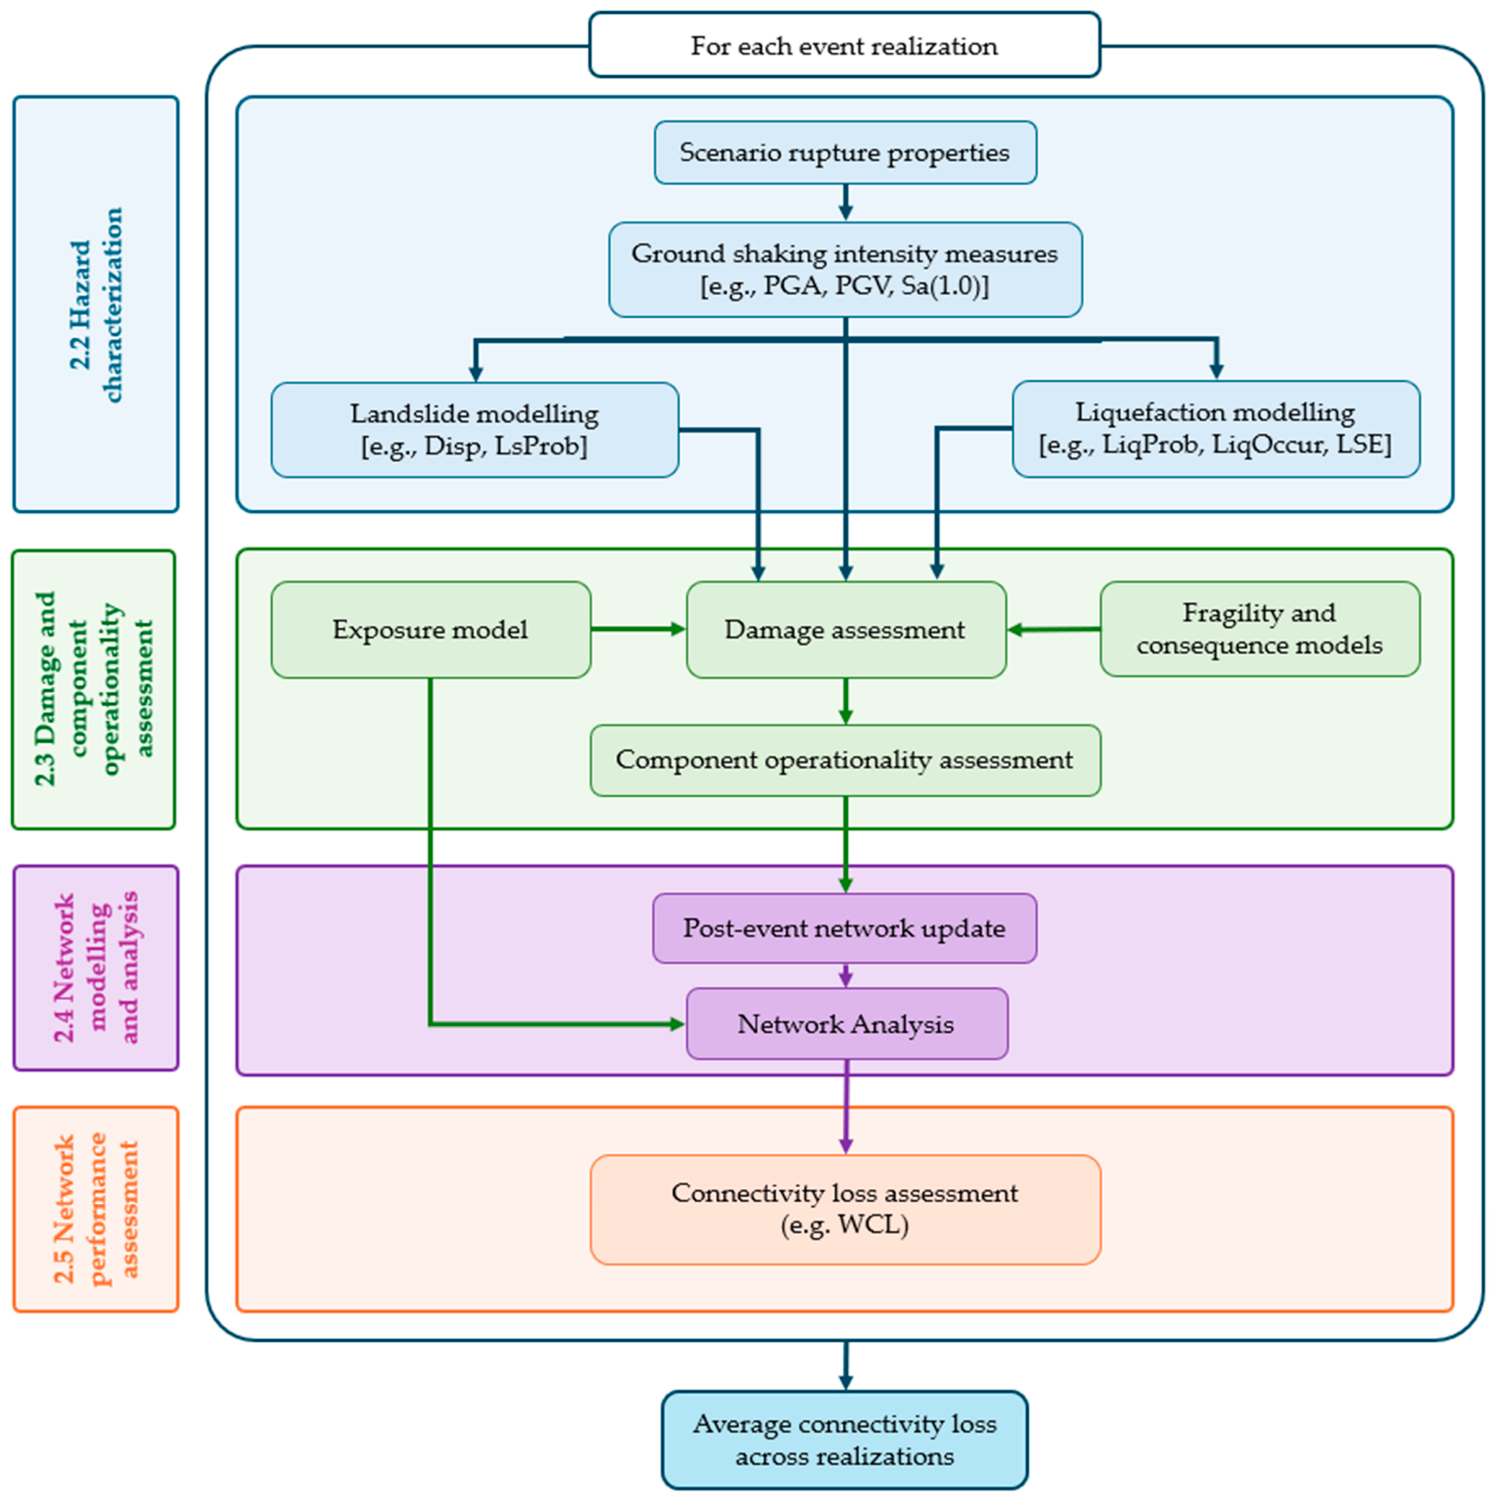
The methodology described in this section integrates ground shaking, earthquake-induced landslides, and liquefaction into an infrastructure-network multi-hazard assessment workflow implemented in the OpenQuake-engine. The overall sequence is described in Figure 1 and discussed in the following paragraphs.
Figure 1.
Methodology. PGA: peak ground acceleration; PGV: peak ground velocity; Sa: spectral acceleration; Disp: landslide displacement; LsProb: landslide probability; LiqProb: liquefaction probability; LiqOccur: liquefaction occurrence; LSE: liquefaction spatial extent; WCL: weighted connectivity loss.
2.2. Hazard Characterization
The initial step in the proposed framework involves the characterization of seismic hazard. The hazard input can represent a single seismic scenario coming from one rupture, or a collection of events, which are sampled considering the rates of occurrence of the different sources of seismicity of the region for a specific timeframe. When a single rupture is used, the uncertainty in the ground motion models (GMMs) is propagated by creating multiple realizations of the scenario. For each realization of the event, a GMM is sampled from a logic tree to propagate the epistemic uncertainty, and random fields of intensity measures (IMs) that represent the shaking in the affected area are generated.
The ground-motion fields associated with each realization are then used as inputs to the earthquake-induced landslide and liquefaction models, together with the corresponding site-specific parameters required by each model. The secondary-hazard calculations are therefore conditioned on the same ground-motion realization, preserving the link between the ground-shaking field and the associated ground-failure estimates. Depending on the selected models, the resulting secondary-hazard intensity measures may include landslide displacement and liquefaction probability, occurrence, or spatial extent. These hazard-specific outputs are subsequently transferred to the exposed network components and used in the corresponding damage models.
While the proposed methodology is applicable to both event-based probabilistic and scenario-based analyses, the presented case study is focused on the scenario-based framework.
2.3. Damage and Component Operationality Assessment
The next step in the methodology consists of estimating the damage state and operational status of each component of the transportation network. This step integrates three main inputs:
- The intensity measures computed in the hazard module for ground-shaking, landslide and liquefaction [26,27];
- The exposure model, which defines the spatial distribution, taxonomy, and the attributes required for network characterization, including the representation of nodes and edges [28];
- The fragility functions, which represent the probability of an asset reaching or exceeding a specific damage state, conditional on a given intensity measure [19].
By combining these inputs, the OpenQuake-engine estimates the probability distribution of damage states for each exposed component and for each hazard considered. For ground shaking, damage is estimated from the corresponding shaking intensity measure and the seismic fragility functions assigned to each asset class. For landslides and liquefaction, damage is estimated using the hazard-specific intensity measures or occurrence indicators and the corresponding fragility or threshold-based damage models.
The damage estimates are subsequently translated into operational status, which determines the component availability for the network analysis, through a consequence model that relates each damage state to asset functionality [19,28]. In this study, component operability is represented using a binary state. Assets in slight or moderate damage states are assumed to remain passable and therefore available within the network, whereas assets in extensive or complete damage states are considered non-operational/unavailable. This threshold is consistent with the qualitative distinction between the damage states adopted in HAZUS [19], where moderate bridge damage may involve structural damage while the affected components remain structurally sound, whereas extensive damage corresponds to structurally unsafe conditions.
This binary representation should not be interpreted as implying that components experiencing slight or moderate damage retain their full pre-earthquake traffic capacity. Such damage may result in lane closures, reduced speeds, traffic restrictions, or other reductions in service. These effects are not explicitly represented in the present analysis because network performance is evaluated in terms of connectivity, using shortest-path distance as the edge weight, rather than through traffic-flow, capacity, or travel-time analysis. Consequently, a partially restricted component remains in the network as long as it is assumed to be traversable. The adopted representation may therefore underestimate service degradation where moderate damage results in complete closure or substantial travel-time penalties. Traffic-capacity reductions, traffic redistribution, and time-dependent recovery are outside the scope of the present study and represent potential extensions of the methodology.
When multiple hazards affect the same component, the final operational status is governed by the most severe damage state obtained across all hazards. Therefore, an asset is considered non-operational, and therefore unavailable in the network, if it reaches an extensive or complete damage state due to ground shaking, landslide displacement, or liquefaction effects. Based on this assumption, the transportation network is updated prior to the connectivity analysis.
2.4. Network Modelling and Analysis
After identifying how the different assets are affected, the network is analysed as a system. Unlike building portfolios, where total loss can be obtained by simply aggregating losses from individual units, the assessment of road networks is more complex due to the interconnected nature of their components. To evaluate the overall network performance, network analysis or graph theory [29] is employed. In network analysis, relationships between entities are modelled using graphs, which consist of nodes and edges. The original graph is constructed using the nodes and edges defined in the exposure model, and, for each event, the post-earthquake graph is updated by removing components that are no longer operational to perform the network analysis.
2.5. Network Performance Assessment
Different network performance metrics can be computed in the OpenQuake-engine, such as the partial connectivity loss (PCL), complete connectivity loss (CCL), weighted connectivity loss (WCL), and efficiency loss (EFL) [28]. In this study, the analysis focuses on the WCL metric [13,21], which extends the concept of connectivity loss by incorporating edge weights. This allows the metric to account not only for whether nodes remain connected, but also for the quality of the available paths, represented here by shortest-path distance.
WCL was selected because it is sensitive to both complete disconnection and degradation of path quality. This makes it more informative than CCL for dense regional road networks, where total isolation between demand and supply nodes is relatively rare due to the presence of redundant paths. Compared with EFL, WCL also provides a balance between computational efficiency and the ability to capture changes in network functionality.
WCL quantifies the reduction in accessibility within the network by considering both the number of reachable nodes and the quality of the connections between them. A value close to 0 indicates that the network remains largely functional, with most nodes still accessible through efficient paths, whereas values approaching 1 indicate severe degradation, associated with loss of connectivity and/or substantially longer routes. Therefore, WCL provides an indirect measure of service disruption, reflecting how earthquake-induced damage affects the ability of users to access different parts of the network. In the context of this study, WCL is used as a network-level consequence metric, representing loss of accessibility and connectivity rather than an economic loss. Indirect consequences such as traffic delays, user costs, and broader socio-economic losses are not quantified.
For each node, is given by Equation (1),
where and represent the number of demand nodes connected to the ith source node after and before the event, and and represent the weights, which can be calculated as shown in Equation (2),
where is equal to 1 when the path exists between ith and jth nodes, and 0 otherwise. represents the weight of the connection between the ith and jth node, which in this study corresponds to the shortest-path distance between nodes in the road network, although other metrics such as travel time or cost may also be used. After computing these metrics for each event realization, the results are averaged to obtain aggregate estimates for each event.
3. Case Study
This section describes the implementation of the general methodology presented in Section 2 for the case of Southern Portugal, including the selection of models, input datasets, and assumptions required for hazard, exposure, and vulnerability characterization.
3.1. Study Area and Seismic Scenarios
The southern part of Portugal is a region characterized by low to moderate seismic hazard, although it is potentially affected by strong events. Existing studies addressing secondary seismic hazards in Portugal are relatively limited and mostly focused on hazard characterization rather than infrastructure impacts. Liquefaction has been investigated through different approaches, including the development of a national liquefaction potential map [30], susceptibility assessments based on field tests in Vila Franca de Xira [31] and in Aveiro [32], as well as numerical simulations conducted in a basin adjacent to the Tagus River [33]. Earthquake-induced landslides have also been explored, for instance through susceptibility analyses combining seismic and rainfall-induced landslides in Azores [34]. However, these studies do not explicitly address consequences on built infrastructure. Research focusing on road networks and incorporating secondary hazards is particularly scarce. Notable exceptions include the work of Azevedo et al. [35], who evaluated damage in road and railway networks in the Lisbon Metropolitan Area under seismic scenarios, and Caiado et al. [36], who analysed seismic vulnerability at a local scale considering building debris and pavement damage. Other studies, such as Costa et al. [37], address road network risk but do not account for secondary hazards.
The road network analysis presented here was performed considering ground-shaking, earthquake-induced landslides, and liquefaction under three seismic scenarios. The scenarios were selected to represent contrasting seismotectonic conditions relevant to Southern Portugal, rather than as an exhaustive representation of all possible earthquake sources. Scenarios A and B are based on two major historical earthquakes and broadly reflect the two types of seismic action considered for mainland Portugal in the Portuguese National Annex to Eurocode 8: a distant, high-magnitude offshore earthquake and a closer, moderate-magnitude earthquake, respectively. Scenario C complements these historical cases with a hypothetical large-magnitude rupture on the Tagus Abyssal Plain Thrust (TAPT), representing an offshore source closer to Lisbon and the western Portuguese coast than Scenario A. Together, the three scenarios represent different combinations of earthquake magnitude, source location, and distance to the exposed network, resulting in contrasting ground-shaking and secondary-hazard footprints. This provides a suitable basis for evaluating how the relative contributions of ground shaking, landslides, and liquefaction to road-network disruption vary between earthquake scenarios.
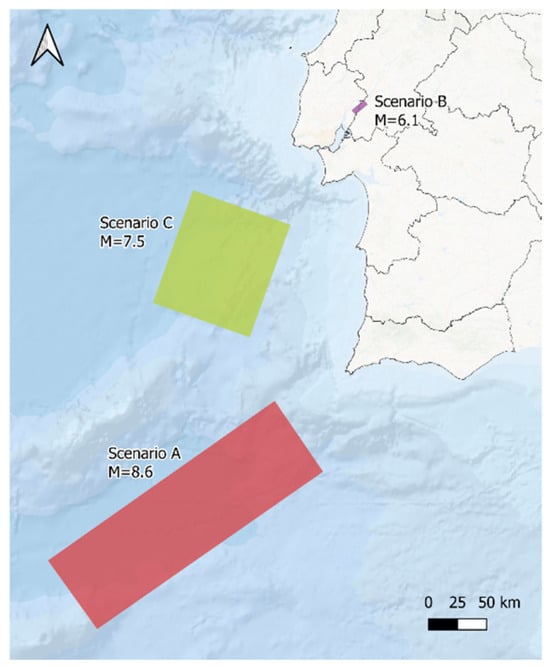
The main characteristics of the three scenarios are summarized in Table 1, and the corresponding rupture geometries are illustrated in Figure 2. Scenario A represents a possible rupture associated with the 1755 earthquake, which severely impacted Lisbon and the southern region of Portugal, and was proposed by Duarte et al. [38]. Scenario B is based on the 1909 Benavente earthquake, which caused extensive damage in the Lower Tagus Valley and surrounding areas. Its rupture parameters were defined by Stich et al. [39]. Scenario C corresponds to a hypothetical Mw 7.5 event occurring along the TAPT, as proposed by Matias et al. [40].
Table 1.
Properties considered for each scenario.
Figure 2.
Location of the three ruptures considered.
3.2. Hazard Modelling and Site Properties
3.2.1. Grid Size and Filtering
A regional site model for Southern Portugal was developed to compute ground-shaking, and to assess the occurrence of earthquake-induced landslides and liquefaction. The required parameters were defined at each node of a regular grid with a spatial resolution of 250 m × 250 m for landslide analysis and 500 m × 500 m for both liquefaction and ground-shaking calculations [41]. Landslides and liquefaction are governed by distinct geotechnical processes and are therefore expected to occur under different terrain conditions. For the landslide analysis, sites with slope angles below 10° were excluded. This threshold was adopted as a regional screening criterion based on observations from global earthquake-induced landslide inventories, which show that the large majority of documented earthquake-induced landslides occur on slopes above 10° [42]. For liquefaction, the analysis was restricted to areas with slope angles below 5°, following the criteria adopted by Allstadt et al. [41]. Liquefaction is predominantly associated with low-slope terrain, and the adopted model does not explicitly represent flow or spreading processes occurring on steeper slopes. In addition to being consistent with the typical occurrence conditions and applicability of the respective models, these filters reduce the computational effort by avoiding calculations in areas where the considered processes are substantially less likely or are outside the intended scope of the models. Ground-shaking estimates, however, were computed for all grid points. The parameters required for each analysis depend on the models selected for the respective hazard; these models and their input requirements are described in the following sections.
For the subsequent damage assessment, hazard intensity measures were spatially assigned to the individual components of the road network using a nearest-neighbour approach. The network is represented by nodes and edges; nodes are characterized by their geographical coordinates, whereas each edge is represented by its midpoint for the purpose of hazard assignment. For each node and edge midpoint, the closest site in the corresponding hazard grid was identified and the intensity measure calculated at that site was assigned to the component.
3.2.2. Ground-Shaking
Ground-shaking was estimated using the ground motion model proposed by Kotha et al. [43], developed for the European context and incorporating region-specific attenuation adjustments. This model requires several input parameters, including the time-averaged shear-wave velocity in the upper 30 m (Vs30), geological era classification, distance to the volcanic front, and attenuation region coefficients. These parameters were obtained for specific locations using the site model tool developed by Weatherill [44].
For each scenario, 1000 random ground motion fields of peak ground acceleration (PGA), peak ground velocity (PGV), and spectral acceleration at 1.0 s (Sa(1.0 s)) were generated by the OpenQuake-engine, to represent ground-motion variability, considering both the spatial and inter-period correlation using the correlation models by Jayaram and Baker [25] and Bradley [45].
3.2.3. Landslide
In OpenQuake, several models are available for the assessment of earthquake-induced landslide hazard. In this study, two displacement-based models were selected: Rathje and Saygili [46] and Jibson [47]. Both models are based on the Newmark sliding-block approach and estimate permanent coseismic slope displacement by relating earthquake ground motion to the critical acceleration of the potentially unstable slope. The critical acceleration is derived from the slope geometry and material strength parameters and represents the acceleration above which permanent sliding is expected to occur. The Newmark formulation idealizes the potentially unstable mass as a sliding block and is therefore principally applicable to translational slope failures.
The two models were selected because they are established regional-scale displacement models, can be applied using the regional data available for the study area, and provide displacement estimates compatible with the adopted landslide fragility functions. They also use different empirical formulations for estimating displacement, allowing the influence of model selection on the subsequent disruption estimates to be explored. The selection was therefore based primarily on their suitability for regional-scale modelling and compatibility with the damage-assessment framework, rather than on site-specific calibration for Southern Portugal.
Both models represent permanent displacement at the location of the unstable slope and do not explicitly simulate other earthquake-induced landslide mechanisms such as rockfalls, highly disrupted slides, debris avalanches, or post-failure runout. Consequently, landslide-induced road damage is evaluated where predicted slope displacement coincides with the road-network assets. Failures initiating upslope and subsequently reaching the road through runout are therefore not represented. This simplification may underestimate road disruption, particularly in steep terrain where rockfalls or mobile landslide masses can affect roads located below the source area. The landslide results should consequently be interpreted as a regional-scale indication of disruption associated with translational slope displacement rather than as a complete representation of earthquake-induced landslide impacts.
The selected models require site-specific parameters, including slope angle, thickness of the sliding mass, unit weight, degree of saturation, cohesion, and friction angle of the materials. The slope angle was calculated from the 25 m Digital Elevation Model (DEM) available for Portugal. Because a spatially consistent geotechnical database covering Southern Portugal was not available, the parameters describing material strength were defined through a regional lithology-based classification.
The 1:1,000,000 geological map of Portugal available through the LNEG (Laboratório Nacional de Energia e Geologia) geoportal identifies 61 geological units within the study area, predominantly associated with metamorphic and igneous formations. These units were grouped by the authors into the broader lithological classes reported in Table 2 according to their dominant lithology and expected similarity in geotechnical behaviour, with additional support from the simplified lithological information available through the LNEG geoportal. Representative values of unit weight, cohesion, and friction angle were then assigned to each group based on the typical properties of the corresponding materials and the authors’ knowledge of the regional geological conditions.
Table 2.
Geological parameters considered.
The parameters in Table 2 should therefore be interpreted as regional-scale modelling assumptions rather than site-specific geotechnical properties.
For parameters with limited available data, conservative assumptions were adopted. In particular, due to the lack of detailed information to accurately define the thickness of the sliding mass, a constant value of 5 m was assumed across the study area. This value should be interpreted as an effective sliding-mass thickness for regional-scale analysis, not as a mapped soil or regolith depth. Because the estimated factor of safety, critical acceleration, and resulting Newmark displacement are sensitive to this parameter, the resulting landslide-induced disruption estimates should be considered indicative rather than site-specific. Similarly, a degree of saturation equal to 1 was also assumed, corresponding to fully saturated conditions and providing a conservative assumption with respect to slope stability.
The geotechnical parameters were treated deterministically in the present regional-scale analysis. Although uncertainty in cohesion, friction angle, sliding-mass thickness, and saturation may significantly affect the predicted displacement, sufficiently detailed data were not available to define defensible probability distributions and spatial correlations for these parameters across the study area. These assumptions contribute additional uncertainty to the absolute displacement estimates and reinforce the interpretation of the displacement estimates as indicative rather than site-specific.
3.2.4. Liquefaction
OpenQuake includes several geospatial models for regional assessment of liquefaction hazard. In this study, two models were selected from those available in OQ: the United States Geological Survey (USGS) Ground Failure liquefaction model described by Allstadt et al. [41] and the regional liquefaction occurrence model of Todorovic and Silva [48]. Both models were developed for regional- to global-scale applications and rely on ground-motion estimates combined with geospatial proxies for soil susceptibility and groundwater conditions, rather than on site-specific geotechnical investigations such as cone penetration test (CPT)- or standard penetration test (SPT)-based liquefaction triggering analyses. They were therefore considered suitable for the spatial scale of the present study and for the level of site information consistently available across Southern Portugal.
The Allstadt et al. [41] formulation builds on a parametric geospatial liquefaction model in which ground shaking is combined with proxies related to soil stiffness and wetness, including , mean annual precipitation, distance to the nearest water body, and groundwater-table depth. The implementation also includes constraints intended to limit extrapolation beyond the range represented in the underlying empirical data. The model provides estimates of liquefaction probability, occurrence, and spatial extent. The Todorovic and Silva [48] model follows a different, non-parametric machine-learning approach, trained using liquefaction occurrence and non-occurrence observations from more than 40 earthquakes worldwide. Its predictors include PGV and , together with hydrogeological variables such as distance to water, groundwater depth, and mean annual precipitation.
The two models were selected because they can be applied using spatially distributed datasets available at the regional scale while representing substantially different modelling approaches. Their combination therefore provides a means of exploring model uncertainty in the liquefaction patterns.
The inputs were derived from publicly available global datasets: precipitation data were obtained from the WorldClim database, distances to the nearest water bodies were calculated using OpenStreetMap (OSM) data, and global water table depth was derived following the methodology and datasets of Fan et al. [49,50].
3.2.5. Logic-Tree Framework and Model Uncertainty
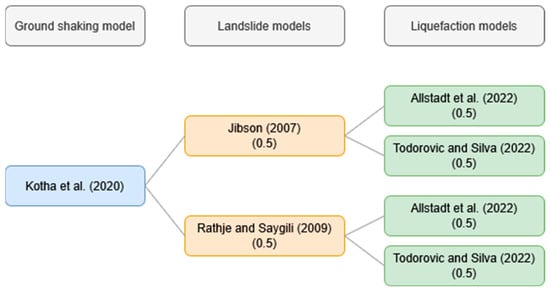
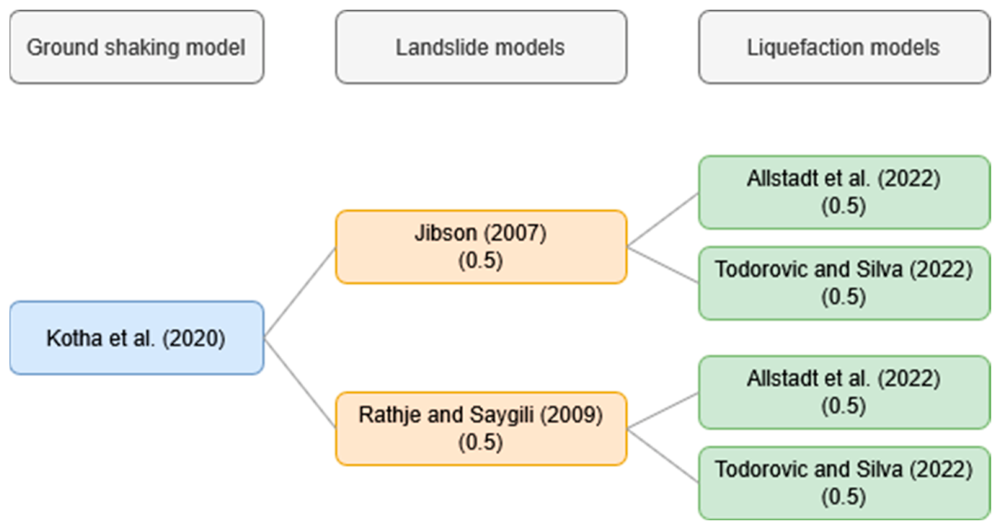
The selected models for ground-shaking, landslide, and liquefaction were combined within the conceptual logic-tree framework shown in Figure 3. Ground shaking was represented using the Kotha et al. [43] ground-motion model, from which 1000 spatially correlated ground-motion realizations were generated for each earthquake scenario. These realizations represent the variability in the spatial distribution of shaking and provide the ground-motion input for the subsequent landslide and liquefaction calculations.
Figure 3.
Conceptual logic-tree framework for the combination of ground-shaking (Kotha et al. [43]), landslide (Rathje and Saygili [46] and Jibson [47]) and liquefaction (Allstadt et al. [41] and Todorovic and Silva [48]) models.
For the secondary hazards, the Rathje and Saygili [46] and Jibson [47] models were used for landslide displacement, while the Allstadt et al. [41] and Todorovic and Silva [48] models were used for liquefaction. Equal weights were assigned to the two models within each secondary-hazard branch because no sufficiently strong region-specific evidence was available to favour one model over the other.
At the time of the analysis, alternative secondary-hazard models could not be sampled directly as branches of a native OpenQuake logic tree. The models were therefore evaluated in separate calculations and their resulting damage and network-performance estimates were subsequently combined using the assigned model weights.
The alternative secondary-hazard models were included to represent the sensitivity of the analysis to model selection rather than to provide an exhaustive characterization of epistemic uncertainty. The selected models were chosen based on their applicability to regional-scale analysis, compatibility with the available input data, and ability to provide outputs that could be consistently linked to the damage models.
3.3. Exposure Model
In this study, the exposure model for the road network was developed using OpenStreetMap (OSM), a community-based open data project and one of the most widely used examples of volunteered geographic information [51]. In recent years, the completeness and quality of global OSM datasets have improved substantially [52,53]. The dataset was imported using the osmnx library [54], which facilitates the extraction and analysis of network properties. To optimize computational efficiency and ensure compatibility with the current implementation of infrastructure risk analysis in OQ, the datasets were refined and consolidated prior to use.
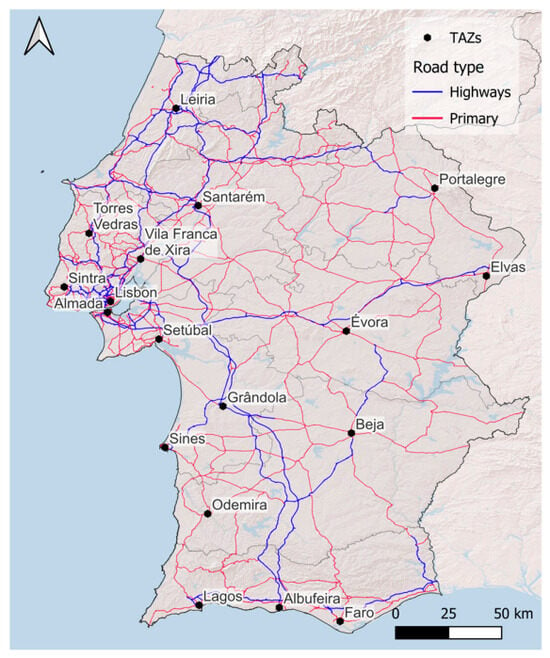
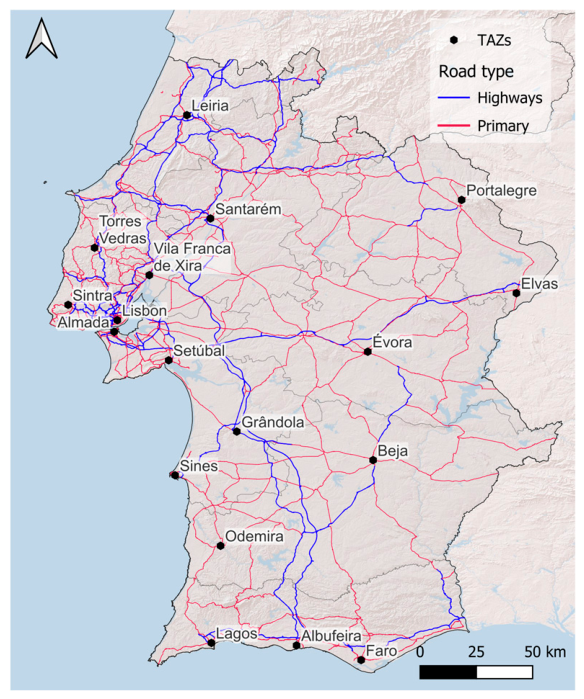
The road network considered for Southern Portugal is illustrated in Figure 4. The network comprises 11,771 nodes and 15,305 edges and is modelled as a simple, undirected graph. Highways and primary roadways are included in the analysis. The analysis was restricted to these road classes to focus on the major regional network and the connectivity between the principal demand/supply locations. Secondary and lower-order roads were therefore not represented as alternative routes. While this choice limits the size and computational requirements of the network analysis, it also reduces the redundancy represented in the network and may lead to higher connectivity-loss estimates in areas where secondary roads could provide alternative paths following disruption of the major network.
Figure 4.
Road network and considered TAZs.
Edge weights are assigned based on the distances between connecting nodes, which provides a consistent basis for the analysis. The Traffic Analysis Zones (TAZs) in Figure 4 were defined as representative demand/supply nodes associated with the main populated areas of the study region. Their locations were selected to ensure both population relevance and geographical coverage of the road network.
3.4. Fragility and Consequence Models
Fragility and consequence models are applied separately for ground shaking, landslide and liquefaction. Although coupled fragility approaches have been developed for specific combinations of hazards, particularly earthquake shaking and earthquake-induced landslides or liquefaction for individual bridges, these models generally require detailed structural and geotechnical information and are not readily transferable to heterogeneous road networks at the regional scale. Therefore, physical interaction and cumulative damage between hazards at the component level are not explicitly represented in this study. When more than one hazard affects the same component, its state is determined by the most severe damage state obtained from the individual hazard assessments.
3.4.1. Fragility Model for Ground-Shaking
Bridges and viaducts are among the most critical yet vulnerable components of road networks under seismic loading, therefore requiring particular attention in risk assessments [55]. The assignment of appropriate fragility functions that adequately represent the seismic behaviour of these assets typically requires detailed information on their structural characteristics and construction materials. However, such data are rarely available at regional or national scales. In the case of Portugal, no comprehensive database of bridge attributes was accessible, and therefore the analysis relied on information extracted from OpenStreetMap (OSM).
The available OSM data lack key structural details, such as the number of spans, structural typology, and construction material. Consequently, a detailed structural classification of the bridge stock was not possible. Bridge length was therefore adopted as a first-order proxy, following the approach of Costa et al. [37], and bridges were grouped into three categories: single-span bridges (length < 40 m), multi-span bridges (length between 40 and 150 m), and major multi-span bridges (length > 150 m).
Given the limited availability of region-specific fragility models for Portugal, the adopted fragility functions were selected by combining regional and international sources. For medium-length multi-span bridges, the functions proposed by Azevedo et al. [35], developed for the Portuguese context, were used. For the single-span and major multi-span classes, no equivalent Portugal-specific relationships were available, and HAZUS [19] fragility functions for broadly comparable bridge classes with conventional seismic design were adopted as proxy models. Although these HAZUS functions were not specifically developed for the Portuguese bridge stock, they provide a practical regional-scale approximation in the absence of more detailed structural information and locally calibrated fragility functions.
The adopted functions follow a lognormal distribution and express the probability of reaching or exceeding a given damage state as a function of Sa(1.0 s). Each fragility function is characterized by a median Sa(1.0 s) value and a logarithmic standard deviation (dispersion). For the functions adopted from Azevedo et al. [35], the original dispersion of 0.4 was adjusted to 0.6, in line with HAZUS recommendations and the findings of Silva et al. [56]. A dispersion of 0.6 was therefore adopted for all the ground-shaking fragility functions, while the median Sa(1.0 s) values for each bridge class and damage state are reported in Table 3.
Table 3.
Median Sa(1.0 s) values adopted for bridge fragility functions.
3.4.2. Fragility Models for Landslide and Liquefaction
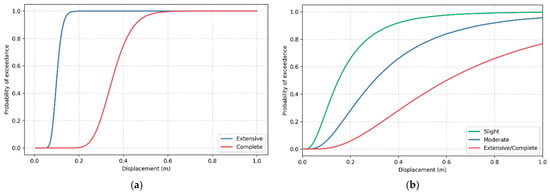
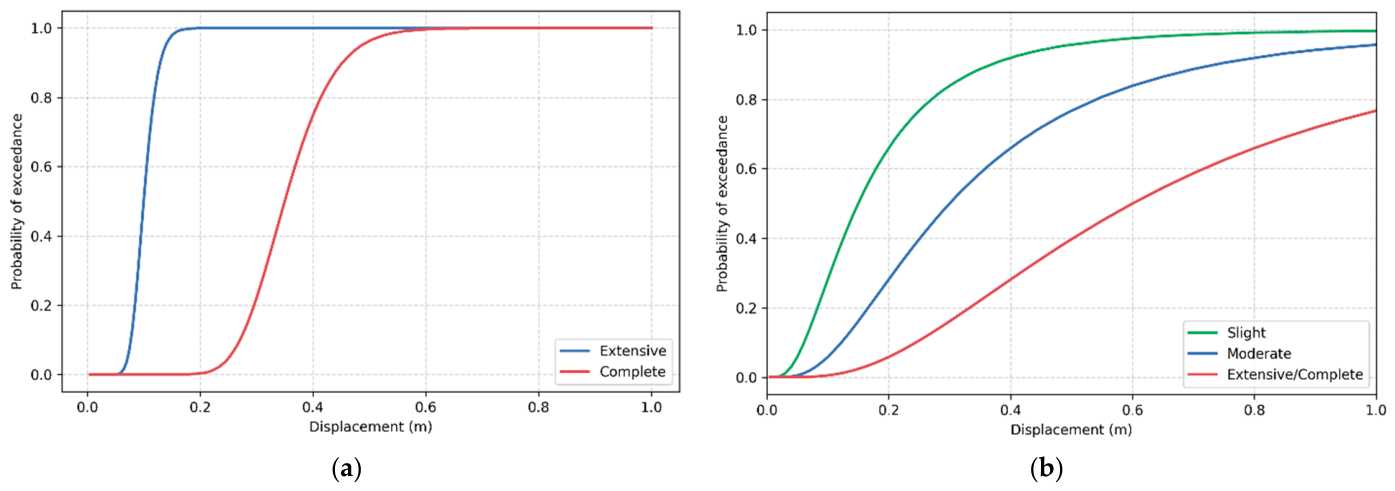
For landslide-induced effects on bridges, the fragility function provided by HAZUS [19] was adopted to represent structural response to ground deformation. HAZUS defines a single fragility function applicable to all bridge types, linking ground displacement to two damage states: incipient unseating and collapse, corresponding to extensive and complete damage, respectively. For compatibility with the four-state damage framework adopted in the analysis, the 10 cm median displacement was assigned to the slight, moderate, and extensive states, while 35 cm was adopted for complete damage. A dispersion of 0.2 was used for all damage states, as illustrated in Figure 5a.
Figure 5.
Fragility functions considered for landslides (HAZUS) for bridges (a) and for road pavement (b).
Landslides were also considered to affect road pavements, as ground deformation can significantly impair road functionality. The HAZUS fragility functions were again adopted, distinguishing three damage states: slight, moderate, and extensive/complete damage. In this case, a dispersion value of 0.7 was assumed for all damage states. The corresponding fragility curves are shown in Figure 5b.
As described in Section 2.3, bridges and roads reaching extensive or complete damage states are treated as unavailable in the network.
The outputs of the liquefaction models considered in this study include an indicator of liquefaction occurrence. Because fragility functions relating liquefaction occurrence to road and bridge operability are scarce or non-existent, liquefaction-induced loss of functionality was represented using a binary rule based on this occurrence indicator. A component was therefore assumed to lose functionality whenever liquefaction occurrence was predicted at the nearest site-model point. This was implemented as a step fragility function, in which the occurrence of liquefaction directly results in loss of functionality. This approach is appropriate for the present regional-scale analysis, but it does not distinguish between different levels of permanent ground deformation, lateral spreading, settlement, or asset-specific foundation response.
4. Results
This section presents the results for the three earthquake scenarios, focusing on the influence of hazard-model selection and on the contribution of ground shaking, landslides, and liquefaction to network disruption.
4.1. Hazard Estimates
4.1.1. Ground-Shaking Estimates
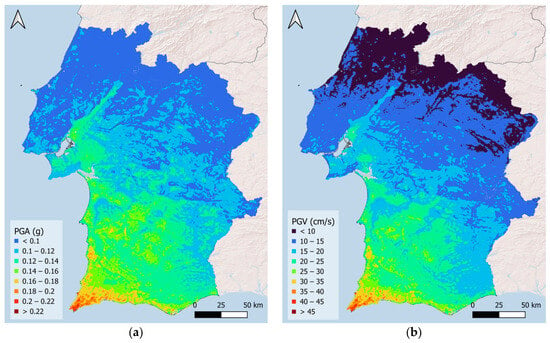
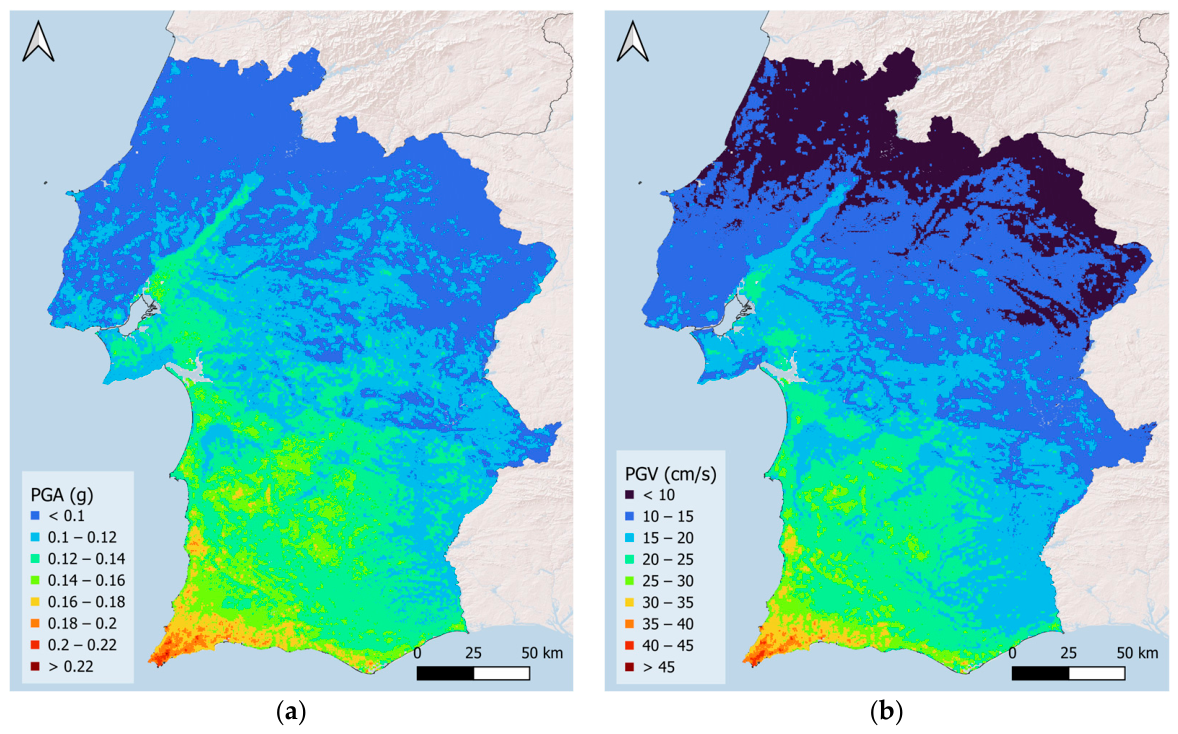
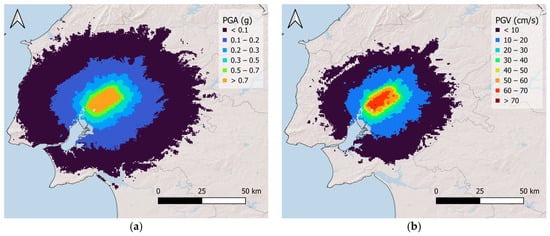
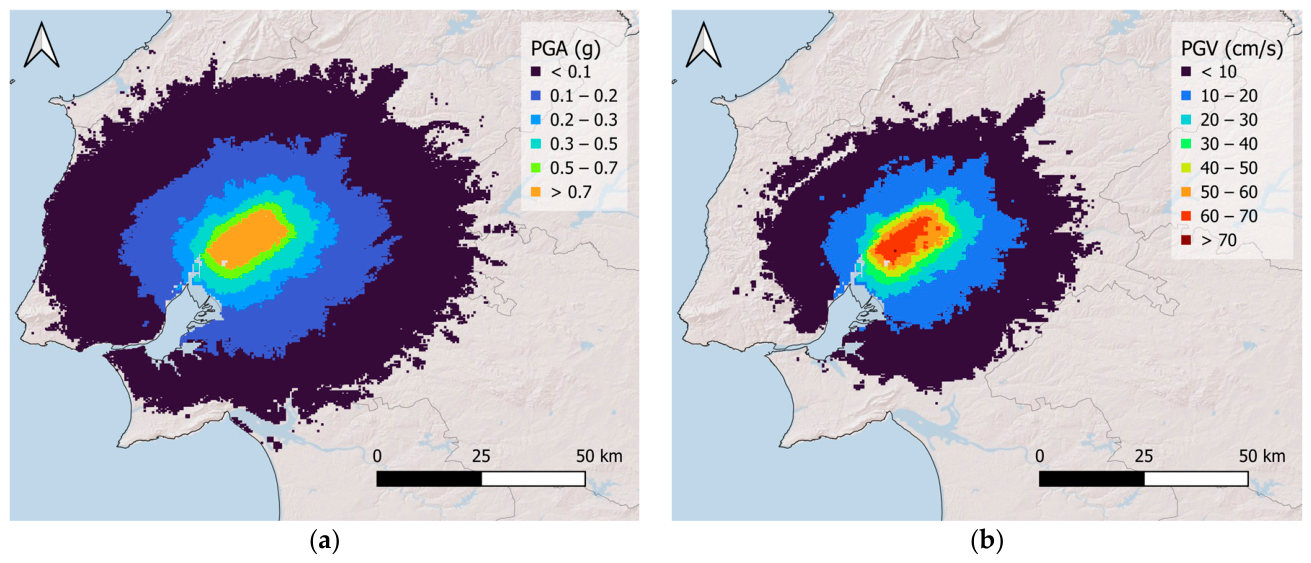
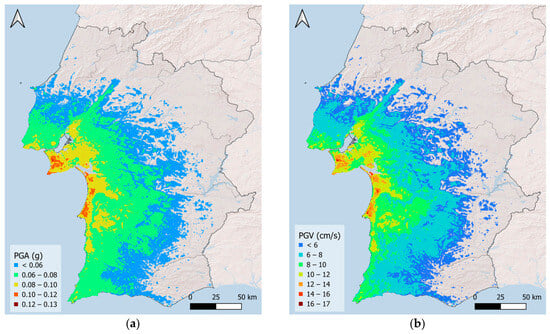
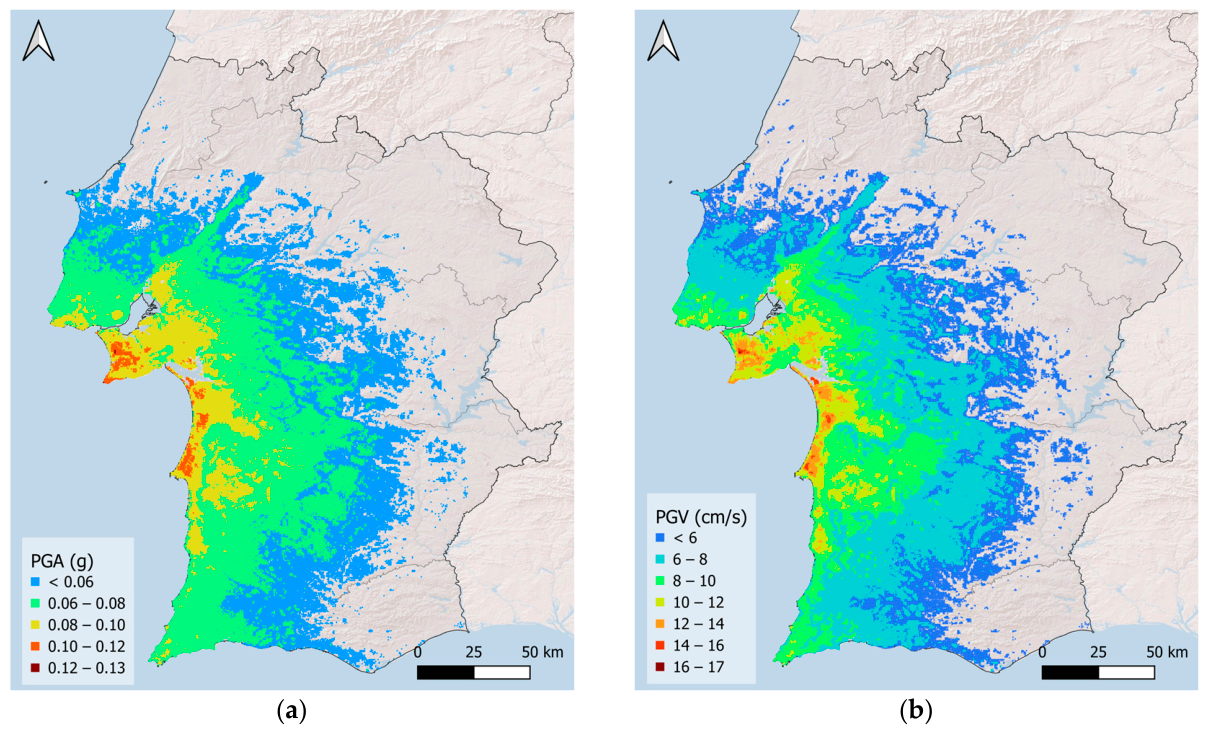
The average peak ground acceleration (PGA) and peak ground velocity (PGV) maps obtained for the three scenarios are presented in Figure 6, Figure 7 and Figure 8.
Figure 6.
Mean (a) PGA and (b) PGV estimates for scenario A.
Figure 7.
Mean (a) PGA and (b) PGV estimates for scenario B.
Figure 8.
Mean (a) PGA and (b) PGV estimates for scenario C.
The maps highlight the variability in the spatial distribution of the hazard. Scenario A, which has the highest magnitude, produces considerable PGA and PGV estimates across the study area. Scenario B, by contrast, results in more localized effects near the epicentre, although hazard estimates in this area remain relatively high. The hypothetical scenario C, despite its proximity to Lisbon and the west coast, produces significantly lower PGA and PGV estimates.
4.1.2. Influence of Landslide and Liquefaction Models
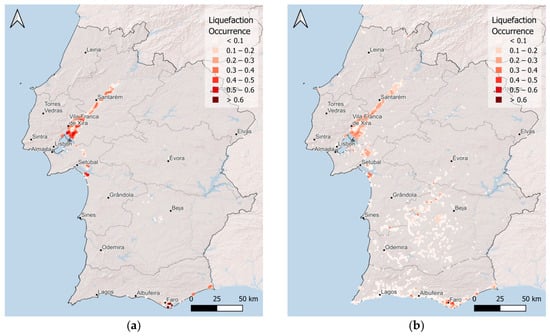
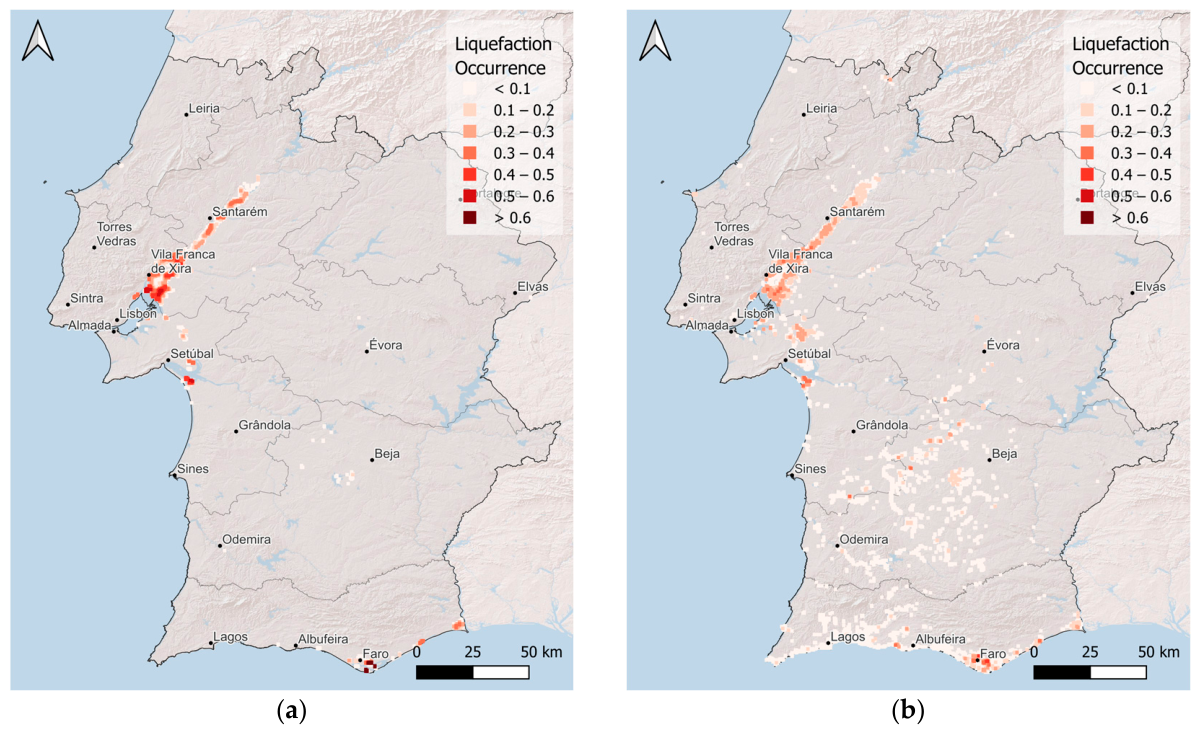
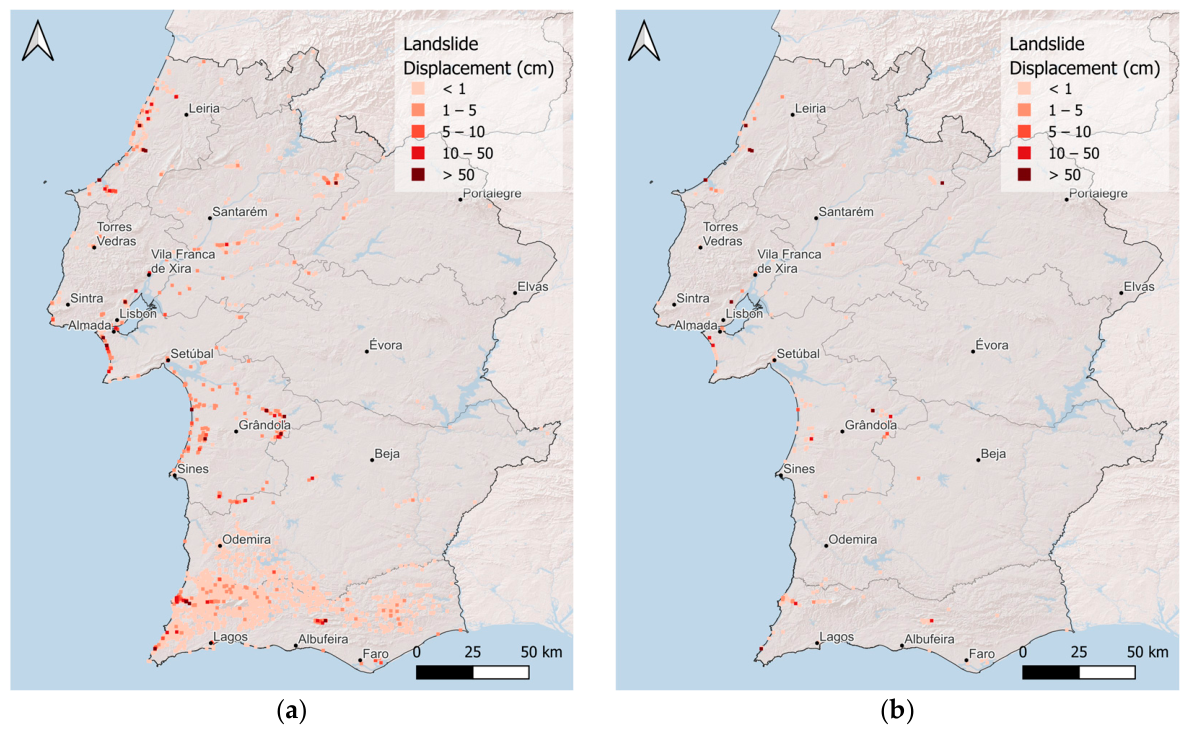
Based on the ground-shaking estimates and the models described in Section 3.2, landslide displacement and liquefaction occurrence were evaluated at each point of the site model. To assess the influence of model selection, the results are compared for the individual models included in the logic-tree framework. To avoid repetition, Figure 9 and Figure 10 illustrate the model-to-model comparison for Scenario A, which provides the clearest visual contrast between the selected landslide and liquefaction models. The corresponding results for Scenarios B and C are provided in Appendix A, while the main differences across the three scenarios are discussed below.
Figure 9.
Liquefaction occurrence for Scenario A estimated using Allstadt et al. [41] (a) and Todorovic and Silva [48] (b) models.
Figure 10.
Landslide displacement for Scenario A estimated using Rathje and Saygili [46] (a) and Jibson [47] (b) models.
The comparison between the liquefaction models shows differences in both spatial extent and amplitude. Overall, the Todorovic and Silva [48] model tends to produce more widespread liquefaction footprints, with occurrence extending farther from the epicentral areas and into regions affected by lower shaking levels. In contrast, the Allstadt et al. [41] model generally produces more localized estimates, but with higher occurrence values in the most susceptible areas.
For Scenario B, the Todorovic and Silva [48] model predicts a slightly broader liquefaction footprint, including areas farther from the epicentre. Closer to the epicentre, this model also produces higher occurrence values over a larger area. For Scenarios A and C, the same general trend is observed: the Todorovic and Silva [48] model produces more spatially extensive but generally lower values, whereas the Allstadt et al. [41] model gives more localized but higher estimates, particularly in the Lower Tagus Valley for Scenario A.
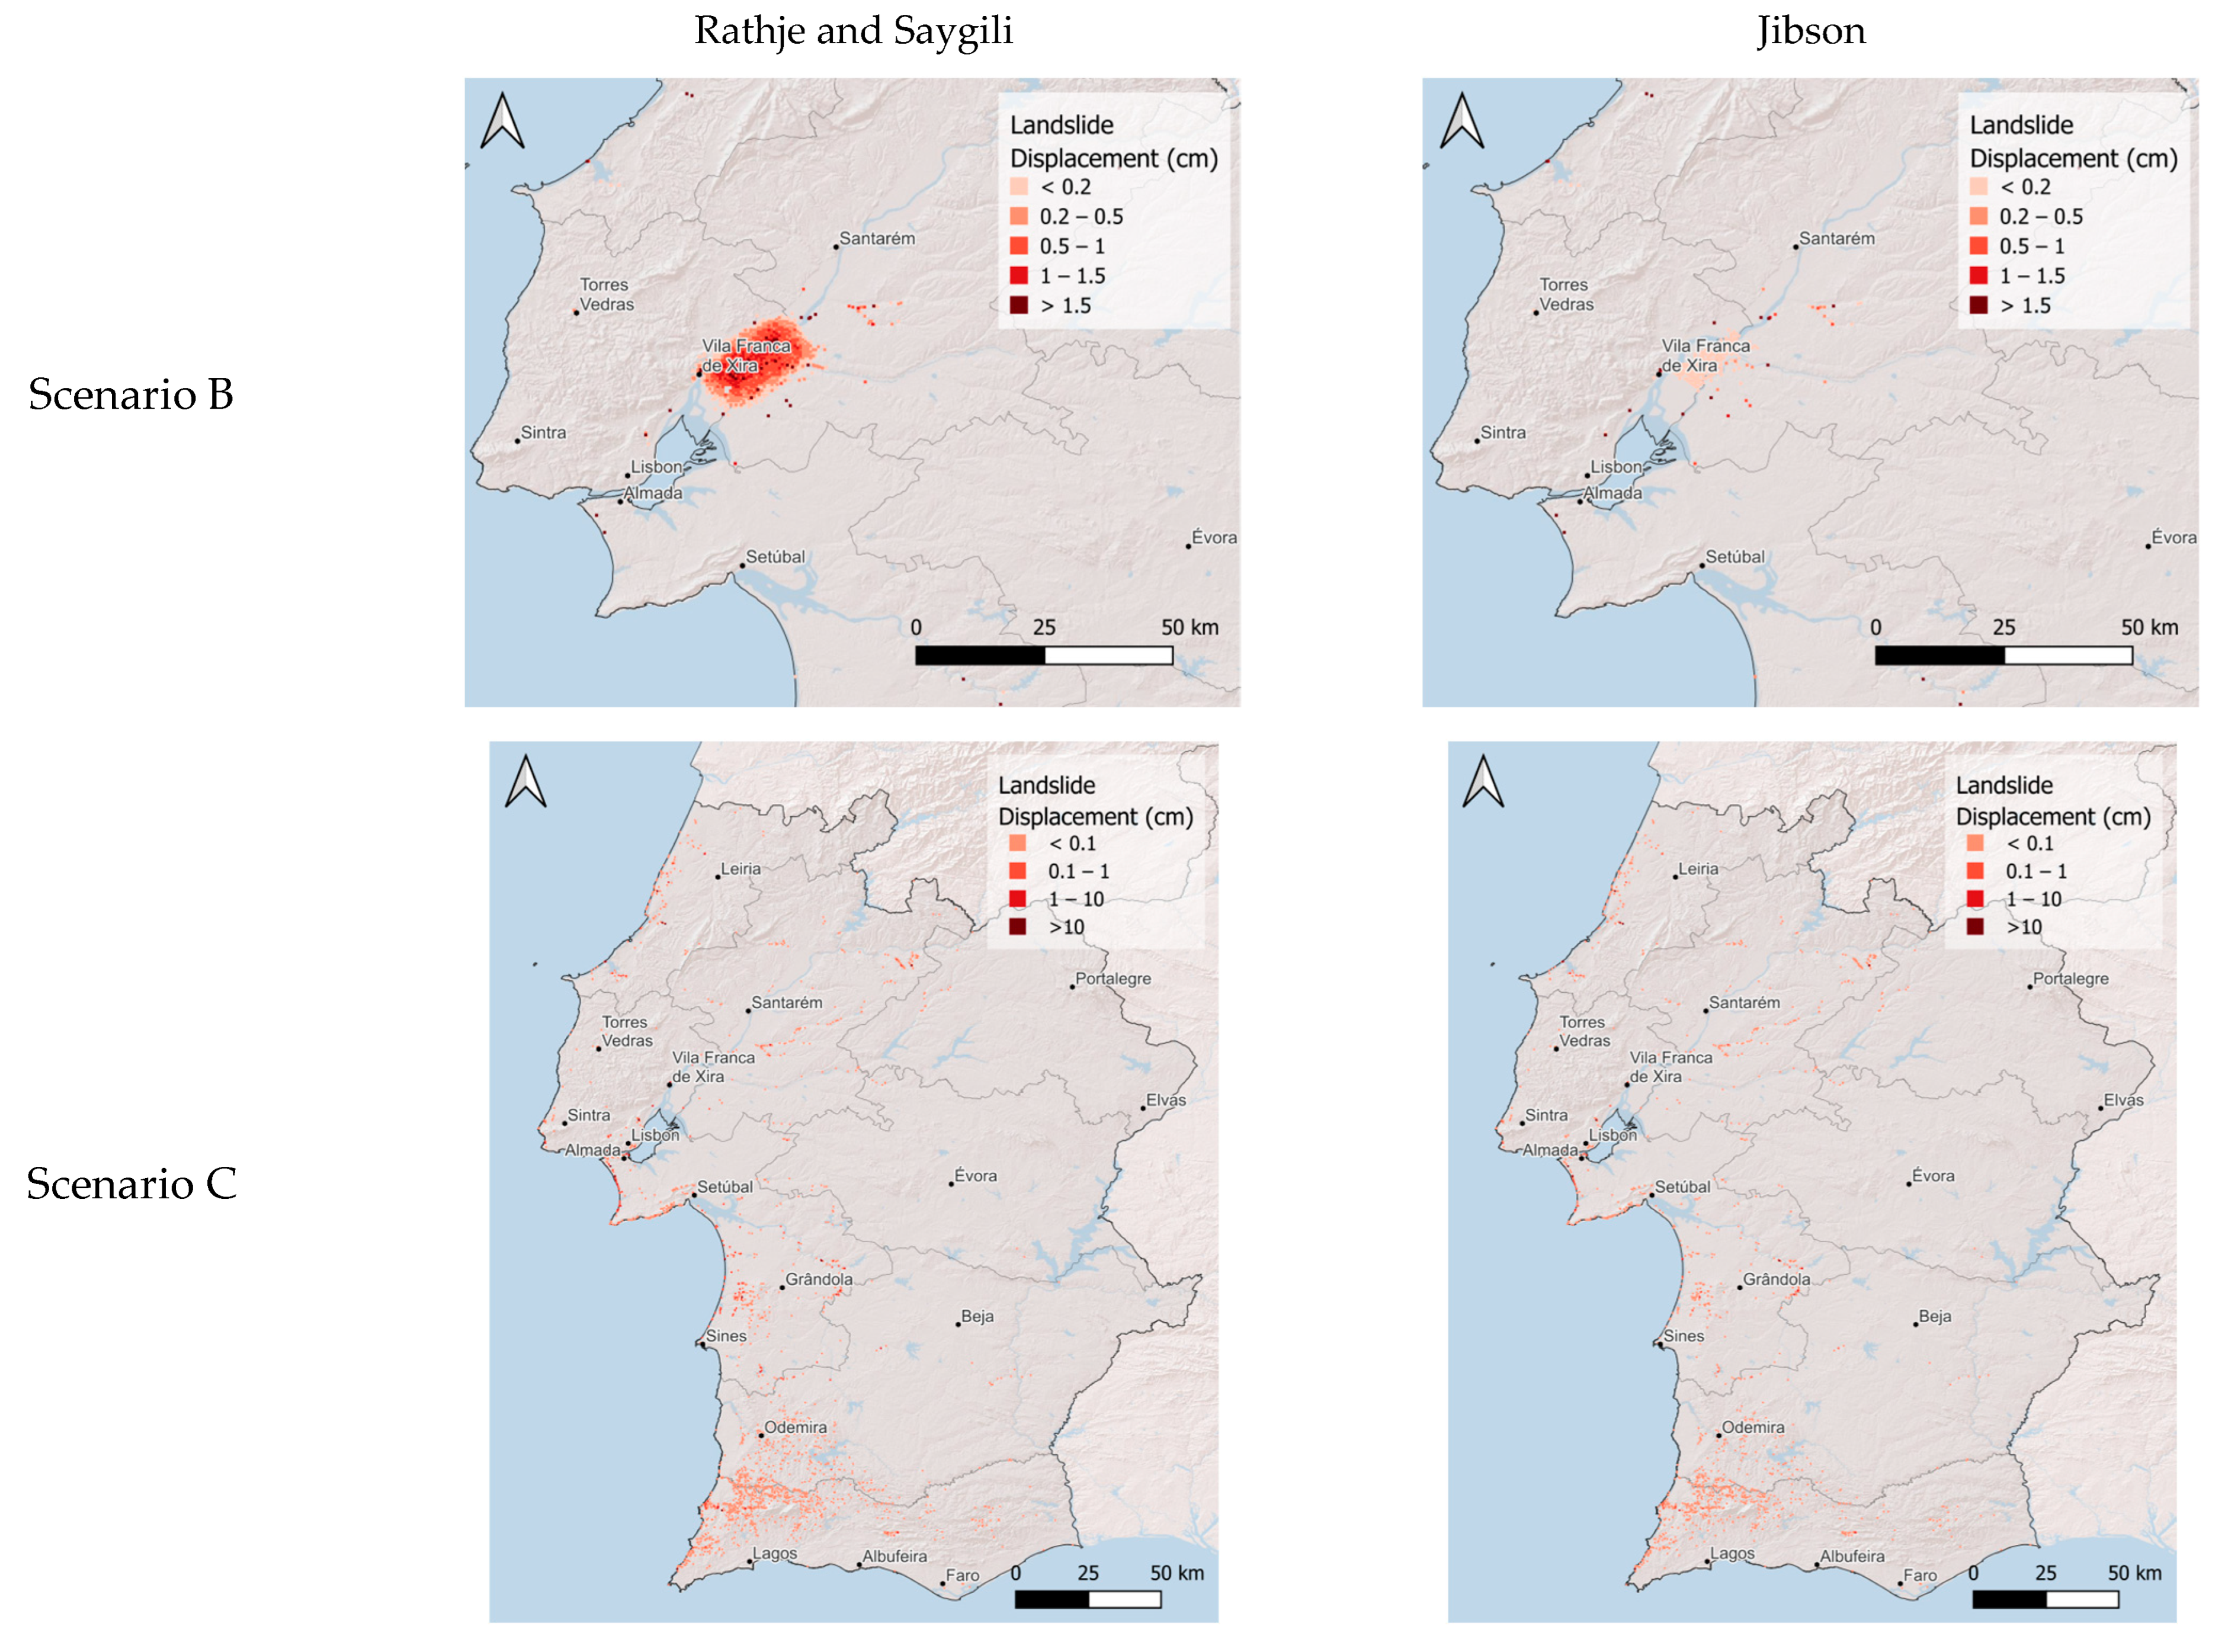
The landslide models also show systematic differences. For Scenarios A and C, the Rathje and Saygili [46] model produces both higher and more widespread displacement estimates. In Scenario B, the Rathje and Saygili [46] model still predicts non-zero displacement over a larger number of sites, although the maximum values are similar for the two models.
These differences highlight the importance of accounting for model uncertainty. For liquefaction, the main contrast is between broader, lower-amplitude estimates and more localized, higher-amplitude estimates. For landslides, the main contrast is the larger and more spatially extensive displacements obtained with the Rathje and Saygili [46] model, particularly in scenarios with stronger shaking.
4.2. Component Level Non-Operationality
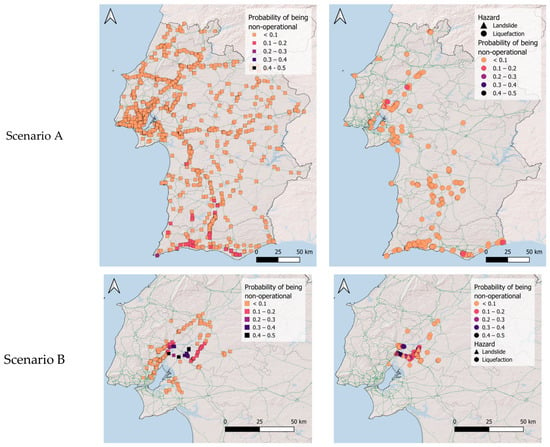
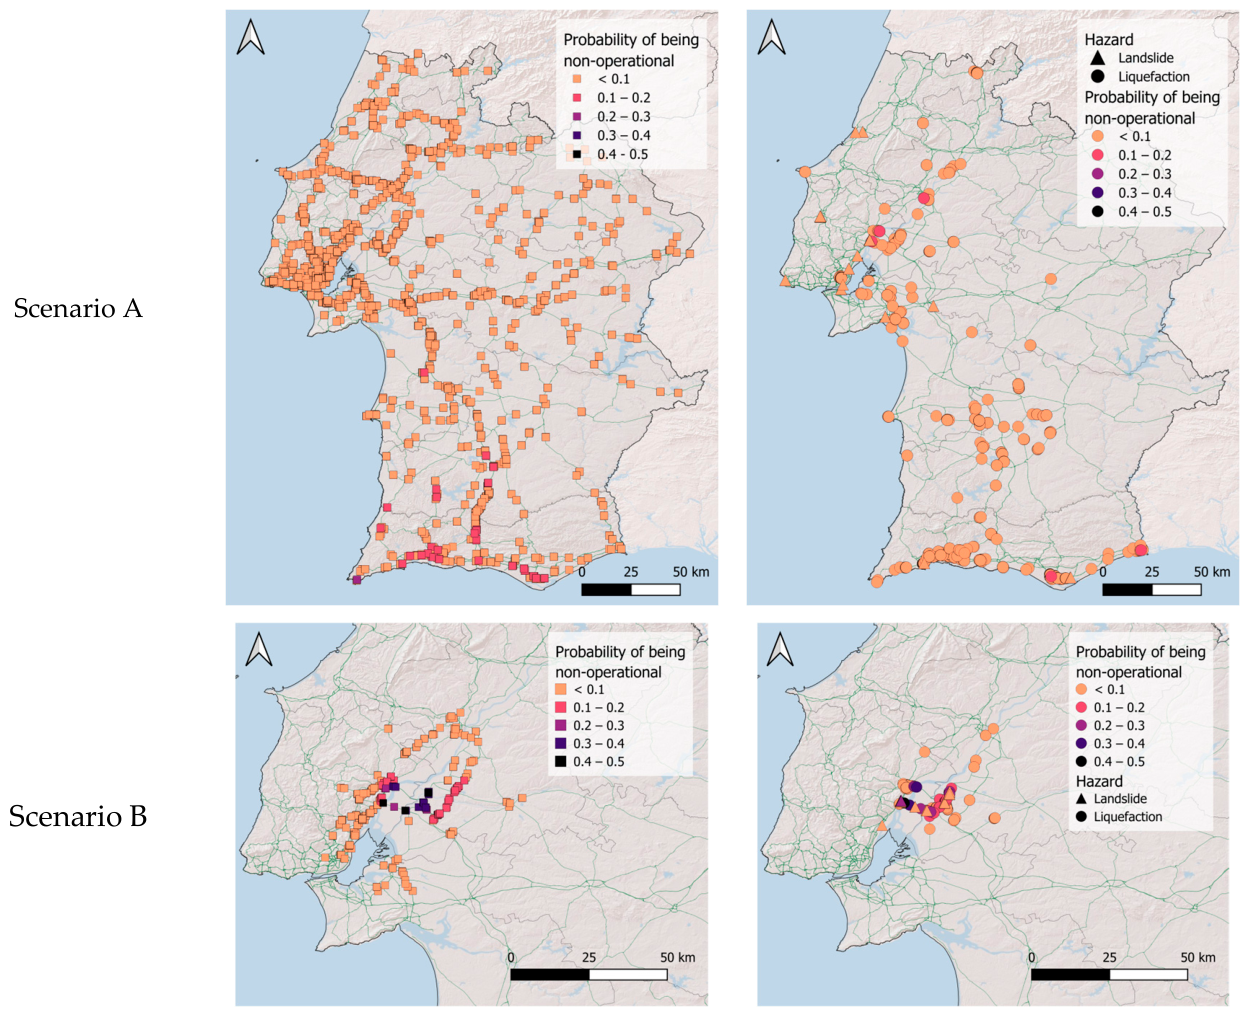
Using the fragility functions and consequence models described in Section 3.4, which relate ground-shaking, landslide displacement and liquefaction occurrence to damage and loss of functionality, the probability of each network component becoming non-operational was estimated. This corresponds to the probability of reaching an extensive or complete damage state. The resulting spatial distribution of non-operationality for the three scenarios is presented in Figure 11. For landslide and liquefaction hazards, the results reflect the combination of the two models adopted for each hazard within the logic tree framework, with their respective weights, thereby incorporating epistemic uncertainty in the hazard assessment.
Figure 11.
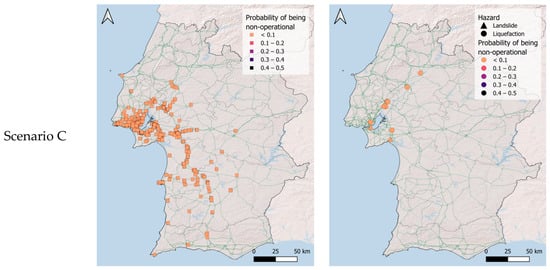
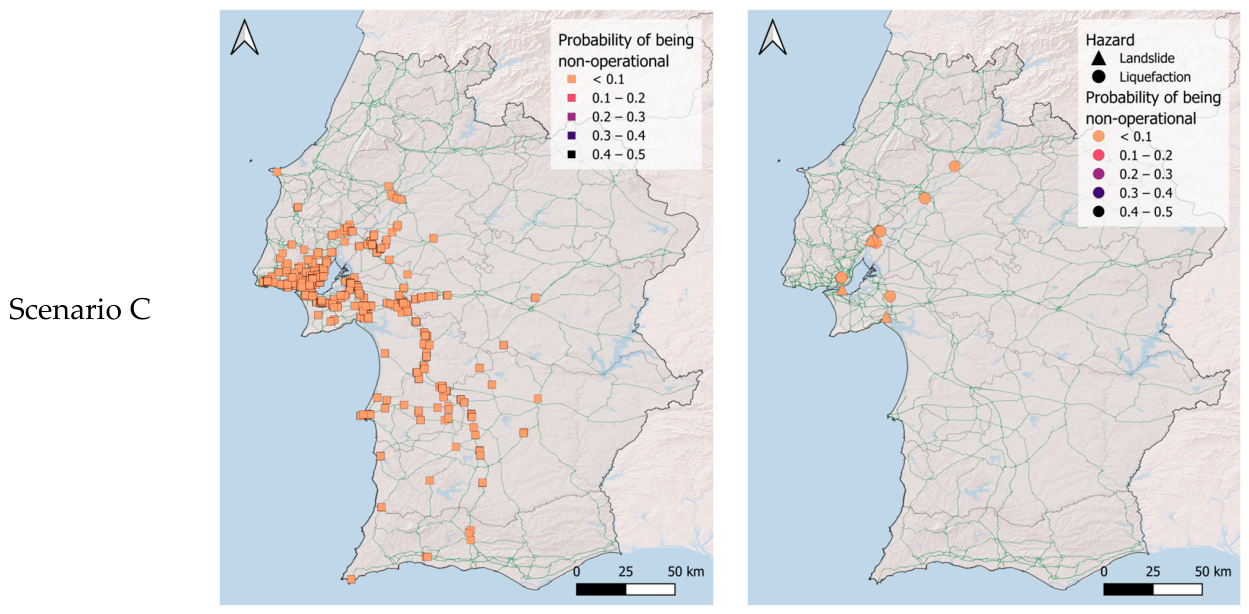
Probability of road-network components becoming non-operational due to ground shaking (left) and due to landslide and liquefaction (right) for scenario A (top), B (middle) and C (bottom).
The maps show that Scenario A produces widespread non-operationality, resulting in numerous disruptions across the southwestern part of the country, coinciding with the areas of highest shaking intensity. They also indicate that most disruptions are caused by ground-shaking, although some assets are rendered non-operational due to liquefaction, particularly in the southern part of the country and near water bodies, and due to landslides, especially in the area close to Lisbon.
Scenario B produces the highest levels of non-operationality in the Lower Tagus Valley, mainly as a result of liquefaction. Scenario C, by contrast, produces very few occurrences of non-operationality, reflecting the relatively low shaking levels generated by this scenario.
4.3. Connectivity Analysis
4.3.1. Combined Weighted Connectivity Loss
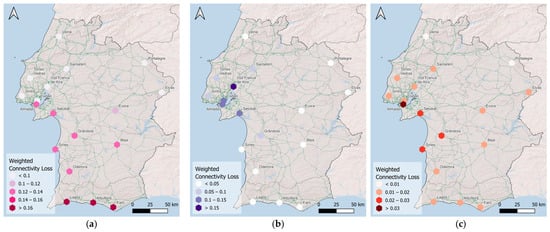
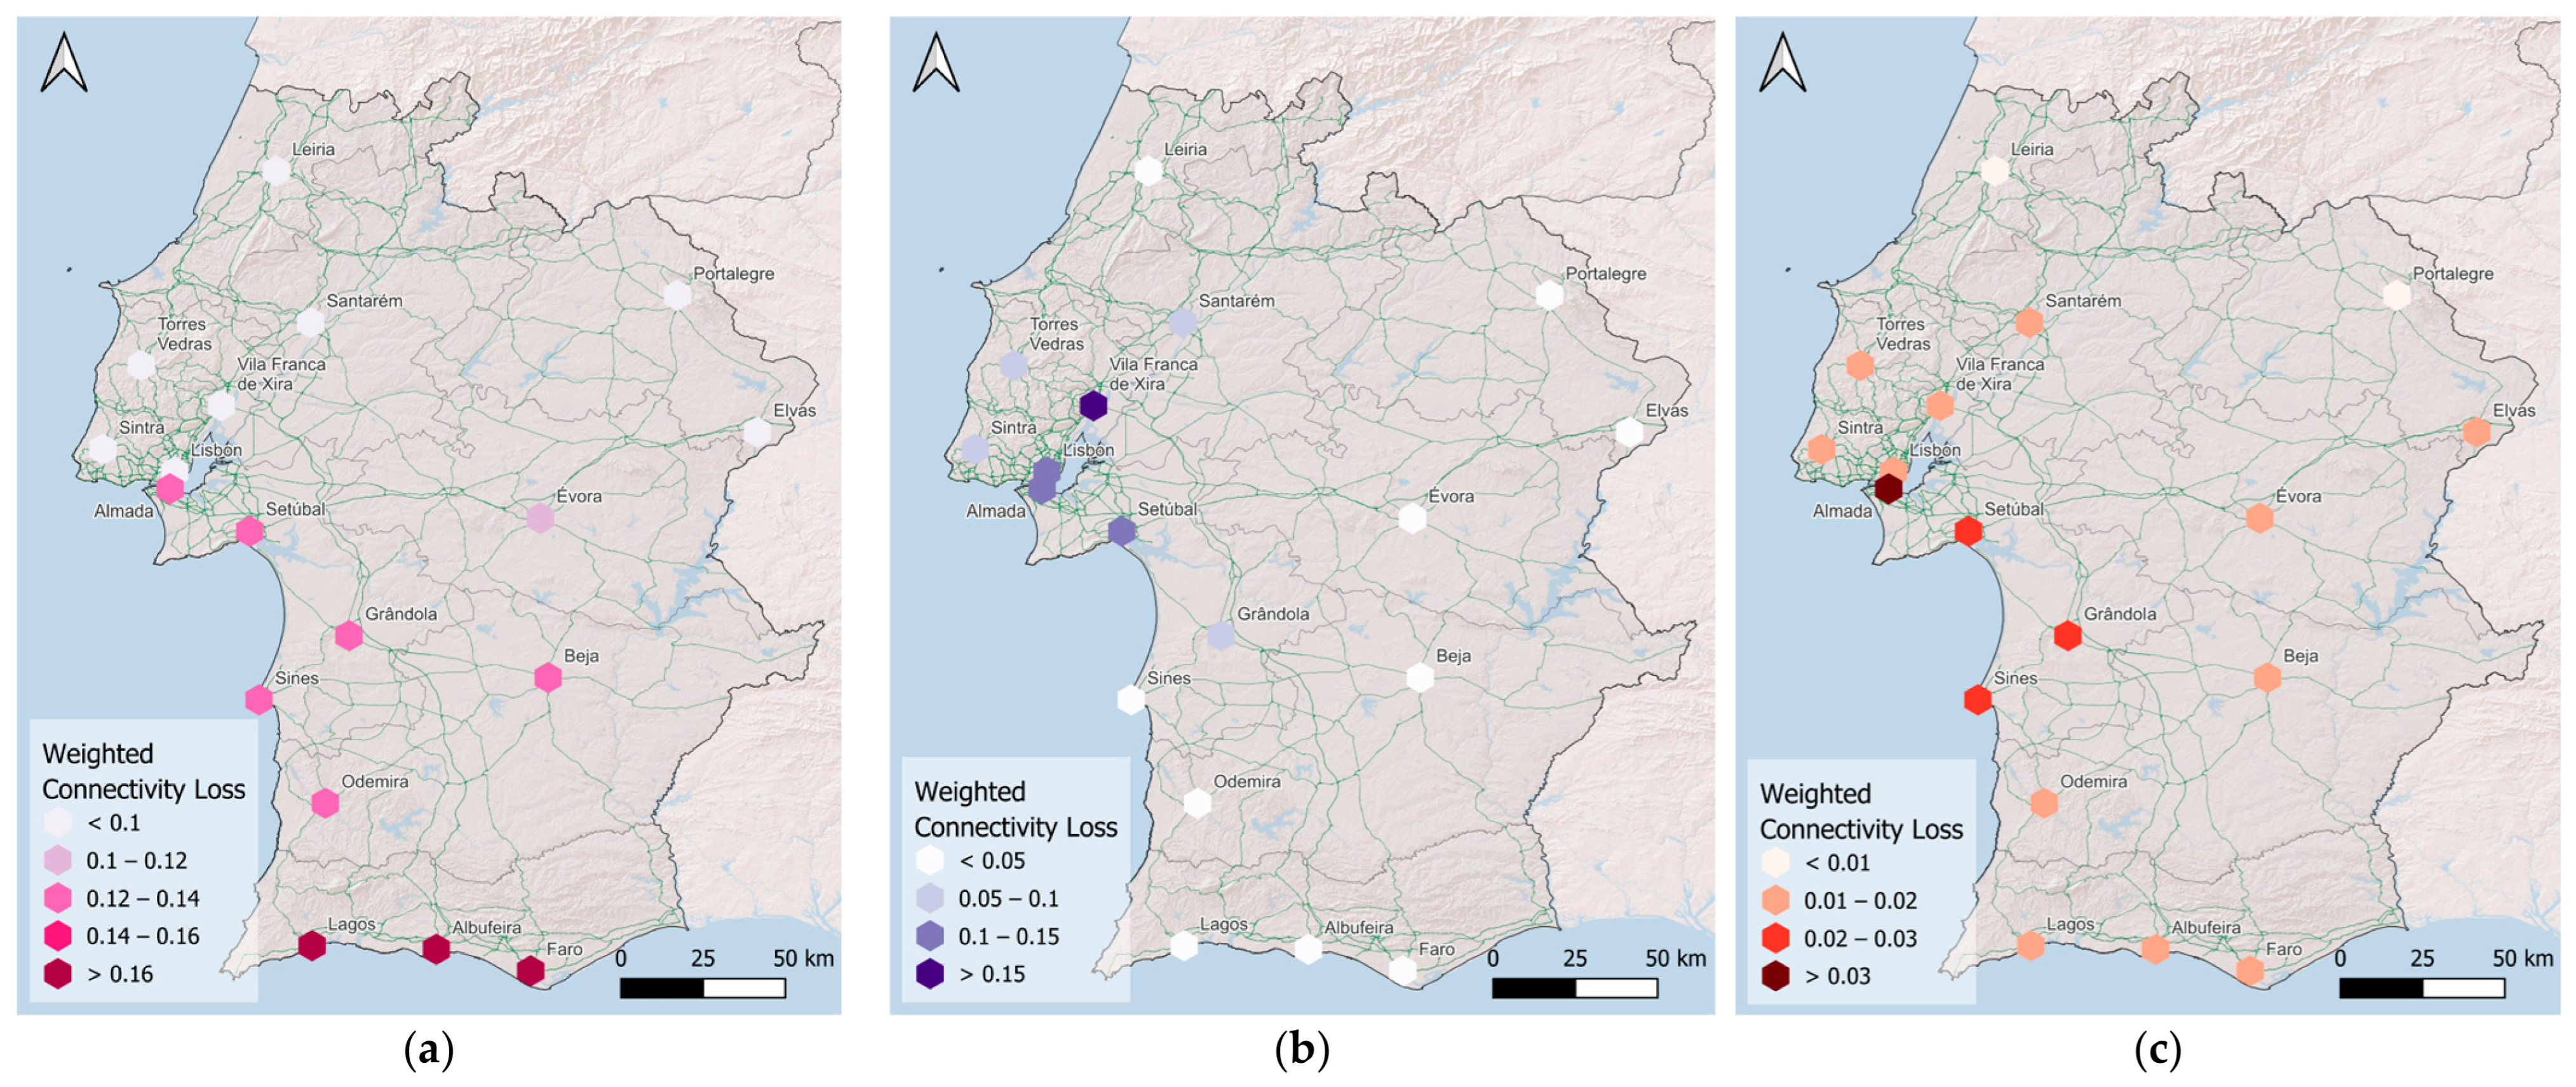
Figure 12 presents the WCL at the level of each Traffic Analysis Zone, considering the combined effects of ground-shaking, landslides, and liquefaction. In this analysis, the non-operational state of each network component is determined by the most critical damage state across all hazards, and the resulting WCL reflects the combined effect of hazard-induced component disruptions on network performance.
Figure 12.
Combined WCL for scenario A (a), B (b), and C (c).
Scenario A produces the most pronounced consequences in the southern region, where some areas reach WCL values close to 0.2. Scenario B leads to substantial connectivity losses in the Lisbon area, as expected given its proximity to the epicentre, while its effects are less pronounced in the southern and western regions. By contrast, scenario C results in the lowest overall weighted connectivity loss, indicating a more limited impact on network performance.
4.3.2. Contribution of Individual Hazards
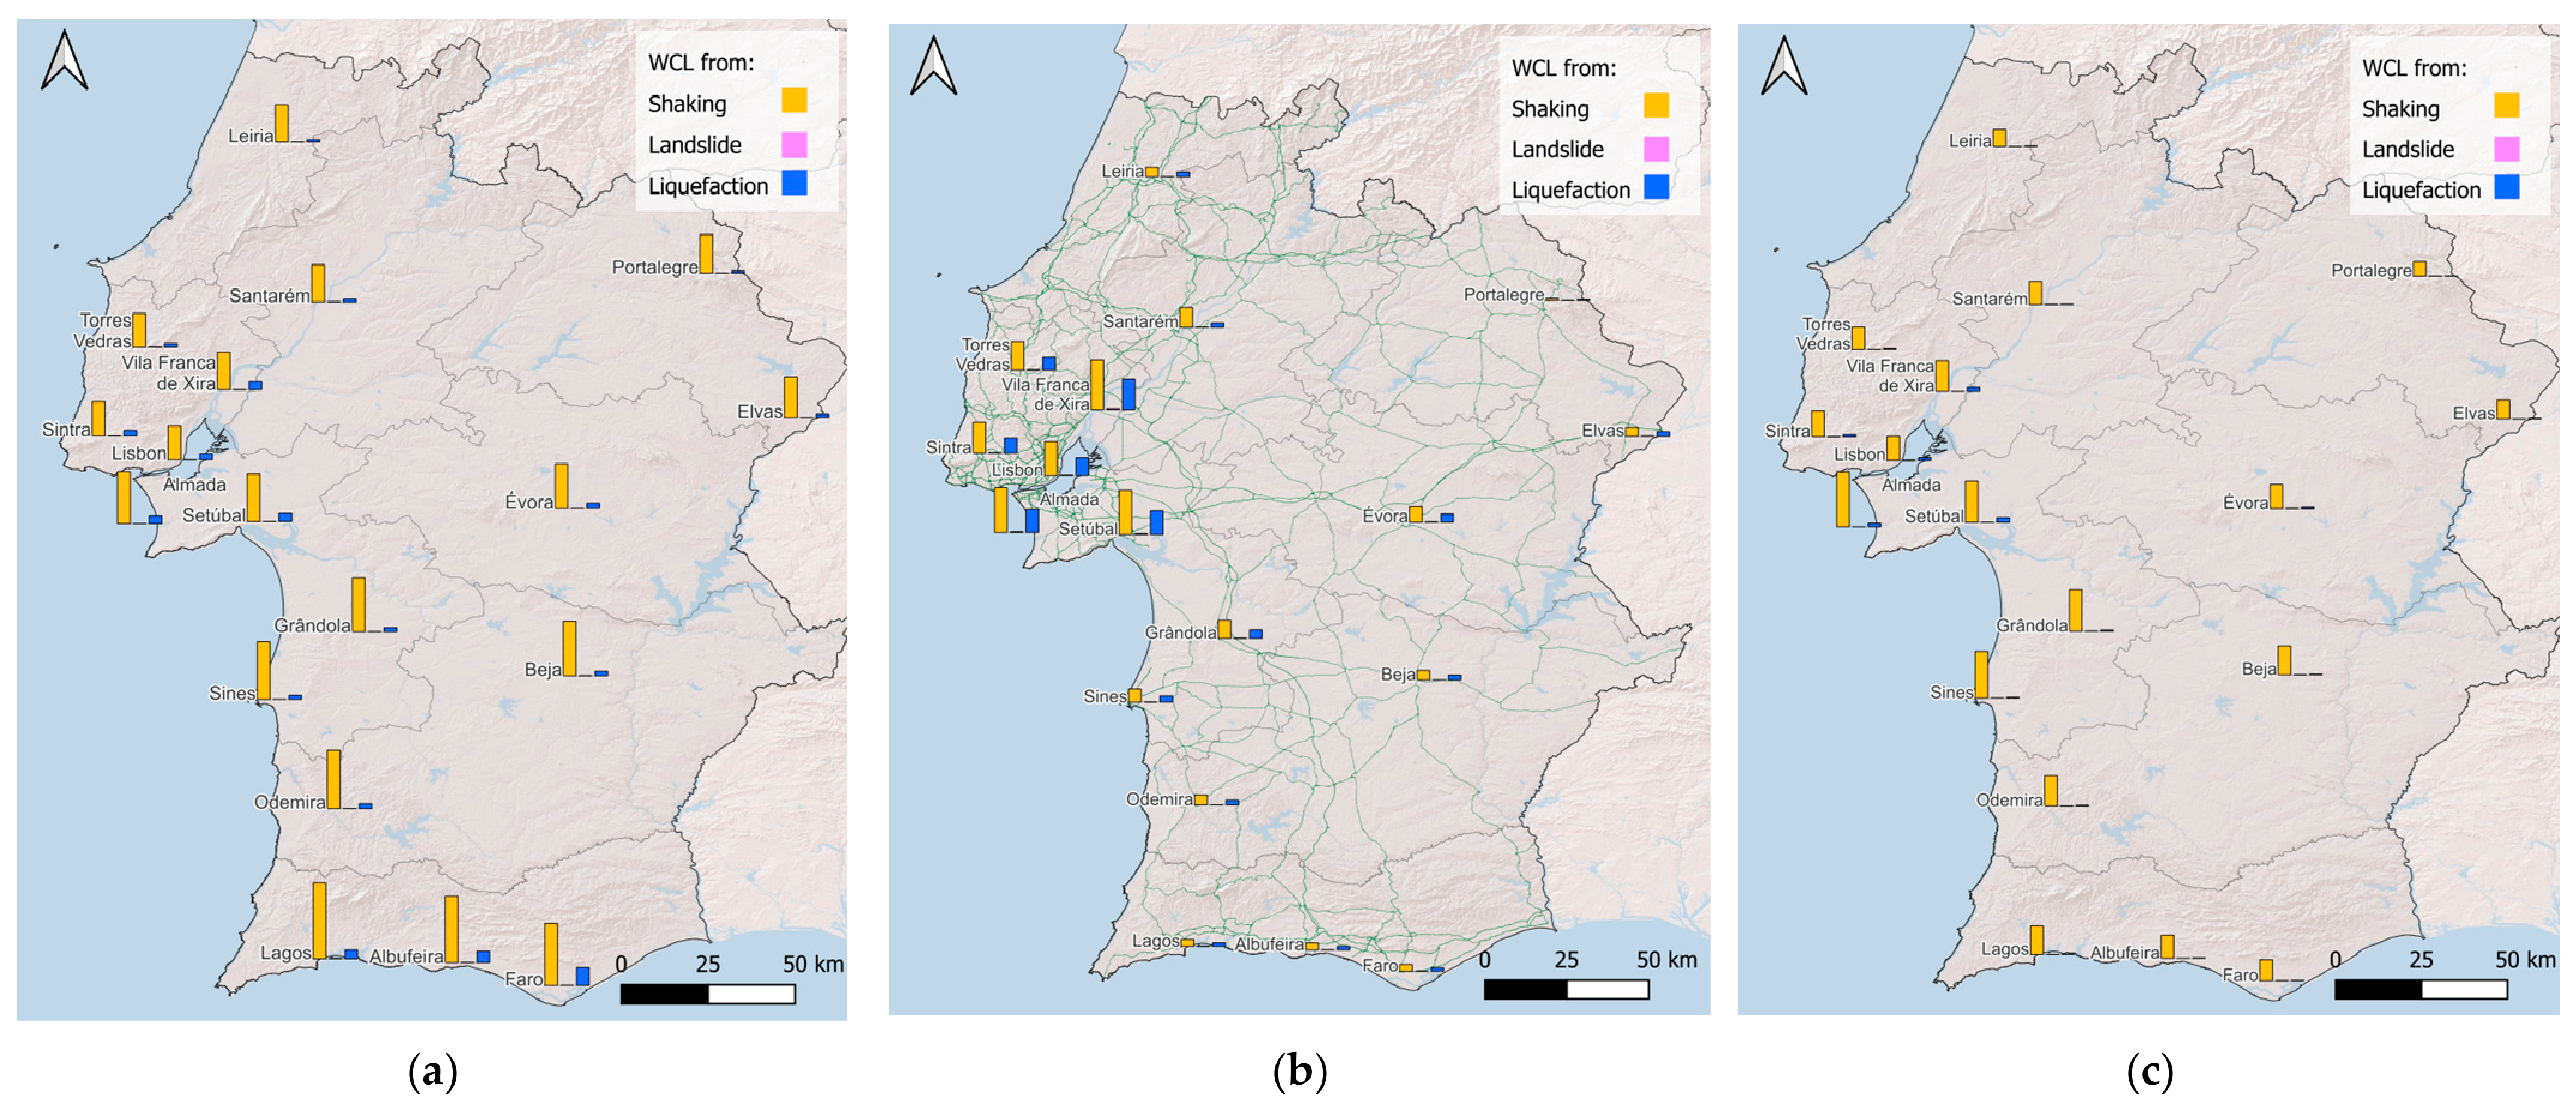
Based on the non-operational states derived for each hazard, the weighted connectivity loss (WCL) was calculated separately for ground-shaking, landslides, and liquefaction at the level of each Traffic Analysis Zone (TAZ), using the formulation described in Section 2.5. Figure 13 presents, for each scenario, the WCL values obtained by considering each hazard independently. The results are displayed as bar plots associated with each TAZ, allowing a direct comparison of the impact of the different hazards and the identification of the dominant driver of connectivity loss across the network.
Figure 13.
WCL per hazard for scenario A (a), B (b), and C (c).
The maps clearly identify ground-shaking as the main contributor to connectivity loss across the three scenarios. In scenario B, the area around Lisbon is also significantly affected by liquefaction, whereas landslide effects remain limited in all scenarios. This representation enables the identification of spatial patterns in hazard dominance, highlighting areas where secondary hazards play a significant role relative to ground-shaking.
The values reported in Table 4 correspond to the ratio between the WCL obtained for each individual hazard and the combined multi-hazard WCL, and provide an indication of the relative influence of ground-shaking, landslides, and liquefaction on overall network disruption. These ratios should not be interpreted as percentage contributions, because WCL is a nonlinear function of the spatial configuration of disrupted components.
Table 4.
Ratio between individual-hazard WCL and combined multi-hazard WCL for the three scenarios considered. Cell shading intensity increases with the ratio value.
When the sum of the ratios is lower than 100%, different hazards tend to affect different parts of the network, so their combined effect reduces redundancy and produces larger connectivity loss than the sum of individual-hazard results. Conversely, when the sum exceeds 100%, the affected components or connections overlap across hazards, and the combined impact is smaller than the sum of the individual effects. This behaviour is particularly evident in Scenario B, where disruptions are concentrated within a smaller region and may affect nearby links belonging to the same functional connection.
5. Discussion of the Results
This study demonstrates the value of integrating ground shaking, earthquake-induced landslides, and liquefaction within a common workflow for regional road-network disruption assessment. The results show that, although ground shaking remains the dominant driver of network disruption in most cases, secondary ground-failure hazards can modify the spatial pattern of non-operationality and affect specific links that are important for maintaining network redundancy and emergency accessibility. This finding is consistent with previous assessments showing that transportation-network consequences depend on the role and configuration of damaged components, rather than on physical damage alone. For example, Argyroudis et al. [13] and Stergiou and Kiremidjian [14] evaluated seismic road-network performance using system-level measures of connectivity and service disruption. The present study follows this perspective while extending it to the combined effects of ground shaking, landslides, and liquefaction on network connectivity.
The comparison between scenarios indicates that network disruption is controlled not only by the severity of shaking, but also by the spatial coincidence between hazard intensity, local susceptibility, exposed assets, and network topology. The contrasting impacts of the three scenarios show that earthquake magnitude alone is not sufficient to explain network disruption; rupture location, attenuation, local ground conditions, and the spatial relationship between hazards and critical infrastructure also play an important role.
Previous studies have also shown that the importance of secondary hazards can vary substantially with local conditions and the performance measure considered. Kiremidjian et al. [15], for instance, identified liquefaction-induced bridge damage as an important contributor to transportation losses in the San Francisco Bay Area, whereas in the present study ground shaking generally dominates regional connectivity loss and liquefaction becomes more important locally, particularly in Scenario B. Similarly, Lin et al. [20] highlighted the strong spatial variability of liquefaction exposure in road networks. The present results reinforce this spatially dependent behaviour and show that secondary hazards can affect network performance even when their regional contribution is comparatively limited. Their contribution therefore depends on the spatial interaction between hazard-specific predisposing conditions and the location and network importance of exposed assets.
A further outcome of the analysis is that multi-hazard impacts on network performance are not additive. When different hazards affect different parts of the network, their combined effect can reduce alternative routing options and generate larger connectivity losses than those obtained from individual-hazard analyses. Conversely, when different hazards affect the same components or nearby links within the same functional connection, the combined WCL may be lower than the sum of the individual-hazard WCL values. This reinforces findings from previous systemic road-network studies [13,14,15] that network consequences depend on the configuration and function of damaged components rather than simply on their number. It should be noted that the non-additivity arises from network topology and overlapping component disruption; physical interaction or cumulative damage from multiple hazards at the component level is not explicitly modelled.
The comparison between individual models further highlights the relevance of epistemic uncertainty in secondary-hazard modelling. For liquefaction, the selected models differ in the spatial extent and magnitude of the predicted occurrence, while the landslide models differ mainly in the magnitude and spatial extent of predicted displacement. These differences show that model selection can influence the locations where secondary hazards are identified as important contributors to network disruption. However, the two models considered for each hazard should not be interpreted as spanning the full epistemic uncertainty; rather, they provide an indication of the sensitivity of the results to model selection.
From a risk-reduction and emergency-planning perspective, the results suggest that prioritization should not focus exclusively on areas of highest ground shaking. Links combining high network importance with susceptibility to liquefaction or landslides may require particular attention even when the secondary hazards make a relatively small contribution to regional WCL. This complements previous road-network assessments in Portugal [35,37], while extending them through the explicit consideration of both landslides and liquefaction and their effects on network-wide connectivity.
These results should be interpreted as regional screening estimates conditioned on the selected scenarios and modelling assumptions. At the secondary-hazard modelling level, several simplifications affect the interpretation of the results. The landslide analysis is restricted to translational slope displacement and does not explicitly represent other failure mechanisms, such as rockfalls, highly disrupted failures, or post-failure runout. Consequently, disruption may be underestimated where failures initiate upslope and subsequently affect road corridors. The landslide estimates are also affected by uncertainty in the geotechnical parameters and effective sliding-mass thickness, which were treated deterministically because detailed regional data were not available to define their variability probabilistically. The resulting displacement estimates should therefore be interpreted as indicative at the regional scale rather than as site-specific predictions. Similarly, the liquefaction models rely on regional geospatial proxies rather than site-specific geotechnical investigations, and the adopted representation does not explicitly characterize the magnitude of permanent ground deformation, settlement, or lateral spreading.
At the component-damage and functionality level, additional simplifications arise from the available exposure and fragility information. The bridge inventory lacks detailed information on structural typology, construction material, age, and seismic detailing, requiring the use of bridge length as a first-order classification criterion and HAZUS fragility functions as proxy relationships for some bridge classes. Differences between the bridge populations represented in HAZUS and those in Portugal therefore introduce additional uncertainty into the damage estimates. Finally, component functionality is represented using a binary assumption: components experiencing slight or moderate damage remain available to the network, whereas those reaching extensive or complete damage are removed. This classification refers to network availability rather than full-service capacity; possible lane closures, speed restrictions, or other partial functionality losses of damaged but traversable components are not explicitly represented.
Additional limitations arise from the representation of the transportation network and the way its performance is evaluated. The analysed network is restricted to highways and primary roads, excluding secondary roads that may provide alternative routes when major links are disrupted. This simplification reduces the redundancy represented in the network and may therefore lead to an overestimation of connectivity loss in locations where lower-order roads could provide viable detours.
The adopted connectivity-based formulation also represents network performance in terms of accessibility rather than traffic service. It does not explicitly account for traffic demand, link-capacity reductions, congestion, route choice, or post-event traffic redistribution. Consequently, WCL should be interpreted as a measure of degradation in network accessibility and path efficiency, rather than as an estimate of traffic delay, travel-time loss, or indirect economic consequences. In addition, the analysis represents a static post-event condition and does not account for repair processes or time-dependent recovery.
These assumptions are consistent with the regional and scenario-based scope of the study, whose primary objective is to compare the relative contribution of ground shaking, landslides, and liquefaction to network disruption rather than to reproduce detailed post-earthquake traffic conditions. Future applications could progressively extend the framework through the inclusion of lower-order roads, partial functionality states, traffic-assignment models, and recovery processes, together with more detailed exposure and infrastructure information.
6. Conclusions
This study developed and applied a scenario-based multi-hazard framework for assessing earthquake-induced disruption to regional road networks. The framework integrates ground shaking, earthquake-induced landslides, and liquefaction within an OpenQuake-based workflow, translates component damage into operational status, and evaluates the resulting degradation in network performance using weighted connectivity loss.
The application to Southern Portugal shows that the inclusion of secondary ground-failure hazards provides a more complete representation of road-network disruption than ground-shaking-only analysis. Scenario A produces the most widespread disruption, mainly due to ground shaking, with localized contributions from liquefaction and landslides. Scenario B produces more concentrated impacts in the Lower Tagus Valley and Lisbon region, where liquefaction becomes an important contributor to non-operationality and connectivity loss, while Scenario C produces limited disruption because lower shaking levels affect the exposed road network.
The results demonstrate that multi-hazard impacts on network performance are not linearly additive. When different hazards affect different parts of the network, their combined effect can reduce redundancy and increase connectivity loss. When hazards affect overlapping components or nearby links within the same functional connection, the combined impact can be lower than the sum of the individual-hazard effects. This confirms the need for system-level network analysis rather than simple aggregation of component-level damage.
The proposed workflow provides a transparent and reproducible basis for regional multi-hazard assessment of earthquake impacts on transportation networks. It can help identify areas where ground shaking, liquefaction, or landslides may compromise accessibility and where more detailed geotechnical investigation, improved bridge information, or targeted mitigation may be warranted.
Author Contributions
Conceptualization, A.P., C.C., M.M. and V.S.; methodology, A.P., C.C. and V.S.; formal analysis, A.P.; investigation, A.P.; writing—original draft preparation, A.P. and C.C.; writing—review and editing, V.S. and L.G.; visualization, A.P. and C.C.; supervision, C.C. and V.S.; funding acquisition, C.C., V.S. and L.G. All authors have read and agreed to the published version of the manuscript.
Funding
This work was financially supported by national funds through the FCT/MCTES (PIDDAC), under the project 2022.07628.PTDC-SAFENET—Seismic risk assessment for transportation networks, with DOI 10.54499/2022.07628.PTDC (https://doi.org/10.54499/2022.07628.PTDC) and by Base Funding-UIDB/04708/2020 with DOI 10.54499/UIDB/04708/2020 (https://doi.org/10.54499/UIDB/04708/2020) of the CONSTRUCT—Instituto de I&D em Estruturas e Construções.
Data Availability Statement
The raw data supporting the conclusions of this article will be made available by the authors on request.
Conflicts of Interest
The authors declare no conflicts of interest.
Appendix A
Figure A1.
Liquefaction estimates for Scenarios B and C obtained using the Allstadt et al. [41] and Todorovic and Silva [48] models.
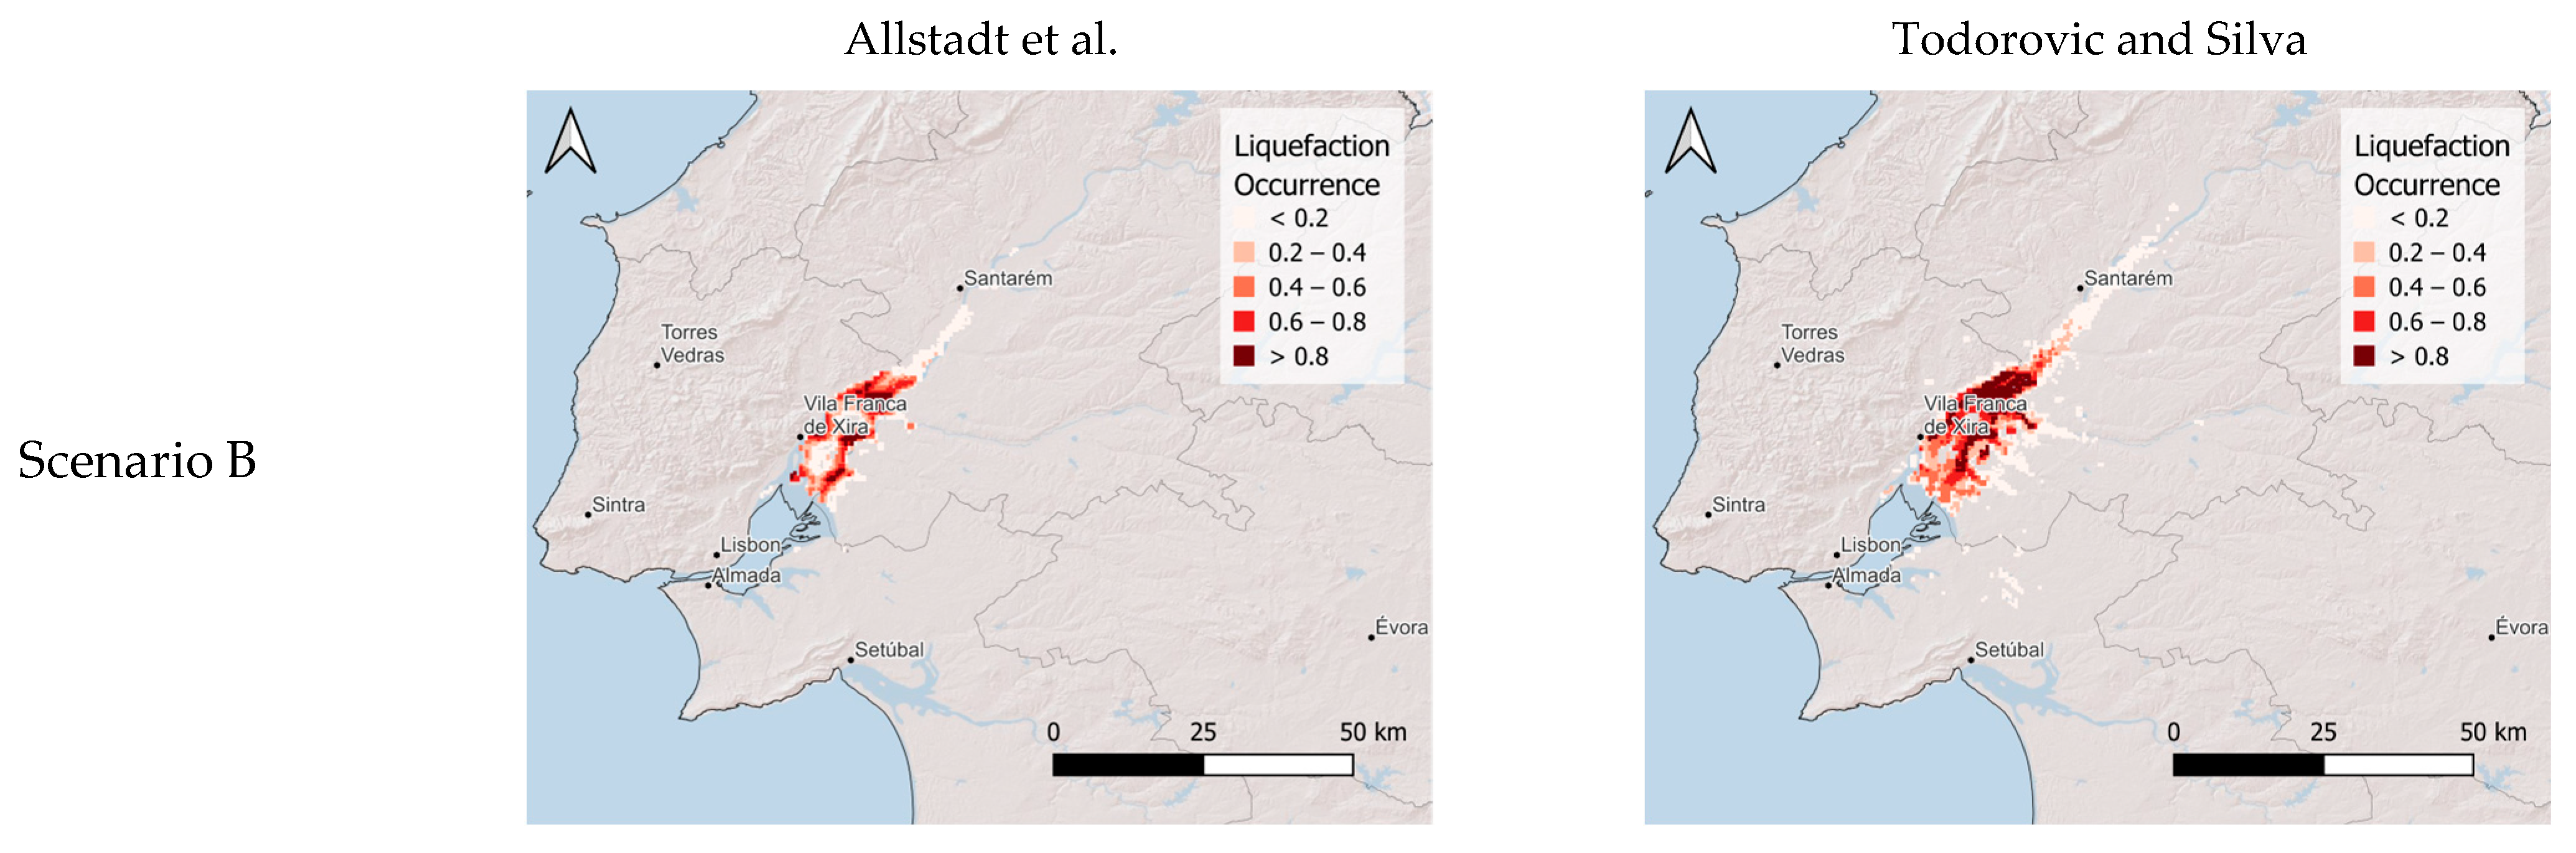
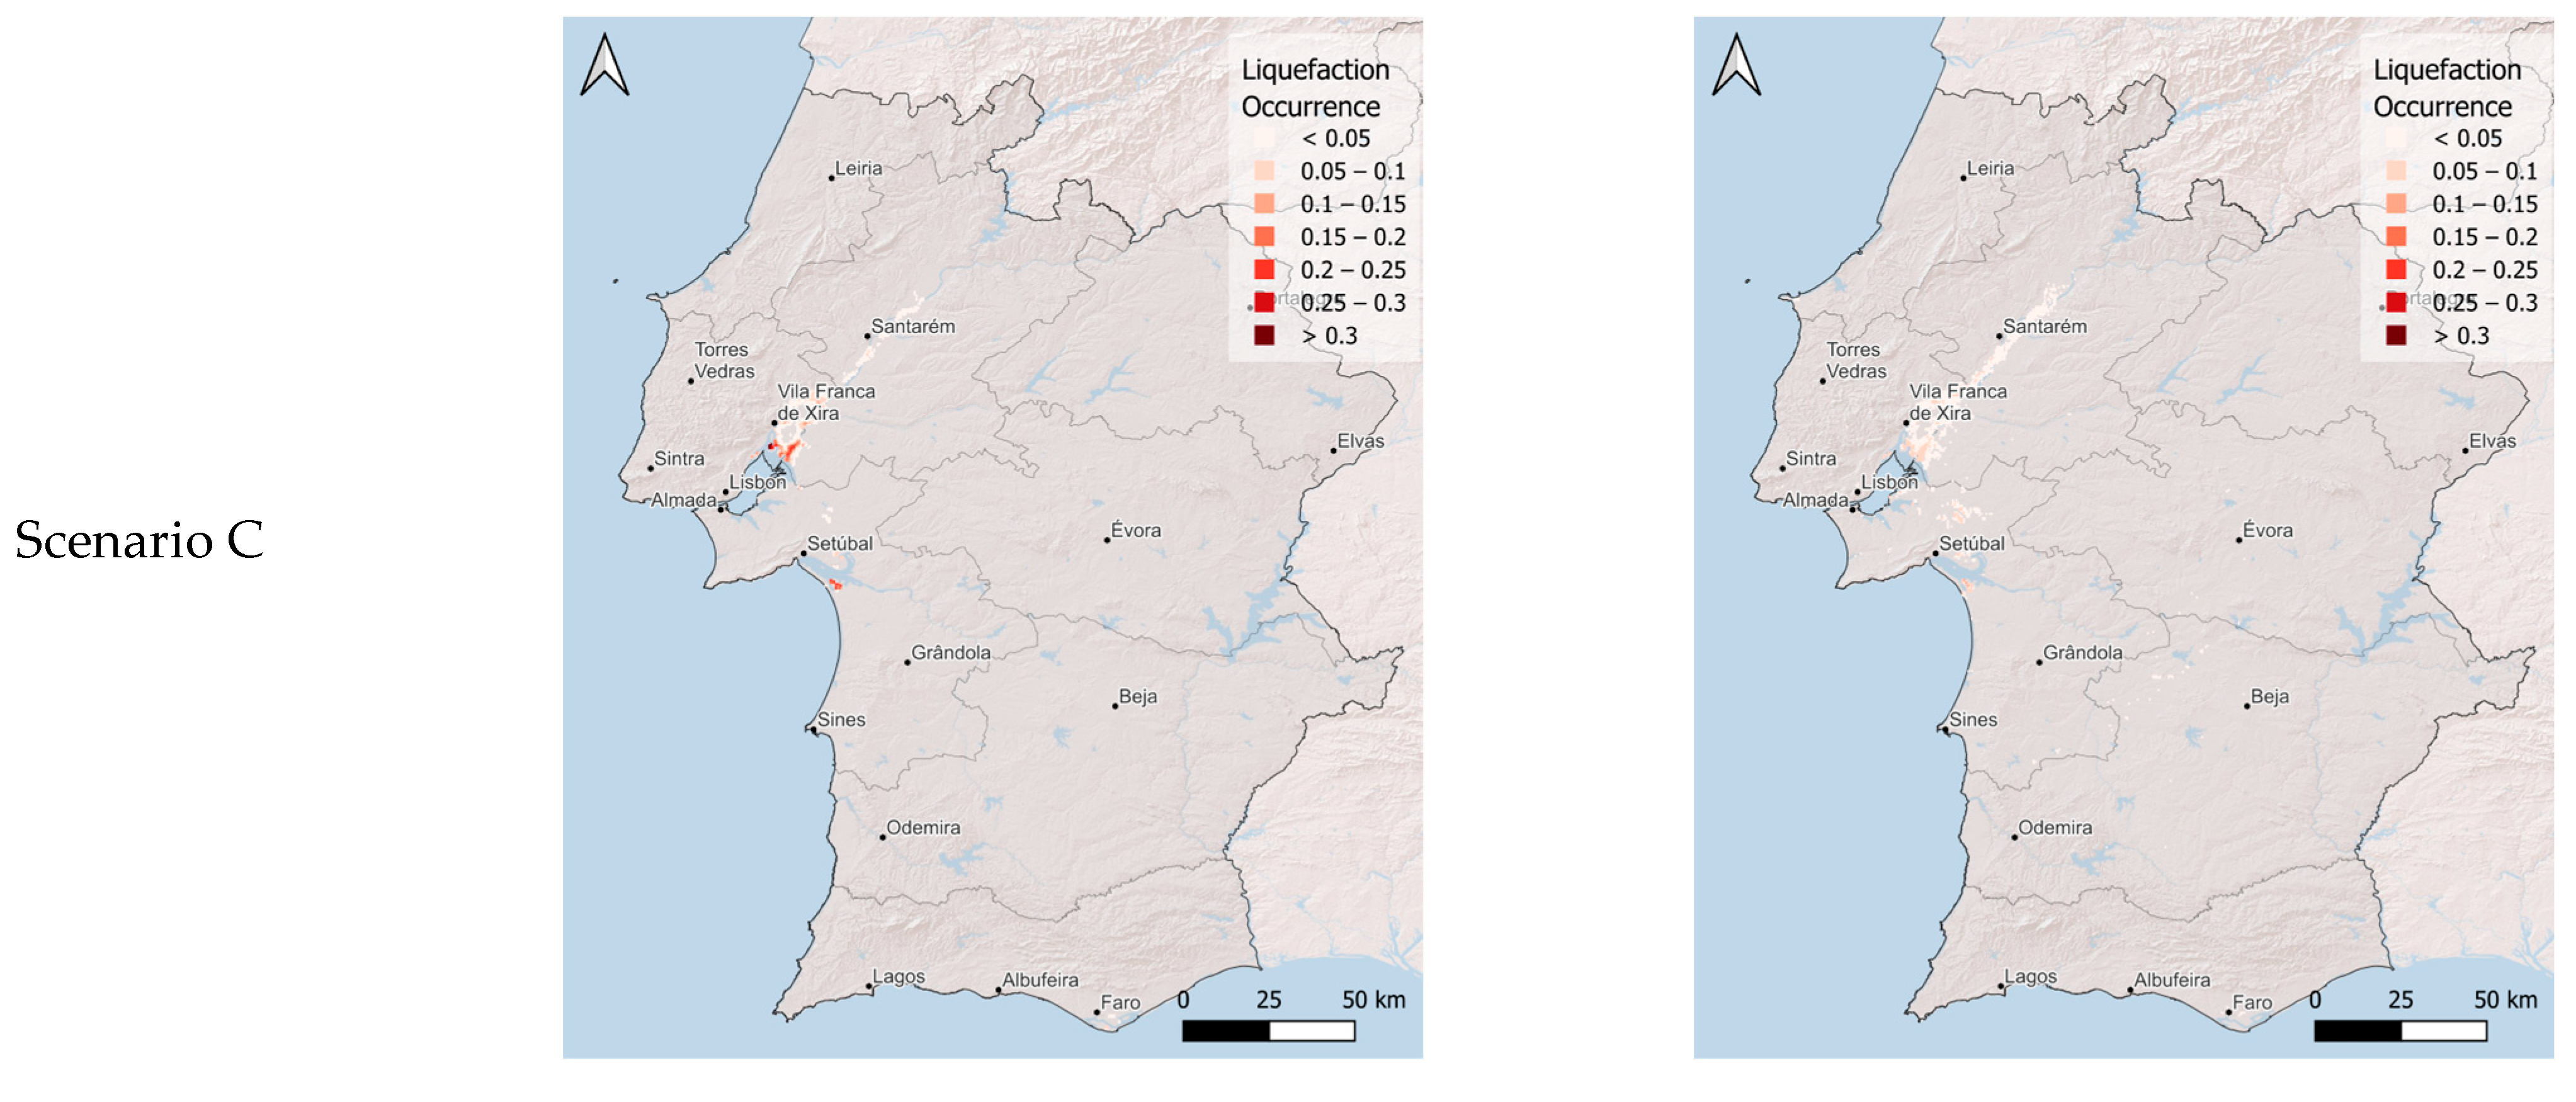
Figure A2.
Landslide displacement estimates for Scenarios B and C obtained using the Rathje and Saygili [46] and Jibson [47] models.
References
- Bird, J.F.; Bommer, J.J. Earthquake Losses Due to Ground Failure. Eng. Geol. 2004, 75, 147–179. [Google Scholar] [CrossRef] [Scilit]
- Kilanitis, I.; Sextos, A. Integrated Seismic Risk and Resilience Assessment of Roadway Networks in Earthquake Prone Areas. Bull. Earthq. Eng. 2019, 17, 181–210. [Google Scholar] [CrossRef] [Scilit]
- Zhou, Y.; Banerjee, S.; Shinozuka, M. Socio-Economic Effect of Seismic Retrofit of Bridges for Highway Transportation Networks: A Pilot Study. Struct. Infrastruct. Eng. 2010, 6, 145–157. [Google Scholar] [CrossRef] [Scilit]
- Ishihara, K.; Koga, Y. Case Studies of Liquefaction in the 1964 Niigata Earthquake. Soils Found. 1981, 21, 35–52. [Google Scholar] [CrossRef] [Scilit] [PubMed]
- Elgamal, A.-W.; Zeghal, M.; Parra, E. Liquefaction of Reclaimed Island in Kobe, Japan. J. Geotech. Eng. 1996, 122, 39–49. [Google Scholar] [CrossRef] [Scilit]
- Cao, Z.; Youd, T.L.; Yuan, X. Gravelly Soils That Liquefied during 2008 Wenchuan, China Earthquake, Ms = 8.0. Soil Dyn. Earthq. Eng. 2011, 31, 1132–1143. [Google Scholar] [CrossRef] [Scilit]
- Li, J.; Peng, T.; Xu, Y. Damage Investigation of Girder Bridges under the Wenchuan Earthquake and Corresponding Seismic Design Recommendations. Earthq. Eng. Eng. Vib. 2008, 7, 337–344. [Google Scholar] [CrossRef] [Scilit]
- Pang, Y.; Meng, R.; Li, C.; Li, C. A Probabilistic Approach for Performance-Based Assessment of Highway Bridges under Post-Earthquake Induced Landslides. Soil Dyn. Earthq. Eng. 2022, 155, 107207. [Google Scholar] [CrossRef] [Scilit]
- Mason, D.; Brabhaharan, P.; Saul, G. Performance of Road Networks in the 2016 Kaikōura Earthquake: Observations on Ground Damage and Outage Effects. In Proceedings of the 20th NZGS Geotechnical Symposium, Napier, New Zealand, 24–26 November 2017; pp. 24–26. [Google Scholar]
- Martino, S.; Bozzano, F.; Caporossi, P.; D’Angiò, D.; Della Seta, M.; Esposito, C.; Fantini, A.; Fiorucci, M.; Giannini, L.M.; Iannucci, R.; et al. Impact of Landslides on Transportation Routes during the 2016–2017 Central Italy Seismic Sequence. Landslides 2019, 16, 1221–1241. [Google Scholar] [CrossRef] [Scilit]
- Lo, I.-T.; Lin, C.-Y.; Yang, C.-T.; Chuang, Y.-J.; Lin, C.-H. Assessing the Blockage Risk of Disaster-Relief Road for a Large-Scale Earthquake. KSCE J. Civ. Eng. 2020, 24, 3820–3834. [Google Scholar] [CrossRef] [Scilit]
- Robinson, T.R.; Davies, T.R.H.; Wilson, T.M.; Orchiston, C.; Barth, N. Evaluation of Coseismic Landslide Hazard on the Proposed Haast-Hollyford Highway, South Island, New Zealand. Georisk Assess. Manag. Risk Eng. Syst. Geohazards 2016, 10, 146–163. [Google Scholar] [CrossRef] [Scilit][Green Version]
- Argyroudis, S.; Selva, J.; Gehl, P.; Pitilakis, K. Systemic Seismic Risk Assessment of Road Networks Considering Interactions with the Built Environment. Comput. Aided Civ. Infrastruct. Eng. 2015, 30, 524–540. [Google Scholar] [CrossRef] [Scilit]
- Stergiou, E.C.; Kiremidjian, A.S. Risk Assessment of Transportation Systems with Network Functionality Losses. Struct. Infrastruct. Eng. 2010, 6, 111–125. [Google Scholar] [CrossRef] [Scilit]
- Kiremidjian, A.; Moore, J.; Fan, Y.Y.; Yazlali, O.; Basoz, N.; Williams, M. Seismic Risk Assessment of Transportation Network Systems. J. Earthq. Eng. 2007, 11, 371–382. [Google Scholar] [CrossRef] [Scilit]
- Glade, T. Vulnerability Assessment in Landslide Risk Analysis. Erde 2003, 134, 123–146. [Google Scholar]
- Jaiswal, P.; Van Westen, C.J.; Jetten, V. Quantitative Assessment of Direct and Indirect Landslide Risk along Transportation Lines in Southern India. Nat. Hazards Earth Syst. Sci. 2010, 10, 1253–1267. [Google Scholar] [CrossRef] [Scilit]
- Michael-Leiba, M.; Granger, K.; Scott, G. Landslide Risk in Cairns. Aust. J. Emerg. Manag. 2000, 15, 32–34. [Google Scholar]
- FEMA. Hazus-MH 6.1—Earthquake Model Technical Manual; Department of Homeland Security: Washington, DC, USA. Available online: https://www.fema.gov/sites/default/files/documents/fema_hazus-earthquake-model-technical-manual-6-1.pdf (accessed on 12 July 2026).
- Lin, A.F.; Wotherspoon, L.; Zorn, C. Evaluating Liquefaction Exposure of Road Networks to Support Decision-Making. Earthq. Spectra 2025, 41, 3337–3364. [Google Scholar] [CrossRef] [Scilit]
- Franchin, P.; Cavalieri, F. Seismic Vulnerability Analysis of a Complex Interconnected Civil Infrastructure. In Handbook of Seismic Risk Analysis and Management of Civil Infrastructure Systems; Elsevier: Amsterdam, The Netherlands, 2013; pp. 465–514e. [Google Scholar]
- Costa, C.; Figueiredo, R.; Silva, V.; Bazzurro, P. Application of Open Tools and Datasets to Probabilistic Modeling of Road Traffic Disruptions Due to Earthquake Damage. Earthq. Eng. Struct. Dyn. 2020, 49, 1236–1255. [Google Scholar] [CrossRef] [Scilit]
- Chang, S.E.; Shinozuka, M.; Moore, J.E. Probabilistic Earthquake Scenarios: Extending Risk Analysis Methodologies to Spatially Distributed Systems. Earthq. Spectra 2000, 16, 557–572. [Google Scholar] [CrossRef] [Scilit]
- Vaziri, P.; Davidson, R.; Apivatanagul, P.; Nozick, L. Identification of Optimization-Based Probabilistic Earthquake Scenarios for Regional Loss Estimation. J. Earthq. Eng. 2012, 16, 296–315. [Google Scholar] [CrossRef] [Scilit]
- Jayaram, N.; Baker, J.W. Efficient Sampling and Data Reduction Techniques for Probabilistic Seismic Lifeline Risk Assessment. Earthq. Eng. Struct. Dyn. 2010, 39, 1109–1131. [Google Scholar] [CrossRef] [Scilit]
- Pagani, M.; Monelli, D.; Weatherill, G.; Danciu, L.; Crowley, H.; Silva, V.; Henshaw, P.; Butler, L.; Nastasi, M.; Panzeri, L.; et al. OpenQuake Engine: An Open Hazard (and Risk) Software for the Global Earthquake Model. Seismol. Res. Lett. 2014, 85, 692–702. [Google Scholar] [CrossRef] [Scilit]
- Silva, V.; Crowley, H.; Pagani, M.; Monelli, D.; Pinho, R. Development of the OpenQuake Engine, the Global Earthquake Model’s Open-Source Software for Seismic Risk Assessment. Nat. Hazards 2014, 72, 1409–1427. [Google Scholar] [CrossRef] [Scilit]
- Poudel, A.; Pitilakis, K.; Silva, V.; Rao, A. Infrastructure Seismic Risk Assessment: An Overview and Integration to Contemporary Open Tool towards Global Usage. Bull. Earthq. Eng. 2023, 21, 4237–4262, Correction in Bull. Earthq. Eng. 2023, 21, 4263. [Google Scholar] [CrossRef] [Scilit]
- Newman, M.E. The Structure and Function of Networks. Comput. Phys. Commun. 2002, 147, 40–45. [Google Scholar] [CrossRef] [Scilit]
- Jorge, C. Zonamento Do Potencial de Liquefação. Tentativa de Aplicação a Portugal. Master Thesis, Universidade Nova de Lisboa, Lisbon, Portugal, 1993. [Google Scholar]
- Ferreira, C.; Viana Da Fonseca, A.; Ramos, C.; Saldanha, A.S.; Amoroso, S.; Rodrigues, C. Comparative Analysis of Liquefaction Susceptibility Assessment Methods Based on the Investigation on a Pilot Site in the Greater Lisbon Area. Bull. Earthq. Eng. 2020, 18, 109–138. [Google Scholar] [CrossRef] [Scilit]
- Cordeiro, D.; da Fonseca, A.V.; Ferreira, C.; Molina-Gómez, F.; Rodrigues, C. Liquefaction Assessment Through SCPTu and DMT Tests: Aveiro Case Study; ISSMGE: Budapest, Hungary, 2021. [Google Scholar]
- Quintero, J.; Gomes, R.C.; Rios, S.; Ferreira, C.; Viana Da Fonseca, A. Liquefaction Assessment Based on Numerical Simulations and Simplified Methods: A Deep Soil Deposit Case Study in the Greater Lisbon. Soil Dyn. Earthq. Eng. 2023, 169, 107866. [Google Scholar] [CrossRef] [Scilit]
- Gordo, C.; Zêzere, J.L.; Marques, R. Landslide Susceptibility Assessment at the Basin Scale for Rainfall- and Earthquake-Triggered Shallow Slides. Geosciences 2019, 9, 268. [Google Scholar] [CrossRef] [Scilit]
- Azevedo, J.; Guerreiro, L.; Bento, R.; Lopes, M.; Proença, J. Seismic Vulnerability of Lifelines in the Greater Lisbon Area. Bull. Earthq. Eng. 2010, 8, 157–180. [Google Scholar] [CrossRef] [Scilit]
- Caiado, G.; Oliveira, C.; Ferreira, M.A.; Sá, F. Assessing Urban Road Network Seismic Vulnerability: An Integrated Approach. In Proceedings of the 15WCEE, Lisbon, Portugal, 24–28 September 2012; pp. 24–28. [Google Scholar]
- Costa, C.; Silva, V.; Bazzurro, P. Assessing the Impact of Earthquake Scenarios in Transportation Networks: The Portuguese Mining Factory Case Study. Bull. Earthq. Eng. 2018, 16, 1137–1163. [Google Scholar] [CrossRef] [Scilit]
- Duarte, J.C.; Riel, N.; Civiero, C.; Silva, S.; Rosas, F.M.; Schellart, W.P.; Almeida, J.; Terrinha, P.; Ribeiro, A. Seismic Evidence for Oceanic Plate Delamination Offshore Southwest Iberia. Nat. Geosci. 2025, 18, 1034–1040. [Google Scholar] [CrossRef] [Scilit]
- Stich, D.; Batlló, J.; Macià, R.; Teves-Costa, P.; Morales, J. Moment Tensor Inversion with Single-Component Historical Seismograms: The 1909 Benavente (Portugal) and Lambesc (France) Earthquakes. Geophys. J. Int. 2005, 162, 850–858. [Google Scholar] [CrossRef] [Scilit][Green Version]
- Matias, L.M.; Cunha, T.; Annunziato, A.; Baptista, M.A.; Carrilho, F. Tsunamigenic Earthquakes in the Gulf of Cadiz: Fault Model and Recurrence. Nat. Hazards Earth Syst. Sci. 2013, 13, 1–13. [Google Scholar] [CrossRef] [Scilit]
- Allstadt, K.E.; Thompson, E.M.; Jibson, R.W.; Wald, D.J.; Hearne, M.; Hunter, E.J.; Fee, J.; Schovanec, H.; Slosky, D.; Haynie, K.L. The US Geological Survey Ground Failure Product: Near-Real-Time Estimates of Earthquake-Triggered Landslides and Liquefaction. Earthq. Spectra 2022, 38, 5–36. [Google Scholar] [CrossRef] [Scilit]
- Tanyaş, H.; Van Westen, C.J.; Allstadt, K.E.; Anna Nowicki Jessee, M.; Görüm, T.; Jibson, R.W.; Godt, J.W.; Sato, H.P.; Schmitt, R.G.; Marc, O.; et al. Presentation and Analysis of a Worldwide Database of Earthquake-Induced Landslide Inventories. J. Geophys. Res. Earth Surf. 2017, 122, 1991–2015. [Google Scholar] [CrossRef] [Scilit]
- Kotha, S.R.; Weatherill, G.; Bindi, D.; Cotton, F. A Regionally-Adaptable Ground-Motion Model for Shallow Crustal Earthquakes in Europe. Bull. Earthq. Eng. 2020, 18, 4091–4125. [Google Scholar] [CrossRef] [Scilit]
- Weatherill, G. Exposure to Site Tool—User Manual and Technical Guide. GitLab. 2023. Available online: https://Gitlab.Seismo.Ethz.Ch/Efehr/Esrm20_sitemodel (accessed on 25 September 2025).
- Bradley, B.A. Empirical Correlations between Peak Ground Velocity and Spectrum-Based Intensity Measures. Earthq. Spectra 2012, 28, 17–35. [Google Scholar] [CrossRef] [Scilit]
- Rathje, E.M.; Saygili, G. Probabilistic Assessment of Earthquake-Induced Sliding Displacements of Natural Slopes. Bull. N. Z. Soc. Earthq. Eng. 2009, 42, 18–27. [Google Scholar] [CrossRef] [Scilit]
- Jibson, R.W. Regression Models for Estimating Coseismic Landslide Displacement. Eng. Geol. 2007, 91, 209–218. [Google Scholar] [CrossRef] [Scilit]
- Todorovic, L.; Silva, V. A Liquefaction Occurrence Model for Regional Analysis. Soil Dyn. Earthq. Eng. 2022, 161, 107430. [Google Scholar] [CrossRef] [Scilit]
- Fan, Y.; Li, H.; Miguez-Macho, G. Global Patterns of Groundwater Table Depth. Science 2013, 339, 940–943. [Google Scholar] [CrossRef] [Scilit] [PubMed]
- Fan, Y.; Miguez-Macho, G.; Jobbágy, E.G.; Jackson, R.B.; Otero-Casal, C. Hydrologic Regulation of Plant Rooting Depth. Proc. Natl. Acad. Sci. USA 2017, 114, 10572–10577. [Google Scholar] [CrossRef] [Scilit] [PubMed]
- Nievas, C.I.; Pilz, M.; Prehn, K.; Schorlemmer, D.; Weatherill, G.; Cotton, F. Calculating Earthquake Damage Building by Building: The Case of the City of Cologne, Germany. Bull. Earthq. Eng. 2022, 20, 1519–1565. [Google Scholar] [CrossRef] [Scilit] [PubMed]
- Barrington-Leigh, C.; Millard-Ball, A. The World’s User-Generated Road Map Is More than 80% Complete. PLoS ONE 2017, 12, e0180698, Correction in PLoS ONE 2019, 14, e0224742. [Google Scholar] [CrossRef] [Scilit] [PubMed]
- Koks, E.E.; Rozenberg, J.; Zorn, C.; Tariverdi, M.; Vousdoukas, M.; Fraser, S.A.; Hall, J.W.; Hallegatte, S. A Global Multi-Hazard Risk Analysis of Road and Railway Infrastructure Assets. Nat. Commun. 2019, 10, 2677. [Google Scholar] [CrossRef] [Scilit] [PubMed]
- Boeing, G. Modeling and Analyzing Urban Networks and Amenities with OSMnx. Geogr. Anal. 2025, 57, 567–577. [Google Scholar] [CrossRef] [Scilit]
- Liu, M.; Frangopol, D.M. Optimizing Bridge Network Maintenance Management under Uncertainty with Conflicting Criteria: Life-Cycle Maintenance, Failure, and User Costs. J. Struct. Eng. 2006, 132, 1835–1845. [Google Scholar] [CrossRef] [Scilit]
- Silva, V.; Crowley, H.; Bazzurro, P. Exploring Risk-Targeted Hazard Maps for Europe. Earthq. Spectra 2016, 32, 1165–1186. [Google Scholar] [CrossRef] [Scilit]

Disclaimer/Publisher’s Note: The statements, opinions and data contained in all publications are solely those of the individual author(s) and contributor(s) and not of MDPI and/or the editor(s). MDPI and/or the editor(s) disclaim responsibility for any injury to people or property resulting from any ideas, methods, instructions or products referred to in the content. |
© 2026 by the authors. Licensee MDPI, Basel, Switzerland. This article is an open access article distributed under the terms and conditions of the Creative Commons Attribution (CC BY) license.