


Abstract
Flutter constrains the design of modern high-aspect-ratio wings, yet the combined influence of planform geometry, aspect ratio (AR) and structural flexibility is rarely assessed within a single consistent framework. This work presents a unified, physics-based reduced-order comparison of rectangular, trapezoidal and elliptical planforms under both rigid and flexible representations, intended as a screening tool for preliminary design rather than as a quantitatively predictive methodology for specific aircraft. A two-degree-of-freedom plunge–pitch typical section with quasi-steady (Theodorsen-based) aerodynamics is cast in state-space form, and flutter is identified through eigenvalue continuation by combined frequency coalescence and damping sign change. For rectangular and trapezoidal wings, increasing AR or reducing stiffness consistently advances flutter onset: at a fixed AR of 7.1, stiffening alone raises the critical speed by approximately 43 m/s (from 105 to 148 m/s, ≈+41%). In contrast, within the reduced-order model the elliptical planform inverts this trend: with sufficient stiffness, frequency coalescence is suppressed, and from the stiffened baseline (AR ≈ 4.75) raising AR to 5.6 keeps the wing flutter-free across the investigated velocity range, whereas lowering AR to 3.9 reintroduces hard flutter at 155 m/s. These model-based comparative tendencies indicate that AR and structural flexibility are strongly coupled design drivers and that elliptical loading is comparatively flutter-resistant, providing an efficient basis for early-stage configuration screening.
1. Introduction
1.1. Aeroelastic Flutter in Aircraft Design
Aeroelasticity plays a central role in modern aircraft design, governing the interaction between aerodynamic loads, structural flexibility and inertial effects [1,2]. Among aeroelastic phenomena, flutter is one of the most critical and potentially catastrophic dynamic instabilities affecting flight structures: a self-excited oscillatory motion in which aerodynamic forces feed energy into the structural modes of the wing, leading to rapidly growing vibrations and structural failure if not adequately controlled [3,4].
Flutter has been recognised as a major design constraint since the early development of aircraft, with classical investigations tracing its origins to the coupling between bending and torsional modes in flexible lifting surfaces [3,4], and historical reviews linking numerous early accidents to an insufficient understanding of aeroelastic instabilities [4,5,6,7]. Despite major advances in materials, structural design and computational tools, flutter remains a binding constraint in both civil and military certification, particularly as designers pursue lighter, more flexible and higher-aspect-ratio wings to improve aerodynamic efficiency [1,7,8,9]. Modern flutter prediction spans a range of fidelities.
Figure 1 illustrates the fundamental distinction between static aeroelastic divergence and dynamic flutter phenomena on lifting surfaces. In the case of divergence, the steady aerodynamic–structural coupling leads to a rapid and monotonic increase in the static pitch response beyond a critical airspeed, indicating a loss of static stability.
Figure 1.
Elastic effects on lifting surfaces can encompass, but are not limited to, phenomena such as structural divergence and flutter. Adapted from: [10].
High-fidelity coupled computational fluid dynamics and structural mechanics (CFD/CSM) methods, based on Euler or Navier–Stokes formulations, capture unsteady aerodynamics and structural response in detail but at a significant computational cost, making them less suitable for early-stage exploration and large parametric studies [6,7].
Intermediate-fidelity methods such as the Doublet Lattice Method (DLM), typically coupled with finite element models, offer a favourable balance between cost and predictive capability for subsonic configurations and are widely used in industrial practice. In parallel, reduced-order and semi-analytical models, often formulated in the frequency domain through eigenvalue analysis, remain widely used for preliminary design, sensitivity analysis and physical interpretation of flutter mechanisms [1,8,9], providing valuable insight into the modal-coupling processes that govern flutter onset at low computational expense [10].
1.2. Role of Wing Geometry and Aspect Ratio
Wing geometry is a fundamental driver of both aerodynamic performance and aeroelastic behaviour. Among geometric parameters, the aspect ratio (AR), defined as the ratio of the square of the wingspan to the wing area (Equation (14)), plays a central role in determining lift distribution, induced drag, and structural load paths [10]. Variations in aspect ratio and planform shape (e.g., rectangular, trapezoidal, or elliptical) directly affect mass and stiffness distributions, aerodynamic centre locations, and modal characteristics, all of which influence the conditions under which flutter may occur.
Previous studies have demonstrated that high-aspect-ratio wings, while aerodynamically efficient, tend to be more flexible and therefore more susceptible to aeroelastic instabilities [11]. Classical and modern analyses have shown that changes in mass distribution, stiffness, and planform taper can significantly shift the flutter boundary and modify the nature of the instability [11,12]. For instance, articulated and highly flexible wings exhibit strong sensitivity of flutter speed to aspect ratio and structural properties, particularly in subsonic flow regimes [11]. Similarly, numerical investigations using coupled fluid–structure solvers have highlighted that geometric modifications such as wingtip devices or planform changes can either delay or precipitate flutter, depending on the specific configuration [6,13].
At the same time, the growing use of composite materials and tailored stiffness distributions has further complicated the relationship between geometry and aeroelastic stability, motivating a wide range of studies focused on stiffness tailoring, active control, and advanced numerical prediction techniques [5,7,9]. While these works have greatly improved predictive capabilities, they often focus on specific configurations or rely on high-fidelity models that obscure general design trends.
1.3. Gap in the Current Literature
Despite the extensive body of research on flutter prediction, a clear gap remains in the systematic, comparative understanding of how planform geometry and aspect ratio interact with structural flexibility to shape flutter boundaries within reduced-order aeroelastic models. While high-fidelity CFD/CSM approaches provide detailed predictions for specific configurations [6,7,13], and classical typical-section models offer physical insight [1,8], relatively few studies provide a unified parametric framework that contrasts different planform geometries (rectangular, trapezoidal, and elliptical) across a wide range of aspect ratios and stiffness regimes within a consistent modelling approach.
In particular, the distinction between rigid and flexible structural representations and their respective influence on flutter onset is often treated implicitly or for isolated cases, rather than explored systematically. This limits the ability to extract design-oriented trends that can guide early-stage configuration selection and preliminary sizing decisions, where fast and physically transparent models are especially valuable.
1.4. Contributions of This Paper and Scope of the Study
The present work develops and applies a reduced-order mathematical model and numerical framework for flutter analysis in aircraft wings, with particular emphasis on the effects of planform geometry and aspect ratio. The study focuses exclusively on the subsonic regime, where a quasi-steady reduction of Theodorsen’s aerodynamic theory provides an appropriate representation of the aerodynamic loads [14].
The novelty lies not in the aeroelastic model itself, which employs well-established typical-section theory, but in the unified and systematic comparison it enables: rectangular, trapezoidal and elliptical planforms are evaluated under identical assumptions across a common aspect-ratio and stiffness envelope, allowing their relative aeroelastic tendencies to be contrasted on a consistent basis—a comparison rarely available in a single, self-consistent study [15]. The framework is deliberately positioned as a physics-based, comparative screening tool for the preliminary-design stage: its purpose is to reveal the relative aeroelastic tendencies of competing planform and stiffness choices at negligible computational cost, not to provide quantitatively predictive flutter speeds for any specific aircraft. Absolute values are therefore reported only to support like-for-like comparison within the reduced-order model [16,17].
Predicting flutter reliably remains challenging, as it involves a complex energy-exchange mechanism in which the structure extracts energy from the surrounding airflow [6,7,8]; among the available techniques, Linear Parameter-Varying (LPV) approaches have been proposed for flutter prediction through interpolation-based parameterisation of aeroelastic models [5,18,19]. The influence of geometry on flutter has been highlighted in several previous investigations; for instance, Banerjee demonstrated, using a rigid-wing assumption and a numerical algorithm, that the aspect ratio plays a crucial role in determining flutter onset, with significant sensitivity of the stability boundary to changes in wing proportions [9]. Building on these observations, the present study assesses systematically whether such reduced-order approximations are sufficiently reliable to identify the critical conditions under which oscillatory responses evolve into unstable flutter, with particular attention to the role of planform shape and the spanwise distribution of aerodynamic and structural properties.
2. Aeroelastic Modelling Framework
This section develops a reduced-order aeroelastic model for the plunge–pitch dynamics of wing sections, suitable for systematic flutter analysis. Using Lagrange’s method and unsteady aerodynamic theory, the equations of motion are derived and cast into a state-space form for eigenvalue-based stability assessment. Both rigid and flexible structural representations are treated within the same mathematical framework [20].
2.1. Kinematic Assumptions and Degrees of Freedom
The wing section is idealized as a two-dimensional typical section undergoing coupled vertical translation (plunge) and rotation (pitch). Typical section models are widely adopted in aeroelastic analysis to capture the essential mechanisms of bending–torsion flutter with reduced complexity [18]. The two generalized coordinates are defined as [21,22]:
- : plunge displacement (positive downward);
- : pitch rotation (positive nose-up).
The reference coordinate system has the origin at the elastic axis, with the mass centre and aerodynamic centre located relative to it through offset distances. These offsets introduce inertial coupling and aerodynamic moment terms in the equations of motion.
In the present work, the term rigid-wing representation does not imply a perfectly rigid structure. Instead, it refers to a lumped typical-section model in which the wing deformation is represented by equivalent plunge and pitch degrees of freedom with constant structural stiffness parameters. In contrast, the flexible-wing representation incorporates explicit structural parameters derived from distributed bending stiffness (EI) and torsional stiffness (GJ). Both formulations therefore retain the same two generalized coordinates but differ in how structural elasticity is represented. To avoid ambiguity, the two structural representations employed throughout this study are summarised and contrasted in Table 1. Both share the same two-degree-of-freedom plunge–pitch kinematics and differ solely in the way the structural stiffness is parameterised, as detailed below.
Table 1.
Comparison of the two structural representations used in this study. Both share the same two-degree-of-freedom kinematics and differ only in how the structural stiffness is parameterised.
It should be emphasised that both cases are parameterisations of the same reduced-order, two-degree-of-freedom system: the study does not compare a truly rigid wing with a fully distributed flexible wing, but rather two stiffness representations within an identical kinematic framework. The “rigid” label therefore denotes the use of fixed equivalent stiffness coefficients, whereas the “flexible” label denotes stiffness derived from distributed structural properties (EI, GJ). This terminology is used consistently throughout the manuscript.
The kinematic basis of the model is summarised in Figure 2. The wing is represented by a rigid two-dimensional section that undergoes two coupled motions about the elastic axis: a vertical translation, or plunge h(t), taken positive downward, and a rotation, or pitch α(t), taken positive nose-up. The restoring action of the surrounding structure is modelled by an equivalent bending spring (kh) in plunge and an equivalent torsional spring (kα) in pitch. The relative chordwise positions of the aerodynamic centre (AC), the elastic axis (EA) and the centre of gravity (CG), defined by the offsets xac and xcg, govern the inertial and aerodynamic coupling between the two degrees of freedom: the static unbalance between the EA and CG couples plunge and pitch inertially, while the offset between the EA and AC determines the aerodynamic pitching moment that drives the bending–torsion flutter mechanism. The unsteady lift L acts at the aerodynamic centre, and U denotes the freestream velocity. This schematic provides the physical basis for the Lagrangian formulation and the coupled equations of motion derived in the following section.
Figure 2.
Two-degree-of-freedom typical-section aeroelastic model. The airfoil undergoes coupled plunge (h, positive down) and pitch (α, positive nose-up) about the elastic axis (EA), restrained by equivalent bending (kh) and torsional (kα) springs. The offsets xac and xcg locate the aerodynamic centre (AC) and centre of gravity (CG) relative to the EA; L is the unsteady lift and U the freestream velocity.
2.2. Energetic Formulation and Lagrange Equations
An energetic approach based on Lagrange’s equations is used to derive the governing equations of motion. The total kinetic energy T of the typical section includes both translational and rotational components [1,22]:
where is the mass per unit span, is the mass moment of inertia about the elastic axis, and is the mass centre offset.
The potential energy U consists of structural restoring forces in plunge and pitch. For the rigid wing [1,22]:
where and are the equivalent bending and torsional stiffness coefficients (Figure 2). For the flexible wing, these stiffness terms are related to distributed bending stiffness and torsional stiffness , representing the underlying structural elasticity.
Lagrange’s equations take the form [1,22]:
where and are generalized nonconservative work terms due to aerodynamic loads. Applying this formalism yields the coupled second-order equations of motion in matrix form [1,22,23]:
where is the inertia matrix, is the structural stiffness matrix, and represents the aerodynamic generalized forces. Structural damping is neglected in the present formulation, allowing focus on dynamic instability mechanisms.
2.3. Quasi-Steady Aerodynamic Model
Flutter prediction depends critically on the aerodynamic loads acting on the section. In this work, the aerodynamic forces are represented by a quasi-steady reduction of classical Theodorsen theory, obtained in the limit of the circulation (Theodorsen) function C(k) → 1, which is appropriate for the low-reduced-frequency, subsonic conditions targeted here [19,20]. In this limit the aerodynamic loads become linear, memoryless functions of the instantaneous motion variables and their first derivatives, introducing additional terms in the equations of motion that act as effective aerodynamic stiffness and damping [24,25].
The generalised aerodynamic load vector is therefore expressed as [19,20]:
where A0 and A1 are constant aerodynamic influence matrices that depend on freestream velocity, air density, planform geometry and airfoil characteristics. The term A0 q represents the aerodynamic stiffness arising from the instantaneous incidence, while A1 represents the aerodynamic damping arising from the plunge and pitch rates. Because these matrices are constant and no aerodynamic lag (memory) states are retained, the wake history and the frequency-dependent phase lag embodied in the full unsteady Theodorsen function C(k) are not represented. This quasi-steady approximation is adopted deliberately to preserve physical transparency and computational efficiency for the parametric screening pursued in this study, whereas higher-fidelity CFD models would be required to capture nonlinear, three-dimensional and genuinely unsteady wake effects [6,7,15,26,27].
It should be emphasised that the aerodynamic model adopted here is based exclusively on the incompressible, subsonic framework of Theodorsen’s theory; the mention of piston theory in Section 1 refers only to previous studies addressing supersonic flutter. No supersonic aerodynamic model is employed, and therefore all comparisons presented in this work correspond to subsonic aeroelastic behaviour within the validity limits of the quasi-steady Theodorsen reduction [28,29].
2.4. State-Space Form and Eigenvalue Problem
To perform flutter analysis, the second-order equations of motion are transformed into a first-order state-space system. Defining the state vector [21]:
the system of equations becomes:
where the system matrix incorporates mass, aerodynamic, and stiffness effects. The flutter characteristics are determined by solving the eigenvalue problem [21]:
The complex eigenvalues have real and imaginary parts representing damping (stability) and oscillatory frequency, respectively. Flutter onset is identified when a complex conjugate pair of eigenvalues crosses the imaginary axis, i.e., when the real part reaches zero, indicating neutral stability. In classical bending–torsion flutter, this is often accompanied by coalescence of two modal frequencies as the freestream velocity increases [21]. Numerical continuation and parameter tracking are used to identify the critical flutter speed, defined as the lowest velocity at which instability occurs.
To improve clarity in the mathematical development and numerical implementation, Figure 3 summarizes the overall aeroelastic modelling workflow adopted in this study. The process begins with the formulation of the governing equations of motion for the typical-section model, followed by their transformation into a state-space representation. The corresponding system matrices are then assembled, and an eigenvalue analysis is performed to extract modal frequencies and damping. By tracking the evolution of these quantities with increasing freestream velocity (V–g and V–f analysis), flutter onset is identified based on the combined criteria of damping sign change and modal coalescence. This schematic provides a structured link between the theoretical formulation and the numerical flutter prediction methodology.
Figure 3.
Aeroelastic flutter analysis workflow from governing equations to stability determination.
3. Wing Geometry and Parametric Definitions
This section defines the wing planform geometries, geometric parameters, and structural properties adopted in the present study. A consistent parametric framework is introduced to enable a systematic comparison of flutter behaviour across different planform shapes, aspect ratios, and stiffness regimes. In addition, a non-dimensional scaling is employed to ensure that the results can be interpreted in a general aeroelastic design context and transferred across aircraft of different sizes [12,21,22,23].
3.1. Planform Geometries Considered
Three representative wing planform geometries are considered: rectangular, trapezoidal, and elliptical, which are commonly used in both classical aeroelastic studies and preliminary aircraft design [12,22].
For the rectangular wing, the chord is constant and equal to along the span. Denoting the semi-span by , the wing planform area is [12,29]:
This configuration is used as a reference case due to its geometric simplicity and its widespread adoption in typical-section flutter models [22,23].
For the trapezoidal wing, the chord varies linearly from the root chord to the tip chord . The chord distribution can be written as [12,29]:
where is the spanwise coordinate measured from the wing root. The corresponding planform area is
This geometry introduces taper effects, which are known to influence both aerodynamic load distribution and aeroelastic stability characteristics [22,25].
For the elliptical wing, the chord follows an idealized elliptical law, given by [12,29]:
where is the root chord. The resulting planform area is
The elliptical planform is included because of its well-known aerodynamic efficiency and its distinct aeroelastic behaviour compared with rectangular and trapezoidal wings [23,26].
3.2. Aspect Ratio and Mean Aerodynamic Chord
The AR is a fundamental geometric parameter in wing design and is defined as [12,29]:
For the rectangular wing, using Equation (9), this reduces to
For the trapezoidal wing, using Equation (11), the aspect ratio becomes
For the elliptical wing, using Equation (13), the aspect ratio is
To define consistent aerodynamic and structural reference quantities across different planforms, the mean aerodynamic chord (MAC) is introduced, as commonly done in aeroelastic and aircraft design analyses [21,22,23]. For the trapezoidal wing, the MAC is given by [12,29]:
For the elliptical wing, the MAC can be expressed as
For the rectangular wing, the MAC trivially coincides with the constant chord, i.e., . The MAC is used as the characteristic chord length in the aeroelastic model to ensure consistent scaling of aerodynamic and inertial terms across different geometries [23,24]. The trapezoidal planform geometry is illustrated in Figure 4.
Figure 4.
Trapezoidal wing.
3.3. Structural and Mass Parameters
The structural and inertial properties of the wing section are defined in terms of equivalent spanwise quantities compatible with the typical-section model. The primary inertial parameter is the mass per unit span , together with the mass moment of inertia about the elastic axis . These quantities govern the translational and rotational inertia of the system and directly influence the natural frequencies and modal coupling behaviour [22,24].
Structural stiffness is characterized by the bending stiffness and the torsional stiffness , where is Young’s modulus, is the shear modulus, is the second moment of area, and is the torsional constant of the cross-section. As summarised in Table 1 (Section 2.1), the rigid formulation uses equivalent stiffness coefficients, whereas the flexible formulation introduces EI and GJ explicitly [23,25].
In practical applications, the bending stiffness and torsional stiffness are derived from the material properties and cross-sectional geometry of the wing structure. For simplified analytical models, these quantities can be obtained using classical beam theory, where and correspond to the elastic and shear moduli, while and are the second moment of area and torsional constant of the representative cross-section.
In more detailed configurations, these stiffness parameters may be evaluated using finite element models, where equivalent sectional properties are extracted from the distributed structural model. In the present work, and are treated as effective parameters representative of the global structural behaviour, allowing systematic parametric variation without reliance on a specific structural layout.
A reference configuration is defined for each planform geometry, and parametric variations are introduced by scaling the span, characteristic chord, and stiffness parameters. This strategy enables a controlled investigation of the influence of aspect ratio and structural rigidity on flutter onset while maintaining a consistent modelling framework.
3.4. Non-Dimensionalization and Scaling
To ensure generality of the results and facilitate comparison across different aircraft sizes, a non-dimensional formulation is adopted following standard aeroelastic practice [22,23,24]. A key parameter is the reduced velocity, defined as [12,22]:
where is the freestream velocity, is a reference natural frequency (typically the uncoupled torsional frequency), and is the mean aerodynamic chord.
Similarly, modal frequencies are normalized with respect to a reference structural frequency, and damping ratios are treated in non-dimensional form. This normalization allows the evolution of eigenvalues and flutter boundaries to be compared consistently across different geometries and structural scales. As a result, the trends identified in the present study can be interpreted in a general design context and transferred to a wide range of aircraft configurations [23,24].
4. Numerical Implementation
This section describes the numerical strategy adopted to solve the aeroelastic eigenvalue problem and to identify the onset of flutter. The procedure is based on systematic eigenvalue tracking as a function of freestream velocity, following the binary-flutter approach of Wright & Cooper [21], implemented in a reproducible MATLAB environment. In addition, the numerical results are validated against classical flutter trends reported in the literature to ensure the physical consistency of the predictions.
The overall numerical procedure follows a velocity-continuation scheme and is summarised in Figure 3. For a prescribed freestream-velocity sweep U ∈ [0, 250] m/s with increment ΔU = 0.1 m/s, the workflow comprises six steps. First, the inertia and stiffness matrices M and K are assembled from the geometric and structural parameters defined in Section 3 (Equation (4)). Second, the velocity-dependent aerodynamic damping and stiffness matrices Ca(U) and Ka(U) are constructed from the Theodorsen unsteady aerodynamic model (Equation (5)). Third, the resulting second-order system is recast into the first-order state-space matrix A(U) (Equations (6) and (7)). Fourth, at each velocity step the complex eigenvalues λ = σ ± iω are computed and the modal branches are sorted by frequency continuity in order to build the V–f (velocity–frequency) and V–g (velocity–damping) diagrams. Fifth, flutter onset is flagged when the real part of a complex-conjugate eigenvalue pair satisfies σ → 0+ while the two oscillatory frequencies coalesce; the simultaneous occurrence of both conditions identifies hard flutter, whereas a damping zero-crossing without frequency coalescence is classified as soft flutter. Sixth, the lowest velocity meeting the flutter criterion is reported as the critical flutter speed Uf, with the corresponding flutter frequency ff taken from the imaginary part of the critical eigenvalue. The procedure was implemented in MATLAB R2025, using the built-in QR eigensolver (eig); it is fully scripted and deterministic, so that all configurations are processed by an identical workflow, ensuring reproducibility.
4.1. Eigenvalue Tracking Strategy
Flutter onset is identified through an eigenvalue-based stability analysis of the state-space aeroelastic system. For a given freestream velocity , the linearized equations of motion are assembled into the system matrix, and the associated eigenvalue problem is solved to obtain a set of complex eigenvalues , where represents the modal damping (growth or decay rate) and the oscillation frequency.
The freestream velocity is treated as a continuation parameter and is increased incrementally over a prescribed range. At each velocity step, all eigenvalues of the system are computed and tracked. Flutter onset is detected when at least one complex-conjugate eigenvalue pair crosses the imaginary axis, i.e., when the real part changes sign and approaches zero from negative values. This condition corresponds to the transition from a stable, damped oscillation to a neutrally stable oscillation with sustained amplitude, which is the classical definition of linear flutter [23,24].
It should be noted that a reduction of modal frequency toward zero does not necessarily correspond to flutter instability. In classical aeroelastic theory, a frequency approaching zero is generally associated with static divergence, whereas flutter is characterized by the interaction and coalescence of two oscillatory modes accompanied by a zero-crossing of modal damping. Accordingly, flutter identification in the present study requires the simultaneous observation of (i) damping approaching zero and (ii) interaction between the plunge- and pitch-dominated modes. This criterion follows the classical aeroelastic interpretation implemented in MSC NASTRAN and documented by Rodden [23].
Two complementary indicators are monitored during the continuation process. The first is damping crossing, where the real part of an eigenvalue pair reaches zero. The second is mode coalescence, where two distinct modal frequencies approach each other and merge as the velocity increases, indicating strong modal coupling between bending- and torsion-dominated modes. In classical bending–torsion flutter, these two phenomena typically occur in close proximity, with frequency coalescence accompanying the loss of damping [23,27]. In the present work, both criteria are evaluated to distinguish between soft flutter (gradual loss of damping) and hard flutter (abrupt instability associated with strong mode coupling).
The critical flutter speed is defined as the lowest freestream velocity at which the real part of any eigenvalue becomes zero. The corresponding flutter frequency is taken as the imaginary part of that eigenvalue at the instability point.
4.2. MATLAB Implementation
The numerical procedure is implemented in MATLAB using standard linear algebra routines for eigenvalue computation. For each configuration (planform geometry, aspect ratio, and structural parameter set), the mass, stiffness, and aerodynamic matrices are assembled according to the formulations described in Section 2 and Section 3. These matrices are then combined into the state-space system matrix, and its eigenvalues are computed using MATLAB’s built-in eigensolver.
The velocity sweep is performed automatically using a scripted parameter loop, and the full eigenvalue spectrum is stored at each step. Post-processing routines are used to extract and track the evolution of modal frequencies and damping ratios as functions of freestream velocity. This allows the construction of the classical V–g (velocity–damping) and V–f (velocity–frequency) plots commonly used in aeroelastic stability analysis [23,27].
The implementation is fully deterministic and does not rely on interactive tuning or case-specific adjustments, ensuring reproducibility of the results. All simulations are driven by a consistent set of input parameters (geometry, mass properties, and stiffness values), and the same numerical workflow is applied to all configurations considered in the parametric study. This approach guarantees that observed differences in flutter behaviour arise from physical parameter variations rather than numerical artifacts.
4.3. Validation
The numerical implementation was validated both quantitatively, against a canonical published flutter case, and qualitatively, against established parametric trends.
For the quantitative benchmark, the Goland uniform cantilever wing, a widely used reference case in flutter analysis [30], was reduced to an equivalent two-degree-of-freedom typical section using its published sectional mass, inertia and stiffness properties. As seen in Figure 5, the present quasi-steady solver predicts flutter onset at 107 m/s, where the bending- and torsion-dominated frequencies converge while the damping of the critical mode changes sign—the classical signature of bending–torsion flutter.
Figure 5.
Validation benchmark for the Goland wing reduced to a two-degree-of-freedom typical section: evolution of modal frequency (top) and damping, i.e., the real part of the eigenvalues (bottom), with airspeed. The blue curve denotes the torsion-dominated mode and the orange the bending-dominated mode. Flutter onset is predicted at 107 m/s (vertical dashed line), where the two modal frequencies approach each other and the damping of the critical (torsion-dominated) mode changes sign, marking the classical bending–torsion coalescence mechanism.
This is of the same order as the value of ≈137 m/s reported for higher-fidelity three-dimensional unsteady analyses; the ~22% difference, together with the correspondingly higher flutter frequency, is consistent with the lumped two-degree-of-freedom reduction and the quasi-steady aerodynamic approximation adopted here. As summarised in Table 2, the present model recovers the correct flutter mechanism and a flutter speed of the same order as the reference, the residual discrepancy being attributable to the reduced dimensionality and the quasi-steady aerodynamic assumption.
Table 2.
Validation of the present quasi-steady typical-section solver against the Goland wing flutter benchmark.
Crucially, the reproduction of the correct flutter mechanism, frequency coalescence with simultaneous loss of damping, is the physical feature exploited in the comparative study of Section 5. Consistent with the screening purpose of the framework, absolute flutter speeds are therefore interpreted on a comparative rather than strictly predictive basis.
The implementation was further verified against well-established qualitative trends from the classical aeroelastic literature. The predicted behaviour of the two-degree-of-freedom typical section reproduces the canonical bending–torsion flutter characteristics described by Hodges & Pierce [1] and Bisplinghoff et al. [22], including the coalescence of modal frequencies and the simultaneous reduction of damping to zero at the flutter boundary. In addition, the evolution of the flutter speed with mass and stiffness was checked against established theoretical expectations [21,22]: increases in torsional stiffness raise the flutter speed, whereas increased structural flexibility lowers the stability margin. The present results reproduce these trends, confirming the qualitative consistency of the formulation.
Together, these checks establish both the quantitative credibility of the solver, through a same-class benchmark, and its qualitative fidelity to classical flutter physics. Such combined benchmark-and-trend validation is widely accepted for the reduced-order, preliminary-design context targeted here [21,23], and supports the use of the framework for the systematic investigation of planform geometry, aspect ratio and structural flexibility presented in the subsequent sections.
5. Parametric Flutter Analysis
This section presents a systematic parametric analysis of aeroelastic flutter for three representative wing planforms: rectangular, trapezoidal, and elliptical. For each geometry, both rigid and flexible structural representations are examined, and the influence of aspect ratio (AR) and stiffness parameters on flutter onset is assessed. The results are interpreted in terms of modal frequency coalescence and damping evolution, following the eigenvalue-based criteria described in Section 4.
5.1. Baseline Rectangular Wing
The analysis begins with a baseline rectangular wing of constant chord and semi-span , corresponding to a planform area and wing loading . In this initial configuration, the wing is modelled as a rigid system and the eigenvalue spectra are computed over the considered velocity range.
The corresponding frequency and damping evolution (Figure 6) indicate that, although the modal frequencies tend to approach each other as the freestream velocity increases, the damping remains negative and does not cross zero. This behaviour implies that the system remains dynamically stable and no flutter is detected within the investigated speed range. Physically, this can be interpreted as insufficient modal coupling strength between the bending- and torsion-dominated modes to trigger a dynamic instability.
Figure 6.
Frequency (top) and damping (bottom) evolution for the baseline rectangular wing (AR 5.7). Blue: torsion-dominated mode; orange: bending-dominated mode. The damping of both modes remains positive throughout, indicating no flutter within the investigated velocity range.
When the aspect ratio is increased by extending the span to while keeping the chord constant, the system indicates a different behaviour. In this case, the two modal frequencies come together at about , and the damping curves cross zero near , which indicates the onset of flutter. This behaviour is shown in Figure 7: the frequency curves merge around , while the damping curves split and change sign near , making the system unstable.
Figure 7.
Frequency (top) and damping (bottom) evolution for the rectangular wing at high aspect ratio (AR 8.8). Blue: torsion-dominated; red: bending-dominated. The modal frequencies approach each other near 60 m/s while the damping of the critical (torsion-dominated) mode crosses zero at 52.9 m/s (dashed line), marking flutter onset.
This result suggests that the rectangular wing is very sensitive to increases in aspect ratio. A higher aspect ratio reduces the effective structural stiffness compared to the aerodynamic loads, which strengthens bending–torsion coupling and causes flutter to appear at lower speeds.
To ensure full reproducibility of the parametric campaign, the complete set of baseline and varied parameters is reported in Table 3. The mass per unit span and the moment of inertia about the elastic axis are derived directly from the prescribed wing loading and planform geometry of each configuration. The bending and torsional stiffnesses (EI, GJ) are reported as effective sectional values representative of the global structural behaviour, consistent with the reduced-order modelling assumption of Section 2.1; the low- and high-stiffness cases discussed throughout Section 5 correspond to the explicit EI and GJ values listed below, replacing the qualitative “low modulus” and “high modulus” descriptors of the original presentation. All configurations share the same air density and velocity sweep, so that the observed differences in flutter behaviour arise solely from the documented geometric and structural parameter variations. The absolute flutter speeds are interpreted, consistently with the screening purpose of the framework (Section 1.4), on a comparative rather than strictly predictive basis.
Table 3.
Baseline and varied parameters used in the parametric campaign. Inertial properties are derived from the prescribed wing loading and planform geometry; bending and torsional stiffnesses are reported as effective sectional values, replacing the qualitative “low/high modulus” descriptors used in Section 5.
5.2. Trapezoidal Wing: Effect of Planform Taper and Aspect Ratio
The trapezoidal wing configuration is next examined, with geometric parameters , , , and , corresponding to a wing loading . In the rigid-wing assumption, the frequency and damping plots (Figure 8) show that a high aspect ratio trapezoidal wing exhibits flutter at approximately , with both frequency coalescence and loss of damping occurring in proximity. This confirms that planform taper does not eliminate flutter susceptibility when the wing is sufficiently slender and structurally stiffened only in a lumped sense.
Figure 8.
Frequency (top) and damping (bottom) evolution with airspeed for the rigid trapezoidal wing (Cr = 2.833 m, Ct = 0.895 m, b = 7.95 m, AR 7.1). The two modal-frequency branches (blue and red) converge towards a common value near 150 m/s, where the green reference line marks the coalescence; the damping crosses zero at Uf = 120 m/s (marker), indicating flutter onset, after which the critical branch grows rapidly.
When structural flexibility is introduced, the influence of material stiffness becomes evident. For the low-stiffness case (EI = 1.0 × 10⁶ N·m2, GJ = 0.8 × 10⁵ N·m2; Figure 9), flutter occurs earlier, at approximately 105 m/s, and the instability is more pronounced, as reflected by the sharper damping crossing and stronger modal interaction.
Figure 9.
Frequency (top) and damping (bottom) evolution with airspeed for the trapezoidal wing in the low-stiffness case (EI = 1.0 × 10⁶ N·m2, GJ = 0.8 × 10⁵ N·m2, AR 7.1). The blue and red curves denote the two tracked modal branches; the green line marks the frequency-coalescence reference; the damping of the critical mode crosses zero at Uf = 105 m/s (marker), indicating flutter onset, with the instability developing more sharply than in the stiffer configurations.
Conversely, for the high-stiffness case (EI = 8.0 × 10⁶ N·m2, GJ = 6.0 × 10⁵ N·m2; Figure 10), the flutter boundary is significantly shifted: damping-based instability appears near , while frequency coalescence is observed closer to . Despite the aspect ratio remaining constant at 7.1 in these cases, the large shift in flutter speed demonstrates the dominant role of structural stiffness in controlling aeroelastic stability.
Figure 10.
Frequency (top) and damping (bottom) evolution with airspeed for the trapezoidal wing in the high-stiffness case (EI = 8.0 × 10⁶ N·m2, GJ = 6.0 × 10⁵ N·m2, AR 7.1). The blue and red curves denote the two tracked modal branches; the green line marks the frequency-coalescence reference; the damping crosses zero at Uf = 148.4 m/s (marker), while frequency coalescence is approached only near 200 m/s. The marked shift in flutter speed relative to the low-stiffness case (Figure 9) demonstrates the dominant role of structural stiffness.
The effect of aspect ratio variation is further explored by modifying the taper ratio while keeping other parameters fixed. When is increased by 11% and is decreased by 36%, the resulting configuration exhibits a 29% reduction in aspect ratio, and flutter is observed at approximately in frequency and in damping (Figure 11). In this case, the instability is associated with both frequency convergence and vanishing damping, indicating a classical hard flutter mechanism.
Figure 11.
Frequency (top) and damping (bottom) evolution with airspeed for the trapezoidal wing with a modified taper ratio (Cr increased by 11%, Ct decreased by 36%, giving a 29% reduction in aspect ratio). The blue and red curves denote the two tracked modal branches; the red line marks the frequency-coalescence reference; the instability combines frequency convergence near 176.8 m/s with a damping zero-crossing at Uf = 154.4 m/s (markers), indicating a classical hard-flutter mechanism.
In contrast, when is decreased by approximately 12% and by 45%, leading to an increase in aspect ratio to about 9.2, the system exhibits a different behaviour (Figure 12). A soft flutter is detected in the damping curves near , while no clear frequency coalescence is observed. This suggests a weaker modal interaction, where instability is driven primarily by gradual loss of damping rather than strong mode coupling.
Figure 12.
Frequency (top) and damping (bottom) evolution with airspeed for the trapezoidal wing with increased aspect ratio (Cr decreased by ≈12%, Ct by ≈45%, giving AR ≈ 9.2). A soft-flutter behaviour is detected near 206 m/s (marker), driven by a gradual loss of damping rather than sharp frequency coalescence, indicating weaker modal interaction.
5.3. Elliptical Wing: Stability Advantages and Limits
The elliptical wing configuration is finally analysed, with baseline parameters , , and . In the rigid-wing case (Figure 13), flutter is observed at approximately , with both frequency coalescence and damping crossing indicating a hard flutter instability. Beyond this velocity, the system becomes dynamically unstable.
Figure 13.
Frequency (top) and damping (bottom) evolution with airspeed for the elliptical wing in the rigid configuration (b = 5.165 m, S = 22.5 m2, AR 4.75). The blue and red curves denote the two tracked modal branches; the green line marks the frequency-coalescence reference; the frequencies coalesce near 140 m/s while the damping crosses zero at Uf = 114.9 m/s (marker), indicating a hard-flutter instability beyond which the system becomes dynamically unstable.
However, when high torsional and flexural rigidities are introduced in the flexible-wing model (Figure 14), neither the frequency nor the damping curves indicate flutter within the analysed velocity range. The damping remains positive and diverges from zero, implying a stable system. This behaviour illustrates the comparatively favourable stability of the elliptical planform within the tested envelope when combined with sufficient structural stiffness, as the load distribution and stiffness distribution work together to suppress strong modal coupling.
Figure 14.
Frequency (top) and damping (bottom) evolution with airspeed for the elliptical wing in the high-stiffness flexible configuration (EI = 8.0 × 10⁶ N·m2, GJ = 6.0 × 10⁵ N·m2, AR 4.75). The blue and red curves denote the tracked modal branches. The damping of both modes remains positive and diverges from zero throughout the velocity range, so no flutter is detected within the investigated envelope, illustrating the comparatively favourable stability of the stiffened elliptical planform.
The sensitivity to aspect ratio is examined by modifying the wing surface while keeping the semi-span constant. Increasing the surface to reduces the aspect ratio by approximately 23% (from 4.75 to 3.9), and flutter reappears at about in both frequency and damping (Figure 15), indicating a hard flutter mechanism.
Figure 15.
Frequency (top) and damping (bottom) evolution with airspeed for the elliptical wing at reduced aspect ratio (wing surface increased to 27.4 m2, giving a ≈ 18% reduction in AR, from 4.75 to 3.9). The blue and red curves denote the tracked modal branches; flutter reappears at Uf = 155.2 m/s (markers) in both frequency and damping, indicating a hard-flutter mechanism.
Conversely, reducing the wing surface by 24% increases the aspect ratio by about 38% (from 4.75 to 5.6), and in this case no flutter is observed: both frequency and damping curves remain stable over the entire velocity range (Figure 16). This confirms that, for the elliptical planform, higher aspect ratio combined with adequate stiffness leads to enhanced aeroelastic stability.
Figure 16.
Frequency (top) and damping (bottom) evolution with airspeed for the elliptical wing at increased aspect ratio (wing surface reduced by ≈ 19.1 m2 giving a ≈18% increase in AR, from 4.74 to 5.6). The blue and red curves denote the tracked modal branches. The damping of both modes remains positive over the entire velocity range and no flutter is detected, confirming that for the elliptical planform a higher aspect ratio combined with adequate stiffness enhances aeroelastic stability.
The sensitivity to aspect ratio is examined by modifying the wing surface while keeping the semi-span constant. Increasing the surface to ≈27.4 m2 reduces the aspect ratio by approximately 18% (from 4.75 to 3.9), and flutter reappears at about 155 m/s in both frequency and damping (Figure 15), indicating a hard flutter mechanism. The comparatively favourable behaviour of the elliptical planform admits a physical interpretation rooted in its coupled load and stiffness distribution. The elliptical chord law c(y) = c0√(1 − (y/b)2) concentrates a larger fraction of the chord, and therefore of the local sectional torsional stiffness, which scales strongly with chord (GJ ∝ c4 for a geometrically similar section), towards the inboard region, while progressively reducing the chord, the local aerodynamic moment arm and the lift-curve contribution towards the tip. Because bending–torsion flutter is driven by the unsteady aerodynamic pitching moment feeding energy into the torsional mode, this inboard redistribution lowers the effective aerodynamic moment relative to the torsional restoring capacity. Conversely, reducing the wing surface to ≈19.1 m2 increases the aspect ratio by about 18% (from 4.75 to 5.6), and in this case no flutter is observed: both frequency and damping curves remain stable over the entire velocity range (Figure 16). This confirms that, for the elliptical planform, higher aspect ratio combined with adequate stiffness leads to enhanced aeroelastic stability.
In the reduced-order representation this is reflected in a larger initial separation between the bending- and torsion-dominated branches and a slower convergence of their frequencies with increasing airspeed, so that coalescence, and hence flutter, is delayed or, for sufficiently stiff configurations, pushed beyond the investigated velocity range. The same mechanism explains the observed aspect-ratio sensitivity: at low AR the chord is comparatively large and the destabilising aerodynamic moment dominates, reintroducing hard flutter, whereas at higher AR the slender elliptical loading reduces the local moment arm and restores the stabilising margin.
It should be emphasised that this interpretation describes a model-level tendency arising from the equivalent stiffness scaling and the strip-wise aerodynamic representation adopted here; it does not account for three-dimensional spanwise mode shapes or tip-vortex effects. A full three-dimensional analysis would be required to confirm the mechanism quantitatively, and the result is therefore presented as a comparative tendency within the reduced-order framework rather than as a general design rule.
5.4. Comparative Analysis Across Geometries
A comparative view of the three planform geometries reveals clear and consistent trends. For the rectangular and trapezoidal wings, increasing aspect ratio generally promotes earlier flutter onset due to increased flexibility and stronger bending–torsion coupling. In contrast, for the elliptical wing, higher aspect ratio tends to improve stability when sufficient structural stiffness is maintained, delaying or suppressing flutter within the investigated velocity range.
From a design perspective, these results suggest that the flutter boundary can be interpreted as a function of both aspect ratio and effective stiffness. Figure 17 plots the critical flutter speed against aspect ratio for the three planforms. For the rectangular and trapezoidal wings the trend is broadly decreasing—higher AR erodes the stability margin—whereas the elliptical wing displays the opposite behaviour: increasing AR, combined with adequate stiffness, raises the flutter speed and ultimately suppresses the instability within the tested envelope. Similarly, the results further indicate a strong positive correlation between structural rigidity and aeroelastic stability across all geometries.
Figure 17.
Critical flutter speed Uf versus aspect ratio for the three planforms (marker shape denotes the flutter mechanism). The elliptical planform exhibits the inverse trend to the rectangular and trapezoidal wings. Note: AR variations were obtained by altering chord and area, so absolute speeds are indicative within each geometry rather than strictly isolated AR effects.
The parametric study demonstrates that flutter is governed by a coupled interplay between planform shape, aspect ratio, and structural properties. While high aspect ratio is often desirable from an aerodynamic efficiency standpoint, its aeroelastic implications depend critically on the chosen planform and stiffness distribution. Among the configurations studied, the elliptical wing exhibits the most favourable flutter behaviour, particularly in flexible but sufficiently stiffened designs, suggesting it as a candidate for flutter-resistant preliminary configurations.
To enable a direct, like-for-like comparison across the configurations examined in Section 5.1, Section 5.2 and Section 5.3, the critical flutter speeds and corresponding instability mechanisms are consolidated in Table 4. The table summarises, for each planform, structural model and aspect ratio, the flutter speeds identified by frequency coalescence and by the damping zero-crossing, together with the resulting flutter classification (hard, soft, or no flutter within the investigated envelope). This consolidated view forms the quantitative basis for the trend analysis developed in the remainder of this section and in Section 6.
Table 4.
Consolidated flutter results across all configurations (extracted from Figure 6, Figure 7, Figure 8, Figure 9, Figure 10, Figure 11, Figure 12, Figure 13, Figure 14, Figure 15 and Figure 16). Uf denotes the critical flutter speed identified by frequency coalescence and by the damping zero-crossing.
6. Physical Interpretation and Design Implications
6.1. Mode Coupling Mechanisms
The present parametric results indicate that flutter onset is governed by a bending–torsion mode coupling mechanism, characterized by (i) the progressive convergence of two aeroelastic eigenfrequencies and (ii) the simultaneous loss of modal damping. In the rectangular and trapezoidal planforms, increasing the aspect ratio (AR) or reducing the effective stiffness leads to a monotonic reduction in the frequency separation between the two critical modes, until coalescence occurs within the investigated velocity range, accompanied by a change of sign in the real part of the eigenvalues (hard flutter regime). These qualitative and quantitative trends are summarized in Table 5, which contrasts the modelling assumptions and physical regimes of the present study with recent high-fidelity and nonlinear investigations.
Table 5.
Comparison of modelling approaches and physical regimes relevant to mode coupling in the present work and recent studies.
A direct comparison with the high-fidelity CFD/CSD study of Yang and Li [26] shows strong consistency in the underlying physics. Although their work focuses on a three-dimensional high-aspect-ratio wing with flexible skin, they report that aeroelastic deformation leads to significant modifications of the structural response relative to the rigid configuration, implying a reduction of effective stiffness and a corresponding strengthening of modal interaction. In the present reduced-order framework, an equivalent effect is observed: decreasing stiffness or increasing AR systematically accelerates the approach of the bending- and torsion-dominated branches and advances the onset of frequency coalescence. The correspondence between these trends, despite the large difference in model fidelity, is highlighted in Table 6, where the role of flexibility in promoting stronger coupling is explicitly compared between the studies.
Table 6.
Quantitative trends on flexibility, geometry, and their impact on flutter-related modal interaction.
A complementary perspective is provided by Farsadi et al. [27], who investigate high-aspect-ratio composite wings using a geometrically nonlinear aeroelastic framework combined with numerical optimization and experimental testing. They suggest that large static deformations in highly flexible wings can alter the linearized eigenstructure about the deformed equilibrium, leading to substantial shifts in flutter boundaries and, in some cases, changes in the dominant instability characteristics [31,32]. Quantitatively, they report that neglecting geometric nonlinearity can result in errors in predicted static deflection of up to approximately 50%, which in turn strongly affects natural frequencies and stability limits. This magnitude of sensitivity is consistent with the present parametric results, where relatively moderate variations in effective stiffness or geometry are sufficient to move the system from a stable regime to one exhibiting clear frequency coalescence. These cross-study quantitative sensitivities are also synthesized in Table 5.
The behaviour of the elliptical planform in the present study can be interpreted in light of these recent findings. When combined with sufficiently high stiffness, the elliptical wing does not exhibit frequency coalescence within the explored velocity envelope, and the damping remains negative, indicating a quantitative weakening of the bending–torsion coupling mechanism. This observation is fully consistent with the aeroelastic tailoring effects reported by Farsadi et al. [27], who show that stiffness redistribution and geometric nonlinearity can shift flutter boundaries and mitigate classical coupling-driven instabilities (see the comparison in Table 6). In contrast, the rectangular and trapezoidal planforms, which lack such favourable load and stiffness distributions, exhibit the classical coalescence-driven flutter scenario, in agreement with both the flexible-wing trends implied by Yang and Li [26] and the nonlinear composite-wing results of [27,32].
The present reduced-order model reproduces the same hierarchy of physical effects observed in recent high-fidelity and nonlinear studies: increased flexibility or slenderness promotes stronger modal interaction and earlier flutter, whereas favourable geometry and stiffness tailoring weaken the coupling and delay or suppress frequency coalescence. The consistency of these trends across fundamentally different modelling levels, as documented in Table 4 and Table 5, supports the use of the present approach for extracting robust, design-oriented physical insight while remaining fully aligned with state-of-the-art aeroelastic research [26,27].
6.2. Aspect Ratio vs. Structural Flexibility Interplay
The present results indicate, within the reduced-order framework, that AR and structural flexibility act as strongly coupled drivers of aeroelastic stability. Increasing AR improves aerodynamic efficiency but reduces effective bending and torsional stiffness, thereby promoting earlier modal interaction and lower flutter margins in compliant configurations. This trend is consistent with the DLR preliminary aeroelastic assessment of high-AR transport wings, where relatively modest structural changes (e.g., ≈17% variation in spar height) produce flutter speed shifts on the order of tens of meters per second due to changes in global stiffness [28,33]. A comparison of modelling assumptions and stability implications between the present work and recent studies is summarized in Table 7.
Table 7.
Interactions of Aspect Ratio and Structural Stiffness on Aeroelastic Stability.
A complementary perspective is provided by the geometrically nonlinear composite-wing study of Farsadi et al. [27], who report that neglecting geometric nonlinearity in highly flexible, high-AR wings can lead to static deflection errors of up to ~50%, with direct consequences for natural frequencies and flutter boundaries. This quantifies how flexibility does not merely shift flutter limits but can significantly reshape the stability landscape [34]. In the present study, this sensitivity is reflected by the strong dependence of modal coalescence on stiffness and AR in rectangular and trapezoidal planforms, while the stiffer elliptical configuration delays or suppresses classical coupling. The quantitative sensitivity trends across the three investigations are compared in Table 8.
Table 8.
Quantitative Effects of Aspect Ratio and Flexibility on Stability Metrics.
Overall, the combined evidence from this work, [27,28] indicates that AR and structural flexibility must be treated as a coupled design problem: higher AR systematically increases aeroelastic susceptibility unless compensated by stiffness distribution or aeroelastic tailoring. The consistency of these trends across reduced-order, preliminary FEM, and nonlinear composite-wing analyses (Table 6 and Table 7) supports the use of the present model for early, design-oriented exploration of stability trade-offs.
The consolidated results of Table 4 allow these trends to be quantified. For the rectangular wing, increasing the aspect ratio from 5.7 to 8.8 (+54%) converts a configuration that is stable throughout the tested range into one that flutters at 53 m/s, isolating AR as the destabilising driver. For the trapezoidal wing at a fixed aspect ratio of 7.1, increasing the bending and torsional rigidity raises the damping-based flutter speed from 105 m/s to 148 m/s—a shift of 43 m/s (≈+41%)—and pushes frequency coalescence beyond 200 m/s, confirming structural stiffness as a first-order control parameter. The elliptical planform reverses the geometric trend: in the rigid case flutter occurs at 115 m/s, but with high stiffness the instability is fully suppressed, and from the stiffened baseline (AR ≈ 4.75) raising the aspect ratio to 5.6 eliminates flutter within the envelope, whereas reducing AR to 3.9 reintroduces hard flutter at 155 m/s. These figures demonstrate quantitatively that aspect ratio and structural flexibility act as strongly coupled, and partly compensating, design drivers.
Comparing the two drivers directly, the present results indicate that aspect ratio and structural stiffness act on flutter in complementary ways and are of comparable first-order magnitude, but with distinct roles. At fixed geometry, stiffness is the dominant controller of the absolute flutter speed: for the trapezoidal wing at AR 7.1, increasing the bending and torsional rigidity alone shifted the critical speed by ≈43 m/s (≈+41%) with no change in planform. Aspect ratio, by contrast, is the dominant qualitative switch governing whether flutter occurs within the envelope at all: a ≈54% increase in AR converted the rectangular wing from a configuration that was flutter-free throughout the tested range into one that fluttered at 53 m/s, and an analogous AR reduction reintroduced hard flutter in the otherwise-stable stiffened elliptical wing. Because the AR variations simultaneously modify the planform area and the mean aerodynamic chord, the stiffness sensitivity—isolated at constant geometry—provides the cleanest single-parameter measure; on this basis structural stiffness (and torsional rigidity GJ in particular) emerges as the more reliable quantitative lever for a given planform, whereas aspect ratio exerts the stronger control over the existence and onset of the instability. In practice the two must therefore be treated jointly, with stiffness allocation used to recover the flutter margin lost to any aerodynamically motivated increase in AR.
It should be noted that the aspect-ratio variations were realised by modifying the root and tip chords (and hence the planform area and mean aerodynamic chord) rather than by scaling span alone; consequently, the reported speeds reflect combined geometric changes rather than a strictly isolated AR sweep, and absolute values are most meaningfully compared within a given planform. Expressing the results in terms of the reduced velocity U* (Equation (20)) provides a complementary, scale-independent basis for cross-geometry comparison and is recommended for future extensions of this work.
6.3. Implications for Preliminary Aircraft Design
The results of this study have direct implications for early-stage aircraft configuration and sizing, where decisions on planform geometry, aspect ratio, and structural layout are often made under limited information but have long-lasting aeroelastic consequences. The present parametric trends suggest that aspect ratio and structural flexibility cannot be treated independently: increasing AR systematically improves aerodynamic efficiency but, unless accompanied by appropriate stiffness distribution, also brings bending- and torsion-dominated modes closer in frequency, thereby reducing flutter margins.
From a design perspective, this implies that flutter should be considered as a first-order constraint already at the conceptual and preliminary design stages, rather than being deferred to detailed design. The DLR preliminary assessments of high-AR transport wings [28] indicates that relatively modest changes in primary structural dimensions (e.g., spar height) can shift flutter speed by tens of meters per second, which is fully consistent with the sensitivity observed in the present parametric study. Similarly, the geometrically nonlinear composite-wing investigations of Farsadi et al. [27] show that stiffness tailoring and load-path design can significantly reshape stability boundaries, reinforcing the idea that structural layout is an aeroelastic design variable, not merely a strength or weight driver.
In practical terms, the present results suggest a clear early-design workflow:
- (i)
- Use reduced-order or low-fidelity models to rapidly explore the combined effects of AR, planform, and stiffness distribution on modal separation and damping trends;
- (ii)
- Identify regions of the design space where classical bending–torsion coupling becomes critical;
- (iii)
- Guide subsequent high-fidelity analyses toward configurations that already exhibit favourable stability characteristics.
Within this framework, planform choices such as the elliptical distribution, when combined with sufficient stiffness, can be seen not only as aerodynamic optimizations but also as potentially stabilizing aeroelastic design features. Thus, the main design takeaway is that aerodynamic efficiency, structural efficiency, and aeroelastic stability must be co-optimized from the outset, rather than sequentially.
Translating these trends into operational guidance, the present results suggest the following recommendations for preliminary design:
(i) Aspect-ratio increases must be stiffness-compensated. For rectangular and trapezoidal planforms, any increase in aspect ratio beyond the baseline should be accompanied by a corresponding increase in torsional rigidity; within the present model, an AR increase of roughly 50% was sufficient to move a stable configuration into hard flutter, so AR gains pursued for aerodynamic efficiency cannot be assessed independently of their aeroelastic cost.
(ii) Prioritise torsional over bending stiffness. Because flutter onset is governed by bending–torsion coalescence, torsional rigidity (GJ) is the more effective stabiliser: at fixed AR, increasing stiffness shifted the critical speed by ≈40 m/s (≈+41%). Early stiffness allocation should therefore favour torsional load paths (e.g., closed-cell wing-box sizing) before bending material.
(iii) Exploit favourable load distributions where admissible. Where an elliptical or near-elliptical spanwise loading is compatible with other design constraints, it offers a comparatively larger flutter margin at a given aspect ratio and may remain flutter-free over the operating envelope when adequately stiffened; planform shaping is thus a usable aeroelastic design variable, not only an aerodynamic one.
(iv) Use the framework as a pre-screening filter. The negligible computational cost of the reduced-order model allows the AR–stiffness design space to be swept exhaustively at the conceptual stage, so that aeroelastically unfavourable regions can be excluded before committing higher-fidelity CFD/CSM or experimental resources to the surviving candidates.
6.4. Limitations of the Present Model and Connection to High-Fidelity Studies
The present study is based on a two-dimensional typical-section model with linear structural assumptions and reduced-order unsteady aerodynamics. As such, it necessarily neglects several effects that are known to influence real aircraft wings, including three-dimensional load redistribution, spanwise mode shapes, geometric nonlinearity, detailed mass and stiffness distributions, and viscous flow effects. Consequently, the absolute flutter speeds and stability boundaries reported here should not be interpreted as predictive for any specific aircraft configuration.
However, recent high-fidelity and nonlinear studies provide a clear context for interpreting these limitations. The DLR preliminary aeroelastic assessments [28] show that even within more realistic 3D FEM-based frameworks, flutter predictions remain highly sensitive to global stiffness distribution and structural layout, confirming that the trend-level sensitivities captured here are physically meaningful. Moreover, the work of Farsadi et al. [27] demonstrates that geometric nonlinearity and large static deformations can alter natural frequencies and stability boundaries substantially—by amounts that cannot be captured by linear reduced-order models—highlighting an important direction for future extensions of the present approach.
In particular, three-dimensional vortex-dominated flow effects in low-aspect-ratio wings are not captured by the present two-dimensional formulation.
Despite these limitations, the reduced-order framework used here remains highly valuable for early-stage analysis. It isolates the fundamental bending–torsion coupling mechanism, makes the role of aspect ratio and stiffness transparent, and enables systematic parametric exploration at negligible computational cost compared to CFD/CSM approaches. In this sense, the present model should be viewed as a physics-based screening and insight tool, whose role is to guide configuration choices and identify critical design trends before committing to expensive high-fidelity simulations.
Future work should therefore focus on extending the present framework toward three-dimensional, geometrically nonlinear, and fully coupled aeroelastic models, in line with the methodologies adopted in [27,28], while preserving the parametric clarity and design-oriented insight that motivate reduced-order approaches in the first place.
7. Conclusions
This work has presented a unified reduced-order aeroelastic framework to investigate the combined influence of planform geometry, aspect ratio (AR), and structural flexibility on flutter boundaries in aircraft wings. A two-degree-of-freedom plunge–pitch typical-section model was implemented and applied systematically to rectangular, trapezoidal, and elliptical planforms, considering both rigid and flexible structural representations. The numerical campaign covered wide parametric variations in AR and stiffness, enabling a quantitative, design-oriented assessment of flutter trends.
The present study should be understood as a reduced-order, comparative screening framework for preliminary design rather than as a predictive flutter methodology. Within this bounded scope, the following trends were identified:
Across all configurations, flutter onset was found to be governed by a bending–torsion mode coupling mechanism, identified by the coalescence of modal frequencies and the simultaneous loss of damping. For rectangular and trapezoidal wings, increasing AR consistently reduced the separation between the bending- and torsion-dominated modes and promoted earlier instability. Quantitatively, in the trapezoidal configurations, variations in stiffness alone were sufficient to shift the critical flutter speed by approximately ≈43 m/s (≈+41%), even at fixed AR, demonstrating that structural rigidity is a first-order driver of aeroelastic stability. Of the two drivers, structural stiffness provided the most directly controllable, cleanly isolated effect on the absolute flutter speed at fixed geometry (≈+41%), whereas aspect ratio governed primarily whether flutter occurred within the envelope; both are first-order and strongly coupled. Likewise, modifying the trapezoidal planform to achieve a ~29% reduction in AR led to the appearance of hard flutter at significantly lower velocities, while increasing AR to about 9.2 produced a soft-flutter scenario dominated by gradual damping loss rather than sharp frequency coalescence.
For the elliptical planform, a markedly different quantitative behaviour was observed. In the stiff flexible-wing configuration, no flutter was detected within the investigated velocity range, indicating suppression of frequency coalescence and a persistently negative damping margin within that range. When the wing surface was increased, producing a ~18% reduction in AR (from ≈4.75 to ≈3.9), hard flutter reappeared, whereas reducing the surface (an ~18% increase in AR, from ≈4.75 to ≈5.6) again eliminated flutter within the explored envelope. These results quantitatively indicate that, for the elliptical planform, higher AR combined with sufficient stiffness improves aeroelastic stability, in contrast to the trends observed for rectangular and trapezoidal wings.
Taken together, the parametric results indicate that aspect ratio and structural flexibility cannot be treated independently. Changes of only a few tens of percent in AR or moderate variations in bending and torsional stiffness are sufficient to move the system between stable operation, soft flutter, and hard flutter regimes. The magnitude of the predicted flutter-speed shifts (on the order of tens of meters per second) is consistent with recent preliminary and nonlinear aeroelastic studies of high-aspect-ratio wings, where structural modifications of comparable scale produce similarly large changes in stability margins and, in nonlinear regimes, static deflection differences approaching ~50% have been reported.
From a preliminary design perspective, these quantitative trends lead to a clear conclusion: flutter must be treated as a first-order constraint at the conceptual and early preliminary stages. High aspect ratio, while aerodynamically attractive, systematically reduces effective stiffness and promotes modal coupling unless compensated by structural tailoring. Conversely, favourable load distributions—such as those associated with elliptical planforms—combined with adequate stiffness can delay or even suppress classical bending–torsion flutter over substantial portions of the flight envelope.
Finally, although the present two-dimensional, linear reduced-order model cannot capture three-dimensional effects, geometric nonlinearity, or viscous flow phenomena, it successfully reproduces the correct order of magnitude and direction of sensitivity of flutter boundaries with respect to geometry and stiffness. In this sense, the framework provides a computationally efficient screening tool capable of identifying critical design trends and excluding unfavourable regions of the design space before committing to high-fidelity CFD/CSM analyses within the investigated envelope and within the limits of the reduced-order model.
Future work should extend this approach toward three-dimensional and geometrically nonlinear aeroelastic models in order to quantify how the absolute flutter speeds and stability margins change with large deformations and realistic structural layouts. Nevertheless, the present study already demonstrates—both qualitatively and quantitatively—that planform geometry, aspect ratio, and structural stiffness jointly control flutter boundaries, and that variations of practical design magnitude (≈20–40% in AR or moderate stiffness changes) can lead to shifts in flutter speed on the order of tens of m/s or even removal of the instability within the investigated envelope.
Author Contributions
Conceptualization, J.G. and S.V.; methodology, J.G., S.V. and I.R.; software, J.G. and S.V.; validation, J.G., S.V. and I.R.; formal analysis, J.G. and S.V.; investigation, J.G., S.V. and I.R.; resources, I.R., J.E.O. and P.M.; data curation, J.G. and S.V.; writing—original draft preparation, J.G. and S.V.; writing—review and editing, S.V., I.R., J.E.O. and P.M.; visualization, J.G. and S.V.; supervision, S.V. and I.R.; project administration, S.V.; funding acquisition, I.R., J.E.O. and P.M. All authors have read and agreed to the published version of the manuscript.
Funding
The authors gratefully acknowledge that the Fundación Universitaria Los Libertadores provided financial support by covering the article’s publication processing fee.
Data Availability Statement
No external datasets were used in this study. All data presented were generated through numerical simulation based on the mathematical models and equations described in the manuscript. The MATLAB/Simulink code used to produce the results is available from the corresponding author upon reasonable request.
Acknowledgments
During the preparation of this manuscript, the authors used Grammarly language refinement, and editorial assistance. The authors have reviewed, validated, and edited all generated content and take full responsibility for the final version of this publication.
Conflicts of Interest
The authors declare no conflicts of interest.
Abbreviations
The following abbreviations are used in this manuscript:
| AR | Aspect Ratio |
| FSI | Fluid–Structure Interaction |
| LPV | Linear Parameter-Varying |
| RANS | Reynolds-Averaged Navier–Stokes |
References
- Hodges, D.H.; Pierce, G.A. Introduction to Structural Dynamics and Aeroelasticity, 2nd ed.; Cambridge University Press: Cambridge, UK, 2011. [Google Scholar] [CrossRef] [Scilit]
- Waitman, S.; Marcos, A. Active flutter suppression: Non-structured and structured H∞ design. IFAC-PapersOnLine 2019, 52, 146–151. [Google Scholar] [CrossRef] [Scilit]
- Sharma, N.; Mohapatra, S.; Kalyan Kumar, E.; Panda, S.K. Numerical aeroelastic flutter prediction of variable stiffness laminated panels with curvilinear fiber in supersonic flow. Structures 2023, 57, 105198. [Google Scholar] [CrossRef] [Scilit]
- Wang, Z.; Chen, H.; Wang, G.; Zhang, Y.; Zheng, C. Prediction and active suppression of flutter in composite panel based on eigenvector orientation method. Compos. Struct. 2021, 262, 113422. [Google Scholar] [CrossRef] [Scilit]
- Visser, M.; Navalkar, S.; van Wingerden, J.W. LPV model identification for flutter prediction: A comparison of methods. IFAC-PapersOnLine 2015, 48, 121–126. [Google Scholar] [CrossRef] [Scilit]
- Luspay, T.; Takarics, B.; Vanek, B. Parameter-varying flutter suppression control for the BAH jet transport wing. IFAC-PapersOnLine 2017, 50, 8163–8168. [Google Scholar] [CrossRef] [Scilit]
- Wright, J.R. An Introduction to Aircraft Aeroelasticity and Loads; Wiley: Chichester, UK, 2007. [Google Scholar]
- Bueno, D.D.; Marqui, C.R.; Gonçalves, P.J.P. Aeroelastic stability analysis using linear matrix inequalities. J. Braz. Soc. Mech. Sci. Eng. 2012, 34, 545–551. [Google Scholar] [CrossRef] [Scilit]
- Banerjee, J.R.; Liu, X.; Kassem, H.I. Aeroelastic stability analysis of high aspect ratio aircraft wings. J. Appl. Nonlinear Dyn. 2014, 3, 413–422. [Google Scholar] [CrossRef] [Scilit]
- Leishman, J.G. Unsteady aerodynamics, aeroelasticity, & flutter. In Introduction to Aerospace Flight Vehicles; EaglePubs, Embry-Riddle Aeronautical University: Daytona Beach, FL, USA, 2023; Available online: https://eaglepubs.erau.edu/introductiontoaerospaceflightvehicles/chapter/unsteady-aerodynamics-flutter/ (accessed on 23 May 2026).
- Balakrishnan, A.V.; Tuffaha, A.M.; Patino, I.; Melnikov, O. Flutter analysis of an articulated high aspect ratio wing in subsonic airflow. J. Frankl. Inst. 2014, 351, 4230–4250. [Google Scholar] [CrossRef] [Scilit]
- Raymer, D.P. Aircraft Design: A Conceptual Approach; AIAA: Washington, DC, USA, 1992. [Google Scholar]
- Fung, Y.C. An Introduction to the Theory of Aeroelasticity; (Republication of the Original John Wiley & Sons, Edition, 1955); Dover Publications: Mineola, NY, USA, 1993; ISBN 978-0-486-49505-9. [Google Scholar]
- Peng, C.; Jinglong, H. Prediction of flutter characteristics for a transport wing with wingtip devices. Aerosp. Sci. Technol. 2012, 23, 461–468. [Google Scholar] [CrossRef] [Scilit]
- Liu, F.; Cai, J.; Zhu, Y.; Tsai, H.M.; Wong, A.S.F. Calculation of wing flutter by a coupled fluid–structure method. J. Aircr. 2001, 38, 334–342. [Google Scholar] [CrossRef] [Scilit]
- Simiriotis, N.; Palacios, R. A numerical investigation on direct and data-driven flutter prediction methods. J. Fluids Struct. 2023, 117, 103835. [Google Scholar] [CrossRef] [Scilit]
- Mukhopadhyay, V. A Conceptual Wing Flutter Analysis Tool for Systems Analysis and Parametric Design Study; NASA Technical Report: Washington, DC, USA, 2003. Available online: https://ntrs.nasa.gov/citations/20030064926 (accessed on 13 November 2023).
- Nieto Gómez, M.; Chimeno Manguán, M. On the Definition and Location of the Aeroelastic Typical Section in Swept Wings. Aerospace 2025, 12, 783. [Google Scholar] [CrossRef] [Scilit]
- Theodorsen, T. General Theory of Aerodynamic Instability and the Mechanism of Flutter; NACA Technical Report No. 496; National Advisory Committee for Aeronautics: Langley Field, VA, USA, 1935. [Google Scholar]
- Berci, M.; Cavallaro, R. A Hybrid Reduced-Order Model for the Aeroelastic Analysis of Flexible Subsonic Wings—A Parametric Assessment. Aerospace 2018, 5, 76. [Google Scholar] [CrossRef] [Scilit]
- Wright, J.R.; Cooper, J.E. Introduction to Aircraft Aeroelasticity and Loads, 2nd ed.; John Wiley & Sons, Ltd.: Chichester, UK, 2015; ISBN 978-1-118-48801-0. [Google Scholar]
- Bisplinghoff, R.L.; Ashley, H.; Halfman, R.L. Aeroelasticity; (Corrected Republication of the Original Addison-Wesley Edition, 1955); Dover Publications: Mineola, NY, USA, 1996; ISBN 0-486-69189-6. [Google Scholar]
- Cooper, J.E. Review of Theoretical and Computational Aeroelasticity, by W. P. Rodden. Aeronaut. J. 2012, 116, 980–981. [Google Scholar] [CrossRef] [Scilit]
- Dunning, P.D.; Stanford, B.K.; Kim, H.A.; Jutte, C.V. Aeroelastic Tailoring of a Plate Wing with Functionally Graded Materials. J. Fluids Struct. 2014, 51, 292–312. [Google Scholar] [CrossRef] [Scilit]
- Berci, M.; Gaskell, P.H.; Hewson, R.W.; Toropov, V.V. A Semi-Analytical Model for the Combined Aeroelastic Behaviour and Gust Response of a Flexible Aerofoil. J. Fluids Struct. 2013, 37, 3–21. [Google Scholar] [CrossRef] [Scilit]
- Yang, Z.; Li, J. Numerical Aeroelastic Analysis of a High-Aspect-Ratio Wing Considering Skin Flexibility. Aerospace 2022, 9, 515. [Google Scholar] [CrossRef] [Scilit]
- Farsadi, T.; Ahmadi, M.; Sahin, M.; Haddad Khodaparast, H.; Kayran, A.; Friswell, M.I. High Aspect Ratio Composite Wings: Geometrically Nonlinear Aeroelasticity, Multi-Disciplinary Design Optimization, Manufacturing, and Experimental Testing. Aerospace 2024, 11, 193. [Google Scholar] [CrossRef] [Scilit]
- Cumnuantip, S.; Schulze, M. Preliminary Aeroelastic Stability Assessment of High Aspect Ratio Wing Aircraft. DLR Technical Articles 17 January 2024. Available online: https://www.dlr.de/en/ae/latest/technical-articles/preliminary-aeroelastic-stability-assessment-of-high-aspect-ratio-wing-aircraft (accessed on 8 January 2026).
- Anderson, J.D. Fundamentals of Aerodynamics, 6th ed.; McGraw-Hill Education: New York, NY, USA, 2017; ISBN 978-1-259-121991-9. [Google Scholar]
- Goland, M. The Flutter of a Uniform Cantilever Wing. J. Appl. Mech. 1945, 12, A197–A208. [Google Scholar] [CrossRef] [Scilit]
- Bisplinghoff, R.L.; Ashley, H. Principles of Aeroelasticity; (orig. 1962); Dover: Mineola, NY, USA, 2002; ISBN 978-0-486-49500-4. [Google Scholar]
- Dowell, E.H. (Ed.) A Modern Course in Aeroelasticity, 5th ed.; Springer International Publishing: Cham, Switzerland, 2015; ISBN 978-3-319-09452-6. [Google Scholar]
- Afonso, F.; Vale, J.; Oliveira, É.; Lau, F.; Suleman, A. A review on non-linear aeroelasticity of high aspect-ratio wings. Prog. Aerosp. Sci. 2017, 89, 40–57. [Google Scholar] [CrossRef] [Scilit]
- Dimitriadis, G. Introduction to Nonlinear Aeroelasticity; John Wiley & Sons: Chichester, UK, 2017; ISBN 978-1-118-61346-7. [Google Scholar]
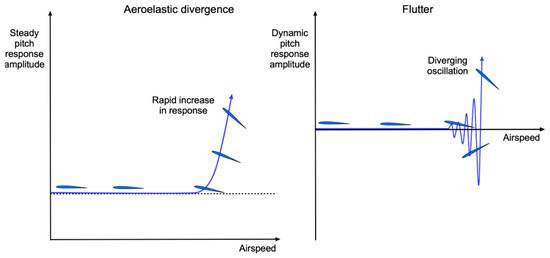
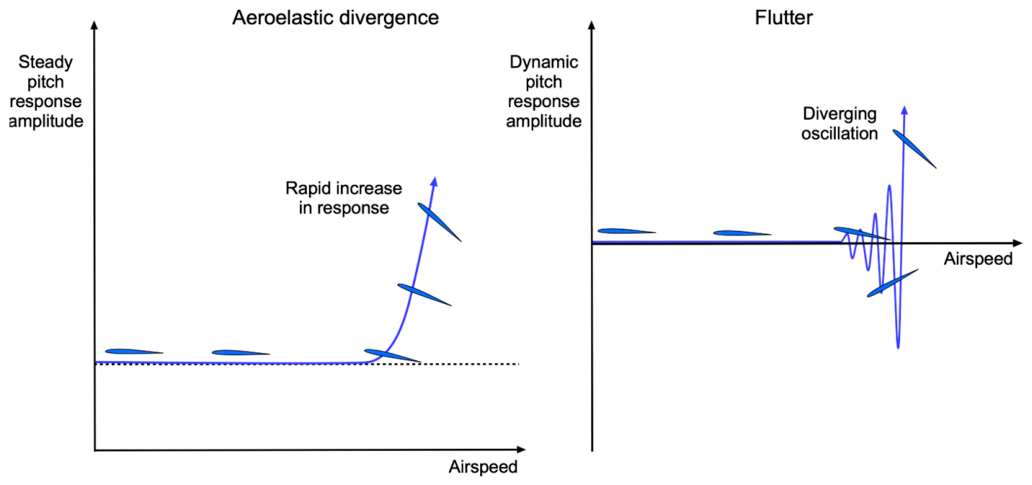
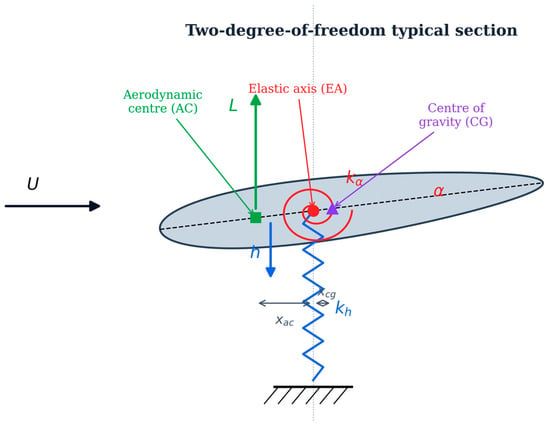
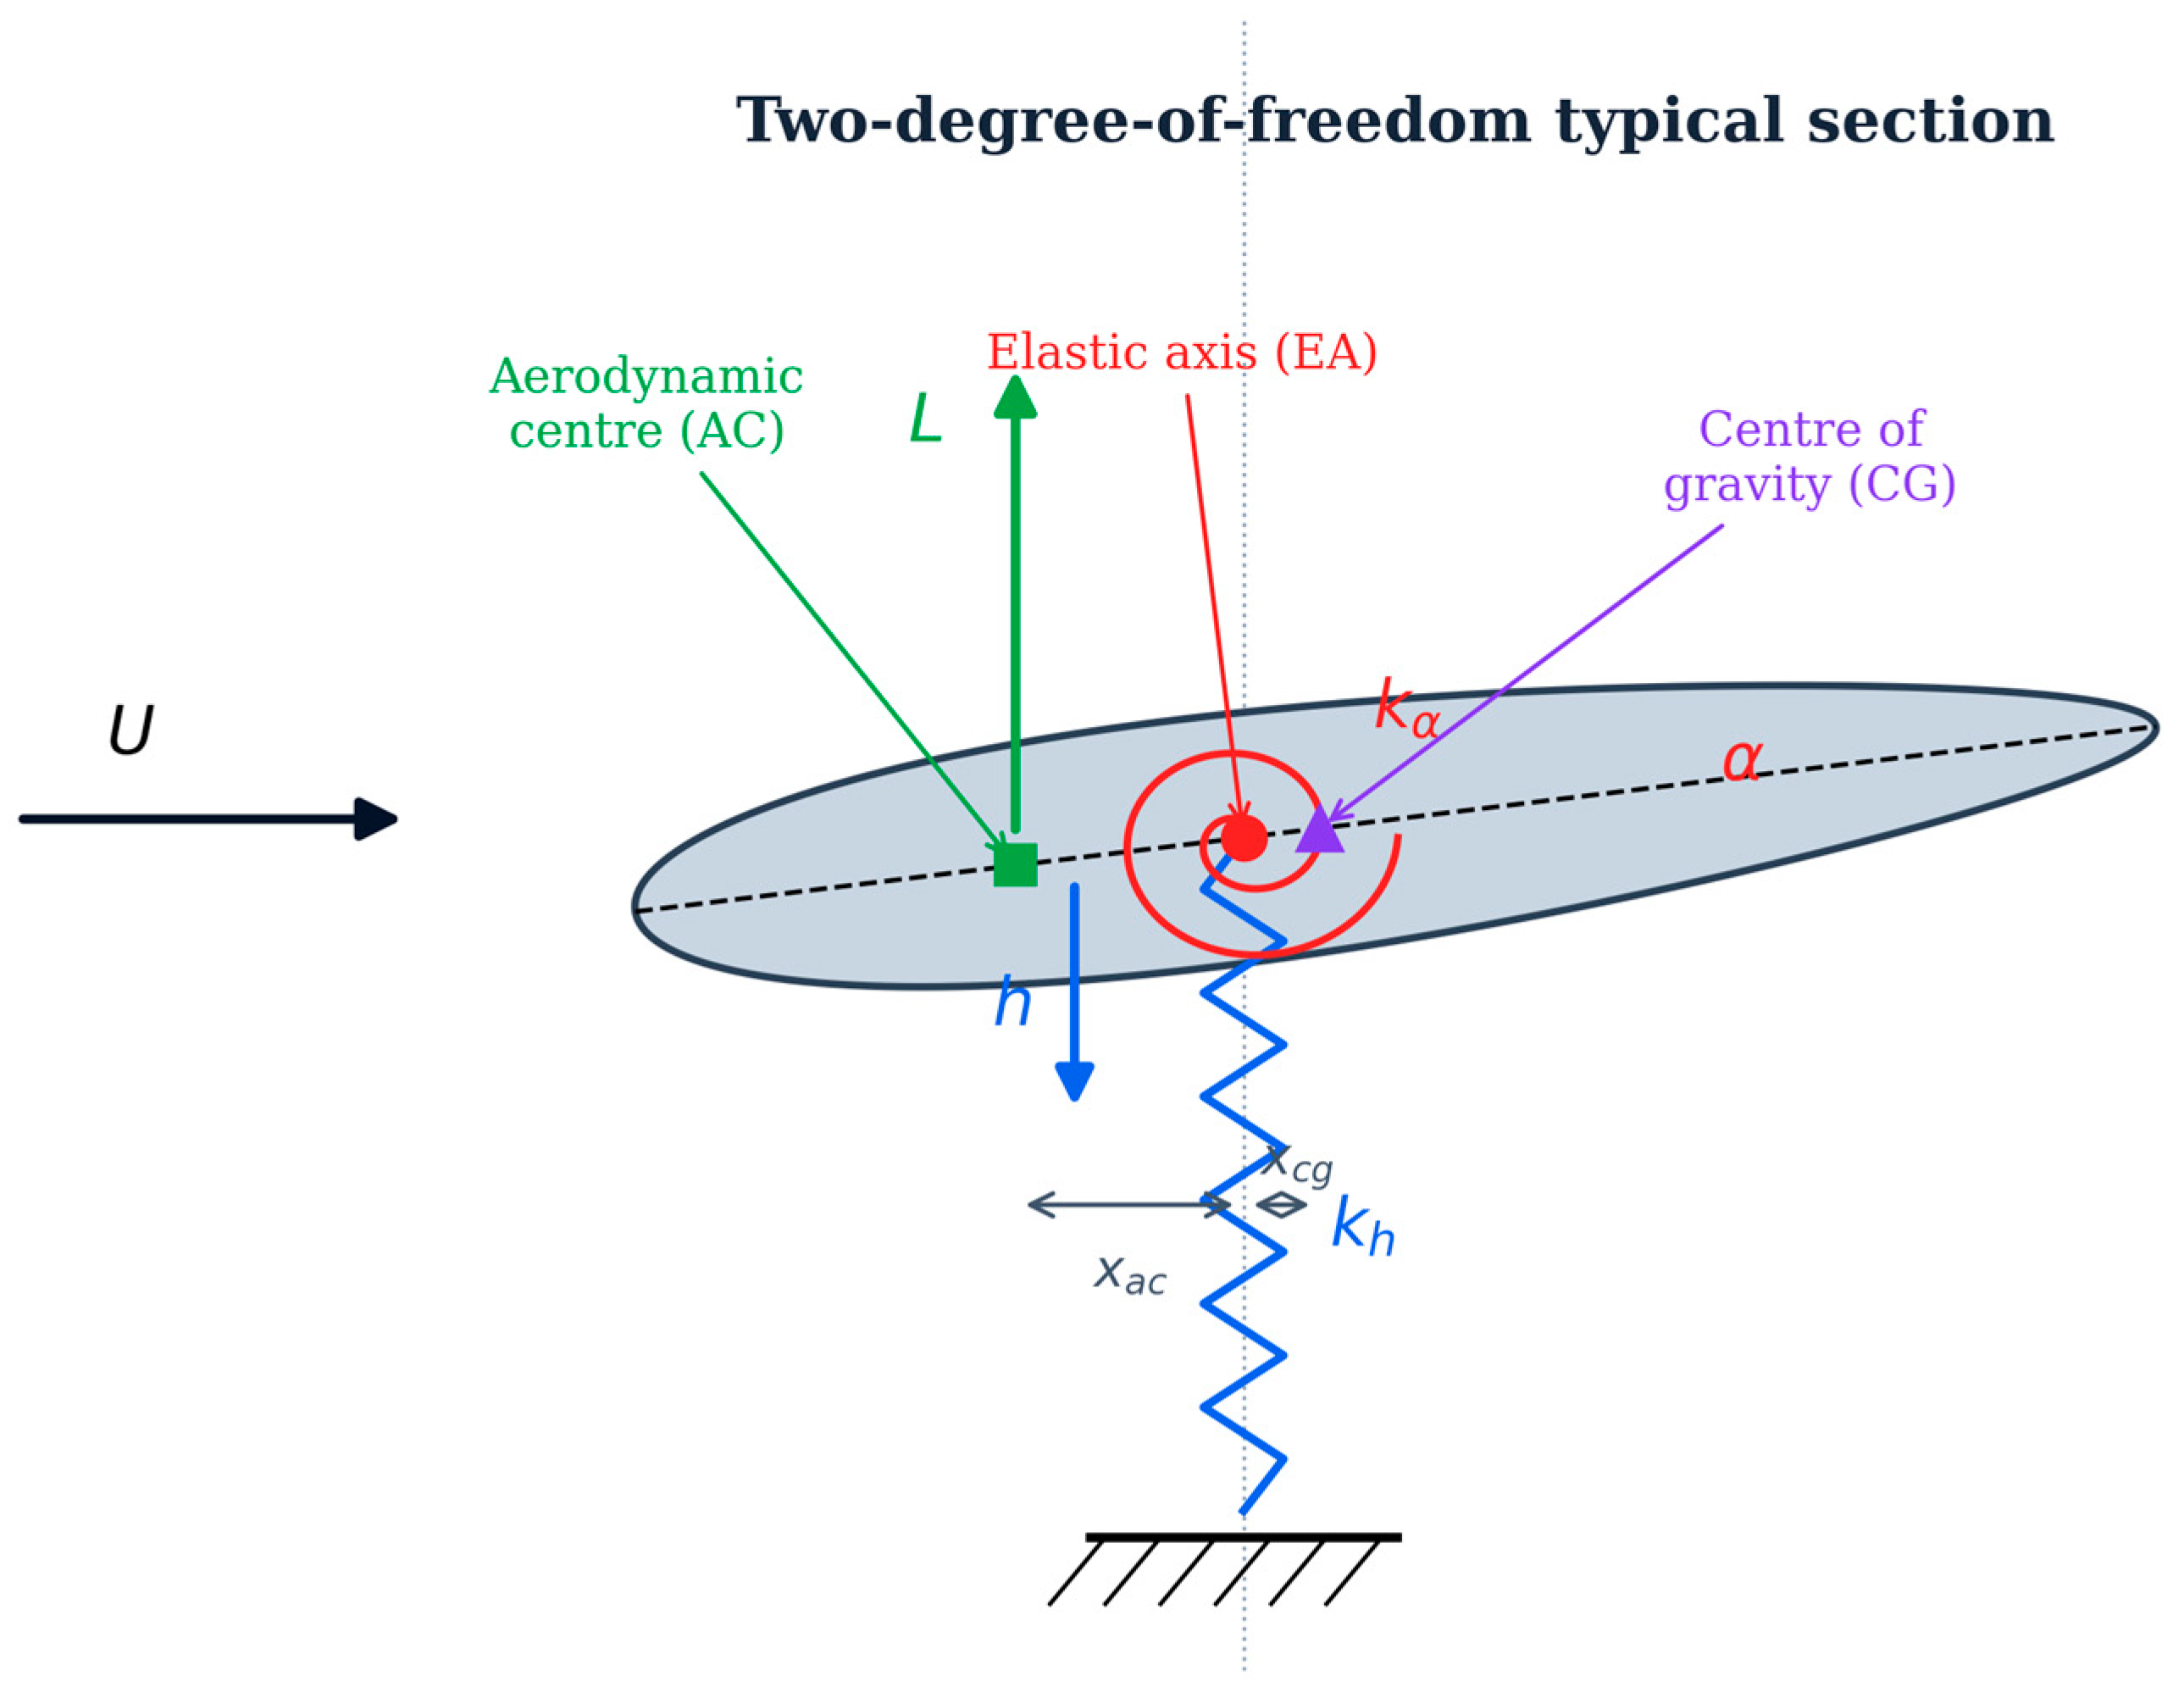
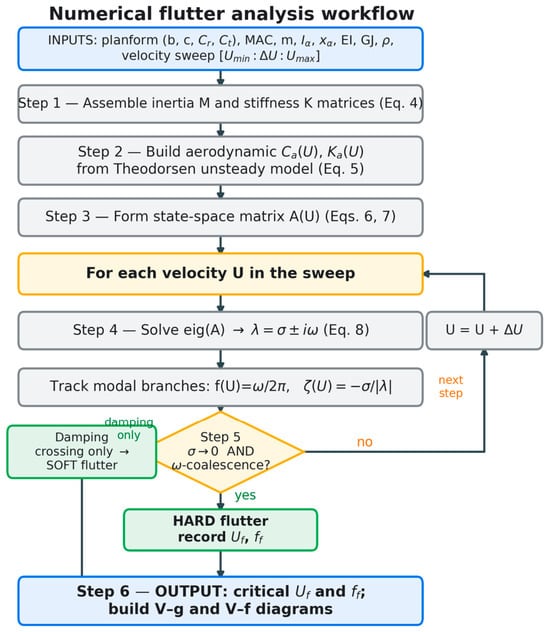
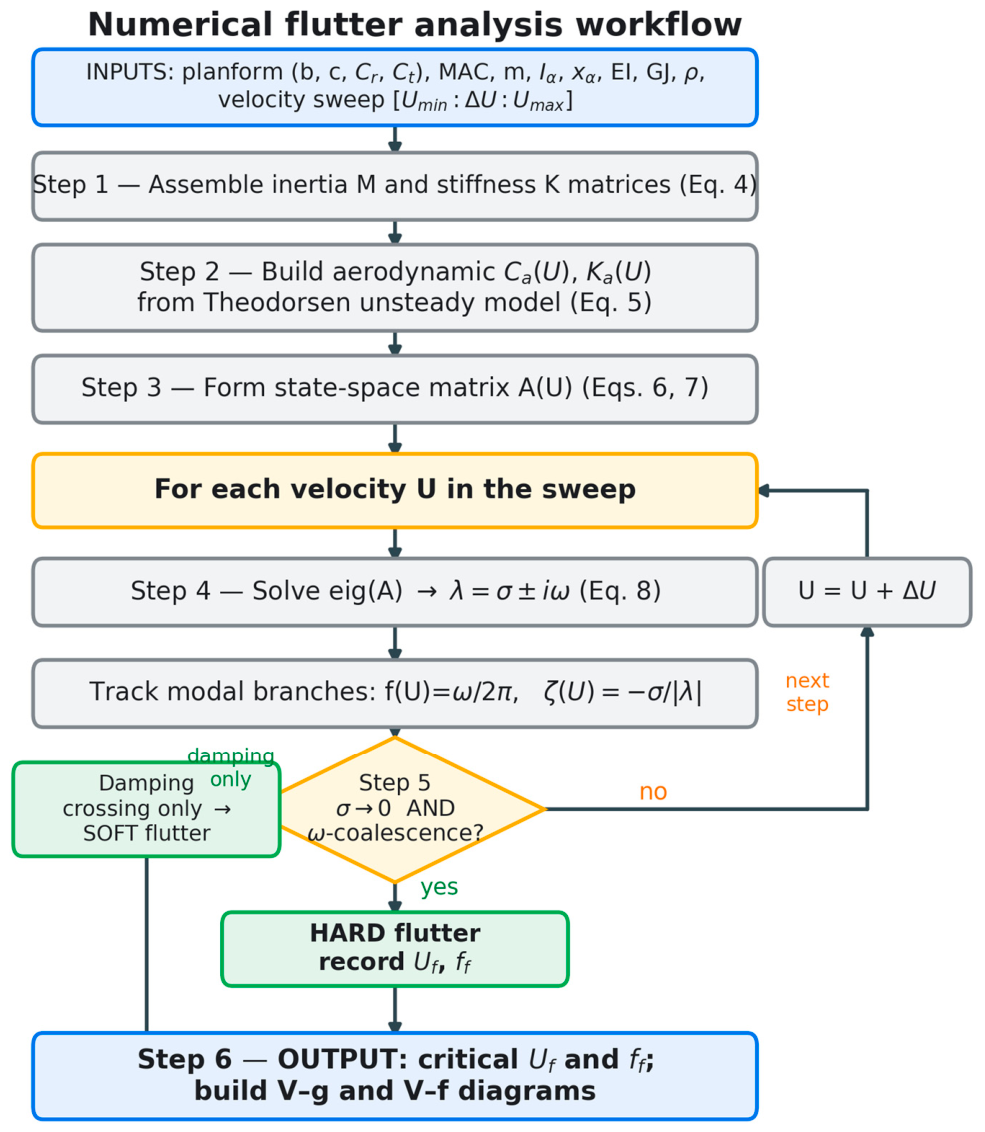
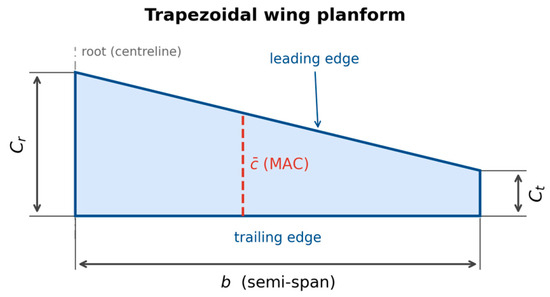
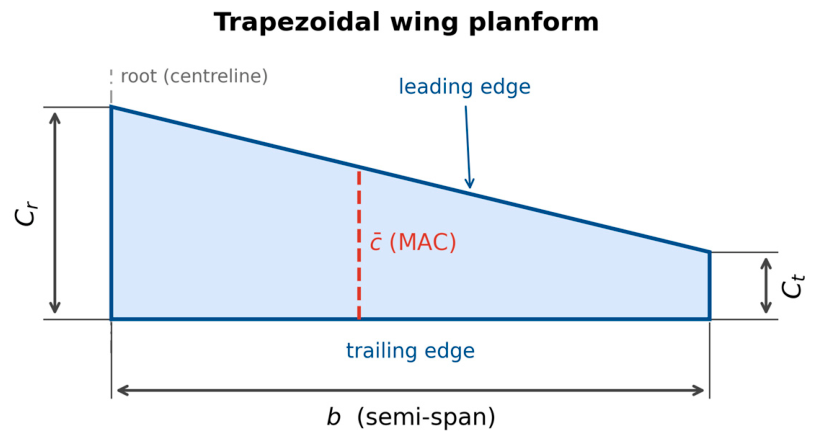
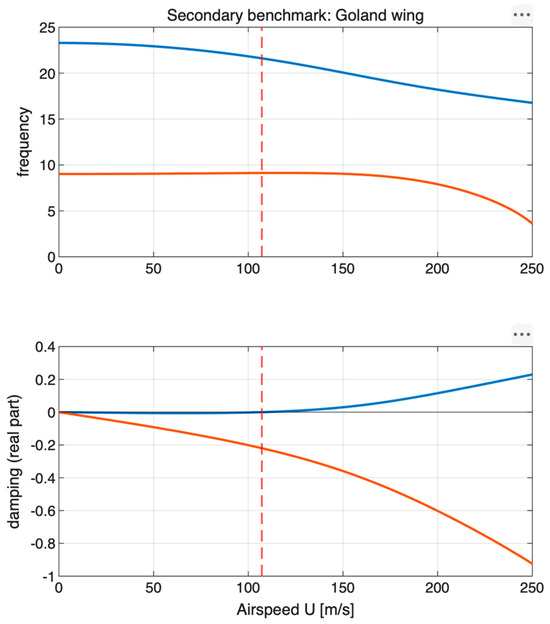
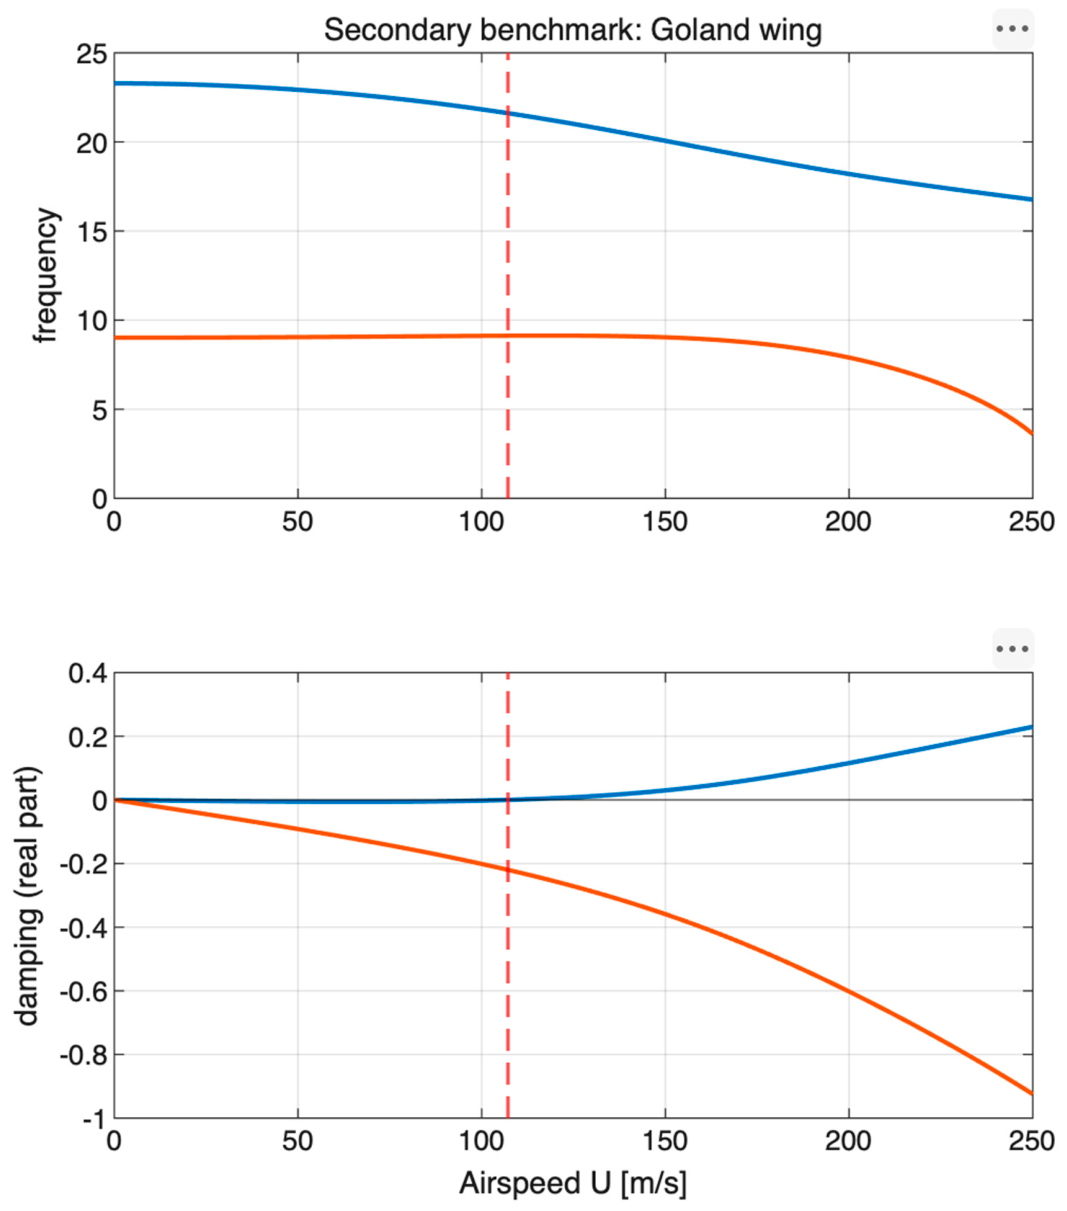
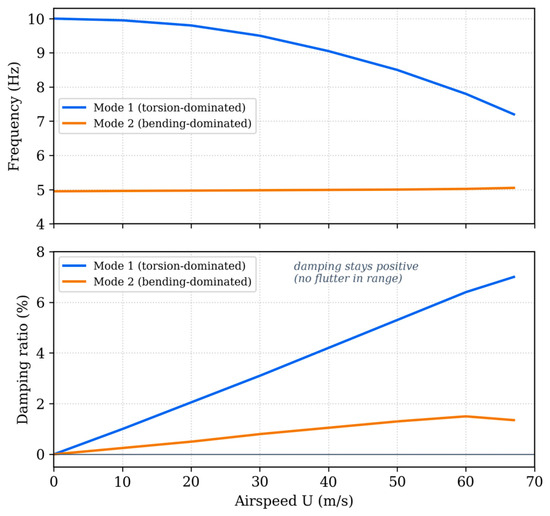
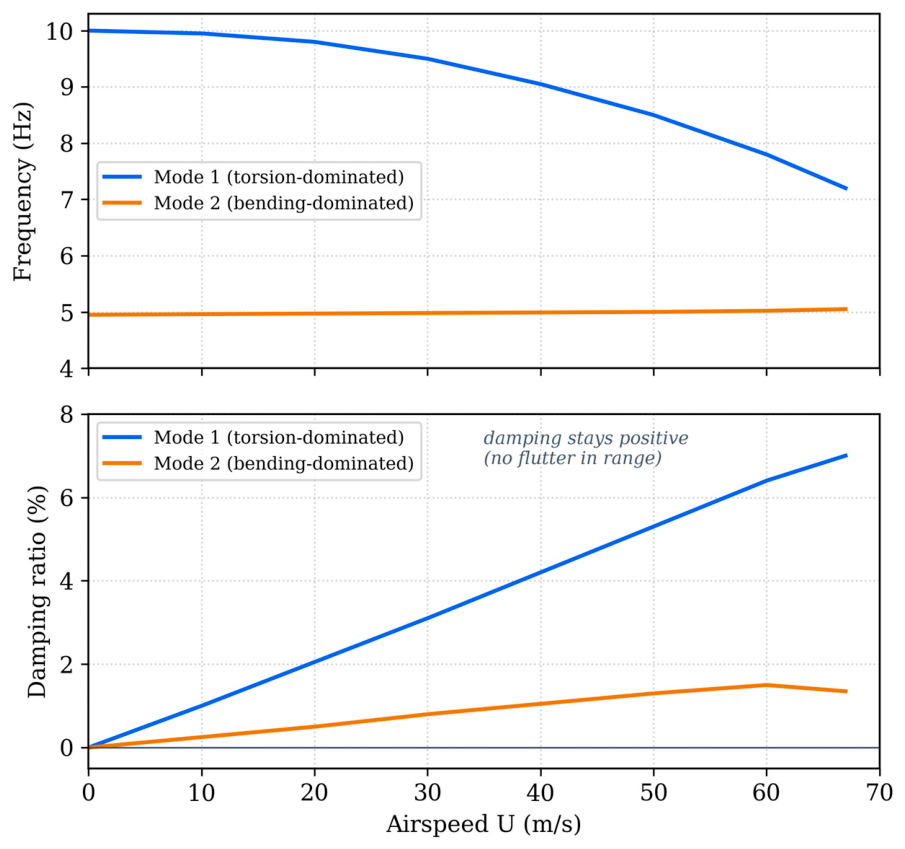
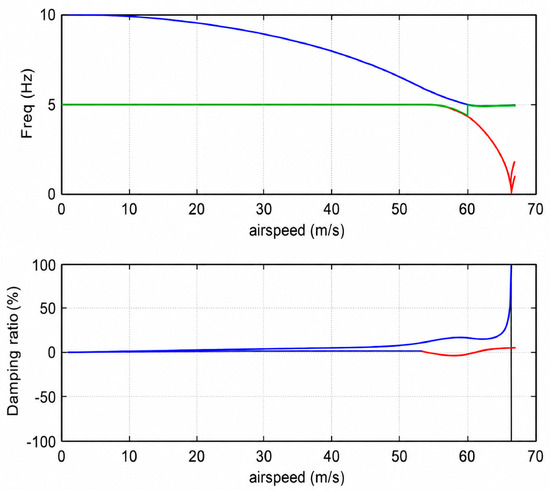
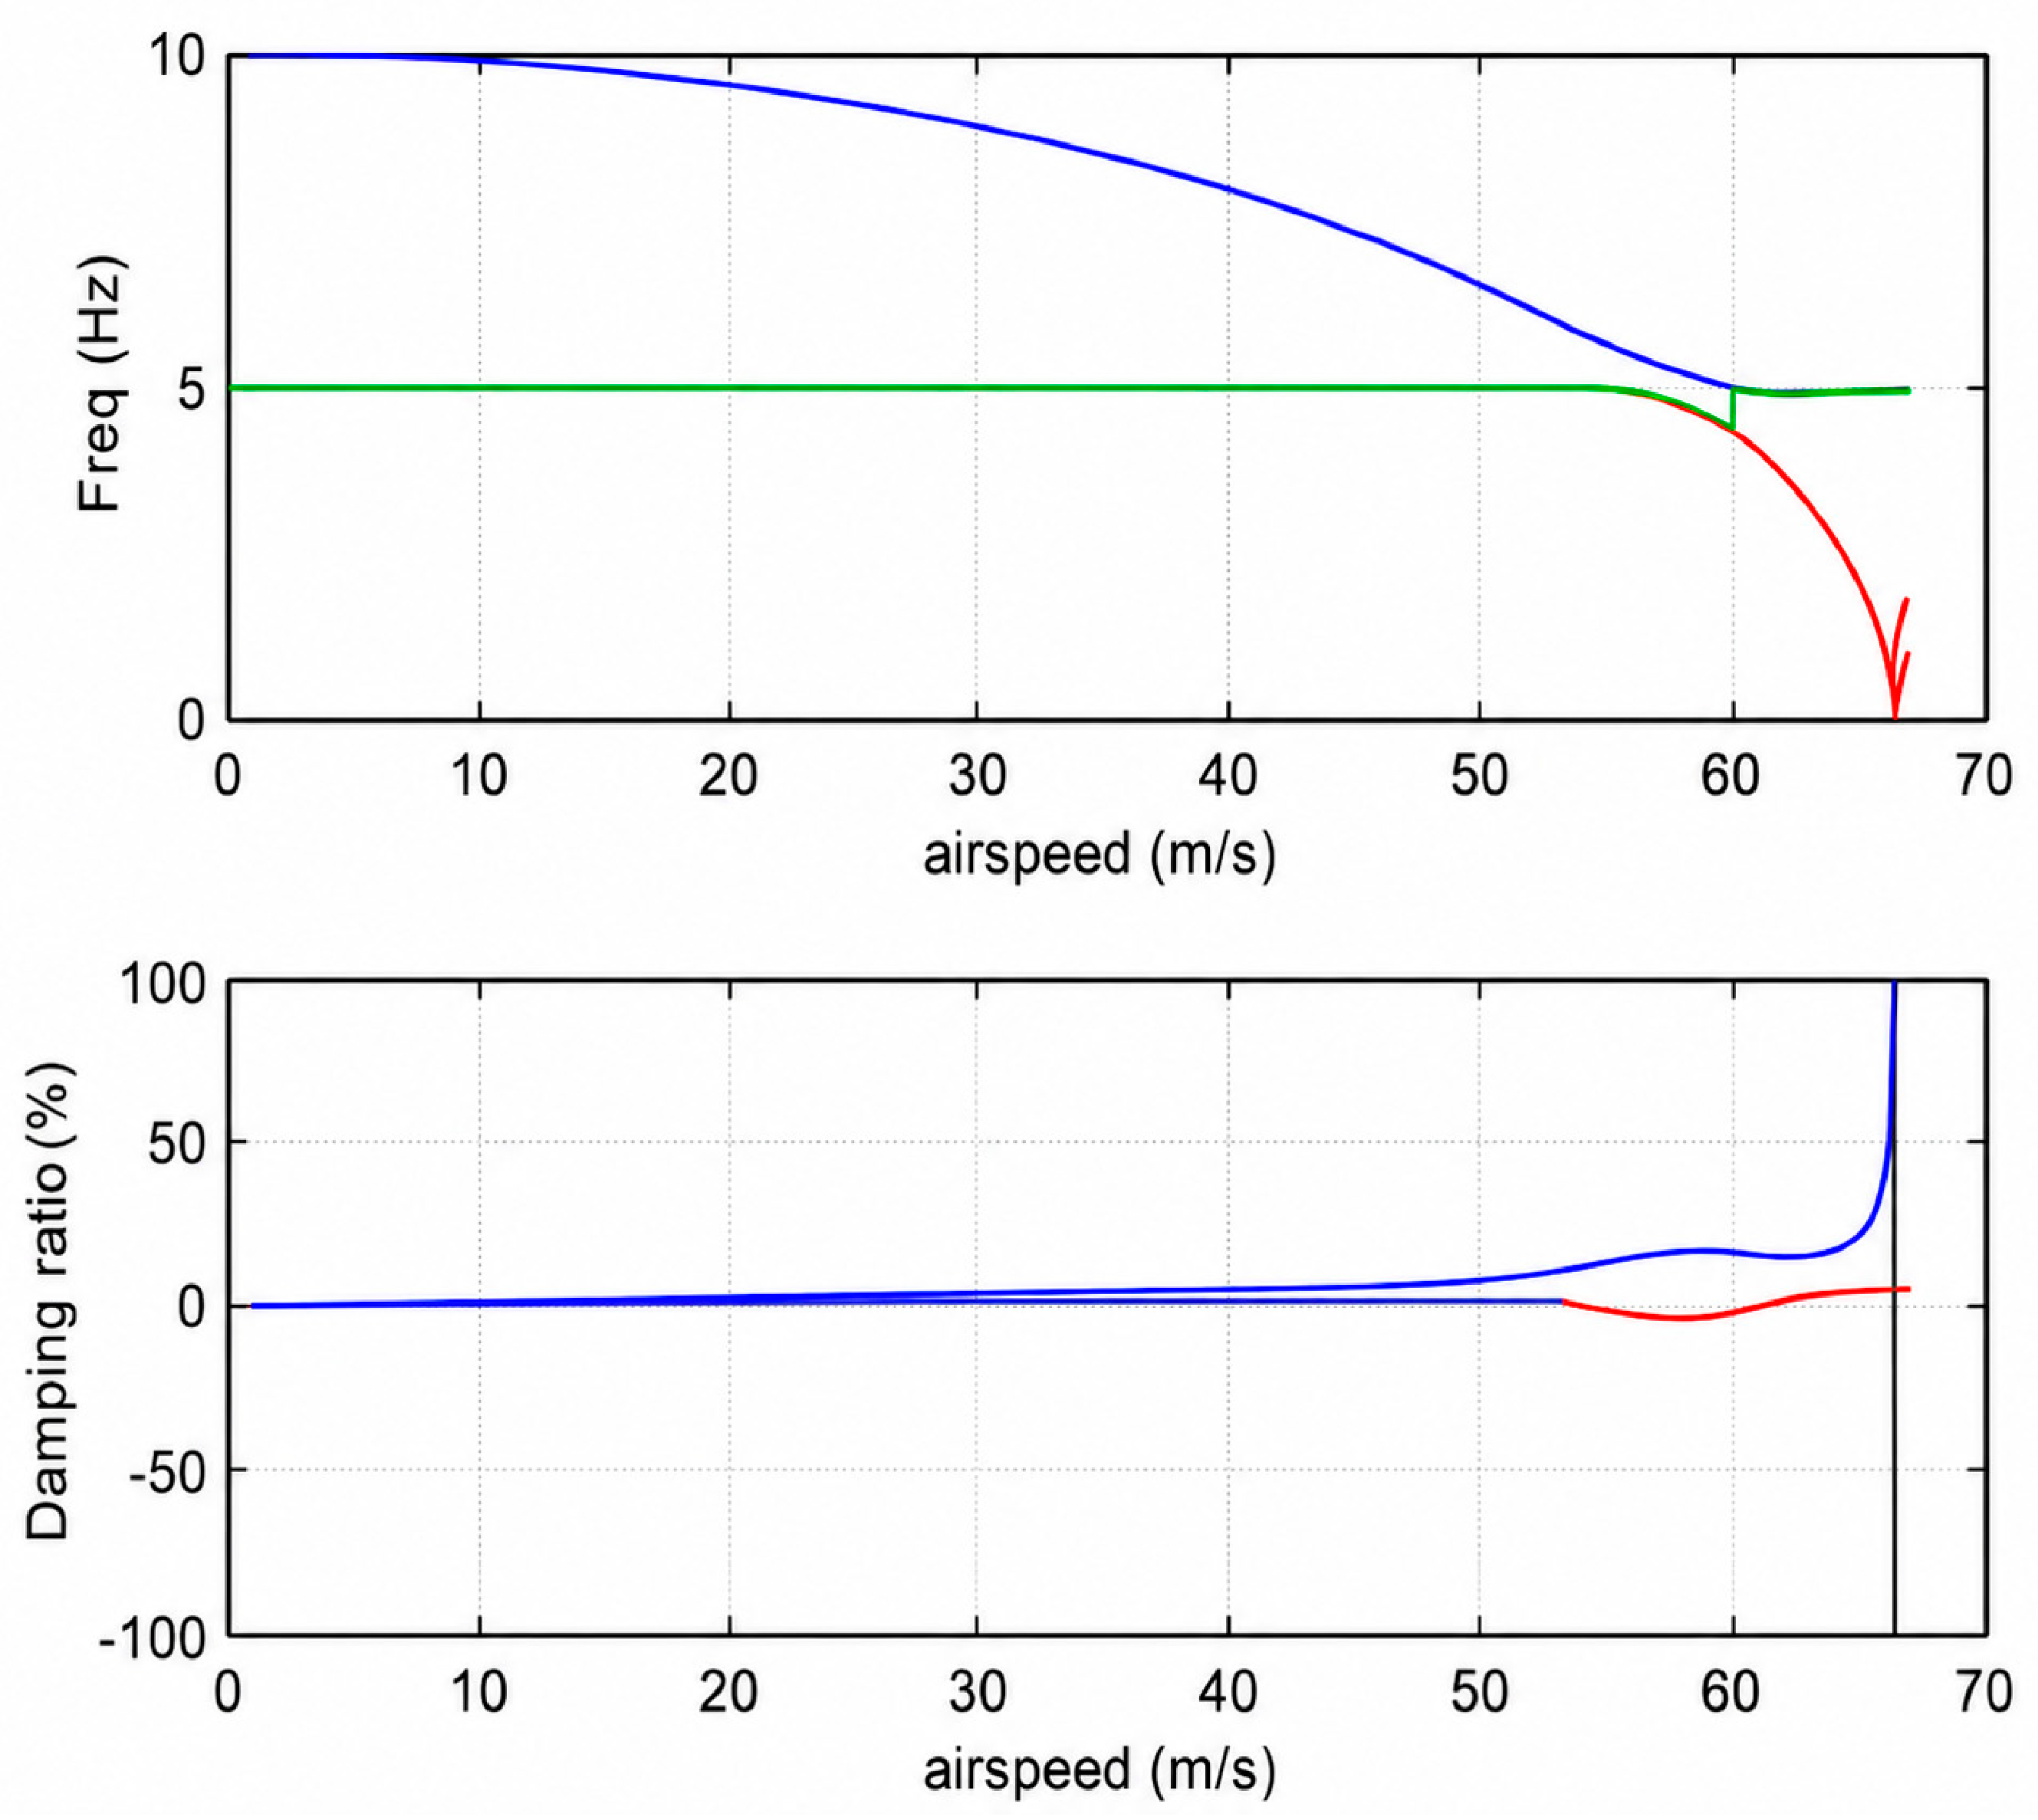
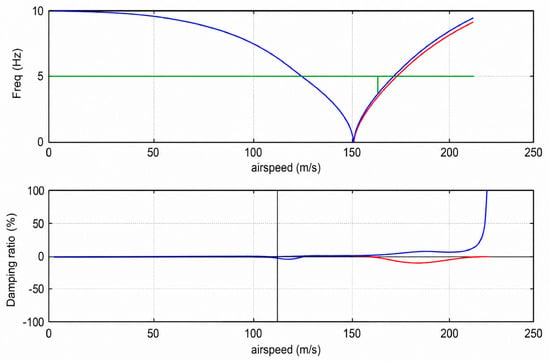
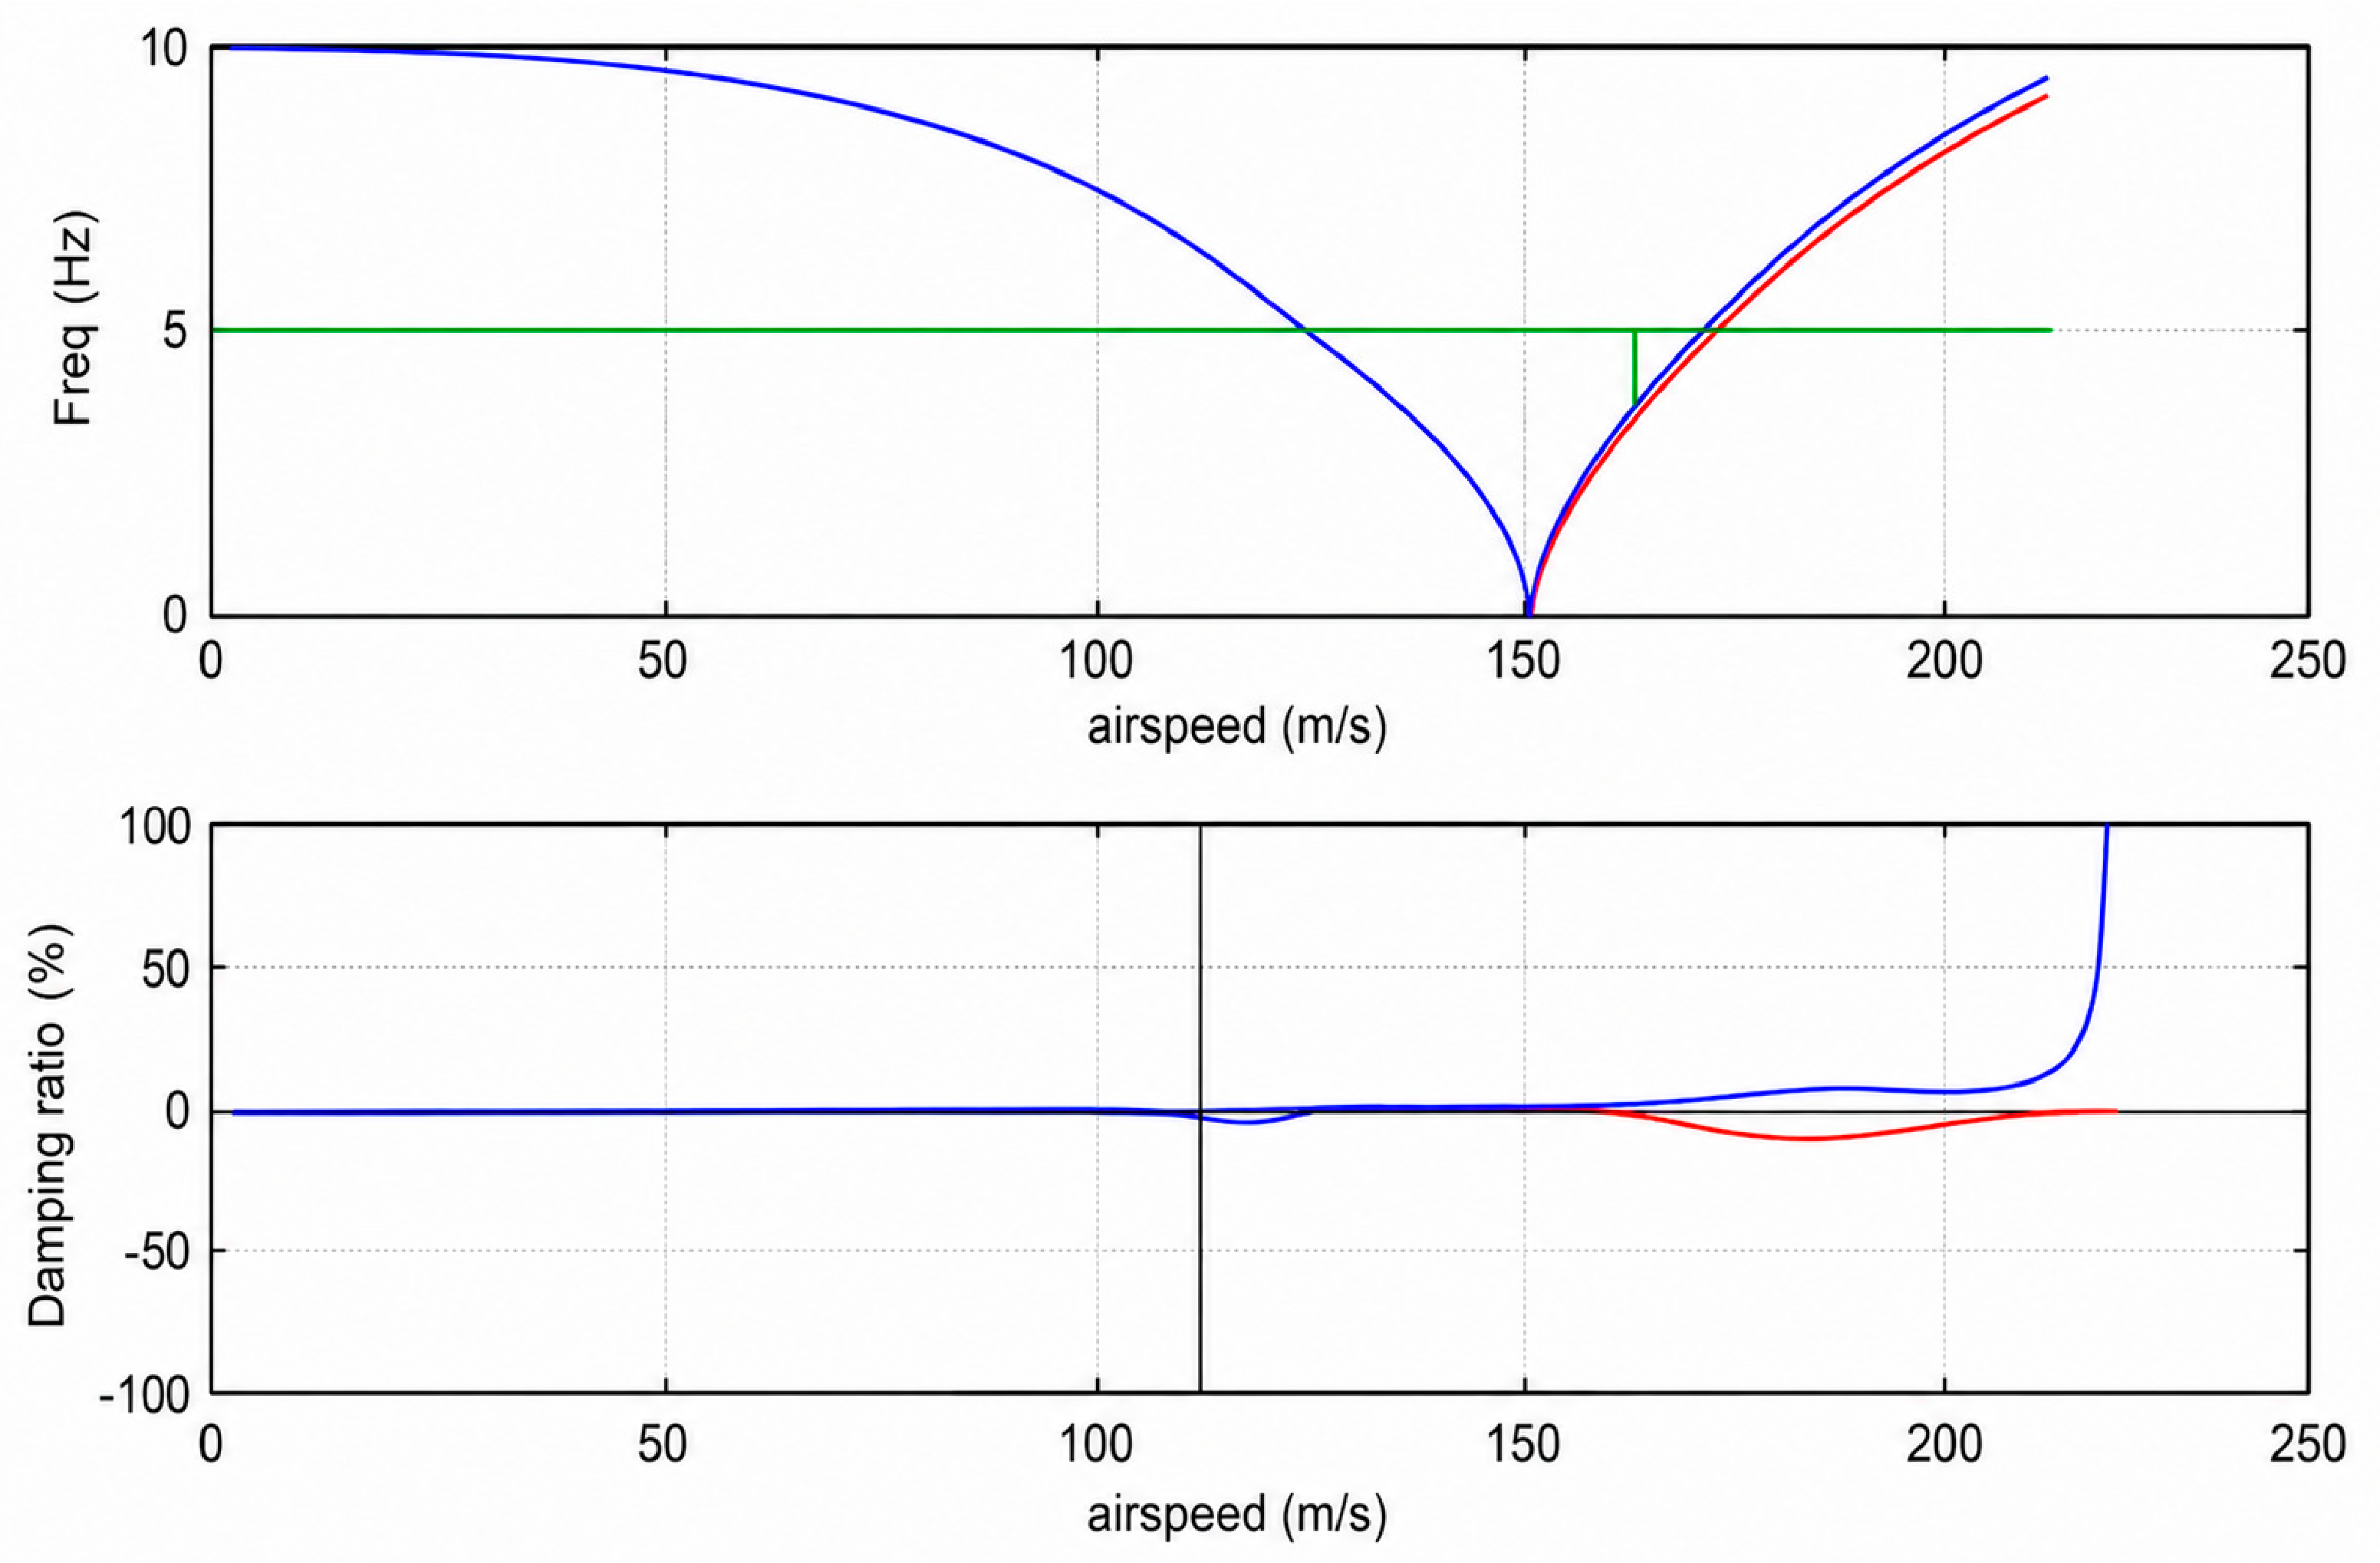
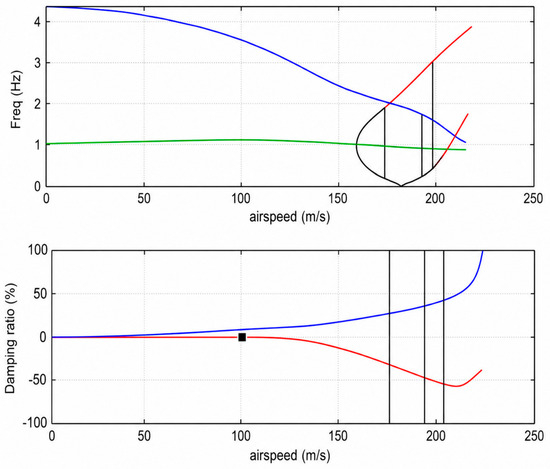
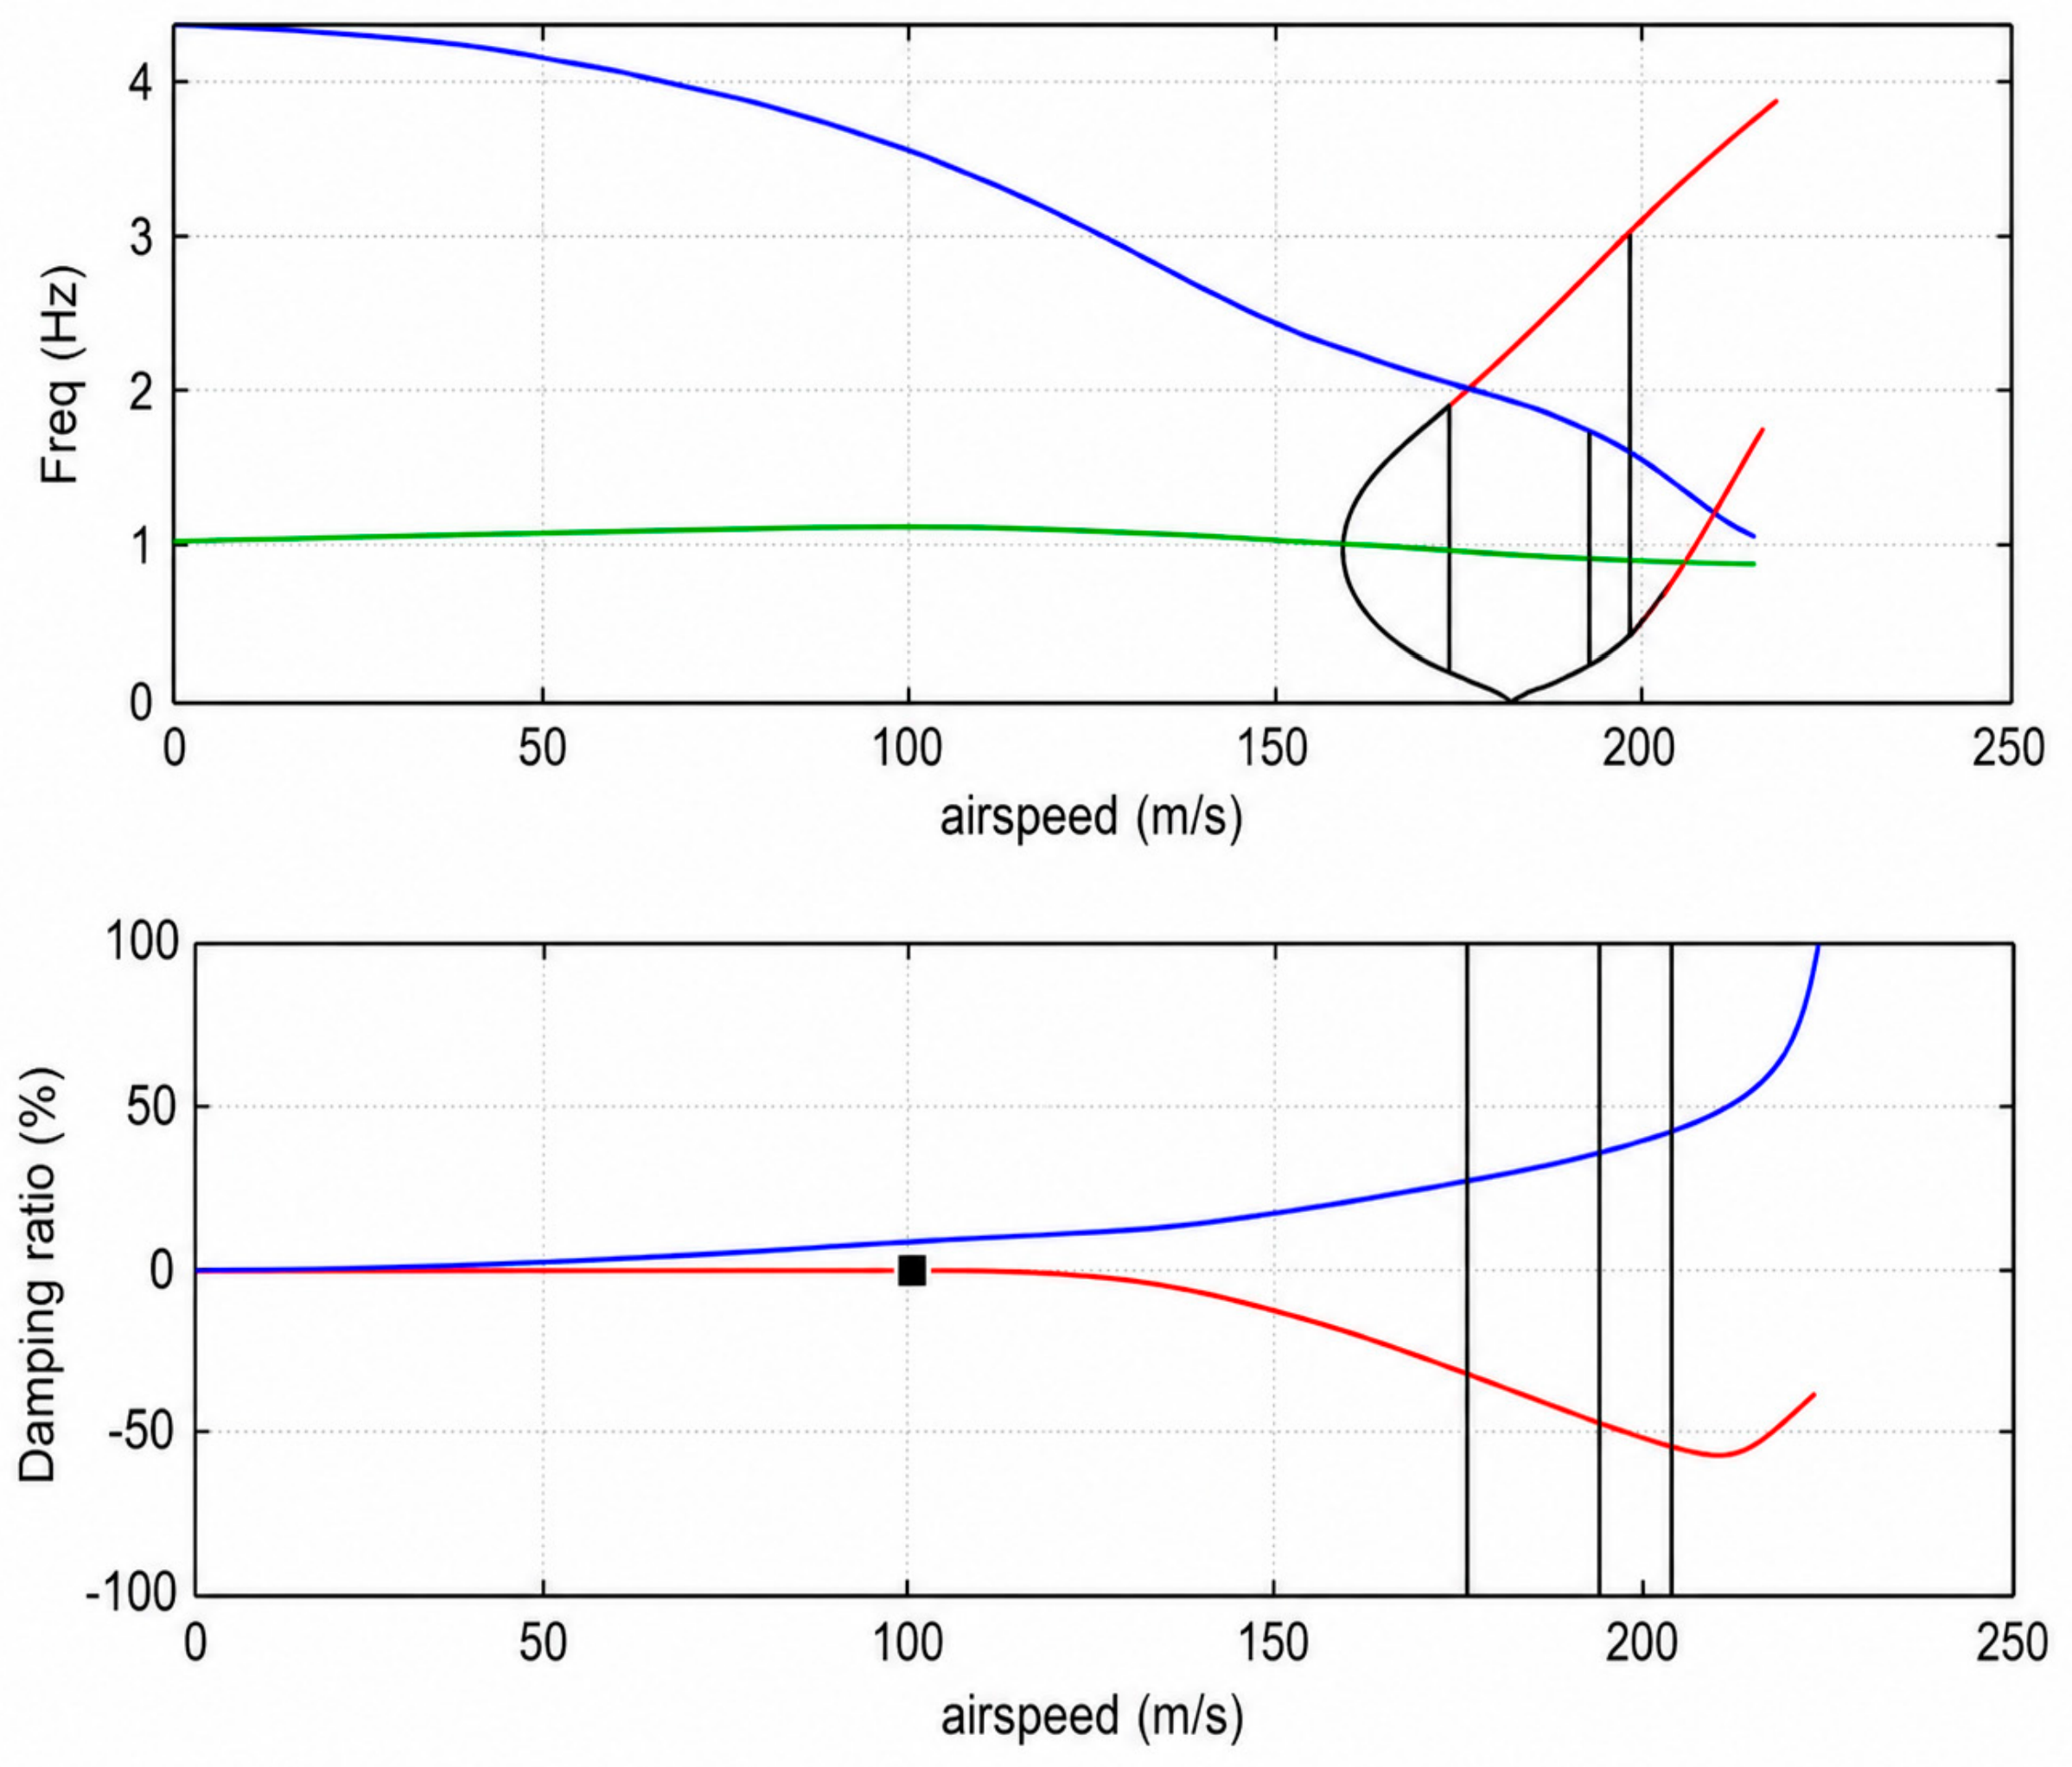
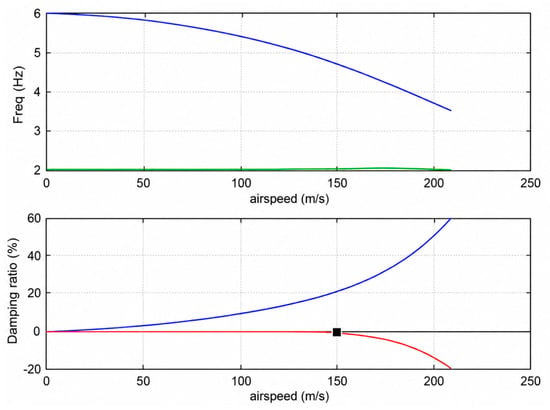
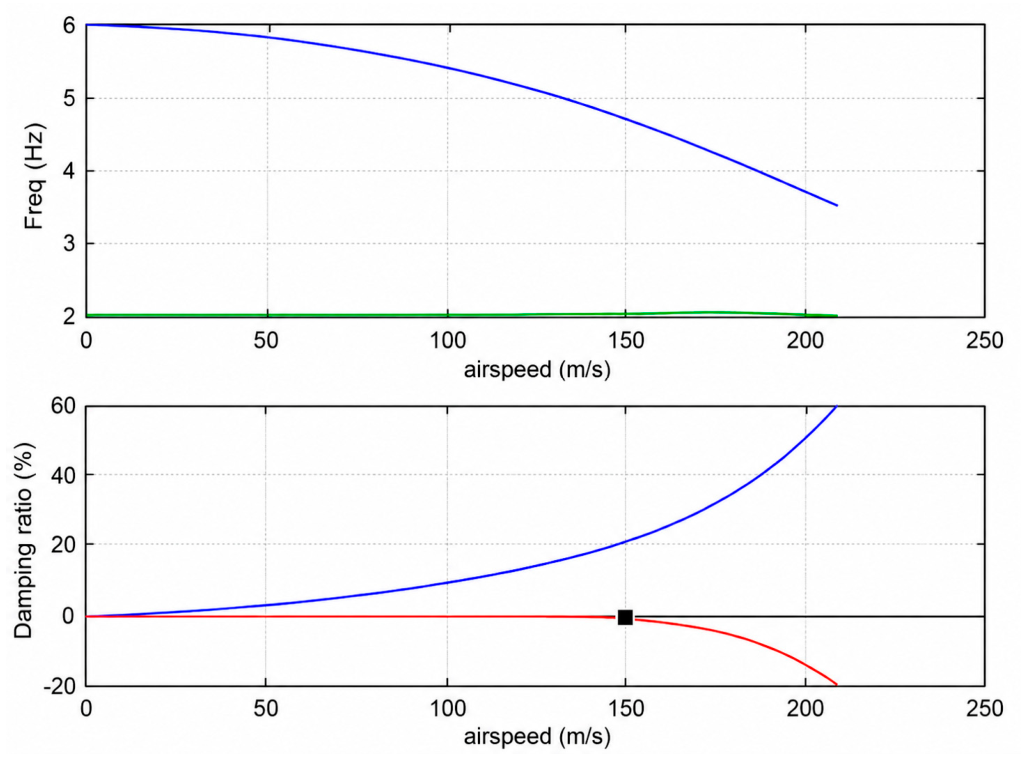
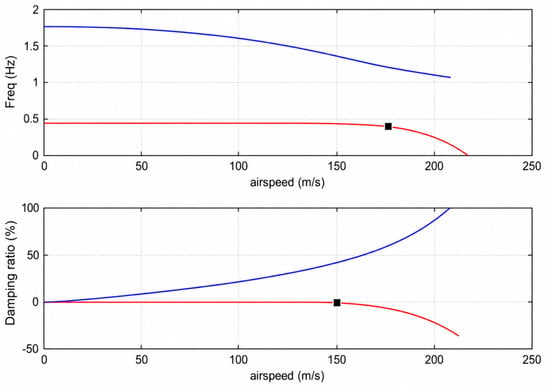
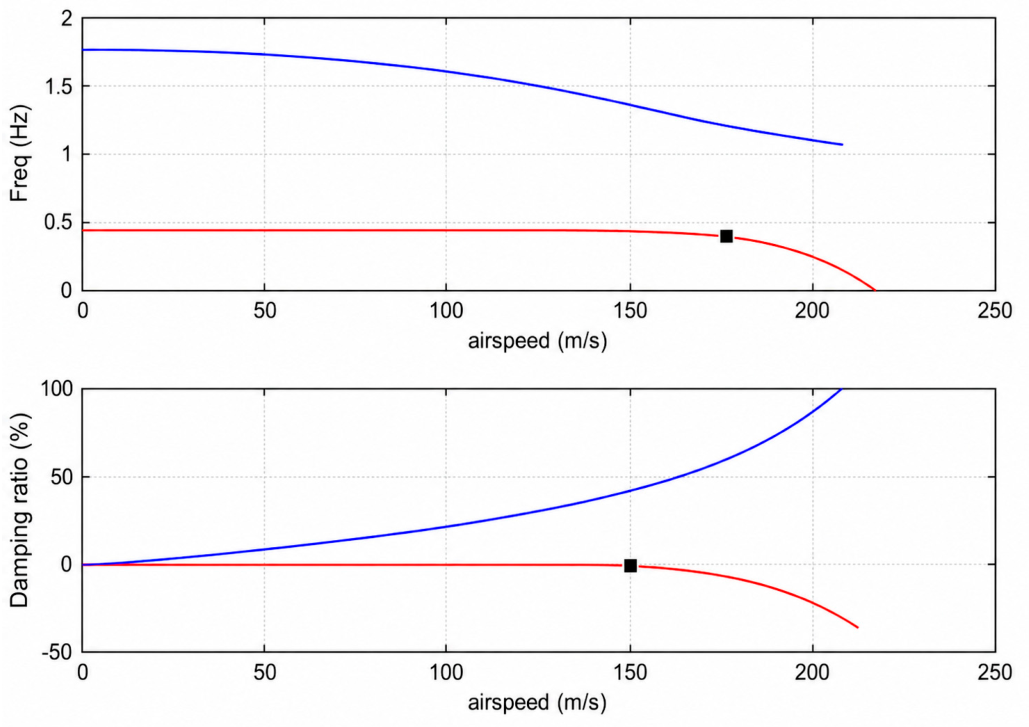
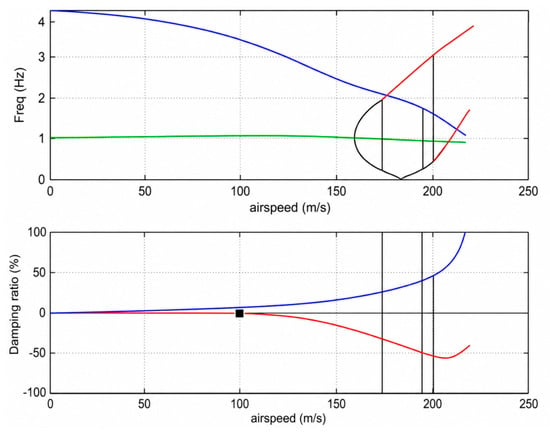
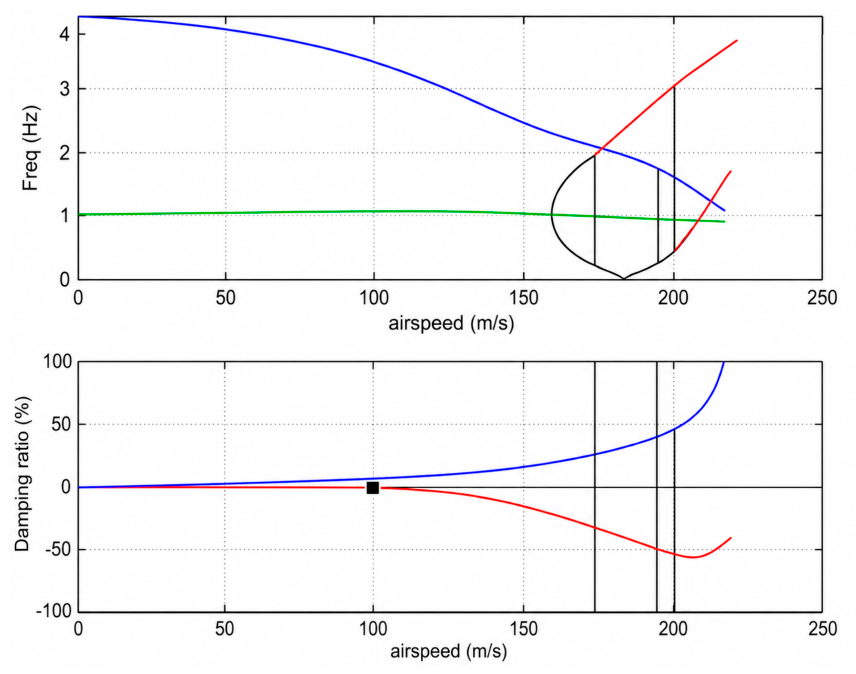
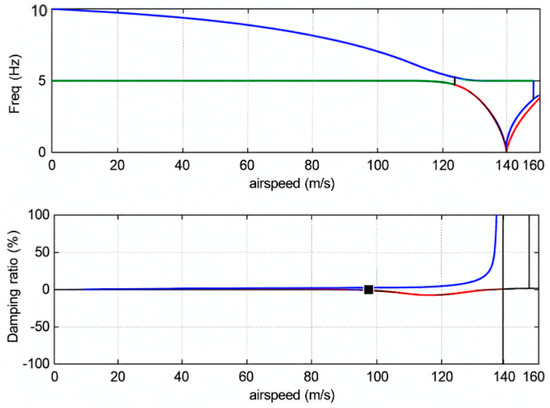
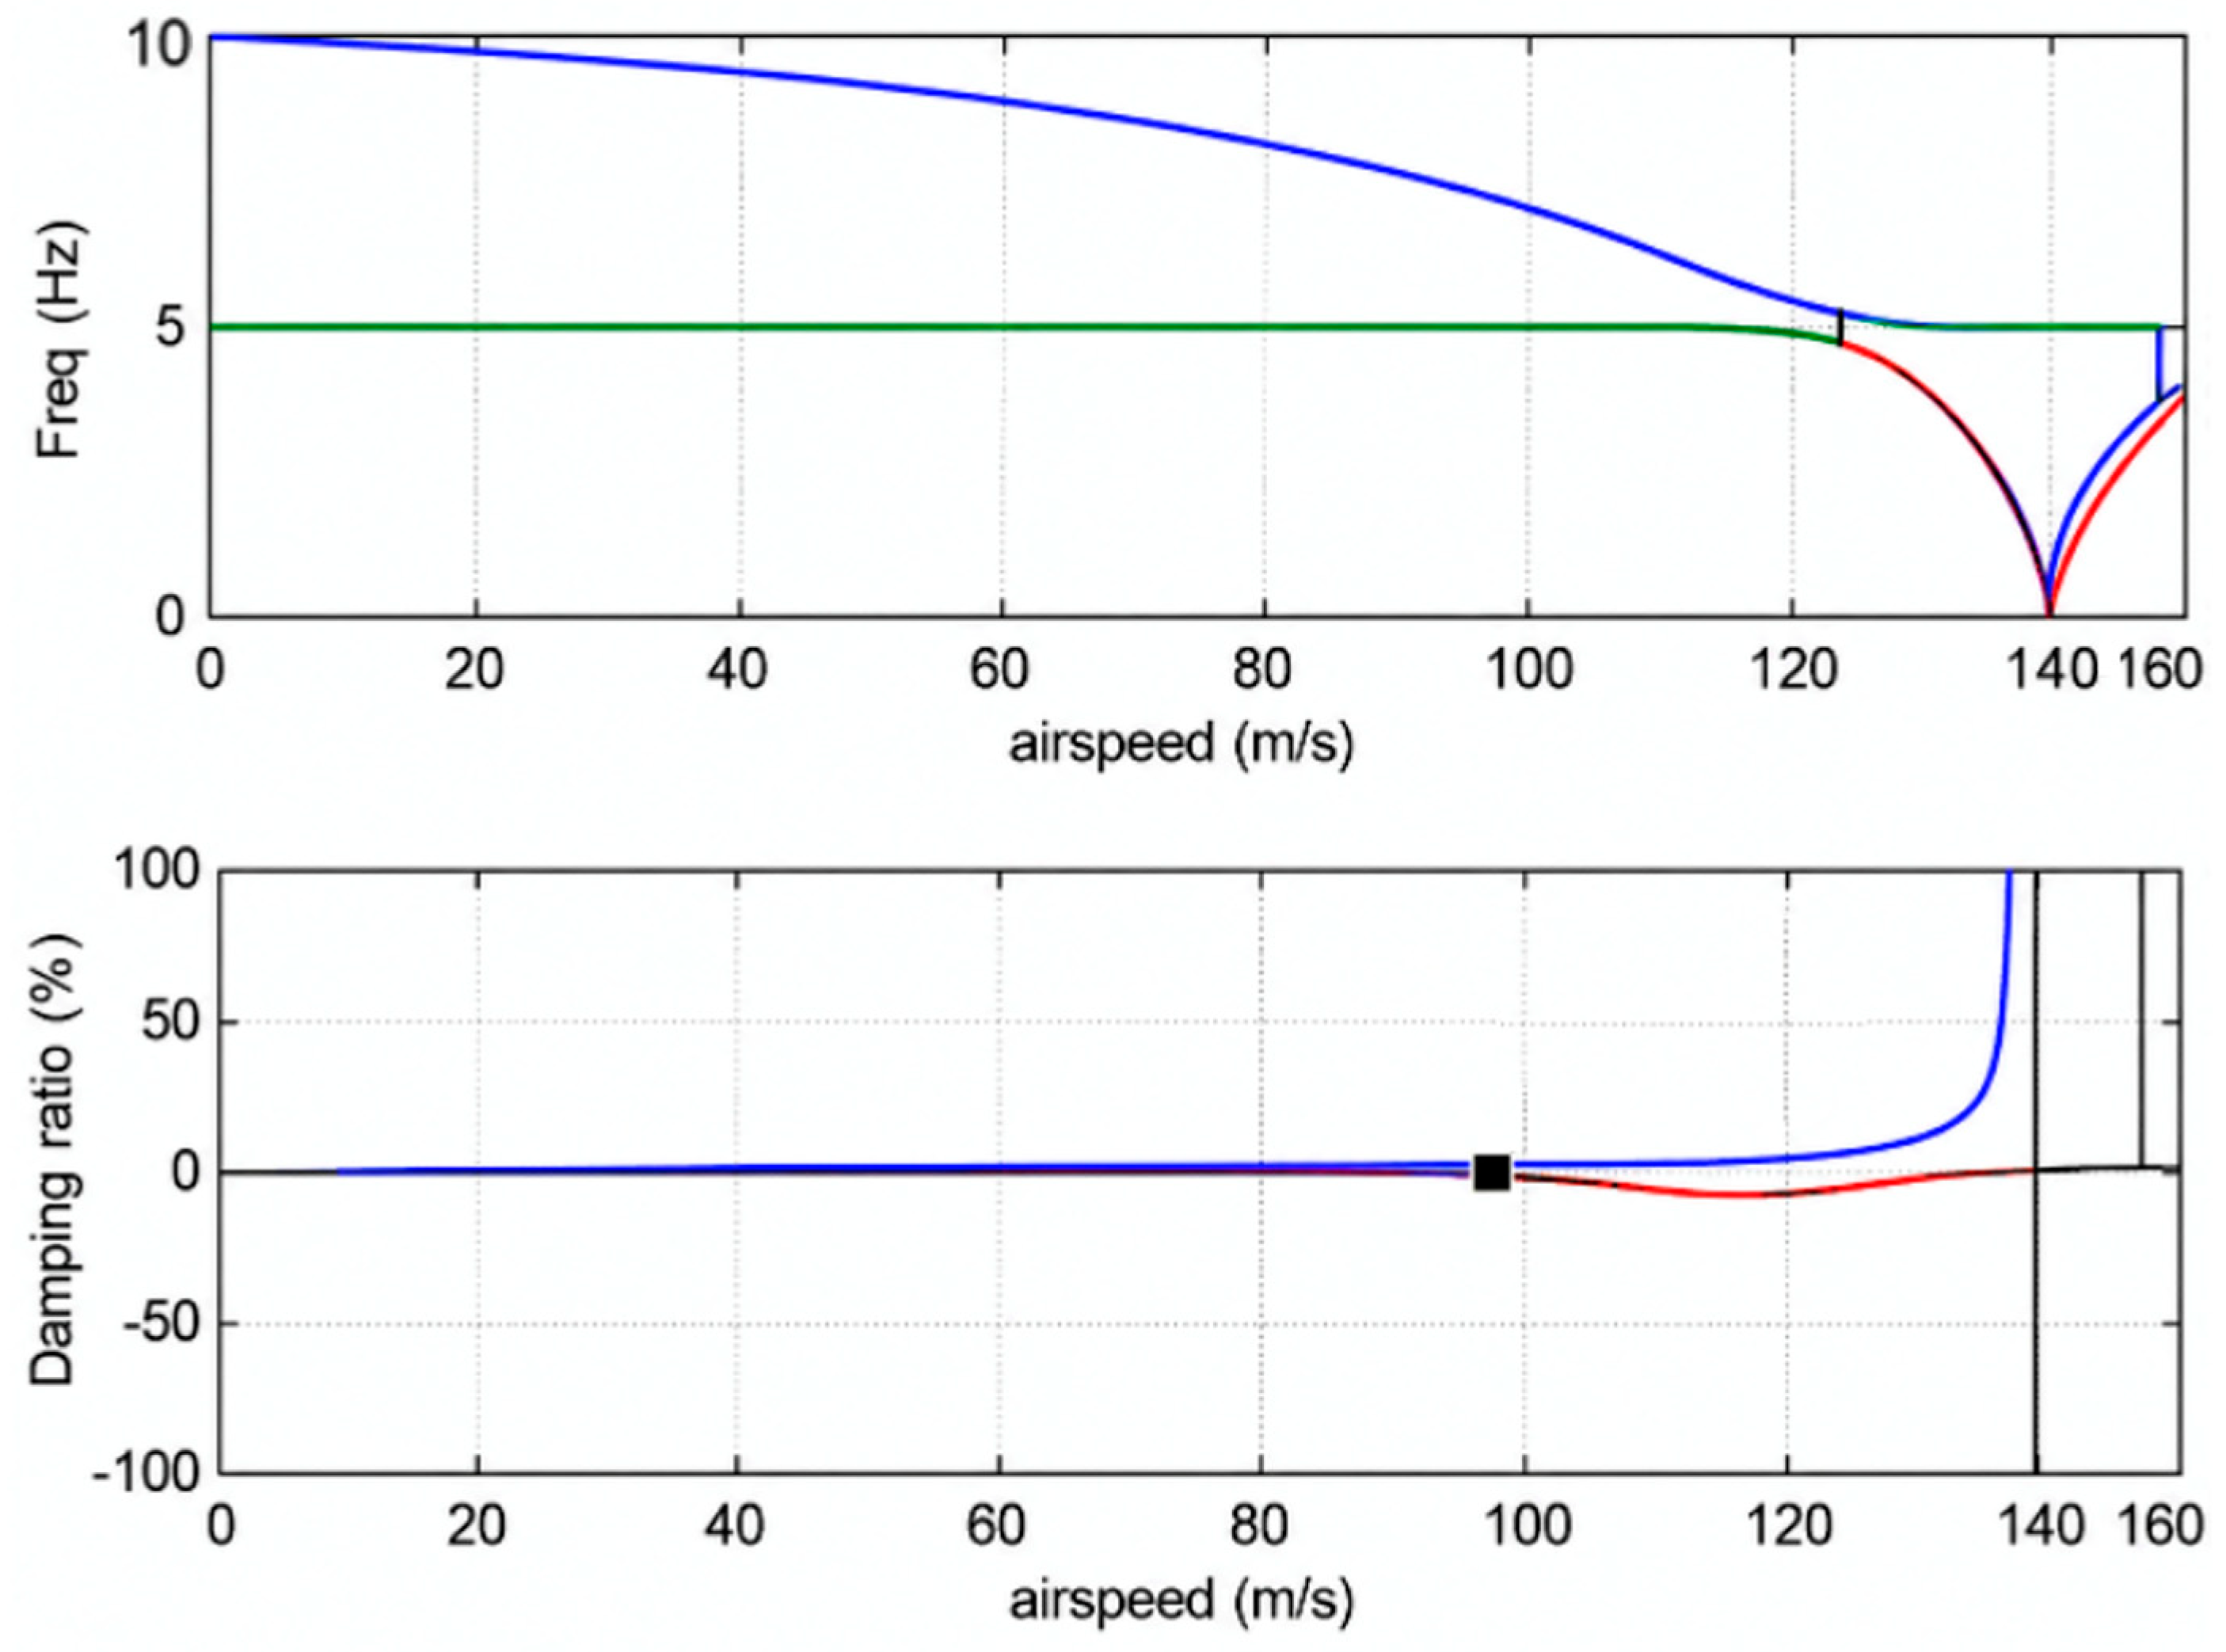
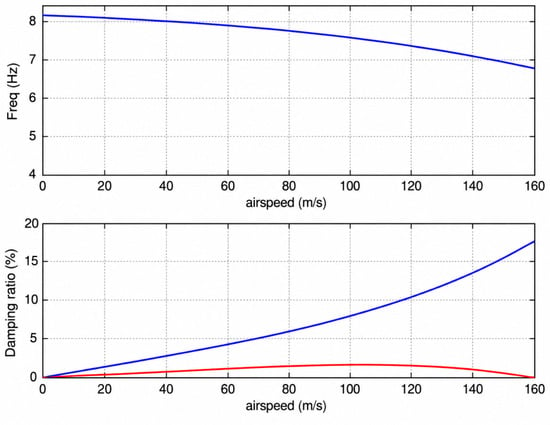
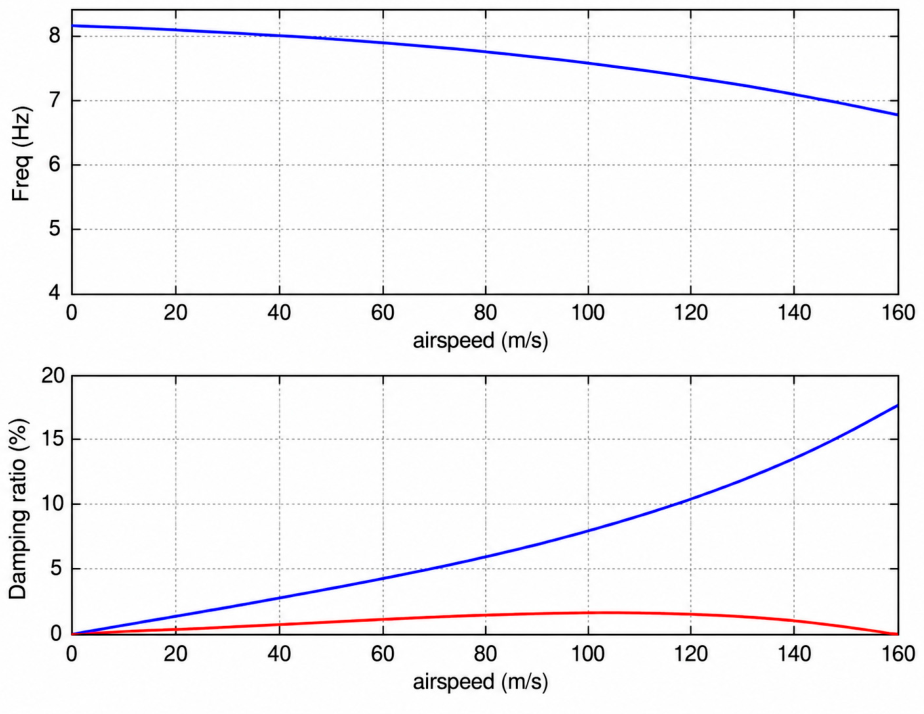
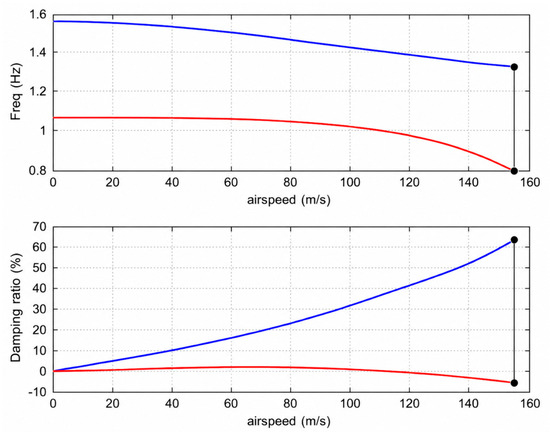
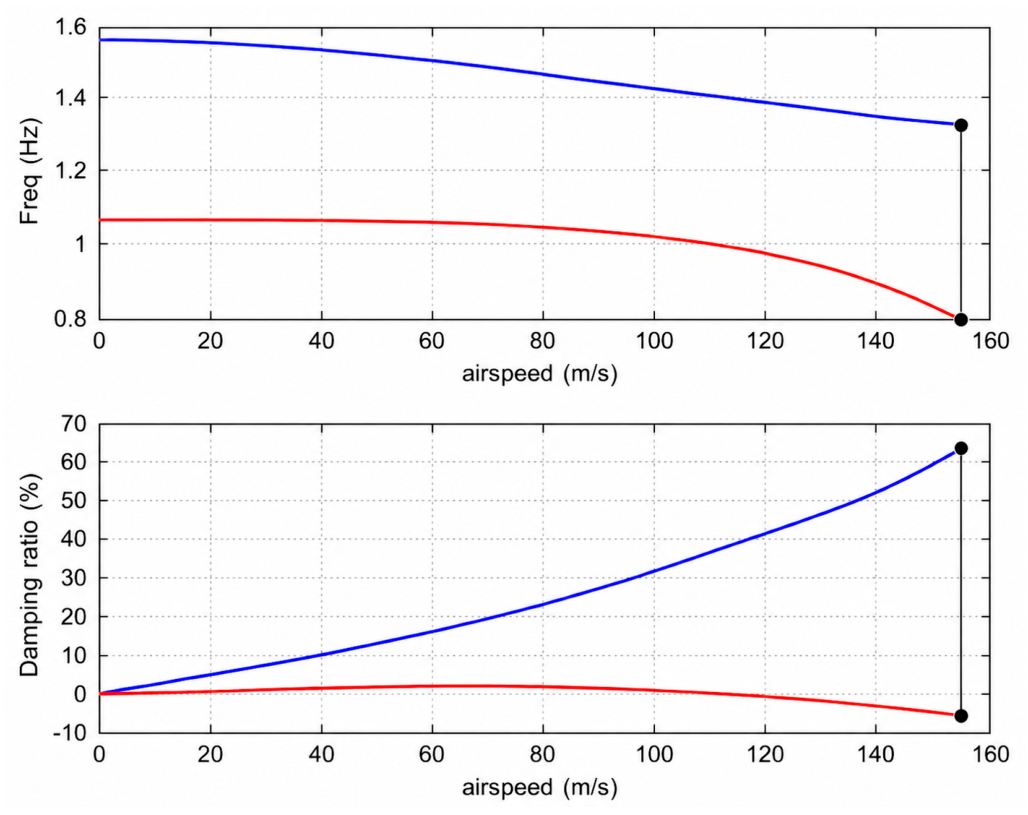
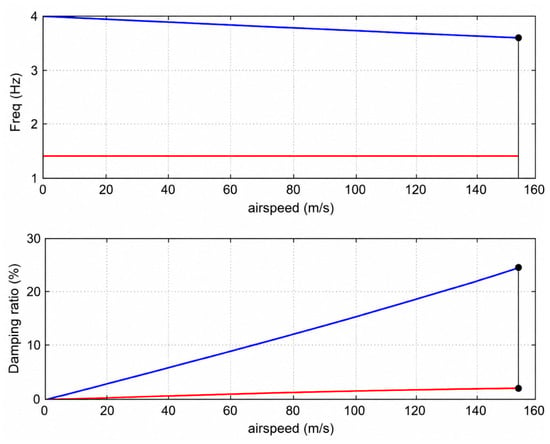
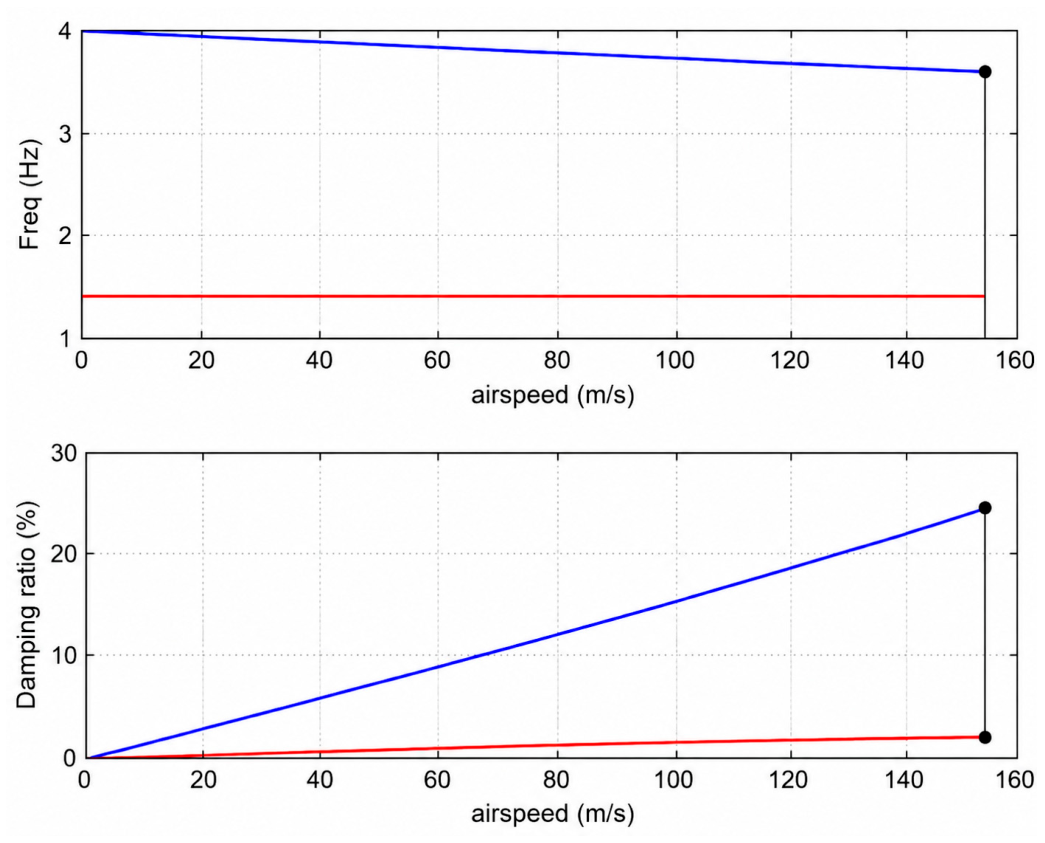
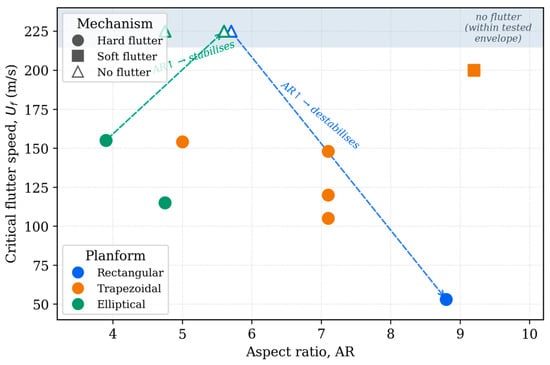
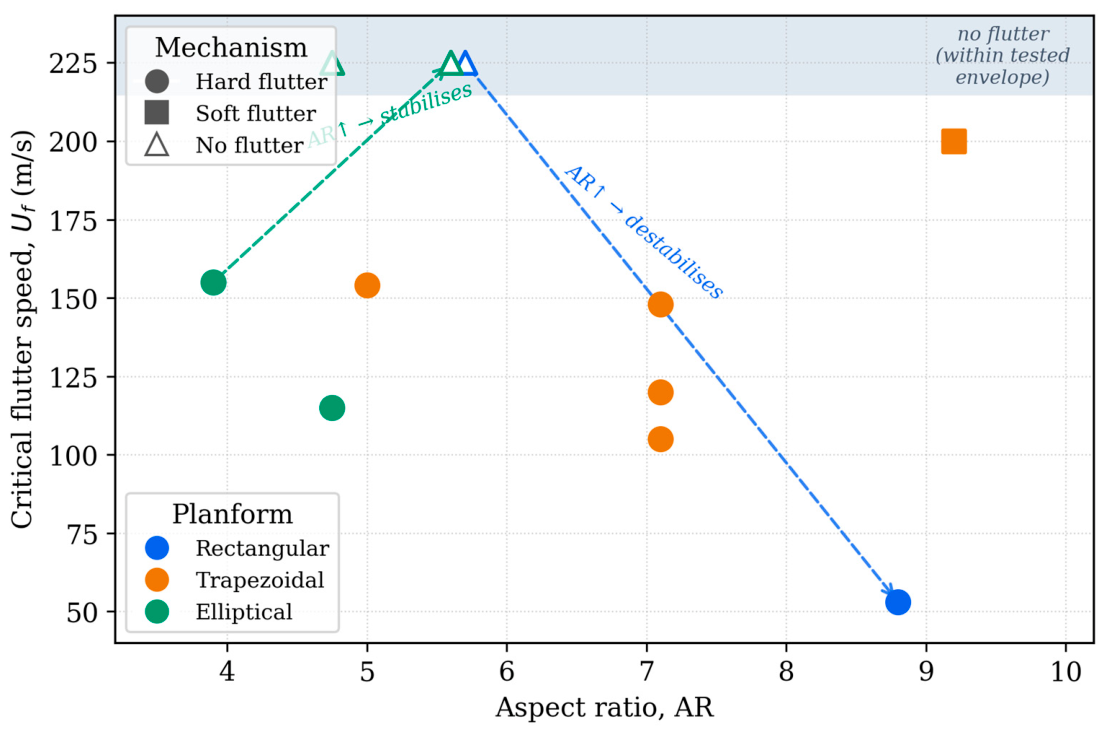

Disclaimer/Publisher’s Note: The statements, opinions and data contained in all publications are solely those of the individual author(s) and contributor(s) and not of MDPI and/or the editor(s). MDPI and/or the editor(s) disclaim responsibility for any injury to people or property resulting from any ideas, methods, instructions or products referred to in the content. |
© 2026 by the authors. Licensee MDPI, Basel, Switzerland. This article is an open access article distributed under the terms and conditions of the Creative Commons Attribution (CC BY) license.