Skip Content
You are currently on the new version of our website. Access the old version .

All Articles (582)

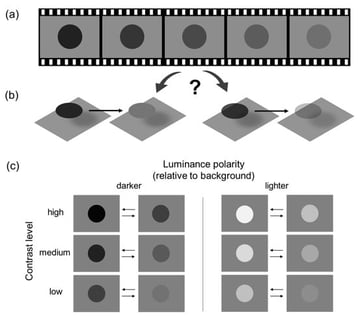
We report a novel phenomenon in which dynamic changes in luminance are perceived as changes in transparency rather than as changes in surface lightness. Participants viewed an achromatic disc on a uniform gray background and indicated whether the observed change was best described in terms of lightness or transparency. In Experiment 1, transparency-change responses were more frequent at low contrast and were strongly biased toward sequences in which contrast decreased over time, revealing a pronounced asymmetry between decreasing and increasing contrast trajectories. Experiment 2 introduced a size manipulation, such that the disc either expanded or contracted during the luminance modulation. Transparency-change responses were highest when contrast decreased and the disc expanded, indicating that spatial expansion further amplifies transparency-related interpretations of the disc’s surface appearance. Overall, the results reveal a systematic asymmetry in how contrast-change direction shapes visual appearance, consistent with a forward bias in the processing of continuously changing visual signals. When contrast dynamically approached the background level, perceptual representations appeared to be weighted toward the upcoming low-contrast state, enhancing impressions of increasing transparency. These findings demonstrate that even minimal displays lacking traditional geometric cues to transparency can evoke strong transparency impressions, driven by predictive weighting of spatiotemporal contrast trajectories rather than by static image properties alone.

6 February 2026

(a) Schematic depiction (not to scale) of the animation sequence used in Experiment 1. (b) Two competing interpretations of the dynamic display in (a): a change in lightness (left) versus a change in transparency (right). (c) Stimulus conditions used in Experiment 1. The luminance of the circular target either increased or decreased over time, resulting in either increasing or decreasing luminance contrast relative to the background. The left panel shows conditions where the target was darker than the background, and the right panel shows conditions where it was lighter. The three rows correspond to three levels of luminance contrast (high, medium, and low). In each cell, the pair of horizontal arrows indicates the direction of luminance change: either toward the background level (rightward arrow), resulting in decreasing contrast, or away from the background level (leftward arrow), resulting in increasing contrast. Animated demos can be viewed in Video S2.

Signal-to-Noise Efficiency Explains Inter-Observer Variability in Orientation Discrimination

  • Thiago P. Fernandes,
  • Natanael A. Santos and
  • Linnea N. Dahlgren

Background: Orientation discrimination tasks provide a core measure of visual sensitivity and are widely used to study how perceptual performance varies with stimulus uncertainty and visual field location. Here, we examined how external noise, retinal eccentricity, and individual perceptual efficiency shape orientation discrimination thresholds. Methods: Forty-two adults (mean age = 32.35 years, SD = 7.23) completed a two-alternative forced-choice task judging the orientation (clockwise vs. counterclockwise) of briefly presented Gabor patches under varying levels of external noise (low, medium, high) and eccentricity (0°, 5°, 10°). Orientation offsets ranged from −8° to +8°. Thresholds were estimated using psychometric functions and analyzed via rm ANOVA, linear mixed-effects models, and supervised machine learning. Results: Accuracy declined with increasing noise (ω2 = 0.48, p < 0.001) and improved with larger orientation offsets (ω2 = 0.62, p < 0.001). Thresholds increased with both noise (ω2 = 0.31, p = 0.002) and eccentricity (ω2 = 0.27, p = 0.003). Signal-to-noise efficiency was the strongest predictor (β = −0.72, p < 0.001); age alone was nonsignificant, but its interaction with eccentricity showed selective peripheral declines. Mixed-effects models confirmed spatial effects (β = 0.058, p < 0.001) and residual between-subject variability (σ2 = 0.14). Predictive models generalized well (R2 = 0.54). Conclusions: Orientation discrimination is shaped by both stimulus-level difficulty and individual differences in perceptual efficiency, which account for variability in sensitivity across visual conditions. Age-related differences emerge primarily under spatial load and depend on interactions between observer traits and task demands.

29 January 2026

Trial sequence in the 2AFC orientation discrimination task. Each trial began with a 500 ms fixation cross, followed by a single Gabor stimulus (100 ms) with variable orientation, noise level, and eccentricity. Participants indicated whether the stimulus was tilted clockwise (CW) or counterclockwise (CCW). Example Gabors shown here illustrate stimulus variation across trials. Trials ended with a jittered inter-trial interval (400–800 ms), during which fixation was maintained.

Background and Objectives: Primary open-angle glaucoma (POAG) is one of the leading ocular diseases leading to irreversible blindness and is often asymptomatic until advanced cases. While intraocular pressure reduction remains the cornerstone of treatment, neuroprotective strategies targeting retinal ganglion cell metabolism are actively investigated. Niacinamide (nicotinamide, vitamin B3), a precursor of NAD+, has shown neuroprotective potential in preclinical models. This exploratory study evaluated the short-term functional, structural, and electrophysiological effects of oral niacinamide supplementation in POAG. Materials and Methods: In this interventional study, patients with POAG received oral niacinamide 500 mg daily for six months. Visual field (VF) global and localized sensitivity (Mean Deviation [MD], Pattern Standard Deviation [PSD]), Optic Coherence Tomography (OCT)-derived peripapillary retinal nerve fiber layer (RNFL) and macular ganglion cell complex (GCC), and Visual evoked potentials (VEP) latency parameters (P2 1.4 Hz, P100 1°, and P100 15′) were assessed at baseline and at six months. Because both eyes from some participants were included, primary longitudinal inference was based on clustered analyses using generalized estimating equations and linear mixed-effects models to account for inter-eye correlation. Eye-level paired analyses were used for exploratory comparison. Change–change relationships across modalities were explored using Spearman correlation. Results: After accounting for inter-eye correlation, no statistically significant change in MD was detected (mean ΔMD +0.43 dB; GEE p = 0.099; LME p = 0.101), and PSD remained stable. RNFL thickness showed a small decrease (−1.26 µm; GEE p = 0.046), while GCC did not change significantly. VEP P100 latencies remained stable, whereas P2 latency showed a small increase (+3.9 ms; GEE p = 0.039). Correlation analysis revealed a moderate association between changes in GCC and MD (ρ = 0.44), suggesting concordance between macular structural stability and global visual field performance. Conclusions: When inter-eye correlation is appropriately accounted for, six months of niacinamide supplementation in POAG is associated with overall functional, structural, and electrophysiological stability, without evidence of clinically meaningful improvement or progression. These findings support short-term safety and highlight the importance of clustered analytical approaches and macular-centered biomarkers in future glaucoma neuroprotection trials.

28 January 2026

(A). Differences in MD after B3 supplementation. (B). Differences in PSD after B3 supplementation.

Wavefront Automated Refraction Comparison of Three Different IOLs: Aspheric Monofocal and Two Enhanced Monofocal IOLs

  • Arthur Buffara van den Berg,
  • Roberta Matschinske van den Berg and
  • Karolinne Maia Rocha
  • + 4 authors

The objective of this study was to compare subjective manifest refraction with wavefront-based automated refraction using iTrace (ray tracing) and LadarWave (Hartmann–Shack) in eyes implanted with two enhanced monofocal intraocular lenses (IOLs) and a standard aspheric monofocal IOL, emphasizing agreement and refractive variability across optical designs. This retrospective cohort included 84 eyes from 42 patients implanted with Tecnis Eyhance (DIB00), RayOne EMV (RAO200E), or Tecnis ZCB00 IOLs. Postoperative evaluation (1–3 months) included uncorrected and corrected distance visual acuity and subjective manifest refraction, followed by automated refraction with iTrace and LadarWave. Outcomes were sphere, cylinder, and spherical equivalent (SE). Agreement was assessed using mean signed difference, mean absolute error, root mean square error, Bland–Altman limits of agreement, proportions within clinically relevant thresholds, and vector astigmatism (J0, J45). Linear mixed-effect modeling evaluated SE differences across methods and IOL types while accounting for within-subject correlation. Subjective SE differed among IOLs (p = 0.027), with RAO200E more myopic than ZCB00 (−0.20 ± 0.32 D vs. −0.08 ± 0.44 D, p = 0.035). Automated refraction showed greater variability and poorer agreement in enhanced monofocal IOLs, particularly for cylinder and SE, with wider limits of agreement and fewer eyes within ±0.50 D compared with ZCB00. In mixed-effect contrasts (three-method repeated-measures model), iTrace and LadarWave showed a consistent myopic bias versus manifest refraction in DIB00 and RAO200E, whereas in ZCB00 the iTrace–manifest difference was not significant and LadarWave retained a significant myopic bias. Enhanced monofocal IOLs exhibit reduced agreement between wavefront-based automated and subjective manifest refraction compared with a standard aspheric monofocal IOL. Manifest refraction remains essential for postoperative assessment, and automated measurements should be interpreted as complementary, particularly in IOL designs that modify aberrations.

26 January 2026

Comparison of subjective and automated refraction outcomes across three monofocal intraocular lenses (DIB00, RAO200E, ZCB00). (A) Spherical refraction by lens and device. (B) Cylindrical refraction by lens and device. (C) Spherical equivalent (SE) by lens and device. (D) Sphere percentage variation by device and lens. (E) Cylinder percentage variation by device and lens. (F) SE percentage variation by device and lens. Subjective manifest refraction is shown in grey, iTrace (ray-tracing aberrometer) in blue, and LadarWave (Hartmann–Shack aberrometer) in orange. Bars represent mean values for each IOL group. Panels (A–C) display absolute dioptric values (D), with the zero line indicated. Panels (D–F) display percentage variation (PV, %), with the dashed line indicating the 100% reference. Percentage variation was defined as the difference between automated and subjective refraction, expressed as a percentage of the absolute subjective value. Because manifest values were frequently close to emmetropia, percentage variation values may appear numerically high and should be interpreted together with absolute differences. Statistical significance was assessed using one-way ANOVA with Tukey’s post hoc test (p &lt; 0.05).

News & Conferences

Issues

Open for Submission

Editor's Choice

Reprints of Collections

Visual Mental Imagery System
Reprint

Visual Mental Imagery System

How We Image the World
Editors: David F. Marks
Eye Movements and Visual Cognition
Reprint

Eye Movements and Visual Cognition

Editors: Raymond M. Klein, Simon P. Liversedge

Get Alerted

Add your email address to receive forthcoming issues of this journal.

XFacebookLinkedIn
Vision - ISSN 2411-5150