


Abstract
Background and Objectives: Plantar fascia (PF) thickness and stiffness respond to repetitive mechanical loading (such as running) and are indicators of plantar fasciitis. However, little is known about these properties and their response to running after injury has been resolved. Thus, the purpose of this study was to investigate the effects of a submaximal treadmill run on PF thickness and stiffness in individuals with resolved plantar fasciitis (RPF). Methods: Twenty participants (8 RPF, 12 no history of plantar fasciitis [NPF]) completed a 30 min submaximal treadmill run. Ultrasound imaging was used to assess PF thickness and stiffness at pre-run, post-run, 15 min post-run, and 30 min post-run. Mixed-model repeated-measures ANOVAs were used to evaluate the effects of group and timepoint on PF thickness and stiffness. Results: No group × timepoint interaction was found for PF thickness (p = 0.586) or stiffness (p = 0.597). Regardless of group, PF thickness decreased from pre-run to post-run (3.53 to 3.01 mm; p < 0.001) and approached pre-run values by 30 min post-run (3.51 mm; p = 1.000). Similarly, PF stiffness decreased from pre-run to post-run (4.12 to 3.13 m/s; p < 0.001) and approached pre-run values by 15 min post-run (3.79 m/s; p = 0.091). PF thickness (p = 0.034) and stiffness (p = 0.034) were greater in the RPF group. Conclusions: RPF may be associated with greater PF thickness and stiffness after symptom resolution, while both groups exhibited similar general patterns of response to submaximal running. Further longitudinal research is needed to establish the clinical relevance of these findings.
1. Introduction
The etiology and underlying mechanisms of plantar fasciitis are still unknown. Plantar fascia (PF) thickness and stiffness have emerged as important clinical factors to diagnose and assess plantar fasciitis [1,2]. The viscoelastic behavior of the PF (e.g., creep and stress relaxation) suggests that repetitive loading, such as walking or running, would lead to axial thinning, longitudinal lengthening, and reduced load transfer of the PF [3]. During a repetitive task, a thinning PF may incur microtears, which, in the absence of sufficient recovery, may elicit an inflammatory reparative response. Consequently, continued repetitive loading without adequate recovery may cause chronic thickening of the PF, as well as a loss of stiffness due to cumulative microstructural damage and impaired tissue remodeling [4,5]. Indeed, individuals diagnosed with plantar fasciitis show increased PF thickness [6] and decreased PF stiffness [4]. However, it remains unclear whether these alterations in tissue morphology and mechanical properties persist after symptoms have been resolved. Furthermore, symptom resolution may not necessarily indicate that the PF has returned to the structural and mechanical characteristics of tissue without a history of injury. Examining how the PF responds to an acute bout of mechanical loading may therefore provide further insight into whether tissue behavior is fully restored following plantar fasciitis.
As is evident in asymptomatic individuals, PF thickness and stiffness decrease after one running bout, but they approximate pre-exercise values after 30 min of recovery in individuals without a history of plantar fasciitis [5,7,8]. The immediate decrease and consequent return of thickness and stiffness after running in asymptomatic individuals affirm the viscoelastic load- and rate-dependent response of the PF to mechanical loading. Whether this sequence of decrease in thickness and stiffness occurs in previously injured PF tissue has not been evaluated thus far. The PF of individuals with resolved plantar fasciitis (RPF) may respond differently to mechanical loading due to potential scar tissue build-up during the inflammatory phase of the healing process [9]. Scar tissue has shown reduced load compliance compared to healthy tissue, potentially affecting how the PF responds to induced continuous mechanical loading in an injured or resolved state [10,11]. Furthermore, evidence suggests that scar tissue is thicker than healthy tissue [9,12], and that it responds to low-load mechanical loading with a stiffer response compared to healthy tissue [11]. Low-load mechanical loading for the PF likely coincides with average daily stressors such as standing and walking, suggesting that PF stiffness in individuals with RPF may be greater than that in individuals with no history of plantar fasciitis (NPF). However, it is unknown whether PF thickness and stiffness abnormalities persist after plantar fasciitis is resolved, and whether a previously injured PF responds differently to mechanical loading conditions compared to a healthy PF.
The PF also plays an integral part in maintaining foot and arch control during the stance phase of the gait cycle [13,14]. The involvement of the PF in the windlass mechanism allows it to react to being loaded during ground contact by coiling around the toes and providing tension within the foot to control midfoot pronation and dorsiflexion under weight-bearing conditions in asymptomatic individuals [2,13,15]. This function is impaired in people with plantar fasciitis [16]. Furthermore, apart from the commonly reported heel pain, individuals with plantar fasciitis display increased midfoot extension and eversion, synonymous with flattening of the medial longitudinal arch, and decreased forefoot dorsiflexion during initial contact compared to asymptomatic individuals [17,18]. This kinematic pattern is synonymous with the loss of PF stiffness during an active episode of plantar fasciitis. However, if scar tissue develops during recovery and rehabilitation, the foot may behave more rigidly during the stance phase, as a thicker and stiffer PF could prevent the arch from properly pronating. A potential lack of midfoot pronation due to a thicker and stiffer PF may alter the tissue’s response to repetitive mechanical loading, such as walking or running.
Given that PF properties can be quantified using ultrasound [7,8] and that changes in these properties are used clinically to identify plantar fasciitis [1,4], measurements of PF thickness and stiffness may provide valuable information for monitoring tissue changes before injury and throughout recovery.
Especially in the absence of pain, progressive deterioration or improvement in PF properties may remain unnoticed. Furthermore, the extent to which a previously injured PF responds to mechanical loading, and whether that resembles healthy tissue mechanics, is still unknown. Therefore, the purpose of the present study was to investigate the effects of a submaximal treadmill run on PF thickness and stiffness in individuals with resolved plantar fasciitis (RPF). It was hypothesized that the ‘no history of plantar fasciitis’ (NPF) group would exhibit a decrease in PF thickness and stiffness from pre-run to post-run, followed by a subsequent return to baseline values, and that the ‘resolved plantar fasciitis’ (RPF) group would show no change in PF thickness and stiffness from pre-run to all post-run measurements. It was also hypothesized that the RPF group would possess a thicker and stiffer PF.
2. Materials and Methods
2.1. Study Design
The present study was designed as a quasi-experimental, repeated-measures pre-test–post-test design to assess the effects of a submaximal treadmill run on PF thickness and stiffness.
2.2. Participants
Twenty healthy individuals participated in the present study (6 females; age: 24.3 yrs [±7.5]; mass: 70.0 kg [±10.1], height 178.0 cm [±8.6]). An a priori power analysis (α = 0.05, statistical power = 0.80, effect size f(U) = 0.60) was conducted using G*Power (v. 3.1.9.7) for a group × timepoint interaction in a mixed-design repeated-measures ANOVA (2 groups × 4 measurements; ε = 1.00). The power analysis employed an effect-size specification in which the correlation between repeated measurements was incorporated into the standardized effect size rather than specified as a separate input parameter. The assumed effect size of f = 0.60 was informed by our previous investigations of PF thickness and shear wave velocity in response to running, which demonstrated substantial within-subject effects (Cohen’s d = 0.54–1.96) [7]. Although these findings supported the expectation of meaningful changes in PF properties following mechanical loading, no study has thus far directly estimated a group × timepoint interaction for PF thickness and stiffness in an RPF population. Therefore, f(U) = 0.60 was selected as a hypothesized large interaction effect. The analysis indicated a minimum required sample size of 14 participants (7 per group). Eight participants had RPF (4 females; age: 25.1 yrs [±9.8]; mass: 69.4 kg [±12.2], height 180.2 cm [±11.3]). RPF was defined as having had no symptoms for at least one month prior to participating in the study [18]. At the time of testing, all RPF participants reported being free of plantar fasciitis-related symptoms for at least one month and were able to complete running activities without pain. Participants reported previous plantar fasciitis symptom onset as far as seven years ago and as close as three months ago, with a mean symptom duration of two months (±0.7 months). All RPF participants self-reported a previous diagnosis of plantar fasciitis by a medical professional and attributed their condition to exercise-related activities. However, previous diagnoses and their clinical justifications were not independently verified through medical records or clinical examination. Three participants experienced unilateral plantar fasciitis on the right, two experienced unilateral plantar fasciitis on the left, and three participants experienced it bilaterally. Twelve participants were NPF individuals (2 females; age: 23.7 yrs [±5.4]; mass: 70.8 kg [±8.5], height 177.5 cm [±7.1]). All participants were considered physically active, having participated in at least 30 min of moderate physical activity on three days per week over the last three months. Participants were also categorized as recreational runners with a minimum weekly running distance of five kilometers (km). The mean monthly running distance for the RPF group was 50.3 km (±20.1), while the NPF group reported 55.0 km (±21.4). A two-sample t-test revealed no significant difference in monthly running distance between the two groups (p = 0.64). All participants indicated their ability to run pain-free and to run comfortably on a motorized treadmill. Exclusion criteria were existing diseases (cardiovascular disease, metabolic disease, renal disease), pregnancy, any history of lower-extremity injuries and surgeries within the past six months, current musculoskeletal injuries, wearing prescription inserts, and regular use of non-steroidal anti-inflammatory drugs (NSAIDs) or topical creams. This study was approved by the Institutional Review Board of the University of Idaho (22-162, 2 November 2022) and was carried out in accordance with the Declaration of Helsinki. Written informed consent was obtained from all participants before data collection.
2.3. Procedures
Participants were instructed to avoid NSAID consumption and topical cream application to the superficial aspect of the plantar fascia prior to participation. Additionally, participants were asked to refrain from vigorous physical activity (such as high-intensity running or weightlifting) and alcohol consumption (due to its potential inflammatory effect) 24 h prior to participation.
Participants had performed a maximal-effort graded exercise test (GXT) on a motorized treadmill (4FRONT, Woodway, Waukesha, WI, USA) at least 48 h prior to the submaximal 30 min treadmill run. This session functioned to determine individual ventilatory threshold 2 (VT2) (TrueOne 2400; Parvo Medics, Salt Lake City, UT, USA). VT2 was determined by a single researcher via visual inspection of a concomitant increase in VE/VO2 and VE/VCO2 [19]. The individualized speed for the 30 min treadmill run was 80% of the running speed at which VT2 was achieved. For participants who did not reach VT2 during the GXT, 80% of the speed at test termination was used. This was the case for five of the twenty participants. Of these five participants, two were in the RPF group (1 female, 1 male), and three were in the NPF group (2 females, 1 male).
Upon reporting to the lab for a second session, participants performed a 30 min run on the same motorized treadmill at their individually prescribed running velocity with their own running shoes. Prior to the run (pre-run), participants underwent ultrasound imaging of the PF to measure thickness and stiffness. Following the completion of the 30 min run, participants underwent ultrasound imaging at three additional timepoints (post-run, 15 min post-run, and 30 min post-run). The transition between the run and the post-run ultrasound imaging took approximately one minute for each participant. Previous literature has repeatedly found no significant differences in PF thickness and stiffness between limbs in asymptomatic individuals [7,20,21,22]. Therefore, all ultrasound imaging was completed on the right foot for each NPF participant, and for each RPF participant who indicated right-foot and bilateral plantar fasciitis. Two RPF participants who indicated left-foot plantar fasciitis had their measurements taken on their left foot.
2.4. Ultrasound Measurements and Analyses
An ultrasound imaging device (Logiq S8; GE Healthcare, Waukesha, WI, USA) was used to assess PF thickness and shear wave velocity (SWV), an indicator of tissue stiffness, with a high-resolution linear array transducer (9L-D, GE; field of view of 43 mm and measurement length of 5.31 × 13.8 mm) at 10 Hz, with a gain of 50 and a depth of 3.5 cm. Ultrasound imaging has been found to be a valid and reliable technique to evaluate both PF thickness and stiffness [7,20,21,22]. All ultrasound measurements were performed by the same experienced examiner, who was not blinded to participant group or measurement timepoint. The use of a single examiner ensured consistent application of the imaging protocol and minimized potential inter-examiner variability. Participants were positioned in a prone position on a treatment table with their lower limbs in full extension and their bare feet hanging over the edge of the table. Participants were verbally instructed to relax their body, specifically their lower extremities, ankles, and feet. An unfixed and unloaded ankle position has been previously described when measuring the PF via ultrasound imaging [7,21], and thus was used in contrast to a fixed, standardized position, which may have resulted in degrees of dorsiflexion eliciting passive stretch to the foot and ankle tissues [23]. In addition, participants were instructed to maintain a relaxed toe position given recommendations for this position to prevent active PF lengthening [24,25]. The proximal site of the PF near the calcaneal tuberosity was marked with a waterproof marker prior to taking measurements [26]. After locating the PF on the ultrasound, markings were placed around the transducer head to ensure the same location for all measurements. Ultrasound gel was applied to the transducer to improve acoustic coupling. The PF was evaluated in a longitudinal orientation.
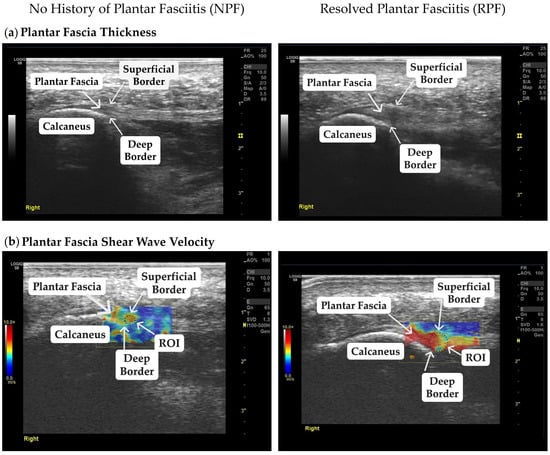
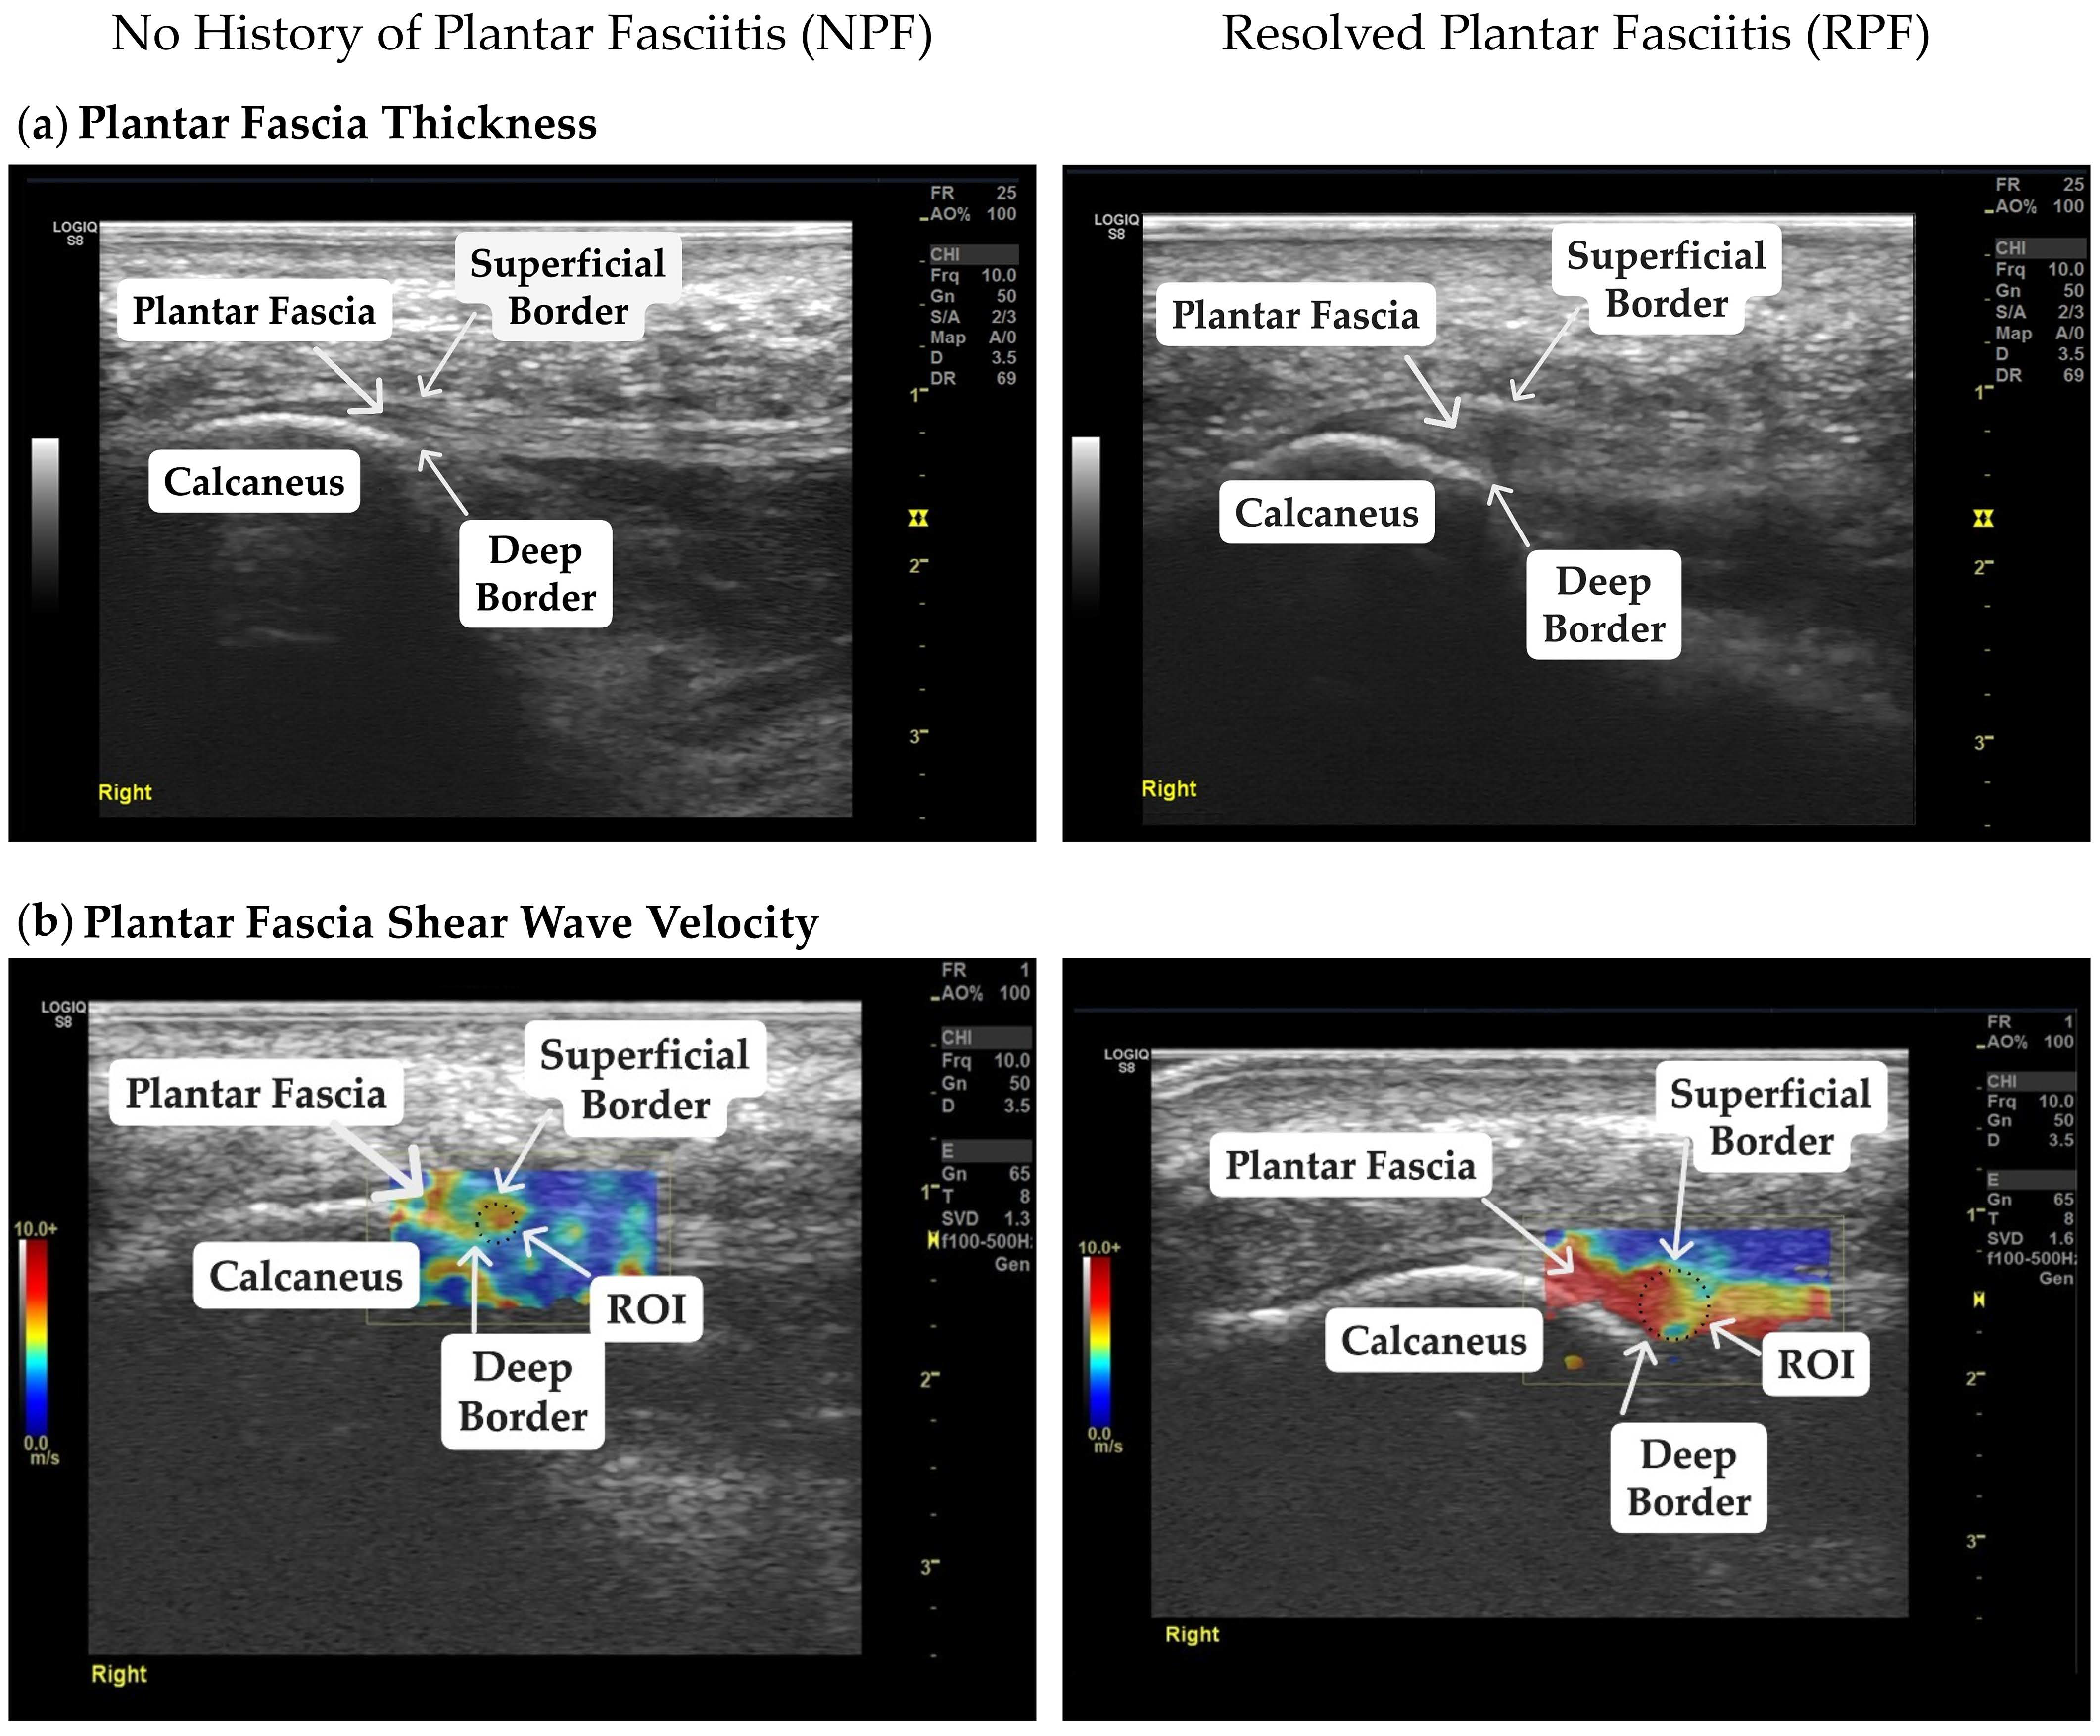
The comprehensive details regarding PF thickness and SWV measurements and image processing methods are based on recently published work [7]. Succinctly, five B-mode images were captured to assess PF thickness for each participant at each timepoint (pre-run, post-run, 15 min post-run, and 30 min post-run). The first and fifth images were excluded from the analysis, as initial transducer placement and subsequent transducer removal may carry potential acquisition artifacts. Thus, the second, third, and fourth images per participant and per timepoint were examined, and their respective mean values were used for statistical analysis. To measure PF thickness, the distance between the deep and superficial borders at the calcaneal origin was measured in millimeters (mm) using the integrated ultrasound measurement functionality (Figure 1a).
Figure 1.
Representative images of B-mode and shear wave elastography for a participant with no history of plantar fasciitis (NPF) and a participant with resolved plantar fasciitis (RPF) at the pre-run measurement. Annotations in the images identify the plantar fascia (PF), the superficial and deep borders to measure PF thickness, and the calcaneus used as the anatomical landmark. (a) Plantar fascia thickness of one NPF and one RPF participant. (b) Plantar fascia shear wave velocity, an indicator of stiffness, of one NPF and one RPF participant. The region of interest (ROI) displays the area of analysis within the deep and superficial PF borders. The color pattern represents shear wave velocity in meters per second (m/s). The color scale ranges from 0.0 to 10.0 m/s. Greater shear wave velocity (indicating stiffer tissue) is represented by red coloration, and lower shear wave velocity (indicating less stiff tissue) is represented by blue coloration.
To estimate PF stiffness, shear wave elastography was used (elastography color map gain of 65%, shear wave detection sensitivity of 1.5, smoothing of 8, and shear wave frequency detection bandwidth between 100 and 500 Hz) via the velocity mode of shear wave propagation in m/s. Shear wave elastography has previously shown satisfactory reliability for assessing PF stiffness [27,28,29]. Quantification of SWV was done by placing a circular region of interest (ROI) within the deep and superficial boundaries of the PF directly on the shear wave elastography images, manually avoiding visible boundary artifacts and other adjacent soft tissues (Figure 1b). More specifically, the calcaneal tuberosity functioned as the anatomical landmark to consistently identify the origin of the PF. Manual ROI placement was performed by the same investigator across all measurements. Shear wave elastography images with a high rejection rate were excluded from the analysis. To analyze PF SWV, five shear wave elastography images of the PF were collected, and the mean SWV of the second, third, and fourth acquired images was used for statistical analysis.
2.5. Statistical Analysis
The present study employed a mixed-design repeated-measures approach, with group (RPF and NPF) as the between-subjects factor and timepoint (pre-run, post-run, 15 min post-run, and 30 min post-run) as the within-subjects factor. Data are presented as means ± standard deviations. Within-session intra-rater reliability of PF thickness and SWV measurements was assessed using the three analyzed pre-run images from each participant. Reliability of the measurement means was evaluated using two-way mixed-effects, absolute-agreement, average-measures intraclass correlation coefficient analyses (ICC [3,k]), using the three pre-run measurements per participant. The standard error of measurement (SEM) was calculated as , where SD represents the standard deviation of the pre-run participant means. The minimal detectable change at the 95% confidence level (MDC95) was subsequently calculated as . The resulting MDC95 was used to quantify the minimum change in PF thickness required to exceed measurement error. For the primary purpose, B-mode and shear wave elastography data were analyzed by separate mixed-model (2-group × 4-timepoint) repeated-measures analyses of variance (ANOVA) to evaluate the effects of injury history (NPF, RPF) and timepoint (pre-run, post-run, 15 min post-run, and 30 min post-run) on PF thickness and SWV and a potential interaction between these factors. The assumptions of homogeneity of variance and sphericity were assessed using Levene’s and Mauchly’s tests, respectively. Levene’s tests indicated no significant differences in error variance between groups at any measurement timepoint for PF thickness (all p > 0.05). Similarly, no significant differences were observed for SWV at pre-run, post-run, or 15 min post-run (all p > 0.05). However, a significant difference in error variance was observed for SWV at 30 min post-run (p = 0.006). Mauchly’s tests indicated no significant violations of sphericity for either outcome (p = 0.390 and p = 0.772); therefore, no corrections for sphericity were applied. Statistically significant main effects were further investigated using Bonferroni-adjusted post hoc pairwise comparisons. Confidence intervals for pairwise comparisons were derived from estimated marginal mean differences, averaged equally across groups and adjusted for multiple comparisons using the Bonferroni method. Effect sizes were calculated as partial eta-squared () for the ANOVA and Cohen’s d (0.2 = small, 0.5 = medium, 0.8 = large) [30] for the post hoc analyses. Partial eta-squared was calculated as the ratio of the effect sum of squares to the sum of the effect and error sums of squares. For pairwise comparisons between timepoints, Cohen’s d was calculated using the dav approach, defined as the mean difference between two repeated measurements divided by the arithmetic mean of their standard deviations [30]. This approach was selected to quantify the magnitude of differences independently of the correlation between repeated measurements. For between-group comparisons, Cohen’s d was calculated using the difference between group means divided by the pooled standard deviation, accounting for the respective sample sizes of the two independent groups. Group means and standard deviations were calculated from each participant’s average across the four measurement timepoints. Running velocity was not used as a covariate for the present analyses, as there was no difference (p = 0.542) in velocity between the RPF group (3.14 m/s ± 0.49) and the NPF group (3.25 m/s ± 0.36). For all analyses, the a priori alpha level was set to 0.05. Statistical analyses were performed using IBM SPSS Statistics v.28.
3. Results
Within-session intra-rater reliability of PF thickness and SWV (i.e., stiffness) measurements was excellent, with an average-measures intraclass correlation coefficient (ICC [3,k]) of 0.98 and 0.96, respectively. The SEM was 0.07 mm for thickness and 0.10 m/s for SWV, corresponding to a MDC95 of 0.20 mm and 0.31 m/s, respectively.
3.1. Plantar Fascia Thickness
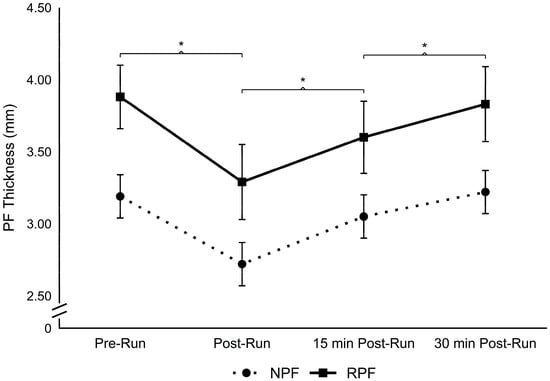
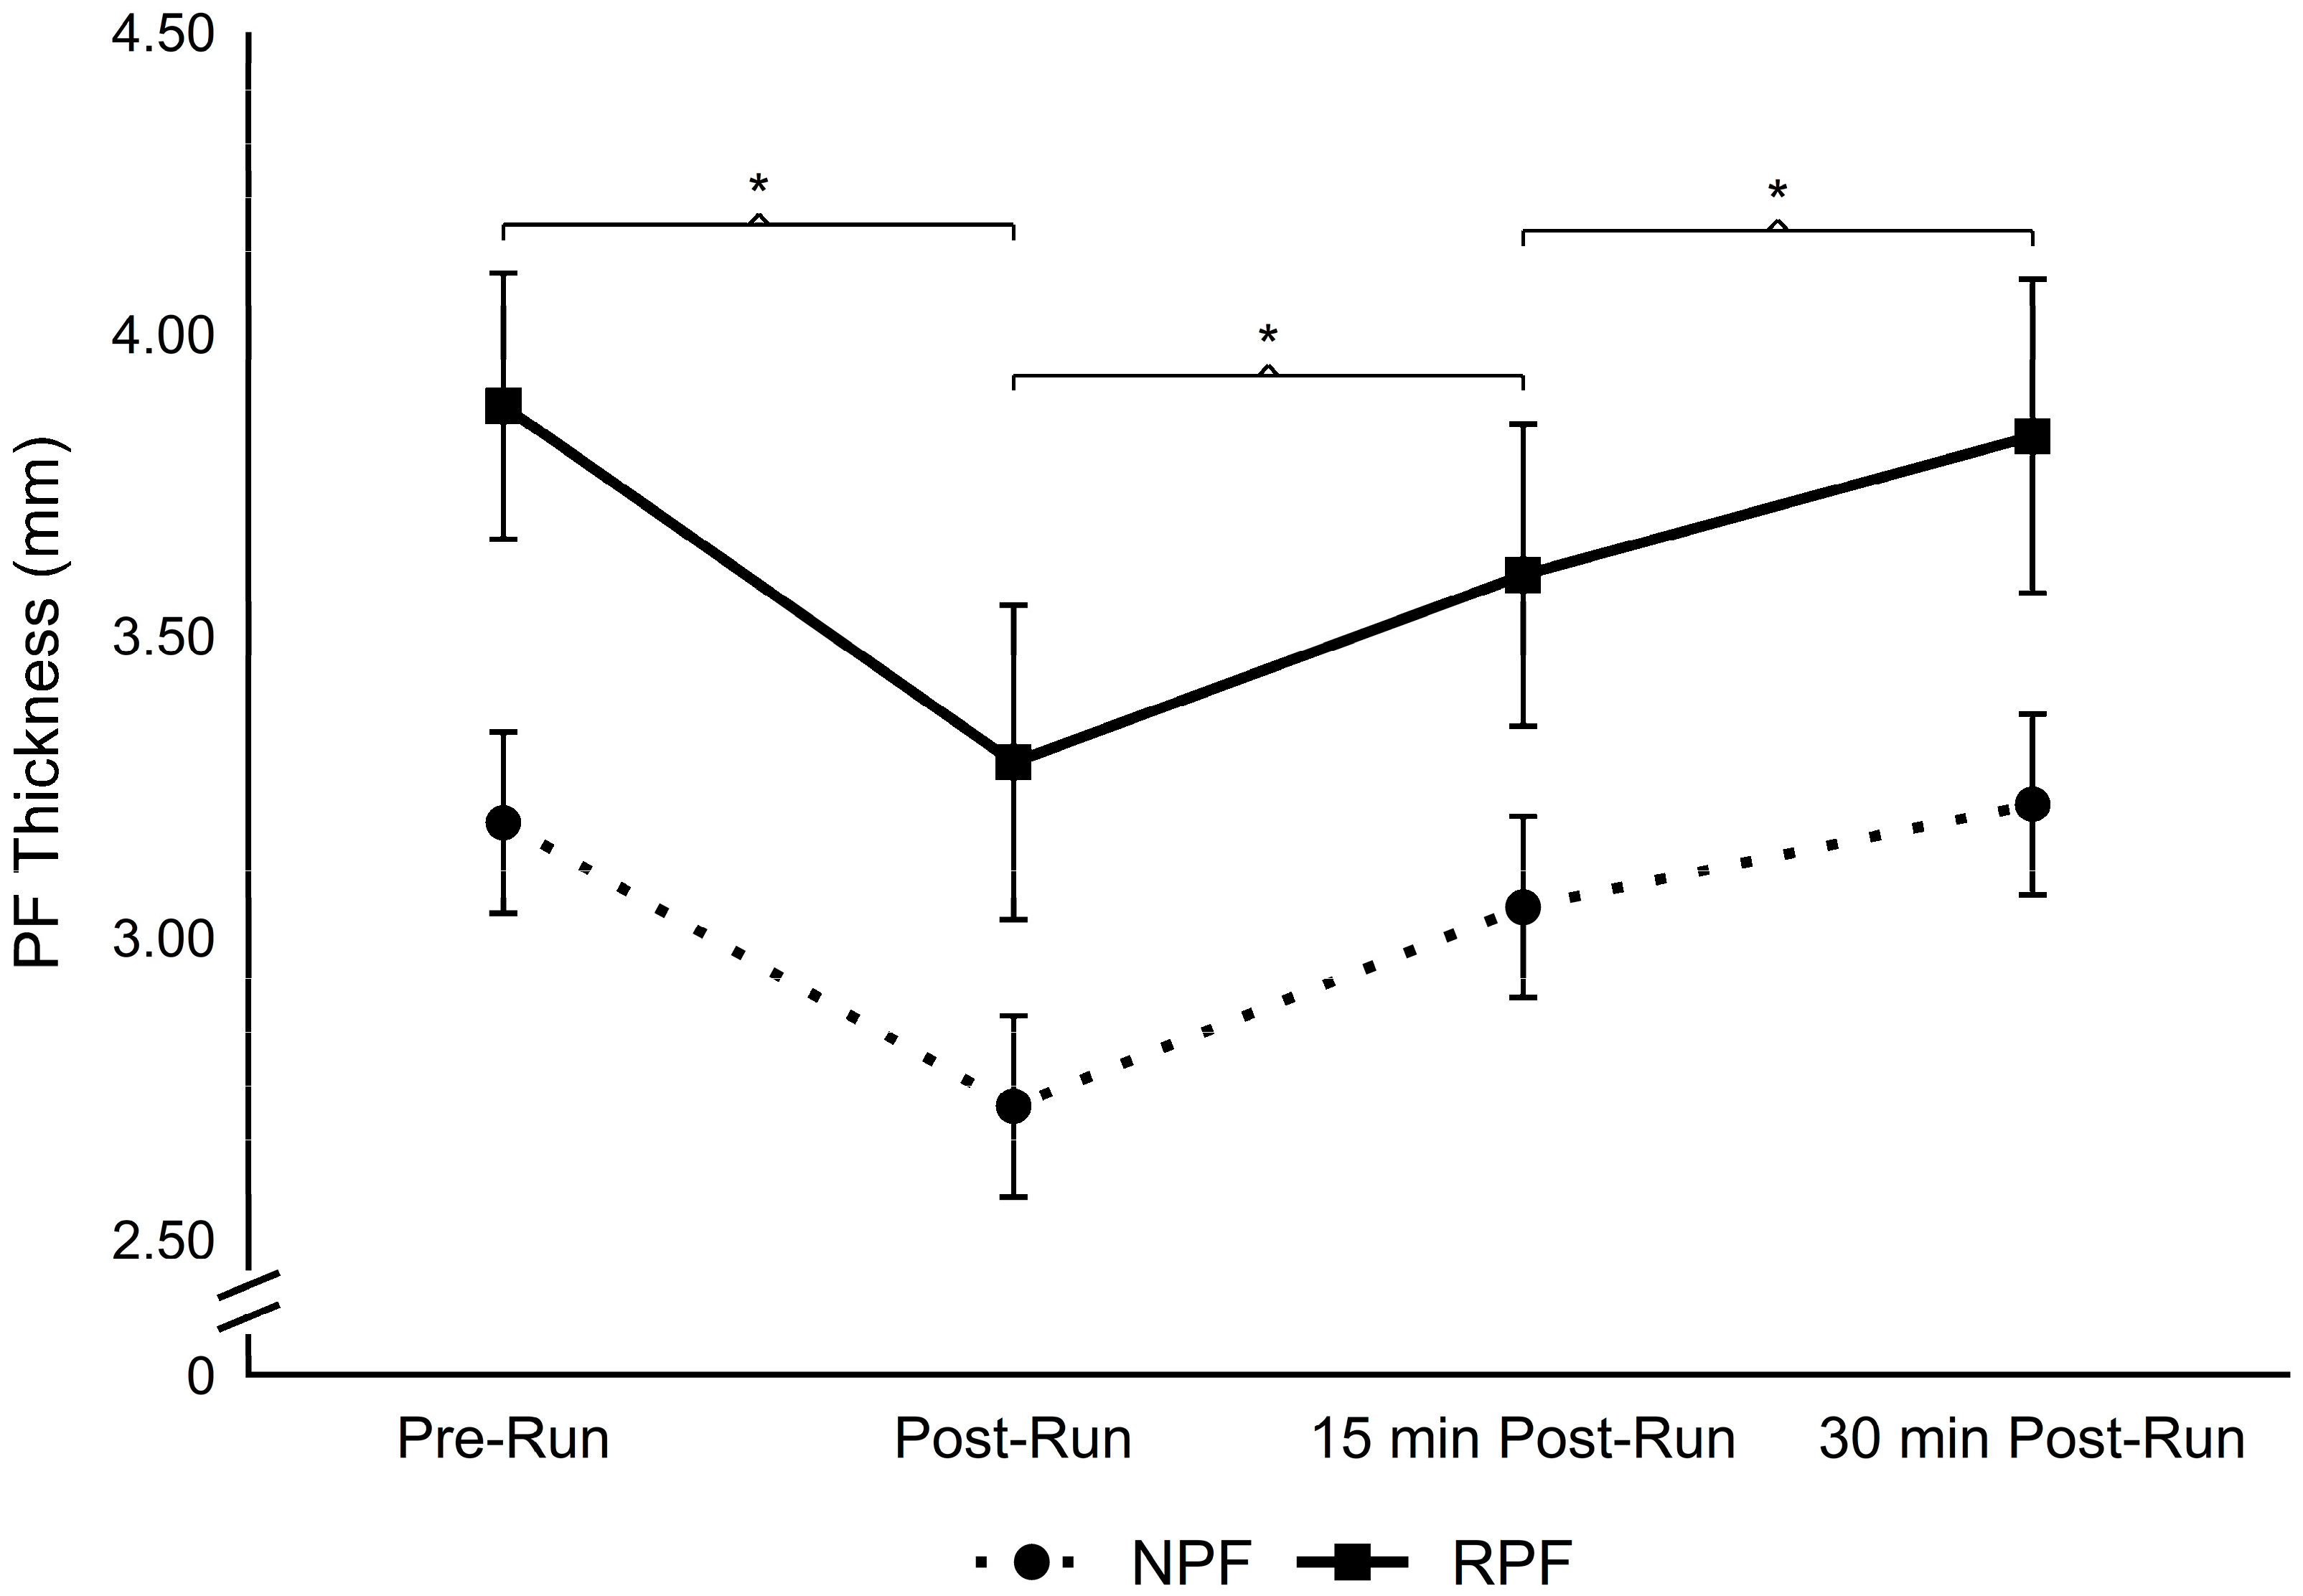
No significant interaction was found for PF thickness between groups and timepoints (F(3, 54) = 0.651, p = 0.586, = 0.035). However, there was a significant main effect of timepoints across the four measurements (pre-run, post-run, 15 min post-run, and 30 min post-run) (F(3, 54) = 77.277, p < 0.001, = 0.811). Regardless of group, post hoc comparisons revealed that thickness decreased from pre-run to post-run (p < 0.001; 3.53 ± 0.64 mm to 3.01 ± 0.65 mm, 95% CI [0.37, 0.66]; dav = 0.81), increased from post-run to 15 min post-run (p < 0.001; 3.01 ± 0.65 mm to 3.29 ± 0.66 mm, 95% CI [0.17, 0.40]; dav = 0.43), and increased from 15 min post-run to 30 min post-run (p < 0.001; 3.29 ± 0.66 mm to 3.51 ± 0.65 mm, 95% CI [0.15, 0.35]; dav = 0.34). There was no difference in PF thickness between pre-run and 30 min-post-run measurements (p = 1.000; 3.53 ± 0.64 mm to 3.51 ± 0.65 mm, 95% CI [−0.09, 0.12]; dav = 0.04) (Figure 2). There was also a significant main effect of group for PF thickness between the RPF and NPF groups (F(1, 18) = 5.241, p = 0.034, = 0.226), with a greater PF thickness in the RPF group compared to the NPF group (3.65 ± 0.68 mm vs. 3.04 ± 0.50 mm, 95% CI [0.05, 1.17]; d = 1.06) (Figure 2).
Figure 2.
Plantar fascia (PF) thickness (mm) across four measurement timepoints in participants with no history of plantar fasciitis (NPF) and resolved plantar fasciitis (RPF). Data are presented as means ± standard error of the mean (SEM). * Denotes a significant difference between adjacent timepoints, averaged across groups (Bonferroni-adjusted p < 0.05). A significant main effect of group was observed (p = 0.034), with greater overall PF thickness in the RPF group.
3.2. Shear Wave Velocity
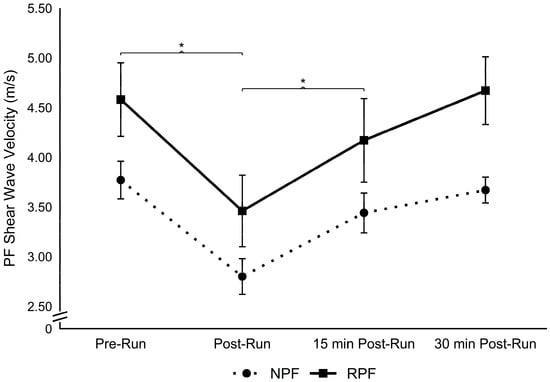
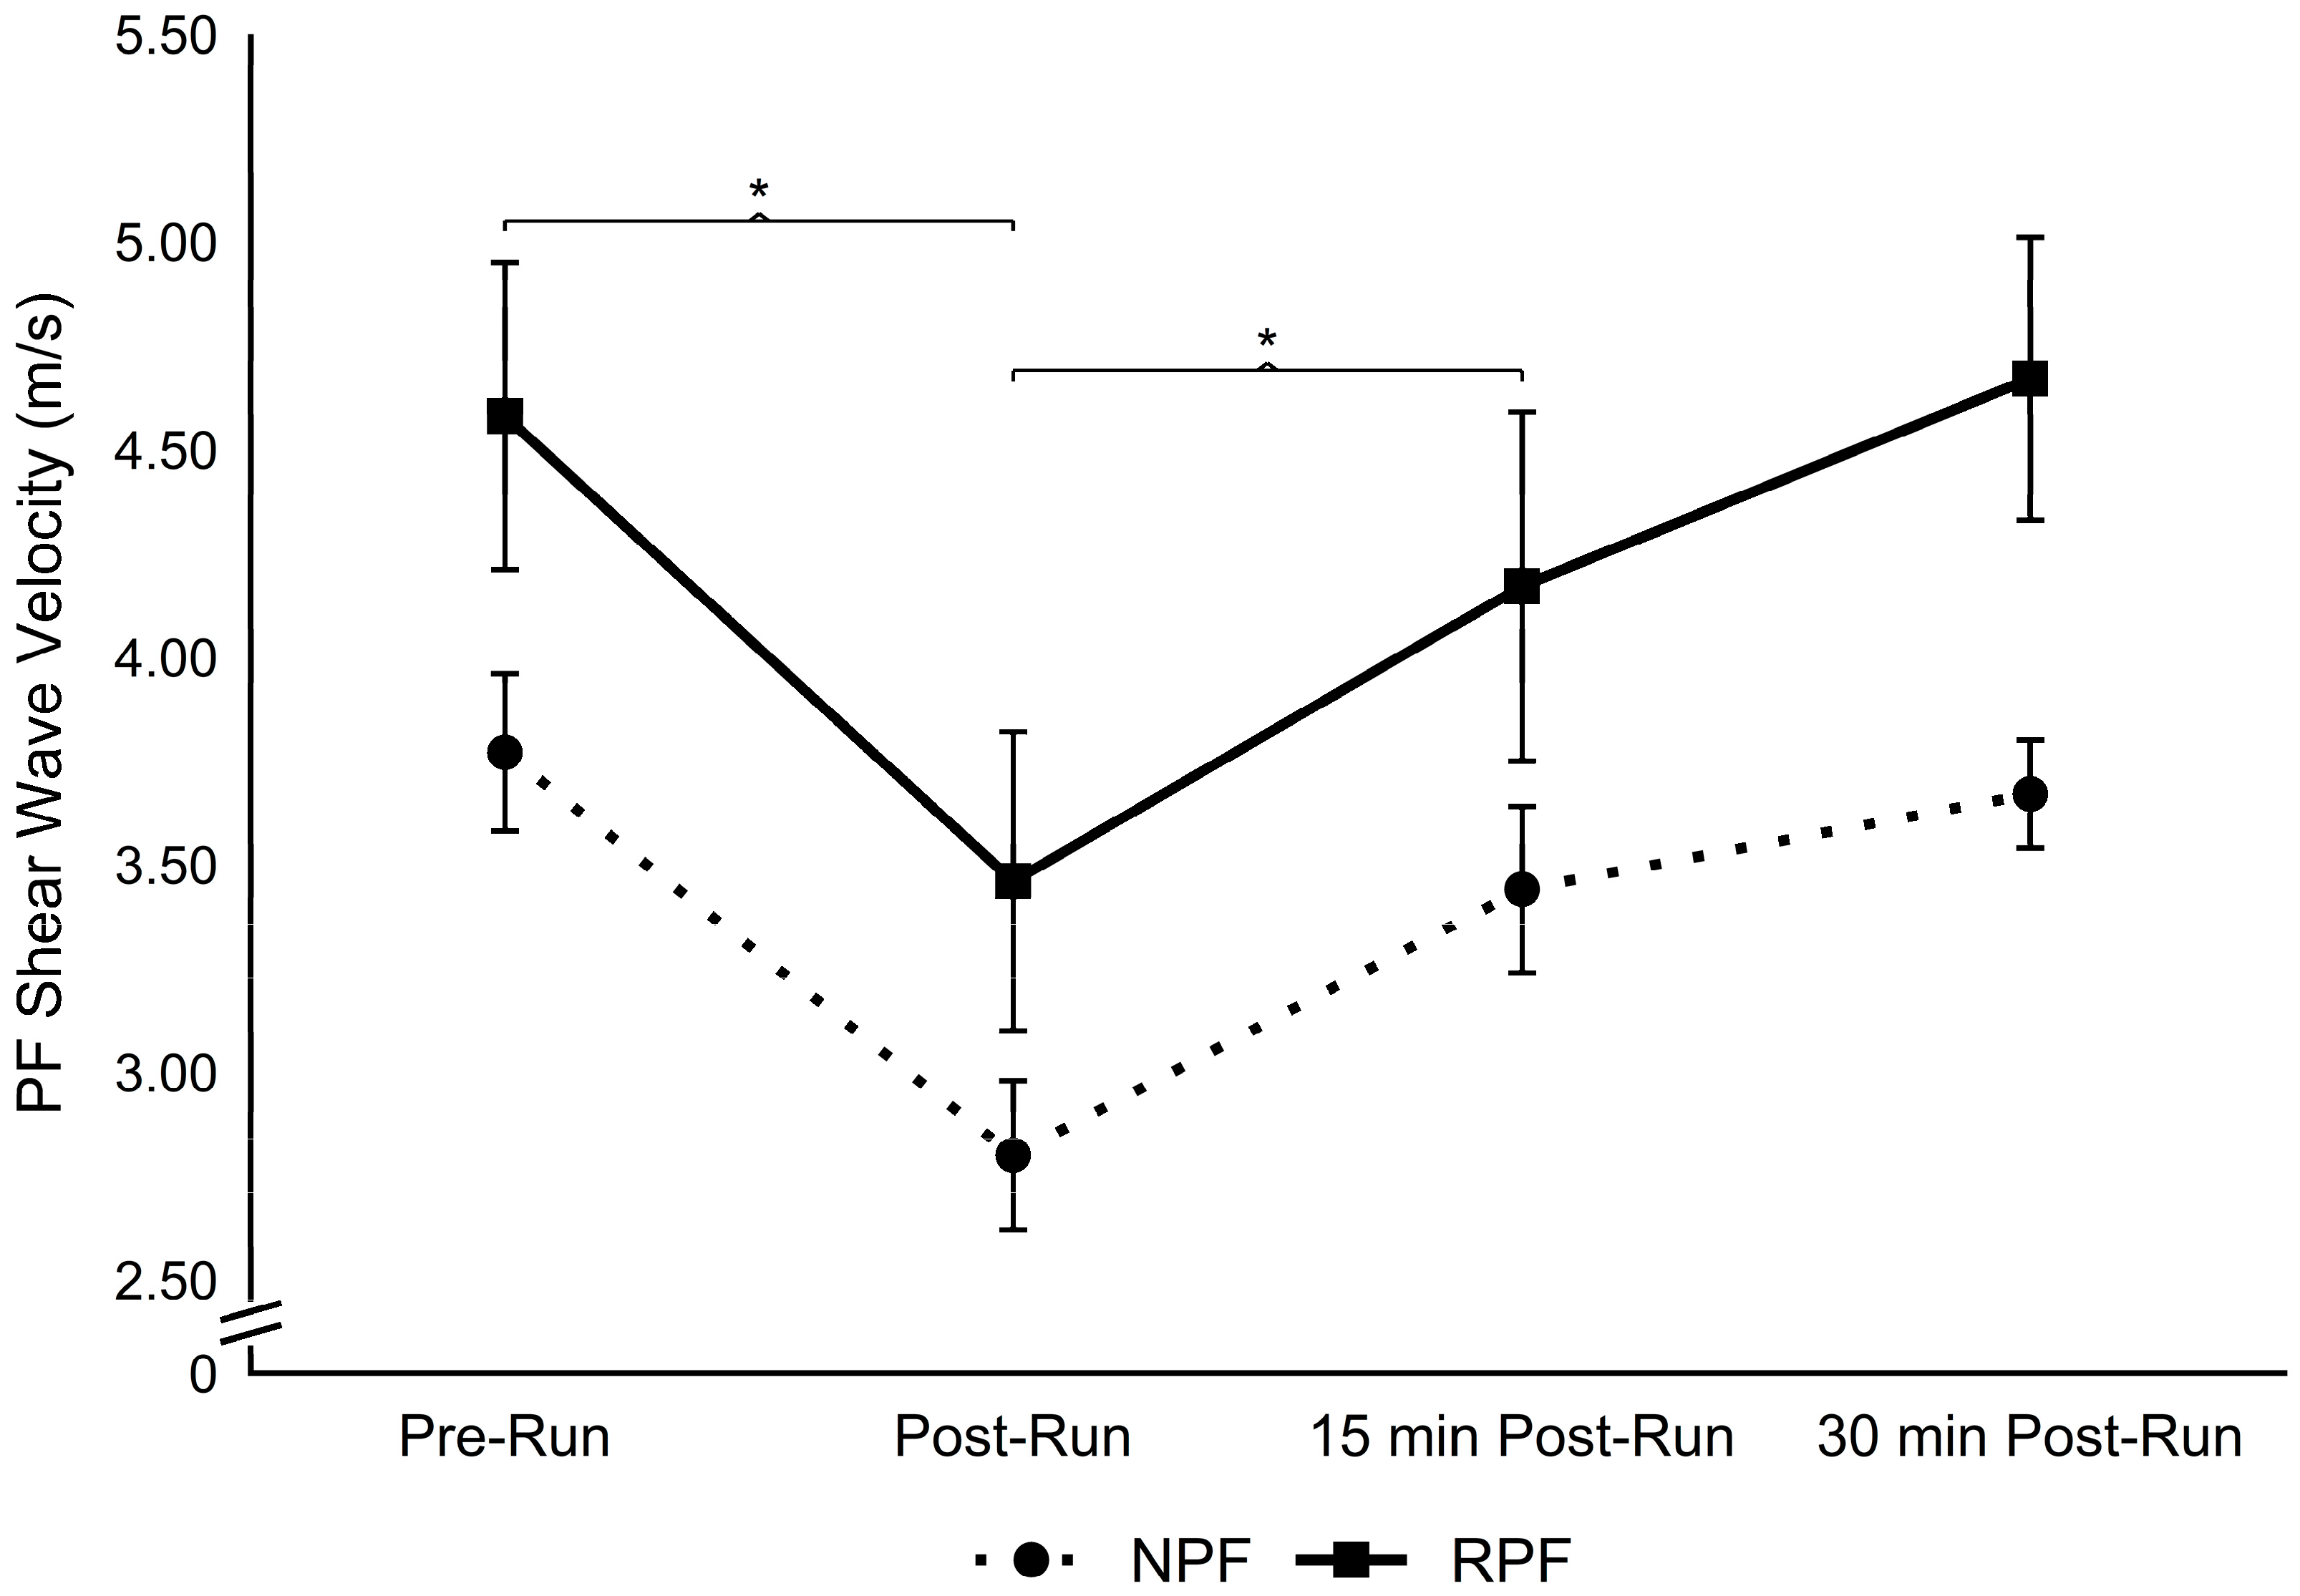
No significant interaction effect was found for PF SWV between groups and timepoints (F(3, 54) = 0.634, p = 0.597, = 0.034). However, there was a significant main effect of timepoints for PF SWV across the four measurements (pre-run, post-run, 15 min post-run, and 30 min post-run) (F(3, 54) = 27.171, p < 0.001, = 0.602). Regardless of group, post hoc comparisons revealed that PF SWV decreased from pre-run to post-run (p < 0.001; 4.12 ± 0.90 m/s to 3.13 ± 0.85 m/s, 95% CI [0.71, 1.39]; dav = 1.13) and increased from post-run to 15 min post-run (p < 0.001; 3.13 ± 0.85 m/s to 3.79 ± 0.95 m/s, 95% CI [0.28, 1.04]; dav = 0.74). No difference in PF SWV was found from pre-run to 15 min post-run (p = 0.091; 4.12 ± 0.90 m/s to 3.79 ± 0.95 m/s, 95% CI [−0.04, 0.82]; dav = 0.36), from 15 min post-run to 30 min post-run (p = 0.057; 3.79 ± 0.95 m/s to 4.24 ± 0.82 m/s, 95% CI [−0.01, 0.74]; dav = 0.51), and from pre-run to 30 min post-run (p = 1.000; 4.12 ± 0.90 m/s to 4.24 ± 0.82 m/s, 95% CI [−0.38, 0.43]; dav = 0.14) (Figure 3). There was also a significant main effect of group for PF SWV between the RPF and NPF groups (F(1, 18) = 5.293, p = 0.034, = 0.227), with a greater PF SWV in the RPF group compared to the NPF group (4.19 ± 0.96 m/s vs. 3.43 ± 0.53 m/s, 95% CI [0.07, 1.46]; d = 1.04) (Figure 3).
Figure 3.
Plantar fascia (PF) shear wave velocity (SWV; m/s), an indicator of tissue stiffness, across four measurement timepoints in participants with no history of plantar fasciitis (NPF) and resolved plantar fasciitis (RPF). Data are presented as means ± standard error of the mean (SEM). * Denotes a significant difference between adjacent timepoints, averaged across groups (Bonferroni-adjusted p < 0.05). A significant main effect of group was observed (p = 0.034), with greater overall PF SWV in the RPF group.
4. Discussion
The purpose of the present study was to investigate the effects of a submaximal treadmill run on PF thickness and stiffness (as estimated by shear wave velocity) in individuals with RPF. To our knowledge, this is the first study to evaluate PF tissue response to running in individuals with RPF. The primary finding was a significant decrease in PF thickness and SWV from pre-run to post-run measurements, regardless of group. The decrease in PF thickness and stiffness from pre-run to post-run measurements partially aligns with the primary hypothesis. It was hypothesized that thickness and stiffness would decrease in the NPF group only, based upon the assumption that RPF would alter the tissue’s viscoelastic response to running. Additionally, as hypothesized, RPF individuals displayed a significantly thicker and stiffer PF compared to the NPF individuals, suggesting that differences in PF morphology and stiffness-related properties may persist following symptom resolution.
The decrease in PF thickness and SWV in NPF individuals after the submaximal 30 min run was expected [7,8]. Notably, the mean pre-run-to-post-run decreases in PF thickness (0.52 mm) and SWV (0.99 m/s) exceeded their respective MDC95 values of 0.20 mm and 0.31 m/s, indicating that these changes were greater than expected measurement error. The subsequent recovery in both outcomes also exceeded the respective MDC95 thresholds during the early recovery period. By 30 min post-run, however, PF thickness and SWV differed from pre-run values by only 0.02 mm and 0.12 m/s, respectively, both of which were below the MDC95. These findings support an acute change in PF thickness and SWV following running, with both measures approaching their respective pre-run values during the recovery period. This response aligns with previous research [7,8] and with the general biomechanical behavior of soft tissues following the application and removal of mechanical load.
The submaximal 30 min run applied repetitive mechanical loading to the tissue, inducing deformation of the PF via tissue creep. As a result, both groups demonstrated reductions in PF thickness and SWV after submaximal treadmill running, followed by increases during the recovery period. However, the nonsignificant group × timepoint interaction does not establish equivalent responses to mechanical loading between groups. Nevertheless, the observed temporal patterns suggest that both groups exhibited a similar general response to submaximal running. The greater overall PF thickness and SWV observed in RPF individuals suggest that differences in tissue morphology and stiffness-related properties may persist after symptom resolution. Yet, as this is a retrospective study, tissue behavior of the RPF group prior to their injury history was not determined.
The hypothesis that the two groups would respond differently to mechanical loading was based on the possibility of post-injury scar tissue accumulation, which can alter tissue behavior by changing its composition and mechanical properties [9]. Scar tissue has been shown to exhibit stiffer behavior and reduced capacity to dissipate energy through viscoelastic mechanisms [9]. The greater PF thickness and SWV observed in RPF individuals across all timepoints may reflect underlying differences in tissue composition or remodeling following injury. Scar tissue accumulation represents one possible explanation; however, tissue composition was not directly assessed in the present study. Nonetheless, the observed patterns of change in PF thickness and SWV following running and during recovery appeared similar between groups, despite differences in their overall tissue properties. Potential explanations include tissue remodeling and adaptation to mechanical loading, although the extent to which previous rehabilitation and recovery processes contributed to the observed responses remains unknown [31]. Though the absence of a significant group × timepoint interaction does not establish that the mechanical responses of previously injured tissue are equivalent to those without a history of injury, the greater PF thickness and SWV in the RPF group may still have implications for tissue function and overall mechanical performance. Future research should address potential differences in mechanical performance of the PF in a resolved state by assessing load distribution, energy storage and return mechanisms, multi-segmental foot kinematics in comparison to healthy individuals, or susceptibility to future injury.
In this study, individuals with RPF had significantly greater PF thickness and SWV compared to those who have never experienced plantar fasciitis. PF thickness has been widely used as a clinical factor to diagnose plantar fasciitis [1,2]. Individuals with ongoing plantar fasciitis generally exhibit significantly greater PF thickness than their healthy counterparts [26,32]. In the present study, the mean pre-run PF thickness of the RPF group was 3.86 ± 0.63 mm, falling just below 4 mm, a commonly cited diagnostic threshold for plantar fasciitis [33]. However, this threshold may vary depending on the measurement technique and population and cannot therefore be considered as a benchmark for tissue repair. Furthermore, because PF thickness was not assessed during a symptomatic phase, the extent of structural recovery following symptom resolution cannot be determined, though evidence shows a decrease in thickness over time after various treatment methods in plantar fasciitis cases [34,35,36]. Regarding PF SWV as an indicator of stiffness, the present findings showed a significantly stiffer PF in RPF individuals compared to their healthy counterparts, despite previous evidence of reduced PF stiffness in individuals with symptomatic plantar fasciitis [4,5]. This discrepancy may reflect different stages of the injury and recovery process. During the symptomatic phase, degenerative tissue changes and altered collagen organization may reduce the tissue’s mechanical stiffness [4,5]. As healing progresses, however, tissue remodeling and fibrosis may increase stiffness through collagen reorganization and scar tissue formation [9]. However, these mechanisms remain speculative, as tissue composition was not directly assessed. The temporal progression of PF properties throughout injury and recovery remains unclear and may be influenced by injury severity, rehabilitation strategies, and individual healing capacity. Consequently, longitudinal investigations are needed to determine whether changes in PF shear wave velocity may serve as a clinically meaningful indicator of tissue recovery, rehabilitation progress, or readiness to return to sport.
Thus, the observed differences in PF thickness and SWV between the RPF and NPF groups may have implications for rehabilitation and recovery programs and return-to-sport criteria of individuals with plantar fasciitis. While previous studies have demonstrated that PF thickness decreases following successful treatment [34,35,36], the present findings suggest that tissue thickness may remain elevated even after symptom resolution. Therefore, PF thickness alone may not fully reflect tissue recovery or readiness to return to activity. The greater stiffness observed in the RPF group despite the absence of symptoms raises questions regarding the relationship between symptom resolution and underlying tissue properties. However, the clinical significance of these findings remains uncertain, and greater stiffness should not necessarily be interpreted as evidence of restored mechanical integrity or successful tissue healing. Future prospective studies are needed to determine whether changes in PF stiffness throughout rehabilitation are associated with functional recovery and readiness to return to physical activity. Currently, the clinical implementation of stiffness assessment is limited by the availability and cost of elastography-based imaging systems. Clinical research should therefore investigate whether more accessible measures, such as manual examination techniques or superficial tissue characteristics, can serve as surrogate indicators of PF stiffness during rehabilitation. Future research should also investigate how different rehabilitation and training interventions influence PF thickness and stiffness as injury subsides, and whether changes in these properties are associated with functional recovery or subsequent injury risk.
The findings of the present study should be interpreted with several limitations and delimitations in mind. First, the ultrasound examiner was not blinded to participant group or measurement timepoint, introducing the possibility of observer bias despite standardized measurement procedures. Although participants were instructed to maintain a relaxed and unloaded ankle position, the ankle angle was not mechanically standardized, potentially introducing variability in passive tissue tension and SWV measurements. Furthermore, reliability was assessed within a single session, and between-session reproducibility was not established. Additionally, the assumption of homogeneity of variance was violated for SWV at the 30 min-post-run measurement (Levene’s test, p = 0.006). Given the unequal group sizes, this violation may affect the robustness of the statistical findings and should be considered when interpreting the results.
Another limitation concerns the interpretation of tissue properties following symptom resolution. Functional tissue integrity, longitudinal healing progression, and subsequent injury risk were not assessed. Therefore, the observed differences in PF thickness and stiffness should not be interpreted as direct evidence of tissue healing, restored mechanical function, or susceptibility to reinjury. Additionally, information regarding PF tissue properties before or during plantar fasciitis was unavailable, and a group with current symptomatic plantar fasciitis was not included. Therefore, it cannot be concluded that plantar fasciitis directly caused the long-term differences in PF thickness and stiffness observed after symptom resolution.
The retrospective classification of RPF relied on participant-reported injury history, and heterogeneity existed within this group. The time from initial symptom onset varied considerably, and participants differed in unilateral or bilateral involvement. Furthermore, previous diagnoses and their clinical justifications, treatment approaches, and the precise time since symptom resolution were not systematically documented, limiting the clinical characterization of the RPF group. These differences may reflect varying stages of tissue remodeling and recovery, potentially influencing plantar fascia thickness and shear wave velocity. The unequal sex distribution between groups (RPF: 4 females, 4 males; NPF: 2 females, 10 males) may have also contributed to the observed differences.
An additional limitation involves the determination of running intensity. Five participants (two RPF and three NPF) did not reach VT2 during the GXT. As the alternative approach to prescribing running intensity may not represent an equivalent relative exercise intensity, differences in the mechanical and physiological demands of the running protocol may have influenced the magnitude of the observed PF thickness and SWV responses. However, these participants were distributed across both groups, and no significant between-group difference in running velocity was observed. Nevertheless, potential variation in relative exercise intensity cannot be excluded and should be considered when interpreting the findings.
Lastly, though the sample size was estimated using a power analysis targeting the group × timepoint interaction, the study may have been insufficiently powered to detect smaller interaction effects. Therefore, the absence of a significant interaction should not be interpreted as evidence of equivalent temporal responses between groups.
5. Conclusions
The present study is the first to investigate the response of PF thickness and stiffness to submaximal treadmill running in individuals with resolved plantar fasciitis. The findings suggest that a history of plantar fasciitis may be associated with persistent differences in PF morphology and stiffness-related properties, as demonstrated by the greater PF thickness and SWV observed in the RPF group. Although the general temporal patterns of PF thickness and SWV appeared similar between groups, no significant group × timepoint interaction was observed. These findings suggest that while previous plantar fasciitis may be associated with persistent differences in overall tissue properties, the PF appears to exhibit a similar general pattern of response to submaximal running following symptom resolution. The observed differences in PF properties may have potential implications for monitoring tissue recovery, informing rehabilitation strategies, and guiding return-to-sport decisions following plantar fasciitis, although further research is needed to establish their clinical relevance. Future longitudinal studies are needed to characterize changes in PF mechanical properties throughout injury and recovery and to determine whether restoring PF stiffness improves functional outcomes and running biomechanics while reducing the risk of recurrent injury.
Author Contributions
All authors of the present manuscript contributed considerably to the work. The individual contributions are as follows: Conceptualization, L.K. and J.P.B.; methodology, L.K. and J.P.B.; formal analysis, L.K.; investigation, L.K.; resources, J.P.B.; data curation, L.K.; writing—original draft preparation, L.K.; writing—review and editing, N.R.S., D.C., L.W.L., A.F. and J.P.B.; visualization, L.K.; supervision, J.P.B. All authors have read and agreed to the published version of the manuscript.
Funding
This research received no external funding.
Institutional Review Board Statement
This study was conducted in accordance with the Declaration of Helsinki and approved by the Institutional Review Board of the University of Idaho (22-162, 2 November 2022).
Informed Consent Statement
Informed consent was obtained from all subjects involved in the study.
Data Availability Statement
The data sets generated and/or analyzed during the current study are available from the corresponding author on reasonable request.
Acknowledgments
This manuscript is based in part on research presented in the doctoral dissertation of Lukas Daniel Dominik Krumpl, entitled The Exploration of Morphological and Mechanical Properties of the Plantar Fascia in Response to Imposed Running Demands, submitted to the University of Idaho, Moscow, Idaho, United States, in May 2023. The dissertation is publicly available through ProQuest and the University of Idaho’s institutional repository.
Conflicts of Interest
The authors declare no conflicts of interest.
Abbreviations
The following abbreviations are used in this manuscript:
| PF | Plantar fascia |
| RPF | Resolved plantar fasciitis |
| NPF | No plantar fasciitis |
| NSAID | Non-steroidal anti-inflammatory drugs |
| GXT | Graded exercise test |
| VT2 | Ventilatory threshold 2 |
| SWV | Shear wave velocity |
| ROI | Region of interest |
References
- Buchbinder, R. Plantar fasciitis. N. Engl. J. Med. 2004, 350, 2159–2166. [Google Scholar] [CrossRef] [Scilit] [PubMed]
- Stecco, C.; Corradin, M.; Macchi, V.; Morra, A.; Porzionato, A.; Biz, C.; De Caro, R. Plantar fascia anatomy and its relationship with the Achilles tendon and paratenon. J. Anat. 2013, 223, 665–676. [Google Scholar] [CrossRef] [Scilit] [PubMed]
- Frost, H.M. Skeletal structural adaptations to mechanical usage (SATMU): 4. Mechanical influences on intact fibrous tissues. Anat. Rec. 1990, 226, 433–439. [Google Scholar] [CrossRef] [Scilit] [PubMed]
- Baur, D.; Schwabl, C.; Kremser, C.; Taljanovic, M.S.; Widmann, G.; Sconfienza, L.M.; Sztankay, J.; Feuchtner, G.; Klauser, A.S. Shear wave elastography of the plantar fascia: Comparison between patients with plantar fasciitis and healthy control subjects. J. Clin. Med. 2021, 10, 2351. [Google Scholar] [CrossRef] [Scilit] [PubMed]
- Welk, A.B.; Haun, D.W.; Clark, T.B.; Kettner, N.W. Use of high-resolution ultrasound to measure changes in plantar fascia thickness resulting from tissue creep in runners and walkers. J. Manip. Physiol. Ther. 2015, 38, 81–85. [Google Scholar] [CrossRef] [Scilit] [PubMed]
- Goff, J.D.; Crawford, R. Diagnosis and treatment of plantar fasciitis. Am. Fam. Physician 2011, 84, 676–682. [Google Scholar] [PubMed]
- Krumpl, L.; Schiele, N.R.; Cannavan, D.; Larkins, L.W.; Brown, A.F.; Bailey, J.P. Acute effects of high-intensity interval running on plantar fascia thickness and stiffness in healthy adults. J. Appl. Biomech. 2025, 41, 413–417. [Google Scholar] [CrossRef] [Scilit] [PubMed]
- Shiotani, H.; Mizokuchi, T.; Yamashita, R.; Naito, M.; Kawakami, Y. Acute effects of long-distance running on mechanical and morphological properties of the human plantar fascia. Scand. J. Med. Sci. Sports 2020, 30, 1360–1368. [Google Scholar] [CrossRef] [Scilit] [PubMed]
- Grant, C.A.; Twigg, P.C.; Tobin, D.J. Static and dynamic nanomechanical properties of human skin tissue using atomic force microscopy: Effect of scarring in the upper dermis. Acta Biomater. 2012, 8, 4123–4129. [Google Scholar] [CrossRef] [Scilit] [PubMed]
- Corr, D.T.; Gallant-Behm, C.L.; Shrive, N.G.; Hart, D.A. Biomechanical behavior of scar tissue and uninjured skin in a porcine model. Wound Repair Regen. 2009, 17, 250–259. [Google Scholar] [CrossRef] [Scilit] [PubMed]
- Corr, D.T.; Hart, D.A. Biomechanics of scar tissue and uninjured skin. Adv. Wound Care 2013, 2, 37–43. [Google Scholar] [CrossRef] [Scilit] [PubMed]
- Ud-Din, S.; Foden, P.; Stocking, K.; Mazhari, M.; Al-Habba, S.; Baguneid, M.; McGeorge, D.; Bayat, A. Objective assessment of dermal fibrosis in cutaneous scarring, using optical coherence tomography, high-frequency ultrasound and immunohistomorphometry of human skin. Br. J. Dermatol. 2019, 181, 722–732. [Google Scholar] [CrossRef] [Scilit] [PubMed]
- Gefen, A. The in vivo elastic properties of the plantar fascia during the contact phase of walking. Foot Ankle Int. 2003, 24, 238–244. [Google Scholar] [CrossRef] [Scilit] [PubMed]
- Kelly, L.A.; Lichtwark, G.; Cresswell, A.G. Active regulation of longitudinal arch compression and recoil during walking and running. J. R. Soc. Interface 2015, 12, 20141076. [Google Scholar] [CrossRef] [Scilit] [PubMed]
- Erdemir, A.; Hamel, A.J.; Fauth, A.R.; Piazza, S.J.; Sharkey, N.A. Dynamic loading of the plantar aponeurosis in walking. J. Bone Jt. Surg. Am. 2004, 86, 546–552. [Google Scholar] [CrossRef] [Scilit] [PubMed]
- Crary, J.L.; Hollis, J.M.; Manoli, A. The effect of plantar fascia release on strain in the spring and long plantar ligaments. Foot Ankle Int. 2003, 24, 245–250. [Google Scholar] [CrossRef] [Scilit] [PubMed]
- Chang, R.; Rodrigues, P.A.; Van Emmerik, R.E.A.; Hamill, J. Multi-segment foot kinematics and ground reaction forces during gait of individuals with plantar fasciitis. J. Biomech. 2014, 47, 2571–2577. [Google Scholar] [CrossRef] [Scilit] [PubMed]
- Wiegand, K.; Tandy, R.; Silvernail, J.F. Plantar fasciitis injury status influences foot mechanics during running. Clin. Biomech. 2022, 97, 105712. [Google Scholar] [CrossRef] [Scilit] [PubMed]
- Elsangedy, H.M.; Krinski, K.; Costa, E.C.; Haile, L.; Fonteles, A.I.; da Silva Timossi, L.; da Silva, S.G. The rating of perceived exertion is not different at the ventilatory threshold in sedentary women with different body mass indices. J. Exerc. Sci. Fit. 2013, 11, 102–106. [Google Scholar] [CrossRef] [Scilit]
- Krumpl, L.; Schiele, N.R.; Cannavan, D.; Larkins, L.W.; Frost, A.; Bailey, J.P. Acute Plantar Fascia Thickness and Stiffness Responses to Three Consecutive Days of 5-Kilometer Running in Healthy Adults. J. Sci. Sport Exerc. 2026. [Google Scholar] [CrossRef] [Scilit]
- Gadalla, N.; Kichouh, M.; Boulet, C.; Machiels, F.; De Mey, J.; De Maeseneer, M. Sonographic evaluation of the plantar fascia in asymptomatic subjects. J. Belg. Soc. Radiol. 2014, 97, 271–273. [Google Scholar] [CrossRef] [Scilit] [PubMed]
- Abul, K.; Ozer, D.; Sakizlioglu, S.S.; Buyuk, A.F.; Kaygusuz, M.A. Detection of normal plantar fascia thickness in adults via the ultrasonographic method. J. Am. Podiatr. Med. Assoc. 2015, 105, 8–13. [Google Scholar] [CrossRef] [Scilit] [PubMed]
- Skovdal Rathleff, M.; Moelgaard, C.; Lykkegaard Olesen, J. Intra- and interobserver reliability of quantitative ultrasound measurement of the plantar fascia. J. Clin. Ultrasound 2011, 39, 128–134. [Google Scholar] [CrossRef] [Scilit] [PubMed]
- Aubry, S.; Nueffer, J.P.; Tanter, M.; Becce, F.; Vidal, C.; Michel, F. Viscoelasticity in Achilles tendonopathy: Quantitative assessment by using real-time shear-wave elastography. Radiol. 2015, 274, 821–829. [Google Scholar] [CrossRef] [Scilit] [PubMed]
- Granado, M.J.; Lohman, E.B., III; Gordon, K.E.; Daher, N.S. Metatarsophalangeal joint extension changes ultrasound measurements for plantar fascia thickness. J. Foot Ankle Res. 2018, 11, 20. [Google Scholar] [CrossRef] [Scilit] [PubMed]
- Jariwala, A.; Bruce, D.; Jain, A. A guide to the recognition and treatment of plantar fasciitis. Prim. Health Care 2011, 21, 22–24. [Google Scholar] [CrossRef] [Scilit]
- Aguilar-Nuñez, D.; Cervera-Garvi, P.; Aguilar-Garcia, M.; Cuevas-Cervera, M.; Gonzalez-Muñoz, A.; Navarro-Ledesma, S. Ultrasound strain elastography reliability in the assessment of the plantar fascia and its relationship with the plantar thickness in healthy adults: An intra and interobserver reliability study in novice evaluators. Biomedicines 2023, 11, 2040. [Google Scholar] [CrossRef] [Scilit] [PubMed]
- Chen, T.L.-W.; Sze, L.K.Y.; Davis, I.S.; Gruber, A.H. Plantar fascia morphology and stiffness differ between runners with rearfoot and forefoot strike patterns. J. Biomech. 2023, 148, 111465. [Google Scholar]
- Drakonaki, E.E.; Allen, G.M.; Wilson, D.J. Real-time elastography of the normal Achilles tendon: Reproducibility and pattern description. Clin. Radiol. 2013, 68, e263–e268. [Google Scholar]
- Lakens, D. Calculating and reporting effect sizes to facilitate cumulative science: A practical primer for t-tests and ANOVAs. Front. Psychol. 2013, 4, 863. [Google Scholar] [CrossRef] [Scilit] [PubMed]
- Hildebrand, K.A.; Gallant-Behm, C.L.; Kydd, A.S.; Hart, D.A. The basics of soft tissue healing and general factors that influence such healing. Sports Med. Arthrosc. Rev. 2005, 13, 136–144. [Google Scholar] [CrossRef] [Scilit]
- Gibbon, W.W.; Long, G. Ultrasound of the plantar aponeurosis (fascia). Skelet. Radiol. 1999, 28, 21–26. [Google Scholar] [CrossRef] [Scilit] [PubMed]
- League, A.C. Current concepts review: Plantar fasciitis. Foot Ankle Int. 2008, 29, 358–366. [Google Scholar] [CrossRef] [Scilit] [PubMed]
- Fabrikant, J.M.; Park, T.S. Plantar fasciitis (fasciosis) treatment outcome study: Plantar fascia thickness measured by ultrasound and correlated with patient self-reported improvement. Foot 2011, 21, 79–83. [Google Scholar] [CrossRef] [Scilit] [PubMed]
- Hansen, L.; Krogh, T.P.; Ellingsen, T.; Bolvig, L.; Fredberg, U. Long-term prognosis of plantar fasciitis: A 5- to 15-year follow-up study of 174 patients with ultrasound examination. Orthop. J. Sports Med. 2018, 6, 2325967118757983. [Google Scholar] [CrossRef] [Scilit] [PubMed]
- Mahowald, S.; Legge, B.S.; Grady, J.F. The correlation between plantar fascia thickness and symptoms of plantar fasciitis. J. Am. Podiatr. Med. Assoc. 2011, 101, 385–389. [Google Scholar] [CrossRef] [Scilit] [PubMed]
Disclaimer/Publisher’s Note: The statements, opinions and data contained in all publications are solely those of the individual author(s) and contributor(s) and not of MDPI and/or the editor(s). MDPI and/or the editor(s) disclaim responsibility for any injury to people or property resulting from any ideas, methods, instructions or products referred to in the content. |
© 2026 by the authors. Licensee MDPI, Basel, Switzerland. This article is an open access article distributed under the terms and conditions of the Creative Commons Attribution (CC BY) license.