


Abstract
Background: Prolonged sitting has been associated with adverse cardiovascular and neuromuscular responses; however, the temporal onset of these acute physiological changes remains unclear. This study aimed to determine the acute effects of prolonged sitting on blood flow, blood pressure, and muscle activity. Methods: A non-controlled clinical trial was conducted with 21 healthy adults (22.5 ± 1.60 years), both male and female. Participants remained seated continuously for three hours, with data collected every 20 min, including infrared thermography, blood pressure, and electromyographic activity. Skin temperature was measured using infrared thermography on the calf region of both legs, and the mean temperature was analyzed. Systolic and diastolic blood pressure were measured using an oscillometric device, and mean arterial pressure was subsequently calculated. Muscle activity was assessed through surface electromyography, using median frequency and root mean square values. Statistical analysis was performed using the Friedman test and the Durbin–Conover post hoc test, along with a subjective trend analysis of each variable over time. Results: A significant reduction was observed in both calf skin temperature and median frequency after 60 min of uninterrupted sitting (p < 0.05). Mean and systolic blood pressure exhibited an increasing trend after 160 min (p < 0.05). Conclusions: The exposure–response data from this study may contribute to the planning of future interventions aimed at refining recommendations for breaking up prolonged sitting periods.
1. Introduction
Sedentary Behavior (SB) is defined as activities performed while sitting, reclining, or lying down, with energy expenditure below 1.5 metabolic equivalents during waking hours [1]. Growing evidence suggests that prolonged SB is associated with adverse physiological effects, including elevated blood pressure (BP), impaired biomarkers, and vascular dysfunction [2,3,4,5].
The vascular dysfunction observed in the lower limbs during uninterrupted sitting is primarily attributed to a reduction in shear stress resulting from decreased blood flow [6]. This decline triggers harmful changes in BP regulation mechanisms, increasing the risk of hypertension [7]. Additionally, the marked reduction in muscle activity while seated eliminates the action of the muscle pump, which is critical for venous return and circulatory homeostasis [6]. Metabolic and vascular alterations seem to occur within as little as three hours of uninterrupted SB [4,8]. Acute changes in blood flow have been detected after just 30 min of sitting, indicating early signs of vascular dysfunction [4,9,10]. To mitigate these effects, breaking up prolonged sitting with physical activity bouts has been shown to improve vascular parameters and reduce cardiovascular risk [2,3,11].
Despite these findings, the exact moment at which these physiological changes begin remains unclear. Current intervention protocols largely rely on arbitrary intervals for interrupting SB time, typically ranging from every 20 min to every two hours, primarily due to the lack of evidence identifying the precise timing at which hemodynamic and neuromuscular changes begin [11]. This gap limits the development of evidence-based recommendations for health professionals and public health guidelines.
More precise evidence in this field will support the development of more effective interventions, with clearer thresholds for interrupting SB. Accordingly, the findings of this study may provide a basis for recommendations that adopt better-defined dosing strategies, moving beyond the generic advice to “sit less and move more”. The present study aims to identify the onset of acute alterations in blood pressure, blood flow, and muscle activity induced by uninterrupted sitting.
2. Materials and Methods
2.1. Study Design
This study was designed as a non-controlled clinical trial with a prospective approach, aiming to determine the minimum duration of prolonged SB required to elicit acute alterations in cardiovascular parameters and muscle activity in young adults. The study was registered in the Brazilian Clinical Trials Registry (REBEC) (RBR-32dp35h) and adhered to the Transparent Reporting of Evaluations with Nonrandomized Designs (TREND) statement [12]. The research protocol was approved by the Local Research Ethics Committee for Human Studies (approval number 6.209.646). All participants signed a written informed consent form prior to enrollment, agreeing to voluntarily participate in the study.
Participants were eligible if they were healthy young adults aged 18–24 years, with no diagnosed chronic diseases, not using continuous medication and/or any ergogenic aids, and without any injuries or conditions that would prevent prolonged sitting. Failure to complete any phase of the study, including initial screening, assessments, or the experimental session, was considered a criterion for exclusion.
A priori sample size calculation was conducted using G*Power 3.1.9.6, considering the study design (single-group), the most appropriate statistical test (one-way ANOVA), a statistical power of 0.80, and pilot study data on the number of measurements to be performed. Based on an effect size of 0.25 and a correlation coefficient of 0.50 between repeated measurements, the required sample size was estimated to be 14 participants.
2.2. Experimental Protocol
Participants were instructed to avoid prolonged sun exposure for at least five days before the experimental protocol (to minimize the risk of sunburn), hot showers within two hours of the session, and the application of creams or ointments on the skin [13].
Additionally, they were required to refrain from moderate-to-vigorous physical activity, caffeine and alcohol consumption for 24 h before the experimental session while maintaining their usual dietary and sleep habits.
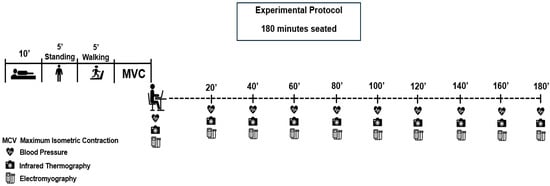
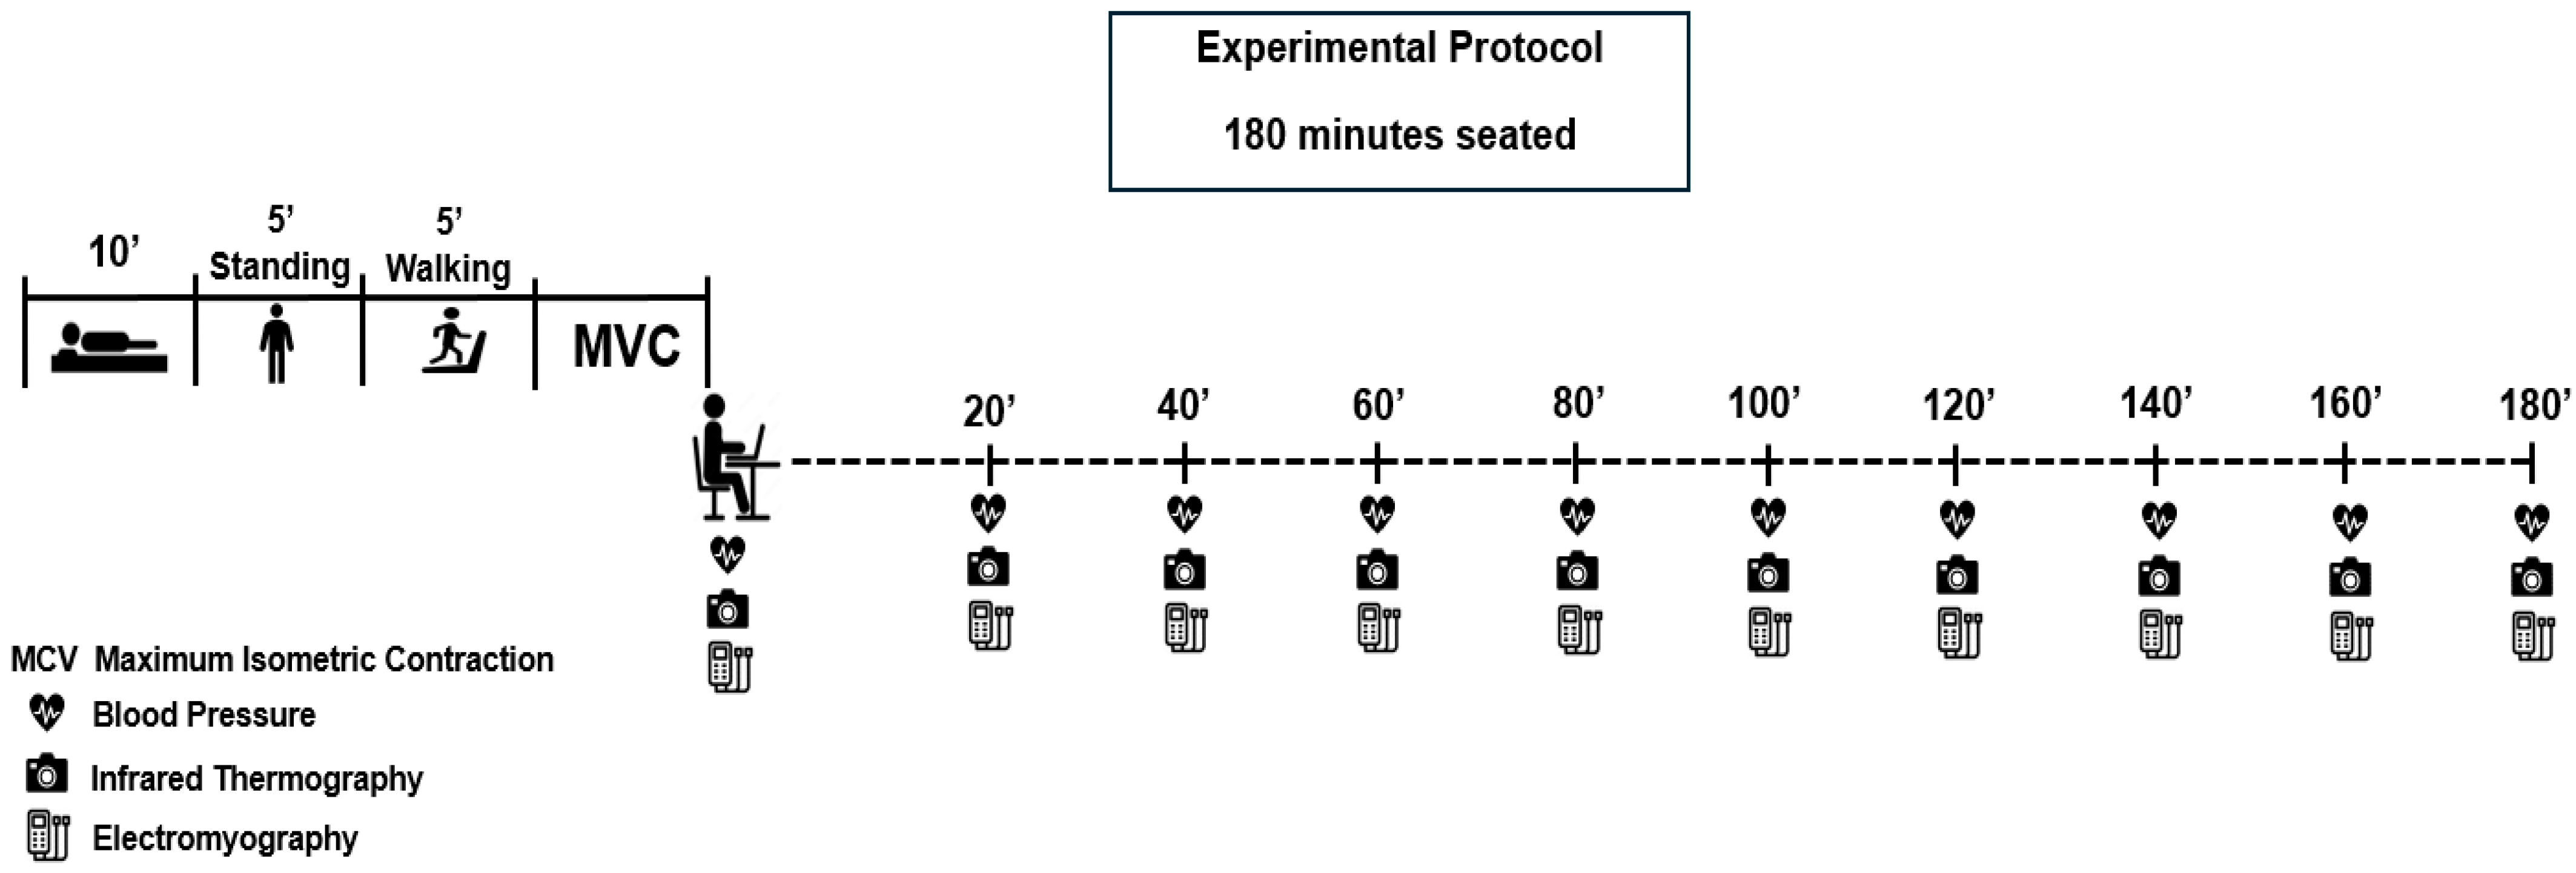
All experimental sessions were conducted at the Laboratory between 7:00–11:00 a.m. In addition to sample characterization at both the beginning and end of the study, the experimental session was structured into two distinct phases: (i) Pre-experimental protocol phase, which included the collection of baseline and reference measurements. (ii) Experimental protocol phase, in which participants remained in prolonged sedentary behavior for three hours (Figure 1).
Figure 1.
Experimental design of the study.
Upon arrival at the laboratory, participants underwent a comprehensive anthropometric assessment, including measurements of body mass (kg), height (m), waist circumference (cm), hip circumference (cm), and body composition analysis. From these measurements, the body mass index (BMI, kg/m2) and waist-to-hip ratio were calculated.
Subsequently, participants received individualized instructions at three different time points regarding the electromyography (EMG) data collection procedures, which were used for signal normalization. After the anthropometric evaluation, participants lay supine on a medical examination table for 10 min to achieve a steady-state condition. This period also allowed for proper skin preparation and electrode placement for EMG recording, as well as acclimatization to the experimental environment. Next, participants stood in an upright position for five minutes, as this is considered the first posture outside of SB [1]. They then performed a five-minute treadmill walk at a speed of 3.5 km/h, with the exercise intensity standardized as “light” based on the Rating of Perceived Exertion scale [14].
Finally, they underwent a maximal voluntary isometric contraction (MVIC) test of the medial gastrocnemius muscle of the right lower limb, which was used for EMG signal normalization.
During this period, participants were allowed minor free movements of their upper and lower limbs, such as adjusting posture or handling personal devices, but without engaging in any vigorous or physically demanding activity. However, interruptions of the experimental session were not permitted. If an interruption occurred for any reason unrelated to the protocol, the session was canceled and rescheduled to ensure the standardization of experimental conditions.
From this point onward, participants assumed the seated position, and data collection for all investigated variables was then performed at 20-min intervals, with the first measurement taken immediately after they were seated. EMG data were continuously recorded for five minutes during each collection period. To ensure protocol standardization, the intervals between collections were adjusted according to the duration of EMG recording: the first and second measurements were separated by 12.5 min, while subsequent measurements were taken at 15-min intervals. This adjustment was necessary to align data collection sequences with the total duration of the experimental session.
2.3. Physical Activity Level
Participant’s physical activity level was assessed using the 24-Hour Physical Activity Recall (R24AF) [15]. Data collection was conducted by a trained researcher through a structured interview, guiding participants to recall in detail their daily activity routine over a typical day in the previous week.
The information provided by the participants included a detailed description of the type of activity performed, encompassing its nature, mode of execution, and duration [15].
Following data collection, the Metabolic Equivalent of Task (MET) for each reported activity was assigned based on the Compendium of Physical Activities [16]. Activities were then classified according to their intensity (light, moderate, or vigorous), and the total time spent in SB was determined [17]. Additionally, the total duration (in minutes) dedicated to each activity during the participant’s waking hours on a typical day was calculated.
2.4. Blood Pressure Measurement
Systolic blood pressure (SBP) and diastolic blood pressure (DBP) were measured using a validated oscillometric device (Omron® HEM-780-E, Omron Healthcare Co., Ltd., Kyoto, Japan). Three measures were taken with a one-minute interval between each reading, always on the participant’s left arm. For analysis, the mean of the last two measurements was considered, following standardization protocols [18].
Following the acquisition of SBP and DBP values, mean arterial pressure (MAP) was calculated. MAP represents the weighted average of arterial pressure throughout the cardiac cycle, incorporating both systolic and diastolic phases. It is determined by cardiac output and systemic vascular resistance, both of which are modulated by various physiological factors [19,20]. The MAP calculation followed the widely accepted formula in the literature: MAP = (1/3 * SBP) + (2/3 * DBP) [19,20].
2.5. Blood Flow Assessment
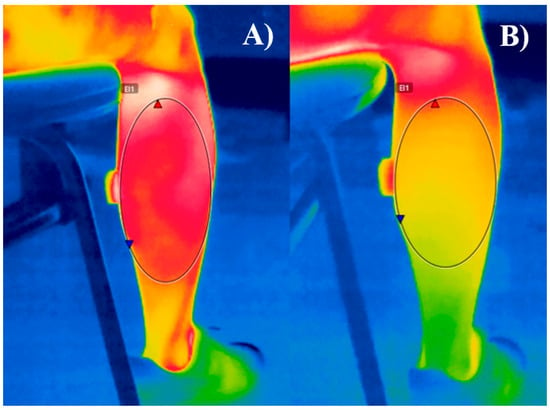
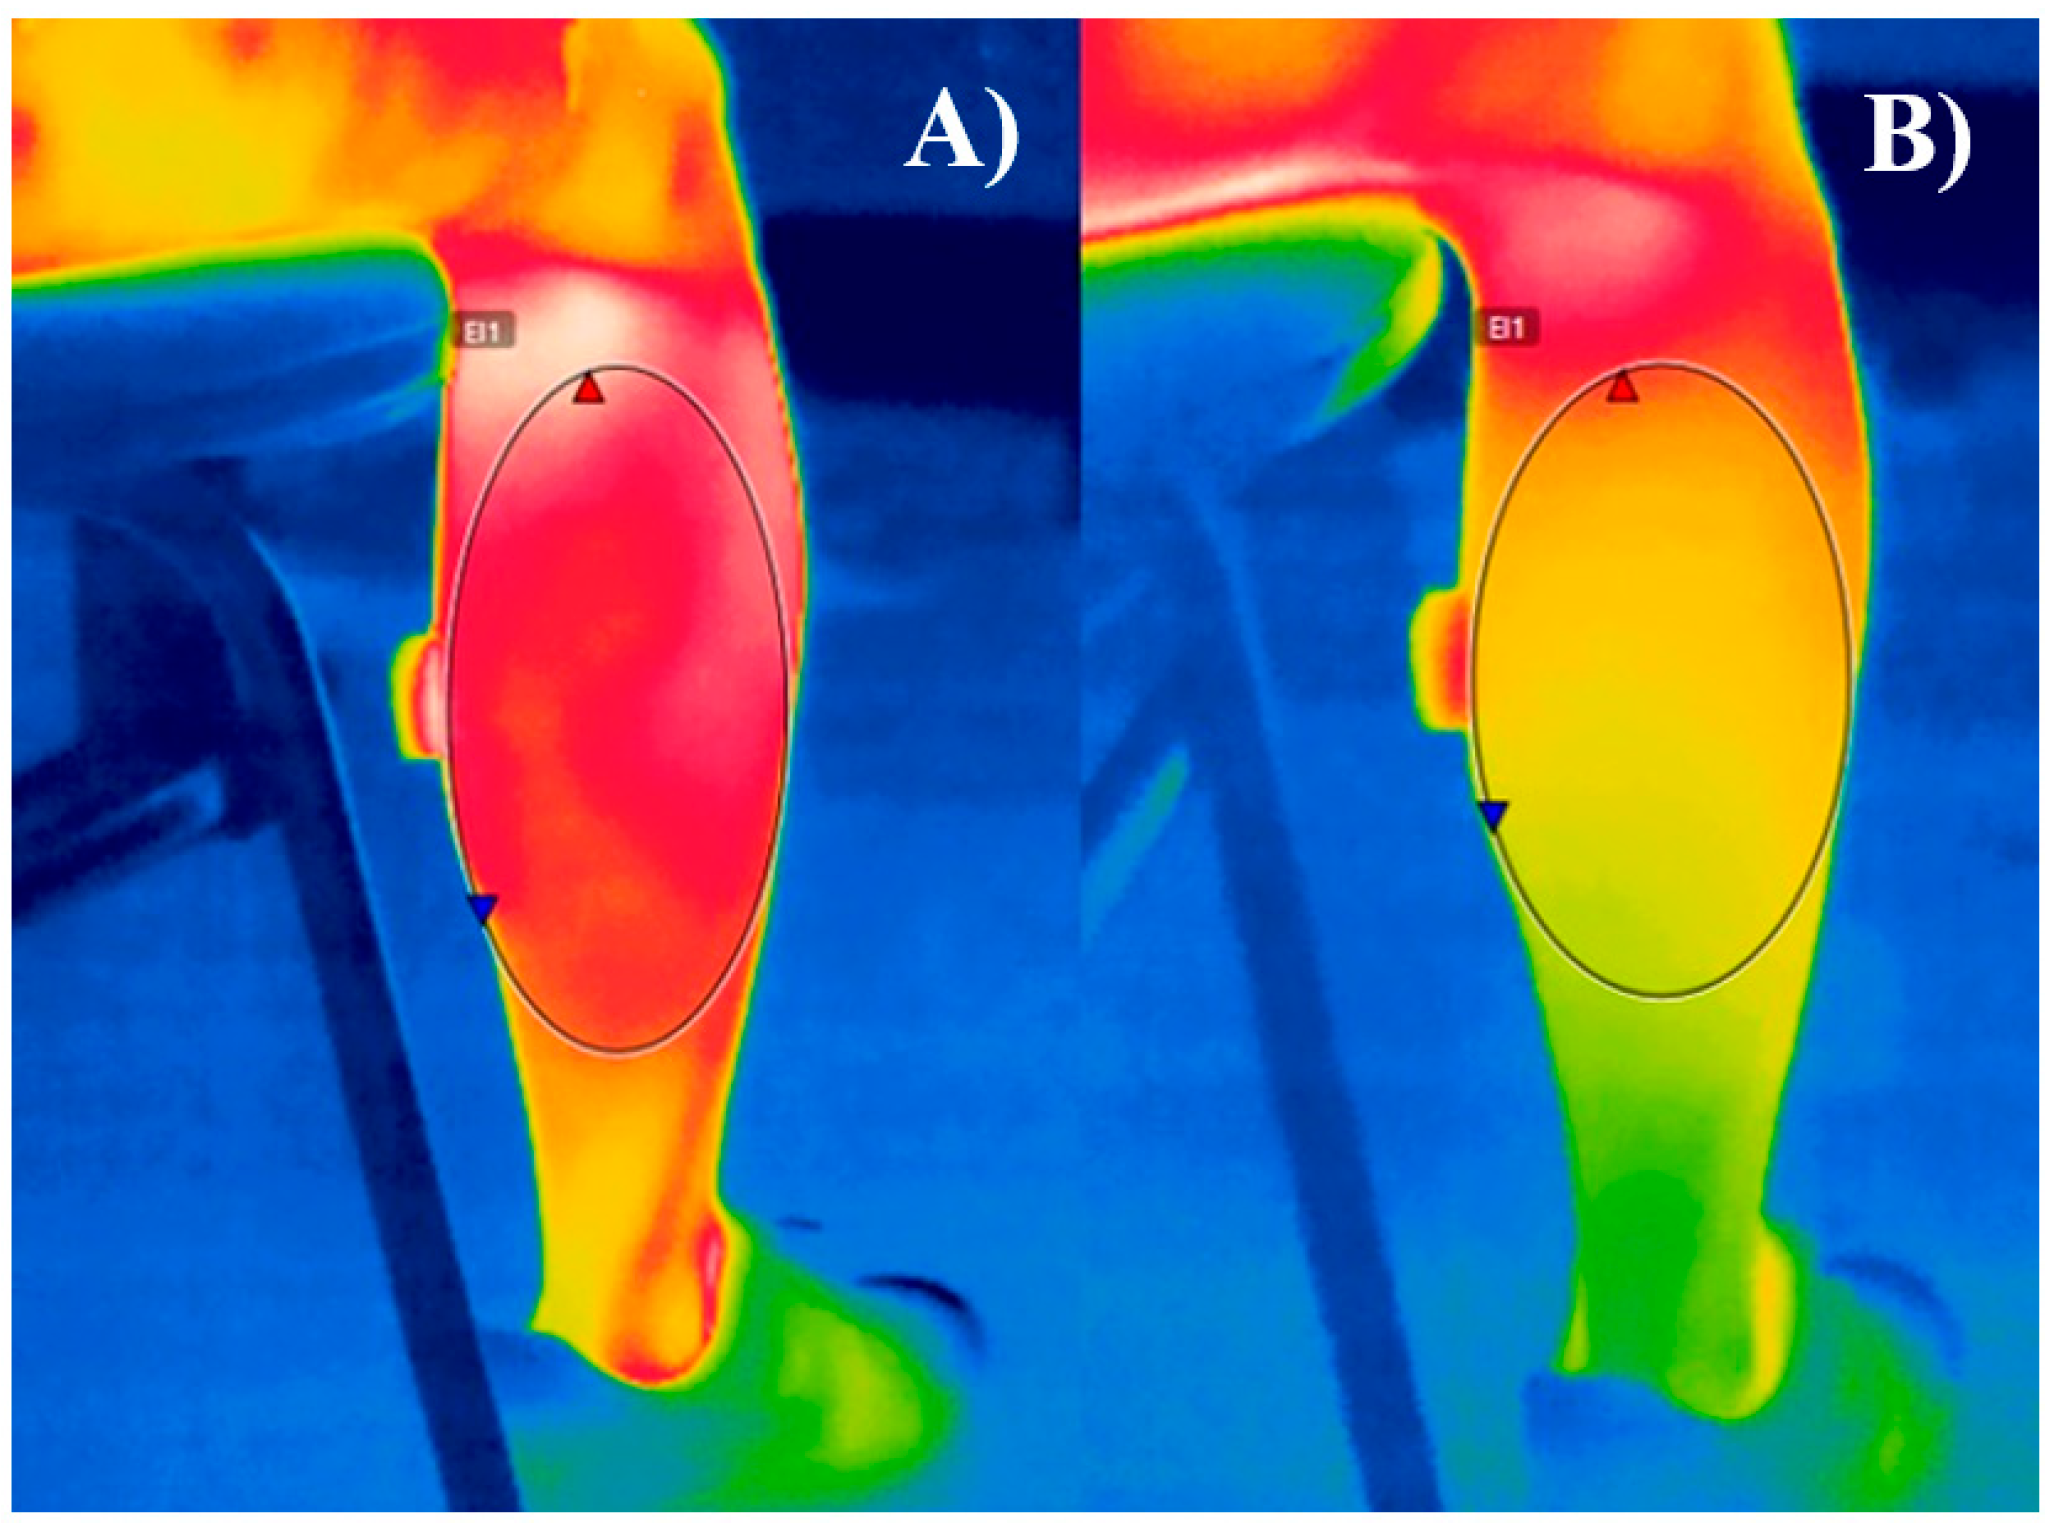
Lower limb blood flow was evaluated using infrared thermography, a non-invasive analysis tool widely employed for monitoring physiological functions associated with skin temperature regulation [21]. This method enables the detection of infrared radiation emitted by the body, allowing the identification of thermal variations that reflect changes in blood flow [21] (Figure 2).
Figure 2.
Gastrocnemius area assessed before (A) and after (B) three hours of sitting time. It can be depicted that (A) shows a higher thermal gradient and skin temperature compared to (B), indicating a potential reduction in local blood flow.
To acquire thermographic images, a thermal camera (FLIR® E76, FLIR Systems, Inc., Wilsonville, OR, USA) with a resolution of 320 × 240 pixels was used. The equipment was installed at the data collection site 60 min before measurements to ensure proper environmental acclimatization. Skin emissivity was standardized at ε = 0.98 [12]. Infrared thermography is a validated technique for blood flow assessment, demonstrating correlation with Doppler ultrasound, which is considered the gold standard for endothelial function measurement. Scientific evidence indicates that reductions in skin temperature are associated with decreased blood flow, reinforcing the applicability of this method for peripheral perfusion analysis [22,23].
2.6. Electromyographic Activity Assessment
Electromyographic (EMG) activity was assessed using surface EMG with a DELSYS® system (DSY-DS-T01-8, Delsys, Inc., Natick, MA, USA). EMG signals were acquired through the TRIGNO® software (version 2.0.1.3, Delsys Inc., Natick, MA, USA), employing a sampling rate of 2000 Hz for each recording [24].
Electrode placement followed the guidelines outlined in the SENIAM (Surface Electromyography for Non-Invasive Assessment of Muscles) protocol [25]. To optimize signal acquisition and minimize impedance, standardized skin preparation procedures—including cleansing and abrasion—were performed prior to electrode placement. The electrodes were aligned parallel to the muscle fibers of the gastrocnemius medialis (GMD).
During the protocol involving prolonged exposure to SB, EMG activity was recorded in 5-min intervals, with a 15-min break between successive recordings, ensuring an average interval of 20 min between assessments. To standardize data collection, participants were informed in advance of the start and end times of each EMG recording. Throughout data acquisition, participants were instructed to keep their right leg as still as possible during the 5-min recording period.
Following data acquisition, signal processing was conducted in accordance with the methodology proposed by Oliveira et al. [23] to extract Root Mean Square (RMS) and Median Frequency values. Data processing was performed using Matlab® (The MathWorks Inc., Natick, MA, USA) and Octave (GNU), ensuring data integrity and eliminating potential external interferences that could compromise EMG signal quality.
For the maximal voluntary isometric contraction (MVIC) of the GMD, participants were positioned in a chair identical to that used in the SB exposure protocol, maintaining 90° of hip flexion with the knee fully extended and supported, ensuring that only the ankle remained free. This configuration minimized compensatory movements and prevented electrode displacement. The participants’ arms were stabilized at shoulder level, and two researchers ensured postural fixation by keeping the chair static throughout the test. Additionally, a portable device was placed against the participant’s foot, allowing them to apply force against a fixed surface to ensure proper execution of the isometric contraction.
During the MVIC test, participants received continuous verbal encouragement to maximize plantar flexion effort. Data were collected over three trials, each lasting 5 s, with 1-min rest intervals between trials. For subsequent analysis, the mean of the three attempts was calculated.
2.7. Statistical Analysis
Descriptive statistics were used to present the data, with results expressed as mean and standard deviation for continuous variables and absolute frequency distribution for categorical variables. The normality of data distribution was assessed using the Shapiro–Wilk test. For variables measured at multiple time points throughout the SB exposure period, the Friedman test was applied to determine whether significant differences existed over time. When significant differences were detected, post hoc analysis was conducted using the Durbin–Conover test to identify specific time points where changes occurred. The correlation between variables was analyzed using Spearman’s correlation coefficient, considering changes between minute 180 and baseline (minute 0). All statistical analyses were conducted with a significant level of 5%, using JAMOVI 2.4.8.
3. Results
3.1. Sample and Hemodynamic Measurements
A total of 21 young adults (11 men and 10 women) participated in the study. The general characteristics of the sample are presented in Table 1.
Table 1.
Descriptive characteristics of the study participants.
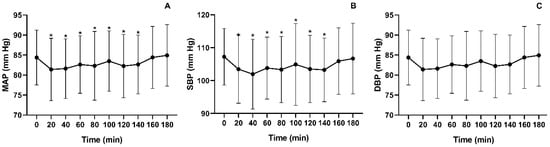
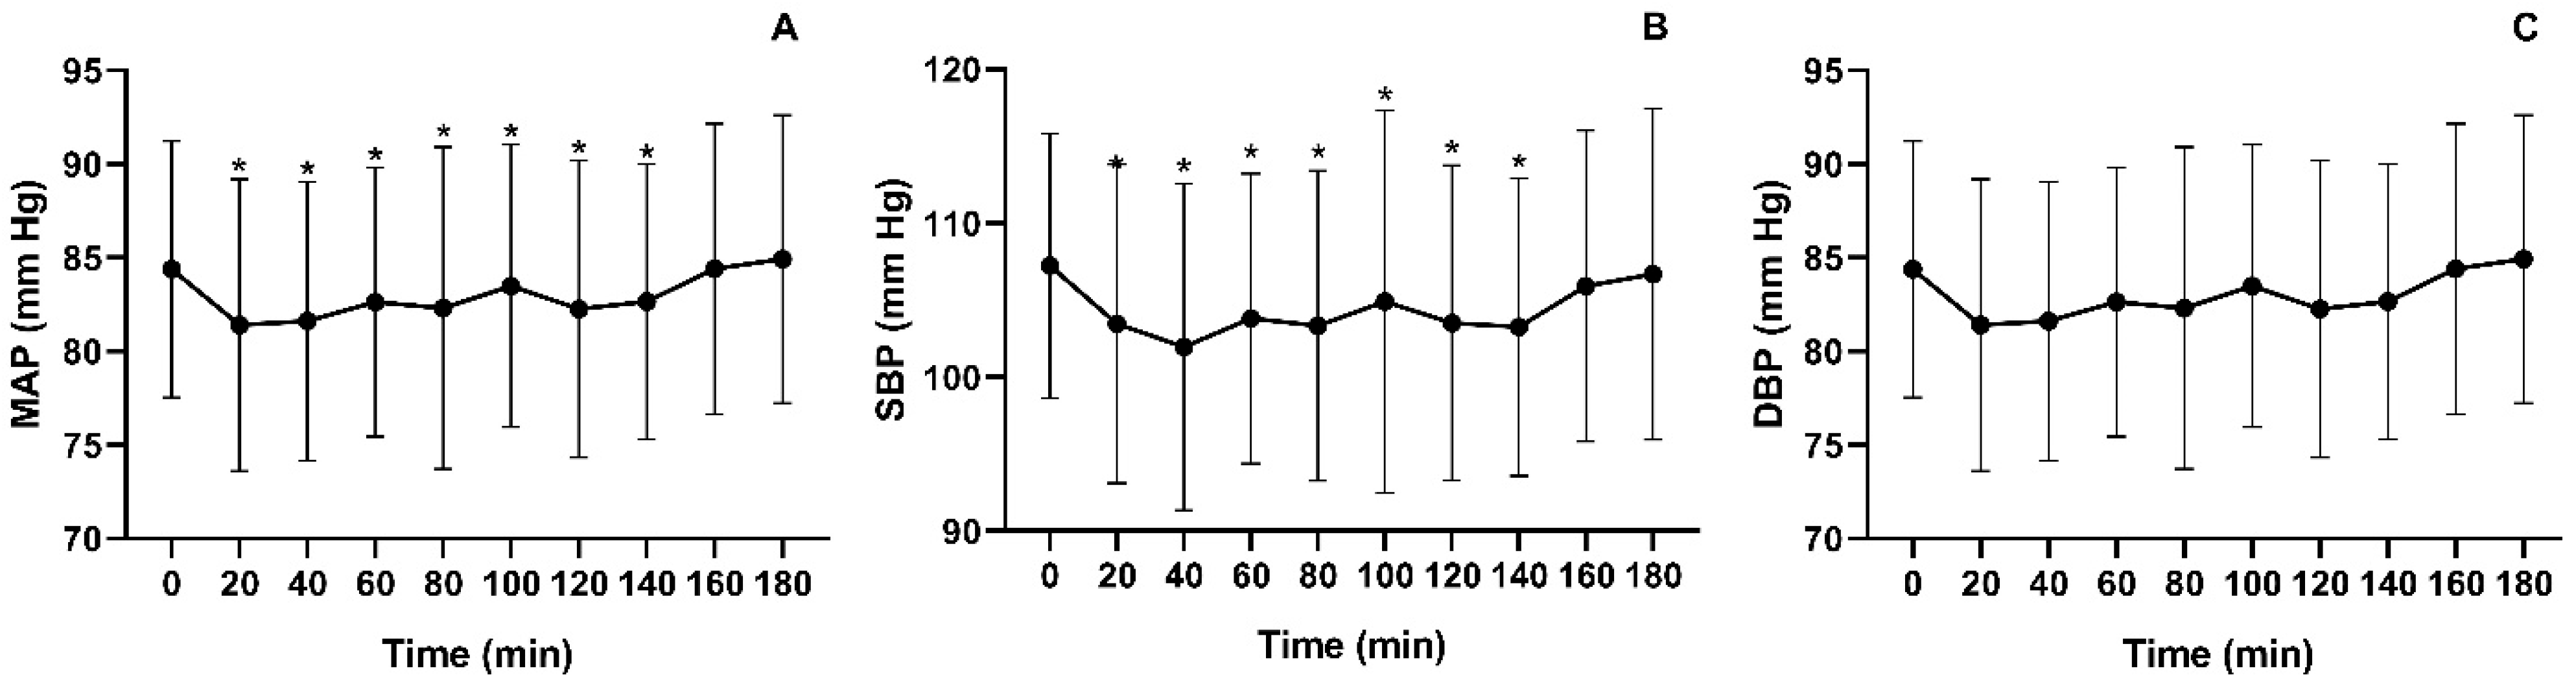
Statistical analysis using the Friedman test revealed significant changes in MAP over time [χ2(9) = 24.274; p < 0.004]. A transient peak in MAP was observed around minute 60; however, statistically significant differences compared to baseline (84.4 ± 6.84 mmHg) were only detected from minute 160 (84.4 ± 7.76 mmHg) and minute 180 (84.9 ± 7.69 mmHg) onward (Figure 3A). Similarly, SBP fluctuated over time, as indicated by the Friedman test [χ2(9) = 26.778; p < 0.002]. A peak in SBP was noted around minute 60, but significant differences compared to baseline (107 ± 8.57 mmHg) were only found at minute 160 (106 ± 10.1 mmHg) and minute 180 (107 ± 10.7 mmHg) (Figure 3B). For DBP, a peak was observed at minute 40; however, statistical analysis did not reveal any significant differences between time points [χ2(9) = 14.578; p = 0.103] (Figure 3C).
Figure 3.
Mean values of (A) MAP, (B) SBP, and (C) DBP over three hours of prolonged sedentary behavior. Significant difference compared to minute 0 (* p < 0.05).
3.2. Skin Temperature Assessment
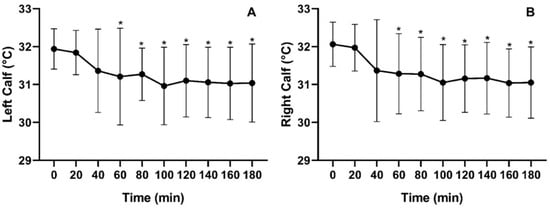
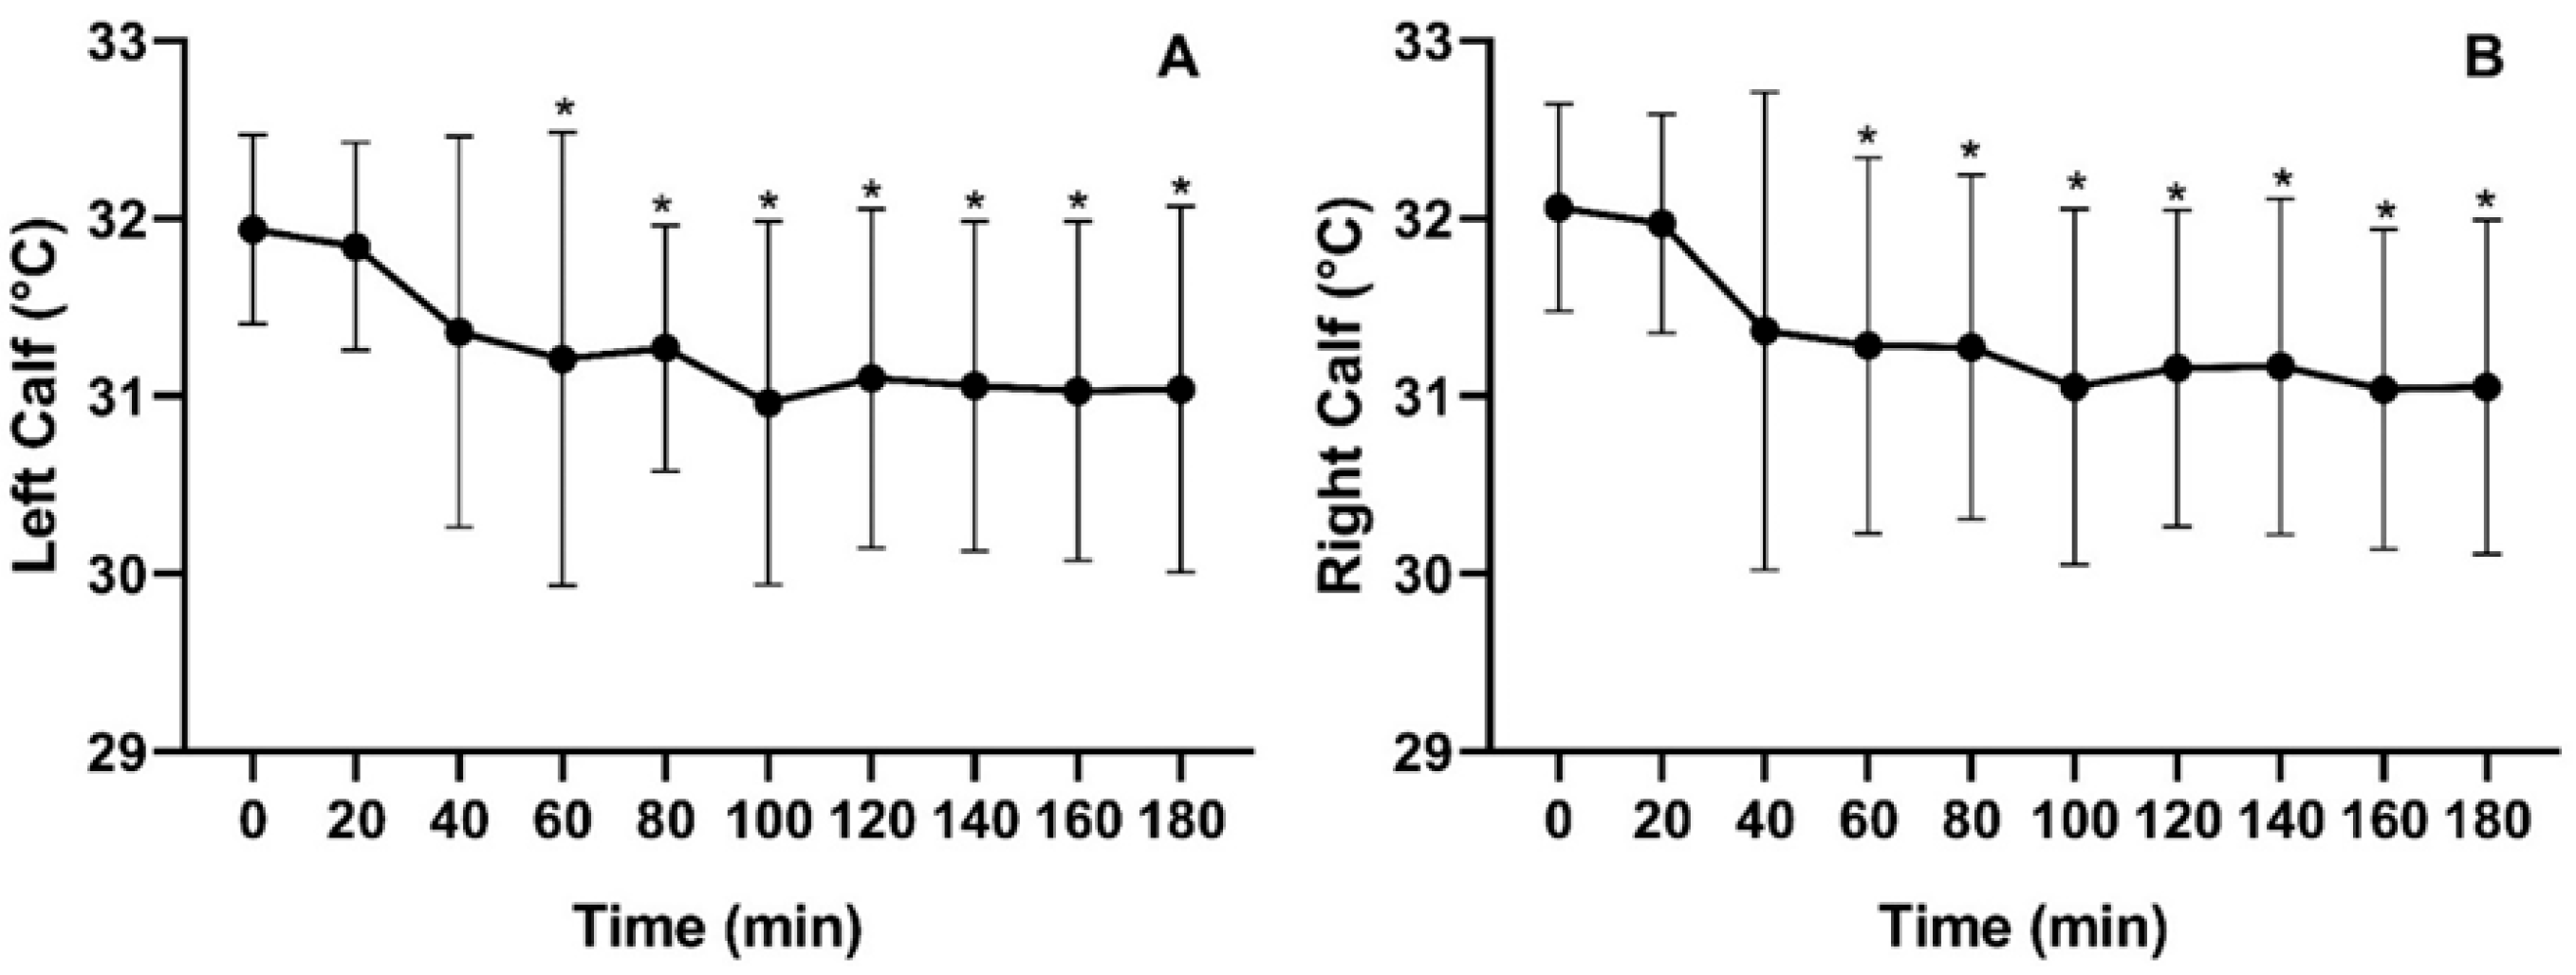
Mean skin temperature varied significantly over time for both the left calf [χ2(9) = 71.687; p < 0.000] and the right calf [χ2(9) = 75.292; p < 0.000]. Throughout the three-hour period of uninterrupted SB, an average temperature decrease of −0.90 ± 1.11 °C was observed for the left calf, while the right calf exhibited a decline of −1.01 ± 9.96 °C. Despite a downward trend starting at minute 20, statistically significant reductions compared to baseline were only detected from minute 60 onward for both calves (Figure 4).
Figure 4.
Mean skin temperature of the left (A) and right (B) calves measured during three hours of prolonged SB. * p < 0.05.
3.3. Muscle Activation Analysis
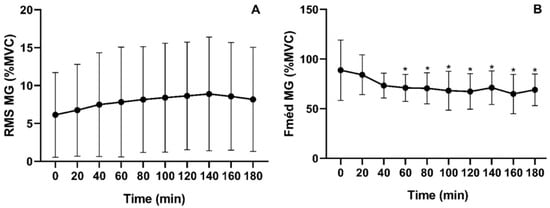
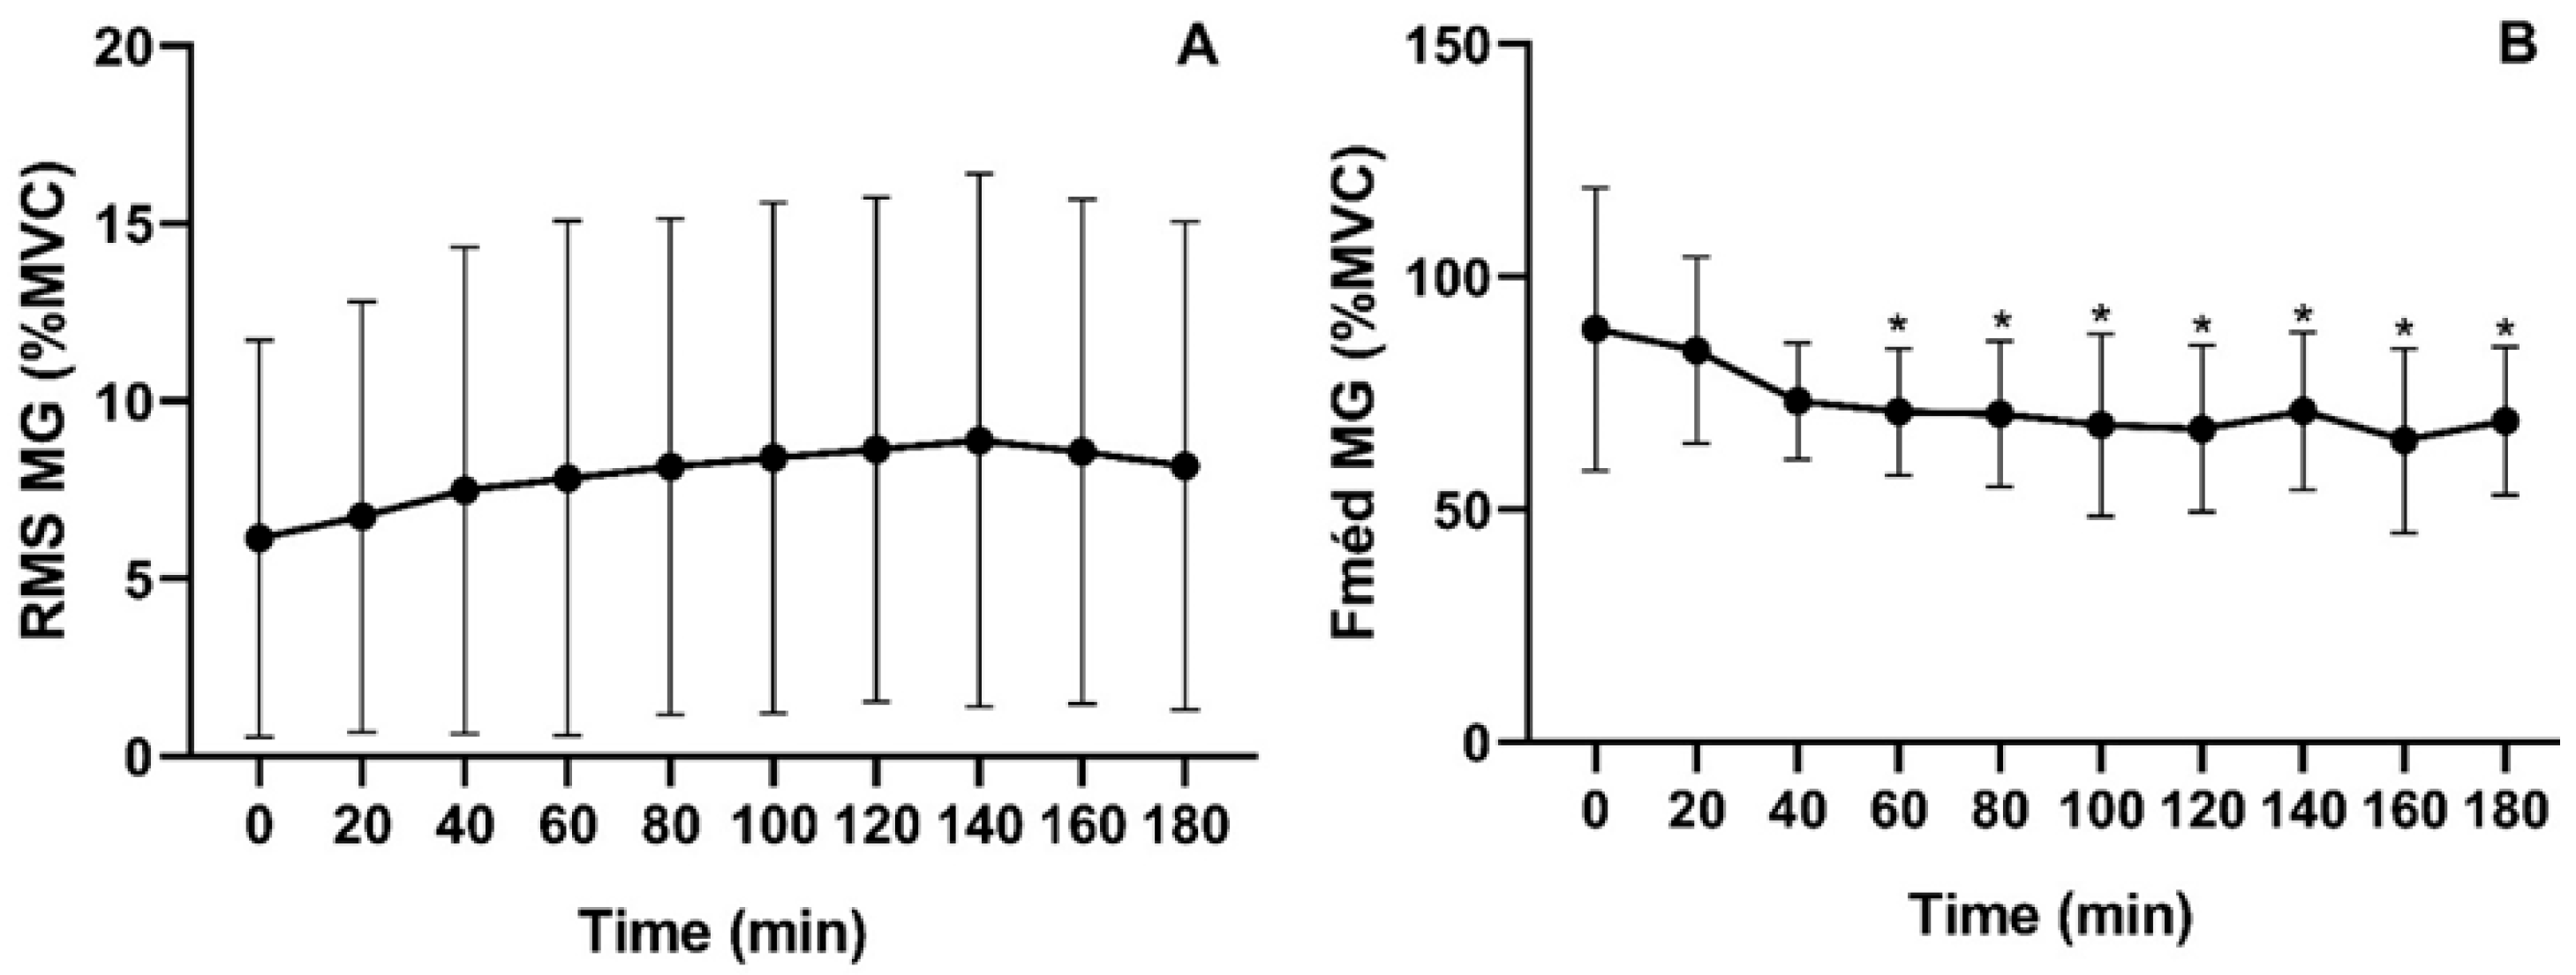
Figure 5 illustrates the percentage of activation over time during prolonged SB for the median frequency (Fmed) and root mean square (RMS) relative to the maximal voluntary isometric contraction (MVIC) of the gastrocnemius medialis (GMD). For Fmed, the mean activation of the GMD was 72.89% ± 7.61, with statistically significant differences compared to baseline detected from minute 60 onward [χ2(9) = 42; p < 0.001]. In contrast, RMS activation averaged 7.91% ± 0.88, with no significant differences observed between time points [χ2(9) = 7.18; p = 0.619].
Figure 5.
Electromyographic parameters of the medial gastrocnemius during prolonged SB. RMS = Root mean square activation (%) relative to maximal voluntary isometric contraction (MVIC) (A); Median frequency (Fmed) relative to MVIC (B). * p < 0.05.
3.4. Correlation Analysis
Spearman’s rank correlation coefficient did not reveal any statistically significant associations between the variables analyzed (p > 0.05 for all comparisons). No meaningful relationships were found between changes in muscle activation, skin temperature, or cardiovascular parameters during the sitting protocol.
4. Discussion
The objective of this study was to analyze the acute effects of prolonged SB on blood pressure, blood flow, and muscle activity in young adults. The results indicate that, for MAP and BP, no significant differences were observed at 160 min of prolonged sitting compared to baseline. However, skin temperature showed a significant decrease in both calves starting at 60 min, while MeanFreq exhibited a significant reduction from 80 min onward.
During prolonged sitting, skin temperature was the first physiological parameter to exhibit significant changes, decreasing markedly after one hour. One of the primary factors regulating skin temperature is blood flow, and a decline in skin temperature is generally associated with reduced blood flow to the assessed region [21,22,23]. A temperature variation greater than 1 °C within the same body region over time can indicate an underlying pathophysiological process [21]. In this study, we observed a decrease of −0.90 °C in the left calf and −1.01 °C in the right calf after three hours, suggesting a potential deleterious effect on endothelial and vascular health when chronically exposed to prolonged sitting. Uninterrupted sitting for prolonged periods, particularly between 120 and 180 min, has been linked to a progressive decline in lower limb vascular function, with more pronounced impairments as sitting duration increases [2,4].
While previous studies did not identify significant vascular function changes within shorter timeframes (e.g., 30 to 60 min) [2,4], evidence suggests that extended exposure to prolonged sitting may negatively impact endothelial function and hemodynamic regulation even in young, healthy individuals [4].
The findings of the present study partially align with this evidence, as vascular function alterations were observed after 180 min of prolonged sitting. However, unlike prior research, significant changes were detected as early as 60 min, with a downward trend in skin temperature emerging from 20 min. These findings suggest that vascular impairments may initiate earlier than previously thought, potentially affecting peripheral circulation from the initial minutes of sitting.
One possible physiological mechanism underlying these changes is the reduction in venous return from the lower limbs, caused by increased pressure in the posterior thigh region. This pressure leads to arterial constriction and an increase in hydrostatic pressure [6,26]. This effect is exacerbated by reduced muscle activity during prolonged sitting, eliminating the contribution of the calf muscle pump in facilitating venous return [6,27].
The decline in calf muscle activity compromises the efficiency of the muscle pump, leading to increased fluid retention in the lower limbs during extended sitting [28]. The reduction in muscle temperature observed in this context serves as an indirect marker of decreased myoelectric activity, suggesting lower calf muscle activation and impaired peripheral circulation [27,28].
In this study, we observed a decline in MeanFreq of the gastrocnemius medialis, a parameter widely used to assess and monitor muscle fatigue [29,30]. The reduction in MeanFreq, evident from 80 min of prolonged sitting, may indicate neuromuscular fatigue, reflecting decreased contractile efficiency and potential physiological adaptations due to prolonged inactivity. Based on these results, we hypothesize that, similar to isometric contraction exercises, reduced blood flow in a specific region leads to decreased oxygenation and energy substrate availability, ultimately resulting in acute muscle fatigue and impaired muscle contractile mechanisms [31].
Additionally, the literature suggests that prolonged sitting with low lower-limb muscle activity reduces both blood flow and shear stress—key mechanisms for vascular regulation [2,6]. However, our findings indicate a distinct sequence of events, where a reduction in blood flow (detected via infrared thermography) occurs first, followed by decreased muscle activity and, subsequently, an increase in blood pressure. A potential reduction in blood flow may decrease shear rate, directly impacting NO synthesis and availability, an essential regulator of vasodilation [9,10]. A decline in circulating NO compromises vascular wall elasticity, increasing arterial stiffness and elevating blood pressure due to impaired vascular adaptation to fluctuations in cardiac output [9,10,32].
Thus, prolonged sitting leads to increased MAP and SBP but does not significantly affect DBP [3], particularly in young adults. This trend was observed in our study, where MAP and SBP reached values comparable to baseline after 160 min of prolonged sitting. However, we identified an initial peak increase at 60 min, suggesting that early physiological alterations may occur before the timeframes typically reported in literature.
These findings offer valuable insights into the development of targeted interventions. Previous studies have suggested that breaking up sitting time at intervals ranging from 20 to 120 min may mitigate the cardiovascular effects of prolonged sedentary behavior [11]. Although each physiological variable exhibits changes at different time points, our data indicates that early physiological changes may occur between 40 and 60 min, even if statistical significance is not reached within this interval. This study provides an initial contribution to understanding the effects of prolonged sitting time, as most research in this area has focused on evaluating the impact of different interventions on cardiovascular parameters [2,3,11] or comparing muscle activation during sedentary behavior with various daily activities [33,34,35,36,37].
From a practical standpoint, the relevance of the present study lies in its contribution to refining the understanding of the temporal sequence of acute physiological changes induced by SB. This knowledge may support the development of evidence-based strategies for interrupting SB. The identification of early physiological markers, such as reductions in skin temperature and electromyographic activity, suggests the potential for establishing physiological thresholds to guide the optimal timing of movement breaks, which may ultimately strengthen clinical and public health initiatives aimed at reducing SB.
However, some important limitations must be considered when interpreting these findings. The absence of a control group limits the ability to distinguish the specific effects of the experimental protocol from potential circadian or environmental influences, and anticipatory responses may have occurred despite the standardized procedures. In addition, although infrared thermography is a reliable indirect indicator of peripheral perfusion, it does not allow direct assessment of shear stress or endothelial function.
The sample consisted exclusively of healthy young adults, which also restricts the generalizability of the results. Therefore, future studies should prioritize controlled research designs with larger and more heterogeneous samples, as well as longer experimental protocols that simulate a typical working day, comparing conditions with and without interruptions for physical activity. Such investigations may contribute to identifying physiological thresholds that guide the ideal frequency of breaks to interrupt SB.
5. Conclusions
This study expands the understanding of the temporal sequence of vascular and neuromuscular responses during uninterrupted sitting in healthy young adults. We demonstrated that reductions in calf skin temperature and electromyographic activity occur before increases in blood pressure, suggesting that circulatory and muscular impairments begin within the first hour of sitting. This chronology provides more precise evidence to guide the frequency of interruption, moving beyond the practice of adopting arbitrary intervals. The identification of early physiological markers of sedentary stress reinforces the need to implement regular active breaks, both in clinical and occupational settings and in sports recovery protocols where prolonged sedentary periods are common. By establishing exposure-response thresholds, these findings contribute to the development of individualized strategies and to the refinement of recommendations aimed at protecting cardiovascular and musculoskeletal health across populations.
Author Contributions
J.R.G.d.S., A.R.N., D.B., C.J.B. and J.S.V.J. conceived and designed the research; J.R.G.d.S. and A.R.N. conducted data collection; J.R.G.d.S., A.R.N., N.B.A. and C.J.B. processed and analyzed the data; J.R.G.d.S., A.R.N. and C.J.B. prepared figures; J.R.G.d.S., A.R.N., N.B.A. and J.S.V.J. drafted the manuscript; J.R.G.d.S., A.R.N., D.B., J.E.S., M.M., S.T., C.J.B. and J.S.V.J. critically revised the manuscript for intellectual content. All authors have read and agreed to the published version of the manuscript.
Funding
This research received external funding from the Coordenação de Aperfeiçoamento de Pessoal de Nível Superior (CAPES): Sheilla Tribess (Grant No. 88881.709009/2022-01); and from the Conselho Nacional de Desenvolvimento Científico e Tecnológico (CNPq): Jair Sindra Virtuoso Junior (Grant No. 309305/2025-0). M. Marocolo was funded by CNPq (process no. 308138/2022-8). This study was supported by the Coordenação de Aperfeiçoamento de Pessoal de Nível Superior (CAPES, Finance Code 001), including the award of a graduate scholarship to the first author, Jonas Ribeiro Gomes da Silva. Additional support was provided by the Fundação de Amparo à Pesquisa do Estado de Minas Gerais (FAPEMIG), including the award of a graduate scholarship to Antônio Ribeiro Neto. The Conselho Nacional de Desenvolvimento Científico e Tecnológico (CNPq) also supported this research through a Research Productivity Fellowship granted to the senior author, Professor Jair Sindra Virtuoso Junior.
Institutional Review Board Statement
The study was conducted in accordance with the Declaration of Helsinki, and the research protocol was approved by the Local Research Ethics Committee for Human Studies (approval number 6.209.646, 31 July 2023).
Informed Consent Statement
Informed consent was obtained from all subjects involved in the study.
Data Availability Statement
The data are available for access at the following address: https://figshare.com/s/8de96104c41f7396bd45 (accessed on 9 January 2026).
Conflicts of Interest
The authors declare no conflicts of interest.
Abbreviations
The following abbreviations are used in this manuscript:
| BMI | Body Mass Index |
| BP | Blood Pressure |
| DBP | Diastolic Blood Pressure |
| EMG | Electromyography |
| Fmed | Median Frequency |
| MAP | Mean Arterial Pressure |
| MVIC | Maximal Voluntary Isometric Contraction |
| RMS | Root Mean Square |
| SB | Sedentary Behavior |
| SBP | Systolic Blood Pressure |
References
- Tremblay, M.S.; Aubert, S.; Barnes, J.D.; Saunders, T.J.; Carson, V.; Latimer-Cheung, A.E.; Chastin, S.F.M.; Altenburg, T.M.; Chinapaw, M.J.M. SBRN Terminology Consensus Project Participants. Sedentary Behavior Research Network (SBRN)-Terminology Consensus Project Process and Outcome. Int. J. Behav. Nutr. Phys. Act. 2017, 14, 75. [Google Scholar] [CrossRef] [Scilit]
- Paterson, C.; Fryer, S.; Zieff, G.; Stone, K.; Credeur, D.P.; Barone Gibbs, B.; Padilla, J.; Parker, J.K.; Stoner, L. The Effects of Acute Exposure to Prolonged Sitting, With and Without Interruption, on Vascular Function Among Adults: A Meta-Analysis. Sports Med. 2020, 50, 1929–1942. [Google Scholar] [CrossRef] [Scilit] [PubMed]
- Paterson, C.; Fryer, S.; Stone, K.; Zieff, G.; Turner, L.; Stoner, L. The Effects of Acute Exposure to Prolonged Sitting, with and Without Interruption, on Peripheral Blood Pressure Among Adults: A Systematic Review and Meta-Analysis. Sports Med. 2022, 52, 1369–1383. [Google Scholar] [CrossRef] [Scilit]
- Taylor, F.C.; Pinto, A.J.; Maniar, N.; Dunstan, D.W.; Green, D.J. The Acute Effects of Prolonged Uninterrupted Sitting on Vascular Function: A Systematic Review and Meta-Analysis. Med. Sci. Sports Exerc. 2022, 54, 67. [Google Scholar] [CrossRef] [Scilit]
- O’Brien, M.W.; Shivgulam, M.E.; Domínguez, A.H.; Liu, H.; Waghorn, J.; Courish, M.; Tovar-Díaz, J. Impact of Sedentary Behaviors on Blood Pressure and Cardiovascular Disease: An Umbrella Review of Systematic Reviews and Meta-Analyses. Sports Med. 2024, 54, 3097–3110. [Google Scholar] [CrossRef] [Scilit]
- Padilla, J.; Fadel, P.J. Prolonged Sitting Leg Vasculopathy: Contributing Factors and Clinical Implications. Am. J. Physiol. Heart Circ. Physiol. 2017, 313, H722–H728. [Google Scholar] [CrossRef] [Scilit]
- Carter, S.E.; Draijer, R.; Holder, S.M.; Brown, L.; Thijssen, D.H.J.; Hopkins, N.D. Effect of Different Walking Break Strategies on Superficial Femoral Artery Endothelial Function. Physiol. Rep. 2019, 7, e14190. [Google Scholar] [CrossRef] [Scilit] [PubMed]
- Patterson, R.; McNamara, E.; Tainio, M.; de Sá, T.H.; Smith, A.D.; Sharp, S.J.; Edwards, P.; Woodcock, J.; Brage, S.; Wijndaele, K. Sedentary Behaviour and Risk of All-Cause, Cardiovascular and Cancer Mortality, and Incident Type 2 Diabetes: A Systematic Review and Dose Response Meta-Analysis. Eur. J. Epidemiol. 2018, 33, 811–829. [Google Scholar] [CrossRef] [Scilit]
- Thosar, S.S.; Johnson, B.D.; Johnston, J.D.; Wallace, J.P. Sitting and Endothelial Dysfunction: The Role of Shear Stress. Med. Sci. Monit. 2012, 18, REV173–REV180. [Google Scholar] [CrossRef] [Scilit] [PubMed]
- Green, D.J.; Dawson, E.A.; Groenewoud, H.M.M.; Jones, H.; Thijssen, D.H.J. Is Flow-Mediated Dilation Nitric Oxide Mediated? Hypertension 2014, 63, 376–382. [Google Scholar] [CrossRef] [Scilit]
- da Silva, G.O.; Santini, L.B.; Farah, B.Q.; Germano-Soares, A.H.; Correia, M.A.; Ritti-Dias, R.M. Effects of Breaking Up Prolonged Sitting on Cardiovascular Parameters: A Systematic Review. Int. J. Sports Med. 2022, 43, 97–106. [Google Scholar] [CrossRef] [Scilit]
- Des Jarlais, D.C.; Lyles, C.; Crepaz, N.; TREND Group. Improving the Reporting Quality of Nonrandomized Evaluations of Behavioral and Public Health Interventions: The TREND Statement. Am. J. Public Health 2004, 94, 361–366. [Google Scholar] [CrossRef] [Scilit]
- Maniar, N.; Bach, A.J.E.; Stewart, I.B.; Costello, J.T. The Effect of Using Different Regions of Interest on Local and Mean Skin Temperature. J. Therm. Biol. 2015, 49–50, 33–38. [Google Scholar] [CrossRef] [Scilit] [PubMed]
- Morishita, S.; Tsubaki, A.; Nashimoto, S.; Fu, J.B.; Onishi, H. Face Scale Rating of Perceived Exertion during Cardiopulmonary Exercise Test. BMJ Open Sport. Exerc. Med. 2018, 4, e000474. [Google Scholar] [CrossRef] [Scilit]
- Ribeiro, E.H.; Costa, E.F.; Sobral, G.M.; Florindo, A.A. Desenvolvimento e validação de um recordatório de 24 horas de avaliação da atividade física. Rev. Bras. De Atividade Física Saúde 2011, 16, 132–137. [Google Scholar] [CrossRef]
- Herrmann, S.D.; Willis, E.A.; Ainsworth, B.E.; Barreira, T.V.; Hastert, M.; Kracht, C.L.; Schuna, J.M.; Cai, Z.; Quan, M.; Tudor-Locke, C.; et al. 2024 Adult Compendium of Physical Activities: A Third Update of the Energy Costs of Human Activities. J. Sport Health Sci. 2024, 13, 6–12. [Google Scholar] [CrossRef] [Scilit]
- Meneguci, J.; Santos, D.A.T.; Silva, R.B.; Santos, R.G.; Sasaki, J.E.; Tribess, S.; Damião, R.; Júnior, J.S.V. Comportamento sedentário: Conceito, implicações fisiológicas e os procedimentos de avaliação. Motricidade 2015, 11, 160–174. [Google Scholar] [CrossRef] [Scilit]
- Malachias, M.; Plavnik, F.L.; Machado, C.A.; Malta, D.; Scala, L.C.N.; Fuchs, S. 7th Brazilian Guideline of Arterial Hypertension: Chapter 1—Concept, Epidemiology and Primary Prevention. Arq. Bras. Cardiol. 2016, 107, 49–52. [Google Scholar] [CrossRef] [Scilit] [PubMed]
- DeMers, D.; Wachs, D. Physiology, Mean Arterial Pressure. In StatPearls; StatPearls Publishing: Treasure Island, FL, USA, 2025. [Google Scholar]
- Sesso, H.D.; Stampfer, M.J.; Rosner, B.; Hennekens, C.H.; Gaziano, J.M.; Manson, J.E.; Glynn, R.J. Systolic and Diastolic Blood Pressure, Pulse Pressure, and Mean Arterial Pressure as Predictors of Cardiovascular Disease Risk in Men. Hypertension 2000, 36, 801–807. [Google Scholar] [CrossRef] [Scilit] [PubMed]
- Côrte, A.C.R.E.; Hernandez, A.J. Termografia Médica Infravermelha Aplicada à medicina do Esporte. Rev. Bras. Med. Esporte 2016, 22, 315–319. [Google Scholar] [CrossRef] [Scilit]
- Passos, M.D.D.; Rocha, A.F.D. Evaluation of Infrared Thermography with a Portable Camera as a Diagnostic Tool for Peripheral Arterial Disease of the Lower Limbs Compared with Color Doppler Ultrasonography. Arch. Med Sci. Atheroscler. Dis. 2022, 7, e66–e72. [Google Scholar] [CrossRef] [Scilit]
- dos Santos, E.B.; Bonasso, C.; Junior, L.K.; Caluz, N.; Ruiz, R.; Filho, J.J.F.R.; Briochi, M.L.; Balbinot, L.F.; Bianco, H.T.; Cunha, T.A.G. Infrared Thermography and Flow Mediated Dilation Measure by Ultrasound as Predictors of Cardiovascular Risk. Pan Am. J. Med. Thermol. 1969, 3, 11–17. [Google Scholar] [CrossRef]
- Oliveira, H.B.; da Silva Marques, V.A.; Fernandes, L.F.M. Analysis of the Force–Time Curve and Median Frequency of Surface Electromyographic Signals during Isometric Hand Grip Test for Estimation of a Temporal Pattern for Muscle Strengthening. Res. Biomed. Eng. 2023, 39, 179–187. [Google Scholar] [CrossRef] [Scilit]
- Hermens, H.J.; Freriks, B.; Disselhorst-Klug, C.; Rau, G. Development of Recommendations for SEMG Sensors and Sensor Placement Procedures. J. Electromyogr. Kinesiol. 2000, 10, 361–374. [Google Scholar] [CrossRef] [Scilit]
- Kitano, A.; Shoemaker, J.K.; Ichinose, M.; Wada, H.; Nishiyasu, T. Comparison of Cardiovascular Responses between Lower Body Negative Pressure and Head-up Tilt. J. Appl. Physiol. 2005, 98, 2081–2086. [Google Scholar] [CrossRef] [Scilit]
- Delp, M.D.; Laughlin, M.H. Regulation of Skeletal Muscle Perfusion during Exercise. Acta Physiol. Scand. 1998, 162, 411–419. [Google Scholar] [CrossRef] [Scilit]
- Singh, B.; Yadollahi, A.; Lyons, O.; Alshaer, H.; Bradley, T.D. The Effect of Sitting and Calf Activity on Leg Fluid and Snoring. Respir. Physiol. Neurobiol. 2017, 240, 1–7. [Google Scholar] [CrossRef] [Scilit] [PubMed]
- Corvini, G.; Conforto, S. A Simulation Study to Assess the Factors of Influence on Mean and Median Frequency of sEMG Signals during Muscle Fatigue. Sensors 2022, 22, 6360. [Google Scholar] [CrossRef] [Scilit]
- Hausswirth, C.; Brisswalter, J.; Vallier, J.M.; Smith, D.; Lepers, R. Evolution of Electromyographic Signal, Running Economy, and Perceived Exertion During Different Prolonged Exercises. Int. J. Sports Med. 2000, 21, 429–436. [Google Scholar] [CrossRef] [Scilit] [PubMed]
- Nugent, N.S.; Majeski, J.B.; Choe, R.; Rashedi, E. Investigating the Effect of Fatigue on Muscle Microvasculature Blood Flow during Intermittent Isometric Contraction. In Proceedings of the 2020 42nd Annual International Conference of the IEEE Engineering in Medicine & Biology Society (EMBC), Montreal, QC, Canada, 20–24 July 2020; pp. 3220–3223. [Google Scholar]
- Dempsey, P.C.; Larsen, R.N.; Dunstan, D.W.; Owen, N.; Kingwell, B.A. Sitting Less and Moving More. Hypertension 2018, 72, 1037–1046. [Google Scholar] [CrossRef] [Scilit] [PubMed]
- Gao, K.; Su, Z.; Meng, J.; Yao, Y.; Li, L.; Su, Y.; Mohammad Rahimi, G.R. Effect of Exercise Training on Some Anti-Inflammatory Adipokines, High Sensitivity C-Reactive Protein, and Clinical Outcomes in Sedentary Adults with Metabolic Syndrome. Biol. Res. Nurs. 2024, 26, 125–138. [Google Scholar] [CrossRef] [Scilit]
- Lamberg, S.; Brakenridge, C.J.; Dunstan, D.W.; Finni, T.; Healy, G.N.; Owen, N.; Pesola, A.J. Electromyography of Sedentary Behavior: Identifying Potential for Cardiometabolic Risk Reduction. Med. Sci. Sports Exerc. 2025, 57, 11–22. [Google Scholar] [CrossRef] [Scilit]
- Pesola, A.J.; Laukkanen, A.; Haakana, P.; Havu, M.; Sääkslahti, A.; Sipilä, S.; Finni, T. Muscle Inactivity and Activity Patterns after Sedentary Time--Targeted Randomized Controlled Trial. Med. Sci. Sports Exerc. 2014, 46, 2122–2131. [Google Scholar] [CrossRef] [Scilit] [PubMed]
- Pesola, A.J.; Laukkanen, A.; Tikkanen, O.; Sipilä, S.; Kainulainen, H.; Finni, T. Muscle Inactivity Is Adversely Associated with Biomarkers in Physically Active Adults. Med. Sci. Sports Exerc. 2015, 47, 1188–1196. [Google Scholar] [CrossRef] [Scilit] [PubMed]
- Pesola, A.J.; Gao, Y.; Finni, T. Responsiveness of Electromyographically Assessed Skeletal Muscle Inactivity: Methodological Exploration and Implications for Health Benefits. Sci. Rep. 2022, 12, 20867. [Google Scholar] [CrossRef] [Scilit] [PubMed]

Disclaimer/Publisher’s Note: The statements, opinions and data contained in all publications are solely those of the individual author(s) and contributor(s) and not of MDPI and/or the editor(s). MDPI and/or the editor(s) disclaim responsibility for any injury to people or property resulting from any ideas, methods, instructions or products referred to in the content. |
© 2026 by the authors. Licensee MDPI, Basel, Switzerland. This article is an open access article distributed under the terms and conditions of the Creative Commons Attribution (CC BY) license.