


Abstract
This work aimed to develop a computer-aided diagnostic system that utilizes radiomics and artificial intelligence (AI) to differentiate between spinal tuberculosis and spinal metastasis, which are difficult to distinguish due to their similar visual characteristics. A total of 50 cases, comprising 25 rare cases of spinal tuberculosis and 25 cases of spinal metastasis, were included in the study cohort. Expert radiologists and orthopedic specialists manually segmented the regions of interest from the corresponding MRI images. PyRadiomics was used to extract 788 radiomic features from each segmented image. XGBoost was then applied for feature selection and SHAP values confirmed their importance. The subset of features from the previous machine learning stage were used to train a deep neural network, resulting in a radiomics-powered AI classification model. Due to the visual challenges in classifying these two diseases, human doctors achieve an average accuracy of 64%, while our well-trained model demonstrates an impressive accuracy of 93%. Along with its strong performance in external validation, this study suggests that this AI model can offer valuable assistance in achieving early and accurate differential diagnoses of spinal tuberculosis and spinal metastasis.
1. Introduction
Spinal tuberculosis (TB) and spinal metastasis (METAS) are among the most challenging diseases to differentiate from one another. Their clinical manifestations are nearly identical, including back pain, constitutional symptoms, and neurological deficits. Additionally, imaging findings can be difficult to distinguish. TB typically presents with paraspinal abscesses, vertebral destruction, and disk space involvement [1,2]. METAS often manifests with patchy or diffuse bone destruction, often characterized by multiple lesions in various vertebrae, whether at the same level or across different levels. In advanced cases, the imaging findings may become nearly indistinguishable due to the severe bone destruction and extensive involvement of large areas. Notably, early-stage TB can also manifest in a manner that spares the intervertebral disk, attributed to the absence of hyaluronidase, while potentially involving multiple vertebral levels. This overlap in presentation complicates the differentiation between METAS and TB, which makes accurate diagnosis particularly challenging. It is also important to note that spinal TB is a rare event that accounts for less than 1% of all tuberculosis cases [3,4]. With this scarcity of spinal TB cases, the diagnostic challenge becomes even greater.
Multiple previous studies and case reports have shown missed diagnoses between these two diseases [5,6,7], especially in endemic regions like in Thailand. The gold standard for diagnosis is tissue sampling, which requires conducting a biopsy. This means that biopsy must be performed for a definitive diagnosis because treatment is completely different; however, it is invasive, it is time- and money-consuming, and sometimes the results may be inconclusive due to an area of necrotic tissue in the lesion.With recent technological advancements, medical imaging AI has rapidly evolved from task-specific models toward foundation architectures and explainable systems, with increasing emphasis on radiomics reproducibility, rigorous external validation, and real-world clinical translation [8]. In recent years, the combined utilization of radiomics and AI techniques has emerged as a powerful method in medical imaging, contributing to the potential enhancement of disease diagnosis and prognosis [9,10,11,12,13]. Radiomics is a medical imaging technique involving the computation and analysis, commonly referred to as extraction, of many quantitative features from medical images [14]. This technique can provide “more than meets the eye” descriptions of the tissues or pathologies depicted in medical images through these quantitative features. Therefore, radiomics has superior ability to analyze various imaging features on MRI, such as texture, morphology, and intensity in a more sophisticated way than a human radiologist can interpret the MRI images. Studies have shown that radiomics can help differentiate TB from pyogenic spondylitis [15], between METAS cases originating from the CA lung and other cancers [16], and also between benign and malignant bone tumors [3].
Extensive research has demonstrated that, when integrated with radiomics, neural networks, a well-established AI technique, have significant diagnostic potential [17,18,19,20,21,22,23]. Remarkable progress has been made in leveraging radiomics-powered neural networks for the diagnosis of various diseases. However, a crucial gap persists in applying this state-of-the-art technique to differentiate between METAS and TB. To the best of our knowledge, only two prior studies have applied AI to differentiate spinal tuberculosis (TB) from metastasis (METAS) using MRI. Specifically, Duan et al. developed a vision transformer-based model [24], whereas Sangsin et al. evaluated convolutional neural network (CNN) architectures [25]. A comparative summary of these two studies is provided in Table 1. Nevertheless, neither study integrated radiomics with AI, which forms the core novelty of our approach.
Table 1.
Summary of AI-based methods for differentiating TB and METAS.
Therefore, in this work, we introduce a radiomics-driven neural network for distinguishing spinal TB from spinal METAS. Rather than employing abstract convolutional layers for end-to-end feature extraction, our model operates directly on quantitative radiomic metrics that explicitly capture clinically interpretable markers, such as lesion morphology and microstructural heterogeneity. By bridging human-understandable radiomic profiling with deep neural networks, this approach offers an alternative and efficient solution for classifying these two diseases. This innovative approach is anticipated to provide a more comprehensive assessment of lesions, potentially reducing the necessity for biopsies, and thereby leading to improved patient outcomes.
2. Materials and Methods
2.1. Data Acquisition and Collection
An observational retrospective study was performed at our university after obtaining prior approval from the Institutional Research Ethics Committee (HE644026) and all methods were performed in accordance with relevant guidelines and regulations.
This retrospective case–control study gathered data from patients diagnosed with either TB or METAS between 2019 and 2021. Patient information was collected from electronic medical records. The inclusion and exclusion criteria for data collection, as well as additional information, are listed below.
Inclusion criteria:
Patients diagnosed with spinal TB based on one of the following:
- Positive pathological result (biopsy).
- Positive Mycobacterium tuberculosis culture from spinal tissue.
- Positive Polymerase Chain Reaction (PCR) test of spinal tissue.
Patients diagnosed with METAS based on either of the following criteria:
- Positive pathological result (biopsy).
- An oncologist confirmed the positive MRI results and ruled out tuberculosis based on clinical and analytical validation.
Exclusion criteria:
- Absence of MRI in the PACS.
- Non-conclusive diagnosis.
METAS cases were selected from the most recent eligible patients in our institutional database. Specifically, we reviewed consecutive patients who met the inclusion criteria and selected the newest cases until the sample size matched that of the tuberculosis group (n = 25). This selection of recent cases was chosen to ensure higher data completeness, including up-to-date laboratory results, histopathological confirmation, and imaging studies of good quality. We acknowledge that the selection of more recent METAS cases may introduce a temporal bias compared to the tuberculosis group. However, this was done deliberately to maximize data quality in a retrospective setting.
Collected data:
- Demographic data (age, sex).
- Laboratory results (blood tests, etc.).
- Pathological results (biopsy reports).
- Clinical data (symptoms, medical history, etc.).
- Radiological imaging (MRI scans, X-rays, etc.).
It is important to state the limitations of this study arising from data collection. Note that some cases lack biopsy confirmation, and diagnosis was based on imaging, clinical findings, and laboratory data.
To mitigate technical variations arising from different imaging centers, vendors, and protocols, we implemented a strict standardized preprocessing pipeline applied uniformly to all MRI images, irrespective of their source. This pipeline included:
- Resampling of all images to a common isotropic voxel size (to minimize differences due to acquisition parameters);
- N4 bias field correction (to reduce intensity inhomogeneity);
- Z-score intensity normalization (to standardize signal intensity distributions across scans).
2.2. Radiomics-Based AI Classification Model
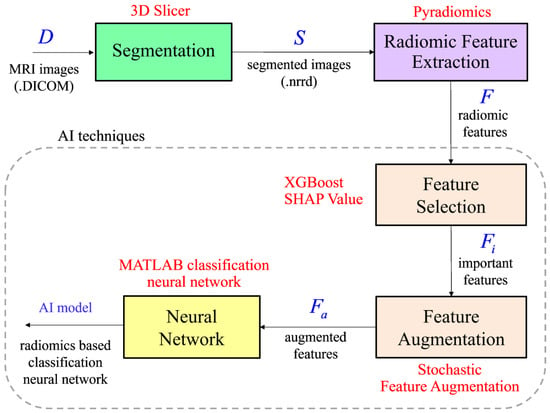
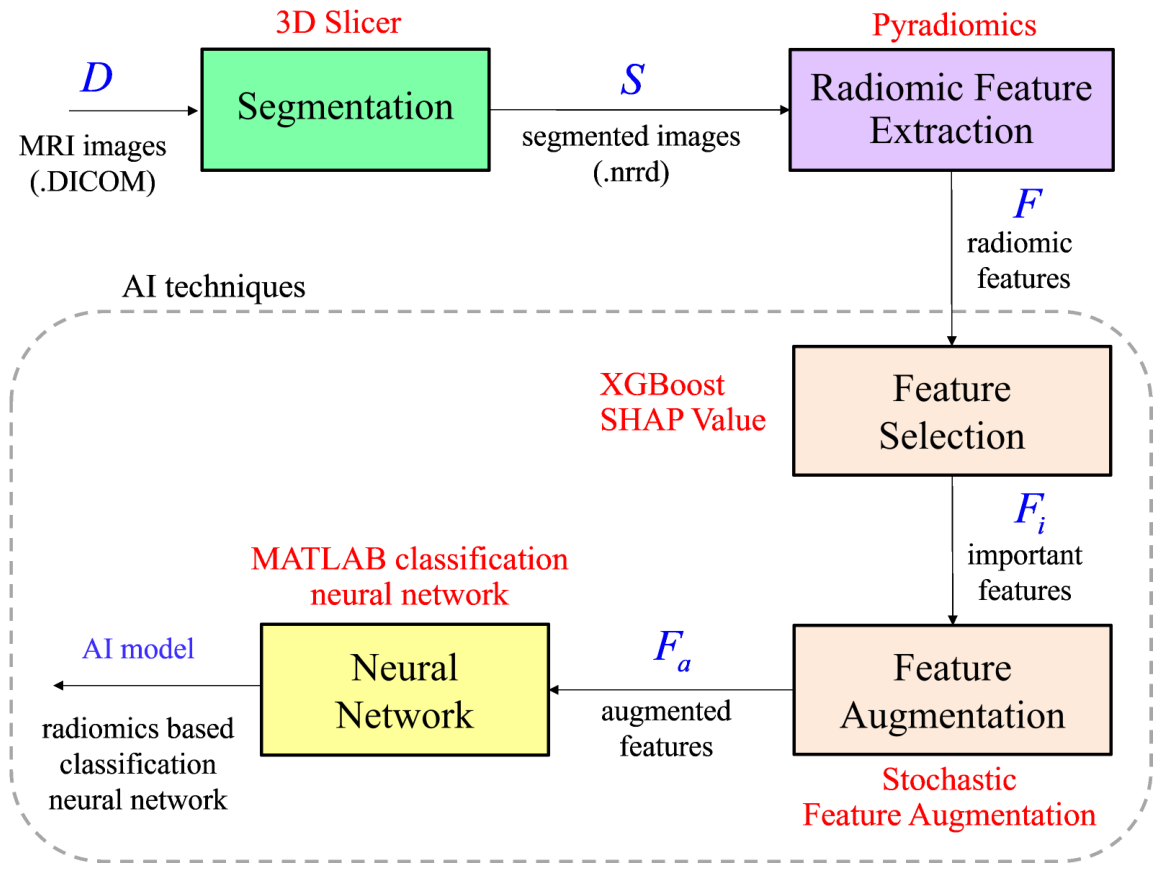
The MRI images for both patient groups were acquired from the picture archiving and communication system (PACS), the medical imaging software utilized at Srinagarind Hospital. Radiologists and orthopedists worked together to acquire, prepare, and store these images in the DICOM file format. As illustrated in Figure 1, these MRI images serve as the input for the development of our radiomics-based AI classification model. The set representing these DICOM images is denoted by , where is the notation for denoting the DICOM images for a given i-th patient, and n represents the total number of patients included in the study. This study involved 25 distinct TB cases and 25 distinct METAS cases, resulting in a total of 50 unique cases, i.e., .
Figure 1.
Generation of radiomics-based AI classification model to distinguish TB and METAS.
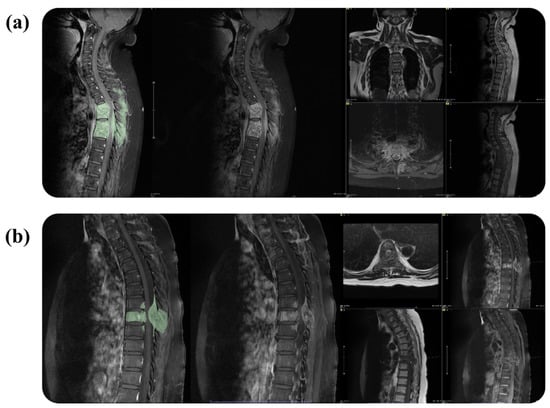
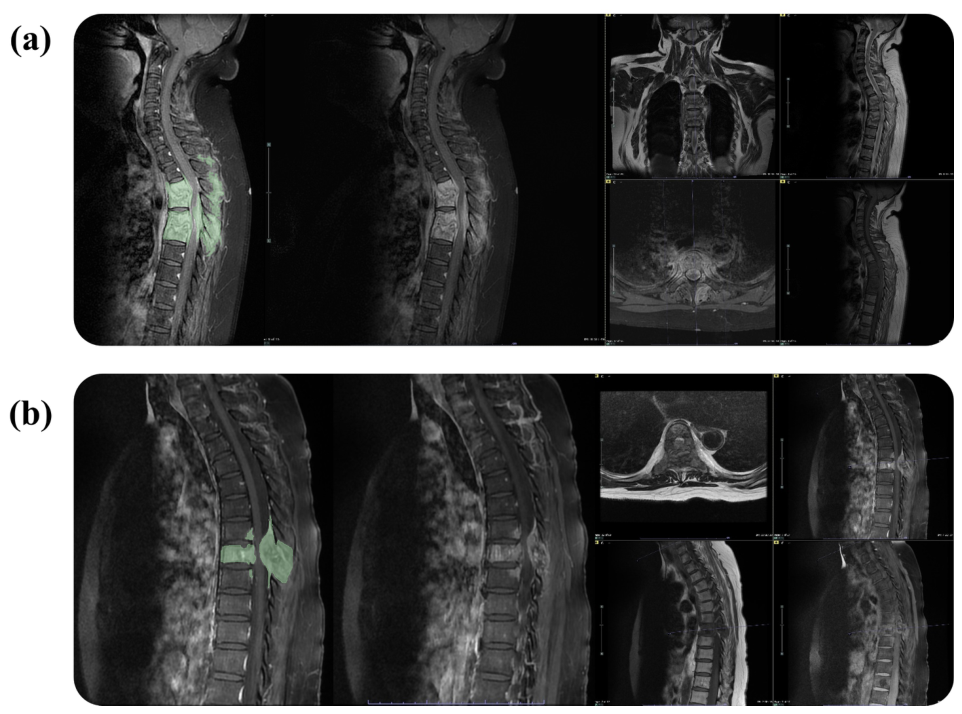
After preparing the input in the patient selection step, the MRI images for all individual patients in set D had to be segmented since this process is essential for subsequent radiomics feature extraction. 3D Slicer (version 5.0.3), a free and open-access software platform for medical image processing, was utilized for this segmentation process. Radiologists with five years of experience, in collaboration with orthopedists with four years of experience, manually delineated the region of interest by achieving consensus and using tools for drawing, painting, and erasing on a image-by-image basis. The T1-weighted fat-saturated (T1FS) post-contrast MRI sequence was utilized for every patient. This study employs T1 post-contrast imaging due to the enhancement of lesions during the post-contrast phase, which also allows for better delineation of anatomical structures. For cases where lesions were difficult to determine, additional sequences, such as T1WI, T2WI, and DWI/ADC, were opened for the clarity of the lesion. Examples of segmentation cases are shown in Figure 2. Additionally, for replication purposes, the acquisition parameters for T1-weighted inversion recovery fast spin echo (T1WIFS) MRI images with gadolinium (Gd) are as follows: TR: 500–600 ms, TE: 15–20 ms, and flip angle: 120–150°.
Figure 2.
Segmentation cases with corresponding additional sequences to clarify the segmentation area. (a) Example of segmentation applied to TB case. (b) Example of segmentation applied to METAS case.
Once the segmentation process was completed, each patient was characterized by the specific region in the MRI images corresponding to the disease. These segmented images were stored in NRRD file format, often referred to as NRRD images. The set representing these images is denoted as , where is the notation for denoting the NRRD image of the i-th patient. Therefore, for this step, it is worth stating that DICOM images of the i-th patient, , were converted to NRRD images, , through segmentation. After segmentation using a 3D slicer, the file was saved as an NRRD file for both the raw image and the masked image. In the preprocessing step, we employed SI normalization using z-scores, a simple and effective method [26].
We recognize that statistical harmonization methods such as ComBat are commonly employed in multi-center radiomics studies to further correct batch effects. However, given the relatively small sample size and the imbalance in center distribution between the two groups, we opted for robust preprocessing standardization rather than post-extraction ComBat harmonization. This decision was made to avoid potential over-correction that could remove biologically relevant variance.
By incorporating the segmentation of MRI images as the input, the Pyradiomics software package was employed in this work to extract a total of 788 features for each patient. Resampling, normalization, and wavelet filtering were applied as part of the basic parameters for PyRadiomics feature extraction. Specifically, the simpleITK BSpline was enabled in the wavelet parameter settings to perform smooth interpolation of medical images. Additionally, the binWidth was set to 25 for histogram calculation and gray level discretization in the medical images. Let be the set of extracted radiomic features, where represents all radiomic features associated with the i-th patient. It is important to note that these 788 features can be categorized into two main groups. The first category, known as default features, consists of 101 features, obtained using Pyradiomics without a wavelet filter. The second category, comprising 687 features, is achieved by customizing the extraction process, specifically by enabling the wavelet filtering option.
To determine the important features, which are indeed a subset of all extracted radiomic features, this study employs eXtreme Gradient Boosting (XGBoost, version 3.4.0), a popular machine learning algorithm for this purpose with the ultimate goal of differentiating between TB and METAS. Subsequently, SHapley Additive exPlanations (SHAP), a framework based on game theory, was utilized to rank the output of XGBoost [27]. With the combination of XGBoost and SHAP, the most relevant features regarding the classification of TB and METAS can be identified and the impact of these features can be quantified in terms of numeric value. Let be the set of these important features for the i-th patient, where k represents a number of important features. Straightforwardly, is a set of important features for all n patients in which each member represents a collection of important features of the i-th patient. To be computationally effective in constructing an efficient AI classification model, the number of important features must be kept small, i.e., . This implies a dimensional reduction in features used as input for the training model.
Only 25 cases of TB were collected in this work due to its rarity. However, from an AI perspective, this sample size is relatively small. To deal with this issue, feature augmentation must be performed to increase the size of the sample which will be fed into the training process. Stochastic feature augmentation, recognized in the literature as a simple feature augmentation technique, was used in this work [28]. The principle of this technique is briefly described as follows. Suppose that this specific augmentation takes the j-th important feature of the i-th patient as the input. The output, i.e., the augmented feature, can be expressed mathematically as
where and are random variables sampled from two different Gaussian distributions. By repeating this process q times, a single original feature can be augmented into q distinct augmented features. This technique is called stochastic feature augmentation since a random variable is used to perturb the original feature and create new ones. For simplicity, we introduce the notation XN to denote random repetitions of feature augmentation. With this notation, the feature augmentation, performed patient by patient, is given by , where is all the input features of the i-th patient of the following AI classification model, consisting of k original features plus augmented features. Additionally, from this notation, X1 represents the use of input features without augmentation. To clearly demonstrate the benefits of augmentation, we also included SMOTE, a well-known advanced augmentation technique, in this study [29].
To develop a radiomics-powered AI classification model for classifying TB and METAS, the dataset, containing well-preprocessed radiomic features of all 50 patients or , is divided into a training set and a testing set. The allocation of these two sets, commonly referred to as the train–test split, is typically implicit. Moreover, due to the limited number of patients, it is very difficult to train such a model and demonstrate its performance with traditional train–test splits, e.g., 90%:10% or 80%:20%. Unless stated otherwise, the default test–train split adopted in this work is 50%:50%, a configuration acknowledged for its difficulty in training models in AI contexts. Our training dataset consists of 13 cases of TB and 12 cases of METAS, i.e., 25 cases for training (50%). With this setting, an equitable distribution of data for both training and testing purposes is ensured.
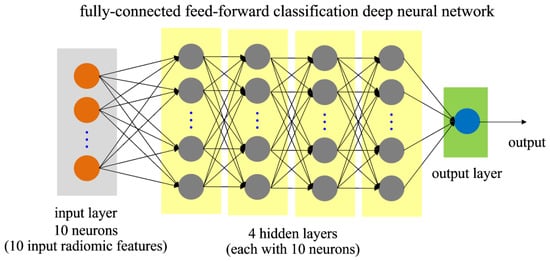
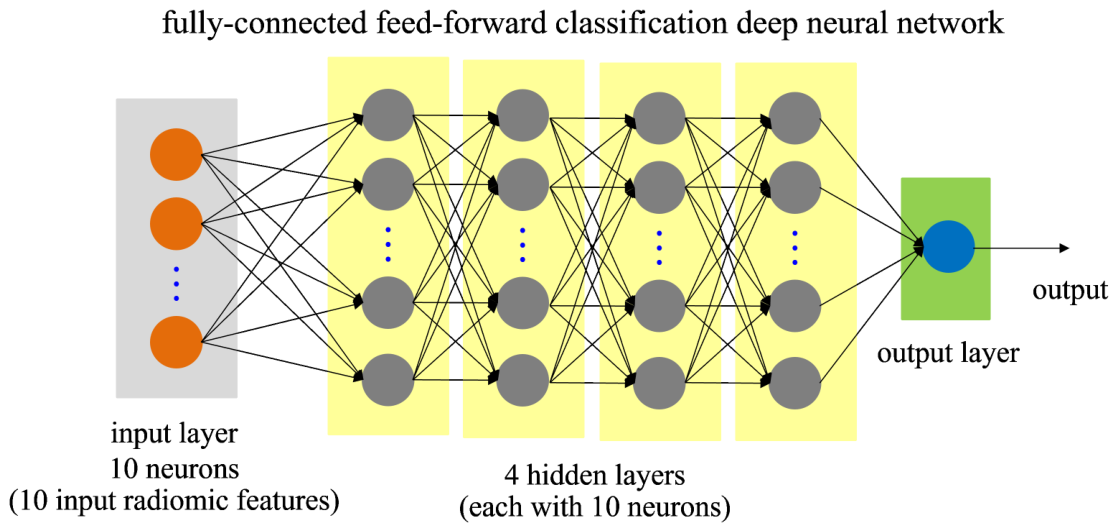
Taking the dataset containing augmented radiomic features provided in the previous step as the input, we utilize MATLAB (version R2016a) to train a fully connected feed-forward neural network with four hidden layers, each comprising 10 neurons. By adopting multiple hidden layers, this neural network is recognized as a deep neural network. Following the training process, the resulting neural network architecture, commonly referred to as the model, has the capability to perform a binary classification task, specifically, distinguishing between TB and METAS. With radiomic features as the input, this trained classification model represents a radiomics-based neural network capable of effectively classifying the two diseases. This classification neural network is graphically represented in Figure 3. It is worth noting that we utilize radiomics and three machine learning techniques, including XGBoost, SHAP, and a neural network, which are all subsets of AI, to construct the model with the ability to classify TB and METAS. Therefore, this model is a so-called radiomics-powered AI classification model, as previously mentioned throughout this paper. During the initial feature and model exploration, traditional machine learning classifiers, such as Support Vector Machine (SVM) and Random Forest (RF), were briefly considered. The deep neural network was subsequently chosen as the main focus of this study due to its flexibility in handling high-dimensional inputs and nonlinear patterns.
Figure 3.
Schematic of neural network for classifying TB and METAS.
To mitigate the risk of overfitting due to the small sample size and high feature dimensionality, several strategies were implemented. First, a rigorous feature selection process was applied to the 788 initially extracted radiomic features. Only the most discriminative and least redundant features were retained for model training, thereby substantially reducing the input dimensionality.
Second, data augmentation was performed on the segmented masks to increase the effective size and variability of the training data. Synthetic but anatomically plausible variations of the 3D segmentations were generated, enabling the multilayer neural network to learn more robust and invariant representations of TB and METAS lesions.
Third, model development and hyperparameter tuning were conducted using cross-validations to obtain a reliable estimate of performance and minimize optimism bias. Finally, the trained model was evaluated on an independent external validation dataset that was completely unseen during feature selection and model training. This external validation served as an important check for generalizability.
In summary, the specific configurations for the proposed model architecture and data augmentation protocols are detailed below:
- SMOTE Configuration and Parameters: The algorithm utilized a fixed k-neighbors value of 5, which is the empirical standard for maintaining local feature variance while preventing class overlapping. Synthetic samples were generated via linear interpolation between a minority class instance and its chosen neighbors, with proximity determined using the Euclidean distance metric.
- Stochastic Feature Augmentation (SFA): Augmentation was performed using Gaussian distribution parameters where (scaling) and (shifting) were defined by and , respectively. To prevent data leakage, data augmentation using SMOTE and SFA was applied exclusively to the training set within each cross-validation fold. The augmentation process was performed independently for each fold, leaving the testing sets entirely unaugmented.
- Neural Network Hyperparameters:
- -
- Architecture: Four hidden layers with 10 neurons each , optimized via grid search (search space: 1–5 layers, 5–50 neurons).
- -
- Optimizer: Stochastic Gradient Descent with Momentum (SGDM) with a momentum coefficient () of 0.9.
- -
- Learning Rate: Fixed at 0.001.
- -
- Loss Function: Mean Squared Error (MSE), with a sign activation function used for final classification mapping .
- -
- Training Epochs: Maximum of 1000 epochs with patience of 50.
The selection of 4 hidden layers with 10 neurons each was determined through a Grid Search optimization process to identify the most effective architecture for our dataset. The search space included a range of hidden layers (from 1 to 5) and neurons per layer (ranging from 5 to 50, in increments of 5). This specific configuration [10, 10, 10, 10] was selected as it achieved the highest classification accuracy while maintaining computational efficiency and preventing overfitting.
2.3. Testing and Evaluation of Model
To enhance the robustness and reliability of our radiomics-powered AI classification model, we utilize a combination of cross-validation techniques on our dataset. Specifically, we employ shuffle-split cross-validation, where the dataset is randomly partitioned into training and testing sets multiple times, facilitating a diverse assessment of model performance. Additionally, we also incorporate leave-p-out cross-validation with values ranging from 1 to 5. This approach involves withholding a small number of samples from the dataset as the test set while using the remaining samples for training the model. By employing these cross-validation methods, we achieve a comprehensive evaluation of our model’s performance across various data partitions, thus reducing the impact of potential data-specific variations. Ultimately, the average performance across all iterations serves as a robust indicator of the capability of our radiomics-powered AI classification model. Given the rarity of TB, our study employs 100 shuffles in the shuffle-split cross-validation, ensuring thorough representation of the data partitions, along with leave-p-out cross-validation for p values of 1 to 5.
Unless stated otherwise, the performance of our classification model is assessed through the utilization of shuffle-split cross-validation, also known as Monte Carlo cross-validation. This cross-validation approach allows us to assess the performance of our model on a large number of shuffles, which can provide robust statistical insights into the accuracy of our model with a small dataset across various data selections.
The performance of our proposed radiomics powered AI classification model is evaluated using a confusion matrix. From this matrix, we derive well-known performance metrics including accuracy, sensitivity, specificity, precision and F1-score. Before ending this section, it is important to note again that cross-validation is employed. Thus, the performance of the model must be interpreted in an averaging sense.
To strengthen the model evaluation in this study, we conducted a comparative study against human doctors by designing a diagnostic test using de-identified MRI images from the 50 patients involved in this study. Each image was to be diagnosed based on one of five choices, which imitates the real situation of diagnosis: (1) TB (definite TB), (2) METAS (definite METAS), (3) TB > METAS (more likely to be TB), (4) METAS > TB (more likely to be METAS), or (5) unable to diagnose. This test was administered to 14 doctors, categorized into four groups: radiologist staff (general), radiologist residents, orthopedic residents and spine surgeons. It is important to note that spine surgeons are expected to have the highest expertise in diagnosing these diseases. The diagnostic confidence of human experts, originally captured on a 5-point Likert scale (1 = ‘Definitely TB’ to 5 = ‘Definitely Metastasis’), was converted into a binary classification for direct comparison with the AI model. Scores of 1 and 2 were mapped to TB, while scores of 4 and 5 were mapped to METAS. To maintain a conservative estimate of human expert performance, any indeterminate responses (score of 3) were treated as incorrect diagnoses in the final accuracy calculation.
To further enhance model evaluation, we conducted external validation using 10 unseen cases. This external test set consists of 5 cases of TB and 5 cases of METAS. In accordance with ethical and privacy guidelines, MRI images associated with these cases were obtained from two independent medical institutions, which were Khon Kaen Hospital (3.0T Siemens Lumina) and Yasothorn Hospital (1.5T Philips Prodiva CS). After receiving the MRI images, we applied the same procedures, including segmentation and feature extraction, to prepare the testing inputs. The well-trained model was then evaluated on these inputs to observe model performance. This validation serves as a performance test on a new test set to demonstrate model robustness and generalizability.
We used two AI checklists, which were the METhodological RadiomICs Score (METRICS) [30] and Checklist for Artificial Intelligence in Medical Imaging (CLAIM) [31], to ensure that the quality of this work is sufficient. It was found that the total METRICS was 80.9%, categorized as an excellent score. The structure and organization of the paper also follow almost all of the items listed in CLAIM. Note that METRICS and CLAIM evaluation reports are provided as Supplementary Materials of this work.
3. Results
3.1. Case Distribution and Characteristics of the Patient Data
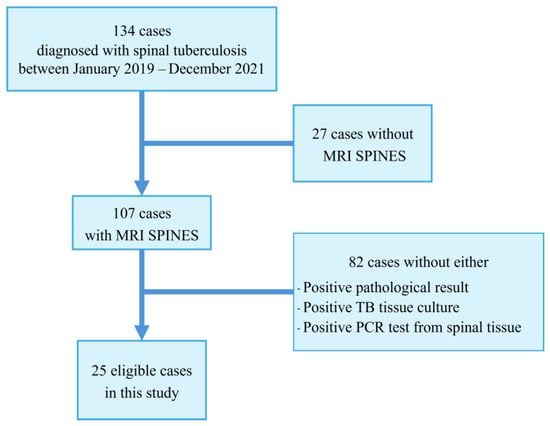
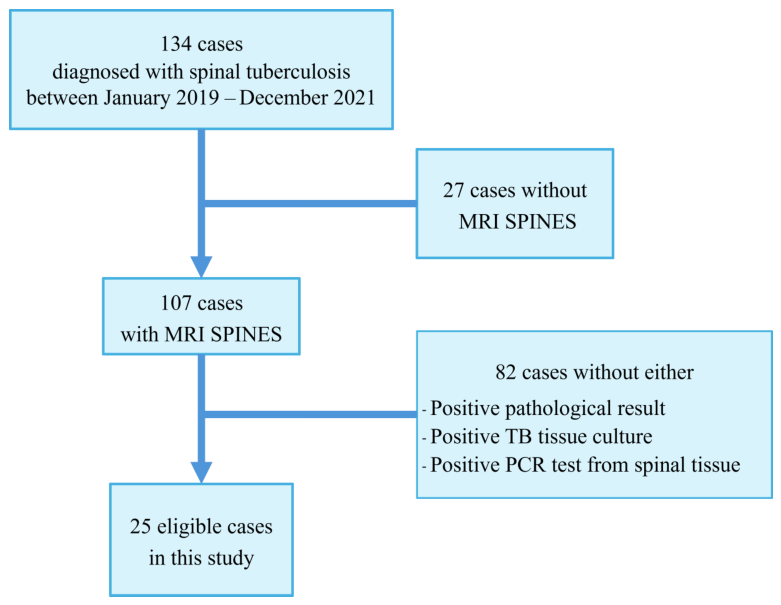
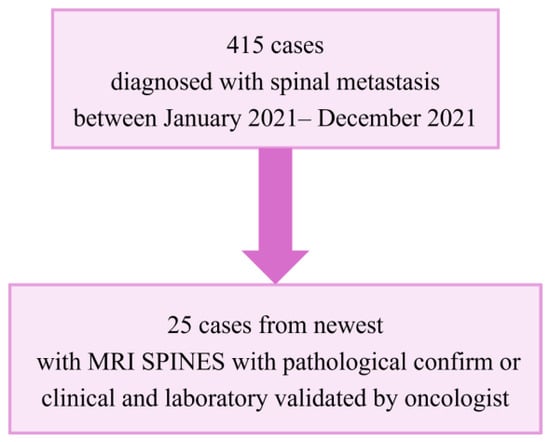
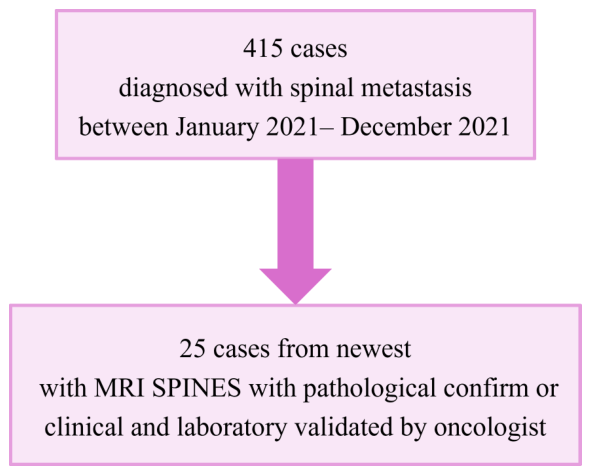
Our research data consists of a relatively small number of patients, consisting of a total of 50 hospitalized patients, as illustrated in Figure 4. To avoid the class imbalance problem, we included only patients with METAS to meet the required number of TB cases.Among these patients, 25 were diagnosed with METAS, while the remaining 25 were diagnosed with TB, as shown in Figure 5. Patient demographics are summarized in Table 2. It can be observed from the table that there are 18 females and 32 males. Notably, the mean age of patients diagnosed with METAS is greater than that of patients with TB which is consistent with the epidemiology of the disease. A two-sample t-test was performed to evaluate the difference in mean ages between the METAS and TB groups. The test yielded a p-value of 0.0629, which is greater than the conventional threshold of 0.05. Although there is an age difference between the two patient groups, the regions of interest included in the segmentation process do not involve anatomical features that may indicate characteristics related to age in the MRI images. As can be seen from Table 2, there is a significant predominance of male patients in the case of METAS, whereas the opposite is true for patients with TB. However, a Chi-square test was conducted to examine the relationship between sex and diagnosis. The Pearson Chi-square value was 0.24 which is greater than the conventional p-value of 0.05. This indicates that sex is not significantly associated with the differentiation of TB and METAS in this study. Table 3 shows the primary malignant cancers of metastasis, which are consistent with the epidemiological data. Cancers of the breast and prostate are the most common, followed by lung cancer, Cancer of Unknown Primary (CUP), thyroid cancer, colon cancer, Diffuse Large B-Cell Lymphoma (DLBCL), and pancreatic cancer.
Figure 4.
Flow diagram of TB patient selection.
Figure 5.
Flow diagram of METAS patient selection.
Table 2.
Demographic characteristics of TB and METAS patients.
Table 3.
Primary malignant cancers (CAs) of METAS.
Table 4 compares the MRI findings of patients with TB and METAS and it is important to note a potential bias in the data source. TB cases came from various hospitals (multi-vendor), whereas most METAS patients were diagnosed at our own institution. Clinically, patients with TB often present with an unknown primary infection and typically come from rural hospitals where MRIs are performed elsewhere. Conversely, patients with METAS are more likely to have received prior cancer treatment at our hospital, leading to subsequent MRI scans being conducted here.
- Only skip lesion shows a statistically significant difference ().
- Vertebral body collapse and disk signal change show trends () but are not statistically significant at the conventional 0.05 level.
Table 4.
MR findings.
3.2. Important Features
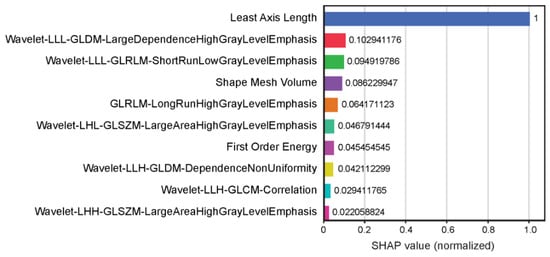
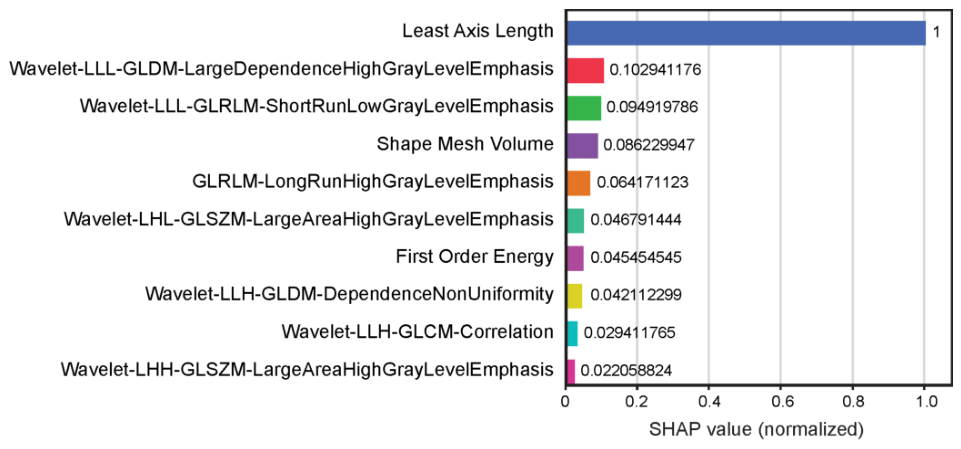
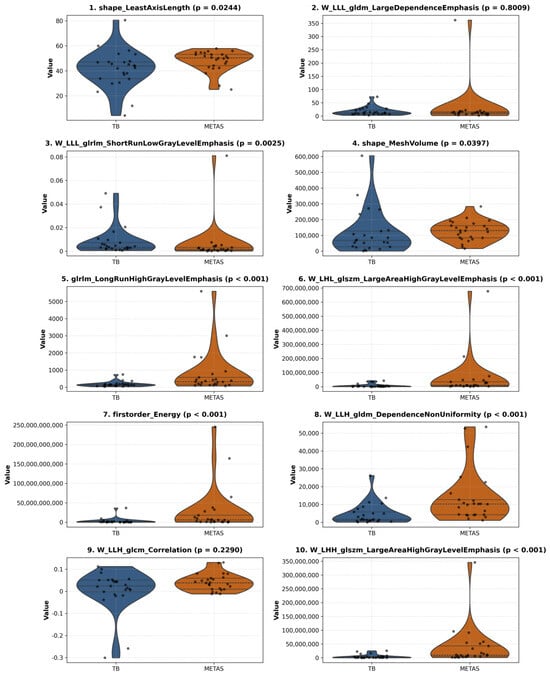
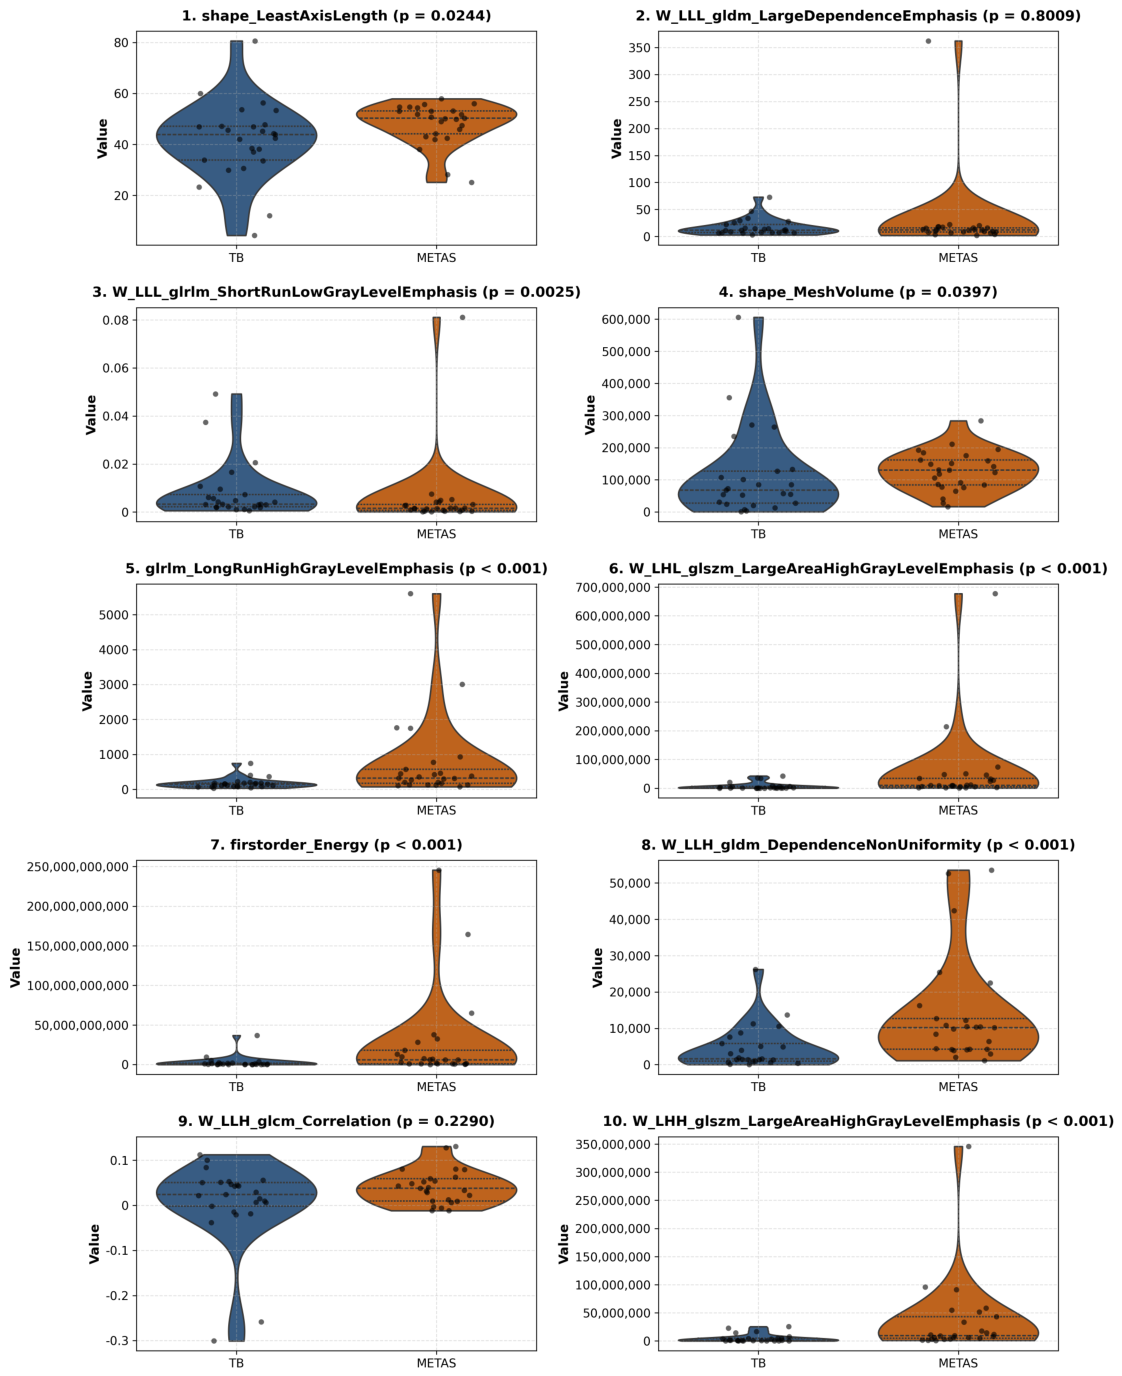
By utilizing all 788 radiomic features, obtained from the feature extraction process (using Pyradiomics), as input for XGBoost-SHAP, we produced Figure 6, which illustrates only the top ten most important high-impact features and their associated normalized SHAP values. Through pretesting, we have found that is sufficient to yield a well-performing neural network. Therefore, this number is fixed at ten for simplicity and consistency. It is obvious from the figure that the Least Axis Length has the highest SHAP value and can be considered to be the most important feature in this feature selection. It is worth noting that SHAP values provide numeric approximations of the model behavior and these values do not guarantee a perfect account of how a model operates. Therefore, we needed to conduct numerical experiments to validate the effectiveness of these important features, as elaborated in the following subsection. Additionally, violin plots of the top 10 extracted features are shown in Figure 7. Mann–Whitney U testing revealed that 8 out of the 10 features exhibited statistically significant differences () between the TB and METAS groups.
Figure 6.
The important features obtained from XGBoost-SHAP.
Figure 7.
Distribution of top 10 radiomic features via violin plots in TB and METAS cohorts.
3.3. Classification Performance
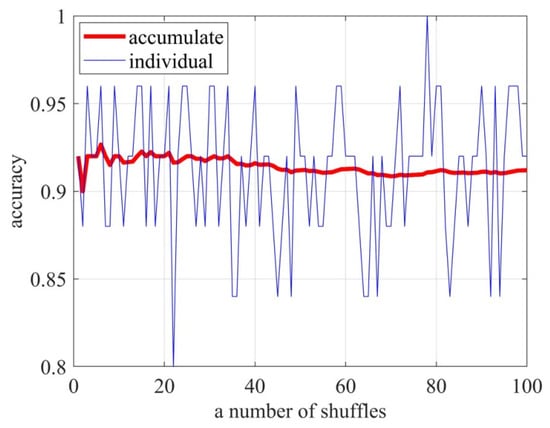
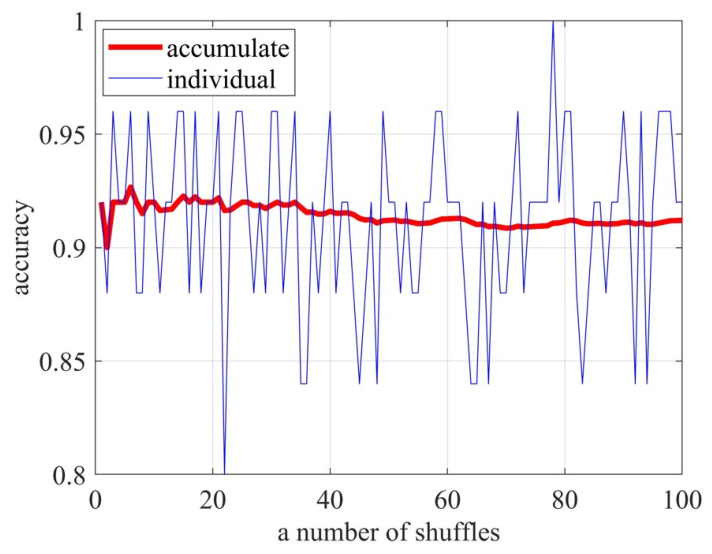
In our initial findings, the appropriate number of shuffles is determined to ensure a robust assessment of our model performance. It is important to note that while a larger number of shuffles tends to yield stable results, it also significantly increases the computational time. Conversely, too few shuffles may fail to provide reliable and consistent outcomes. To explore this optimal number of shuffles, the cumulative average performance over successive shuffles and the individual accuracy of each shuffle are depicted in Figure 8. As can be seen, if this number is less than 30, the average performance still fluctuates. Our experiment reveals that employing at least 50 shuffles is sufficient for generating reliable assessments across various data partitions. The average accuracy approaches 0.916 after 80 shuffles. Therefore, based on these findings, 100 shuffles was chosen for all subsequent experiments and results.
Figure 8.
Cumulative average performance over successive shuffles of neural network for classifying TB and METAS.
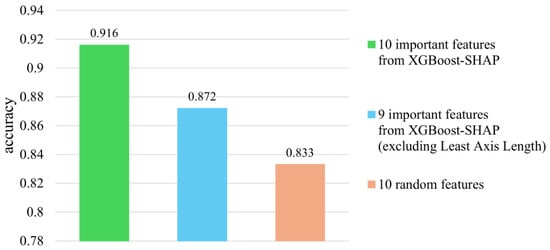
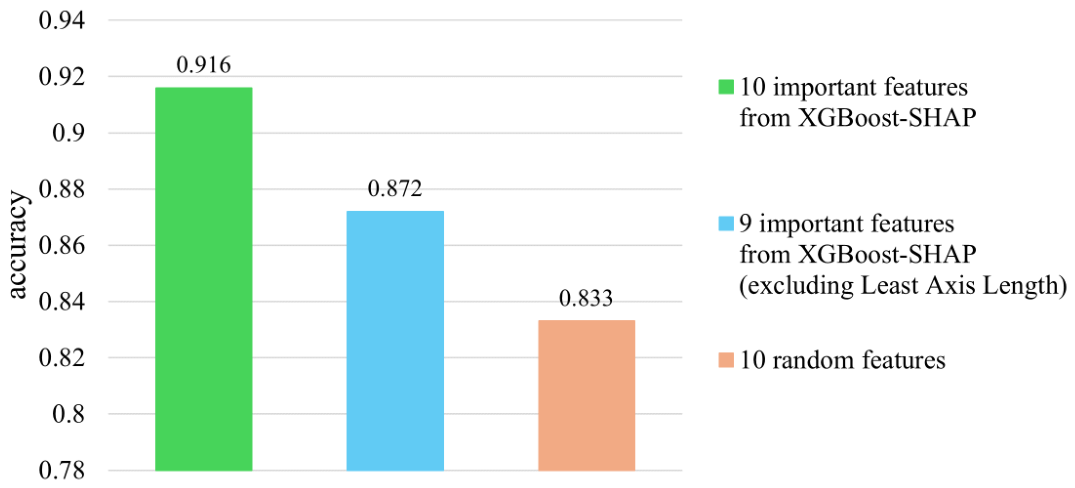
A numerical experiment was conducted to assess the effectiveness of key radiomic features selected by XGBoost-SHAP in distinguishing between TB and METAS. We compared the accuracy of three neural network models, each trained on different sets of radiomic features. For the first case, the neural network was trained using the top ten most important features selected by XGBoost-SHAP, as shown in Figure 9. For the second case, we excluded the highest-ranked feature, Least Axis Length, from the top ten to evaluate its impact on model performance. For the last case, we randomly selected 10 features from the full radiomic feature set, under the assumption that this random selection may lead to lower performance. The performance of these three models is shown in Figure 9. As expected, the model trained on the top ten most important features achieved the highest accuracy in classifying TB and METAS. The model with the exclusion of the top-ranked feature still performed reasonably well, while the model trained on randomly selected features showed the lowest performance.
Figure 9.
Performance of neural network with various dataset types from three feature selection cases.
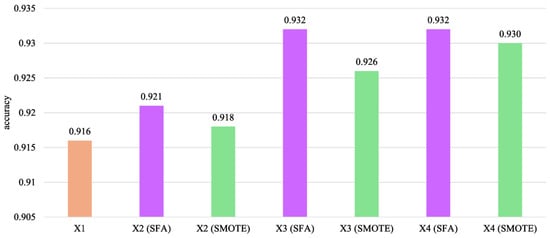
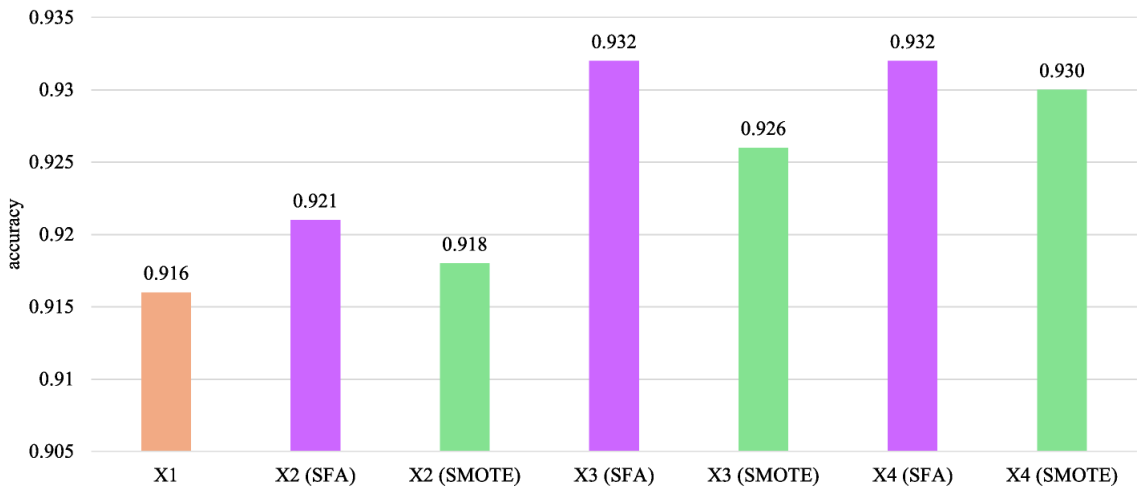
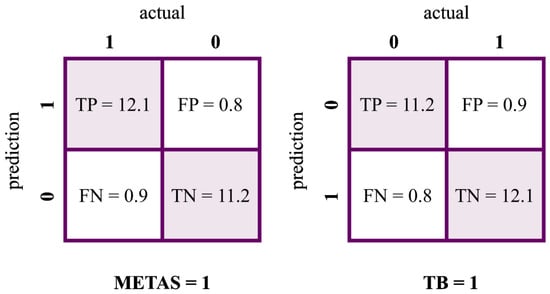
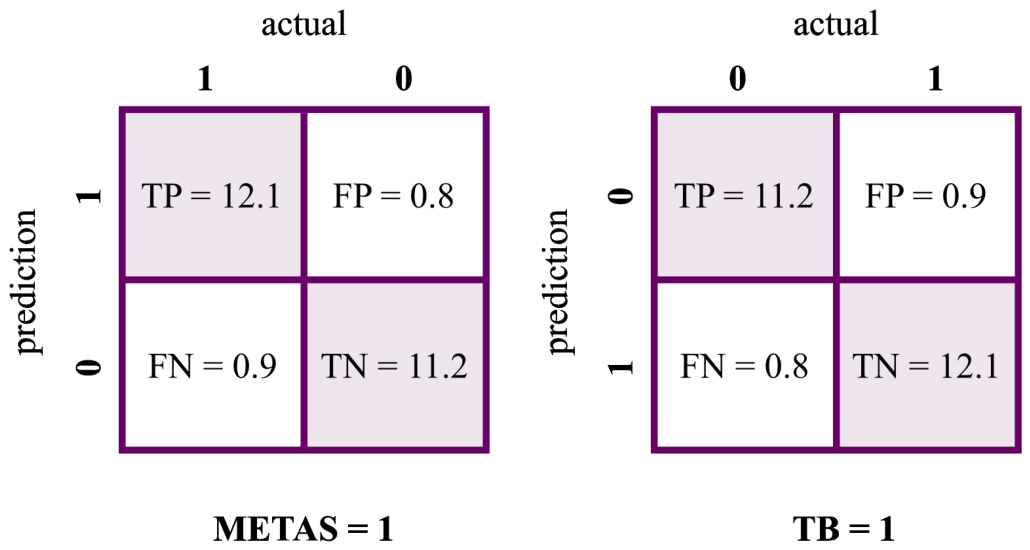
The previous experiment demonstrated the effectiveness of the radiomics-based neural network in distinguishing between TB and METAS. To further improve to model performance, a more robust model using feature augmentation was explored. The performance of the neural network models after augmentation is shown in Figure 10. Both SPF and SMOTE augmentation strategies yield identical results. Notably, with X3 scaling, the model reaches an impressive accuracy of 93%. However, no further improvement is observed at X4 scaling, suggesting that performance improvement saturates at X3. This finding highlights that model enhancement can be achieved through feature augmentation. This also implies that increasing the number of patients substantially strengthens the radiomics-based neural network. Figure 11 specifically illustrates the average confusion matrices to further show the model’s performance. From these matrices, the following useful performance metrics were calculated. Additional evaluation metrics are summarized in Table 5.
Figure 10.
Performance of classification neural network utilizing feature augmentation.
Figure 11.
Average confusion matrices from the neural network classification model during the test phase. This result is based on X3 data augmentation and 100 shuffles of Monte Carlo cross-validation. The left matrix shows METAS as the positive class, while the right matrix shows TB as the positive class.
Table 5.
Additional performance metrics of the classification model for METAS and TB.
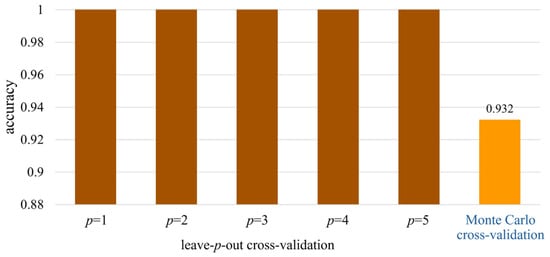
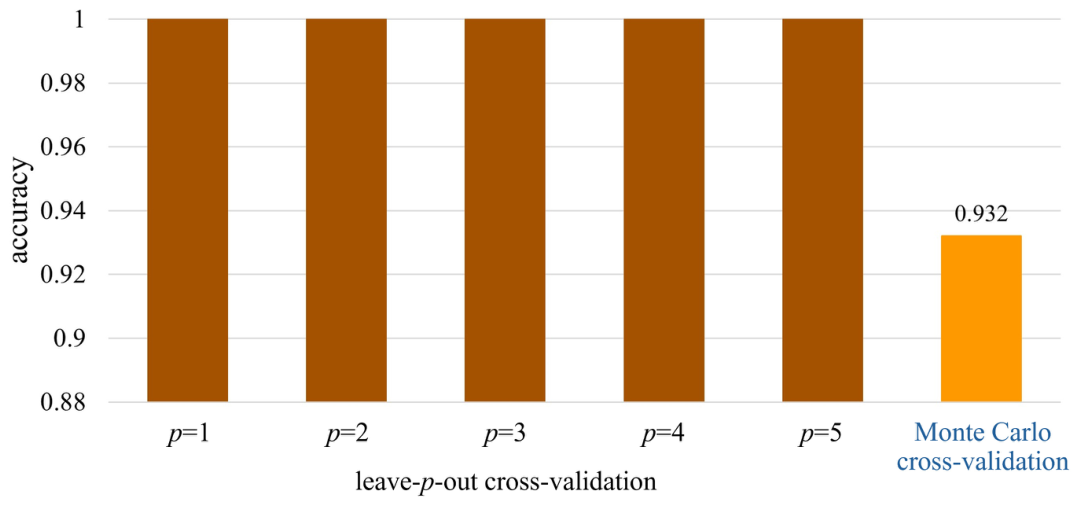
Figure 12 illustrates the accuracy of our AI model with leave-p-out cross-validation for p values ranging from 1 to 5. The best-performing accuracy from Monte Carlo cross-validation, obtained from the previous experiment, is also depicted in this figure for comparison purposes. It is clear that leave-p-out cross-validation achieves an impressive 100% accuracy for all p values. This implies that our radiomics-powered neural network is very robust and can be utilized as a classification model. Note that the computational demands increase significantly with increasing p, rendering testing times prohibitively long beyond .
Figure 12.
Model performance under two cross-validation techniques.
A comparative study was conducted to evaluate the performance of the AI model against four groups of human doctors: radiologist staff, radiology residents, orthopedic residents, and spine surgeons. Table 6 presents the accuracy of the doctors in classifying TB and METAS. As anticipated, spine surgeons achieved the highest accuracy at 92%. On average, human doctors attained an accuracy of 65.6%, with the lowest-performing group scoring 42%. The previously discussed performance metrics of the AI model are also included in this table for the sake of comparison. This underscores the superior diagnostic performance of the AI model compared to the human experts. Finally, the proposed radiomics-powered AI model was further evaluated using an external test set consisting of 10 cases. This external validation revealed only two misclassifications, where the model incorrectly diagnosed METAS as TB on two occasions. As a result, an excellent accuracy rate of 80% was achieved.
Table 6.
Diagnostic performance of human doctors compared to radiomics-powered AI model. Values outside parentheses indicate performance with METAS as the positive class, while values inside parentheses represent performance with TB as the positive class.
4. Discussion
Differentiating between TB and METAS can be particularly diagnostically complex when a patient presents with pain, progressive motor weakness, sensory loss, or even bladder/bowel incontinence, accompanied by fever, weight loss, and night sweats, with no known underlying disease or absence of a readily identifiable etiology. Despite undergoing spinal MRI, patients presenting with MRI findings of bone destruction, soft tissue mass, and heterogeneous enhancement, although common patterns, cannot be reliably differentiated between these two diseases [1,5,6,7]. Despite reports documenting frequent misdiagnosis due to the resemblance between TB and METAS [9], the diagnostic accuracy of existing differentiation methods [10,11], including MRI scoring systems [12,13], is still limited. Previous attempts using deep learning, however, have not focused on radiomic features, and their reported accuracy may not generalize well to external validation sets [14].
As a tertiary care hospital, we frequently receive outsourced MRI scans from smaller referring hospitals, resulting in data from a variety of MRI manufacturers and vendors. Incorporating this heterogeneous data expands the sample size and enhances dataset diversity, supporting the development of more robust and generalizable radiomic models [15]. However, we acknowledge an imbalance in vendor distribution between the TB and METAS groups, which may partially limit the strength of our generalizability claims. This approach is particularly relevant for diseases with a low prevalence, such as those of the spine, for which large datasets are critical for reliable model development. METAS cases typically involve patients with a known malignancy previously treated at our hospital. These patients may develop METAS due to disease progression or the natural course of the disease. Consequently, the majority of MRI examinations for METAS at our institution originate from our in-house MRI unit. While working with such diverse data can pose analytical challenges compared to models using standardized protocols or specific vendors, this heterogeneity also offers a valuable opportunity to assess the generalizability of our model across diverse scanners and protocols in real-world applications. To address these challenges, we employed z-score normalization as a preprocessing step before feature extraction.
Our study addresses this challenge by developing a radiomics-based classification neural network model to accurately distinguish between TB and METAS. It is worth noting the important limitation of this work whereby some cases lack biopsy results. Therefore, only imaging, clinical findings, and laboratory data were used as criteria for diagnosis. Our radiomics-based deep neural network model offers promising advantages in differentiating between TB and METAS. By analyzing quantitative features within MRI data using advanced algorithms, our model has the potential to surpass the performance of traditional human interpretation with an accuracy of 93%. This approach could reduce reliance on invasive biopsies, which often face limitations due to inconclusive results or targeting granulation/necrosis. To expedite diagnosis and ultimately improve patient outcomes, the model may aid in facilitating earlier and more appropriate treatment initiation. The similarity of conventional MRI findings between the TB and METAS groups (Table 4) partly reflects the advanced stage of presentation in many cases. Nevertheless, this overlap underscores the inherent difficulty in differentiating the two conditions on standard imaging and emphasizes the potential added value of radiomics in such challenging scenarios.
Regarding radiomics feature extraction process, the Least Axis Length, which is the top-ranked feature as shown in Figure 6, is defined as the smallest axis of the ellipsoid that encloses the region of interest (ROI) and is computed using the physical coordinates of the voxel centers defining the ROI. With precise segmentation, it is intuitive to think that the spatial distribution of TB and METAS differs significantly. Our further analysis confirmed that the mean Least Axis Length between TB and METAS is distinct. While it might be argued that the spacing difference related to this feature could be visually observed, potentially diminishing the necessity of the radiomics approach, we addressed this by conducting an additional experiment. We excluded the Least Axis Length from the model and trained it using only the other important features. Although the resulting performance dropped slightly, the decrease was not significant, as shown in Figure 9. This suggests that while Least Axis Length is an important feature, the other features also provide substantial diagnostic power.
The Least Axis Length was identified as the most important radiomic feature in our model. This shape feature quantifies the smallest axis length of the ellipsoid that best encloses the lesion and reflects the minimum thickness (thinnest dimension) of the 3D volume. Our analysis showed that the mean Least Axis Length was mm in the TB group compared with mm in the METAS group (Mann–Whitney U test, ). This indicates that TB lesions tended to have a larger Least Axis Length than METAS lesions. Anatomically, this feature effectively captures the contrasting growth patterns between the two pathologies. TB often presents with expansive, circumferential paravertebral abscesses and relatively preserved or elongated dimensions across multiple planes, whereas METAS typically shows more focal, asymmetrical, and destructive bone involvement that reduces the minimal axis length. Thus, Least Axis Length serves as an objective morphological marker that helps the model differentiate these complex patterns, which may sometimes be subtle on conventional imaging. Additionally, another limitation of this study lies in the feature selection pipeline. Although XGBoost combined with SHAP feature importance was applied to select the top discriminative radiomic features, an explicit statistical collinearity or redundancy analysis was not performed on the final feature subset. While tree-based algorithms and deep neural networks can inherently model complex interactions, relying solely on model capacity without preliminary collinearity filtering may retain redundant features.
Given the rarity of TB and its potential to complicate the diagnosis of METAS, we sought to investigate whether augmenting the dataset with additional cases of TB could enhance the performance of our model. Through relatively simple stochastic feature augmentation and the well-known SMOTE technique, we systematically increased the number of synthetic cases in our dataset and evaluated the impact on model performance. Our findings, as illustrated in Figure 10, reveal a notable improvement in accuracy when utilizing augmented datasets, particularly with X3 scaling. This finding suggests that augmenting the dataset with additional cases of TB can indeed contribute to the construction of a more robust radiomics-based neural network. This result also implies the importance of dataset size for model performance and highlights the potential benefits of incorporating stochastic feature augmentation techniques to enhance the effectiveness of AI models in clinical applications.
Incorporating robust cross-validation techniques is essential for validating the reliability and effectiveness of AI models, especially when dealing with small datasets. Our results, as illustrated in Figure 12, highlight the impact of two cross-validation approaches on the accuracy of our model in classifying TB and METAS. Leave-p-out cross-validation demonstrates remarkable accuracy, reaching 100% for p values ranging from 1 to 5, indicating the robustness of our model across various test set sizes. However, the computational demands increase significantly with higher p values, making testing times impractical beyond . On the other hand, shuffle-split cross-validation, utilizing 100 shuffles, provides a reliable assessment of model performance, achieving an accuracy of 93%. These findings underscore the effectiveness of our AI model in classifying between TB and METAS, while also highlighting the importance of selecting appropriate cross-validation techniques to ensure reliable results despite dataset limitations. It should be acknowledged as a limitation that, due to the execution of multiple cross-validation approaches and extensive experimental runs, epoch-level learning curves were not retained during training. Consequently, this hinders the granular evaluation of model convergence and stability.
Despite the benefits of data augmentation, this study is limited by its small original sample size (), which can lead to reduced statistical power, increased margins of error, and limited generalizability in the case of broader populations. We address this limitation by conducting the comparison against human doctors and the independent external validation. As shown in Table 6, our proposed AI model demonstrates superior diagnostic accuracy. While the average performance of human doctors across different specialties was 73.4%, the AI model can achieve an accuracy of 93.2%. This significant difference highlights the effectiveness of the AI approach in diagnosing TB and METAS. This difference also highlights the limitation of human interpretation which can be more subjective and prone to error From the results, a wide range of diagnostic performance, ranging from 42% to 92%, was observed among human doctors. Interestingly, a spine surgeon, who has the best potential for accurately making this diagnosis, performed worse than a radiology resident. This result implies the inherent difficulty in differentiating between TB and METAS using MRI images. It is also seen that the AI model, with accuracy of 93%, performs identically to the best-performing spine surgeon, with accuracy of 92%. A one-sample t-test confirmed that the AI model achieved statistically significantly higher diagnostic accuracy than the cohort of doctors (, ), thereby rejecting the null hypothesis of equal performance.
The robustness of our AI model was further validated using an external test set comprising 10 cases of TB and METAS. Despite the challenges associated with differentiating these conditions based on MRI imaging, the AI model demonstrated great performance by achieving an accuracy of 80%. Only two misclassifications occurred, where two METAS cases were mistakenly identified as TB. Error analysis revealed that prediction failures predominantly occurred with low confidence scores near the decision threshold. Retrospective review by an expert medical team confirmed that these misclassified instances represented diagnostically ambiguous cases, where both human experts and the model experienced high diagnostic uncertainty. However, this validation suggests that the proposed AI model holds significant promise for practical clinical applications. Future efforts could focus on expanding the external test set to include a wider range of cases. This external validation reinforces the model capability to generalize well to unseen cases and confirm its potential for real-world settings. It is important to emphasize that this study focused specifically on the differential diagnosis between TB and METAS. However, the absence of a broader control cohort containing other non-TB and non-metastatic spinal pathologies presents a limitation, particularly regarding the evaluation of false-positive rates in general clinical practice. Expanding the cohort to include a wider spectrum of spinal diseases will be pursued in future work.
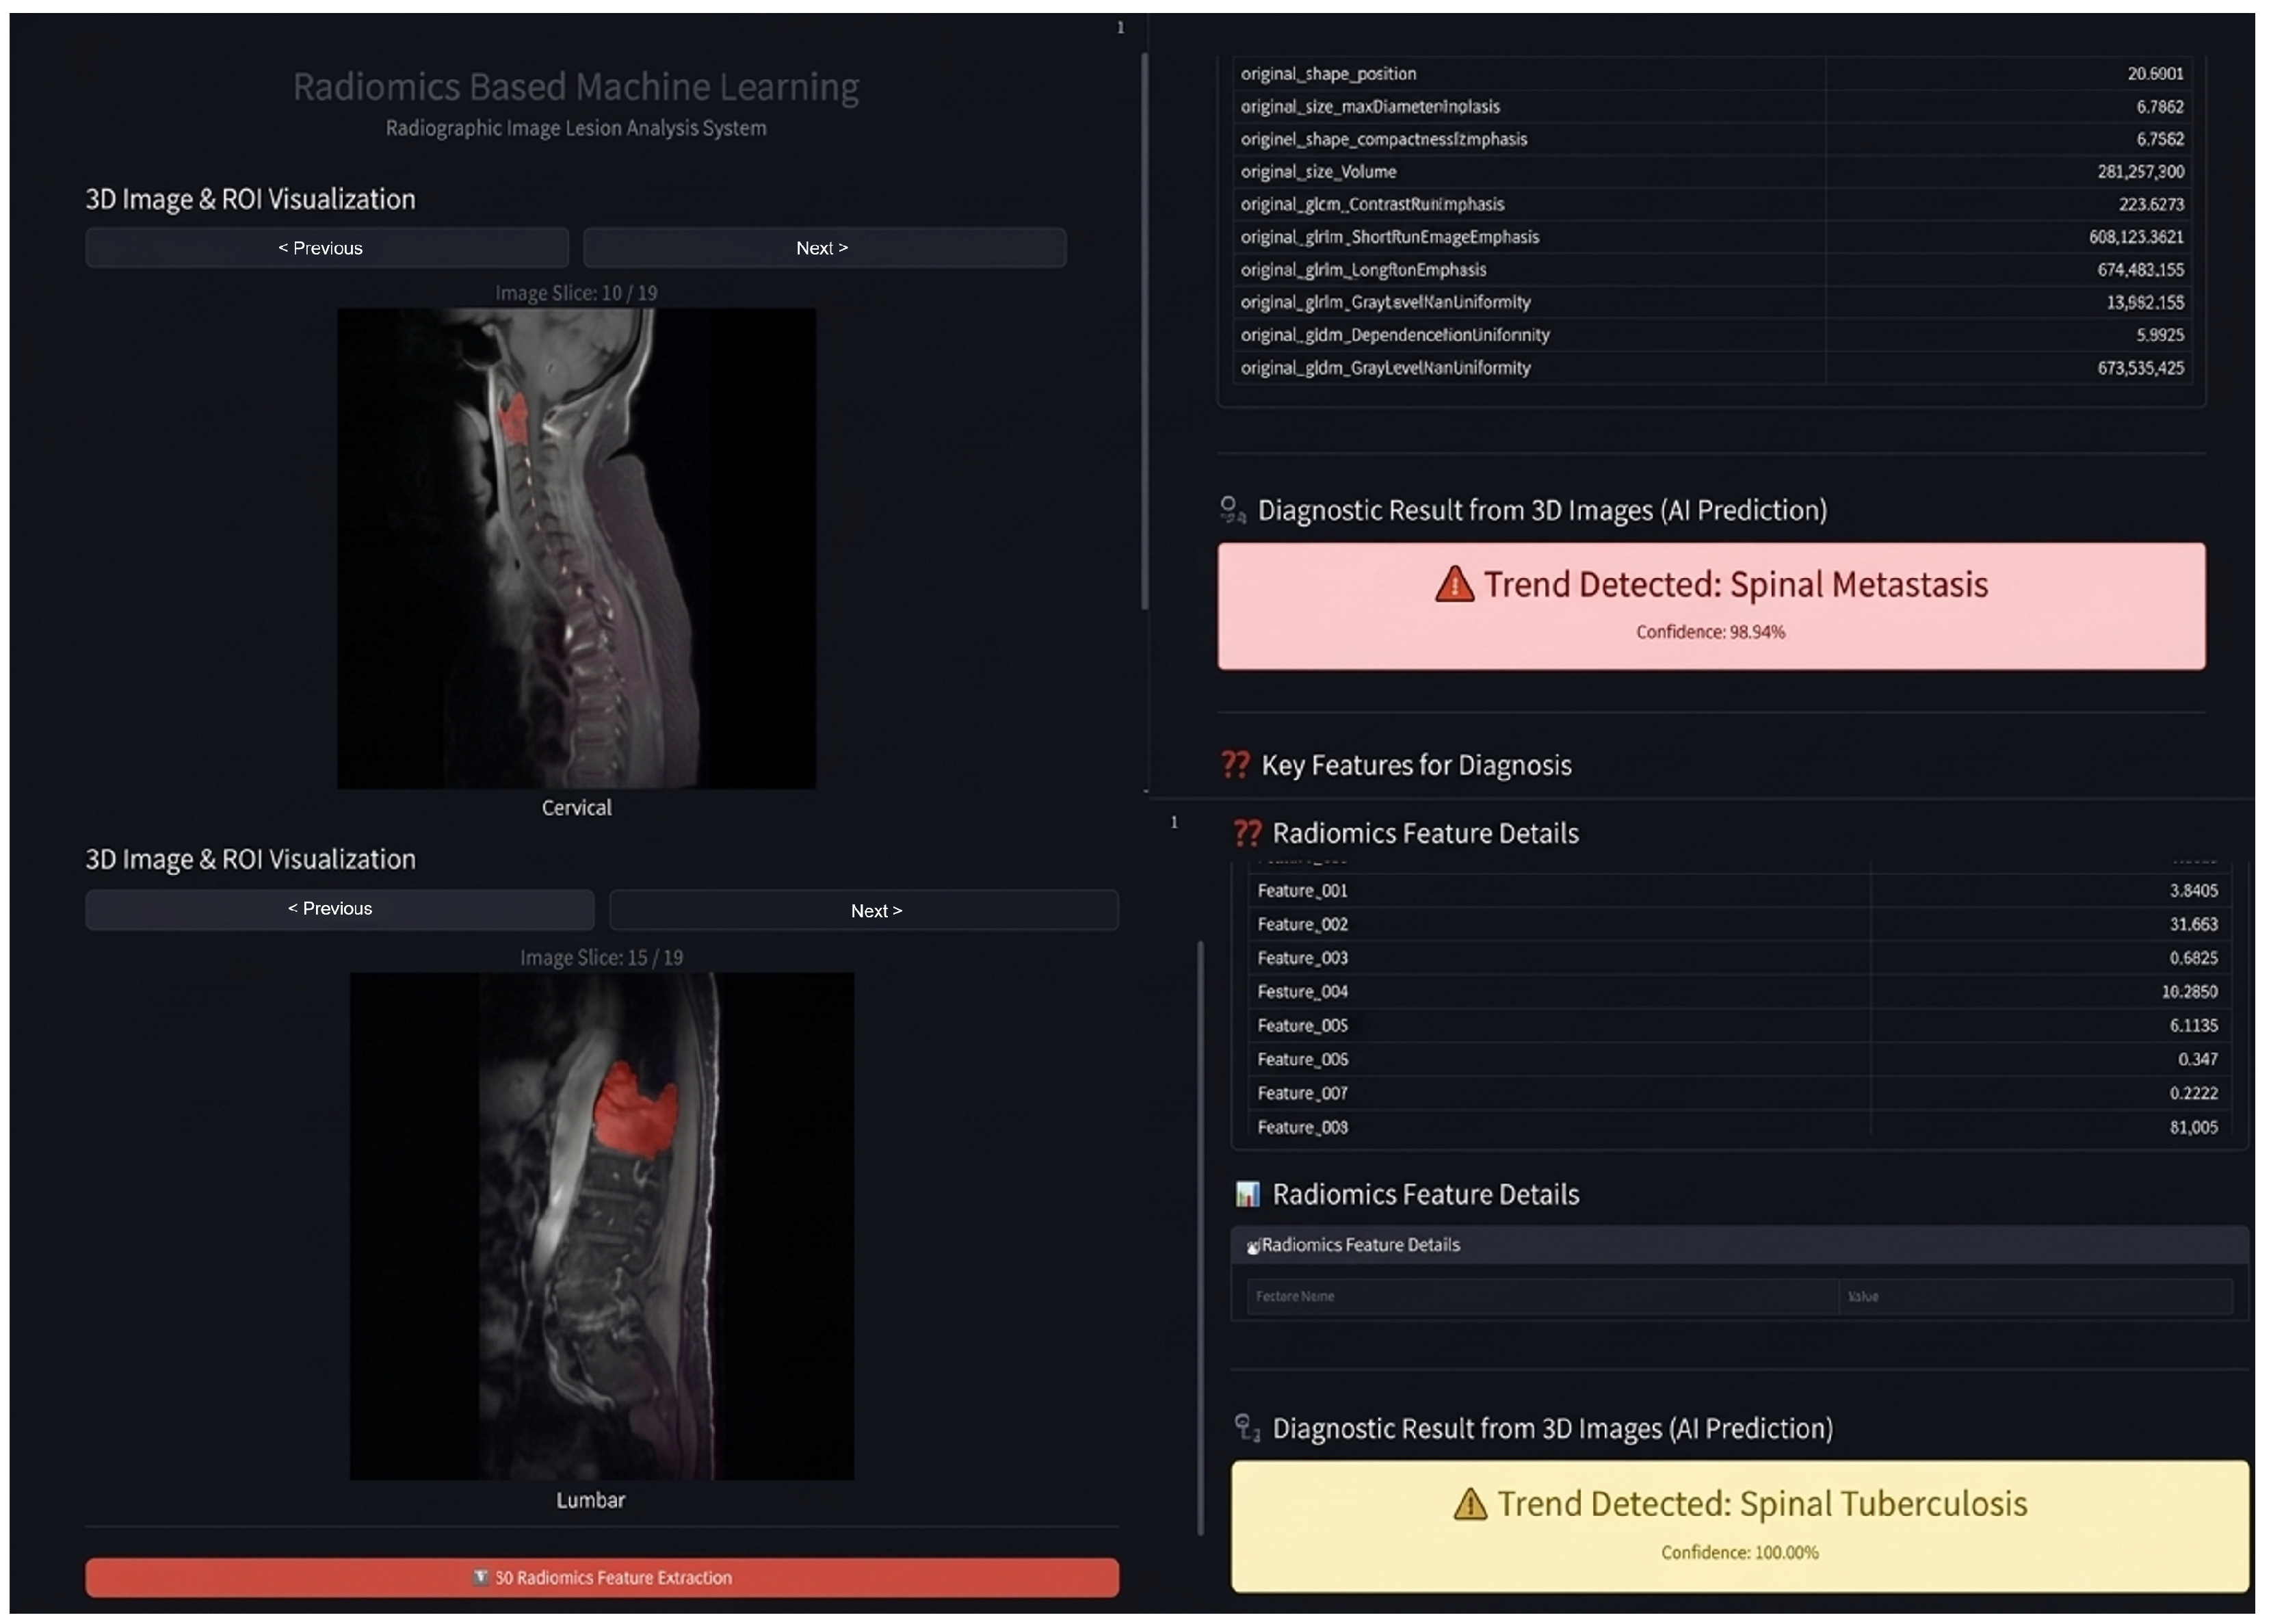
Although TB has a relatively low incidence in general public health, distinguishing it from METAS presents a major clinical challenge due to their overlapping clinical presentations and MRI manifestations. To further validate the potential of AI development and real-world clinical translation, we deployed our model as an accessible web-based diagnostic platform, as shown in Figure 13. During initial clinical integration, the platform was prospectively evaluated on six real-world routine cases. The platform achieved 100% diagnostic accuracy, with 6/6 cases correctly classified. To preserve the structural integrity of our retrospective study protocol, these routine prospective cases were excluded from the primary experimental cohort. Nevertheless, this real-world implementation serves as a practical proof-of-concept, validating the proposed model’s utility as a decision-support tool in clinical workflows.
Figure 13.
The deployed web-based diagnostic platform (https://indie-ct.enit.kku.ac.th/tbmetas (accessed on 26 July 2026)) for real-world spinal TB and METAS classification.
Regarding clinical implementation, it is important to emphasize that the proposed AI-based model is designed to serve as a decision-support tool rather than a replacement for experienced clinicians or radiologists. In real-world clinical practice, differentiating TB from METAS remains challenging due to overlapping radiological features. Integrating our model as a second reader can assist radiologists by providing objective quantitative feature analyses, thereby reducing diagnostic errors and expediting clinical decision-making, particularly in resource-limited settings where subspecialized musculoskeletal radiologists may be unavailable. Nevertheless, several technical considerations must be addressed prior to widespread clinical adoption, most notably the inherent variability among MRI scanners and acquisition protocols. Differences in magnetic field strengths, vendor-specific sequence parameters, and signal-to-noise ratios can introduce feature instability in radiomics analyses, necessitating the integration of robust image harmonization algorithms in future iterations. Furthermore, the retrospective, single-center design and relatively modest sample size of this study represent key limitations. Larger prospective multi-center validations across diverse patient populations and institutional workflows remain an essential next step to establish true generalizability and clinical utility.
5. Conclusions
Differentiating between TB and METAS is recognized as a significant clinical challenge due to their similar imaging characteristics. This difficulty often leads to a high chance of misdiagnosis, which subsequently results in an inappropriate treatment plan for the patient. This work demonstrates the promising potential of a radiomics-powered AI model to distinguish between TB and METAS. By using MRI scans and AI software, this radiomics-based AI method can achieve high diagnostic accuracy with an accuracy rate of 93%. The ability of this non-invasive approach can significantly impact patient outcomes by aiding human doctors in clinical decision-making. Future work will focus on expanding the dataset to further strengthen model robustness and exploring the development of an advanced framework for automated segmentation for TB and METAS.
Supplementary Materials
The following supporting information can be downloaded at: https://www.mdpi.com/article/10.3390/inventions11060115/s1, CLAIM Checklist and METRICS Checklist.
Author Contributions
N.T. contributed to the research design and methodology, data analyses, research conclusion, and suggestions. P.T. contributed to the literature review, data acquisition, preparation, patient characteristic analysis, segmentation, and manuscript writing. P.M. contributed to research methodology, particularly in neural networks, experimentation, and result representation/interpretation. A.K. performed radiomics feature extraction, related feature pre/post-processing, and provided the concept of generating a radiomics-powered AI model. J.C. contributed to data preparation. P.W. performed data preparation. P.C. participated in the research methodology. W.L. contributed to the AI experimental design. P.S. collaborated on manuscript writing, designed the radiomics-powered AI model as well as conducting its relevant tuning, and carried out the overall experimentation. All authors have read and agreed to the published version of the manuscript.
Funding
This research was supported by the Fundamental Fund of Khon Kaen University (grant no. 179574), funded by the National Science, Research and Innovation Fund (NSRF), Thailand.
Institutional Review Board Statement
The study was conducted in accordance with the Declaration of Helsinki, and approved by the Institutional Review Board (Center for Ethics in Human Research) of Khon Kaen University (protocol code HE644026, approved on 15 August 2024).
Informed Consent Statement
Patient consent was waived due to the retrospective design of the study using fully anonymized, pre-existing clinical MRI data without direct personal identifiers or contact with participants, as approved by the Institutional Review Board. No identifiable personal information or images are included in this article.
Data Availability Statement
The dataset of radiomics features and the MATLAB source codes used for generating the radiomics-based neural network for classifying TB and METAS can be accessed via the following link: https://indie-ct.enit.kku.ac.th/assets/data/Data_availability.zip (accessed on 26 July 2026).
Conflicts of Interest
The authors declare no conflicts of interest.
References
- Du, X.; She, Y.; Ou, Y.; Zhu, Y.; Luo, W.; Jiang, D. A scoring system for outpatient orthopedist to preliminarily distinguish spinal metastasis from spinal tuberculosis: A retrospective analysis of 141 patients. Dis. Markers 2021, 2021, 6640254. [Google Scholar] [CrossRef] [Scilit] [PubMed]
- Ma, J.; Gong, D.; Chen, X. A multicenter multi-modal AI framework integrating radiomics and deep learning for differentiating Spinal Tuberculosis from pyogenic spondylitis using chest X-rays. J. Radiat. Res. Appl. Sci. 2025, 18, 101723. [Google Scholar] [CrossRef] [Scilit]
- Robson, P. Metastatic spinal cord compression: A rare but important complication of cancer. Clin. Med. 2014, 14, 542. [Google Scholar] [CrossRef] [Scilit] [PubMed]
- Osmanagic, A.; Emamifar, A.; Bang, J.C.; Hansen, I.M.J. A rare case of Pott’s disease (spinal tuberculosis) mimicking metastatic disease in the southern region of Denmark. Am. J. Case Rep. 2016, 17, 384. [Google Scholar] [CrossRef] [Scilit] [PubMed]
- Niedermeyer, S.; Draenert, R.; Beck, A.; Todorova, R.; Jung, A.; Biczok, A.M.; Tonn, J.C.; Thorsteinsdottir, J. Spinal Tuberculosis within the Vertebral Arch Mimicking a Malignant Tumor: Case Report. J. Neurol. Surg. Part A Cent. Eur. Neurosurg. 2023, 84, 91–94. [Google Scholar] [CrossRef] [Scilit] [PubMed]
- Li, X.D.; Xie, P.; Zhang, J.; Du, S.X. Imaging Presentation Highly Manifested as Tuberculosis in Spinal Hemangioendothelioma: A Case Report. J. Surg. Oncol. 2022, 1–3. [Google Scholar] [CrossRef] [Scilit]
- Fard, S.A.; Pourzand, P.; Tabasi, F.; Mohammadi, M.; Nafeli, M.; Jourahmad, Z. Non-contiguous multilevel spinal tuberculosis: A case report of unusual spinal tuberculosis resembling spinal metastasis. Clin. Case Rep. 2023, 11, e7053. [Google Scholar] [CrossRef] [Scilit] [PubMed]
- Ma, J.; He, Y.; Li, F.; Han, L.; You, C.; Wang, B. Segment anything in medical images. Nat. Commun. 2024, 15, 654. [Google Scholar] [CrossRef] [Scilit] [PubMed]
- Ye, M.; Huang, J.; Wang, J.; Ren, J.; Tu, J.; You, W.; Zhu, T. Multifocal musculoskeletal tuberculosis mimicking multiple bone metastases: A case report. BMC Infect. Dis. 2015, 16, 34. [Google Scholar] [CrossRef] [Scilit] [PubMed]
- Lyu, J.; Xu, Z.; Sun, H.; Zhai, F.; Qu, X. Machine learning-based CT radiomics model to discriminate the primary and secondary intracranial hemorrhage. Sci. Rep. 2023, 13, 3709. [Google Scholar] [CrossRef] [Scilit] [PubMed]
- Roisman, L.C.; Kian, W.; Anoze, A.; Fuchs, V.; Spector, M.; Steiner, R.; Kassel, L.; Rechnitzer, G.; Fried, I.; Peled, N.; et al. Radiological artificial intelligence-predicting personalized immunotherapy outcomes in lung cancer. NPJ Precis. Oncol. 2023, 7, 125. [Google Scholar] [CrossRef] [Scilit] [PubMed]
- Naseri, H.; Skamene, S.; Tolba, M.; Faye, M.D.; Ramia, P.; Khriguian, J.; Patrick, H.; Andrade Hernandez, A.X.; David, M.; Kildea, J. Radiomics-based machine learning models to distinguish between metastatic and healthy bone using lesion-center-based geometric regions of interest. Sci. Rep. 2022, 12, 9866. [Google Scholar] [CrossRef] [Scilit] [PubMed]
- Lu, J.; Ji, X.; Liu, X.; Jiang, Y.; Li, G.; Fang, P.; Li, W.; Zuo, A.; Guo, Z.; Yang, S.; et al. Machine learning-based radiomics strategy for prediction of acquired EGFR T790M mutation following treatment with EGFR-TKI in NSCLC. Sci. Rep. 2024, 14, 446. [Google Scholar] [CrossRef] [Scilit] [PubMed]
- Momjian, R.; George, M. Atypical imaging features of tuberculous spondylitis: Case report with literature review. J. Radiol. Case Rep. 2014, 8, 1–14. [Google Scholar] [CrossRef] [Scilit] [PubMed]
- Khattry, N.; Thulkar, S.; Das, A.; Khan, S.A.; Bakhshi, S. Spinal tuberculosis mimicking malignancy: Atypical imaging features. Indian J. Pediatr. 2007, 74, 297–298. [Google Scholar] [CrossRef] [Scilit] [PubMed]
- Lang, N.; Zhang, Y.; Zhang, E.; Zhang, J.; Chow, D.; Chang, P.; Hon, J.Y.; Yuan, H.; Su, M.Y. Differentiation of spinal metastases originated from lung and other cancers using radiomics and deep learning based on DCE-MRI. Magn. Reson. Imaging 2019, 64, 4–12. [Google Scholar] [CrossRef] [Scilit] [PubMed]
- Zhang, X.; Wang, D.; Shao, J.; Tian, S.; Tan, W.; Ma, Y.; Xu, Q.; Ma, X.; Li, D.; Chai, J.; et al. A deep learning integrated radiomics model for identification of coronavirus disease 2019 using computed tomography. Sci. Rep. 2021, 11, 3938. [Google Scholar] [CrossRef] [Scilit] [PubMed]
- Xie, Y.; Liu, Q.; Ji, C.; Sun, Y.; Zhang, S.; Hua, M.; Liu, X.; Pan, S.; Hu, W.; Ma, Y.; et al. An artificial neural network-based radiomics model for predicting the radiotherapy response of advanced esophageal squamous cell carcinoma patients: A multicenter study. Sci. Rep. 2023, 13, 8673. [Google Scholar] [CrossRef] [Scilit] [PubMed]
- Kobayashi, K.; Miyake, M.; Takahashi, M.; Hamamoto, R. Observing deep radiomics for the classification of glioma grades. Sci. Rep. 2021, 11, 10942. [Google Scholar] [CrossRef] [Scilit] [PubMed]
- Braghetto, A.; Marturano, F.; Paiusco, M.; Baiesi, M.; Bettinelli, A. Radiomics and deep learning methods for the prediction of 2-year overall survival in LUNG1 dataset. Sci. Rep. 2022, 12, 14132, Correction in Sci. Rep. 2023, 13, 17561. https://doi.org/10.1038/s41598-023-44197-1. [Google Scholar] [CrossRef] [Scilit] [PubMed]
- Cho, H.h.; Lee, H.Y.; Kim, E.; Lee, G.; Kim, J.; Kwon, J.; Park, H. Radiomics-guided deep neural networks stratify lung adenocarcinoma prognosis from CT scans. Commun. Biol. 2021, 4, 1286. [Google Scholar] [CrossRef] [Scilit] [PubMed]
- Shim, K.Y.; Chung, S.W.; Jeong, J.H.; Hwang, I.; Park, C.K.; Kim, T.M.; Park, S.H.; Won, J.K.; Lee, J.H.; Lee, S.T.; et al. Radiomics-based neural network predicts recurrence patterns in glioblastoma using dynamic susceptibility contrast-enhanced MRI. Sci. Rep. 2021, 11, 9974. [Google Scholar] [CrossRef] [Scilit] [PubMed]
- Ding, S.X.; Sun, Y.F.; Meng, H.; Wang, J.N.; Xue, L.Y.; Gao, B.L.; Yin, X.P. Radiomics model based on multi-sequence MRI for preoperative prediction of ki-67 expression levels in early endometrial cancer. Sci. Rep. 2023, 13, 22052. [Google Scholar] [CrossRef] [Scilit] [PubMed]
- Duan, S.; Dong, W.; Hua, Y.; Zheng, Y.; Ren, Z.; Cao, G.; Wu, F.; Rong, T.; Liu, B. Accurate differentiation of spinal tuberculosis and spinal metastases using MR-based deep learning algorithms. Infect. Drug Resist. 2023, 16, 4325–4334. [Google Scholar] [CrossRef] [Scilit] [PubMed]
- Sangsin, A.; Khumrin, P.; Sarasombath, P.; Murakami, H.; Paholpak, P.; Pattamapaspong, N.; Liawrungrueang, W. Classification of spinal tuberculous infection, pyogenic infection and spinal metastasis from magnetic resonance imaging using machine learning. BMC Musculoskelet. Disord. 2026, 27, 456. [Google Scholar] [CrossRef] [Scilit] [PubMed]
- Shur, J.D.; Doran, S.J.; Kumar, S.; Ap Dafydd, D.; Downey, K.; O’Connor, J.P.; Papanikolaou, N.; Messiou, C.; Koh, D.M.; Orton, M.R. Radiomics in oncology: A practical guide. Radiographics 2021, 41, 1717–1732. [Google Scholar] [CrossRef] [Scilit] [PubMed]
- Raihan, M.J.; Khan, M.A.M.; Kee, S.H.; Nahid, A.A. Detection of the chronic kidney disease using XGBoost classifier and explaining the influence of the attributes on the model using SHAP. Sci. Rep. 2023, 13, 6263. [Google Scholar] [CrossRef] [Scilit] [PubMed]
- Li, P.; Li, D.; Li, W.; Gong, S.; Fu, Y.; Hospedales, T.M. A simple feature augmentation for domain generalization. In Proceedings of the IEEE/CVF International Conference on Computer Vision; IEEE: New York, NY, USA, 2021; pp. 8886–8895. [Google Scholar]
- Han, Y.; Wei, Z.; Huang, G. An imbalance data quality monitoring based on SMOTE-XGBOOST supported by edge computing. Sci. Rep. 2024, 14, 10151. [Google Scholar] [CrossRef] [Scilit] [PubMed]
- Kocak, B.; Akinci D’Antonoli, T.; Mercaldo, N.; Alberich-Bayarri, A.; Baessler, B.; Ambrosini, I.; Andreychenko, A.E.; Bakas, S.; Beets-Tan, R.G.; Bressem, K.; et al. METhodological RadiomICs Score (METRICS): A quality scoring tool for radiomics research endorsed by EuSoMII. Insights Imaging 2024, 15, 8. [Google Scholar] [CrossRef] [Scilit] [PubMed]
- Tejani, A.S.; Klontzas, M.E.; Gatti, A.A.; Mongan, J.T.; Moy, L.; Park, S.H.; Kahn, C.E., Jr. Checklist for Artificial Intelligence in Medical Imaging (CLAIM): 2024 Update. Radiol. Artif. Intell. 2024, 6, e240300. [Google Scholar] [CrossRef] [Scilit]

Disclaimer/Publisher’s Note: The statements, opinions and data contained in all publications are solely those of the individual author(s) and contributor(s) and not of MDPI and/or the editor(s). MDPI and/or the editor(s) disclaim responsibility for any injury to people or property resulting from any ideas, methods, instructions or products referred to in the content. |
© 2026 by the authors. Licensee MDPI, Basel, Switzerland. This article is an open access article distributed under the terms and conditions of the Creative Commons Attribution (CC BY) license.