


Abstract
Freshwater aquaculture in China has expanded rapidly in recent decades, raising growing concerns about its environmental sustainability. However, the relationship between industrial agglomeration and environmental efficiency in freshwater aquaculture remains insufficiently understood. Using panel data from 18 major freshwater aquaculture provinces in China from 2009 to 2023, this study investigates the nonlinear effects of industrial agglomeration on environmental efficiency. Environmental efficiency is evaluated using a Global Super-SBM model incorporating undesirable outputs, while industrial agglomeration is measured by the location quotient index. A two-way fixed-effects model is employed for empirical estimation. The results reveal a significant inverted U-shaped relationship between industrial agglomeration and environmental efficiency, with a turning point at an agglomeration level of 2.519. Moderate agglomeration improves environmental efficiency through economies of scale and technology diffusion, whereas excessive agglomeration generates crowding effects that reduce efficiency. Further mechanism analysis shows that technology diffusion, proxied by the number of trained fishermen, plays a significant mediating role in this relationship. This study provides new empirical evidence on the nonlinear environmental effects of industrial agglomeration in freshwater aquaculture and offers policy implications for optimizing industrial spatial layout and developing differentiated environmental regulations to support the green and sustainable development of the sector.
Keywords:
freshwater aquaculture; industrial agglomeration; environmental efficiency; global Super-SBM model; technology diffusion Key Contribution:
This study contributes to the literature by extending the agglomeration–environmental efficiency nexus to freshwater aquaculture and revealing an inverted U-shaped relationship mediated by technology diffusion.
1. Introduction
As the world’s largest producer of freshwater aquaculture, China accounts for nearly 60% of global aquaculture output. The freshwater aquaculture industry plays an indispensable role in ensuring the supply of high-quality protein and improving fishermen’s livelihoods [1]. However, the rapid expansion of the industry, combined with extensive farming practices, has led to increasingly serious environmental concerns, including the accumulation of uneaten feed and the discharge of aquaculture wastewater. Emissions of pollutants such as nitrogen, phosphorus, and chemical oxygen demand (COD) have gradually exceeded the carrying capacity of aquatic ecosystems, resulting in a series of ecological problems, including ecosystem degradation and biodiversity loss. Against this background, balancing production growth with emission reduction in freshwater aquaculture, while improving environmental efficiency and maintaining industrial competitiveness, has become a pressing issue for the green transformation of the freshwater aquaculture industry in China and worldwide.
As an important form of economic spatial organization, industrial agglomeration and its environmental effects have attracted considerable academic attention in recent years. Theoretically, industrial agglomeration can reduce transaction costs through information sharing, knowledge spillovers, and human capital accumulation, thereby facilitating the diffusion of green technologies and generating positive environmental externalities [2]. However, agglomeration may also produce negative environmental consequences, such as excessive expansion of production scale, increased resource consumption, and concentrated pollutant emissions. Existing empirical findings remain inconclusive. Some studies suggest that industrial agglomeration improves environmental efficiency in sectors such as producer services [3], marine industries [4], manufacturing [5], and forestry [6]. In contrast, other studies argue that agglomeration exacerbates environmental pollution and inhibits efficiency improvement [7,8]. Further research indicates that the relationship may be nonlinear, exhibiting patterns such as an inverted U-shaped relationship [9,10], a U-shaped relationship [11], or significant regional heterogeneity [12]. These mixed findings suggest that the environmental effects of industrial agglomeration are highly sector-specific and context-dependent, highlighting the need for industry-oriented analysis.
Although previous studies have provided an important basis for understanding the environmental effects of industrial agglomeration in the agricultural sector [13,14], it remains unclear whether these conclusions apply to freshwater aquaculture. Compared with the sectors examined in previous studies, freshwater aquaculture differs substantially in terms of production organization, pollution discharge characteristics, and technology diffusion pathways, making it inappropriate to directly generalize the environmental effects of agglomeration to this industry. First, unlike industrial agglomeration dominated by large-scale enterprises, freshwater aquaculture is mainly characterized by small-scale farmers with limited operational capacity and low levels of organization. Their adoption of new technologies is often constrained by financial limitations, information asymmetry, and risk aversion, resulting in technology diffusion mechanisms that differ fundamentally from those observed in industrial sectors. Second, compared with agricultural agglomerations such as crop farming, freshwater aquaculture is more strongly dependent on aquatic ecosystems. Its pollution emissions are characterized by continuous and dispersed non-point source pollution, while pollutants such as nitrogen and phosphorus tend to accumulate in enclosed or slow-flowing water bodies. Excessive agglomeration may therefore directly exceed the environmental carrying capacity of local water systems, whereas the environmental effects of crop farming agglomeration are more closely related to land use and fertilizer application. Third, even compared with marine aquaculture, freshwater aquaculture differs significantly in cultivated species, water exchange capacity, self-purification ability, and regulatory intensity. Freshwater aquaculture is generally concentrated in enclosed or semi-enclosed water bodies, resulting in higher pollutant retention and greater ecological vulnerability. However, these sectoral characteristics have rarely been incorporated into existing analytical frameworks. Empirical evidence on the relationship between freshwater aquaculture agglomeration and environmental efficiency therefore remains limited, particularly regarding its nonlinear effects and underlying mechanisms.
In light of these gaps, this study systematically investigates the impact of freshwater aquaculture agglomeration on environmental efficiency, with particular attention to its nonlinear characteristics and transmission mechanisms. Using panel data from 18 major freshwater aquaculture provinces in China from 2009 to 2023, we first employ the Global Super-SBM model to measure environmental efficiency. We then construct a two-way fixed-effects model to examine the linear and nonlinear effects of industrial agglomeration. In addition, a mediation model is used to identify the role of technology diffusion in this relationship. Finally, instrumental variable estimation and a series of robustness tests are conducted to ensure the reliability of the empirical results.
The contributions of this study are fourfold. First, it extends the analysis of the relationship between industrial agglomeration and environmental efficiency to the freshwater aquaculture sector, thereby enriching the understanding of the environmental effects of industrial heterogeneity. Second, it identifies an inverted U-shaped relationship between freshwater aquaculture agglomeration and environmental efficiency and estimates the corresponding turning point, providing new empirical evidence on the nonlinear environmental effects of industrial agglomeration in the freshwater aquaculture industry. Third, it confirms the mediating role of technology diffusion and clarifies the transmission mechanism through which agglomeration affects environmental efficiency. Specifically, this study further explains how industrial agglomeration influences environmental efficiency through technology diffusion, knowledge spillovers, and behavioral adjustments among aquaculture producers.
2. Theoretical Assumptions and Research Design
2.1. Theoretical Analysis of the Relationship Between Industrial Agglomeration and Environmental Efficiency
Industrial agglomeration refers to the spatial concentration of economic activities. However, the agglomeration–environment relationship in freshwater aquaculture differs fundamentally from that in other agricultural sectors due to its unique ecological embedding within aquatic ecosystems. According to the agglomeration economy theory, industrial agglomeration can generate both positive and negative externalities [15]. In the freshwater aquaculture sector, positive externalities arise when aquaculture operators within an agglomerated area share fishery infrastructure, thereby reducing production costs, improving production efficiency, promoting the intensive use of production factors, and ultimately enhancing environmental efficiency. In contrast, negative externalities emerge when agglomeration becomes excessive and generates congestion effects. Once the concentrated discharge of non-point source pollutants exceeds the environmental carrying capacity of a region, pressures on fishery resources and the ecological environment intensify [16]. Due to the semi-enclosed nature and relatively weak water exchange capacity of freshwater aquaculture environments, pollutants tend to accumulate rapidly, resulting in eutrophication, deterioration of water quality, and ecological stress. Under such conditions, the environmental costs associated with aquaculture production increase substantially, thereby inhibiting improvements in environmental efficiency.
This distinct ecological characteristic also shapes the positive externalities of agglomeration in the early stage. In the early stages of agglomeration, freshwater aquaculture operators can achieve large-scale and intensive production through spatial concentration, generating economies of scale that improve both resource utilization and environmental efficiency. Specifically, first, according to economies of scale theory, industrial agglomeration promotes increasing marginal returns by expanding production scale and improving factor allocation efficiency. Moderate agglomeration enables aquaculture operators to cluster geographically, allowing production factors such as capital, labor, and technology to be allocated more efficiently within a specialized production network. Participation in specialized division-of-labor and cooperation systems helps reduce transaction costs and improve resource allocation efficiency [17]. As agglomeration intensifies, production inputs do not increase proportionally with output, thereby generating increasing marginal returns. Second, based on location theory, industrial agglomeration facilitates the concentration of regional resources, promotes infrastructure sharing among aquaculture operators, and reduces resource waste [18]. Freshwater aquaculture depends heavily on infrastructure such as water conservancy facilities, environmental protection systems, and water quality monitoring networks, which are often too costly for individual operators to establish independently. Through industrial agglomeration, facilities such as centralized wastewater treatment systems, recirculating aquaculture systems, and water quality monitoring platforms can be jointly operated on a larger scale. This collaborative arrangement not only lowers environmental management costs for individual operators but also improves the overall efficiency of pollution control within the agglomeration area. Therefore, during the initial stages of agglomeration, freshwater aquaculture agglomeration can improve environmental efficiency through economies of scale and infrastructure-sharing effects, thereby promoting the green and high-quality development of the industry.
Compared with other agricultural sectors, freshwater aquaculture is uniquely constrained by the dual role of aquatic ecosystems as both production space and environmental sink. This implies that production activities, resource inputs, and pollutant emissions occur within the same ecological medium, making environmental carrying capacity a binding constraint on industrial agglomeration. However, the environmental carrying capacity of a region is inherently limited. When aquaculture activities become excessively concentrated and exceed the ecological carrying capacity of the region, agglomeration may hinder green development [19], generate cumulative environmental pollution effects [10], and lead to rising marginal environmental costs, governance congestion, and inefficient competition, ultimately producing diseconomies of scale and reducing environmental efficiency. Specifically, first, excessive concentration of freshwater aquaculture production may exceed the carrying capacity of regional resources and ecosystems, causing environmental factors to shift from relatively abundant resources to binding constraints. Under such conditions, further expansion of production scale increases marginal environmental costs, while the efficiency gains associated with agglomeration gradually diminish. Compared with other industrial sectors, freshwater aquaculture production is more dependent on the ecological carrying capacity of aquatic environments. Freshwater ecosystems generally possess relatively limited water exchange and self-purification capacities. Once aquaculture activities become excessively concentrated, high-density stocking, excessive feeding, and the intensive use of fishery chemicals may substantially increase nutrient emissions and organic pollutants. The accumulation of nitrogen, phosphorus, and residual feed can easily trigger eutrophication and ecological degradation in aquaculture waters, thereby increasing environmental governance costs and weakening environmental efficiency. Instead, excessive agglomeration may intensify high-density stocking, excessive feeding, and the overuse of fishery drugs and chemical inputs. These production behaviors increase nutrient discharge and organic pollution, further aggravating water eutrophication and ecological degradation in freshwater aquaculture areas. Beyond ecological constraints, infrastructural and managerial capacity limitations further reinforce the non-linear agglomeration–environment relationship in freshwater aquaculture. Second, once the degree of agglomeration exceeds the capacity of existing infrastructure, collaborative sharing mechanisms may weaken and even generate congestion effects. Fishery infrastructure, including centralized wastewater treatment facilities, water management systems, and environmental monitoring networks, may become overloaded under intensive use, resulting in declining marginal service efficiency. As a consequence, infrastructure-sharing mechanisms that initially enhanced environmental efficiency may eventually constrain further efficiency improvements. Through the combined effects of these two pathways, excessive freshwater aquaculture agglomeration may ultimately reduce environmental efficiency and hinder the sustainable development of the industry. As a result, environmental degradation in freshwater aquaculture tends to be more rapid and direct compared with land-based agricultural systems due to the immediate coupling between production and water environments. The inverted U-shaped relationship in freshwater aquaculture is therefore fundamentally different from that in other agricultural sectors, as it is jointly shaped by ecological carrying constraints and infrastructure congestion effects that are uniquely intensified by the water-based production environment. Based on the above theoretical analysis, we construct a quadratic function of AGG and its squared term to capture the hypothesized inverted U-shaped relationship, where the positive externality dominates at low agglomeration levels, and the congestion effect dominates at high levels. Consequently, we propose the following hypothesis:
H1.
Freshwater aquaculture industrial agglomeration has an inverted U-shaped effect on environmental efficiency. Specifically, environmental efficiency initially increases with the degree of agglomeration but declines significantly once agglomeration exceeds a critical threshold.
2.2. Mechanisms Linking Freshwater Aquaculture Agglomeration and Environmental Efficiency
Technological innovation is a fundamental driver of economic restructuring and endogenous economic growth [20]. In the freshwater aquaculture sector, the promotion and adoption of aquaculture technologies have played an important role in improving producers’ technical capabilities and advancing technological progress within the industry [21]. Importantly, in the context of industrial agglomeration, technological diffusion is not homogeneous but instead consists of multiple types of innovations with heterogeneous impacts on environmental efficiency. Specifically, green production technologies, including water pollution control technologies, recirculating aquaculture systems, feed optimization technologies, and aquaculture waste treatment technologies, constitute the most direct channel for improving environmental efficiency, as they directly reduce pollutant emissions and enhance resource utilization efficiency. In addition, organizational and managerial innovations, such as standardized farming practices, cooperative-based production models, and supply chain integration, further contribute to environmental efficiency by improving production coordination and reducing resource wastage. Moreover, with the rapid development of digital agriculture, information-based technologies such as intelligent monitoring systems and digital extension platforms have become increasingly important in accelerating the diffusion, absorption, and application of advanced aquaculture practices. As an important component of agriculture, the freshwater aquaculture industry can generate sharing, learning, and demonstration effects through moderate industrial agglomeration, thereby facilitating the diffusion of these heterogeneous innovations and ultimately improving environmental efficiency. Therefore, technology diffusion in this study should be understood as a multidimensional process involving the dissemination of green technologies, organizational innovations, and digital knowledge, rather than merely an increase in the number of trained fishermen, encompassing knowledge transmission, technology adoption, and behavioral adjustment among aquaculture producers.
According to regional innovation theory, the spatial proximity generated by industrial agglomeration facilitates knowledge and technology spillovers [22] and enhances a region’s capacity for innovation creation, integration, and application [23]. On the one hand, freshwater aquaculture agglomeration strengthens spatial linkages among aquaculture operators, allowing advanced aquaculture technologies, green production methods, and management experience to spread more efficiently through technical training, demonstration effects, and peer learning within agglomeration areas. This process reduces the costs associated with acquiring and applying new technologies, thereby promoting the diffusion and adoption of green production practices. As aquaculture producers gain greater access to technical knowledge and environmental management skills, they are more likely to adopt ecological feeding practices, improve water quality management, and optimize the use of production inputs, which ultimately reduces pollutant emissions and improves environmental efficiency. On the other hand, the agglomeration environment reinforces learning and demonstration effects among aquaculture operators, encouraging technological imitation and re-innovation. Advanced production and management practices generated through technology diffusion can be directly applied to the improvement of fishery infrastructure and the development of new operational models [24], thereby enhancing the overall technological level of the region and further improving environmental efficiency.
However, the effectiveness of technology diffusion is constrained by several practical factors. Due to differences in education level, financial capacity, and risk preferences among aquaculture operators, the ability to absorb and apply new technologies may vary significantly. In addition, information asymmetry, uneven training quality, and insufficient follow-up technical services may weaken the actual effectiveness of technology diffusion programs. When freshwater aquaculture becomes excessively concentrated, technological homogeneity among aquaculture operators may gradually increase, weakening the marginal benefits of technology spillovers. Under such conditions, imitation and diffusion alone become insufficient to sustain technological progress. At the same time, intensified market competition may encourage some aquaculture operators to adopt short-term production strategies, such as increasing stocking density, excessive feeding, or overusing medications to maintain output levels. These practices may crowd out the application of green aquaculture technologies and ultimately hinder improvements in environmental efficiency. As shown in Figure 1, overall, technology diffusion influences environmental efficiency through a sequential mechanism of “industrial agglomeration → knowledge dissemination and technology diffusion → behavioral adjustment → environmental improvement.” Based on the above analysis, the following hypothesis is proposed.
Figure 1.
Mechanisms and Transmission Channels of the Impact of Freshwater Aquaculture Clustering on Environmental Efficiency. Note: Arrows indicate the mediating pathway, whereby industrial agglomeration affects environmental efficiency through its impact on technology diffusion.
H2.
Technology diffusion plays a mediating role in the relationship between freshwater aquaculture industrial agglomeration and environmental efficiency.
3. Model Specification and Variable Selection
3.1. Measurement of Environmental Efficiency in Freshwater Aquaculture
3.1.1. Measurement Methodology
Data Envelopment Analysis (DEA) is a widely used method for measuring efficiency and generally includes radial models represented by the CCR and BCC models, as well as non-radial models represented by the SBM model. In radial models, slack improvements are not reflected in the measurement of efficiency scores, whereas the non-radial SBM model cannot further distinguish among efficient decision-making units (DMUs) with an efficiency score equal to 1. To address these limitations, Tone proposed the Super-SBM model [25]. It should be noted that the Super-SBM model is based on cross-sectional data analysis, implying that the production frontier differs across years and thus efficiency scores are not directly comparable over time. To accurately examine the dynamic characteristics of environmental efficiency in 18 major freshwater aquaculture-producing regions in China and to avoid the influence of short-term fluctuations in input–output data, this study constructs a single production frontier using all input–output data over the sample period and accordingly adopts a global Super-SBM model for estimation. The model includes input-oriented, output-oriented, and non-oriented forms. To evaluate efficiency simultaneously from both the input and output perspectives, and following the approaches adopted in the existing literature [26,27,28], this study employs a non-oriented global Super-SBM model to measure the environmental efficiency of the 18 major freshwater aquaculture-producing regions in China. In the global Super-SBM model, inefficient DMUs obtain efficiency scores smaller than 1, while efficient DMUs can obtain scores exceeding 1, allowing further discrimination among frontier units. A DMU is considered efficient if its efficiency score is equal to or greater than 1, placing it on the production frontier, where a higher score indicates superior efficiency. Conversely, a score below 1 signifies inefficiency, implying that improvements can be achieved through better allocation of inputs or enhancement of outputs. The detailed formulation of the model is presented as follows.
In the above equation, denotes the efficiency score; x, y, and b represent inputs, desirable outputs, and undesirable outputs, respectively; i, r, and k denote the numbers of input, desirable output, and undesirable output variables, respectively; si−, sr+, and sk− are the slack variables for inputs, desirable outputs, and undesirable outputs, representing input excess, desirable output shortfall, and undesirable output excess, respectively; t denotes the year; and λ represents the weight variable.
3.1.2. Input and Output Indicator System
Following the production theory framework and the environmental characteristics of freshwater aquaculture, the indicator system includes resource inputs, economic outputs, and environmental pollution outputs (Table 1).
Table 1.
Input-Output Indicator System.
- Input Indicators
In conventional production models, land, labor, and capital are regarded as the primary input factors [29]. Considering the development characteristics of the freshwater aquaculture industry and data availability, this study selects aquaculture labor, aquaculture area, aquatic fry, aquaculture capital investment, and intermediate consumption as input indicators. These input indicators reflect the fundamental production factors required for freshwater aquaculture activities. Specifically, aquaculture labor is measured by the number of specialized freshwater aquaculture workers, while aquaculture area is measured by the total freshwater aquaculture area [30]. Aquatic fry input is measured by the quantity of freshwater fish fry [31]. Aquaculture capital investment mainly refers to material and technological inputs used to improve aquaculture production efficiency and is measured by the total power of freshwater aquaculture machinery and fishing vessels [32]. Intermediate consumption mainly includes expenditures on feed, fuel, electricity, and office supplies [1]. To eliminate the influence of price fluctuations, the agricultural production materials price index is used to deflate intermediate consumption to constant 2009 prices.
- 2.
- Output Indicators
Output indicators include both desirable and undesirable outputs. Based on the existing literature [33], in this study, the desirable output indicators are freshwater aquaculture output value and freshwater aquaculture production volume. To eliminate the influence of price fluctuations, the freshwater aquaculture output value is deflated using the freshwater aquaculture product price index. The undesirable output indicators mainly capture estimated pollutant emissions generated during freshwater aquaculture production, which directly reflect the environmental costs associated with intensive aquaculture activities and are therefore essential for evaluating environmental efficiency. Undesirable outputs are estimated using the pollution equivalent method and the emission factor method to measure pollutant loads generated by freshwater aquaculture [34], which relies on standardized emission coefficients. Such indirect estimation approaches are widely adopted in the literature on aquaculture environmental efficiency due to the lack of disaggregated emission data. In addition, DEA-based efficiency measures are primarily concerned with relative rather than absolute values, implying that moderate measurement errors are unlikely to significantly affect the ranking of decision-making units. The calculation formulas are presented below.
Here, En represents the standard pollution load of freshwater aquaculture in Province n; Eu,n represents the discharge volume of pollutant u (N, P, and COD) from freshwater aquaculture in Province n; Pu represents the standard pollution concentration for Class III water quality specified in the Surface Water Environmental Quality Standards (N = 1 mg/L, P = 0.2 mg/L, and COD = 20 mg/L); Yi,n represents the production volume of aquaculture species category i in Province n; wi,j,n represents the share of aquaculture species category i produced using farming method j in Province n; and qi,j,n represents the emission coefficient of aquaculture species category i under farming method j in Province n.
Due to the unavailability of detailed data on production shares across aquaculture species and farming methods at the provincial and annual levels, this study follows the approach of Fu Yufang et al. [35] and estimates these shares based on the composition of total freshwater aquaculture production by farming method reported in the China Fisheries Statistical Yearbook for each year. This procedure introduces potential measurement uncertainty, as it relies on secondary allocation assumptions rather than directly observed data. However, since the same estimation procedure is consistently applied across all provinces and years, the resulting measurement errors are expected to be random rather than systematic. Moreover, the robustness of the empirical results using alternative efficiency measures further supports the reliability of the constructed indicators. Here, xj,n represents the share of production under farming method j in the total aquaculture production of Province n. Considering that the production associated with certain farming methods may be zero in some provinces and years, a dummy variable, yi,j is introduced, which equals 1 when aquaculture species i can be cultured using farming method j, and 0 otherwise, following existing literature, to ensure consistency in the estimation procedure. The data used in this study are mainly obtained from the annual China Fisheries Statistical Yearbook and the Manual of Pollutant Emission Coefficients for Aquaculture Pollution Sources from the First National Pollution Source Census, which are widely used authoritative data sources in aquaculture environmental efficiency studies.
3.2. Specification of the Econometric Model
To examine the nonlinear effect of freshwater aquaculture agglomeration on environmental efficiency, this study constructs the following two-way fixed-effects panel model:
Here, i and t denote the province and year, respectively. The dependent variable Feeit represents the environmental efficiency of freshwater aquaculture. The core explanatory variable AGGit represents the degree of freshwater aquaculture industrial agglomeration, while its squared term, AGGit2 is included to capture the potential nonlinear relationship implied by agglomeration economy theory, under which industrial agglomeration may generate both positive externalities and congestion effects at different development stages. Xit denotes the vector of control variables. μi and νt represent province fixed effects and year fixed effects, respectively, which are used to control for time-invariant provincial heterogeneity and common time shocks. εit represents the random error term.
To further examine the transmission mechanism through which freshwater aquaculture industrial agglomeration affects environmental efficiency, this study uses the degree of freshwater aquaculture technology diffusion as the mediating variable. Following the approach of Jiang Ting [36], the following mediation model is constructed:
In this equation, erit represents the degree of freshwater aquaculture technology diffusion in province i in year t; θ1, θ2, and θ3 represent the estimated coefficients of the corresponding variables; represents the constant term; represents the random error term; μi and vt denote the individual and time effects, respectively; and the remaining variables are defined as above.
3.3. Description of Variables
Following the principles of scientific rigor, comprehensiveness, and data availability, the indicators were selected from four dimensions: inputs, outputs, intermediates, and controls (Table 2).
Table 2.
Qualitative Description of Key Variables.
3.3.1. Dependent Variable: Freshwater Aquaculture Environmental Efficiency
Unlike traditional production efficiency, environmental efficiency simultaneously considers economic output and environmental costs under resource and ecological constraints. Freshwater aquaculture environmental efficiency refers to the ratio between the minimum undesirable output and the actual undesirable output under given freshwater aquaculture technology conditions, while holding input factors and desirable outputs constant. Environmental efficiency emphasizes the coordinated relationship among economic output, resource utilization, and environmental pollution under environmental constraints. Therefore, the Global Super-SBM model incorporating undesirable outputs is particularly suitable for freshwater aquaculture, as it simultaneously considers multiple inputs, desirable outputs, and pollution emissions generated during aquaculture production. It is used to measure the relative environmental impact of freshwater aquaculture production activities. This study employs a Global Super-SBM model to construct the indicator system and estimate the environmental efficiency of freshwater aquaculture across 18 major freshwater aquaculture production regions in China [37].
3.3.2. Key Explanatory Variable: Freshwater Aquaculture Industry Agglomeration
According to the agglomeration economy theory, industrial agglomeration is essentially characterized by the spatial concentration and regional specialization of economic activities. The location quotient index can effectively capture the relative concentration degree and specialization level of freshwater aquaculture across regions and is therefore widely used in studies on industrial agglomeration. Freshwater aquaculture exhibits strong regional dependence due to differences in water resources, climatic conditions, and aquaculture infrastructure, making the location quotient index particularly suitable for capturing regional specialization and spatial concentration in this industry. This study uses the location quotient index to measure the degree of freshwater aquaculture industrial agglomeration. The calculation formula is presented below [38].
Here, AGGit represents the location quotient of Province i in year t; denotes the total output value of the freshwater aquaculture industry in Province i in year t; eit denotes the total output value of the agriculture, forestry, animal husbandry, and fisheries sectors in Province i in year t; Eit0 denotes the national total output value of the freshwater aquaculture industry in year t; and Eit denotes the national total output value of the agriculture, forestry, animal husbandry, and fisheries sectors in year t. When AGGit > 1, the degree of freshwater aquaculture industrial agglomeration in Province i is higher than the national average; when AGGit < 1, the degree of freshwater aquaculture industrial agglomeration in Province i is lower than the national average. The inclusion of the squared term follows directly from the theoretical prediction of a nonlinear agglomeration–environment relationship (Section 2.1).
3.3.3. Mediating Variables
Industrial agglomeration facilitates technology diffusion through knowledge spillovers, demonstration effects, labor mobility, and intensified producer interactions within geographically concentrated aquaculture clusters. Technology diffusion plays an important role in promoting the high-quality development of the freshwater aquaculture industry. Technical training is an important channel through which aquaculture knowledge, green production technologies, and management skills are disseminated among producers. Therefore, the number of trained fishermen can effectively reflect the diffusion, adoption, and application of aquaculture technologies within freshwater aquaculture clusters. In this study, the intensity of technical training for freshwater aquaculture fishermen is used as a proxy for technology diffusion and is measured by the number of fishermen participating in technical training programs [39].
3.3.4. Control Variables
Considering the characteristics of the freshwater aquaculture industry and drawing on previous studies [22,40,41], this study selects freshwater fisheries industry structure, regional economic development level, urbanization rate, and government environmental expenditure as control variables. Specifically, the freshwater fisheries industry structure is measured by the ratio of freshwater aquaculture output value to total fisheries output value; regional economic development level is measured by fishermen’s per capita net income; urbanization rate is measured by the ratio of the urban population at year-end to the total population; and government environmental expenditure is measured by the ratio of regional investment in environmental pollution control to GDP.
3.3.5. Data Sources
According to the China Fisheries Statistical Yearbook 2024, freshwater aquaculture production in 18 regions—including Guangdong, Guangxi, Fujian, Hainan, Shandong, Hebei, Tianjin, Beijing, Henan, Hubei, Hunan, Jiangxi, Jiangsu, Anhui, Zhejiang, Liaoning, Jilin, and Heilongjiang—accounted for 87.9% of China’s total freshwater aquaculture output in 2023, indicating their important role in the development of the freshwater fisheries sector (Table 3). Focusing on the freshwater aquaculture industry and following the classification of major freshwater aquaculture production areas proposed by Hu Xiaojuan et al. [42], this study empirically examines the impact of industrial agglomeration on environmental efficiency in 18 major freshwater aquaculture production regions from 2009 to 2023. Data are obtained from the annual China Fisheries Statistical Yearbook, China Rural Statistical Yearbook, China Statistical Yearbook, China Environmental Statistical Yearbook, and China Ecological and Environmental Statistical Annual Report. Missing data are supplemented using interpolation methods.
Table 3.
China’s 18 Major Aquaculture Production Areas and Geographical Zones.
4. Analysis of Results
4.1. Environmental Efficiency Estimates for Freshwater Aquaculture
Based on the Global Super-SBM model, this study estimates the environmental efficiency of freshwater aquaculture in 18 major aquaculture production regions in China from 2009 to 2023 (Figure 2). The results show that the average environmental efficiency increased from 0.516 in 2009 to 0.723 in 2023, exhibiting an overall upward trend with slight fluctuations. This suggests that, with the continuous implementation of green development policies, the ecological governance capacity of freshwater aquaculture has gradually improved, and the production mode has increasingly shifted toward resource-saving and environmentally friendly development. At the same time, the continuous advancement of ecological aquaculture technologies and scientific management practices has further contributed to improvements in environmental efficiency.
Figure 2.
Trends in Environmental Efficiency of Freshwater Aquaculture in 18 Major Aquaculture Regions of China, 2009–2023.
In terms of regional averages, South China exhibited the highest average environmental efficiency (0.605), followed by Northeast China (0.600), North China (0.582), and East China (0.573), while Central China recorded the lowest average efficiency (0.514) (Table 4). At the provincial level, the highest average environmental efficiency values during 2009–2013 were observed in Hainan, Shandong, and Fujian; during 2014–2018, in Hainan, Fujian, and Henan; and during 2019–2023, in Hainan, Heilongjiang, and Fujian. These regions consistently maintained relatively high levels of green freshwater aquaculture development, benefiting from favorable geographical conditions and resource endowments.
Table 4.
Trends in Aquaculture Environmental Efficiency by Region in China’s 18 Major Aquaculture Production Areas, 2009–2023.
Notably, from the second development stage (2014–2018) to the third stage (2019–2023), environmental efficiency improved significantly in most provinces and municipalities, with only a few exceptions. For example, the average environmental efficiency in Northeast China increased from 0.531 to 0.741, while South China and East China increased from 0.595 to 0.663 and from 0.552 to 0.635, respectively. This trend is closely related to national policy support. In 2019, the Ministry of Agriculture and Rural Affairs, together with nine other ministries and commissions, issued the Several Opinions on Accelerating the Green Development of the Aquaculture Industry, which provided important policy guidance for the green development of the aquaculture sector.
4.2. Estimates of Industrial Agglomeration in China’s Major Freshwater Aquaculture Production Regions
Figure 3 presents the distribution of average industrial agglomeration levels across 18 major freshwater aquaculture production regions in China during 2009–2023. Overall, freshwater aquaculture industrial agglomeration exhibits significant regional imbalance and a clear clustering pattern in coastal and riverine areas. Hubei and Jiangsu recorded average agglomeration levels exceeding 2.8, classifying them as typical high-agglomeration regions. Jiangxi, Tianjin, Guangdong, Anhui, Zhejiang, and Hunan all reported average agglomeration levels above 1, indicating relatively strong agglomeration effects, whereas the remaining regions had average values below 1.
Figure 3.
Distribution of Average Industrial Agglomeration in 18 Major Aquaculture Production Areas in China, 2009–2023.
The degree of freshwater aquaculture industrial agglomeration is closely associated with regional resource endowments. Provinces with relatively high agglomeration levels are mainly concentrated in central and eastern China, where water resources are relatively abundant, and the aquaculture industry has a strong development foundation, such as Hubei (2.95), Jiangsu (2.85), Jiangxi (2.50), and Tianjin (2.44). Benefiting from favorable freshwater resource conditions, the freshwater aquaculture industry in these regions has developed rapidly. In addition, regions with higher agglomeration levels tend to improve aquaculture performance through economies of scale, technological spillovers, and factor-sharing effects, thereby achieving relatively higher levels of freshwater aquaculture development.
To further interpret the economic and environmental implications of the estimated nonlinear relationship, we examine the distribution of industrial agglomeration levels across the 18 major freshwater aquaculture-producing provinces relative to the estimated threshold (2.519). The results indicate that only four provinces—Tianjin, Jiangsu, Jiangxi, and Hubei—exceeded the threshold during the sample period. Among them, Jiangsu remained above the turning point throughout the entire period, while Hubei exceeded the threshold in 93.3% of the sample years, suggesting that both provinces are persistently located on the right-hand side of the inverted U-shaped relationship. Tianjin and Jiangxi exceeded the threshold in 40.0% and 46.7% of the sample years, respectively, indicating that their industrial agglomeration levels intermittently reach or surpass the turning point.
In addition, several provinces are found to operate in close proximity to the estimated threshold. Tianjin, Jiangxi, Hubei, and Guangdong record 26.7%, 53.3%, 6.67%, and 6.67% of sample years, respectively, with agglomeration levels close to the turning point, suggesting that these regions are in a transitional zone between agglomeration economies and congestion effects.
By contrast, the remaining 14 provinces—including Beijing, Hebei, Liaoning, Jilin, Heilongjiang, Zhejiang, Anhui, Fujian, Shandong, Henan, Hunan, Guangdong, Guangxi, and Hainan—consistently remain below the estimated threshold, indicating that they are still located on the left-hand side of the inverted U-shaped curve where agglomeration continues to generate environmental efficiency gains.
Overall, these findings reveal substantial regional heterogeneity in the stage of industrial agglomeration development. Accordingly, three distinct regional groups can be identified: mature regions (e.g., Jiangsu and Hubei) that have already entered the congestion-effect stage; transitional regions (e.g., Tianjin and Jiangxi) that are approaching the turning point; and early-stage regions that remain below the threshold and continue to benefit from agglomeration economies. This heterogeneity provides a structural explanation for the observed inverted U-shaped relationship, as the aggregate nonlinear effect is driven by asynchronous transitions across regions. From a policy perspective, mature regions should prioritize strengthening environmental regulation and improving ecological carrying capacity to mitigate congestion effects, transitional regions should carefully balance efficiency gains and environmental risks to avoid excessive agglomeration, while early-stage regions may continue to promote moderate industrial agglomeration to enhance scale economies and resource-sharing efficiency.
4.3. Impact of Freshwater Aquaculture Industrial Agglomeration on Environmental Efficiency
To investigate the impact of freshwater aquaculture industrial agglomeration on environmental efficiency, this study employs a two-way fixed-effects model for panel data estimation. The regression results are reported in Table 5. Column (1) includes only the core explanatory variable and its squared term, while Columns (2)–(5) progressively incorporate the control variables.
Table 5.
Regression Results of Freshwater Aquaculture Industrial Agglomeration and Environmental Efficiency.
The estimation results indicate that the coefficient of the first-order term of industrial agglomeration is significantly positive across all models, whereas the coefficient of the squared term is significantly negative, indicating a stable inverted U-shaped relationship between industrial agglomeration and environmental efficiency. Specifically, the results in Column (5) show that the coefficient of the first-order term is 0.5246 (significant at the 5% level), while the coefficient of the squared term is −0.1041 (significant at the 1% level). Based on these regression coefficients, the turning point of the inverted U-shaped relationship is calculated to occur at an industrial agglomeration level of 2.519. This suggests that, for most regions still below the threshold, moderate industrial agglomeration continues to exert positive environmental externalities. However, regions with excessively high agglomeration levels may already face diminishing environmental returns.
When the level of industrial agglomeration remains below this threshold, economies of scale, infrastructure sharing, and technological spillovers generated by agglomeration reduce environmental governance costs for aquaculture producers and facilitate the adoption of green production practices. This, in turn, generates increasing marginal returns and improves environmental efficiency in freshwater aquaculture. However, once the agglomeration level exceeds the threshold, excessive concentration intensifies resource competition for limited water resources, breeding space, feed inputs, and environmental carrying capacity. High-density aquaculture production may further increase pollutant emissions, such as aquaculture tailwater discharge and nutrient accumulation, while also raising the risk of disease transmission among farming units. These crowding effects weaken the environmental benefits generated by agglomeration and ultimately reduce environmental efficiency.
Regarding the control variables, the results in Column (5) indicate that industrial structure and urbanization level exert significant effects on the environmental efficiency of freshwater aquaculture. First, the freshwater aquaculture industrial structure has a significantly positive effect on environmental efficiency at the 5% significance level. This suggests that the continuous optimization of industrial structure has promoted the transition from traditional extensive aquaculture to intensive and facility-based production, thereby improving resource utilization efficiency and enhancing environmental efficiency.
Second, the urbanization rate has a significantly negative effect on environmental efficiency at the 5% significance level, indicating that higher urbanization levels are associated with lower environmental efficiency in freshwater aquaculture. One possible explanation is that rapid urbanization may not only accelerate the outflow of rural labor but also intensify competition between urban expansion and aquaculture production for land and water resources. In addition, the expansion of non-agricultural industries may increase environmental pressure on surrounding aquatic ecosystems, thereby constraining the development of ecological aquaculture and reducing environmental efficiency.
Both regional economic development level and government environmental expenditure exhibit positive but statistically insignificant effects on environmental efficiency. On the one hand, improvements in regional economic development may promote the adoption of green aquaculture technologies and optimize resource allocation. However, these effects often require a relatively long adjustment period, particularly during the early stages of environmental governance and green transformation. Their effects may operate indirectly and exhibit significant time-lag characteristics, making them difficult to capture within the current sample period. On the other hand, although increased government environmental expenditure is generally expected to improve environmental efficiency, its effectiveness largely depends on the efficiency of fund allocation and policy implementation. If environmental expenditure is not effectively directed toward aquaculture water pollution control and green technology development, its contribution to environmental efficiency improvement may remain limited, resulting in statistically insignificant regression coefficients.
Overall, the benchmark regression results indicate that freshwater aquaculture industrial agglomeration exerts a nonlinear effect on environmental efficiency, with moderate agglomeration generating positive environmental externalities while excessive agglomeration leads to ecological crowding effects.
4.4. Robustness Tests
4.4.1. Substitution of the Dependent Variable
To alleviate potential estimation bias arising from alternative efficiency measurement approaches, this study recalculates environmental efficiency using the Super-Epsilon-Based Measure (Super-EBM) model. Compared with the conventional EBM model, the Super-EBM model not only incorporates both radial and non-radial characteristics but also allows efficiency scores to exceed one, thereby enabling further discrimination among efficient decision-making units (DMUs) [43]. The regression results based on the recalculated Super-EBM efficiency values are reported in Column (5) of Table 6. The results show that the coefficient of the first-order term of freshwater aquaculture industrial agglomeration remains significantly positive, whereas the coefficient of the squared term remains significantly negative. The consistency of the coefficient signs and significance levels across different efficiency measurement methods suggests that the estimated nonlinear relationship is not sensitive to the specification of the environmental efficiency indicator, thereby confirming the robustness and reliability of the baseline findings.
Table 6.
Robustness Test Results.
4.4.2. Truncation
The baseline regression results reveal an inverted U-shaped relationship between freshwater aquaculture industrial agglomeration and environmental efficiency. However, considering that outliers may affect the estimation results, due to substantial regional differences in aquaculture scale, resource endowment, and environmental governance capacity across provinces, the main variables were winsorized at the 1% level. The regression results are reported in Column (6) of Table 6. Compared with the baseline regression results, neither the magnitude nor the sign of the coefficients of the core explanatory variables changed substantially, and both coefficients remained significant at the 1% level. The stability of the regression coefficients after winsorization indicates that the estimated inverted U-shaped relationship is not driven by extreme observations, thereby further supporting the robustness of the empirical results.
4.4.3. Shortening the Study Period
Considering that freshwater aquaculture production, logistics, and technology diffusion activities were affected to varying degrees during the COVID-19 pandemic, which may have altered the normal operation of industrial linkages, factor mobility, and technology spillovers within freshwater aquaculture clusters, this study excludes the 2021–2023 samples and re-estimates the model. The results are reported in Column (7) of Table 6. Both the first-order term of industrial agglomeration and its squared term remain significant at the 10% level. The persistence of the inverted U-shaped relationship after excluding the pandemic period suggests that the baseline findings are not driven by short-term external shocks associated with COVID-19.
4.5. Endogeneity Test
Industrial agglomeration may improve regional environmental efficiency; however, regions with higher environmental efficiency may attract greater government support, infrastructure investment, and aquaculture enterprises due to their stronger ecological governance capacity and higher production sustainability, thereby exerting a reverse effect on industrial agglomeration. In other words, a bidirectional causal relationship may exist between the two variables, giving rise to potential endogeneity concerns. To address this issue, this study uses the one-period lagged values of freshwater aquaculture industrial agglomeration and its squared term as instrumental variables and conducts a two-stage least squares (2SLS) estimation [44]. The lagged terms are expected to be strongly correlated with current industrial agglomeration due to path dependence and persistence in regional industrial development, while being less likely to directly affect current environmental efficiency except through their impact on current agglomeration levels. The regression results are reported in Column (10) of Table 7.
Table 7.
Results of the endogeneity analysis.
The test results show that the Kleibergen–Paap rk LM statistic is 38.390 and is significant at the 1% level, indicating that the selected instrumental variables are sufficiently correlated with the endogenous explanatory variables and satisfy the identification requirement. In addition, the Cragg–Donald Wald F-statistic is 29.219, exceeding the 10% critical value of 7.03 in the Stock–Yogo weak identification test, thereby suggesting that the selected instrumental variables possess adequate explanatory power and are unlikely to suffer from weak instrument bias. These results confirm the validity of the selected instrumental variables.
After controlling for endogeneity, the coefficient of the first-order term of industrial agglomeration remains significantly positive, whereas the coefficient of the squared term remains significantly negative. This indicates that the relationship between freshwater aquaculture industrial agglomeration and environmental efficiency still exhibits a significant inverted U-shaped pattern. This finding suggests that the estimated inverted U-shaped relationship is not driven by reverse causality or endogeneity bias, thereby further enhancing the credibility of the baseline regression results.
4.6. Heterogeneity Analysis
4.6.1. Stocking Density Heterogeneity Analysis
Stocking density is an important factor affecting the self-purification capacity of water bodies, and the impact of industrial agglomeration on environmental efficiency may vary under different stocking density conditions. Therefore, this study measures stocking density using the ratio of freshwater aquaculture production to freshwater aquaculture area. Using the median stocking density as the threshold, the sample is divided into low-density and high-density aquaculture groups. The grouped regression results are reported in Columns (11) and (12) of Table 8.
Table 8.
Test for Heterogeneity.
The results show that, in low-density aquaculture areas, the coefficient of the first-order term of industrial agglomeration is significantly positive, whereas the coefficient of the squared term is significantly negative, both at the 1% significance level. This indicates a significant inverted U-shaped relationship between industrial agglomeration and environmental efficiency. One possible explanation is that, under low-density aquaculture conditions, the self-purification capacity of water bodies remains relatively strong. In this context, industrial agglomeration can optimize regional resource allocation and promote technological innovation in aquaculture, thereby improving environmental carrying capacity and environmental efficiency. Moreover, relatively lower ecological pressure provides greater room for the environmental benefits of technological spillovers and green production practices to materialize. However, when agglomeration becomes excessive, intensified resource exploitation and concentrated pollutant discharge may exceed the environmental carrying capacity, ultimately leading to a decline in environmental efficiency.
In contrast, in high-density aquaculture areas, neither the coefficient of the first-order term nor that of the squared term is statistically significant, and the inverted U-shaped relationship is no longer observed. This may be because, under high-density aquaculture conditions, environmental pressure on water bodies has already approached or exceeded their self-purification capacity. Although industrial agglomeration may generate certain technological and resource advantages, in high-density aquaculture areas, environmental constraints may become the dominant factor affecting environmental efficiency, thereby weakening the marginal environmental benefits generated by industrial agglomeration. As a result, the adverse environmental effects of excessive aquaculture density may mask the potential benefits of industrial agglomeration, rendering the inverted U-shaped relationship insignificant.
4.6.2. Temporal Heterogeneity Analysis
In 2015, the State Council issued the Water Pollution Prevention and Control Action Plan, which explicitly emphasized the promotion of environmentally friendly aquaculture practices and strengthened environmental governance in the aquaculture sector. To examine whether the effects of industrial agglomeration changed before and after the implementation of this policy, this study divides the sample into two periods, 2009–2014 and 2015–2023, and conducts separate regressions. The results are reported in Columns (13) and (14) of Table 8.
The results show that during the 2015–2023 period, the coefficient of the first-order term of industrial agglomeration is significantly positive, whereas the coefficient of the squared term is significantly negative, indicating a significant inverted U-shaped relationship with environmental efficiency. In contrast, during the 2009–2014 period, the relationship is not statistically significant. One possible explanation is that, following the implementation of the Water Pollution Prevention and Control Action Plan, environmental regulation of aquaculture water pollution was significantly strengthened across regions, leading to stricter constraints on pollutant emissions. Prior to the implementation of the policy, relatively weak environmental regulation may have allowed the environmental externalities of industrial agglomeration to remain insufficiently differentiated across regions, thereby weakening the observable nonlinear relationship.
Under increasingly stringent environmental regulations, the dual effects of industrial agglomeration became more pronounced. Moderate agglomeration promoted the diffusion of advanced aquaculture technologies and infrastructure sharing, thereby improving resource allocation and environmental governance efficiency and enhancing environmental efficiency within a certain range. However, once the agglomeration level exceeded the environmental carrying capacity threshold, ecological pressure gradually accumulated, and the negative effects associated with pollutant emissions and resource consumption became dominant, ultimately reducing environmental efficiency. The strengthened environmental regulation also raised environmental compliance requirements for aquaculture producers, making the environmental consequences of excessive agglomeration more apparent.
4.7. Mediating Mechanism Analysis
To examine the mediating role of freshwater aquaculture technology diffusion in the relationship between industrial agglomeration and environmental efficiency, this study adopts the two-step mediation analysis approach proposed by Jiang Ting to identify the underlying mechanism [36]. Traditional stepwise mediation analysis typically incorporates the mediating variable directly into the regression equation to examine changes in the coefficient of the core explanatory variable. However, from the perspective of causal inference, this approach may suffer from endogeneity problems because the mediating variable itself is often endogenous; directly including it in the regression may therefore lead to biased estimation results [36].
To address these limitations, Jiang Ting proposed a more rigorous analytical framework that focuses only on testing the effect of the core explanatory variable on the mediating variable, while the effect of the mediating variable on the outcome variable is justified through theoretical analysis or existing authoritative literature [36]. This two-step approach effectively avoids the endogeneity bias associated with traditional mediation methods and is more consistent with the causal inference framework commonly used in economics research.
This study further examines the mediating role of technology diffusion in the relationship between freshwater aquaculture industrial agglomeration and environmental efficiency. Technology diffusion is measured by the logarithm of the number of trained fishermen. The estimation results reported in Column (16) of Table 9 show that the coefficients of the first-order and squared terms of industrial agglomeration are 1.5241 and −0.4850, respectively, and are significant at the 10% and 5% levels, indicating a significant inverted U-shaped relationship between industrial agglomeration and technology diffusion. Specifically, during the moderate stage of agglomeration development, industrial agglomeration significantly promotes the diffusion and dissemination of aquaculture technologies through knowledge spillovers, demonstration effects, and increased interactions among producers. However, once the agglomeration level exceeds a certain threshold, excessive concentration may weaken the marginal effects of technology diffusion due to intensified competition for resources, congestion effects, and declining efficiency of information transmission.
Table 9.
Results of the mediation analysis.
Existing studies have widely confirmed that technology diffusion plays an important role in improving the environmental efficiency of aquaculture, mainly through the dissemination of green technological innovations and the enhancement of producers’ management capabilities. At the technological level, technology diffusion facilitates the transition from traditional production methods to low-pollution and high-efficiency technologies, promotes intensive economic development, and improves resource allocation efficiency, thereby enhancing green production efficiency [45]. In addition, technology diffusion can mitigate the influence of time preference and encourage producers to adopt environmentally friendly management practices, contributing to long-term ecological benefits [46]. Further shows that green technologies and ecological farming models can be effectively disseminated through demonstration effects, brand effects, cost effectand neighborhood spillovers among aquaculture operators, thereby improving environmental efficiency [47]. At the managerial level, technology diffusion represents a process of knowledge transfer and skill accumulation. The dissemination and adoption of agricultural technologies not only improve producers’ access to information [48] but also enhance their resilience and adaptive capacity in response to climate change [49], thereby reducing resource waste and environmental pollution. Zhao Wenxin et al. (2023) further argue that technology diffusion improves green production efficiency by expanding access to information, increasing production efficiency, and mitigating environmental pollution [50].
Overall, the results suggest that industrial agglomeration indirectly affects environmental efficiency through the mediating effect of technology diffusion. Moderate industrial agglomeration promotes the dissemination of green technologies and management knowledge, thereby improving environmental efficiency, whereas excessive agglomeration weakens the marginal effects of technology diffusion and consequently exerts a negative impact on environmental efficiency. Therefore, Hypothesis H2 is verified.
5. Discussion
Although the location quotient index is a commonly used indicator to measure the degree of industrial agglomeration, it still has certain limitations when applied to heterogeneous production systems such as freshwater aquaculture. In essence, this indicator captures the relative concentration of industry across regions, but it does not provide information on the internal composition or organizational structure of the agglomeration itself. As a result, it cannot distinguish whether a high level of agglomeration is driven by a large number of small-scale traditional farming households or by a smaller number of large-scale and more industrialized enterprises.
This limitation is particularly relevant in the context of aquaculture, where production organization is highly diverse. In practice, smallholder-based clusters and industrialized farming systems often coexist, but their environmental implications may differ substantially. Small-scale fragmented farms are typically characterized by limited access to advanced technologies, weaker environmental management capacity, and relatively dispersed pollution control efforts. In contrast, large-scale industrial enterprises are more likely to adopt standardized production practices, invest in pollution abatement technologies, and achieve higher resource utilization efficiency through economies of scale. Therefore, although both types of production structures may generate similar values of location quotient, their actual impacts on environmental efficiency can be quite different.
Accordingly, the location quotient index should be interpreted as a measure of spatial concentration rather than a comprehensive reflection of agglomeration quality or structure. This implies that the empirical results of this study should be understood in terms of average agglomeration intensity, while potential structural differences within aquaculture clusters are not explicitly captured. Future research could further refine the measurement of industrial agglomeration by distinguishing between different production organization forms, so as to better identify their heterogeneous environmental effects.
6. Conclusions and Policy Recommendations
6.1. Research Conclusions
This study employs a Global Super-SBM model with undesirable outputs to estimate environmental efficiency across 18 major freshwater aquaculture provinces in China from 2009 to 2023, and documents its temporal evolution and regional heterogeneity. The location quotient method is then used to measure the degree of industrial agglomeration in the freshwater aquaculture sector and to capture regional variation in agglomeration patterns. A two-way fixed-effects model is further applied to identify the nonlinear relationship between industrial agglomeration and environmental efficiency, together with robustness checks, endogeneity tests, mediation analysis, and heterogeneity analysis. The main findings are as follows:
First, environmental efficiency shows a steady upward trend over the sample period, increasing from 0.516 in 2009 to 0.723 in 2023. Clear regional disparities are observed: South China exhibits the highest average efficiency (0.605), while Central China records the lowest (0.514), reflecting differences in resource endowments and development conditions. Second, industrial agglomeration displays marked spatial imbalance, with a distinct clustering pattern along rivers and coastal areas. A robust inverted U-shaped relationship is identified between industrial agglomeration and environmental efficiency, with an inflection point at 2.519. Below this threshold, agglomeration enhances efficiency through scale economies and knowledge spillovers, whereas beyond it, congestion effects dominate and reduce efficiency.
Third, the mediation analysis shows that technology diffusion serves as an important transmission channel linking industrial agglomeration and environmental efficiency. Moderate agglomeration promotes technology diffusion and improves environmental performance, while excessive agglomeration weakens its marginal effects and reduces efficiency gains. Fourth, the inverted U-shaped relationship is more pronounced in low-density aquaculture regions. Temporally, it is significant during 2015–2023 but not during 2009–2014, suggesting that stricter environmental regulation has strengthened and accelerated the manifestation of agglomeration effects.
6.2. Policy Recommendations
Based on the empirical findings, this study proposes the following policy implications that are directly derived from the estimated results and threshold effects.
First, implement threshold-based zoning policies for industrial agglomeration using the estimated inflection point (2.519). The results indicate a robust inverted U-shaped relationship between industrial agglomeration and environmental efficiency, with an estimated turning point at 2.519. Therefore, industrial agglomeration should not be promoted uniformly, but instead managed according to its position relative to this threshold. For regions where agglomeration levels remain below 2.519, policy should focus on promoting moderate clustering by improving infrastructure sharing, strengthening coordinated water resource management, and facilitating knowledge spillovers among aquaculture producers. For regions such as Hubei and Jiangsu, where agglomeration is approaching or exceeding the threshold, policy should prioritize controlling excessive concentration. In particular, early-warning mechanisms for aquaculture clustering should be established, and upper bounds on regional production intensity should be defined based on local water environmental carrying capacity. Pilot programs, such as density-based licensing systems or zoning-based stocking limits, should be introduced to prevent congestion-induced efficiency losses.
Second, construct a targeted technology diffusion system based on the mediating mechanism identified in this study. Empirical results confirm that technology diffusion is a key transmission channel through which industrial agglomeration affects environmental efficiency. Therefore, policy should focus on improving the effectiveness of technology diffusion rather than merely expanding its scale. A structured aquaculture technology diffusion system should be established, including standardized training programs for fishermen, demonstration-based diffusion platforms, and regionally coordinated extension services. Pilot technology diffusion hubs can be established in representative regions to test cooperative extension stations and digital training platforms. In addition, priority should be given to the promotion of low-pollution aquaculture technologies and ecological farming models to ensure that technology diffusion contributes directly to environmental efficiency improvement.
Third, design differentiated stocking density regulation policies based on empirical heterogeneity results. The heterogeneity analysis shows that the inverted U-shaped relationship is significant in low-density aquaculture areas but not significant in high-density regions, indicating that stocking density conditions the effectiveness of industrial agglomeration. In low-density regions, policy should encourage a gradual transition toward moderate intensification by improving resource utilization efficiency while avoiding underuse of aquaculture space. In high-density regions, stricter environmental carrying capacity constraints should be implemented. Governments should establish scientifically defined stocking density ceilings based on water quality conditions and pollutant absorption capacity, and implement real-time monitoring systems for aquaculture intensity. Where necessary, phased reduction strategies should be adopted to gradually alleviate excessive stocking pressure while maintaining production stability. At the same time, agricultural extension services should be more deeply integrated into the transition process in highly concentrated aquaculture regions. Governments and local fisheries departments should strengthen technical training, demonstration programs, and on-site guidance to help aquaculture farmers gradually adopt organic and ecological aquaculture models, including environmentally friendly feeding practices, reduced chemical inputs, and water recycling technologies. Through the combined effects of technical support and ecological management, the negative environmental impacts associated with excessive stocking density can be mitigated while maintaining the long-term sustainability of freshwater aquaculture production.
Fourth, strengthen cross-regional coordination mechanisms to optimize the allocation of production factors. A coordinated development framework for freshwater aquaculture should be established to facilitate the efficient flow of technology, capital, and labor across regions. Pilot inter-regional cooperation zones can be established to test shared water quality monitoring systems, joint pollution control mechanisms, and unified technical standards. In addition, high-efficiency regions should be encouraged to provide technical support to low-efficiency regions through institutionalized transfer programs, ensuring balanced technology diffusion and improving overall environmental performance across regions.
Author Contributions
Q.W.: Conceptualization, Methodology, Software, Validation, Formal Analysis, Investigation, Writing—Original Draft; Y.Z.: Supervision, Project Administration, Validation, Resources, Writing—Review and Editing, Funding Acquisition; S.Y.: Methodology, Software, Validation, Project Administration, Supervision, Resources, Data Curation; L.P.: Supervision, Project Administration, Funding Acquisition, Writing—Review and Editing, Formal Analysis, Data Curation, Methodology, Software. All authors have read and agreed to the published version of the manuscript.
Funding
This research was funded by the Shanghai Academy of Agricultural Sciences 2025–2026 Open Competition Project for Key Tasks (grant number: BS25019) and the Shanghai Ocean University (grant number: SHYJYJH-B-252601).
Institutional Review Board Statement
Not applicable.
Data Availability Statement
The original contributions presented in this study are included in the article. Further inquiries can be directed to the corresponding authors.
Conflicts of Interest
The authors declare no conflicts of interest.
References
- Yang, Z.; Peng, L.; Yan, Z. Dynamic Evolution and Convergence Analysis of Green Development Level in China’s Freshwater Aquaculture Industry: From the Perspective of Green Total Factor Productivity. J. Agrotech. Econ. 2023, 12, 57–77. [Google Scholar] [CrossRef]
- Dang, Y.; Gao, W.; Li, S. Industrial Agglomeration, Human Capital Accumulation and Spatial Spillover Effect. Commer. Res. 2020, 6, 55–64. [Google Scholar] [CrossRef]
- Yan, J.; Zhao, J.; Yang, X. Is Producer Services Agglomeration a “New Engine” for Urban Green Economic Development? An Econometric Analysis of Chinese Cities. Environ. Dev. Sustain. 2024, 26, 17157–17183. [Google Scholar] [CrossRef] [Scilit]
- Huang, Y.; Zhao, X. The Coupling Relationship Between Marine Industry Agglomeration and Ecological Environment System From the Perspective of Ecological Environment. J. Sea Res. 2024, 198, 102485. [Google Scholar] [CrossRef] [Scilit]
- Liu, J.; Qian, Y.; Song, S.-F.; Duan, R.-R. Industrial Symbiotic Agglomeration and Green Economic Growth: A Spatial Difference-in-Differences Approach. J. Clean. Prod. 2022, 364, 132560. [Google Scholar] [CrossRef] [Scilit]
- Zheng, Y.; Gao, C.; Lei, G. Empirical Analysis of Forestry Industry Agglomeration Level and Ecological Efficiency: Based on the Test of Panel Data from 15 Provinces in China. Econ. Geogr. 2017, 37, 136–142. [Google Scholar] [CrossRef]
- Jia, Z.; Chen, Q.; Na, H.; Yang, Y.; Zhao, J. Impacts of Industrial Agglomeration on Industrial Pollutant Emissions: Evidence Found in the Lanzhou–Xining Urban Agglomeration in Western China. Front. Public Health 2023, 10, 1109139. [Google Scholar] [CrossRef] [Scilit]
- Zhang, K.; Wang, D. The Interactive Influence and Spatial Spillover Between Economic Agglomeration and Environmental Pollution. China Ind. Econ. 2014, 6, 70–82. [Google Scholar] [CrossRef]
- Ye, R.; Qi, Y.; Zhu, W. Impact of Agricultural Industrial Agglomeration on Agricultural Environmental Efficiency in China: A Spatial Econometric Analysis. Sustainability 2023, 15, 10799. [Google Scholar] [CrossRef] [Scilit]
- Dai, S.; Xu, J.; Wang, L. Research on the Impact of Industrial Agglomeration and Technological Innovation on Environmental Efficiency of Dairy Farming. Heilongjiang Anim. Sci. Vet. 2022, 16, 1–9+23. [Google Scholar] [CrossRef]
- Chen, C.; Sun, Y.; Lan, Q.; Jiang, F. Impacts of Industrial Agglomeration on Pollution and Ecological Efficiency—A Spatial Econometric Analysis Based on a Big Panel Dataset of China’s 259 Cities. J. Clean. Prod. 2020, 258, 120721. [Google Scholar] [CrossRef] [Scilit]
- Ma, J.; Yu, X. The U-Shaped Impact of Manufacturing-Services Co-Agglomeration on Urban Green Efficiency: Evidence from the Yangtze River Delta. Sustainability 2026, 18, 967. [Google Scholar] [CrossRef] [Scilit]
- Luo, J.; Huang, M.; Hu, M.; Bai, Y. How Does Agricultural Production Agglomeration Affect Green Total Factor Productivity?: Empirical Evidence from China. Environ. Sci. Pollut. Res. 2023, 30, 67865–67879. [Google Scholar] [CrossRef] [Scilit]
- Zhang, H.; Zhang, J.; Song, J. Analysis of the Threshold Effect of Agricultural Industrial Agglomeration and Industrial Structure Upgrading on Sustainable Agricultural Development in China. J. Clean. Prod. 2022, 341, 130818. [Google Scholar] [CrossRef] [Scilit]
- Hu, Y.; Xu, J.; Yan, Z. Impact of Industrial Agglomeration on Environmental Efficiency of Pig Farming: An Empirical Analysis from China. Int. J. Agric. Sustain. 2025, 23, 2545044. [Google Scholar] [CrossRef] [Scilit]
- Li, Y.; Li, C. The Impact of Industrial Agglomeration on the Synergistic Level of Emission Reduction and Efficiency Improvement in Dairy Farming. Heilongjiang Anim. Sci. Vet. 2026, 3, 158–167. [Google Scholar] [CrossRef]
- Zeng, Y.; Guo, H.; Yao, Y.; Huang, L. The Formation of Agricultural E-Commerce Clusters: A Case from China. Growth Change 2019, 50, 1356–1374. [Google Scholar] [CrossRef] [Scilit]
- Wang, S.; Tian, X.; Zhang, X. Research on the Influence of Hog Breeding Industry Agglomeration on Environmental Efficiency. Agric. Mod. Res. 2019, 40, 459–469. [Google Scholar] [CrossRef]
- Gong, M.; He, G.; Wang, Y.; Yang, Y.; Li, X. Collaborative Industrial Agglomeration and a Green Low-Carbon Circular Development Economy: A Study Based on Provincial Panel Data in China. Sustainability 2025, 17, 6950. [Google Scholar] [CrossRef] [Scilit]
- Li, Y.; Yan, F. Research on the Impact of Agricultural Industrial Agglomeration on Agricultural Economic Resilience: Taking 77 Prefecture-Level Cities in the Middle and Lower Reaches of the Yangtze River as an Example. J. Agric. Tech. Econ. 2025, 4, 38–53. [Google Scholar] [CrossRef]
- Peng, L.; Yang, Z.; Yan, Z. Measurement of Fishery Technology Extension Efficiency and Its Influencing Factors in China. Stat. Decis. 2022, 38, 78–82. [Google Scholar] [CrossRef]
- Xu, J.; Li, C. “Scale Effect” or “Congestion Effect”?—Research on the Nonlinear Influence of Dairy Farming Industrial Agglomeration on Environmental Efficiency. J. Agric. Tech. Econ. 2023, 10, 22–43. [Google Scholar] [CrossRef]
- Huang, M.; Hu, J.; Wu, K.; Hu, M.; Bai, Y. Regional Agglomeration, Regulation, and Agricultural Sustainability: Evidence from China. Int. Rev. Econ. Financ. 2025, 104, 104714. [Google Scholar] [CrossRef] [Scilit]
- Song, M.; Liu, X. Research on the Mechanism of Digital Economy Empowering Agricultural Resilience: Based on the Mediating Effect Analysis of Human Capital. Jiangsu Soc. Sci. 2023, 1, 103–112. [Google Scholar] [CrossRef]
- Tone, K. A slacks-based measure of super-efficiency in data envelopment analysis. Eur. J. Oper. Res. 2002, 143, 32–41. [Google Scholar] [CrossRef] [Scilit]
- Xiao, Y. Research on the Industrial Green Transformation of Resource-Based Cities. Doctoral Dissertation, China University of Geosciences, Beijing, China, 2019. [Google Scholar] [CrossRef]
- Wang, J.; Xu, R.; Ye, S. Spatiotemporal evolution characteristics and influencing factors of China’s interprovincial industrial green efficiency based on the super-efficiency SBM model. Front. Environ. Sci. 2025, 13, 1625233. [Google Scholar] [CrossRef] [Scilit]
- Su, Z.; Zhao, Q.; Zheng, Y. Spatial regional disparities and convergence analysis of tourism eco-efficiency in the Yellow River Basin: A super-efficiency SBM model approach. Port. Econ. J. 2026, 25, 235–259. [Google Scholar] [CrossRef] [Scilit]
- Gao, J.; Shi, Q.; Lu, K. Evaluation on Technical Efficiency of Mariculture in China. J. Agric. Tech. Econ. 2018, 1, 132–144. [Google Scholar] [CrossRef]
- Wang, Z.; Chen, X.; Shi, L.; Zhang, X.; Hu, Y. Productivity versus Environmental Sustainability: A Broadscale Assessment of Freshwater Aquaculture’s Technical Efficiency and Ecological Efficiency in China’s Inland Provinces. J. World Aquac. Soc. 2024, 55, e13057. [Google Scholar] [CrossRef] [Scilit]
- Zhang, C.; Zhang, W.; Gao, Z. Research on Technical Efficiency and Total Factor Productivity of Aquaculture in China. J. Agric. Tech. Econ. 2014, 6, 38–45. [Google Scholar] [CrossRef]
- Gao, M.Y. Evaluation of Green Water Resource Efficiency in China’s Freshwater Aquaculture and Its Decoupling Analysis with Economic Growth. Master’s Thesis, Shanghai Ocean University, Shanghai, China, 2023. [Google Scholar] [CrossRef]
- Wu, D.; Liu, L. Study on eco-efficiency and influencing factors of freshwater aquaculture based on the Super-NSBM model in the Yangtze River Economic Belt. Aquac. Fish. 2025, 10, 1096–1105. [Google Scholar] [CrossRef] [Scilit]
- Qiu, L.Q.; Wu, G.Y.; Li, X.; Yu, L.; Fu, Z. Study on the Characteristics of Rural Non-Point Source Pollution in Hainan Province Based on Equivalent Standard Pollution Load Intensity. J. Agric. Resour. Environ. 2023, 40, 55–63. [Google Scholar] [CrossRef]
- Fu, Y.F.; Cui, J.M.; Chen, F.; Gu, B. Calculation and Spatiotemporal Evolution of Equivalent Pollution Load of Mariculture in Zhejiang Province. Ocean Dev. Manag. 2023, 40, 94–104. [Google Scholar] [CrossRef]
- Jiang, T. Mediating and Moderating Effects in Empirical Causal Inference Research. China Ind. Econ. 2022, 5, 100–120. [Google Scholar] [CrossRef]
- Zhou, X.; Li, G.; Wang, Q.; Zhou, D. U-Shaped Relationship Between Digitalization and Low-Carbon Economy Efficiency: Mediation and Spillover Effects. J. Clean. Prod. 2024, 458, 142535. [Google Scholar] [CrossRef] [Scilit]
- Yi, A.; Ji, Z.; Zhou, T.; Qiu, T.; Yin, R.; Li, C. The Impact of Agricultural Industrial Agglomeration on Agricultural Carbon Emissions: Evidence from China. Pol. J. Environ. Stud. 2025, 34, 6449–6464. [Google Scholar] [CrossRef] [Scilit]
- Qin, H.; Zhang, Y.; Lu, Y.Y. Measurement of Eco-Economic Efficiency of Mariculture in China Based on SBM Model. J. Agric. Tech. Econ. 2018, 9, 67–79. [Google Scholar] [CrossRef]
- Zhang, J.X.; Wang, H.L. Environmental Regulation, Agricultural Technological Innovation and Agricultural Carbon Emissions. Hubei Univ. J. (Philos. Soc. Sci.) 2020, 47, 147–156. [Google Scholar] [CrossRef]
- Li, J.Y.; Fu, X.H.; Luo, L.; Liu, Y. Impact of Factor Marketization on Agricultural Green Production Efficiency Under Heterogeneous Environmental Regulation. Chin. J. Eco-Agric. 2025, 33, 999–1011. [Google Scholar] [CrossRef]
- Hu, X.J.; Li, Q.F.; Zhang, H.Y.; Sun, C.; Yang, Y.; Chen, K.; Luo, L.; Xie, G.; Cao, Y. Current Situation, Problems and Suggestions of Fishery Microbial Inoculant Market in Major Aquaculture Areas of China. Chin. Fish. Qual. Stand. 2023, 13, 32–39. [Google Scholar] [CrossRef]
- Wang, T.; Li, W.; Jin, T.; Wu, J.; Liu, J. Research on Regional Differences and Influencing Factors of Energy Efficiency in China’s Agricultural Production Sector. Agriculture 2025, 15, 1189. [Google Scholar] [CrossRef] [Scilit]
- Li, J.; Yang, C.Y. Impact Mechanism of Co-Agglomeration of Manufacturing and Producer Services on Regional Ecological Efficiency. J. Sci. Technol. Manag. Res. 2025, 45, 229–237. [Google Scholar] [CrossRef]
- Guo, Q.; Liu, J.; Zhang, H.Y.; Wu, Z. Influence and mechanism of agricultural productive services on agricultural eco-efficiency. Chin. J. Eco-Agric. 2024, 32, 1744–1755. [Google Scholar] [CrossRef]
- Yang, H.; Shen, Y.Q.; Huang, J.Q.; Qian, W.-R.; Zhu, Z. Impact of Time Preference on Farmers’ Adoption of Ecological Management Technology for Non-Timber Forest Products—Based on the Moderating Role of Technology Promotion Intervention. J. Nat. Resour. 2026, 41, 589–608. [Google Scholar] [CrossRef] [Scilit]
- Zhang, Q.; Lin, J.; Wei, W.; Wei, Y. Evolutionary Path and Influences on Marine Ecological Farming: Dual Perspective of Government Intervention and Enterprise Participation. Discret. Dyn. Nat. Soc. 2022, 2022, 3250863. [Google Scholar]
- Liu, J.; Jia, J.F.; Xu, Q. How agricultural machinery purchase subsidies affect smallholders’ access to agricultural machinery socialized services—Analysis based on national rural fixed observation point data. China Rural Econ. 2023, 2, 85–108. [Google Scholar] [CrossRef]
- Antwi-Agyei, P.; Stringer, L. Improving the effectiveness of agricultural extension services in supporting farmers to adapt to climate change: Insights from northeastern Ghana. Clim. Risk Manag. 2021, 32, 100304. [Google Scholar] [CrossRef] [Scilit]
- Zhao, W.X.; Luo, X.F.; Tang, L. The impact of labor transfer on farmers’ grain green production efficiency—Also on the role of technology promotion. Resour. Sci. 2023, 45, 1440–1454. [Google Scholar] [CrossRef] [Scilit]
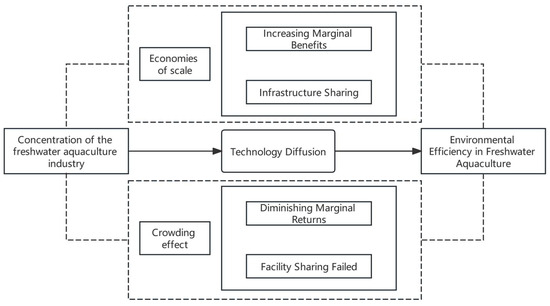
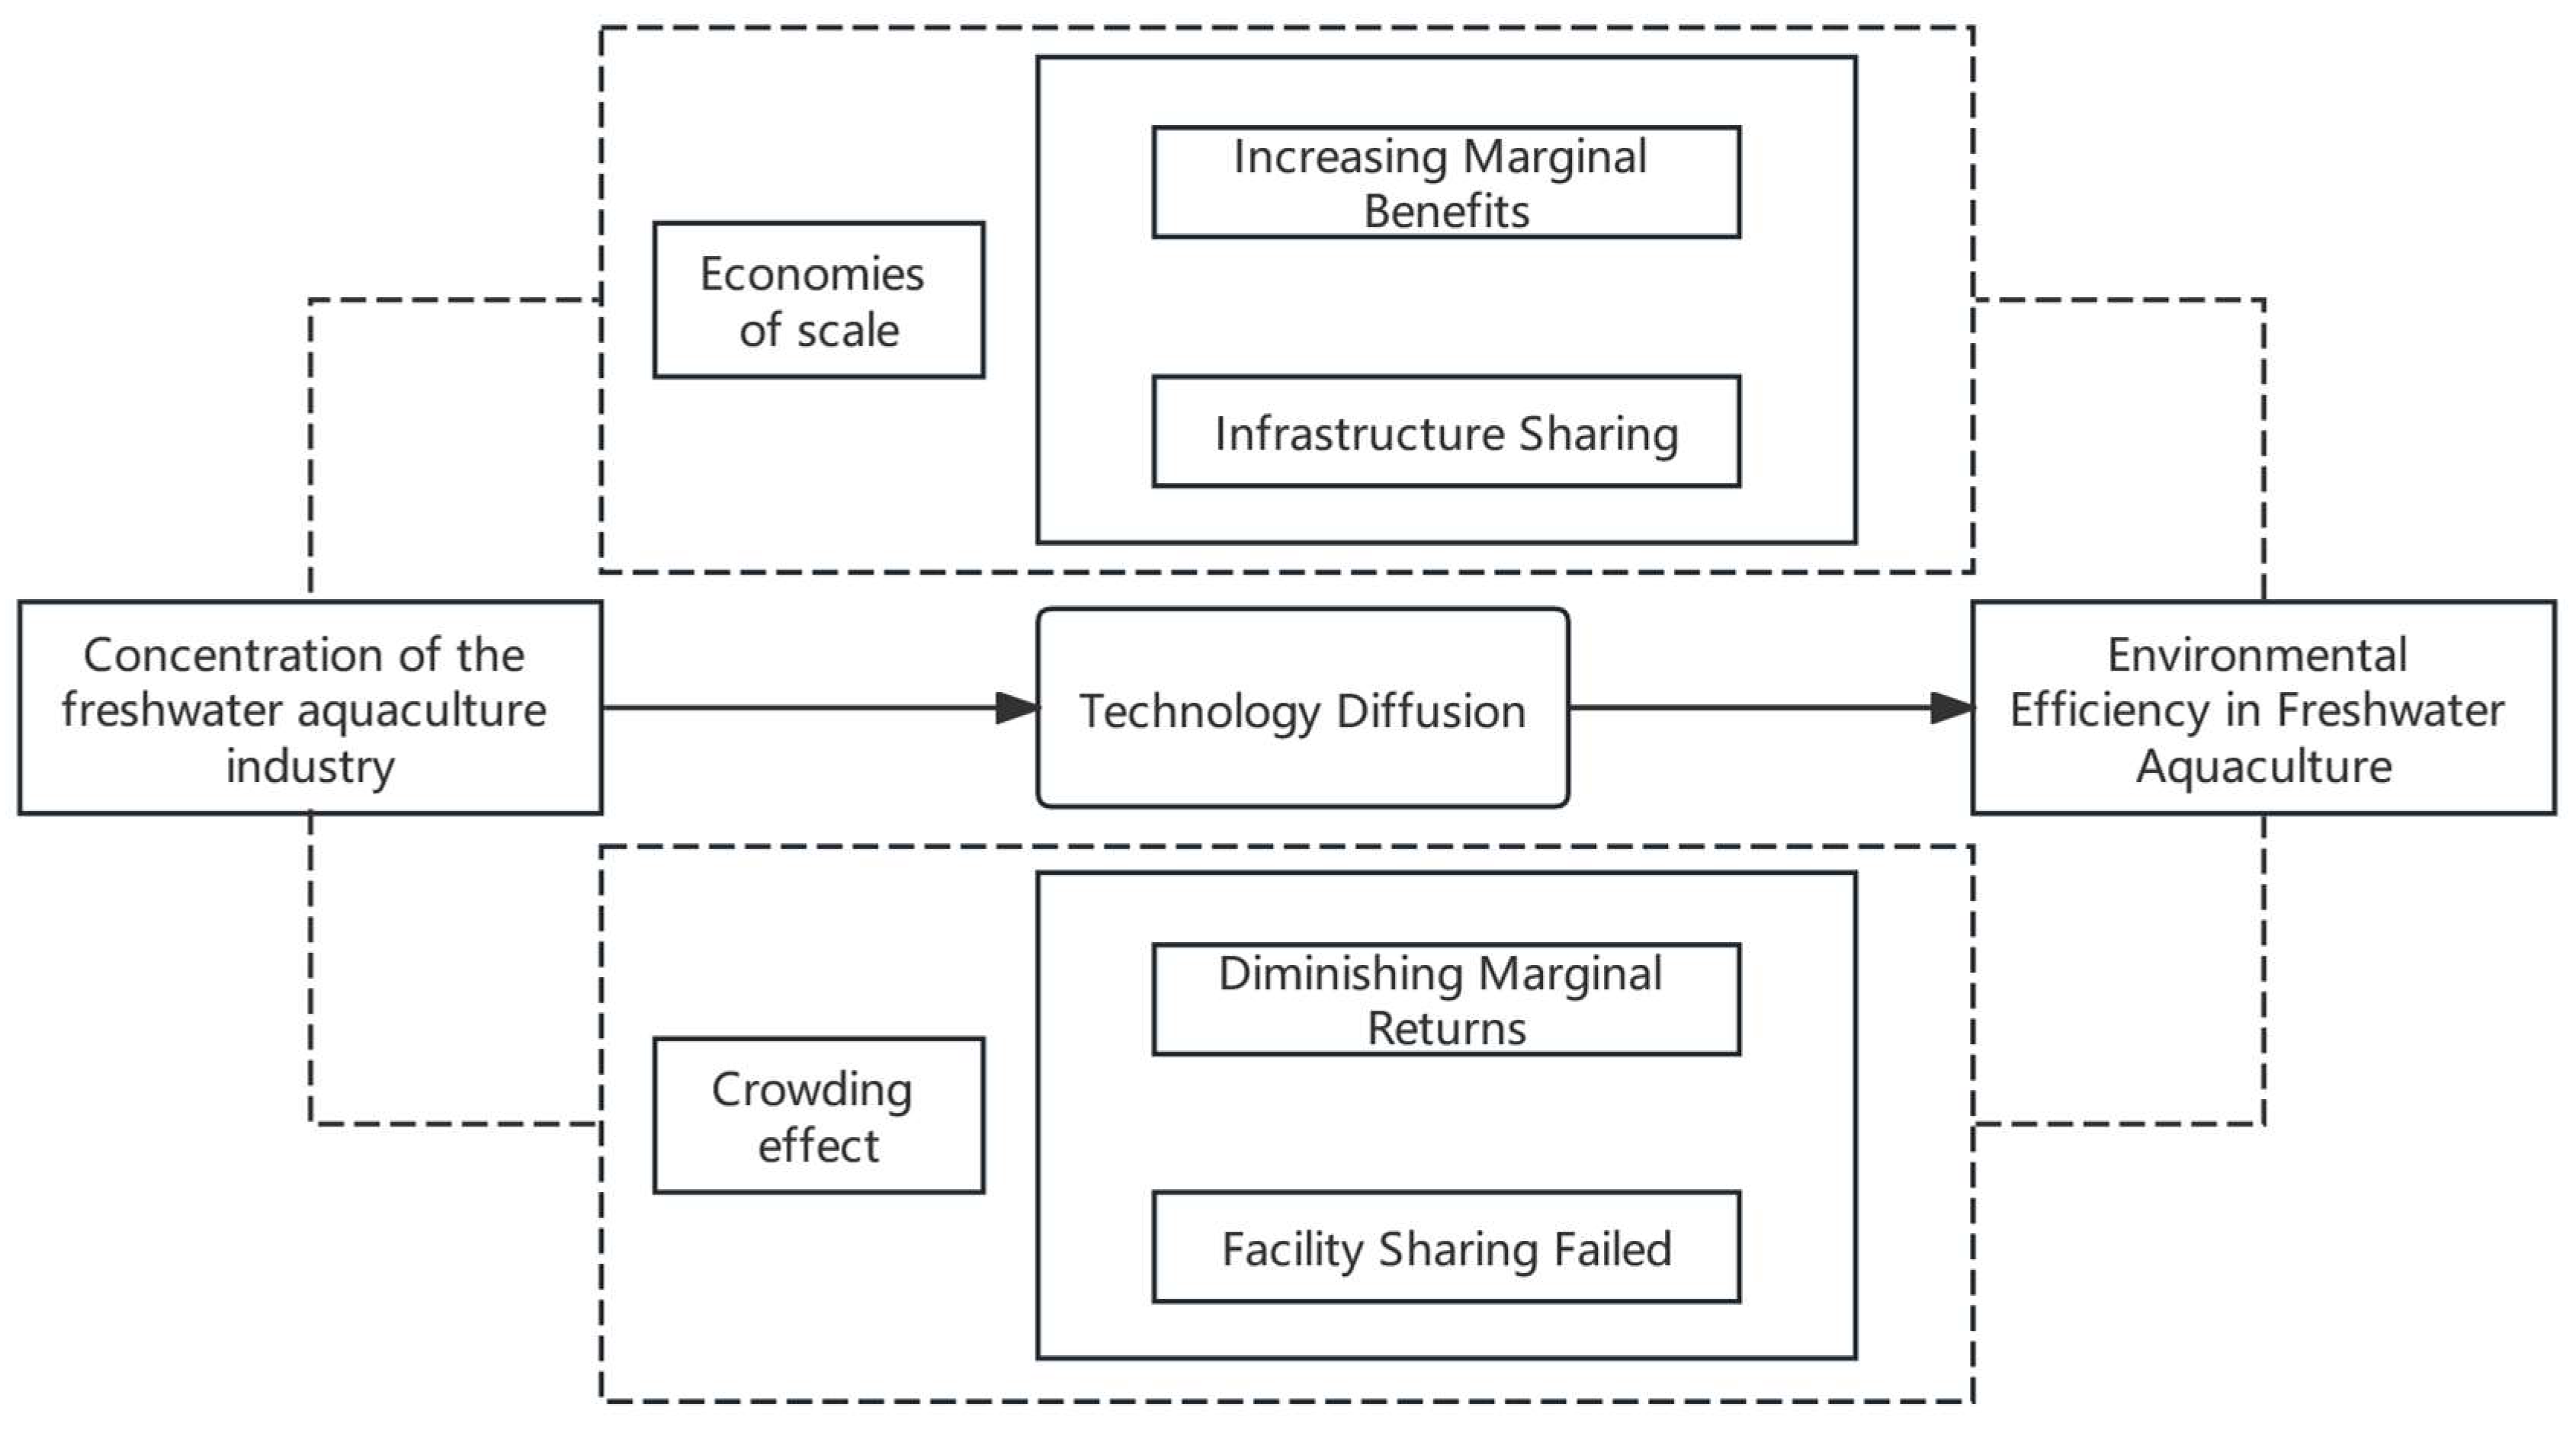
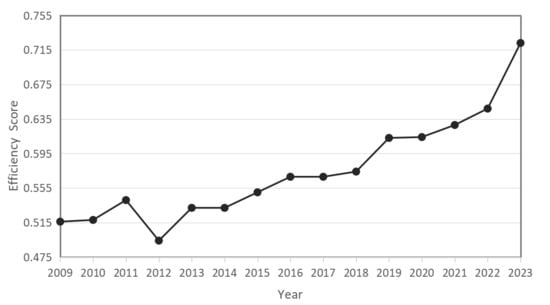
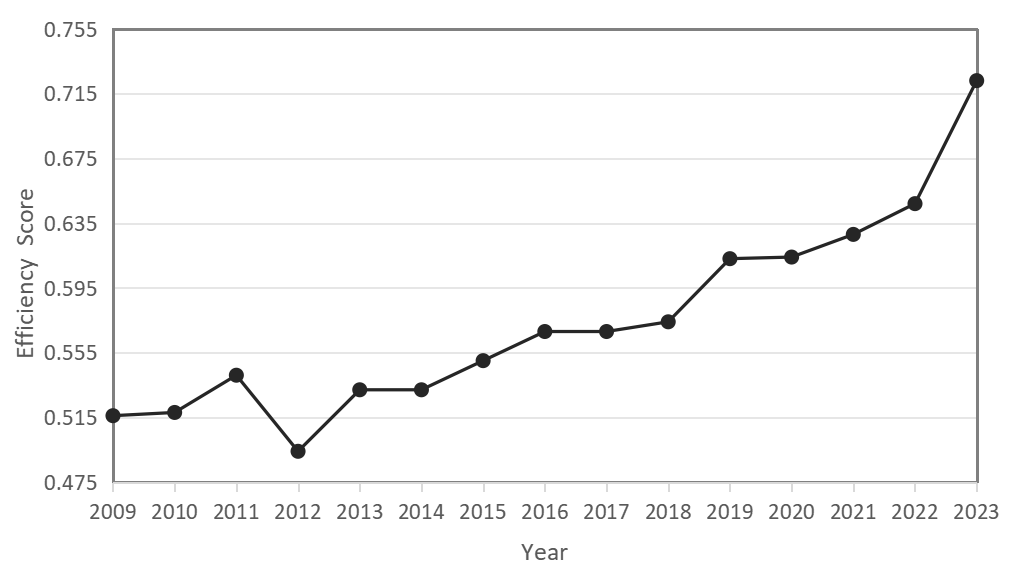
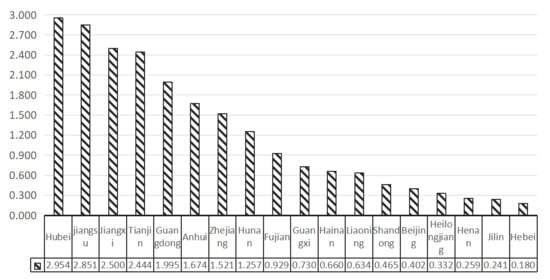
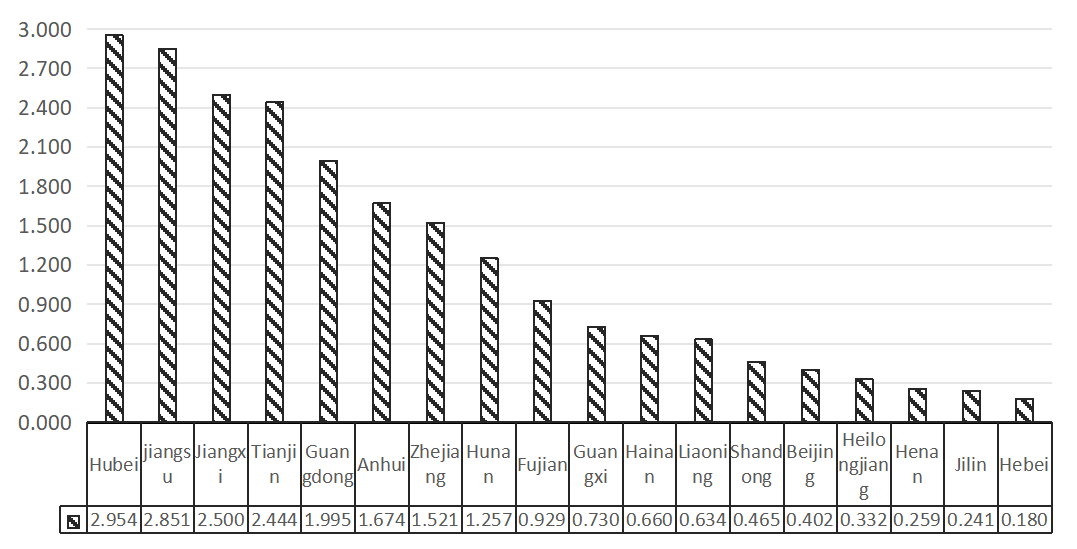

Disclaimer/Publisher’s Note: The statements, opinions and data contained in all publications are solely those of the individual author(s) and contributor(s) and not of MDPI and/or the editor(s). MDPI and/or the editor(s) disclaim responsibility for any injury to people or property resulting from any ideas, methods, instructions or products referred to in the content. |
© 2026 by the authors. Licensee MDPI, Basel, Switzerland. This article is an open access article distributed under the terms and conditions of the Creative Commons Attribution (CC BY) license.