


Abstract
Small-scale fisheries constitute the backbone of coastal livelihoods in Indonesia, yet comprehensive socio-economic data remain limited for effective management. This study characterizes the operational and socioeconomic patterns of multi-gear artisanal fisheries in the Pangandaran coastal waters of West Java, Indonesia. A cross-sectional survey of 136 fishers across 14 coastal communities was conducted using structured questionnaires covering socio-demographic characteristics, fishing operations, and catch composition. Complete economic data were available for 125 fishermen, while multivariate analyses used n = 105 due to listwise deletion of cases with missing predictor variables. Fishermen averaged 46.9 years of age with 25.8 ± 11.6 years of fishing experience. Mean monthly income was IDR 5.80 million (SD = 7.51, 95% CI: 4.47–7.13 million, approximately USD 387). Gillnet was the dominant fishing gear (73.5% of fishermen), followed by hook-and-line (14.7%). A total of 57 fish species were recorded, dominated by hairtail Trichiurus spp. (61.0% occurrence). Statistical analyses revealed weak relationships between conventional demographic and operational variables and income. Although crew number showed a statistically significant association with income (p = 0.039), its effect size was small, and the overall regression model was not significant, with very low explanatory power (R2 = 0.038). These results indicate that income variability is largely driven by unmeasured and context-specific factors rather than observable fishing characteristics. These findings provide baseline socio-economic data essential for developing community-specific management interventions in Pangandaran waters.
Keywords:
socioeconomic assessment; fishing gear diversity; tropical coastal fisheries; Indonesian fisheries; livelihood analysis Key Contribution:
This study provides the first comprehensive socio-economic baseline for multi-gear artisanal fisheries in Pangandaran, revealing significant inter-community economic disparities driven by unmeasured factors beyond conventional operational variables, with implications for targeted, community-specific fisheries management interventions.
1. Introduction
Small-scale fisheries play a critical role in global food security, providing livelihoods for approximately 90% of the world’s capture fishers and fish workers [1]. In tropical developing countries, these fisheries are particularly significant as they contribute substantially to protein supply, income generation, and coastal community resilience [2,3]. Indonesia, as the world’s largest archipelagic nation with over 54,000 km of coastline, depends heavily on small-scale fisheries, which account for more than 90% of total fishing operations and employ over 2.7 million fishermen [4]. Despite this importance, comprehensive socio-economic data on Indonesian small-scale fisheries remain limited for specific coastal regions, constraining evidence-based management and policy development.
The southern coast of Java represents one of Indonesia’s most productive fishing grounds, characterized by high species diversity and year-round fishing activities supported by the Indian Ocean’s oceanographic conditions [5]. Pangandaran, located in West Java Province, hosts numerous small-scale fishing communities that have historically depended on marine resources for their livelihoods. These communities employ diverse fishing gears and target multiple species, reflecting the multi-gear, multi-species nature typical of tropical small-scale fisheries [6,7]. However, Pangandaran’s small-scale fisheries face increasing pressures from overfishing, habitat degradation, and socio-economic changes, necessitating urgent attention from fisheries managers and policymakers.
Understanding the socio-economic characteristics and operational patterns of small-scale fishermen is fundamental for designing effective and equitable management strategies [8]. Factors such as income levels, fishing effort intensity, gear diversity, and seasonal patterns directly influence fishing behavior, resource exploitation rates, and community vulnerability to environmental and economic shocks [9]. Moreover, identifying inter-community variations in these characteristics enables targeted interventions that address specific local needs rather than applying blanket policies that may be ineffective or inequitable [10,11].
While previous studies on Indonesian small-scale fisheries exist [12,13], most have focused on the biological aspects of target species or on fishing gear selectivity [14,15]. Comprehensive socio-economic assessments that integrate demographic, fishing operations, income structures, and economic dimensions remain limited, particularly at localized coastal scales. Regional studies from similar tropical coastal fisheries in Southeast Asia demonstrate that socio-economic factors significantly influence fishing sustainability and community resilience [16,17]. In the case of Pangandaran, existing studies are sparse and fragmented; consequently, there is a lack of spatially explicit and community-level socio-economic data that can support context-specific fisheries management in this region.
This study addresses this knowledge gap by providing a comprehensive socio-economic characterization of small-scale fisheries in Pangandaran coastal waters. Specifically, the objectives were to: (1) characterizes the socio-demographic and operational characteristics of small-scale fishermen across different communities and compare these characteristics among communities to identify inter-community variations; (2) assess economic outcomes and identify factors influencing fishing income including differences in income levels across fishing communities; (3) document catch composition and species diversity in multi-gear fisheries; and (4) analyze spatial and temporal patterns of fishing activities. By integrating these dimensions, this study provides one of the first holistic socio-economic baselines for Pangandaran’s small-scale fisheries. The findings not only provide baseline data essential for developing community-specific fisheries management interventions but also contribute to the broader understanding of tropical small-scale fisheries by demonstrating how socio-economic heterogeneity influences fishing behavior and sustainability in multi-species, multi-gear systems.
2. Materials and Methods
2.1. Study Area
The study was conducted in the Pangandaran coastal region, located in Pangandaran Regency, West Java Province, Indonesia (7°41′ S, 10°839′ E). Pangandaran waters are part of the southern Java coastal zone facing the Indian Ocean, characterized by tropical marine ecosystems supporting diverse small-scale fisheries. The region experiences a tropical monsoon climate with two distinct seasons: the rainy season from November to April and the dry season from May to October [18]. Oceanographic conditions are influenced by the South Java Current and monsoonal wind patterns, which significantly affect fishing operations and catch composition throughout the year [19].
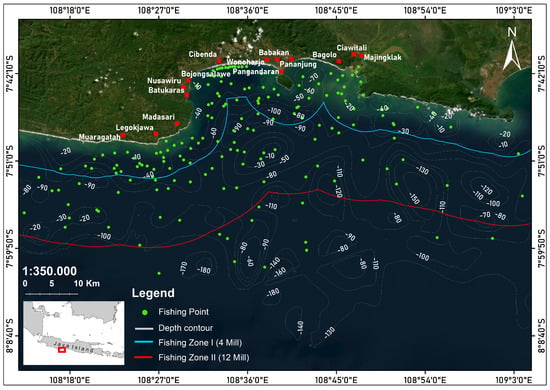
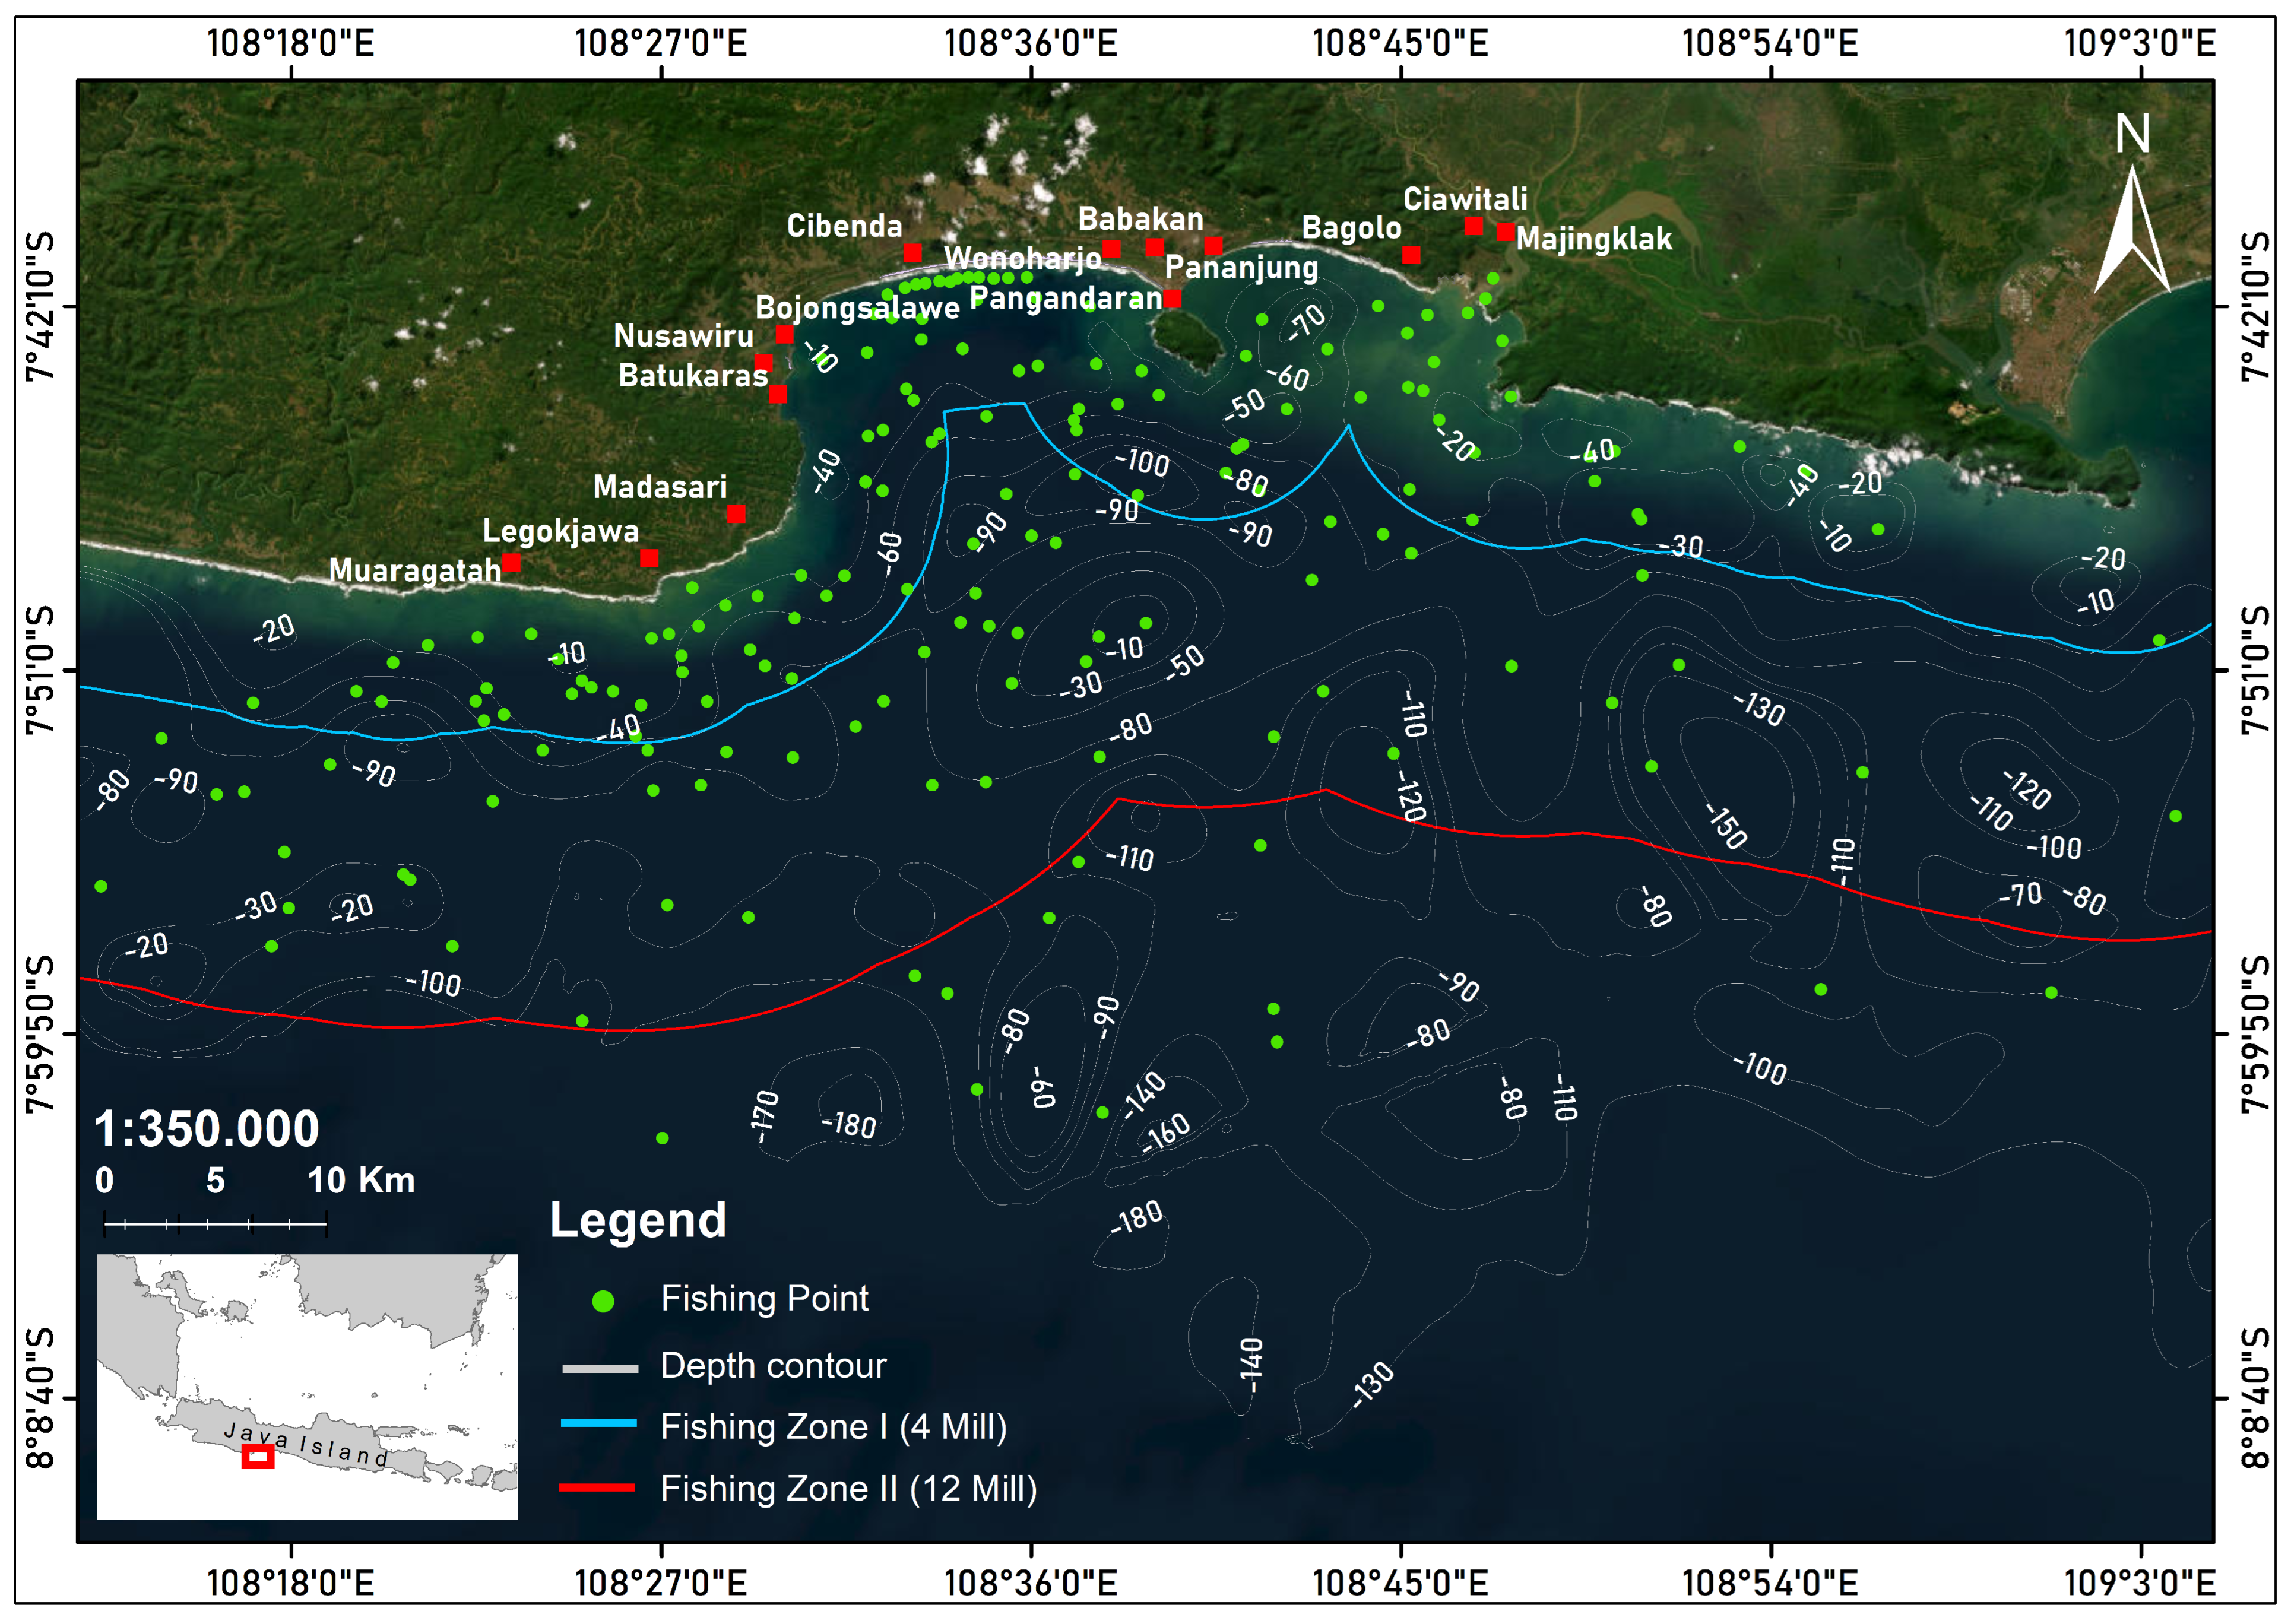
Fourteen fishing communities were selected for this study: Pananjung, Bojongsalawe, Cibenda, Muaragatah, Madasari, Wonoharjo, Bagolo, Majingklak, Batukaras, Ciawitali, Babakan, Nusawiru, Legokjawa, and Pangandaran village. These communities represent the major small-scale fishing landing sites along the Pangandaran coast and collectively account for significant fishing activities targeting both demersal and pelagic resources in nearshore and offshore waters. Figure 1 illustrates the spatial distribution of the 14 small-scale fishing communities included in the survey.
Figure 1.
Study area in Pangandaran coastal waters, West Java, Indonesia, showing the spatial distribution of 14 small-scale fishing communities included in the survey.
2.2. Sampling Design and Data Collection
A cross-sectional survey was conducted using a stratified purposive sampling approach. Stratification was based on key fishing characteristics, including fishing gear type, vessel size, and operational patterns, to ensure representation of the diversity of active small-scale fishermen across the 14 communities. Within each community, fishermen were first categorized into these predefined strata, and purposive sampling was subsequently applied within each stratum to select active fishermen. Key informants (community leaders and fish buyer representatives) facilitated the identification of eligible respondents within each stratum.
Given that full enumeration was not feasible, a stratified purposive sampling approach was employed to ensure adequate representation of the population structure. Stratification by fishing gear type, vessel size, and operational patterns ensured that respondents collectively captured the diversity of fishing practices across communities. This approach reduces sampling bias and enhances the extent to which the observed patterns reflect the broader population of small-scale fishermen, particularly in heterogeneous systems where variability is structured across identifiable strata. To complement this design and ensure that each stratum was sufficiently represented for statistical analysis, an appropriate sample size was determined.
The sample size was determined based on the estimated population of active small-scale fishermen in the study area (approximately 500–600 individuals), derived from local fisheries office records and validated through consultations with community leaders. A minimum sample size was calculated using a finite population sampling approach. This resulted in a required sample size of approximately 120–230 respondents. The final sample size of 136 fishermen falls within this acceptable range, supporting reliable statistical inference while maintaining logistical feasibility.
A total of 136 fishermen were interviewed using a structured questionnaire administered through face-to-face interviews. Interviews were conducted opportunistically with available fishermen at landing sites and fishermen’s residences during non-fishing hours to maximize response rates and data quality. The overall response rate was approximately 85%, with refusals primarily due to time constraints or reluctance to disclose economic information. Prior informed consent was obtained from all respondents, with participation being voluntary and anonymous. The questionnaire was developed in Indonesian (Bahasa Indonesia) and pre-tested with 10 fishermen from a neighboring community to ensure clarity and cultural appropriateness.
2.3. Variables and Measurements
The survey instrument collected data across three main categories:
- (1)
- Socio-demographic characteristics, including age, education level (categorized as elementary, junior high, or senior high school), number of household dependents, years residing in the community, and years of fishing experience, were included to capture individual and household attributes that may influence economic performance and adaptive capacity.
- (2)
- Economic variables, including self-reported monthly fishing income and household expenditure, were recorded in Indonesian Rupiah (IDR) at an approximate exchange rate of 1 USD ≈ 15,000 IDR, with the income-to-expenditure ratio calculated as an indicator of household economic security, and was used in descriptive and inferential analyses to assess the balance between earnings and living costs.
- (3)
- Fishing operational characteristics, including fishing season, gear type, vessel size, crew number, trip frequency, and trip duration, were included as key determinants of fishing effort and productivity, and were therefore considered potential predictors in the statistical analyses, including correlation and regression models.
2.4. Data Quality Control
Multiple measures were implemented to ensure data quality. Enumerators received standardized training on survey administration and ethical research conduct. Data entry was performed using double-entry verification to minimize transcription errors. Questionnaires with incomplete critical variables were excluded from relevant analyses. Sample sizes vary across analyses due to item non-response: age and fishing experience data were complete for all 136 respondents (100% response rate), economic variables had complete data for 125 respondents (92% response rate), and multivariate analyses employed listwise deletion, resulting in n = 105. Missing data patterns were examined and showed no systematic bias related to age, community, or gear type.
To assess potential bias arising from missing data, a comparative analysis was conducted between respondents with complete data and those with missing values. Continuous variables were compared using independent sample tests, while categorical variables (e.g., community and gear type) were evaluated using chi-square tests. The results indicated no statistically significant differences between groups (p > 0.05), suggesting that the missing data were randomly distributed and unlikely to introduce systematic bias into the analysis.
2.5. Statistical Analysis
All statistical analyses were conducted using R version 4.3.1 [20]. Descriptive statistics (mean, standard deviation, median, interquartile range) were calculated for all continuous variables. Confidence intervals (95% CI) for means were calculated using bootstrap methods for non-normal data. Normality was assessed using the Shapiro–Wilk test and visual inspection of Q–Q plots. As most variables exhibited non-normal distributions, non-parametric tests were primarily employed. Inter-community comparisons of key socio-economic and operational variables (e.g., income, expenditure, fishing effort indicators) were conducted using the Kruskal–Wallis test [21], with post hoc pairwise comparisons performed using Dunn’s test with Bonferroni correction [22]. Effect sizes were calculated as eta-squared (η2). Relationships among variables, including socio-demographic characteristics, economic indicators (income, expenditure, and income-to-expenditure ratio), and fishing operational variables, were assessed using Spearman’s rank correlation coefficient (ρ) [23]. Multiple linear regression analysis was conducted to identify key predictors of fishing income, with log10-transformed income as the dependent variable. Explanatory variables were selected based on their theoretical relevance to fishing productivity and livelihood outcomes, as well as their observed relationships in correlation analysis. Before model fitting, multicollinearity among explanatory variables was assessed, and variables with high collinearity were excluded or adjusted to ensure model robustness. Statistical significance was set at α = 0.05 for all tests.
3. Results
3.1. Socio-Demographic and Economic Characteristics
The sociodemographic and operational characteristics of small-scale fishers in Pangandaran were surveyed among 136 respondents. Table 1 presents the detailed descriptive statistics.
Table 1.
Socio-demographic, economic, and fishing operational characteristics of respondents.
The 136 surveyed fishermen exhibited demographic characteristics typical of established small-scale fishing communities. Mean age was 46.9 ± 10.8 years (range: 22–72 years), indicating a mature workforce. Fishing experience averaged 25.8 ± 11.6 years, demonstrating high occupational persistence. Most fishermen (76.8%) had resided in their communities for over 30 years (mean 44.8 ± 12.6 years). Educational attainment was generally low: 45.6% elementary school, 31.2% junior high school, and 23.2% senior high school, with no tertiary education reported. Household size averaged 3.0 ± 1.2 dependents.
Monthly fishing income exhibited substantial variation, with a mean income of IDR 5.80 million (SD = 7.51, 95% CI: 4.47–7.13 million, approximately USD 387) and a median of IDR 4.00 million. Income ranged from IDR 0.30 million to IDR 50.00 million, representing a 167-fold difference between minimum and maximum earners. The uniformly small vessel sizes (mean 2 GT) and minimal crew numbers (mean 2 persons) reflect capital constraints typical of Indonesian artisanal fisheries. Most fishermen (73.5%) employ gillnets and conduct frequent short-duration trips (mean 6 trips/week, 60% lasting 6–12 h), characteristic of one-day fishing operations.
Significant inter-community variation in monthly income was observed (Kruskal–Wallis H = 11.76, p = 0.019, η2 = 0.087, indicating a small to moderate effect size), as shown in Table 2. Madasari fishermen exhibited the highest mean income (IDR 13.10 ± 17.37 million), more than four times higher than Cibenda as the lowest-earning community (IDR 2.70 ± 1.21 million). Post hoc pairwise comparisons using Dunn’s test indicated that Madasari’s income differed significantly from Cibenda (p = 0.008) but not from other communities, suggesting localized rather than systematic patterns. Trips per week varied significantly among communities (H = 26.46, p < 0.001), with Cibenda conducting more frequent trips (8.12 ± 2.03 trips/week) compared to other communities, potentially indicating compensatory effort in response to lower per-trip productivity.
Table 2.
Site-level differences in socioeconomic and fishing characteristics across selected communities.
3.2. Fishing Operational Characteristics and Gear Diversity
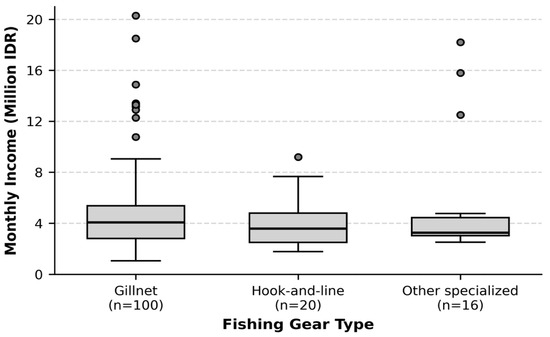
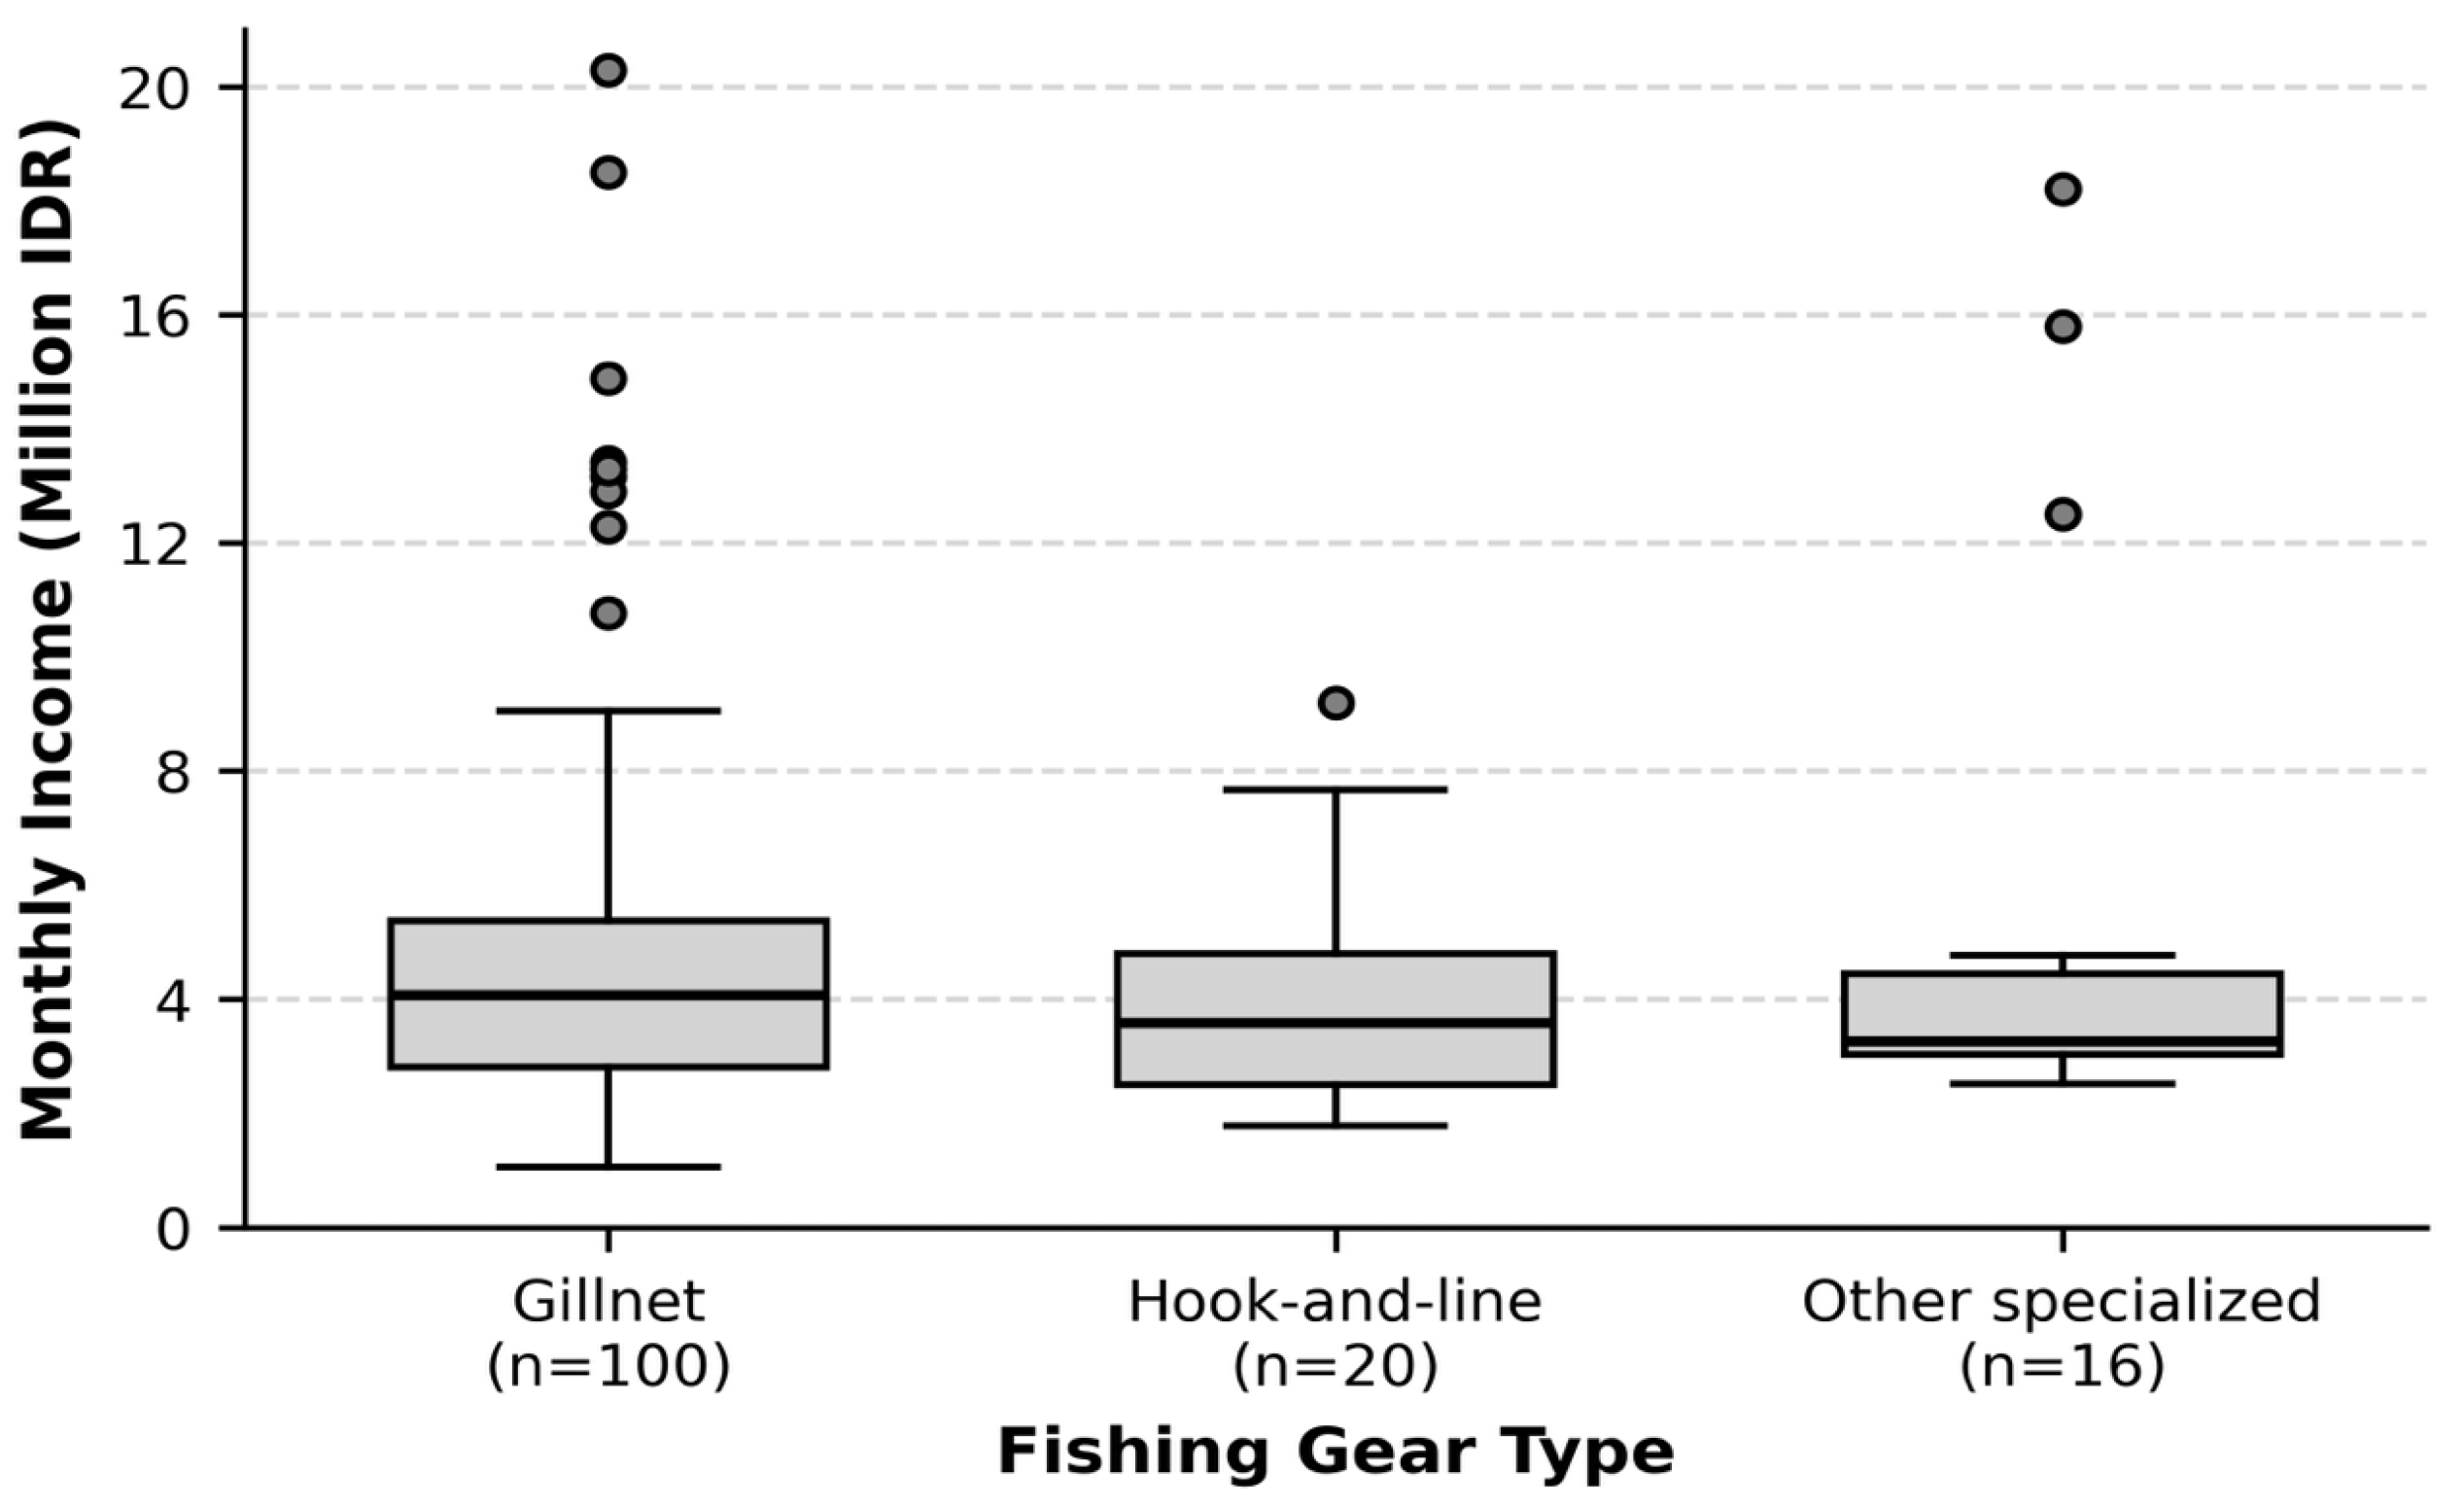
Three types of fishing gear were identified in Pangandaran small-scale fisheries: gillnets, hook-and-line, and other specialized gear. The comparison of monthly income and expenditure patterns among the three main gear types is presented in Figure 2.
Figure 2.
Comparison of monthly income and expenditure patterns among the three major fishing gear types in Pangandaran small-scale fisheries. Box plots show median (center line), interquartile range (box), and range (whiskers).
Gillnet was the dominant fishing gear, employed by 73.5% of fishermen (100 of 136), followed by hook-and-line (14.7%, n = 20) and other specialized gear (11.8%, n = 16). No significant differences in monthly income were detected among gear types (Kruskal–Wallis H = 0.58, p = 0.747), as shown in Table 3. Similarly, boat size, crew number, trips per week, and trip duration distributions did not differ significantly among gear types, indicating relatively homogeneous operational patterns despite gear diversity.
Table 3.
Differences in economic and operational characteristics among fishing gear types.
The operational homogeneity across gear types is notable. Despite targeting potentially different species assemblages, all three gear groups operated vessels of similar size (mean 2.00–2.25 GT), employed comparable crew numbers (2.00–2.47 persons), and maintained similar fishing frequencies (5.69–6.16 trips/week). This uniformity reflects both the constraints of small-scale fishing—where capital limitations restrict vessel size and technology—and the convergent evolution of fishing strategies adapted to Pangandaran’s oceanographic conditions.
3.3. Species Composition and Catch Diversity
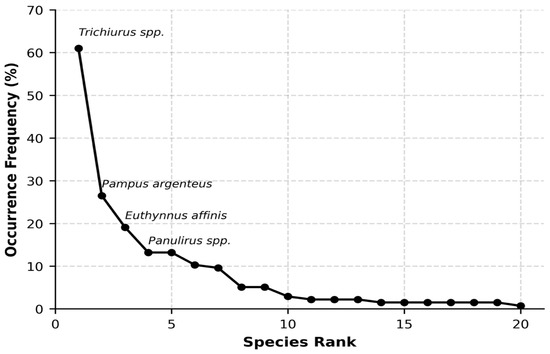
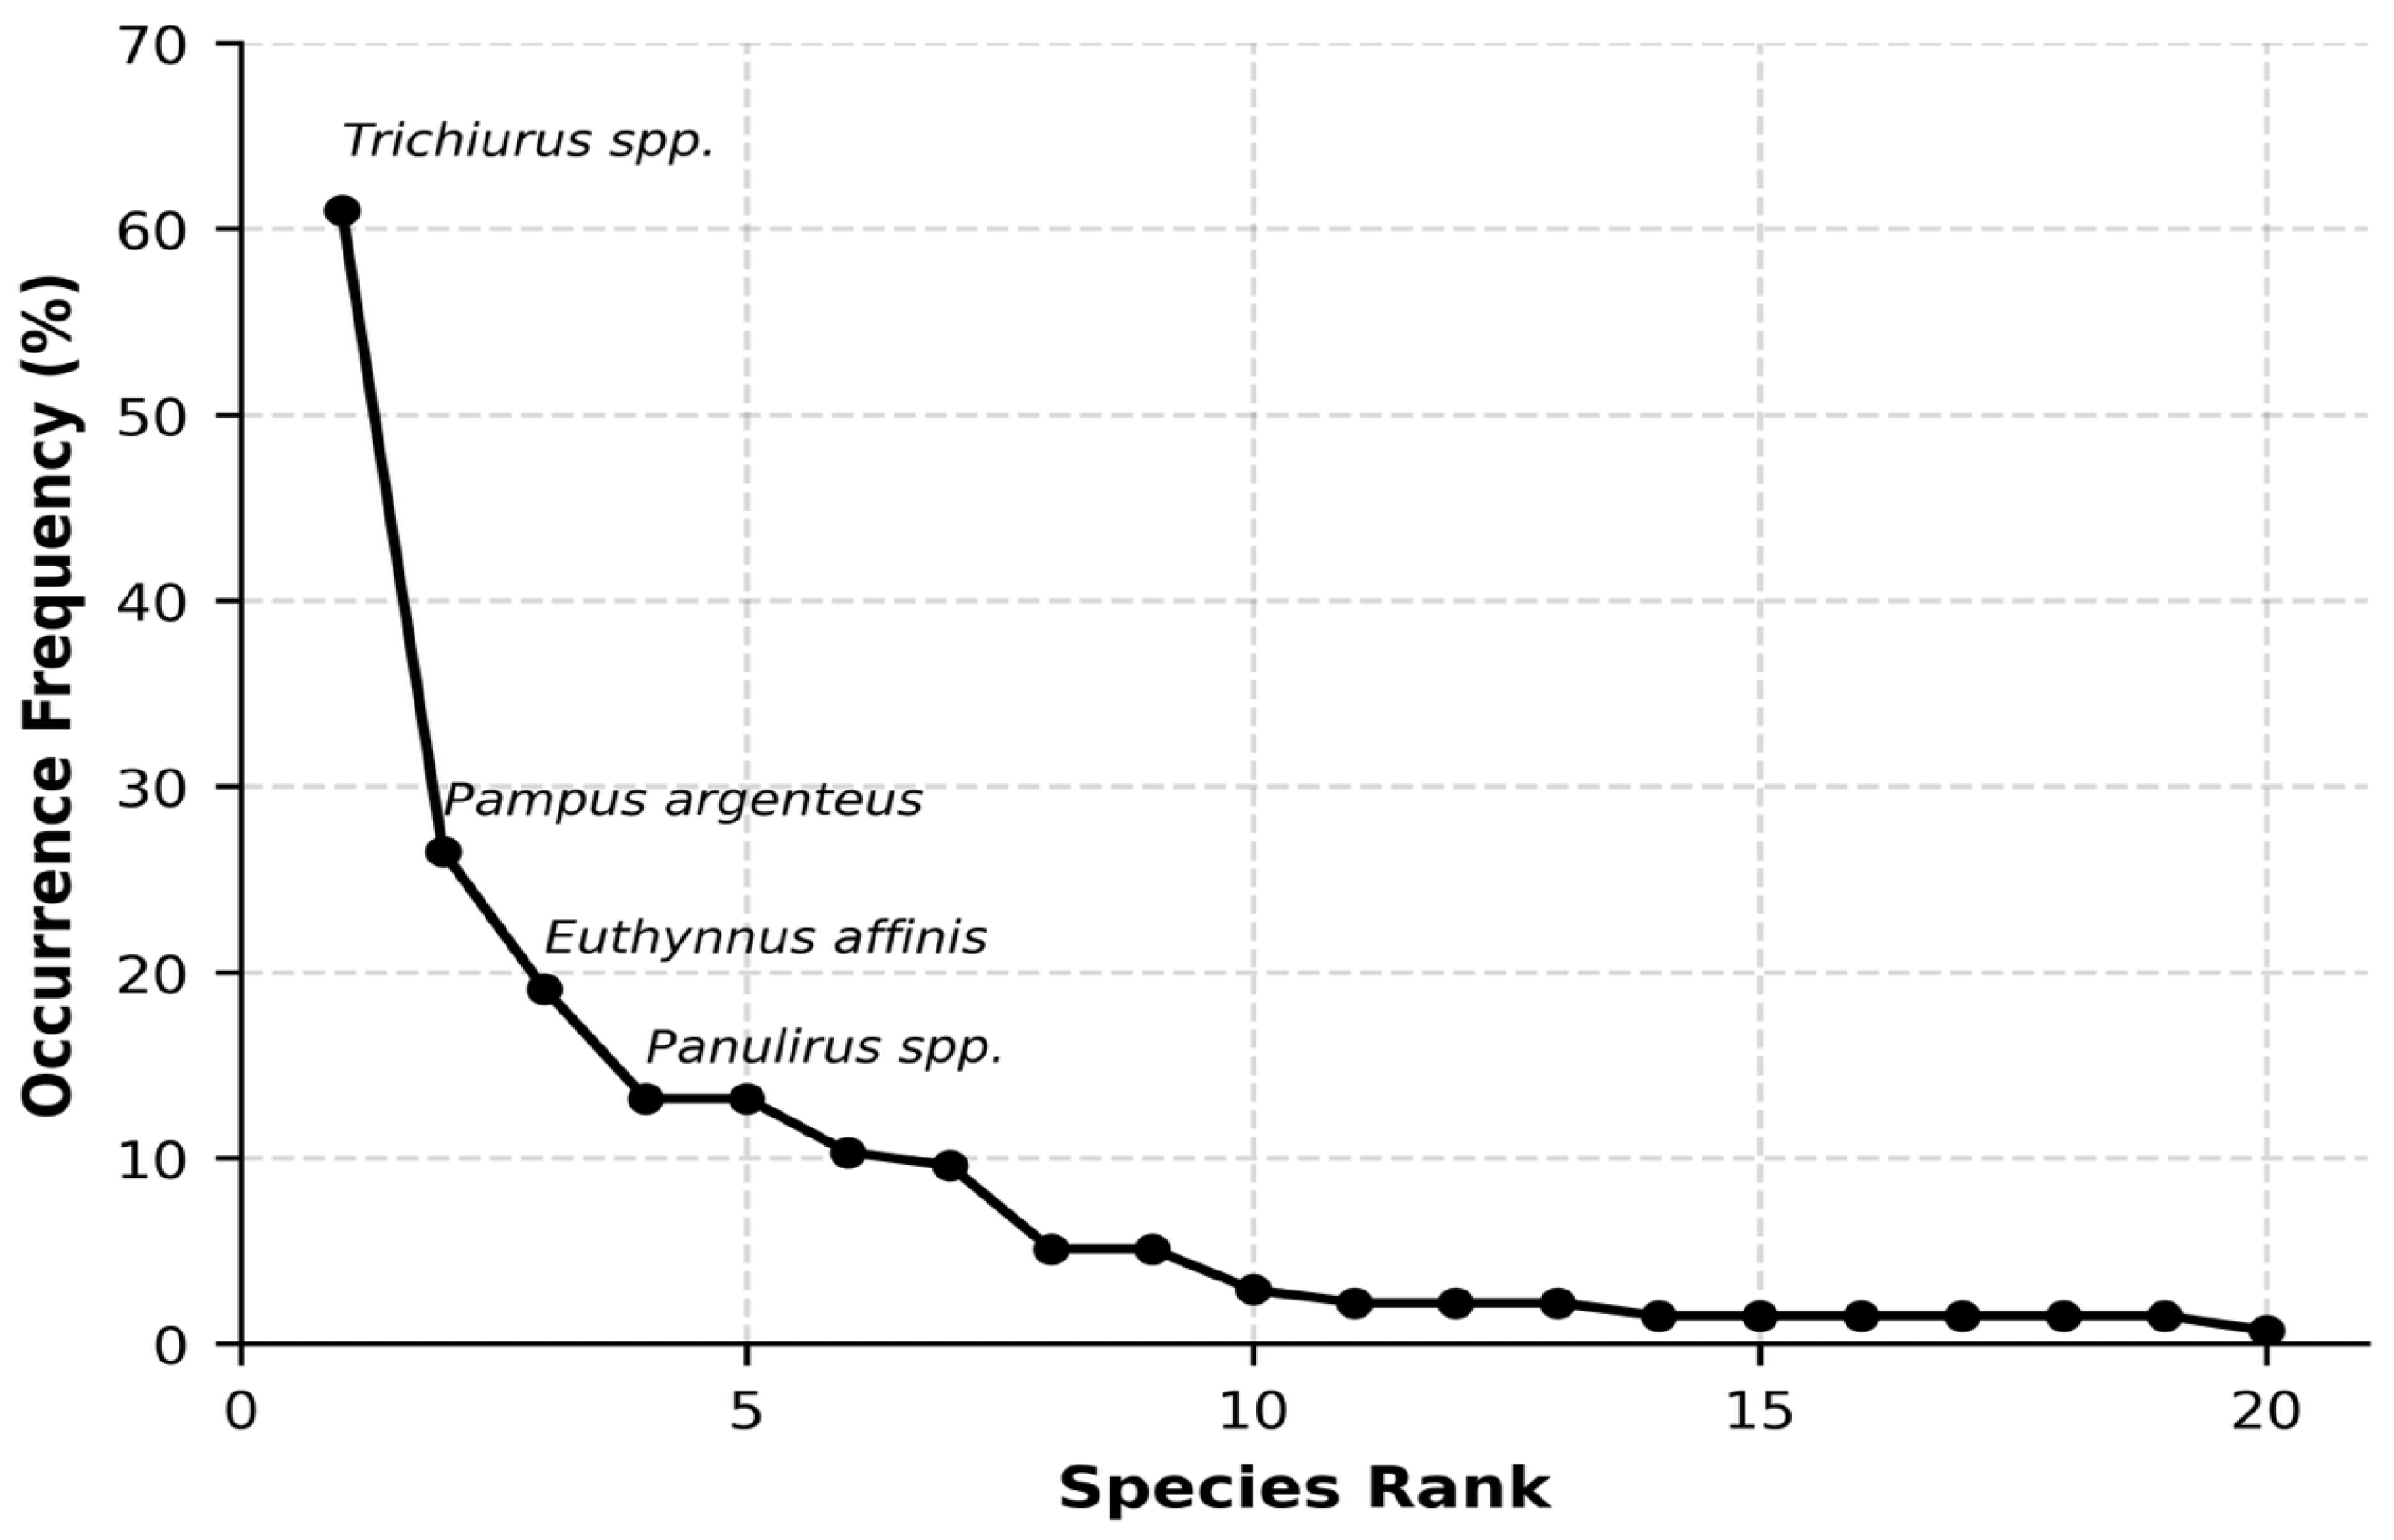
A total of 57 distinct fish species or taxa were identified (Table 4). The most frequently reported species was ribbon fish (Trichiurus spp.), caught by 61.0% of fishermen (83 of 136). Silver pomfret (Pampus argenteus) ranked second (26.5% occurrence), followed by kawakawa (Euthynnus affinis) (19.1%), spiny lobster (Panulirus spp.) (13.2%), and snappers (Lutjanus spp.) (13.2%). The rank-abundance distribution exhibited a steep decline, with the top five species accounting for 52.9% of total occurrences, while 37 species (64.9%) were each reported by fewer than 2% of fishermen. Taxonomic composition included at least 15 families, demonstrating the multi-species nature of the fishery (Figure 3).
Table 4.
Ranked list of dominant fish and invertebrate species in small-scale fisheries catches.
Figure 3.
Rank-abundance curve showing occurrence frequency of the top 20 fish species in small-scale catches from Pangandaran coastal waters.
The steep rank-abundance curve illustrates the “few dominant, many rare” pattern characteristic of tropical multi-species fisheries. While biodiversity is high (57 taxa), fishing effort concentrates on species with favorable combinations of abundance, catchability, and market value. The dominance of Trichiurus spp. reflects both their schooling behavior, making them susceptible to gillnets, and strong market demand domestically and for export.
3.4. Factors Influencing Fishing Income
Spearman rank correlation analysis revealed a generally weak correlation between measured variables and monthly income (Table 5). Only crew number showed a statistically significant positive correlation with income (ρ = 0.20, p = 0.036), although the strength of the relationship was weak. The squared correlation coefficient (p2 = 0.04) indicates that crew number shares only about 4% of the variance in income, highlighting its limited explanatory relevance. Age, education level, boat size, and trips per week exhibited no significant associations with income. Furthermore, education level showed a moderate negative correlation with age (ρ = −0.31, p = 0.001).
Table 5.
Spearman correlation matrix among key study variables (n = 105).
Multiple linear regression modeling of log-transformed monthly income confirmed the weak relationships observed in the correlation analysis (Table 6). The overall model was not statistically significant (F5.99 = 0.78, p = 0.565) and exhibited extremely low explanatory power (R2 = 0.038, adjusted R2 = −0.011). Under these conditions, the estimated coefficients should be interpreted with caution. Among predictors, only crew number approached significance (β = 0.076, p = 0.039). This result should not be considered robust given the lack of overall model significance. These findings suggest that unmeasured factors likely play a more dominant role in determining income.
Table 6.
Estimated coefficients of the multiple linear regression model explaining monthly income (n = 105).
3.5. Seasonal Fishing Patterns
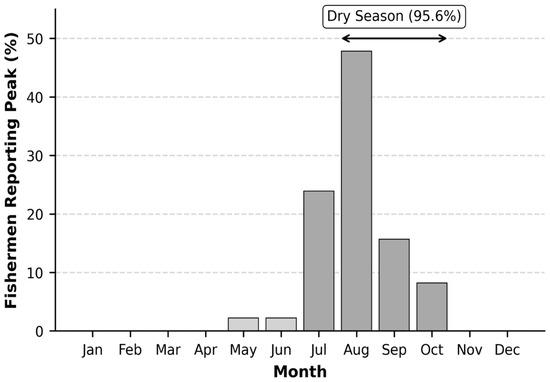
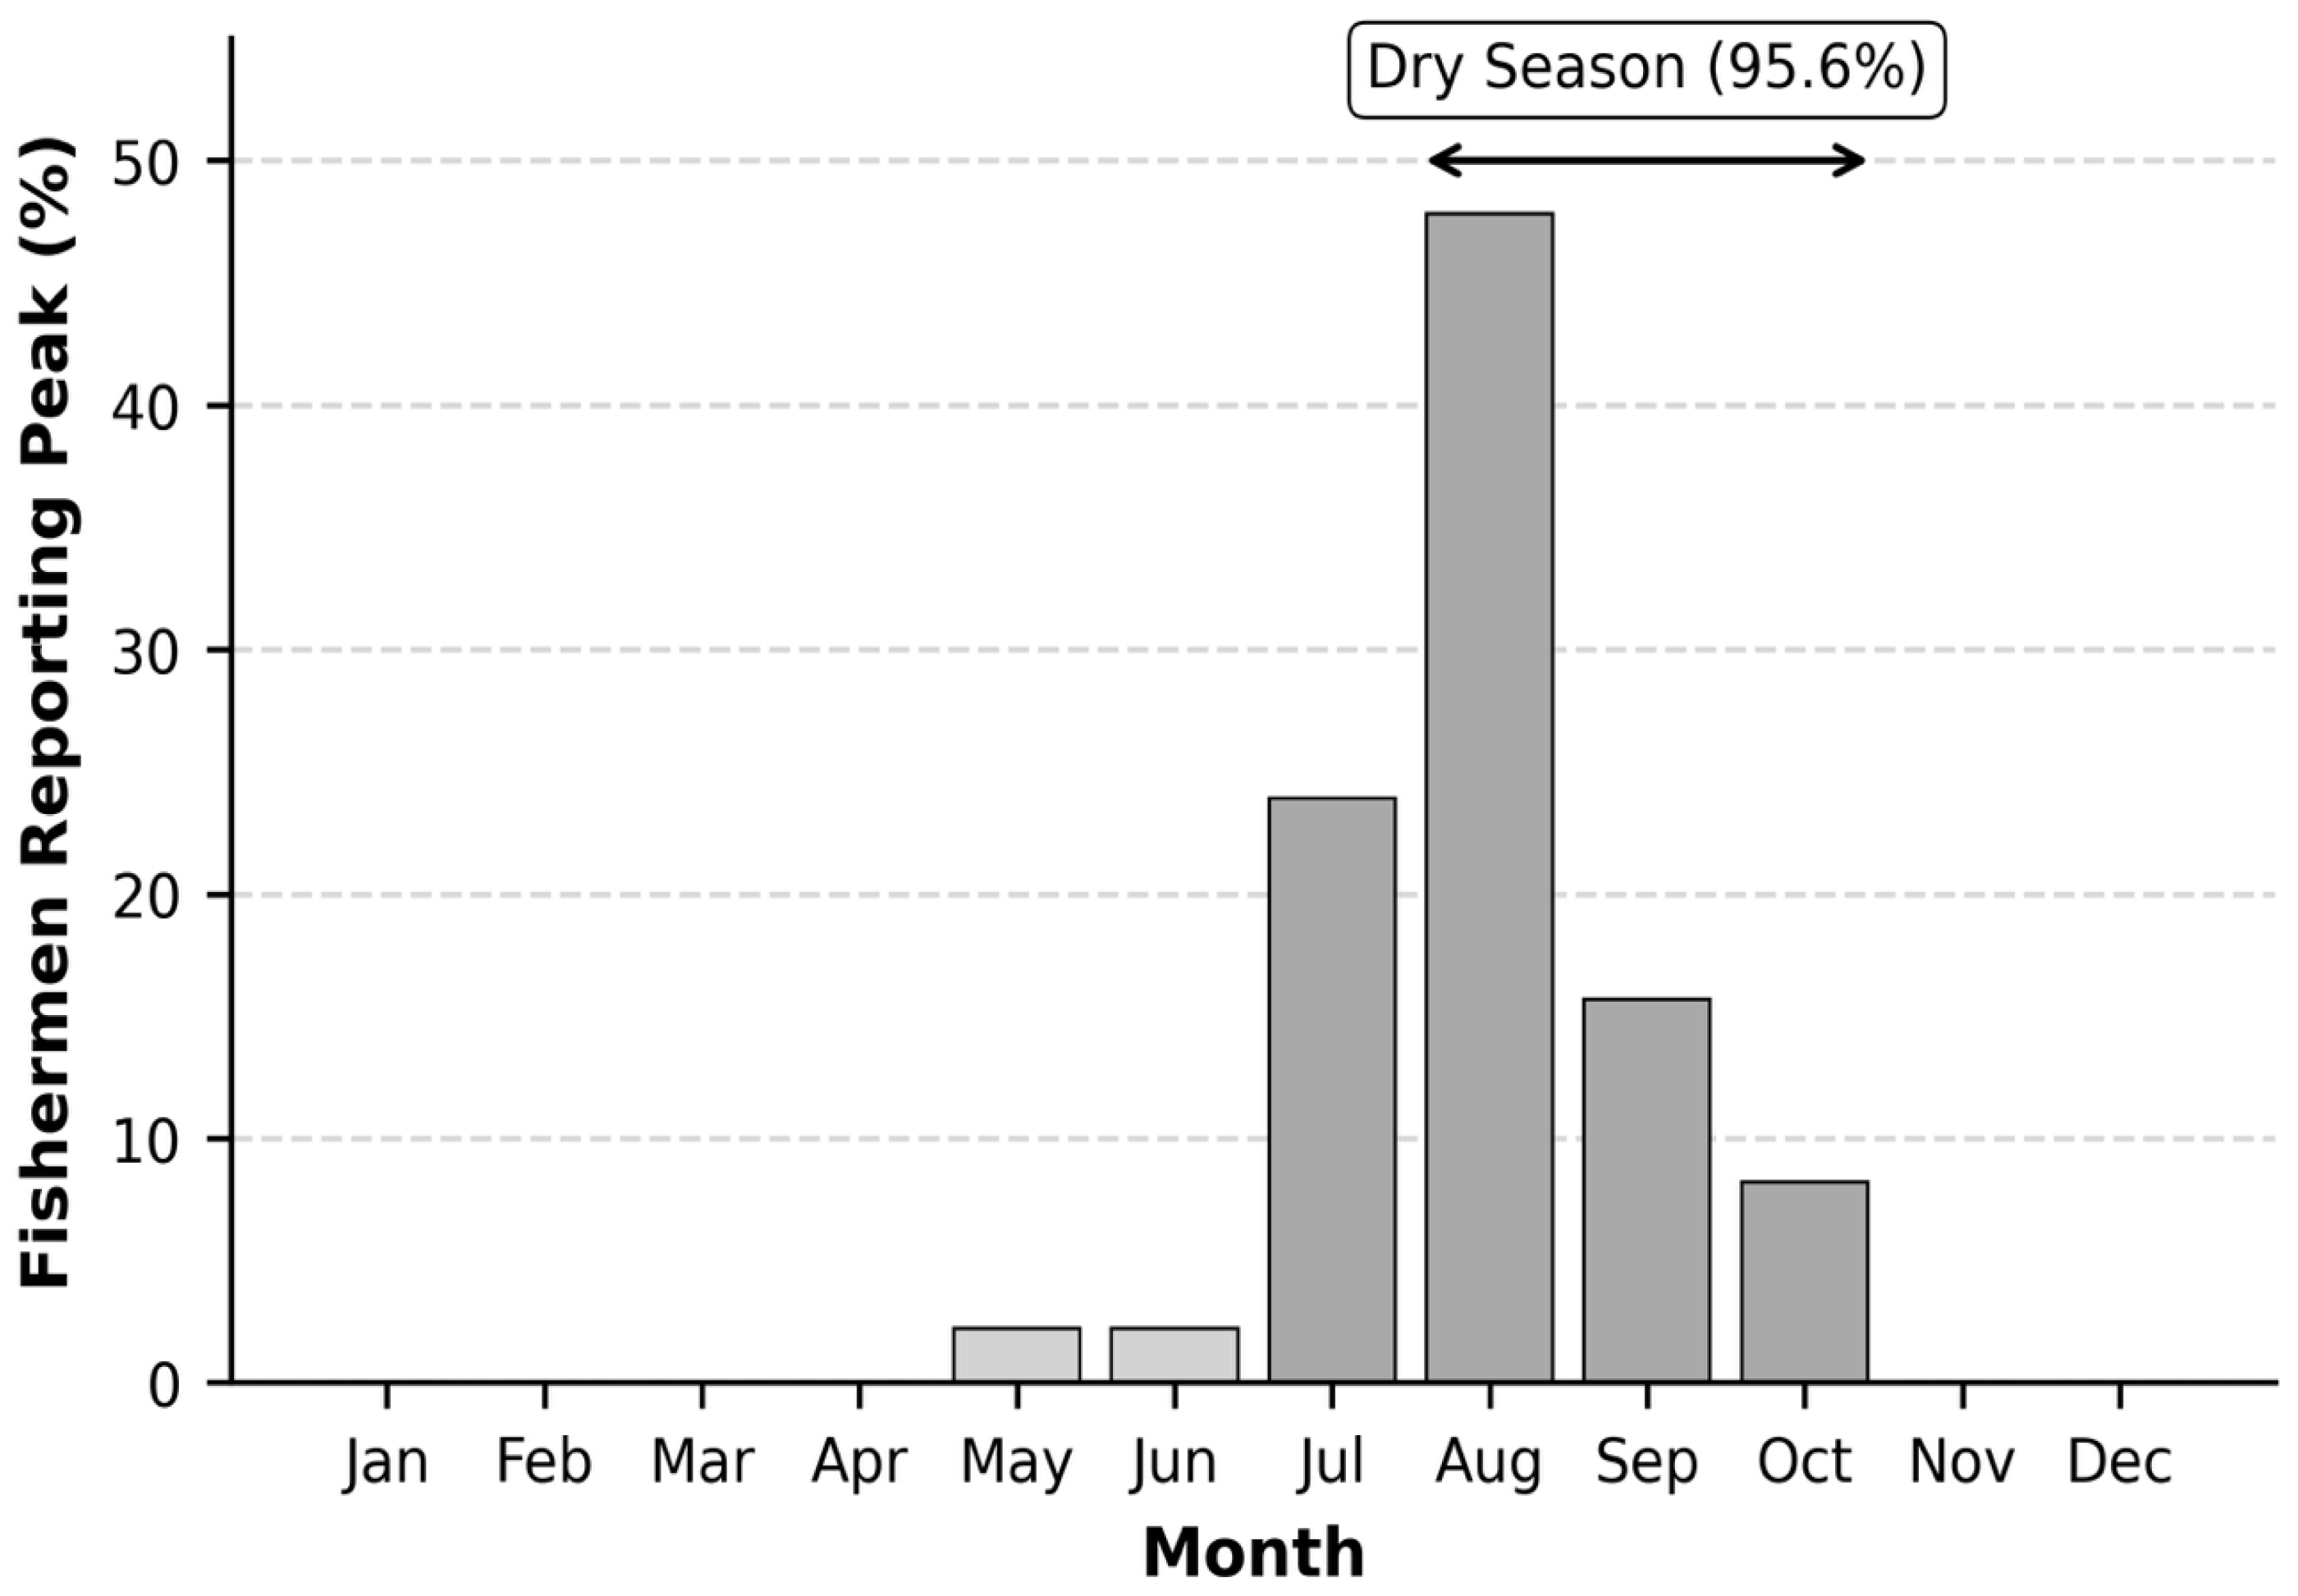
Temporal patterns exhibited pronounced seasonality aligned with monsoon cycles. 130 of 136 responses (95.6%) reported a strong concentration of peak fishing productivity during the Australian monsoon (July-October), particularly in August (n = 65, 47.8%), July (n = 33, 23.9%), September (n = 21, 15.7%), and October (n = 11, 8.2%). In contrast, only 6 fishermen (4.4%) identified rainy-season months (November–April) as most productive, with none selecting January–April (Figure 4).
Figure 4.
Seasonal patterns of fishing productivity showing the percentage of fishermen reporting each month as most productive (n = 136).
Gillnet fishers exhibited the most pronounced seasonal concentration (89.0% reporting July–October peak). Hook-and-line fishers showed similar patterns (85.0% July–October), while specialized gear users displayed more variable patterns (68.8% July–October), possibly reflecting targeting of species with less synchronized life histories. The extreme seasonal concentration demonstrates the dominant influence of monsoon-driven oceanographic patterns on small-scale fishing operations in Pangandaran. Seasonal fishing patterns in the region are likely influenced by oceanographic conditions such as sea surface temperature and chlorophyll-a variability associated with monsoon dynamics, which were not explicitly analyzed in this study.
4. Discussion
Income variability among small-scale fishermen in Pangandaran is substantial yet difficult to explain using conventional demographic and operational variables. The demographic profile, dominated by mature age (46.9 years), extensive experience (25.8 years) (Table 1), and low formal education, which is a common pattern across Southeast Asian small-scale fisheries [24,25], indicates that fishing is a long-term, multi-generational vocation. This occupational entrenchment has important implications for adaptive capacity and livelihood diversification, as older fishers with limited education face significant barriers to transitioning into alternative income sources [26].
Despite this relatively homogeneous demographic and operational profile, economic outcomes show considerable variation. The mean monthly income of IDR 5.80 million (USD 387, 95% CI: 4.47–7.13 million) and income-to-expenditure ratio of 1.89 (95% CI: 1.65–2.13) suggest generally positive but variable economic outcomes (Table 1). However, the wide income range and 12% of households reporting deficits highlight substantial economic heterogeneity and vulnerability, characteristic of small-scale fisheries where stochastic environmental factors, differential fishing skill, market access, and social capital create highly variable outcomes [27]. Although the total income exceeds the regional minimum wage of Pangandaran (IDR 2.3 million), fishermen often face economic difficulties due to catch uncertainty, underscoring the need for increased capital assistance or market access [28,29]. This mismatch between relatively homogeneous characteristics and highly variable income underscores the central challenge of explaining income differences using conventional variables.
Conventional explanatory variables fail to account for these income differences. The significant inter-community income variation (p = 0.019, η2 = 0.087) (Table 2), despite non-significant differences in boat size and most operational variables, suggests that income disparities arise from factors beyond simple capital investment or effort quantity. Madasari’s four-fold higher income compared to Cibenda may reflect differential access to productive fishing grounds, variation in local fish abundance, differences in market infrastructure and buyer networks, or community-level differences in collective action and resource governance [10]. The observation that Cibenda fishermen conducted significantly more trips per week despite achieving lower incomes suggests potential compensation for reduced per-trip productivity through increased effort, a common but ultimately unsustainable strategy in overexploited fisheries.
Fishing strategies and gear use provide partial insight into these dynamics but do not fully explain income variation. The dominance of gillnets (73.5%) reflects both ecological and socio-economic factors. Gillnets effectively capture the abundant pelagic species dominating Pangandaran catches (ribbon fish, pomfrets, scombrids), while requiring modest capital investment and technical skill compared to more intensive gears (Table 3). The absence of significant income differences among gear types (p = 0.747) could reflect either genuine similarity in economic returns or insufficient statistical power to detect differences given unequal group sizes [14]. Future research with larger samples of non-gillnet gears would provide more definitive comparisons.
Ecological complexity further contributes to the unpredictability of income. The documentation of 57 fish species (Table 4), with steep rank-abundance distribution (Figure 3), reflects tropical Indo-Pacific fisheries’ high biodiversity but selective exploitation [30,31]. The dominance of ribbon fish (Trichiurus spp.) at 61.0% occurrence aligns with regional catch statistics showing Trichiuridae as one of Indonesia’s most important commercial families. The multi-species nature provides livelihood flexibility, buffering fishermen against single-species collapses. However, it complicates stock assessment and management, as species-specific exploitation rates are difficult to determine when catches are aggregated, and sequential depletion can occur without clear signals in aggregated catch data.
These findings are reinforced by the regression results, which demonstrate extremely low explanatory power. Both the weak correlations (Table 5) and the non-significant regression model (Table 6) indicate that conventional demographic and operational variables explain only a negligible proportion of income variation (R2 = 0.038). The weak relationships suggest that income is driven more by unmeasured factors than by conventional operational and demographic variables, including: (1) fishing skill encompassing knowledge of fish behavior, ability to locate productive grounds, and gear deployment technique; (2) social capital including relationships with buyers and participation in information-sharing networks; (3) catch composition, specifically the proportion of high-value versus low-value species; and (4) stochastic variation due to fish schooling behavior and oceanographic variability. Furthermore, although crew number shows a statistically significant association with income in both the correlation analysis (Table 5) and regression model (Table 6), its effect size is small (β = 0.076) and the overall model lacks statistical significance. Under these conditions, this relationship should be interpreted with caution, as it may reflect incidental correlation rather than a robust or practically meaningful predictor. Therefore, crew number is unlikely to be a primary driver of income variability in this context.
Seasonal environmental forcing provides an additional layer of explanation for income variability. The pronounced concentration of peak fishing productivity during July–October (95.6% of fishermen) demonstrates the dominant influence of monsoon-driven oceanographic conditions. This seasonality has important economic and food security implications, as income concentration during the dry season necessitates effective household financial management. From an ecological perspective, the seasonal reduction in fishing pressure during the rainy season may provide de facto temporal refugia, allowing recovery from dry-season exploitation.
These interconnected factors highlight the need for more adaptive and context-specific management approaches. The findings have several direct implications for fisheries management: community-specific interventions addressing localized income disparities rather than uniform regulations; livelihood diversification programs promoting rainy-season income alternatives such as aquaculture, tourism services, or coastal restoration; participatory monitoring engaging fishermen in systematic catch recording and taxonomic verification; market infrastructure improvements targeting price transparency and value addition; and adaptive co-management frameworks incorporating local ecological knowledge and enabling flexible regulations.
These findings suggest that income variability is primarily driven by unmeasured and context-specific factors rather than conventional demographic or operational variables. In small-scale fisheries, fishing skill plays a critical role, encompassing the ability to locate productive fishing grounds, interpret environmental cues, and optimize gear deployment, which has been widely recognized as a key determinant of fishing success. In addition, access to productive fishing areas is often spatially unequal, influenced by local ecological conditions and informal territorial arrangements, which can lead to substantial differences in catch rates among communities (Table 2).
Finally, several limitations constrain the interpretation of these results. The cross-sectional design precludes analysis of temporal trends, which are important drivers of income variability. or causality. Income and expenditure data are self-reported and subject to recall bias. Catch composition data are based on fisher reports rather than landings monitoring, preventing quantitative catch analysis. Sample size limitations prevented robust subgroup analyses for some communities and gear types. Some variables contained missing or incomplete data, which reduced the effective sample size for specific analyses and may introduce bias. Furthermore, catch composition data are based on fisher reports rather than systematic landings monitoring, preventing quantitative assessment of catch volume and species composition. Species identification based on local names without voucher specimens may also introduce taxonomic uncertainty. The extremely low explanatory power of the regression model (R2 = 0.038) indicates that key determinants of income were not captured, severely limiting causal inference. These limitations highlight the need for future studies incorporating longitudinal designs, standardized catch monitoring, and integrated environmental data to better understand income variability in small-scale fisheries.
5. Conclusions
This study provides an integrated socio-economic baseline for multi-gear small-scale fisheries in Pangandaran coastal waters. Key findings include: (1) significant inter-community economic disparities (four-fold income difference, η2 = 0.087) despite similar operational characteristics, indicating the importance of localized factors such as fishing ground access and market linkages; (2) strong seasonal concentration of fishing productivity (95.6% during July–October) highlighting vulnerability to monsoon variability and the need for seasonal coping strategies; (3) high species diversity (57 taxa) combined with concentrated exploitation on few commercially valuable species, suggesting potential for sequential depletion; and (4) the very low explanatory power of conventional operational variables for income (R2 = 0.038, adjusted R2 = −0.011), indicating dominant roles of unmeasured factors including fishing skill and social capital.
These findings underscore the need for management approaches that move beyond uniform regulations toward more context-specific and adaptive strategies. Priority actions include community-specific interventions addressing localized income disparities rather than uniform regulations. Livelihood diversification strategies to enhance resilience against seasonal variability should be prioritized. Participatory monitoring systems engaging fishermen in catch recording would improve data quality while building capacity. Market infrastructure improvements to increase fishers’ bargaining power warrant investigation. While the generally positive income-to-expenditure ratios (mean 1.89, 95% CI: 1.65–2.13) indicate economic viability for most households, leave limited buffering capacity against environmental shocks, particularly for the 12% operating at deficits. This baseline establishes critical reference points and identifies key knowledge gaps requiring future research, including longitudinal monitoring of catches and incomes, detailed biological assessments of target species, value chain analyses, and evaluations of climate change impacts on seasonal productivity patterns.
Author Contributions
Conceptualization, Z.A. and N.P.P.; Methodology, N.K. and N.P.P.; Software, S.A.H.; Validation, A.A.H.; Formal analysis, A.A.H.; Investigation, L.P.D. and H.A.; Resources, N.K., Y.M., H.A. and B.D.C.; Data curation, S.A.H., D.J.P., H.A., B.D.C., R.A. and M.S.A.M.; Writing—original draft, L.P.D., D.J.P. and N.P.P.; Writing—review & editing, Z.A., J.R.N.P. and N.P.P.; Visualization, and Rewrite combine result, J.R.N.P.; Project administration, Y.M.; Funding acquisition, Z.A. and H.A. All authors have read and agreed to the published version of the manuscript.
Funding
This publication charge is funded by Universitas Padjadjaran (Unpad) through the Indonesian Endowment Fund for Education (LPDP) on behalf of the Indonesian Ministry of Higher Education, Science and Technology, and managed under the EQUITY Program (Contract No. 4303/ B3/DT.03.08/2025 and 3927/UN6. RKT/HK.07.00/2025).
Institutional Review Board Statement
Not applicable.
Informed Consent Statement
Not applicable.
Data Availability Statement
The datasets generated and/or analyzed during the current study are available from the corresponding author upon reasonable request.
Acknowledgments
We thank the observer team, fishermen and other participants in Pangandaraan for the fruitful discussion. Thank you also to the VOSviewer 1.6.20 team for the visualization.
Conflicts of Interest
The authors declare no conflicts of interest.
Correction Statement
This article has been republished with a minor correction to the Funding statement. This change does not affect the scientific content of the article.
Abbreviations
| IDR | Indonesian Rupiah |
| GT | Gross Tonnage |
| CI | Confidence Interval |
| SD | Standard Deviation |
| IQR | Interquartile Range |
| VIF | Variance Inflation Factor |
| CPUE | Catch Per Unit Effort |
References
- FAO. The State of World Fisheries and Aquaculture 2022; Towards Blue Transformation; Food and Agriculture Organization of the United Nations: Rome, Italy, 2022. [Google Scholar]
- Fröcklin, S.; de la Torre-Castro, M.; Lindström, L.; Jiddawi, N.S. Fish traders as key actors in fisheries: Gender and adaptive management. Ambio 2013, 42, 951–962. [Google Scholar] [CrossRef] [Scilit] [PubMed]
- Salas, S.; Barragán-Paladines, M.J.; Chuenpagdee, R. Viability and Sustainability of Small-Scale Fisheries in Latin America and the Caribbean; MARE Publication Series; Springer: Cham, Switzerland, 2019; Volume 19. [Google Scholar]
- KKP (Kementerian Kelautan dan Perikanan). Marine and Fisheries in Figures 2021; Ministry of Marine Affairs and Fisheries, Republic of Indonesia: Jakarta, Indonesia, 2021. [Google Scholar]
- Setiawan, H.; Manessa, M.D.M.; Supriatna. Study on spatio-temporal distribution of chlorophyll-a on pelagic catch productivity in Muara Bendera, West Java, Indonesia. J. Ilm. Perikan. Kelaut. 2024, 16, 349–363. [Google Scholar] [CrossRef] [Scilit]
- Cinner, J.E.; Huchery, C.; MacNeil, M.A.; Graham, N.A.J.; McClanahan, T.R.; Maina, J.; Maire, E.; Kittinger, J.N.; Hicks, C.C.; Mora, C.; et al. Bright spots among the world’s coral reefs. Nature 2016, 535, 416–419. [Google Scholar] [CrossRef] [Scilit]
- Mills, D.J.; Westlund, L.; De Graaf, G.; Kura, Y.; Willman, R.; Kelleher, K. Under-reported and undervalued: Small-scale fisheries in the developing world. In Small-Scale Fisheries Management: Frameworks and Approaches for the Developing World; Pomeroy, R.S., Andrew, N.L., Eds.; CABI: Wallingford, UK, 2011; pp. 1–15. [Google Scholar]
- Kronen, M.; Vunisea, A.; Magron, F.; McArdle, B. Socio-economic drivers and indicators for artisanal coastal fisheries in Pacific island countries and territories. Mar. Policy 2010, 34, 1135–1143. [Google Scholar] [CrossRef] [Scilit]
- Béné, C.; Arthur, R.; Norbury, H.; Allison, E.H.; Beveridge, M.; Bush, S.; Campling, L.; Leschen, W.; Little, D.; Squires, D.; et al. Contribution of fisheries and aquaculture to food security and poverty reduction: Assessing the current evidence. World Dev. 2016, 79, 177–196. [Google Scholar] [CrossRef] [Scilit]
- Cohen, P.J.; Lawless, S.; Dyer, M.; Morgan, M.; Saeni, E.; Teioli, H.; Kantor, P. Understanding adaptive capacity and capacity to innovate in social-ecological systems: Applying a gender lens. Ambio 2016, 45, S309–S321. [Google Scholar] [CrossRef] [Scilit]
- Kittinger, J.N.; Finkbeiner, E.M.; Glazier, E.W.; Crowder, L.B. Human dimensions of coral reef social-ecological systems. Ecol. Soc. 2012, 17, 17. [Google Scholar] [CrossRef] [Scilit]
- Panggabean, J.R.N.; Putra, H.F.; Habibie, I.M. Community-based ecosystem governance model for Indonesia’s marine food security. J. Ilm. Multidisipliner 2025, 3, 574–586. [Google Scholar]
- Nurhijayat, A.; Adrianto, L.; Zairion, Z.; Salim, M.G.; Zulfikar, A. Exploring uncertainty of small-scale blue swimming crab fishery toward local blue economy. IOP Conf. Ser. Earth Environ. Sci. 2024, 1400, 012004. [Google Scholar] [CrossRef] [Scilit]
- Krismatama, S.; Riyantini, I.; Gumilar, I.; Dewanti, L.P. Selectivity of fishing gear for Scomberomorus guttatus commodities in Pangandaran fishing ground, West Java. Asian J. Fish. Aquat. Res. 2020, 5, 1–10. [Google Scholar]
- Parawangsa, I.N.Y.; Tampubolon, P.A. Some biological aspects of Indian mackerel (Rastelliger kanagurta) in Bali Strait waters. Omni-Akuatika 2023, 19, 137–146. [Google Scholar] [CrossRef] [Scilit]
- Panggabean, J.R.N.; Syamsudin, F.; Suaydhi, S.; Purba, N.; Feng, X. Interannual Climate Variability Impacts on Rainfall Extremes and Flooding. J. Presipitasi Media Komun. Dan Pengemb. Tek. Lingkung. 2026, 23, 244–257. [Google Scholar]
- Song, A.M.; Chuenpagdee, R.; Jentoft, S. Values, images, and principles: What they represent and how they may improve fisheries governance. Mar. Policy 2013, 40, 167–175. [Google Scholar] [CrossRef] [Scilit]
- Aldrian, E.; Dwi Susanto, R. Identification of three dominant rainfall regions within Indonesia and their relationship to sea surface temperature. Int. J. Climatol. 2018, 38, 1654–1670. [Google Scholar] [CrossRef] [Scilit]
- Purba, N.P.; Faizal, I.; Abimanyu, A.; Zenyda, K.S.; Jaelani, A.; Indriawan, D.; Priadhi, M.M.; Martasuganda, M.K. Vulnerability of Java Sea marine protected areas affected by marine debris. IOP Conf. Ser. Earth Environ. Sci. 2020, 584, 012029. [Google Scholar] [CrossRef] [Scilit]
- R Core Team. R: A Language and Environment for Statistical Computing; R Foundation for Statistical Computing: Vienna, Austria, 2023. [Google Scholar]
- Kruskal, W.H.; Wallis, W.A. Use of ranks in one-criterion variance analysis. J. Am. Stat. Assoc. 1952, 47, 583–621. [Google Scholar] [CrossRef]
- Dunn, O.J. Multiple comparisons using rank sums. Technometrics 1964, 6, 241–252. [Google Scholar] [CrossRef]
- Spearman, C. The proof and measurement of association between two things. Am. J. Psychol. 1904, 15, 72–101. [Google Scholar] [CrossRef] [Scilit]
- Brewer, T.D.; Cinner, J.E.; Green, A.; Pressey, R.L. Effects of human population density and proximity to markets on coral reef fishes vulnerable to extinction by fishing. Conserv. Biol. 2013, 27, 443–452. [Google Scholar] [CrossRef] [Scilit]
- Gelcich, S.; Reyes-Mendy, F.; Rios, M.A. Early assessments of marine governance transformations: Insights and recommendations for implementing new fisheries management regimes. Ecol. Soc. 2019, 24, 12. [Google Scholar] [CrossRef] [Scilit]
- Pollnac, R.B.; Seara, T.; Colburn, L.L. Aspects of fishery management, job satisfaction, and well-being among commercial fishermen in the Northeast region of the United States. Soc. Nat. Resour. 2015, 28, 75–92. [Google Scholar] [CrossRef] [Scilit]
- Hicks, C.C.; Cohen, P.J.; Graham, N.A.J.; Nash, K.L.; Allison, E.H.; D’Lima, C.; Mills, D.J.; Roscher, M.; Thilsted, S.H.; Thorne-Lyman, A.L.; et al. Harnessing global fisheries to tackle micronutrient deficiencies. Nature 2019, 574, 95–98. [Google Scholar] [CrossRef] [Scilit]
- Enema, M.F.A.; Quezon, M.S. Fisherfolk at the crossroads: A socio-economic analysis of small-scale coastal communities. J. Interdiscip. Perspect. 2024, 2, 6–15. [Google Scholar] [CrossRef] [Scilit]
- Lorenzo, I.G.; Lafuente, M.V.; Garza-Gil, M.D.; Sumaila, U.R. Social and solidarity economy in small-scale fisheries: An international analysis. Ocean Coast. Manag. 2024, 253, 107166. [Google Scholar] [CrossRef] [Scilit]
- Humphries, A.T.; Dimarchopoulou, D.; Stergiou, K.I.; Tsikliras, A.C.; Palomares, M.L.; Bailly, N.; Nauen, C.E.; Luna, S.; Banasihan, L.P.; Froese, R.; et al. Measuring the scientific impact of FishBase after three decades. Cybium 2023, 47, 213–224. [Google Scholar]
- Purwanto; Sugianto, D.N.; Zainuri, M.; Permatasari, G.; Atmodjo, W.; Rochaddi, B.; Ismanto, A.; Wetchayont, P.; Wirasatriya, A. Seasonal variability of waves within the Indonesian seas and its relation with the monsoon wind. Ilmu Kelaut. Indones. J. Mar. Sci. 2021, 26, 189–196. [Google Scholar] [CrossRef] [Scilit]

Disclaimer/Publisher’s Note: The statements, opinions and data contained in all publications are solely those of the individual author(s) and contributor(s) and not of MDPI and/or the editor(s). MDPI and/or the editor(s) disclaim responsibility for any injury to people or property resulting from any ideas, methods, instructions or products referred to in the content. |
© 2026 by the authors. Licensee MDPI, Basel, Switzerland. This article is an open access article distributed under the terms and conditions of the Creative Commons Attribution (CC BY) license.