


Abstract
This study compares two policy instruments for decarbonizing China’s seafood exports to the EU and UK over 10 years using a recursive dynamic computable general equilibrium model. One instrument applies tariff-like carbon surcharges on embedded emissions at the border. The other recognises certified low-carbon production through tiered rate reductions or exemptions. The model constructs product-level carbon cost wedges for processing electricity, aluminium packaging, and cold-chain operations, then transmits them to border prices through pass-through and to import volumes through Armington demand. These mechanisms operate inside a dynamic setting with capital accumulation, learning, and technology adoption. We evaluate processed tuna, shrimp, whitefish, and fresh tilapia to reflect differences in energy use, packaging intensity, and cold-chain reliance. Results show that certification, especially when paired with targeted domestic green finance or tax offsets, speeds adoption of cleaner power and refrigerants and preserves market share better than uniform surcharges. Effects differ between coastal and inland production hubs, supporting location-specific policy bundles. Sensitivity analysis varies carbon prices, adoption speeds, and certification coverage within stated parameter ranges. We report trade, export revenue, emissions, investment, and welfare outcomes and identify product and channel drivers of exposure.
Keywords:
dynamic CGE; GTAP; carbon border adjustment; low-carbon certification; seafood trade; technology adoption; climate policy Key Contribution:
This paper embeds a channel-specific carbon wedge model for seafood supply chains into a recursive dynamic GTAP framework, linking emission drivers to border prices, trade, and welfare in a transparent way. It shows that tiered low-carbon certification, especially with domestic incentives, can speed technology adoption and retain the EU and UK market share better than uniform carbon surcharges.
1. Introduction
Carbon border measures price embedded emissions at the point of import to limit leakage and align trade with climate policy. The EU Carbon Border Adjustment Mechanism (CBAM) operationalizes this approach under WTO compatibility and design constraints that shape the treatment of indirect emissions and competitiveness safeguards [1,2,3,4,5]. Multi-country trade modelling shows that impacts depend on sectoral carbon intensity and trade elasticities, and that border measures interact with emissions embodied in trade flows [6,7,8]. For food trade in particular, indirect carbon costs can materially shift border prices and competitiveness [9].
This study quantifies the ad valorem “carbon wedge” faced by China’s seafood exports under the EU/UK border carbon measures and compares two tools—(i) low-carbon certification that reduces embedded emissions and (ii) a tariff-like carbon surcharge applied at the border—within a recursive dynamic GTAP framework. We report both short-run (static) revenue effects and medium-run (dynamic) adjustments under a consistent trade structure and transparent parameter ranges.
The transmission of border carbon measures to trade outcomes in our framework is governed by two parameters: (i) pass-through, which determines what share of the upstream carbon cost wedge enters the border price, and (ii) import-demand responsiveness, represented by Armington elasticities that map price changes into quantity changes. Empirical work shows that pass-through varies with market structure, contracts, and currency pricing, so upstream cost shocks do not translate one-for-one into CIF prices [10,11]. Adjustment speed can also differ across commodities and contract settings, thereby affecting how quickly shocks are reflected in the observed trade values [12]. Armington elasticities vary by product form and processing intensity and are typically calibrated and stress-tested using standard GTAP guidance and elasticity surveys [13,14]. Comprehensive trade elasticity surveys provide further information [15].
For seafood, three channels dominate embedded emissions and therefore exposure to border carbon pricing. First, processing electricity is tied to grid carbon intensity, so product footprints evolve as grids decarbonize over time [16]. Second, packaging emissions depend on material choice and recycled content shares, with carbon intensity shaped by whether aluminium is primary or secondary and by the electricity mix used in production and recycling [17,18]. Third, cold chains require continuous energy for freezing/refrigeration and depend on refrigerant management; sector reviews summarise typical energy use, leakage risks, and mitigation options [19,20,21]. These channels align with firm-level levers that can be recorded in a conformity assessment (e.g., renewable power procurement, verified recycled content, and cold-chain efficiency/leakage control). FAO fisheries and aquaculture statistics, including FishStatJ, support the export context and product mapping by form and category [5]. UN Comtrade partner-reported trade values and quantities anchor baseline CIF unit values and export revenues [22].
This paper contrasts two tools—tariff-like carbon surcharges at the EU/UK border and the recognition of certified low-carbon production through lower applicable rates or exemptions—over a ten-year horizon. Building on a transparent pass-through mapping, we embed product-specific “carbon wedges” into a recursive dynamic GTAP model with learning and capital accumulation so that technology adoption changes wedges over time. We analyse four representative export product forms: processed tuna (Thunnus spp., including Katsuwonus pelamis), processed shrimp (primarily penaeid shrimp, e.g., Litopenaeus vannamei), processed whitefish (whitefish category including cod Gadus spp. and Alaska pollock Gadus chalcogrammus), and fresh tilapia (Oreochromis spp., mainly O. niloticus). These scientific names are used to anchor the product taxonomy to FAO categories; the calibration remains at the product-form level (processed vs. fresh; packaging and cold-chain requirements) rather than a single-species life-cycle model [23,24].
We address three questions. To begin with, what tool stimulates the greener power usage more swiftly, as well as refrigeration and feed technologies, and preserves market share in the EU/UK? Second, what are the differences in adoption patterns and performances between the coastal and the inland farming areas? Third, how can certification and domestic green finance/tax offsets be adjusted to achieve maximum emission reduction relative to preservation per unit of export share?
Methodologically, we implement a recursive dynamic GTAP model with learning and capital accumulation and embed a transparent wedge → price → quantity mapping for seafood products under alternative border policy designs. Channel-specific wedges link to border prices through pass-through and to import quantities through Armington demand, with parameter values and ranges reported explicitly in Section 3 and Section 4.
This research also draws on cross-sector evidence that informs CBAM-relevant transmission mechanisms. Manufacturing-focused analyses document leakage and competitiveness channels under border measures [25]. Simulation studies in agrifood trade highlight indirect carbon costs and cross-commodity spillovers that can amplify price transmission [26]. Policy commentaries emphasise practical design and administrative constraints at the border, while experience from the EU ETS informs CBAM design choices and enforcement considerations [27,28].
Our dynamic framework focuses on the EU/UK border price transmission and import demand. It does not model downstream retail margins, exchange-rate dynamics, or explicit diversion of exports to third markets. Section 2 reviews CBAM design, pass-through, trade elasticities, and seafood supply-chain emission drivers. Section 3 documents data sources, units, product mappings, and baseline parameter values and ranges. Section 4 sets out the wedge equations and the recursive dynamic GTAP implementation. Section 5 reports results and discussion. Section 6 concludes this study. Accordingly, the EU/UK revenue losses should be interpreted as upper-bound estimates under limited diversion.
2. Literature Review
This section positions this study within five strands that inform parameterization and model design: CBAM design and legality, pricing-to-market and pass-through, seafood supply-chain emission drivers, fisheries/trade statistics for calibration, and modelling strategies for policy evaluation. Evidence is more limited for seafood than for energy-intensive manufacturing in several parameter blocks (especially cold-chain practices, packaging intensities, and product-form elasticities). Accordingly, this study uses the closest documented analogues where seafood-specific estimates are unavailable, states transfer assumptions transparently, and tests key ranges in sensitivity analysis. The review motivates the focus on electricity, aluminium packaging, and cold-chain operations, as well as the pass-through and Armington elasticity ranges used throughout the simulations. It also clarifies why a recursive dynamic CGE setting is suitable for tracking investment, capital accumulation, and welfare effects alongside trade outcomes while keeping wedge transmission mechanisms explicit at the product level.
2.1. Policy Design, Legality, and Scope
Carbon border adjustment tools put a price on imported embedded carbon to limit leakage and align the stringency of domestic policy with trade exposure. The EU CBAM specifies covered goods and establishes reporting and verification regimes that define firm liabilities and documentation requirements [23,29]. Legal scholarship discusses how CBAM design can be made consistent with core WTO principles (e.g., national treatment and non-discrimination) while noting constraints on export rebates and contested treatment of indirect emissions [1,4,30]. Multi-country modelling evaluates alternative CBAM designs and projects competitiveness and leakage effects across energy-intensive industries, highlighting the role of sectoral carbon intensity and trade elasticities [30,31]. Broader trade evidence documents rising emissions embodied in trade, supporting border pricing as a complement to domestic mitigation [32,33]. Practical implementation issues and lessons from the EU ETS are also emphasised in the policy literature [27,28].
2.2. Price Pass-Through and Demand Elasticities
Pass-through governs how carbon cost wedges translate into border prices. Evidence on pricing-to-market and local-currency pricing shows that pass-through is often incomplete and contingent on market structure and contracting in traded goods [34]. For traded foods and seafood product forms, Armington elasticities provide a practical link between relative price changes and import demand responses, with surveyed values differing by processing intensity and product differentiation [14,35]. Related evidence from the EU ETS-exposed industries also shows heterogeneous downstream transmission depending on supply-chain position and market structure [36]. Together, these findings motivate product-specific pass-through assumptions and an Armington import-demand structure, with elasticity ranges selected for sensitivity analysis rather than treated as fixed constants.
2.3. Upstream Intensity Factors for Seafood Supply Chains
For seafood, exposure to border carbon pricing is driven mainly by three upstream channels: processing electricity, packaging materials, and cold-chain operations. Grid-transition scenarios show how electricity emission intensity varies over time and across locations, directly affecting embedded emissions from energy-intensive processing steps [16]. Aluminium packaging is carbon-intensive, with emissions determined by primary versus recycled content and the electricity mix used in smelting and remelting, as summarised in recent industry environmental profile reporting [17]. Cold chains also help by ensuring constant energy consumption and refrigerant control. Descriptions of energy demand, leakage risks, and efficiency metrics are found in reviews and technical syntheses of refrigerated transport and storage [19,20,21]. Taken together, these sources support literature-based inputs for channel wedges that are observable and, in principle, adjustable through firm actions (electricity procurement, recycled-content verification, and cold-chain efficiency/leakage control).
2.4. Fisheries and Aquaculture Data for Trade Analysis
FAO statistical outputs, including FishStatJ version 2.12.4, provide production and trade series by species and product form, supporting benchmarking of product shares and composition over time [20,24,37]. Peer-reviewed process studies in aquaculture and seafood processing translate physical inputs into carbon intensities that can be priced under a carbon benchmark to construct a channel wedge [24]. Standards of UN Comtrade methodology help ensure consistent mapping between the values and quantities reported by partners and the import statistics, which are then used to provide responses to revenue and quantities [22]. These datasets align with the requirements for a channel-resolved analysis that tracks upstream intensity to trade outcomes.
2.5. Policy Evaluation Modelling Strategies
Armington-based partial-equilibrium approaches remain common when the goal is to trace price and quantity effects in specific industries under transparent parameter assumptions [13,14]. Multi-country CGE models are well suited for evaluating CBAM design and economy-wide leakage, but they can obscure product-level attribution unless the transmission mechanism is made explicit [8]. For seafood, where key upstream drivers are channel-specific (electricity, packaging, cold chain), a useful strategy is to retain an explicit wedge → price → quantity mapping at the product-form level while embedding it in a CGE setting that captures investment, capital accumulation, and welfare effects over time. This motivates the recursive dynamic GTAP implementation used in this study, with channel wedges documented and sensitivity tested alongside CGE outcomes.
Taken together, prior work clarifies CBAM scope and design constraints, documents incomplete pass-through, provides trade-elasticity ranges, and reports process drivers for electricity, aluminium packaging, and cold-chain emissions. What remains limited for seafood is a product-form, channel-resolved mapping from upstream wedges to the EU/UK border prices, import volumes, and export revenues using fully documented, replicable parameters anchored in fisheries/trade statistics. This paper addresses that gap by compiling the required intensity and elasticity inputs, constructing channel-specific wedges, and linking them to prices, quantities, and revenues in a transparent framework that complements CGE-based CBAM studies.
3. Study Data
3.1. Data Sources and Preprocessing
Trade values and quantities follow UN Comtrade partner-reporting conventions and methodology [22]. Fisheries and aquaculture statistics used for product-form/category mapping are drawn from FAO sources, including FishStatJ outputs [5,20]. For shrimp, we also use recent China-based footprint evidence, where product-specific measurements exist, to anchor process-intensity assumptions [34]. Grid emission intensity for the reference year is taken from the NREL Standard Scenarios outlook. Aluminium life-cycle factors and recycled content shares follow the European Aluminium environmental profile reporting [17]. Cold-chain energy use and refrigerant parameters follow periodic technical reviews and the FAO cold-chain synthesis. Where seafood-specific process factors are unavailable, we use peer-reviewed analogues, document the transfer, and record sources in a data log. We harmonise reference years, map HS codes to FAO product categories, and convert all intensities to a per-unit basis within a consistent product boundary to avoid double-counting across channels. Electricity inputs are recorded in kWh per unit and converted to MWh by dividing by 1000 when applying the grid emissions factor ( per MWh). Where seafood-specific process factors are unavailable, we use the closest peer-reviewed analogue by processing stage and cold-chain requirement and record the transfer assumption in a study data log.
3.2. Parameterization and Ranges
Both the pass-through parameter () and the Armington elasticity () are assigned at the product level in the 2024 reference year. Baseline values reflect differences between processed and fresh product forms: processed products are assigned a higher pass-through than fresh products to reflect more standardised contracting and pricing in canned/frozen lines [11,29]. The processed-product baseline is used as a central calibration within the tested processed range (0.60–0.80) rather than as an upper-bound assumption, and Section 5.3 reports how revenue outcomes shift under lower pass-through.
For fresh tilapia, we use a lower pass-through range (0.40–0.60) to reflect greater price flexibility in fresh trade relative to standardised canned/frozen contracting. Armington elasticities are set within 2.50–3.50 for processed products and 1.50–2.50 for fresh products, consistent with elasticity guidance and GTAP-based policy applications [13,14]. These are treated as form-based behavioural parameters (fresh vs. processed) rather than species-specific estimates; accordingly, tilapia outcomes are interpreted within the same bounded ranges rather than as point-identified parameters for China’s tilapia exports. The grid emission factor () is set within 0.5–0.9 MWh−1 [16]. Recycled content share varies between 0.20 and 0.70 [17]. Refrigerant leakage () ranges from 0.05 to 0.15 kg per unit, and the carbon price () ranges from EUR 70 to 100 per . Together, these bounds define uncertainty in the channel wedges (Equations (1)–(4)), border price transmission (Equation (5)), and trade responses (Equations (6) and (7)).
When product-specific inputs are unavailable, we use the nearest credible analogue by processing stage and cold-chain requirement and scale it using transparent ratios, flagging imputed values in a study data log. For example, for a fresh tilapia packaging mass ()), we scale the aluminium packaging mass for processed whitefish by a fillet-to-whole-fish weight ratio and apply the fresh-product bounds for and to reflect greater price flexibility in the fresh form. These assumptions, together with central behavioural parameters, define the 2024 baseline calibration reported in Table 1, Table 2 and Table 3 and the sensitivity bounds in Table 4. We scale the aluminium packaging mass for processed whitefish by the fillet-to-whole-fish weight ratio and apply lower pass-through and elasticity bounds to reflect the fresh form. These assumptions, together with the central behavioural parameters, define the 2024 baseline calibration inputs reported in Table 1.
Table 1.
Baseline parameter values by product for 2024 reference year.
Table 2.
Process intensities by product for 2024 reference year.
Table 3.
Provenance of key process-intensity inputs by product and channel (2024 reference year).
Table 4.
Parameter ranges for sensitivity analysis.
Table 1 summarises the 2024 baseline calibration inputs by product. Pass-through (π) is the share of the upstream carbon cost wedge transmitted to the CIF unit price. Armington elasticity (σ) maps the CIF price change into the import quantity response. Total wedge is the combined ad valorem carbon cost wedge, expressed as a percentage of the baseline CIF unit value .
Table 2 translates the baseline calibration into measurable per-unit process intensities that determine the electricity, aluminium packaging, and cold-chain wedges. It also explains cross-product differences in exposure under the same carbon price. Higher electricity use raises the electricity wedge, higher packaging mass raises the aluminium wedge, and higher cold-chain electricity and leakage raise the cold-chain wedge. A consistent per-unit boundary keeps the combined wedge additive across channels and avoids double-counting.
To make the calibration transparent, Table 3 records whether each key process-intensity input is taken from seafood-specific evidence, derived by transparent scaling, or transferred from the closest peer-reviewed analogue (matched by processing stage and cold-chain requirement), with details retained in the study data log.
Because analogue/derived inputs introduce greater uncertainty in level estimates, we report bounded parameter ranges (Table 4) and use a one-factor sensitivity analysis to show how results change under plausible low–high inputs, rather than asserting a single numerical margin of error.
Table 4 defines the parameter ranges for the one-factor sensitivity analysis and complements the central calibration in Table 1 and Table 2 by providing plausible bounds for behavioural parameters and emission drivers that shift wedge magnitude and transmission. Varying π and σ tests the uncertainty in cost pass-through and demand responsiveness. Varying , , , and tests uncertainty in emissions inputs and policy stringency. Changing one parameter at a time within these bounds isolates the main drivers of results without altering the model structure.
4. Methodology
4.1. Study Design
This study follows a two-layer design. First, we construct product-specific ad valorem carbon cost wedges from three measurable upstream channels—processing electricity, aluminium packaging, and cold-chain electricity/refrigerant leakage—and map these wedges into border price changes, import-quantity responses, and export-revenue changes using a transparent pass-through and Armington-demand structure. Second, we embed the same wedge transmission mechanism into a recursive dynamic GTAP setting to evaluate the multi-year adjustment under alternative policy blocks, allowing technology adoption and capital accumulation to modify wedge drivers over time while keeping the product-level mapping explicit.
4.2. Core Formulations
This section sets out the static wedge framework that links upstream emission-related costs to border prices and trade outcomes at the product level. Equations (1)–(4) construct the ad valorem carbon cost wedge from the three supply chain channels. Equations (5)–(7) map the wedge into the CIF unit value change, the import quantity response, and the export revenue change. We report ΔP in percentage points and ΔQ and ΔR in percent.
Total wedge percent of CIF price:
where is the total ad valorem carbon cost wedge for product expressed as a percent of the baseline CIF unit value, and , , and are the electricity, aluminium packaging, and cold-chain components defined in Equations (2)–(4).
Electricity channel:
where is the electricity use in kWh per unit. We convert kWh to MWh by dividing by 1000 before multiplying by . is the grid emission factor in tCO2e per MWh, is the carbon price in euros per tCO2e, and is the baseline CIF unit value in euros per unit.
Aluminium packaging channel:
where is the aluminium packaging mass (kg per unit), is the recycled content share, and and are emission factors (tCO2e per kg) for recycled (secondary) and primary aluminium, respectively. For baseline accounting, we set tCO2e/kg and tCO2e/kg (i.e., 6.6 kg CO2e/kg for primary and 0.26 kg CO2e/kg for recycled), consistent with the aluminium profile factors used in our calibration sources.
Cold-chain channel:
where and denote the cold-chain electricity use (kWh per unit) for storage and transport, and denotes the refrigerant leakage (kg per unit). Electricity is converted from kWh to MWh by dividing by 1000 before applying (tCO2e per MWh). Refrigerant leakage is converted from kg to tonnes via , and is the 100-year global warming potential of the representative refrigerant. For baseline accounting, we use (HFC-134a benchmark) as applied in our cold-chain parameterization sources.
Border price transmission:
where is the percent change in the CIF unit value, expressed in percentage points. The pass-through parameter reflects contractual and competitive conditions in the supply chain [13,14].
Import quantity response:
where is the Armington elasticity of substitution [14,37]. It maps the CIF unit price change , expressed in percentage points, into a percent change in import quantity.
Export revenue change:
where is the percent change in export revenue for product h, combining the CIF unit value change and the import quantity response. Equations (1)–(4) construct product-level ad valorem carbon cost wedges from process intensities and . Equations (5)–(7) map wedges into the CIF unit value change, the import quantity response, and the export revenue change.
4.3. Dynamic GTAP Model and Policy Blocks
To evaluate tariff surcharges and low-carbon certification in a multi-year setting, we embed the product-specific wedge framework into a recursive dynamic GTAP model. In each period , the wedge is implemented as an ad valorem bilateral price wedge on China → EU/UK flows of product , raising the effective importer price and reallocating demand across origins through the Armington structure. Under certification, wedge drivers decline over time because certification is operationalized as gradual reductions in emission-relevant coefficients (processing electricity, cold-chain electricity, refrigerant leakage, and effective packaging emissions), rather than a one-time level shock. The recursive dynamic channel then operates through standard capital accumulation: changes in returns shift investment and capital stocks update period by period, while learning is represented parsimoniously as a decline in the per-unit cost of adoption (e.g., renewables’ procurement, refrigerant upgrades, and packaging improvements), subject to adjustment frictions and adoption limits, which govern the pace at which the coefficients underlying are reduced
We define three policy blocks. P1 applies a tariff-only carbon surcharge on embedded emissions at the border (a uniform upstream carbon charge translated into an ad valorem wedge). P2 combines the surcharge with certification through tiered rate reductions on certified low-carbon products, so certified exporters face a reduced effective tariff rate. P3 pairs certification with domestic green-finance or tax credits that partially offset investment costs. Certification coverage follows conservative, moderate, and ambitious paths corresponding to slow, moderate, and rapid adoption of low-carbon standards, respectively.
4.4. Validation and Robustness Checks
We validate the numerical implementation through three checks. First, additivity holds by construction: for each product , the total wedge equals the sum of the electricity, aluminium, and cold-chain components in Equations (1)–(4), and the wedge propagates linearly through Equations (5)–(7). For example, the processed tuna wedge of 11.39% can be decomposed into approximately 2.1 percentage points (electricity), 8.0 percentage points (aluminium packaging), and 1.3 percentage points (cold chain), which sum to 11.4% after rounding, consistent with Table 1. Second, direction tests confirm expected signs: lower pass-through or lower elasticity attenuates revenue losses, while higher recycled content or lower emission intensity reduces the wedges at the source in Equations (1)–(4). Third, we assess parameter uncertainty using the bounds in Table 4 through one-factor sensitivity analysis.
The sensitivity of π, σ, , and indicates how central results change when varying the carbon price, pass-through, demand elasticity, and recycled content share within empirically based bounds.
5. Results and Discussions
Section 5 reports results in the same order as the research questions. Section 5.1, Section 5.2 and Section 5.3 quantify short-run (static) exposure by product and channel (RQ1). Section 5.4, Section 5.5, Section 5.6 and Section 5.7 then report dynamic adoption, unit emissions, export-share retention, investment, and welfare under the three policy blocks, including coastal–inland contrasts (RQ2) and the certification design implications (RQ3).
5.1. Channel Decomposition of CIF Unit Value Changes
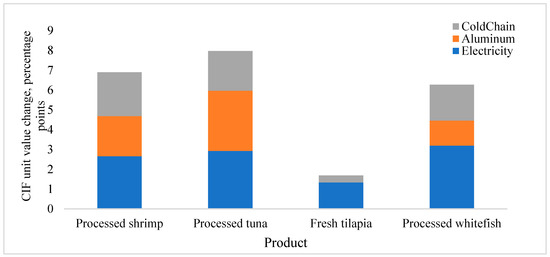
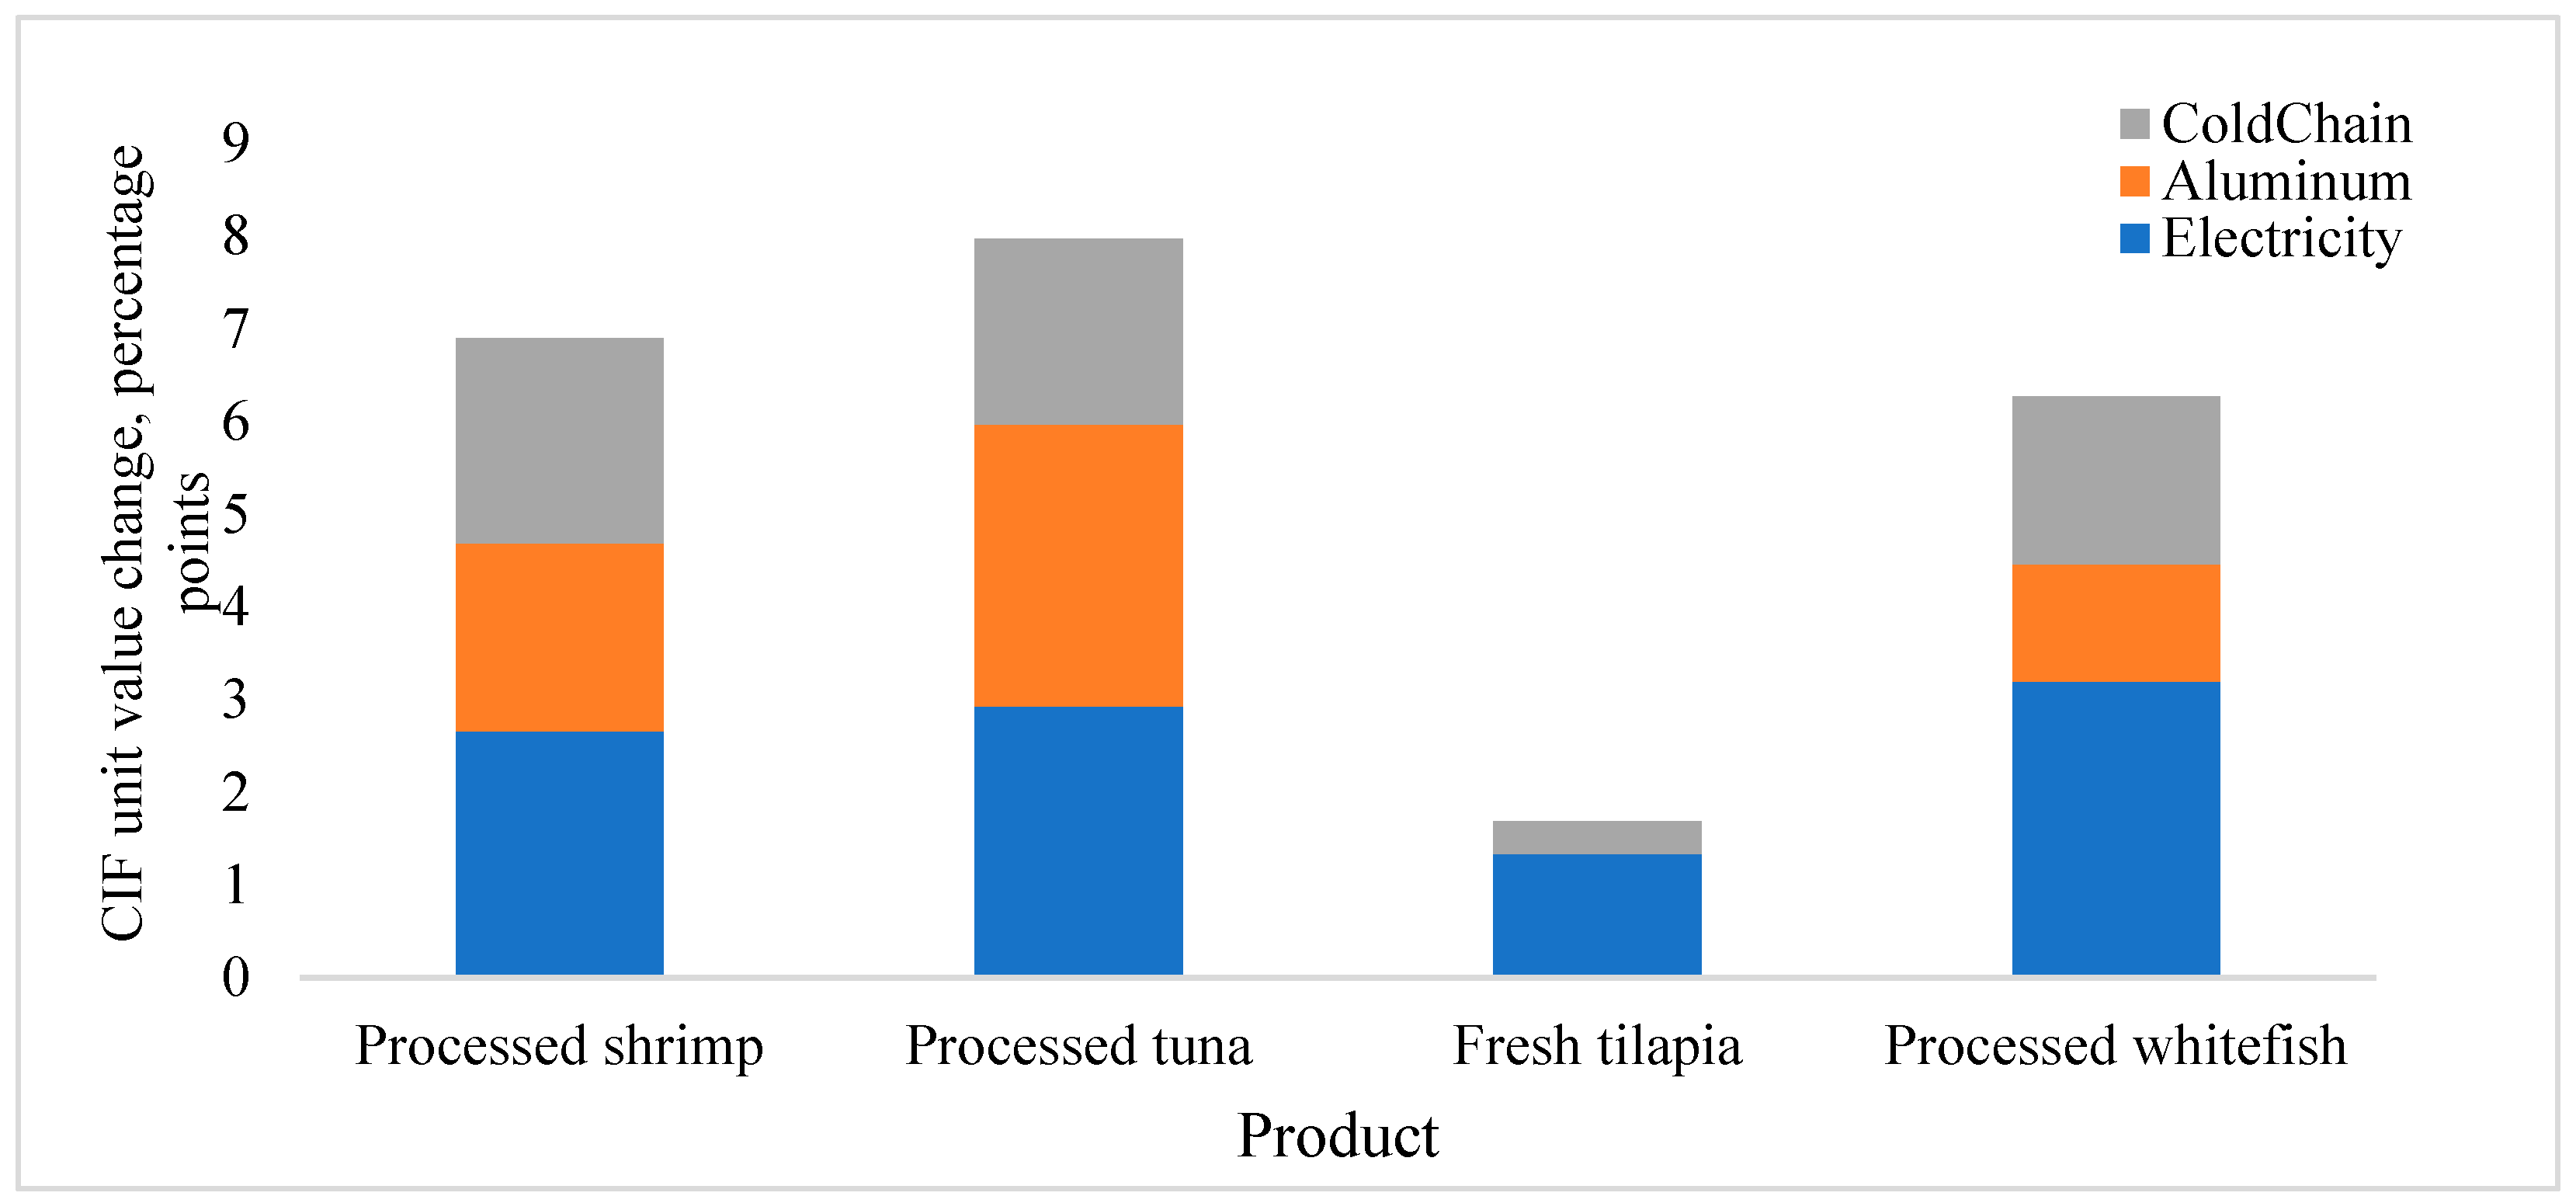
As shown in Figure 1, we then calculate the magnitude of transmission of upstream carbon wedge cost to border prices by isolating the electricity, aluminium packaging systems, and cold-chain systems.
Figure 1.
Channel decomposition of CIF unit price change by product (static central case). Notes: Channel wedges are computed using Equations (2)–(4) and translated into CIF unit value changes using the pass-through mapping in Equation (5). Bars report percentage-point contributions of electricity, aluminium packaging, and cold chain to the total CIF unit price change for each product.
Channel-level wedges are calculated using expressions (2) to (4) and converted to CIF unit values using the pass-through parameter in Equation (5). This is because this step shows which process drives the price pressure for each product and prepares the way for quantity and revenue reactions in subsequent figures. We report static wedge results first, then dynamic trajectories to separate immediate border impacts from medium-run adjustment.
5.2. Central Case Trade and Revenue Outcomes
This subsection links the price effects to trade volumes and export revenues. Armington import demand maps the change in CIF unit price to a percent change in the EU and UK import quantities for each product. Export revenue then combines the price and quantity effects. Table 5 presents the central case outcomes under the static wedge framework. ΔQ is the percent change in import quantity, and ΔRevenue is the percent change in export revenue.
Table 5.
Central case trade and revenue outcomes by product using static wedge model.
In the static mapping, processed tuna experiences the largest contraction in the EU/UK imports and export revenue, followed by shrimp and whitefish, while fresh tilapia is the least exposed. At the same time, fresh tilapia remains the least exposed line. These magnitudes arise from the interaction of border price transmission and demand sensitivity. A larger channel wedge increases the CIF unit value change through Equation (5), and a higher pass-through parameter increases the fraction of that wedge that reaches the border price. Given the Armington structure, a larger CIF price shock leads to a larger import contraction, as shown in Equation (6). Export revenue follows as the combined effect of the price change and the quantity response. This mapping explains why the dominant channel differs by product while the overall exposure ranking remains stable across central cases.
5.3. Scenario and Sensitivity Analysis
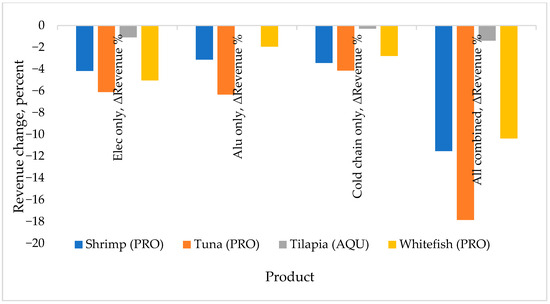
In this subsection, the effects on revenues of certain processes are presented, and the strength against some important parameters is also tested. Our starting point is scenario decomposition. We turn on one channel at a time, turn off the other wedges, and plot the active wedge to CIF unit values using Equation (5) on one product and repeat this process on the other product. Then, we calculate quantity and revenue using Equation (6) and Equation (7). This separates the functions of electricity, aluminium packaging, and cold chain. The combination case activates all channels and performs a consistency check.
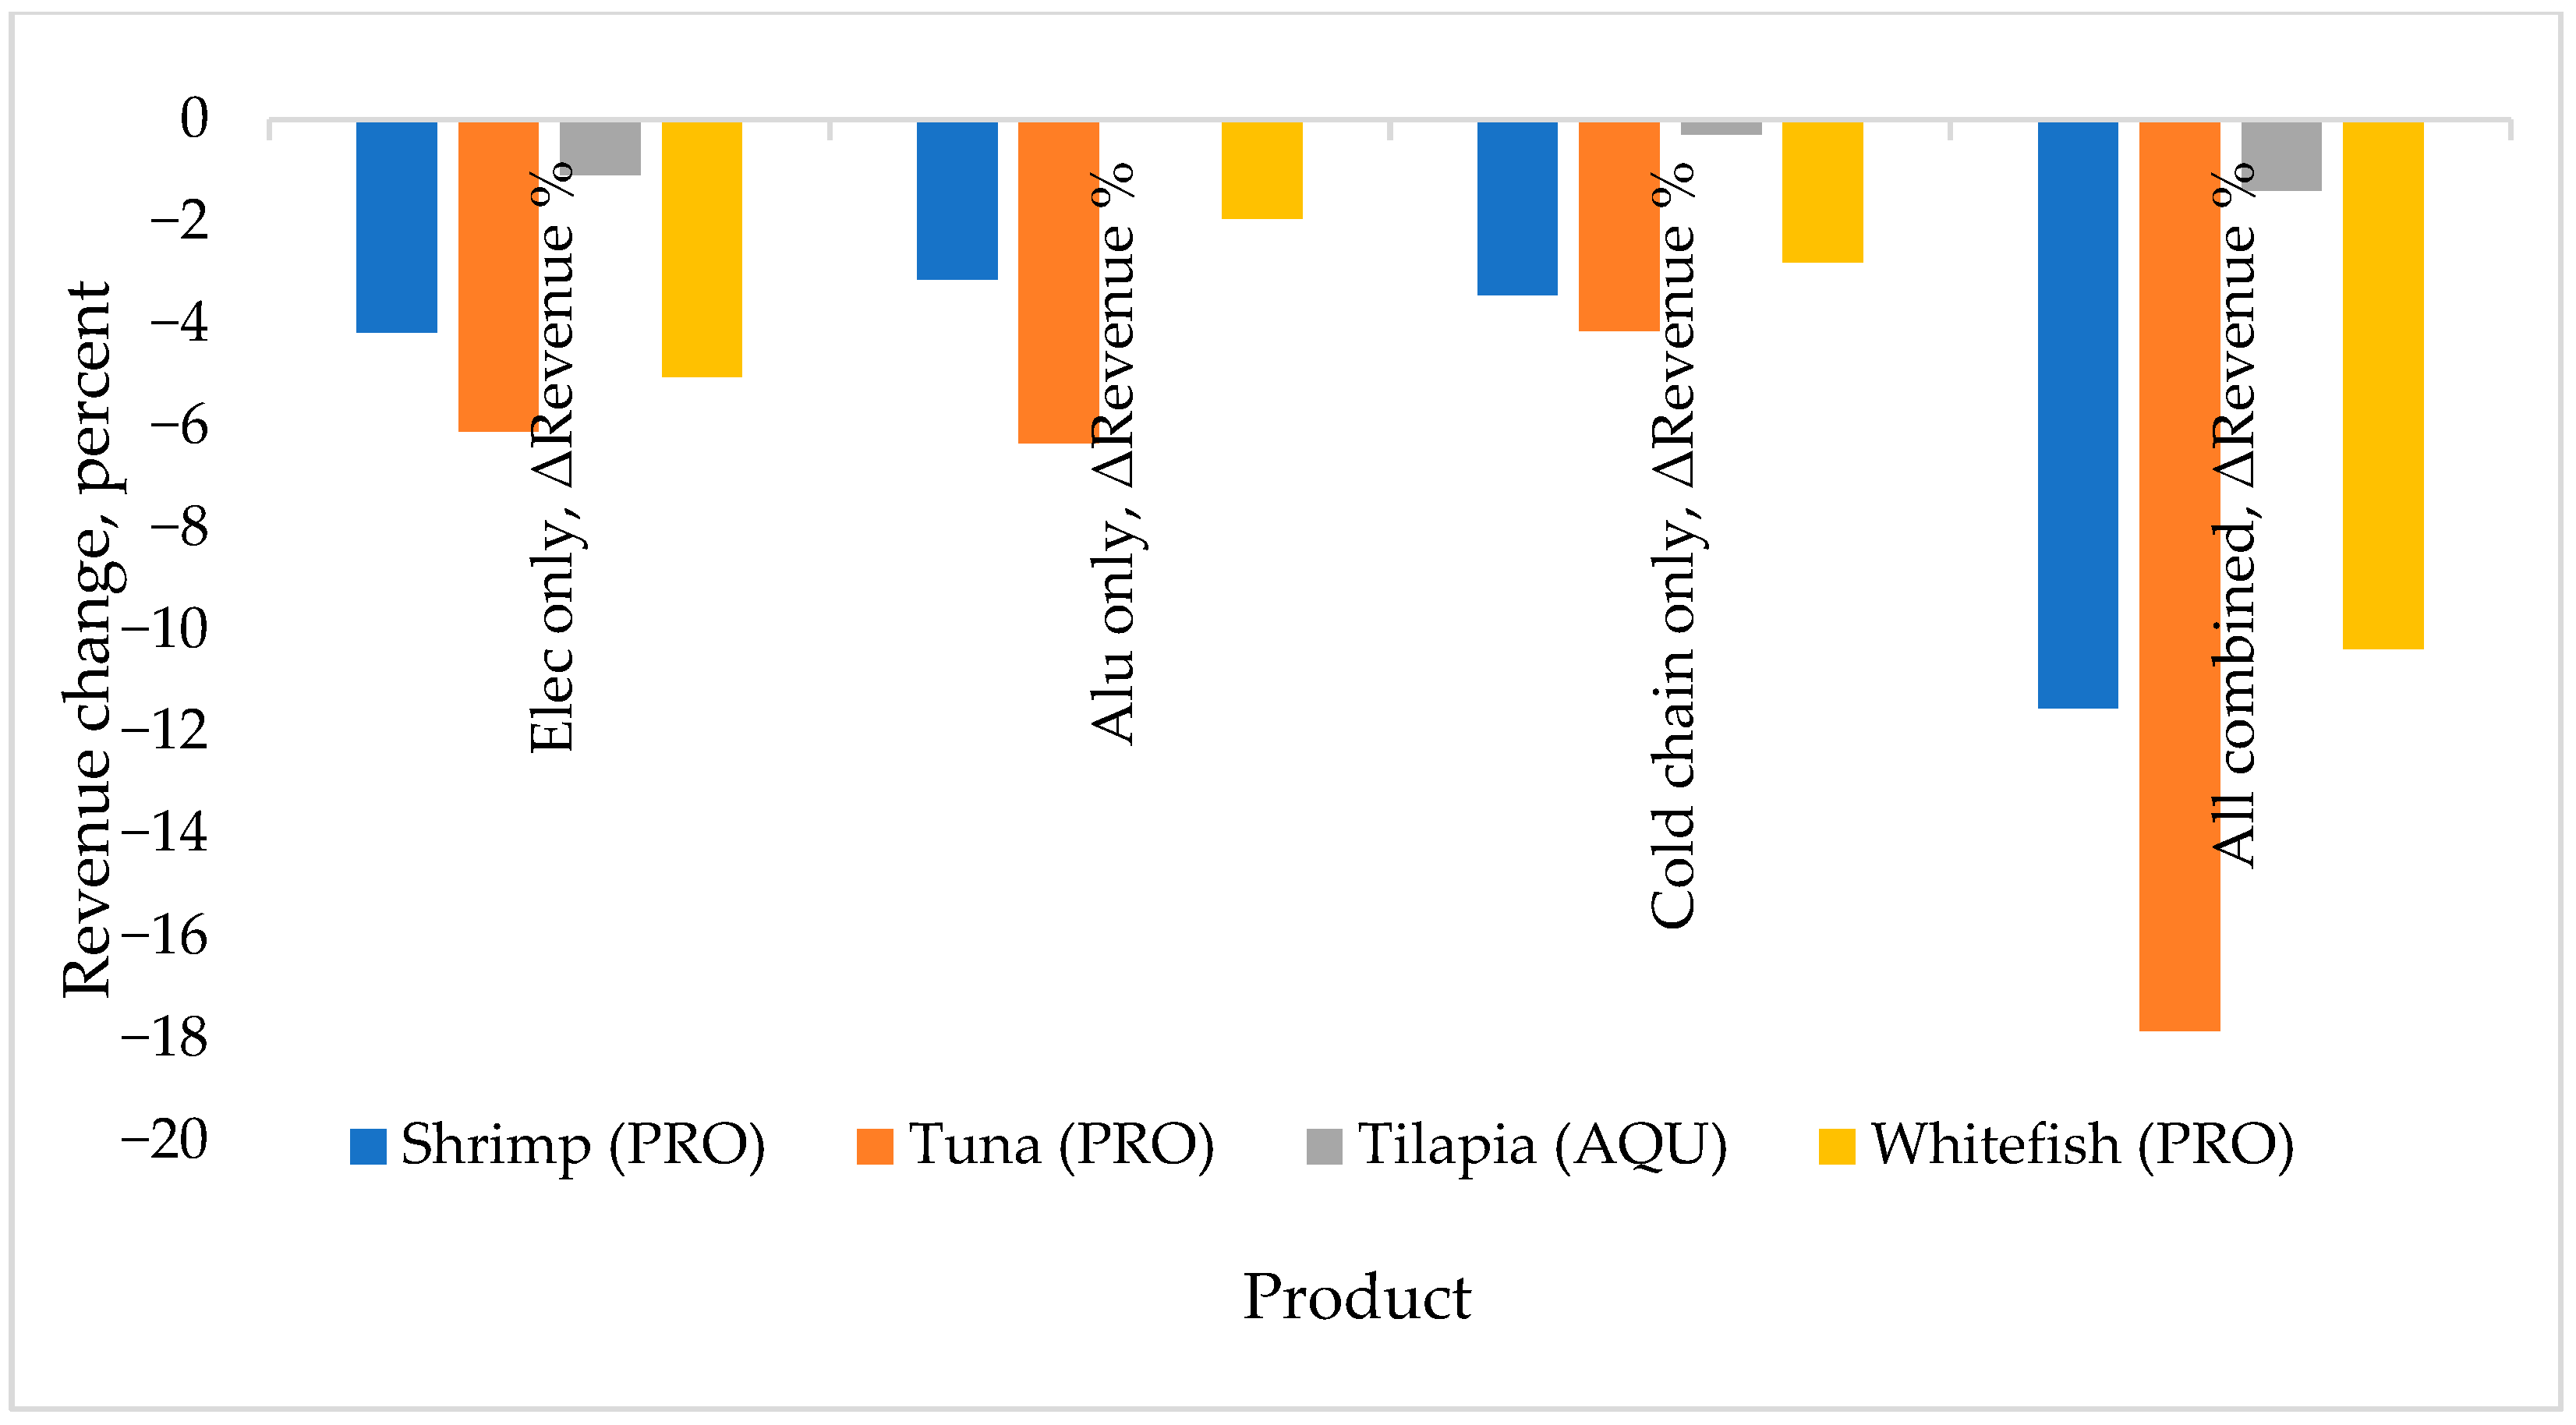
The scenario comparison in Figure 2 shows that products with larger combined wedges also experience larger export revenue losses. Single-channel results isolate the dominant driver by product. Aluminium packaging dominates tuna, electricity dominates shrimp and whitefish, and cold chain acts as a secondary driver for shrimp. Tilapia remains at low exposure across channels, reflecting lower processing intensity and weaker pass-through in the fresh trade.
Figure 2.
Export revenue change by product under single-channel and combined wedges (static mapping). Notes: ΔRevenue (%) is computed from Equations (5)–(7) under single-channel activation (electricity, aluminium, cold chain) and under the combined-wedge case.
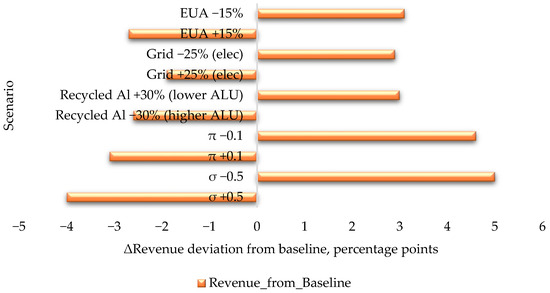
We test how processed tuna results respond to plausible variation in pass-through, demand elasticity, and technical parameters. The sensitivity design varies one parameter at a time while holding all others fixed. Specifically, we vary pass-through (π) to 0.60, Armington elasticity (σ) to 2.50, the grid emissions factor () to 0.50 tCO2e per MWh, and the recycled content share () to 0.70 from the 0.20 baseline. We translate each change into CIF price, import quantity, and export revenue outcomes using the mapping described above. In addition, we confirm that the qualitative exposure ranking (fresh tilapia remaining the lowest exposure line) is preserved when fresh-product and are moved to their low and high bounds in Table 4.
The sensitivity results from Figure 3 show that commercial levers that lower pass-through or demand elasticity provide the largest revenue relief for processed tuna. Physical levers that reduce electricity emission intensity, aluminium emission intensity through higher recycled content, or refrigerant leakage also reduce losses, but by smaller margins within the tested bounds. Carbon price changes scale the wedge proportionally and therefore amplify or dampen the revenue response.
Figure 3.
One-factor sensitivity of processed tuna export revenue (static mapping). Note: each bar varies one parameter within the bounds in Table 4 while holding other parameters at baseline; outcomes report ΔRevenue (%) implied by Equations (5)–(7).
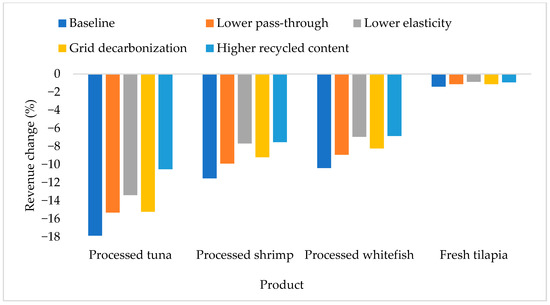
Figure 4 compares export revenue losses across products under the baseline and the alternative static scenarios defined in the text. Differences reflect changes in commercial transmission and demand responsiveness and changes in the key technical drivers of wedge magnitude.
Figure 4.
Revenue losses across products under baseline and alternative static scenarios.
These static results establish short-run exposure and the relative importance of commercial versus technical drivers; we now turn to the dynamic model to evaluate how certification and incentives alter adoption, emission intensity, and market-share outcomes over time (RQ3), including differences across coastal and inland groupings (RQ2).
5.4. Dynamic Adoption, Emissions, and Export Share Trajectories
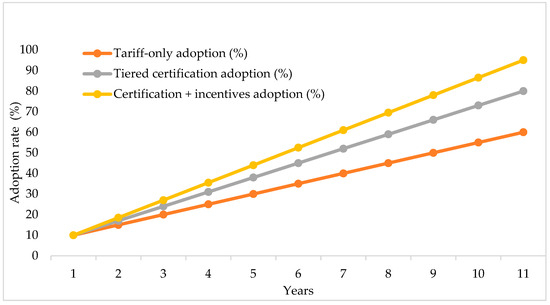
We now examine the time-varying impact of technology adoption, unit emission, and export share under each block of the policy. In the recursive dynamic model, investment decisions are linked to expected profits, the learning curve, and the adoption ceiling; thus, the trajectories of the tariff-only (P1), tiered certification (P2), and certification with incentives (P3) cases vary. The first results that we have are related to the adoption of low-carbon technologies. Installation of renewable electricity, natural refrigerants, and low-carbon feedstock is slow under P1 because surcharges do not alter the payoff matrices. Adoption is only approximately 60% by year 10. In cases where companies are offered a tiered reduction in certified products (P2), the rate of uptake increases to about 80%. The certification, combined with domestic incentives (P3), leads to almost total adoption at the horizon’s end. In the dynamic model, certification (P2) accelerates adoption relative to tariff-only surcharges (P1), and certification with incentives (P3) produces the fastest and deepest adoption over the ten-year horizon, which in turn reduces unit emissions and improves export-share retention. All these variations explain the effects of certification and financial support in reducing the costs of investment and payback periods. These trajectories are recorded graphically in Figure 5.
Figure 5.
Technology adoption trajectories under alternative policy blocks (dynamic model). Note: lines report the modelled adoption share over years 1–10 under tariff-only surcharges (P1), tiered certification (P2), and certification with incentives (P3).
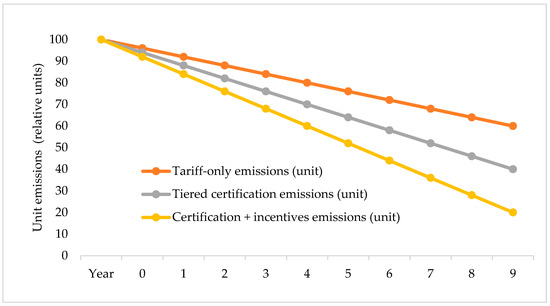
Adoption changes are directly converted into outcomes in terms of emissions. With the diffusion of green technologies, the unit emissions are reduced. Under P1, the level of reduction in emissions is low since the adoption is slow. The fall is more pronounced under P2, and under P3, it is most evident when companies are rapidly moving towards low-carbon power, refrigeration, and feed. Figure 6 shows how each block of policy has unit emissions over the course of time and points out the greater decarbonization with certification regimes.
Figure 6.
Unit-emission trajectories under alternative policy blocks (dynamic model).
Figure 6 shows unit-emission paths under the alternative policy blocks in the recursive dynamic model over years 1 to 10. Lower unit emissions improve compliance and reduce the cost penalty associated with CBAM-type adjustments, thereby supporting export competitiveness in the EU and UK markets. Under P1, competitiveness weakens over time as emissions and costs remain relatively higher. Under P2, faster emission reductions stabilise and, in some years, improve competitiveness by lowering emissions and production costs.
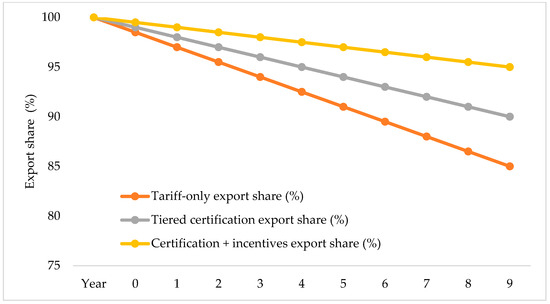
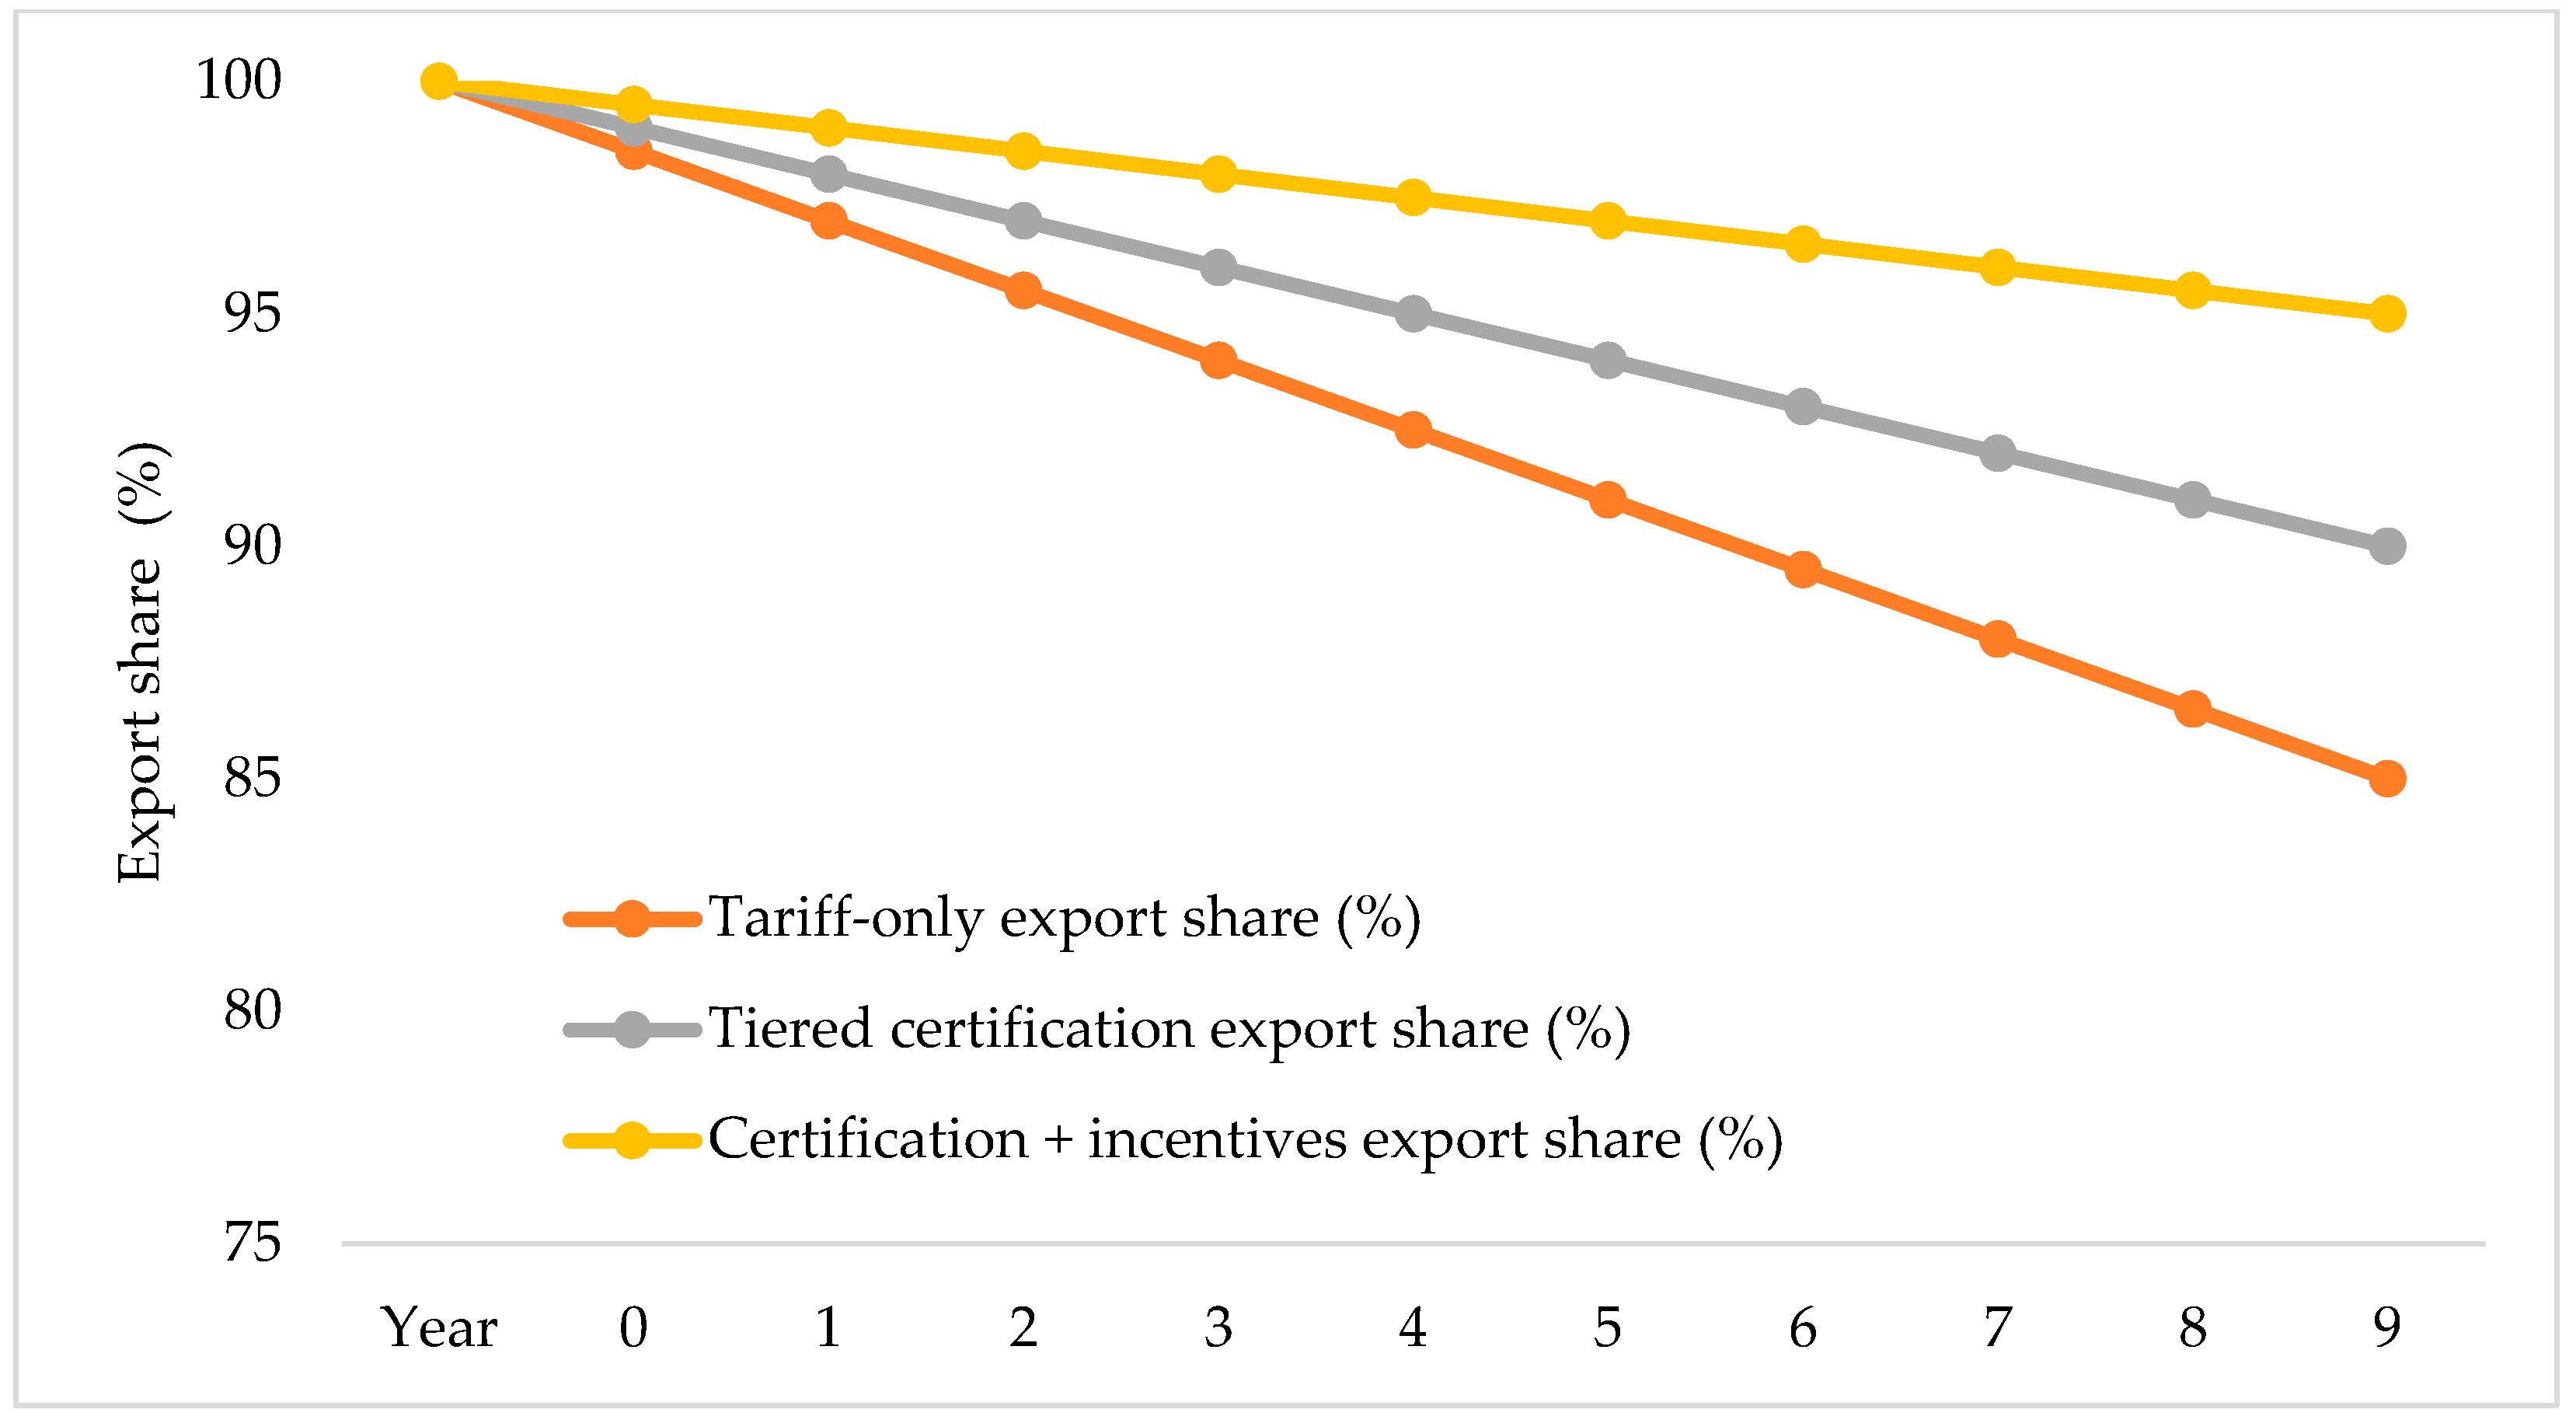
Figure 7 shows the EU/UK market export-share retention under alternative policy blocks relative to the baseline path. The horizontal axis is model year 1 to year 10. Here, “export share” is defined with respect to the EU and UK import demand in the modelled markets and does not endogenize diversion of exports to third destinations. Export share retention is the highest when certification is combined with incentives, followed by tiered certification, with tariff-only surcharges performing the worst over the horizon. The ordering reflects faster adoption and lower unit emissions under certification, which compresses the border cost wedge over time and moderates the import contraction.
Figure 7.
EU/UK export-share retention under alternative policy blocks (dynamic model).
5.5. Investment and Capital Stock Outcomes
Investment reactions are a reflection of the adoption trends. Before reporting the numbers, it is important to remember that the dynamic model traces capital accumulation subsector by subsector. According to P1, companies have minimal investments; hence, the capital stocks are barely above the base levels. With P2, companies invest more vigorously, particularly in aquaculture, to meet certification requirements. Under P3, high incentives induce heavy investments in processing, aquaculture, and cold chain. Table 6 summarises dynamic investment and capital stock outcomes by subsector under the policy blocks in the recursive dynamic GTAP simulations over the ten-year horizon.
Table 6.
Dynamic investment and capital stock outcomes by subsector and policy block.
Investment and capital-stock responses track the adoption-driven productivity path in the dynamic model. Certification with incentives shows the strongest capital deepening across affected subsectors, including seafood processing and cold-chain services, while tiered certification produces intermediate gains. Tariff-only surcharges show the weakest investment response, consistent with slower emission improvements and weaker export retention in the model simulations.
5.6. Welfare and Cost-Effectiveness Outcomes
This subsection reports welfare impacts and the implied cost per tonne of CO2_22 abatement. The dynamic model aggregates changes in consumption, investment, and policy payments across two stylized regional groupings (coastal vs. inland) to represent heterogeneity in export-oriented seafood supply chains, rather than a detailed spatial industry map. In this setup, regional differences mainly operate through (i) logistics and cold-chain intensity (longer transport legs and refrigeration dependence raise the sensitivity of delivered costs to energy and refrigerant wedges) and (ii) implementation capacity (differences in the ability to finance and complete certification-linked upgrades). Table 7 reports present value welfare changes (bn USD) and the model-implied cost per tCO2_22 under each policy block over the ten-year horizon. Across both groupings, tariff-only surcharges (P1) generate larger welfare losses and higher abatement costs, while certification regimes (P2 and especially P3) reduce welfare losses and improve cost-effectiveness; in the reported calibration, inland outcomes are more sensitive under P1.
Table 7.
Present value welfare and cost-effectiveness by region and policy block.
Table 7 reports present value welfare changes and abatement costs under each policy block for the coastal, inland, and combined groupings. The largest welfare losses and highest cost per tonne occur under tariff-only surcharges (P1), with stronger adverse effects in the inland grouping in the reported calibration. Tiered certification (P2) reduces welfare losses and lowers the cost per tonne relative to P1. Certification with incentives (P3) further improves cost-effectiveness and substantially attenuates welfare losses compared with the surcharge-only case.
5.7. Policy Efficiency Frontier and Sensitivity Analysis
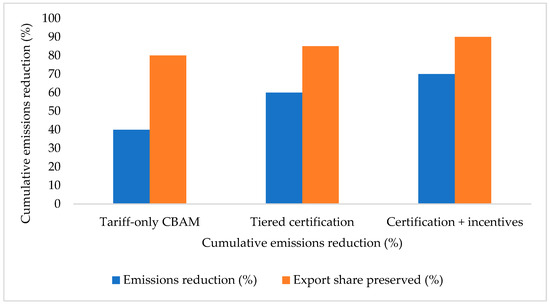
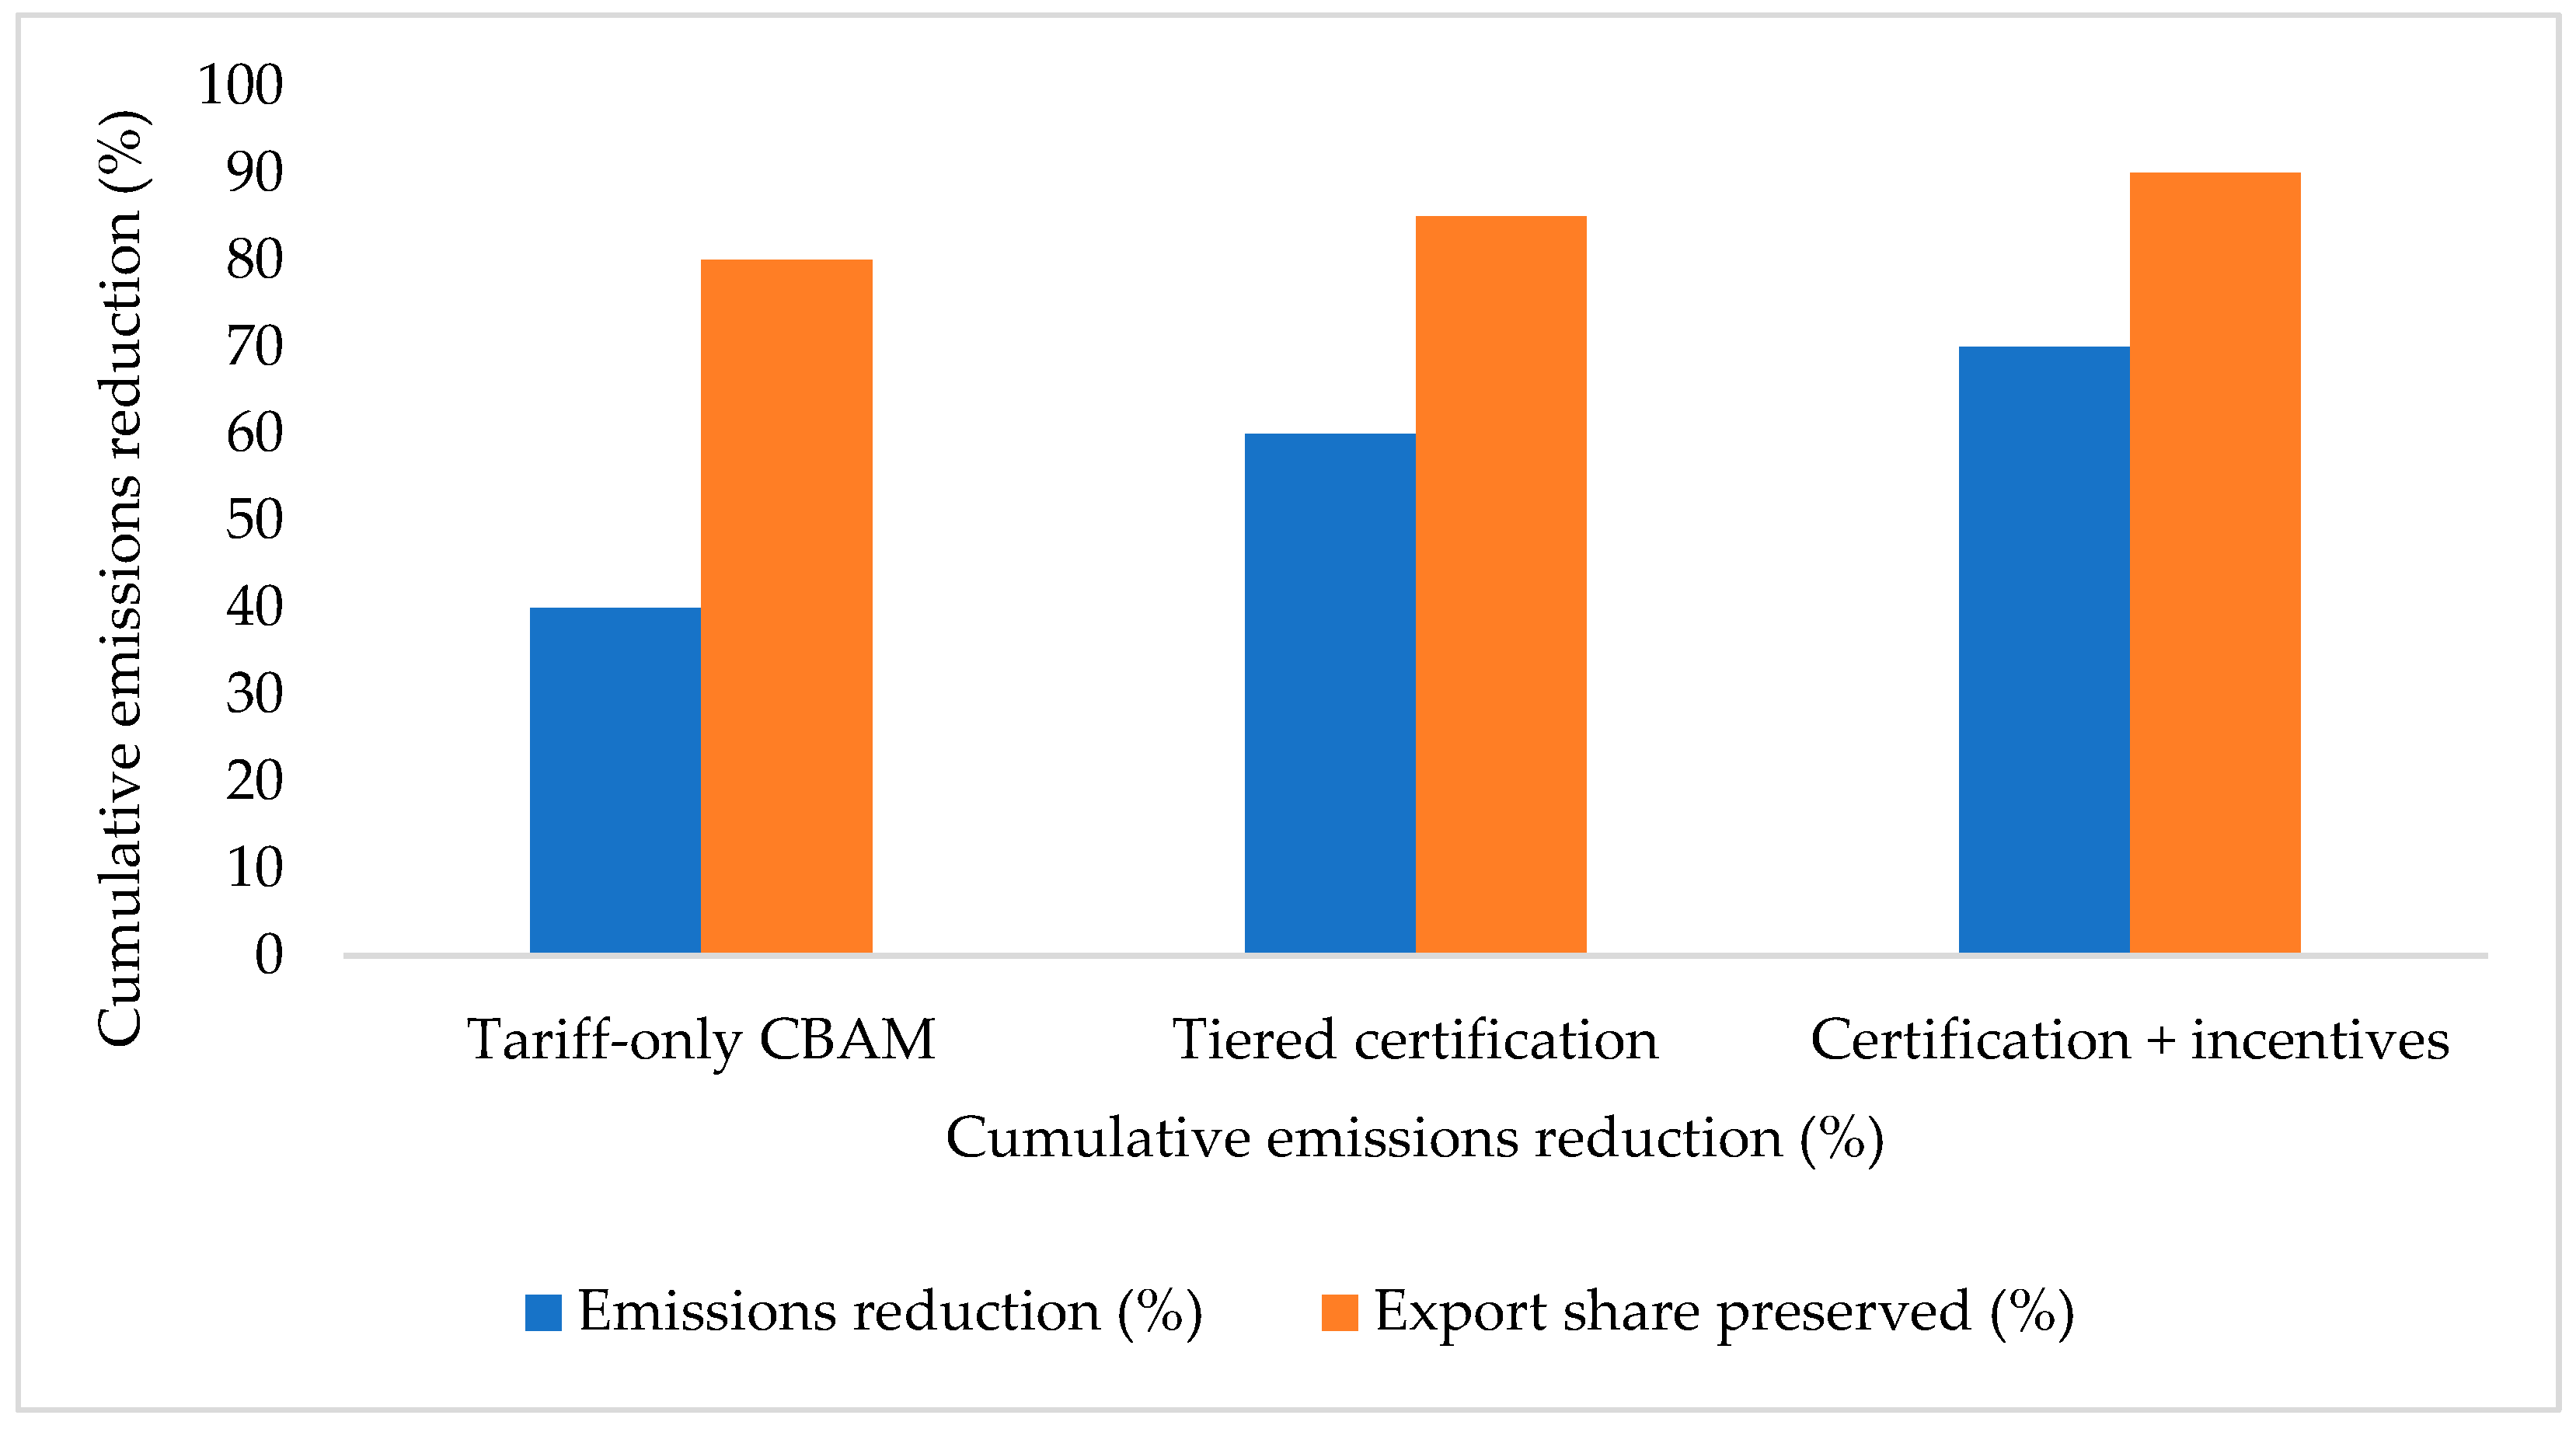
This subsection summarises the trade-off between market access and decarbonization and tests whether the dynamic rankings depend on key assumptions. Figure 8 places each policy block on a two-outcome space. The horizontal axis reports the retained export share relative to the baseline path. The vertical axis reports cumulative emission reduction over the ten-year horizon. Points closer to the upper right deliver larger emission reductions while preserving more market share.
Figure 8.
Policy efficiency frontier: export-share preservation versus cumulative emission reduction (years 1–10).
The tariff-only block lies in the lower-left region, indicating that it delivers emission reductions but at the cost of larger losses in the EU and UK market share. Tiered certification shifts to the right and upward, indicating better market retention and stronger emission reductions. Certification with incentives moves closest to the upper-right region, which indicates the most favourable joint outcome in this comparison. The frontier highlights that policy blocks that accelerate adoption and lower unit emissions can improve both outcomes rather than trading one off against the other.
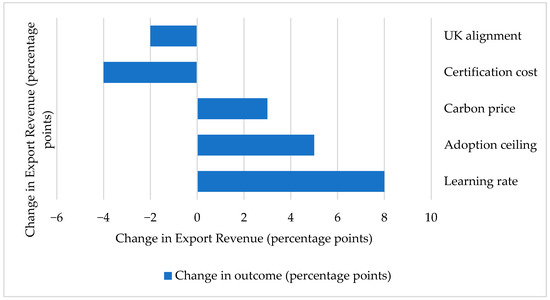
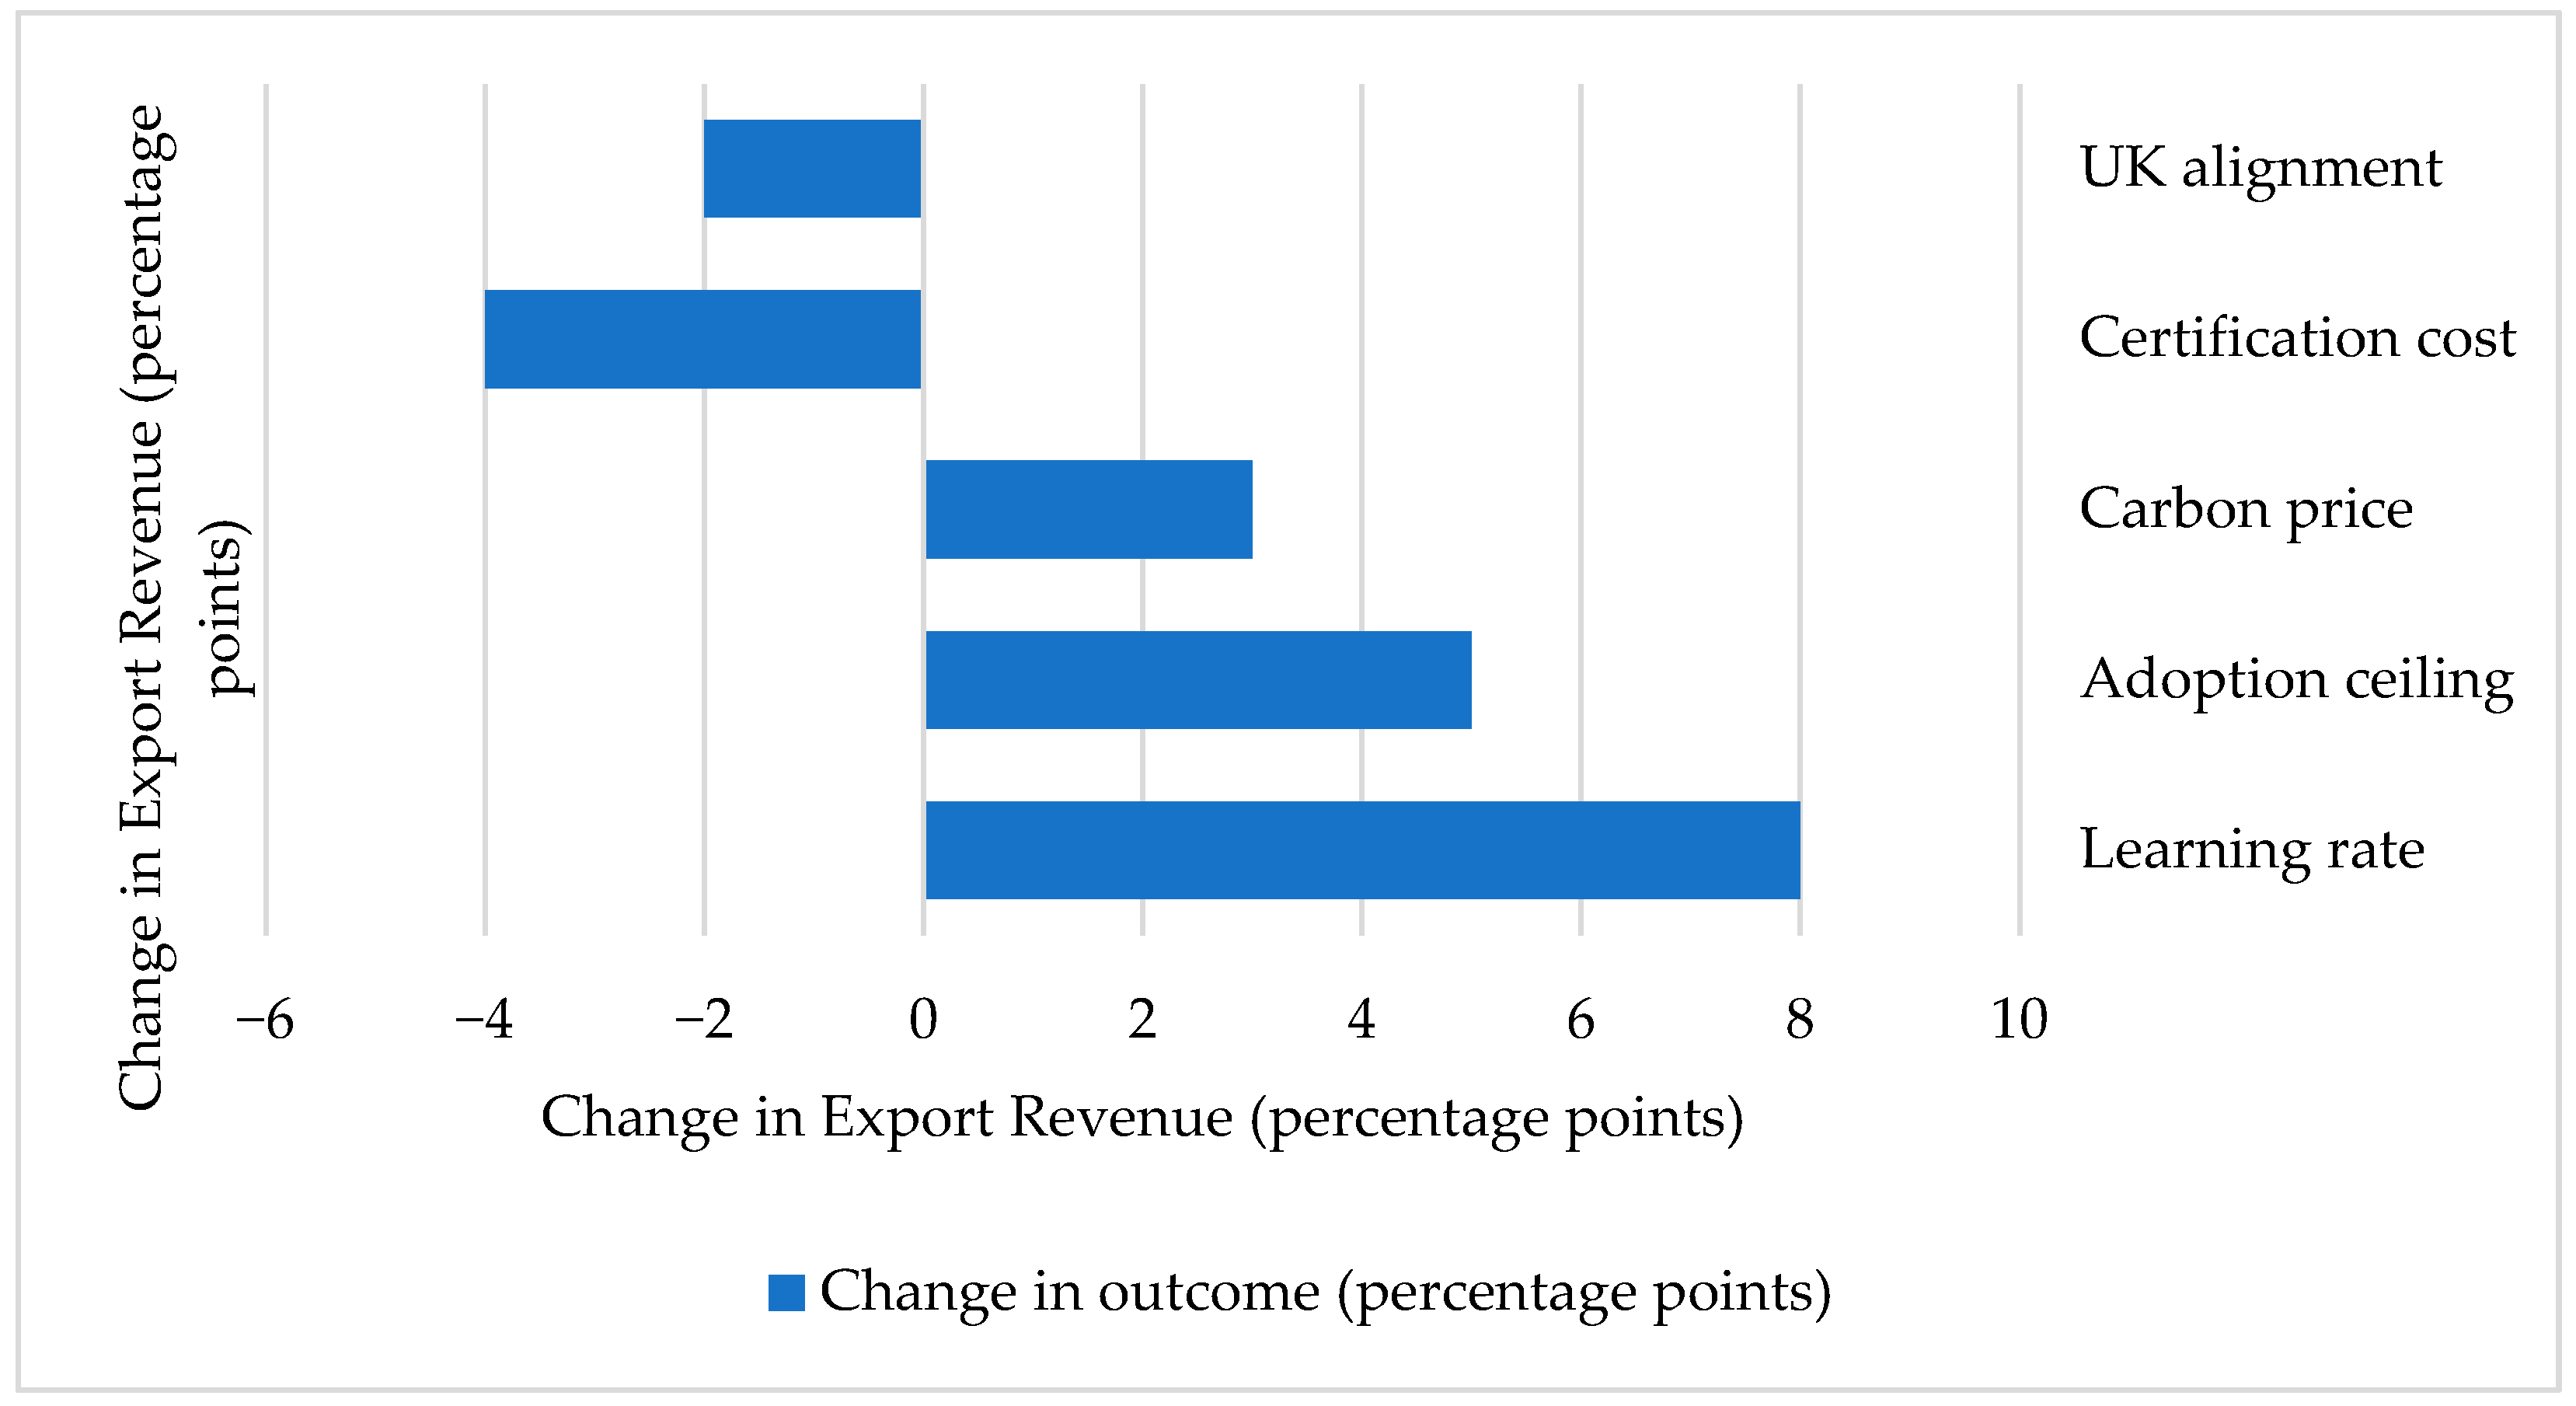
We then test robustness by varying key dynamic parameters around their central values. Figure 9 reports how these changes shift cumulative emission reduction while keeping the policy structure unchanged. Higher learning rates and higher adoption ceilings produce the largest increases in cumulative emission reduction because they raise the speed and maximum extent of technology uptake. Higher certification administrative costs reduce emission gains by slowing or limiting participation and implementation. A weaker UK policy alignment also reduces cumulative reductions by lowering the effective market incentive to sustain adoption. Carbon price changes shift outcomes in the expected direction, but their influence is smaller than the adoption dynamics in this model setup.
Figure 9.
Sensitivity of cumulative emission reduction in the dynamic model.
5.8. Interpretation and Policy Implications
The results show that CBAM exposure is product-specific and channel-driven. Processed tuna is the most exposed because aluminium packaging dominates its wedge. Shrimp exposure reflects both electricity and cold-chain contributions. Whitefish exposure is mainly electricity-driven. Fresh tilapia remains the least exposed under the same framework.
These patterns point to product-specific abatement priorities. For tuna, the priority is packaging redesign and higher recycled content with credible documentation. For shrimp, the priority is processing energy efficiency and operational improvements in cold chain. For whitefish, the priority is securing lower-carbon electricity through credible instruments. For tilapia, monitoring and incremental efficiency support compliance readiness at a low cost.
Commercial parameters shape short-run outcomes. Lower pass-through reduces the portion of upstream carbon costs reflected in the CIF unit price. Lower demand sensitivity reduces import contraction for a given price change. These levers can manage transition risk, but they do not reduce embedded emissions. Durable exposure reduction comes from shrinking the dominant wedge component for each product.
The policy comparison supports tiered low-carbon certification when it accelerates the verified adoption of cleaner electricity, lower-carbon packaging, and improved cold-chain practices. Certification designs also preserve market access more efficiently than uniform surcharges under the model’s adoption paths. Public policy can amplify firm action by lowering verification costs and supporting channel-specific upgrades through targeted finance and technical assistance.
6. Conclusions
This study compares low-carbon certification and tariff-like carbon surcharges as alternative border policy tools affecting China’s seafood exports to the EU and the UK. Using a transparent product-level wedge → price → quantity mapping embedded in a recursive dynamic GTAP framework, we track how three upstream channels, processing electricity, aluminium packaging, and cold-chain operations, translate into border price pressure and trade outcomes in the short run and how technology adoption can reduce wedge drivers over time in the medium run.
In the static mapping, exposure is product-specific and channel-driven. Processed tuna faces the largest revenue loss because aluminium packaging dominates its wedge, while shrimp and whitefish are driven mainly by electricity (with a secondary cold-chain contribution for shrimp). Fresh tilapia remains the least exposed line under the same framework. In the dynamic simulations, coastal and inland groupings differ in welfare and cost-effectiveness outcomes, with inland outcomes being generally more adverse under tariff-only surcharges in the reported calibration. Across policy blocks, certification performs better than uniform surcharges when it accelerates verified adoption, thereby reducing wedge drivers; certification with incentives delivers the strongest joint outcome for export-share retention and emission reduction.
This paper contributes a replicable bridge between supply-chain drivers that firms can influence (electricity procurement, packaging recycled content, and cold-chain performance) and the trade outcomes that matter for policy evaluation (border prices, quantities, revenue, and welfare). By keeping parameters explicit and separating channel wedges, the framework clarifies why border measures can affect seafood product forms unevenly and why certification performance depends on whether it targets the dominant channel for each product.
Practical implications follow from the channel decomposition. For tuna, the priorities are packaging decarbonization and credible documentation of recycled content. For shrimp, processing electricity and cold-chain upgrades matter most. For whitefish, access to lower-carbon electricity and documentation is central. For tilapia, monitoring and incremental efficiency can support compliance readiness at a low cost. Certification is most effective when verification costs are manageable and when measured reductions translate into meaningful rate differentials; incentives can further improve uptake when investment costs and adoption frictions are binding.
This study does not model downstream retail margins, exchange-rate dynamics, or explicit diversion of exports to third markets. This omission likely overstates the EU/UK market revenue losses because exporters can reallocate part of the affected volume to non-EU destinations when relative prices change. Several process-intensity inputs rely on best-available analogues where seafood-specific estimates are limited; we therefore emphasise bounded parameter ranges and sensitivity analysis when interpreting level results.
Author Contributions
Conceptualization, X.M. and Z.L. Methodology, X.M. Software, X.M. Validation, X.M. Formal analysis, X.M. Investigation, X.M. Resources, X.M. Data curation, X.M. Writing—original draft preparation, X.M. Writing—review and editing, X.M. and Z.L. Visualization, X.M. Supervision, Z.L. Project administration, X.M. and Z.L. Funding acquisition, Z.L. All authors have read and agreed to the published version of the manuscript.
Funding
This research was funded by the Major Research Project of the National Social Science Fund of China, grant number 22VHQ006.
Institutional Review Board Statement
Not applicable.
Informed Consent Statement
Not applicable.
Data Availability Statement
The data presented in this study are available on request from the corresponding author.
Conflicts of Interest
The authors declare no conflicts of interest. The funders had no role in the design of the study, the collection, analysis, or interpretation of data, the writing of the manuscript, or the decision to publish the results.
References
- Monjon, S.; Quirion, P. A Border Adjustment for the EU ETS: Reconciling WTO Rules and Capacity to Tackle Carbon Leakage. Energy Policy 2011, 11, 1212–1225. [Google Scholar] [CrossRef] [Scilit]
- Leonelli, G.C. Export Rebates and the EU Carbon Border Adjustment Mechanism: WTO Law and Environmental Objections. J. World Trade 2022, 56, 963–984. [Google Scholar] [CrossRef] [Scilit]
- Bellora, C.; Fontagné, L. EU in Search of a Carbon Border Adjustment Mechanism. Energy Econ. 2023, 123, 106673. [Google Scholar] [CrossRef] [Scilit]
- Durán, G.M. Securing Compatibility of Carbon Border Adjustments with the Multilateral Climate and Trade Regimes. Int. Comp. Law Q. 2023, 72, 73–103. [Google Scholar] [CrossRef] [Scilit]
- European Commission. European Commission Carbon Border Adjustment Mechanism: Questions and Answers; European Commission: Brussels, Belgium, 2023. [Google Scholar]
- Branger, F.; Quirion, P. Would Border Carbon Adjustments Prevent Carbon Leakage and Heavy Industry Competitiveness Losses? Insights from a Meta-Analysis of Recent Economic Studies. Ecol. Econ. 2014, 99, 29–39. [Google Scholar] [CrossRef] [Scilit]
- Peters, G.P.; Minx, J.C.; Weber, C.L.; Edenhofer, O. Growth in Emission Transfers via International Trade from 1990 to 2008. Proc. Natl. Acad. Sci. USA 2011, 108, 8903–8908. [Google Scholar] [CrossRef] [Scilit]
- Duarte, R.; Pinilla, V.; Serrano, A. Factors Driving Embodied Carbon in International Trade: A Multiregional Input–Output Gravity Model. Econ. Syst. Res. 2018, 30, 545–566. [Google Scholar] [CrossRef] [Scilit]
- Yang, C.; Yan, X. Impact of Carbon Tariffs on Price Competitiveness in the Era of Global Value Chain. Appl. Energy 2023, 336, 120805. [Google Scholar] [CrossRef] [Scilit]
- Goldberg, L.S.; Hellerstein, R. A Structural Approach to Identifying the Sources of Local-Currency Price Stability. Rev. Econ. Stud. 2007, 81, 691–727. [Google Scholar] [CrossRef] [Scilit]
- Aron, J.; Macdonald, R.; Muellbauer, J. Exchange Rate Pass-Through in Developing and Emerging Markets: A Survey of Conceptual, Methodological and Policy Issues, and Selected Empirical Findings. J. Dev. Stud. 2014, 50, 101–143. [Google Scholar] [CrossRef] [Scilit]
- Bogmans, C. The Power of Prices: How Fast Do Commodity Markets Adjust to Shocks? International Monetary Fund: Washington, DC, USA, 2024. [Google Scholar]
- Mc Daniel, C.A.; Balistreri, E.J. A Review of Armington Trade Substitution Elasticities. Écon. Int. 2003, 9495, 301–313. [Google Scholar] [CrossRef] [Scilit]
- Simonovska, I.; Waugh, M.E. The Elasticity of Trade: Estimates and Evidence. J. Int. Econ. 2014, 92, 34–50. [Google Scholar] [CrossRef] [Scilit]
- Imbs, J.; Mejean, I. Trade Elasticities. Rev Int. Econ. 2017, 25, 383–402. [Google Scholar] [CrossRef] [Scilit]
- Gagnon, P.; Pham, A.; Cole, W.; Hamilton, A.; Awara, S.; Barlas, A.; Brown, M.; Brown, P.; Carag, V.; Cohen, S.; et al. 2024 Standard Scenarios Report: A U.S. Electricity Sector Outlook; National Renewable Energy Laboratory (NREL): Golden, CO, USA, 2024.
- Niero, M.; Manzardo, A. Case Study–Packaging. In Life Cycle Assessment: A Metric for The Circular Economy; The Royal Society of Chemistry: London, UK, 2021. [Google Scholar]
- Yakymchuk, A.; Ivanenko, I. Food Packaging Evolution in the Context of Environmental and Economic Sustainability; Silesian University of Technology Publishing House: Gliwice, Poland, 2025. [Google Scholar]
- Andersen, S.O.; Bandarra, E.; Bhushan, C.; Borgford-Parnell, N.; Chen, Z.; Christensen, J.M.; Devotta, S.; Dhasan, M.L.; Dreyfus, G.B.; Dulac, J.; et al. Cooling Emissions and Policy Synthesis Report: Benefits of Cooling Efficiency and the Kigali Amendment; The UN Environment Programme: Nairobi, Kenya, 2020. [Google Scholar]
- Meng, X.; He, Y.; He, L.; Zhao, C.; Wang, L.; You, W.; Zhu, J. A Review of the Energy-Saving Potential of Phase Change Material-Based Cascaded Refrigeration Systems in Chinese Food Cold Chain Industry. Energies 2024, 17, 4762. [Google Scholar] [CrossRef] [Scilit]
- Iyer, P.; Robb, D. Cold Chain Optimisation Models: A Systematic Literature Review. Comput. Ind. Eng. 2025, 204, 110972. [Google Scholar] [CrossRef] [Scilit]
- Chen, C.; Jiang, Z.; Li, N.; Wang, H.; Wang, P.; Zhang, Z.; Zhang, C.; Ma, F.; Huang, Y.; Lu, X. Advancing UN Comtrade for Physical Trade Flow Analysis: Review of Data Quality Issues and Solutions. Resour. Conserv. Recycl. 2022, 186, 106526. [Google Scholar] [CrossRef] [Scilit]
- Petropoulos, F.; Akkermans, H.; Aksin, O.Z.; Ali, I.; Babai, M.Z.; Barbosa-Povoa, A.; Battaïa, O.; Besiou, M.; Boysen, N.; Brammer, S.; et al. Operations & Supply Chain Management: Principles and Practice. Int. J. Prod. Res. 2026, 64, 330–513. [Google Scholar] [CrossRef] [Scilit]
- Naik, G.; Suresh, D.N. Challenges of Creating Sustainable Agri-Retail Supply Chains. IIMB Manag. Rev. 2018, 30, 270–282. [Google Scholar] [CrossRef] [Scilit]
- Zhang, W.; Sovacool, B.K. The “Triple Burden” Effect and “Pressure-Opportunity Paradox” of Net-Zero Transitions: Exploring the Political Economy of Carbon Border Adjustment Mechanism (CBAM) Implementation in the Global South. Energy Strategy Rev. 2025, 62, 101913. [Google Scholar] [CrossRef] [Scilit]
- Boessenkool, K.; Moffatt, M.; Cosbey, A.; Bernstein, M. Border Carbon Adjustments-Four Practical Challenges. Can. Tax J. 2022, 70, 41. [Google Scholar]
- Erdogdu, E. The Carbon Border Adjustment Mechanism: Opportunities and Challenges for Non-EU Countries. WIREs Energy Environ. 2025, 14, e70000. [Google Scholar] [CrossRef] [Scilit]
- Leal-Arcas, R.; Faktaufon, M.; Kyprianou, A. A Legal Exploration of the European Union’s Carbon Border Adjustment Mechanism. Eur. Energy Environ. Law Rev. 2022, 31, 223–240. [Google Scholar] [CrossRef] [Scilit]
- Weishaar, S.E. EU CBAM Implementation Challenges. In Environmental Tax Reforms for a Just Energy Transition; Edward Elgar Publishing: Cheltenham, UK, 2025; pp. 114–128. [Google Scholar]
- Ismayilzada, F. The EU Carbon Border Adjustment Mechanism and WTO Law-Is the EU’s CBAM Compatible with WTO Regulations? Master’s Thesis, Lund University, Lund, Sweden, 5 June 2025. [Google Scholar]
- Kim, Y.; Zhang, Q. Modeling of Energy Intensity in Aquaculture: Future Energy Use of Global Aquaculture. J. Aquac. Fish. Sci. 2018, 2, 60–89. [Google Scholar]
- Gobi, G.; Iswarya, K.; Sundar, S. Cold Chain Management for Seafood Logistics and Storage. In Advanced Fish Processing Technology Safety and Quality Control; Elite Publishing House: Delhi, India, 2025; pp. 221–234. ISBN 978-93-7108-595-3. [Google Scholar]
- Rong, F.; Liu, H.; Zhu, J.; Qin, G. Carbon Footprint of Shrimp (Litopenaeus vannamei) Cultured in Recirculating Aquaculture Systems (RAS) in China. J. Clean. Prod. 2025, 510, 145606. [Google Scholar] [CrossRef] [Scilit]
- Hallren, R.; Riker, D. An Introduction to Partial Equilibrium Modeling of Trade Policy; Economics Working Paper Series; U.S. International Trade Commission: Washington, DC, USA, 2017.
- Shah, S.A.; Garg, B. Dynamics of Exchange Rate Pass-through: The Role of Pricing Strategies and Economic Shocks. Econ. Model. 2026, 154, 107353. [Google Scholar] [CrossRef] [Scilit]
- Auer, R.; Chaney, T. Exchange Rate Pass-Through in a Competitive Model of Pricing-to-Market. J. Money Credit Bank 2009, 41, 151–175. [Google Scholar] [CrossRef] [Scilit]
- Álvarez-Diez, S.; Baixauli-Soler, J.S.; Lozano-Reina, G.; Rodríguez-Linares Rey, D. Block Connectedness between the EU-ETS and Corporate Returns: Evidence from High- and Low-Emission Firms. J. Commod. Mark. 2025, 40, 100511. [Google Scholar] [CrossRef] [Scilit]

Disclaimer/Publisher’s Note: The statements, opinions and data contained in all publications are solely those of the individual author(s) and contributor(s) and not of MDPI and/or the editor(s). MDPI and/or the editor(s) disclaim responsibility for any injury to people or property resulting from any ideas, methods, instructions or products referred to in the content. |
© 2026 by the authors. Licensee MDPI, Basel, Switzerland. This article is an open access article distributed under the terms and conditions of the Creative Commons Attribution (CC BY) license.