


Abstract
Aquaculture faces rising climate-change risks, while photovoltaic power generation requires substantial land resources, underscoring the need for multifunctional land use in the energy transition. Aquavoltaics—combining aquaculture with solar power—has emerged, and its success depends on stakeholder cooperation. Using white shrimp aquaculture in Taiwan as a case study, this study examines four cooperation schemes—a sole-investment scheme, a photovoltaic-led leasing scheme, a landowner lease-back scheme, and a separated aquaculture and photovoltaic operation scheme—across six aquavoltaic types. Cost–benefit and data envelopment analyses assess the economic returns and operational efficiency of aquaculture operators and photovoltaic companies under each scheme. The results show that all schemes offer profit potential but differ in efficiency and income distribution. The landowner lease-back scheme is most efficient for aquaculture operators, while photovoltaic companies operate near the efficiency frontier in all schemes. The findings highlight that cooperation design shapes the economic feasibility, efficiency, and livelihood impact of aquavoltaic systems, providing a useful reference for future policy and model design.
Key Contribution:
This study provides the first systematic comparison of stakeholder cooperation schemes in aquavoltaic systems by integrating cost–benefit analysis and data envelopment analysis. The findings reveal how different cooperation structures shape cost allocation, operational efficiency, and risk asymmetry between aquaculture operators and photovoltaic developers.
1. Introduction
Climate change has harmed the ecosystem and the grain production system [1,2]. FAO statistics indicate that global farmed shrimp production increased from approximately 1.22 million tons in 2000 to 6.74 million tons in 2022, representing an average annual growth rate of about 7.9%. Pacific white shrimp (Litopenaeus vannamei) now accounts for approximately 80–83% of global farmed shrimp production [3]. Despite rapid global gains, Taiwan’s shrimp production has not kept pace. In 2006, Taiwan produced 22,000 tons; by 2024, output declined to 14,285 tons. Extreme heat and typhoon-driven rainfall events can impair the physiological condition and immune defenses of white shrimp, thereby increasing production volatility and mortality [4,5]. In Taiwan, sea surface temperature in the Taiwan Strait has increased by approximately 0.63 °C per decade since 2012. Projections suggest that typhoon rainfall intensity may increase by ~35%, and wet-season precipitation along the southern coast may rise by ~30% [6], further elevating thermal, flooding, and water-quality risks to shrimp ponds. These changes collectively exacerbate the climate vulnerability of Taiwan’s white shrimp aquaculture. To address these issues, the Taiwan government is promoting an aquavoltaics policy to encourage interdisciplinary cooperation. This aims to advance facility and enterprise aquaculture while strengthening the industry’s ability to respond to climate and global market challenges [7,8].
Greenhouse gas emissions, primarily from fossil fuels, are major contributors to climate change [9]. To mitigate the adverse effects of greenhouse gases, the sustainable development goal of achieving net-zero carbon emissions by 2050 has become a global consensus. Renewable energy is one of the most critical strategies for achieving net zero. The United Nations defines renewable energy as energy derived from nature. Common renewable energy sources include solar, wind, geothermal, hydroelectric, tidal, and biomass. According to International Renewable Energy Agency (IRENA) Statistics 2025 [10], global renewable energy installed capacity reached 4442 GW in 2024 (up from 3861 GW in 2023, a net increase of about 582 GW). Solar energy capacity reached 1859 GW in 2024 (up from 1407 GW in 2023, a net increase of about 452 GW), underscoring the continued dominance of solar in recent renewable capacity expansion [10].
Solar power generation technology dates back to the late 19th century. In 1876, Willoughby Smith observed the photoelectric effect [11]. Bell Laboratories invented the first efficient solar cell in 1954 [12]. The oil crisis of the 1970s increased demand for alternative energy sources and brought solar technologies into the commercial stage [13]. After the 1990s, costs declined with technological advances, accelerating deployment [14]. According to SolarPower Europe [15], the levelized cost of solar electricity fell from 359 USD/MWh in 2009 to 36 USD/MWh in 2022, contributing to rapid capacity growth; global installed solar capacity has now exceeded 1000 GW.
Solar power is land-intensive because it relies on solar irradiance and typically requires substantially more land than fossil-fuel power—reported estimates suggest at least ~20 times more land per gigawatt of installed capacity [16,17,18]. To address land constraints, many governments have promoted multi-functional land-use strategies that combine photovoltaics with other land uses (e.g., agriculture, forestry, fisheries, and livestock) to reduce land-use conflicts and improve overall land productivity [19,20,21,22,23].
To align with global renewable energy trends, Taiwanese enterprises have joined RE100. Taiwan’s government aims to have renewable energy comprise 20% of power generation by 2025, targeting 20 GW of installed solar capacity [24,25]. With limited land and a dense population, solar photovoltaics should be planned for multifunctional spaces. The government is promoting aquavoltaics, the combination of aquaculture and solar power, to diversify land use. This policy can more effectively upgrade aquaculture and accelerate energy transition [26].
There are two main aquavoltaic modes in Taiwan: ground-type for outdoor aquaculture and facility-type for indoor aquaculture. National regulations allow solar devices to cover up to 40% of ground-type and up to 80% of facility-type sites. According to this study [8]. Ground-type aquavoltaics include floating, foundation-pile, and embankment types; facility aquavoltaics include indoor, semi-indoor, and greenhouse types. An economic feasibility study on white shrimp aquaculture in these six modes found all to be economically feasible. However, the initial investment is high (NTD 32–85 million; for reference, 1 USD ≈ 31 NTD, average in 2023), making it difficult for most aquaculturists to adopt aquavoltaics without outside investment. Ioakeimidis et al. [27] noted that combining renewable energy and aquaculture is easier with government or company investment.
Aquavoltaics in Taiwan involves complex, cross-sector collaboration. Typically, aquaculture operators or landowners supply land, which photovoltaic companies then lease for aquavoltaic development. Professional management firms often help adopt and operate aquaculture technologies. Multiple stakeholders connect mainly through commercial cooperation. The design of these cooperation schemes shapes investment, operational risks, and income distribution.
International research on cross-sector cooperation examines collaboration through supply chains [28,29], technical knowledge sharing [30], and infrastructure sharing [27,31]. These studies identify profit potential but note that cooperation structures and benefit-sharing are key to performance and stability. Most past work focuses on single industries or general cross-sector cases. There is little empirical evidence on how business cooperation schemes affect performance and efficiency for aquavoltaic stakeholders. To address this gap, this study investigates the following research questions (RQs):
- RQ1
- How do different aquavoltaic cooperation schemes affect the economic performance of aquaculture operators and photovoltaic firms (e.g., NPV, IRR, and payback period)?
- RQ2
- How do operational efficiency outcomes differ across cooperation schemes under CRS and VRS DEA specifications for aquaculture operators and photovoltaic firms?
- RQ3
- To what extent can heterogeneity in investment allocation and risk-sharing mechanisms explain the observed differences in profitability and efficiency across schemes?
To answer RQ1–RQ3, the study combines cost–benefit and data envelopment analysis to compare the economic performance and efficiency of aquaculture operators and photovoltaic firms across aquavoltaic types. From a stakeholder and fisheries governance view, the study clarifies efficiency and income differences among schemes and offers insights for policy and cooperation model design.
2. Materials and Methods
2.1. Data Sources
This study was based on the previous research, “Economic Feasibility Assessment of Aquavoltaics—Taking White Shrimps As an Example.” [8]. It used this research’s framework to examine the economic feasibility of cultivating white shrimps using different aquavoltaic modes in Taiwan. However, the transformation of most aquavoltaics currently relies on commercial cooperation between interested parties. Hence, this study analyzed the operational performance of various commercial Cooperation Schemes and used the findings of a previous study as data sources for subsequent operational performance evaluations. The findings from the previous study were referenced as follows: (1) research location and hours of sunshine, (2) operation, investment costs, and other information on six aquavoltaic modes, and (3) production management data for indoor and outdoor white shrimp aquaculture in the Tainan area.
2.1.1. Research Place
Solar power generation efficiency is influenced by solar radiation, hours of sunshine, and latitude [32,33,34,35]. Tainan City is a key area for aquavoltaic development in Taiwan. Its approved aquavoltaic area covers 5950 hectares, making it the administrative region with the largest such area. Thus, this study selected Tainan City as the research site. According to data from the Taiwan Central Weather Administration, the average daily insolation in Tainan City over the past five years has been 16.1 MJ/m2. Based on this data, the estimated daily generation capacity is 3.5 kWh/day/kWp.
2.1.2. Aquavoltaics Operation Data
This study analyzed the operational performance of six aquavoltaic modes under different Cooperation Schemes, with an operational scale of 1 hectare. Based on previous research, the available aquaculture area for aquavoltaics was influenced by factors such as water source, geographical location, regulations, and other considerations. For ground-type aquavoltaics, the available aquaculture area ranged from 0.6 to 0.8 hectares, whereas for facility aquavoltaics, the available area was approximately 0.95 hectares. Regarding initial investments, ground-type aquavoltaics required investments ranging from NTD 32.66 million to NTD 37.64 million. Among facility aquavoltaics, greenhouse aquavoltaics had the lowest initial investment at NTD 74.227 million, while fully indoor aquavoltaics required the highest investment at NTD 85.865 million [8].
2.1.3. Production Management Data on White Shrimp Aquaculture
White shrimp production and management data were classified into biological and economic parameters. Aquaculture operators commonly adopt stocking density as a risk management strategy [36,37,38]. Due to greater exposure to climatic and environmental risks, outdoor aquaculture systems typically use lower stocking densities, which were set at 800,000 postlarvae per hectare in this study. In contrast, indoor or facility-based aquaculture systems offer more controlled rearing conditions; therefore, a higher stocking density of 1 million postlarvae per hectare was assumed.
Regarding survival rates, outdoor white shrimp aquaculture was assumed to have a relatively low survival rate of 15% (The assumed survival rates were applied solely as analytical assumptions for the purpose of relative comparison across different cooperation schemes, and were not intended to assess compliance with existing aquavoltaic regulations, which are currently based on unit-area production thresholds rather than survival rate criteria.). whereas facility-based systems, benefiting from improved environmental control, were assumed to achieve a minimum survival rate of 30%. Feed conversion ratios (FCRs) were assumed to be similar across the two aquaculture systems, and a value of 1.8 was adopted for the analysis. The price of white shrimp postlarvae in Taiwan varies considerably, ranging from NTD 0.03 to 0.06 per individual; accordingly, a unit price of NTD 0.04 per postlarva was applied in this study. Feed costs were estimated at NTD 50 per kilogram.
All parameter values were determined based on interviews with aquaculture operators conducted during the study period and prevailing aquaculture practices. These values were validated using a triangulation approach: we compared the ranges reported by different respondent groups and retained values within the overlapping intervals; we further cross-checked the resulting assumptions against available secondary sources (e.g., government extension materials and industry technical reports) and verified whether their implied yield levels were consistent with local production conditions. These parameters were used as analytical assumptions for comparative purposes.
2.2. Stakeholders and Aquavoltaic Cooperation Schemes
From April to June 2023, this study collected empirical insights on aquavoltaic practices in Taiwan through semi-structured interviews with key stakeholders (N = 20). Interviewees included aquaculture farmers (both owner–operators, n = 3, and tenant farmers, n = 4), photovoltaic companies (n = 7), landowners (n = 3), and aquaculture consulting firms (n = 3). The interviews covered prevailing cooperation arrangements, investment allocation, and operational responsibilities in aquavoltaic projects. Based on the interview results, four major aquavoltaic cooperation schemes currently observed in Taiwan were identified and subsequently adopted as comparative scenarios for the cost–benefit analysis and data envelopment analysis.
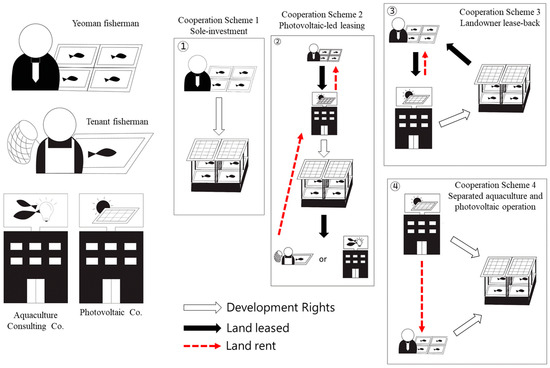
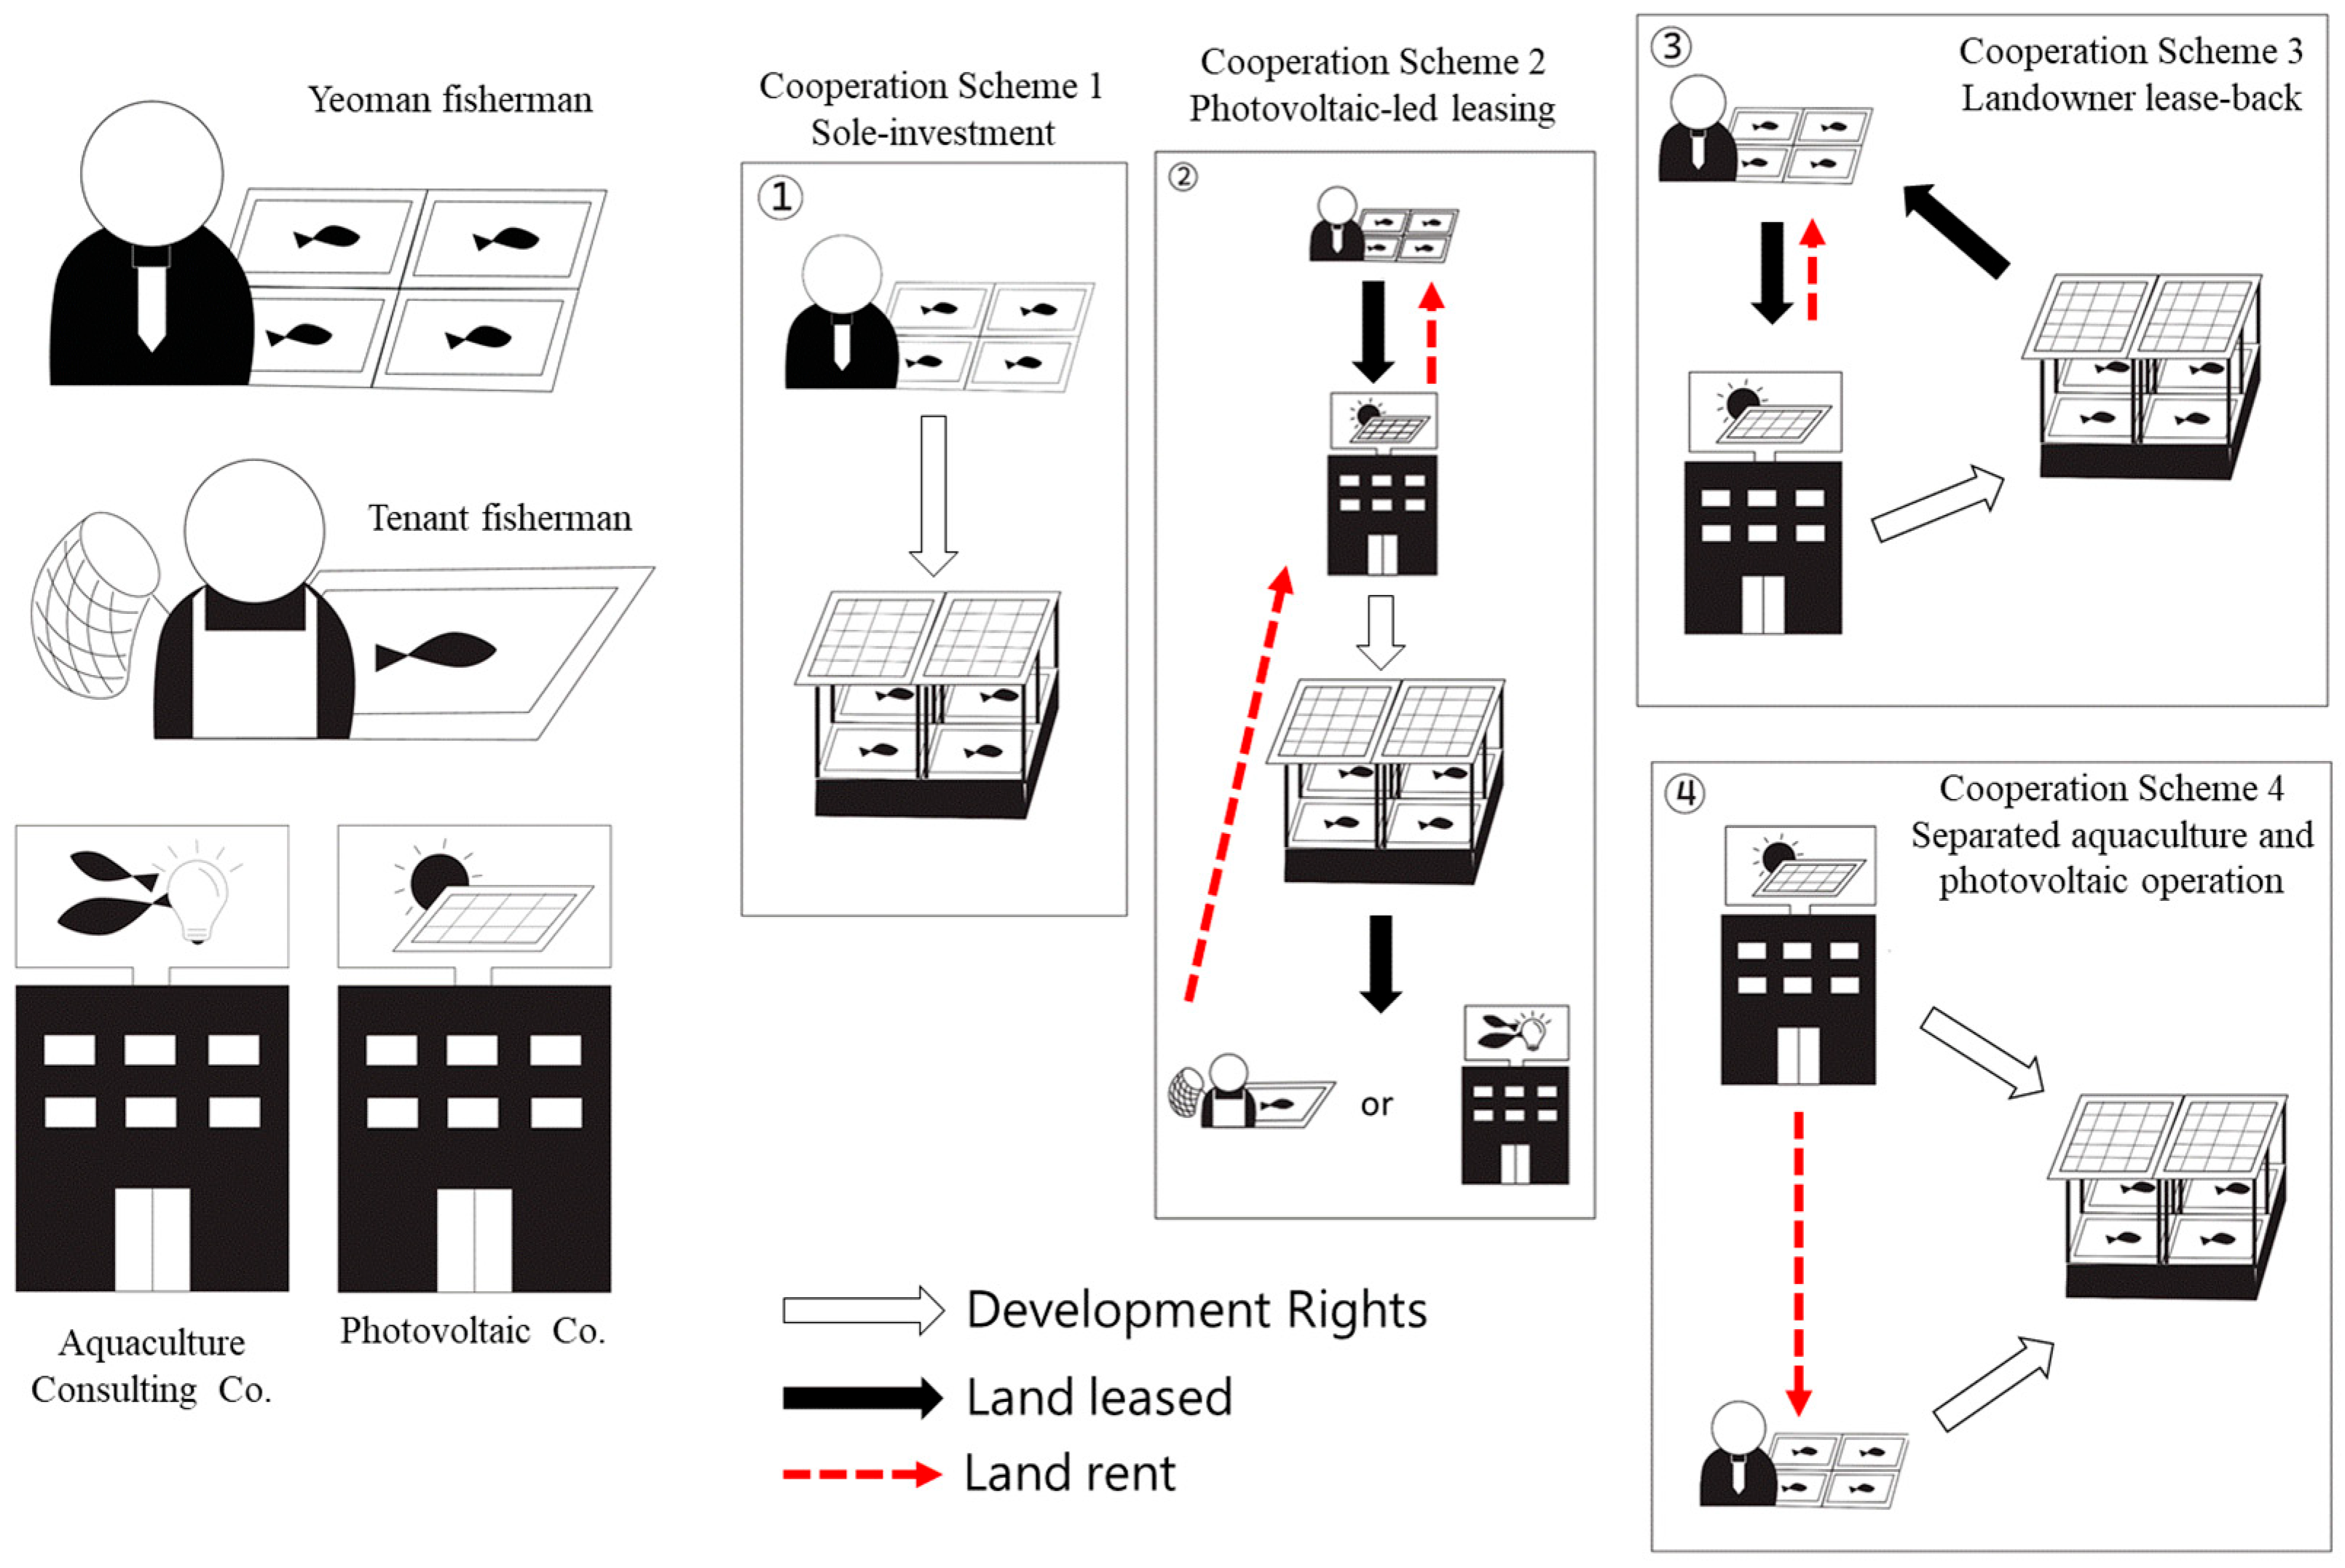
Under these cooperation schemes, stakeholders assume different investment responsibilities according to their roles. The main investment items include buildings and solar carriers, solar panels and inverters, farming ponds, and aquaculture equipment. Figure 1 and Table 1 summarize the investment items, capital shares, initial investment amounts, and depreciation costs of each stakeholder across the four cooperation schemes and six aquavoltaic type.
Figure 1.
The four cooperation schemes in aquavoltaics. Note: The stakeholders involved include yeoman farmers (owner–operators), tenant farmers, photovoltaic companies, landowners, and aquaculture consulting firms. The four cooperation schemes comprise: ① the sole-investment scheme, in which a single entity undertakes both photovoltaic development and aquaculture operation; ② the photovoltaic-led leasing scheme, where photovoltaic companies lease land from landowners, invest in photovoltaic facilities and pond construction, and subsequently sublease the site to aquaculture operators; ③ the landowner lease-back scheme, under which photovoltaic companies develop the aquavoltaic site and lease back aquaculture operation rights to landowners; and ④ the separated aquaculture and photovoltaic operation scheme, where aquaculture operators and photovoltaic companies independently invest in and operate their respective components. Arrows indicate development sequences and operational arrangements rather than financial flows.
Table 1.
Investment allocation and capital costs (initial investment and annual depreciation) by aquavoltaic type and cooperation scheme (aquaculture operator vs. photovoltaic company).
2.2.1. Cooperation Scheme 1: Sole-Investment Scheme
Under the sole-investment scheme, a single investor independently finances all investment items and is responsible for both photovoltaic operation and aquaculture production. Either the aquaculture operator (typically an owner–operator) or the photovoltaic company bears 100% of the investment across all items. For ground-based aquavoltaic systems, the initial investment ranges from NTD 32.66 million to NTD 37.64 million, with annual depreciation costs of approximately NTD 1.64–1.89 million. For facility-based aquavoltaic systems, the initial investment ranges from NTD 74.23 million to NTD 85.87 million, with annual depreciation costs of approximately NTD 3.78–4.36 million.
2.2.2. Cooperation Scheme 2: Photovoltaic-Led Leasing Scheme
In the photovoltaic-led leasing scheme, photovoltaic companies lease land from landowners and jointly plan aquavoltaic projects with tenant farmers or aquaculture consulting firms. Photovoltaic companies are the primary investors, covering solar carriers, solar panels, and inverters, as well as pond renovation for farming, whereas aquaculture operators separately invest in aquaculture equipment. After project construction is completed, the aquavoltaic site is subleased by the photovoltaic company to aquaculture operators for production activities.
2.2.3. Cooperation Scheme 3: Landowner Lease-Back Scheme
The landowner lease-back scheme is similar to Cooperation Scheme 2, except that the aquaculture operator is the landowner (owner–operator). Photovoltaic companies negotiate aquavoltaic type and pond designs with landowners, and after project development is completed, aquaculture operation rights are leased back to the landowners. Under both the photovoltaic-led leasing scheme and the landowner lease-back scheme, aquaculture operators only invest in aquaculture equipment. For ground-based aquavoltaic systems, the initial investment is approximately NTD 0.08 million, with annual depreciation costs of NTD 0.016 million; for facility-based systems, the initial investment is approximately NTD 0.475 million, with annual depreciation costs of NTD 0.095 million.
2.2.4. Cooperation Scheme 4: Separated Aquaculture and Photovoltaic Operation Scheme
The separated aquaculture and photovoltaic operation scheme is relatively uncommon (observed in only one interviewed farm; 1 case, 14.3% of interviewed farms, n = 7) and is mainly observed among owner–operators who previously engaged in facility-based aquaculture. Under this scheme, aquaculture operators are responsible for investing in and upgrading farming ponds or aquaculture facilities, while photovoltaic companies separately invest in solar carriers and photovoltaic equipment. Compared with the landowner lease-back scheme, aquaculture operators bear higher initial investment costs. For example, under a fully indoor aquavoltaic configuration, aquaculture operators invest approximately NTD 11.12 million, whereas photovoltaic companies invest approximately NTD 74.75 million.
2.3. Operation Performance Analysis
The aquaculture industry is recognized as the fastest-growing food production system of the 21st century [39,40,41]. Aquaculture-producing countries have been promoting and developing new systems and technologies through policies aimed at improving productivity. These efforts are evaluated for their effectiveness in research and development (R&D) and in policy promotion through cost-effectiveness analyses [42,43,44,45]. Additionally, data envelopment analysis (DEA) has emerged as a widely used method for efficiency evaluation in the aquaculture industry. It is frequently used to assess the technological and economic efficiency of aquaculture systems [46,47,48,49]. This study evaluated the operational performance of aquavoltaic cooperation schemes using cost-effectiveness analysis and data envelopment analysis.
2.3.1. Cost-Effectiveness Analysis
Cost-effectiveness analysis is often employed to evaluate investment projects or the financial performance of enterprise management. Costs are divided into equipment depreciation costs and operational costs. Equipment depreciation cost is calculated based on the equipment’s depreciable life from the initial investment, using the straight-line depreciation method in this study. Operational costs refer to all aquaculture expenses incurred during the operation of aquavoltaics. Income is categorized into aquaculture income and electricity sales income.
For the cost-effectiveness analysis, the assessment indexes selected in this study include the Benefit–Cost Ratio (BCR), Profit Rate (PR), Net Present Value (NPV), Internal Rate of Return (IRR), and Payback Period (PBP), as referenced in previous studies [50,51,52]. BCR and PR, calculated using total cost, net income, and total income, are used to assess enterprise profitability. The time value of money is considered when evaluating NPV and IRR [53], utilizing cash flow and discount rates. Given Taiwan’s 2023 consumer price index (CPI) of 2.5% and bond yield of 1.54%, the discount rate in this study was set at 5%. The discount rate was set at 5% to reflect a conservative benchmark consistent with the current macroeconomic conditions during the study period (e.g., inflation and government bond yields). Scheme-level comparison was performed using a unified set of baseline hypotheses. Microsoft Office Excel® was used to compute the aforementioned indexes. The calculation formulas for all indexes are as follows:
Net revenue (NR):
- n: the nth year
- : Net revenue in the nth year
- : Total return in the nth year
- : Operating expense in the nth year
- : Depreciation cost in the nth year
Benefit–cost ratio (BCR):
- n: the nth year
- : Benefit–cost ratio in the nth year
- : Net revenue in the nth year
- : Total cost in the nth year
Profit rate (PR):
- n: the nth year
- : Profit rate in the nth year
- : Net revenue in the nth year
- : Total revenue in the nth year
Cash flow (CF):
- n: the nth year
- : Cash flow in the nth year
- : Total return in the nth year
- : Operating expense in the nth year
Net present value (NPV):
- : Cash flow in the nth year
- IIC: Initial investment cost
- : discount rate
- the nth year
Internal rate of return (IRR):
When NPV was 0, the discount rate obtained is IRR.
Payback period (PBP):
- PBP: Payback period of the investment project
- IIC: Initial investment cost
- CF: Cash flow in the nth year
2.3.2. Data Envelopment Analysis (DEA)
Data Envelopment Analysis (DEA) is a non-parametric linear programming approach widely applied to evaluate the relative efficiency of decision-making units (DMUs) with multiple inputs and outputs, without requiring a predefined production function [49,54]. DEA efficiency scores range from 0 to 1, where a value of 1 indicates that a DMU lies on the efficient frontier relative to other units in the sample.
In this study, DEA was employed to examine the relative operational efficiency of different aquavoltaic cooperation schemes. Each DMU was defined as a unique combination of cooperation scheme × aquavoltaic type × stakeholder role (aquaculture operator vs. photovoltaic company), yielding 48 DMUs in total (4 schemes × 6 aquavoltaic types × 2 stakeholder roles) and enabling systematic comparison across schemes and configurations under a consistent analytical structure (Supplementary Materials). This DMU construction is adopted because the study’s objective is to compare scheme-level economic performance across aquavoltaic configurations for each stakeholder role under a consistent set of inputs and outputs, rather than to estimate a common production function across fully homogeneous farms.
The input variables included initial investment costs and total operating costs, reflecting capital intensity and cost burdens borne by each stakeholder. The output variables comprised annual revenue and NPV. We include annual revenue and NPV as complementary outputs to capture short-term earning capacity and discounted long-term value creation, respectively, while maintaining consistency with the CBA framework. Revenue reflects contemporaneous cash-generation performance, whereas NPV summarizes intertemporal net benefits under the assumed discount rate. These variables were selected to ensure consistency with the cost–benefit analysis framework and to reflect economic performance rather than physical production outcomes.
Both constant returns to scale (CRS) and variable returns to scale (VRS) DEA models were estimated to account for potential scale effects and to decompose overall technical efficiency into pure technical efficiency and scale efficiency. The CRS model provides overall technical efficiency (OTE), while the VRS model yields pure technical efficiency (PTE) net of scale effects; the ratio of CRS to VRS efficiency is interpreted as scale efficiency (SE). Reporting both CRS and VRS, therefore, allows us to determine whether inefficiency is primarily driven by operational practices or by operating at a non-optimal scale. All DEA computations were conducted using the DEAP version 2.1 software package.
3. Results
3.1. Cost Structure and Operating Costs
Table 2 summarizes the fixed and variable cost structures across different aquavoltaic types under the four aquavoltaic cooperation schemes. Fixed costs include depreciation, land rental payments, and interest. In contrast, variable costs include production-related expenditures for white shrimp farming, such as postlarvae, feed, labor, electricity, repairs, and other operating costs.
Table 2.
The cost structure (fixed cost, variable cost, and total cost) by aquavoltaic type and cooperation scheme (aquaculture operator vs. photovoltaic company).
The results indicate clear differences in cost allocation between aquaculture operators and photovoltaic companies across cooperation schemes. Under the sole-investment scheme (Scheme 1), the operator bears all investment and operating costs, resulting in the highest annual total costs. In particular, the fully indoor aquavoltaic type exhibits the highest annual total cost, reaching approximately NTD 7.80 million.
Under the photovoltaic-led leasing scheme (Scheme 2) and the landowner lease-back scheme (Scheme 3), aquaculture operators primarily bear the costs of aquaculture equipment and production. Their annual total costs range from approximately NTD 0.74 to 2.23 million under Scheme 2 and NTD 0.80 to 2.70 million under Scheme 3, depending on the aquavoltaic type.
Under the separated aquaculture and photovoltaic operation scheme (Scheme 4), aquaculture operators additionally bear the costs associated with pond renovation or facility upgrades, resulting in annual total costs ranging from approximately NTD 0.80 to 2.70 million.
From the perspective of photovoltaic companies, annual total costs under Schemes 2 and 3 range from approximately NTD 2.45 to 5.76 million. In contrast, Scheme 4 represents the cooperation scheme with the lowest relative investment burden for photovoltaic companies, although absolute annual costs are higher, ranging from approximately NTD 2.39 to 5.09 million depending on the aquavoltaic type.
3.2. Revenue Structure and Cost–Benefit Analysis Results
Table 3 presents the annual operating revenue structures across different aquavoltaic types under the four cooperation schemes. The results show that only operators investing in photovoltaic facilities receive electricity sales revenue. Annual electricity revenue is approximately NTD 3.996 million for ground-based aquavoltaic types and NTD 7.505 million for facility-based aquavoltaic types.
Table 3.
The revenue composition (electricity sales, aquaculture revenue, land rental income, and total revenue) by aquavoltaic type and cooperation scheme.
Regarding aquaculture income, facility-based aquavoltaic types generate higher annual revenues than ground-based types, at approximately NTD 3.206 million and NTD 0.81–1.08 million, respectively. The composition of aquaculture income and land rental income varies across cooperation schemes. Under the photovoltaic-led leasing scheme (Scheme 2), photovoltaic companies receive rental income from subleasing the aquavoltaic site, whereas under the landowner lease-back scheme (Scheme 3) and the separated aquaculture and photovoltaic operation scheme (Scheme 4), aquaculture operators receive both aquaculture income and land rental income.
Table 4 and Table 5 present the cost–benefit analysis results for aquaculture operators and photovoltaic companies, respectively, under the four cooperation schemes. For aquaculture operators, the cooperation schemes exhibit clear differences in net present value (NPV), internal rate of return (IRR), payback period (PBP), benefit–cost ratio, and profit ratio, with the landowner lease-back scheme (Scheme 3) showing relatively superior overall performance, characterized by higher NPV and IRR values and shorter payback periods compared with other schemes. Scheme 3 performs best for aquaculture operators because farmers need to invest only in aquaculture equipment (NTD 0.08–0.475 million), while the photovoltaic partner bears most project development and photovoltaic capital costs. This allocation effectively shares risk and reduces farmers’ upfront financial burden, resulting in higher NPV/IRR and a shorter payback period.
Table 4.
Profitability indicators for aquaculture operators across four cooperation schemes and six aquavoltaic types (each cell reports: cash flow, BCR, profit ratio, NPV, IRR, payback period).
Table 5.
Profitability indicators for photovoltaic companies across four cooperation schemes and six aquavoltaic types (each cell reports: cash flow, BCR, profit ratio, NPV, IRR, payback period).
For photovoltaic companies, differences in benefit–cost ratios and profit ratios across cooperation schemes are relatively limited; however, when discount rates are considered, variations in NPV, IRR, and PBP across schemes remain evident.
3.3. Operational Efficiency of Aquaculture Operators and Photovoltaic Companies Under Different Cooperation Schemes
Building on the results of the cost–benefit analysis, this study further applies data envelopment analysis (DEA) to compare the relative operational efficiency of different aquavoltaic cooperation schemes. The DEA results under constant returns to scale (CRS), variable returns to scale (VRS), and scale efficiency (SE) are summarized in Table 6.
Table 6.
DEA efficiency scores for aquaculture operators and photovoltaic companies by cooperation scheme (CRSTE, VRSTE, and scale efficiency; mean ± SD).
For aquaculture operators, the sole-investment scheme (Scheme 1) and the photovoltaic-led leasing scheme (Scheme 2) exhibit relatively low efficiency levels under both CRS and VRS assumptions. In particular, under Scheme 1, the average CRSTE and VRSTE values are 0.380 ± 0.203 and 0.512 ± 0.320, respectively, indicating relatively low overall and pure technical efficiency. By contrast, efficiency scores under the landowner lease-back scheme (Scheme 3) increase substantially under both CRS and VRS models and approach the efficient frontier. The corresponding scale efficiency values are also relatively high, suggesting that aquaculture operators under Scheme 3 operate closer to the optimal scale.
For photovoltaic companies, efficiency levels remain consistently high across all cooperation schemes under both CRS and VRS models. The associated scale efficiency values are generally close to unity, indicating limited scale inefficiency. Although efficiency scores under the photovoltaic-led leasing scheme (Scheme 2) are relatively lower than those under Schemes 1, 3, and 4 (Table 6), they remain above 0.9, suggesting that differences in cooperation schemes exert only a minor influence on the operational efficiency of photovoltaic companies.
4. Discussion
This study systematically compares the operational performance and relative efficiency of aquaculture operators and photovoltaic companies under different aquavoltaic cooperation schemes using cost–benefit analysis and data envelopment analysis. The results reveal pronounced differences across cooperation schemes in cost allocation, profitability, and operational efficiency, with asymmetric patterns between aquaculture operators and photovoltaic companies. Building on these findings, the following discussion focuses on how alternative aquavoltaic cooperation schemes influence stakeholder incentives, risk-sharing arrangements, and governance-related decision-making.
4.1. Aquavoltaic Cooperation Schemes, Operational Incentives, and Risk-Sharing Mechanisms
Inter-firm cooperation is widely regarded as an important strategy for enhancing operational efficiency and competitive advantage; however, most existing studies focus on cooperation models within the same industry or along a shared value chain [29,55]. In contrast, aquavoltaics integrates two highly heterogeneous sectors—aquaculture and photovoltaic power generation—resulting in cooperation schemes that require cross-sectoral coordination and professional integration. Moreover, aquavoltaic cooperation frequently involves partnerships between firms and individual operators rather than purely inter-firm alliances. Previous studies have emphasized that the ability to share and integrate knowledge across sectors is a critical determinant of successful cross-industry collaboration [30]. The results indicate that Cooperation Scheme 3 demonstrates clear advantages for aquaculture operators in both cost–benefit performance and operational efficiency, suggesting that its cooperation structure provides stronger operational incentives for aquaculture participation. Under this scheme, aquaculture operators are predominantly owner–operators who can obtain income from shrimp production while simultaneously receiving land rental income. Moreover, their initial investment is largely limited to aquaculture equipment, resulting in relatively low capital exposure and reduced financial risk.
In contrast, tenant farmers and aquaculture consulting companies can only continue production at the original site under Cooperation Schemes 2. Although their required capital investment is comparatively low, they are exposed to higher production risks and often achieve profitability only at the break-even level. This finding highlights structural asymmetries in participation incentives and risk-bearing across different types of aquaculture operators under the current aquavoltaic institutional framework, which may, in turn, affect long-term operational stability.
The DEA results show that photovoltaic companies remain close to the efficiency frontier across all cooperation schemes (Table 6), consistent with several structural characteristics of the PV sector. In particular, because our DEA inputs are initial investment costs and total operating costs, and outputs are total revenues and NPV, PV projects are inherently capital-intensive but operationally standardized, leaving limited room for cross-scheme managerial inefficiency. In aquavoltaic projects, PV firms typically rely on replicable engineering, procurement, and construction (EPC) designs and routine O&M practices, which limit cross-project managerial heterogeneity in cost formation. Moreover, PV revenues and long-term returns are largely driven by contractual and regulation-constrained cash-flow mechanisms (e.g., grid-connection requirements and standardized electricity sales arrangements). At the same time, differences across cooperation schemes mainly affect the allocation of rents and risks between partners rather than PV production technology itself. Consequently, PV firms consistently achieve high economic efficiency scores, with limited variation across schemes.
In addition, field investigations suggest that aquaculture operators may adjust their production strategies in response to different cooperation schemes, such as adopting polyculture systems or engaging in seed production, to mitigate production risks and enhance revenue per unit area. These observations indicate that aquavoltaic cooperation schemes influence not only financial outcomes but also shape aquaculture management decisions and production behavior.
4.2. White Shrimp Aquaculture Under Aquavoltaic Systems: Economic and Operational Implications
Building on the discussion of cooperation schemes and stakeholder incentives, this subsection further examines the performance of white shrimp aquaculture under aquavoltaic systems by situating the results within existing domestic and international literature. Overall, the findings indicate that aquavoltaic shrimp farming demonstrates improved economic performance compared with conventional outdoor shrimp aquaculture in Taiwan, particularly in terms of cost structure and profitability.
Recent evidence from Taiwan suggests that conventional white shrimp farming faces persistent profitability constraints amid environmental variability and market pressures [56], while aquavoltaic configurations can improve economic outcomes by altering cost structures and income composition [8]. Building on this evidence, the present results suggest that aquavoltaic systems can partially alleviate this limitation. Even in ground-based aquavoltaic type, the benefit–cost ratio improves significantly relative to traditional outdoor systems, suggesting that aquavoltaics may enhance the economic resilience of shrimp farming amid climate and environmental uncertainty.
From an international perspective, studies in China and India reveal substantial variation in cost and revenue structures across production environments. Reported benchmarks illustrate the magnitude of this heterogeneity: China (indoor) total production cost ≈ NTD 3.36 million/ha [57]; China (outdoor) total cost ≈ NTD 2.46 million/ha and annual revenue ≈ NTD 4.13 million [58]; Taiwan (outdoor) variable cost ≈ NTD 0.88 million/ha and annual revenue ≈ NTD 1.08 million; and India cost ≈ NTD 0.6 million/ha/cycle and revenue ≈ NTD 0.93 million/ha/cycle [59].
Several region-specific factors likely drive cross-country differences in cost and revenue structures. First, policy and market settings (e.g., electricity pricing schemes, permitting procedures, and the presence or absence of targeted subsidies or concessional finance for PV–agriculture integration) can substantially affect both capital recovery conditions and risk exposure. Second, farming techniques and production intensity differ across regions: indoor or facility-based shrimp culture typically requires higher energy and biosecurity inputs but can achieve more stable survival and yield; by contrast, open-pond systems are more exposed to rainfall-driven salinity swings, temperature stress, and disease outbreaks, which can lower realized output and increase volatility. Third, input price structures and supply-chain organization (seed quality, feed prices, labor availability, and access to technical services) vary across countries and can shift the feasible cost frontier. These mechanisms help explain why Taiwan’s outdoor shrimp systems show lower absolute cost and revenue levels, while facility-based or better-controlled systems in other regions may exhibit higher costs but potentially stronger and more stable returns.
These comparisons suggest that the economic performance of aquavoltaic shrimp farming remains highly context-dependent, shaped by regional environmental conditions, institutional arrangements, and production practices. Importantly, results from the data envelopment analysis indicate that aquaculture operators under aquavoltaic systems currently exhibit relatively low operational efficiency, reflecting the early developmental stage of aquavoltaic shrimp farming in Taiwan. Previous studies have shown that factors such as farming experience, education level, and technical training positively influence production efficiency. In contrast, extreme weather events and water quality constraints negatively affect production efficiency [49].
Recent evidence from China further suggests that aquavoltaic systems may enhance biological performance by increasing shrimp survival rates and yield per unit area [60]. As aquavoltaic shrimp farming in Taiwan continues to mature and production technologies become more standardized, there is potential for further improvements in both biological performance and operational efficiency.
From the perspective of photovoltaic companies, aquavoltaics represents a power generation model with higher system integration and greater managerial complexity than stand-alone solar power plants [60] reported that the payback period of conventional photovoltaic projects is approximately 12.28 years, whereas aquavoltaic systems can reduce the payback period to around 10.14 years. Consistent with this finding, the results of the present study indicate that across different cooperation schemes, aquavoltaic development shows economic potential for photovoltaic operators in terms of investment recovery.
4.3. Policy and Practical Implications
The results of this study indicate that differences in operational performance and relative efficiency across aquavoltaic cooperation schemes are not determined solely by aquaculture or power generation technologies. Instead, they are closely associated with cooperation structures, investment allocation, and risk-sharing mechanisms. In particular, the observed asymmetry in operational performance and risk exposure between aquaculture operators and photovoltaic companies highlights the critical role of institutional design in shaping the development of aquavoltaic systems.
Recent reviews of energy–agriculture integration emphasize that dual-use PV systems (including agrivoltaics and aquavoltaics) can alleviate land-use competition while generating joint value in food and energy production, but their performance is strongly shaped by governance and benefit–risk allocation arrangements [61,62]. Moreover, emerging empirical evidence indicates that water-surface PV can measurably alter aquatic physicochemical conditions and biodiversity, underscoring the need for context-specific institutional design and risk-sharing mechanisms when scaling aquavoltaics [63,64].
In the Taiwanese context, aquavoltaic projects are predominantly organized under a model in which aquaculture and photovoltaic operations are managed separately. Photovoltaic companies typically focus on site development and electricity generation, while aquaculture operators undertake aquaculture production. This form of professional specialization helps reduce managerial complexity associated with cross-sectoral operations and aligns with the capital constraints and technical expertise of most stakeholders. However, the results of this study suggest that while such arrangements may lower entry barriers for project development, they can also place a disproportionate share of production risk on aquaculture operators, whose profitability and operational efficiency remain relatively weaker than those of photovoltaic companies.
To reduce asymmetric risk exposure and strengthen aquaculture operators’ participation incentives, several actionable measures can be considered:
- Government-backed guarantee or risk-sharing facility: Establish credit enhancement or guarantee mechanisms to ease financing constraints for aquaculture operators’ facility upgrades and biosecurity investments.
- Standardized contract templates and disclosure: develop model contracts that specify investment responsibilities, revenue-sharing rules, and force majeure clauses (e.g., typhoon damage and disease outbreaks) to reduce bargaining asymmetry and improve predictability.
- Cooperative or community-investment pathways: enable aquaculture operators to participate in PV returns through cooperative entities (e.g., associations/SPVs) or community energy/citizen power plant models, diversifying income sources beyond shrimp production alone.
Previous studies have suggested that deeper integration between photovoltaic companies and aquaculture operations—either through direct participation in aquaculture activities or through more tightly coupled cooperation arrangements—may enhance overall profitability and shorten investment payback periods [60]. From an institutional perspective, inclusive business models (IBMs) emphasize value chain integration to achieve economic upgrading while simultaneously addressing social outcomes [65,66,67,68]. In aquaculture-related research, institutional arrangements such as contract farming and joint ventures are often identified as mechanisms to strengthen stakeholder interactions and improve the livelihoods of small-scale aquaculture operators [69,70,71].
Within this broader context, the recent literature has also proposed community energy or citizen power plant models as potential approaches to enhancing local stakeholder participation in renewable energy investment and governance [71]. Compared with enterprise-led development models, community energy arrangements emphasize shared investment and benefit distribution among local actors, thereby offering a possible pathway for redistributing risk and returns. Applied to aquavoltaic systems, enabling aquaculture operators to participate in photovoltaic investment through community energy mechanisms may reduce their reliance on aquaculture income alone and, to some extent, mitigate the asymmetries in operational performance and risk exposure observed between aquaculture operators and photovoltaic companies in this study.
Nevertheless, such institutional arrangements are not universally applicable, and their effectiveness is likely to depend on specific design features, governance structures, and local conditions. Overall, the findings of this study suggest that future aquavoltaic development should not only continue to focus on technological performance and production efficiency but also consider greater flexibility and diversity in cooperation schemes as potential avenues for addressing heterogeneous stakeholder incentives and risk-sharing structures. The actual impacts of these alternative institutional arrangements remain an important subject for future empirical research.
5. Conclusions and Suggestions
Taiwan’s aquaculture sector is dominated by small-scale, family-based production systems, commonly referred to as artisanal aquaculture, a structural characteristic shared with many Southeast Asian countries. This production structure has long been regarded as a major constraint on the transition toward more enterprise-oriented aquaculture development [72,73]. In recent years, the promotion of aquavoltaic policies has created a potential opportunity for structural transformation within Taiwan’s aquaculture industry.
Key finding:
Using white shrimp farming as a case study, this research combines cost–benefit analysis and data envelopment analysis to examine the operational performance and relative efficiency of aquaculture operators and photovoltaic companies under four cooperation schemes and six aquavoltaic types. The results demonstrate that cooperation schemes differ substantially in terms of cost allocation, profitability, and operational efficiency. From the perspective of aquaculture operators, Cooperation Scheme 3 performs best overall in terms of profitability (higher NPV/IRR and shorter payback periods) and has a more favorable efficiency profile, primarily because of its lower investment threshold and the ability to generate both aquaculture and land rental income. In contrast, tenant farmers and aquaculture consulting companies can continue production under alternative cooperation schemes, but their profit margins and risk exposure remain constrained. On the other hand, photovoltaic companies display stable operational performance across all cooperation schemes, with efficiency levels consistently close to the efficient frontier.
5.1. Policy Recommendations
- Establish a government-backed credit enhancement or guarantee mechanism (or a risk-sharing facility) to ease financing constraints for aquaculture operators’ facility upgrades and biosecurity investments.
- Develop standardized contract templates that clarify investment responsibilities, revenue-sharing rules, and the allocation of force majeure risk (e.g., typhoons and disease outbreaks) to reduce bargaining asymmetry and improve predictability.
- Support cooperative or community-investment pathways that enable aquaculture operators—especially non-landowning operators—to participate in photovoltaic returns, thereby diversifying income sources and mitigating asymmetric risk exposure.
5.2. Practice Recommendations
- Strengthen targeted extension services and training on pond engineering under PV structures, water-quality management, and disease prevention to improve survival and operational stability.
- Encourage farm-level risk management (e.g., cash-flow stress testing across plausible ranges of survival rates and market prices), particularly for tenant farmers facing higher production risk.
- Improve cross-sector coordination between PV firms and aquaculture operators (e.g., access planning and maintenance scheduling) to reduce operational friction.
5.3. Limitations and Future Research
This study has several limitations. First, key biological and production parameters (e.g., stocking density and survival rates) were informed by stakeholder interviews and secondary sources rather than longitudinal farm-level observations. Although triangulation was applied, realized survival and production performance may vary across farms, seasons, and environmental conditions, potentially affecting estimated costs, revenues, and profitability outcomes. Second, the cost–benefit analysis relies on deterministic assumptions (e.g., survival rates, feed costs, and the discount rate) and does not include a full uncertainty or sensitivity analysis; therefore, the stability of scheme-level profitability rankings under parameter volatility warrants further investigation. Third, the DEA model defines DMUs as combinations of cooperation scheme, aquavoltaic type, and stakeholder role, which facilitates systematic comparison but may introduce structural heterogeneity across decision units and thus influence efficiency scores. Moreover, we did not implement robustness procedures such as bootstrapped DEA; accordingly, the DEA results should be interpreted as deterministic relative benchmarking within the defined analytical structure. Future studies with larger datasets could apply bootstrapped DEA or stochastic frontier analysis (SFA) to strengthen robustness. Fourth, the empirical analysis focuses on white shrimp farming in Tainan, Taiwan; caution is needed when generalizing the findings to other species, production systems, regions, or regulatory environments.
5.4. Future Research
Future research should (i) expand the sample scope by using longitudinal farm-level datasets across regions and production cycles to capture learning effects and technology standardization over time; (ii) conduct sensitivity and robustness analyses (e.g., varying survival rates, electricity prices/PV rents or revenue-sharing terms, feed costs, and discount rates, and applying bootstrapped DEA or stochastic frontier analysis (SFA)) to test the stability of scheme-level conclusions; (iii) integrate economic indicators with physical and environmental indicators (e.g., realized yield/survival, energy generation, and water-quality/ecological metrics) to evaluate the multidimensional performance and externalities of aquavoltaic systems; and (iv) examine governance mechanisms and contract design (e.g., standardized contract clauses, risk allocation, and incentive compatibility) to understand better how cooperation arrangements shape adoption incentives and performance.
Supplementary Materials
The following supporting information can be downloaded at: https://www.mdpi.com/article/10.3390/fishes11030150/s1, Table S1: The DEA efficiency indicators of 6 types of aquavoltaics and 4 cooperate plan; Table S2: The DEA efficiency indicators of 6 types of aquavoltaics and 4 cooperate plan.
Author Contributions
Conceptualization, B.-Y.C., P.-L.H., Y.-L.H. and S.-H.L.; methodology, B.-Y.C. and Y.-L.H.; software, B.-Y.C., Y.-L.H. and S.-H.L.; validation, F.A.; investigation, B.-Y.C., S.-H.L. and C.-T.H.; resources, P.-L.H. and C.-T.H.; data curation, B.-Y.C. and P.-L.H.; writing—original draft, B.-Y.C.; writing—review and editing, B.-Y.C., F.A. and C.-T.H.; project administration, B.-Y.C.; funding acquisition, C.-T.H. All authors have read and agreed to the published version of the manuscript.
Funding
This research was funded by National Science and Technology Council (NSTC), grant number 113-2621-M-019-004.
Institutional Review Board Statement
The interviews conducted in this study involved industry stakeholders (aquaculture operators, photovoltaic developers, landowners, and consulting firms) and were carried out for the purpose of collecting professional and institutional information, rather than personal or sensitive data. The study did not involve human experimentation, medical intervention, human biological materials, or identifiable personal data. According to the institutional guidelines of our affiliation and relevant national regulations, this type of non-invasive, non-clinical social science research based on voluntary expert interviews does not require formal approval from an Ethics Committee or Institutional Review Board (IRB).
Informed Consent Statement
Participation in the interviews was entirely voluntary, and oral informed consent was obtained from all participants prior to data collection. Participants could decline to answer any question and withdraw at any time. All information was anonymized and used solely for academic research purposes.
Data Availability Statement
The data presented in this study are available on request from the corresponding author.
Acknowledgments
The author also extends sincere gratitude to the Aquavoltaics company for participating in the interview and sharing valuable insights.
Conflicts of Interest
The authors declare no conflicts of interest.
References
- Kais, S.M.; Islam, M.S. Impacts of and Resilience to Climate Change at the Bottom of the Shrimp Commodity Chain in Bangladesh: A Preliminary Investigation. Aquaculture 2018, 493, 406–415. [Google Scholar] [CrossRef] [Scilit]
- Huang, M.T.; Zhai, P.M. Achieving Paris Agreement Temperature Goals Requires Carbon Neutrality by the Middle Century with Far-Reaching Transitions in the Whole Society. Adv. Clim. Chang. Res. 2021, 12, 281–286. [Google Scholar] [CrossRef] [Scilit]
- FAO. The State of World Fisheries and Aquaculture 2024; Food and Agriculture Organization of the United Nations: Rome, Italy, 2024. [Google Scholar] [CrossRef] [Scilit]
- Chang, Y.T.; Huang, W.T.; Wu, P.L.; Kumar, R.; Wang, H.C.; Lu, H.P. Low Salinity Stress Increases the Risk of Vibrio Parahaemolyticus Infection and Gut Microbiota Dysbiosis in Pacific White Shrimp. BMC Microbiol. 2024, 24, 275. [Google Scholar] [CrossRef] [Scilit] [PubMed]
- Effects of Weather and Climate on Aquaculture-Responsible Seafood Advocate. Available online: https://www.globalseafood.org/advocate/effects-of-weather-and-climate-on-aquaculture/ (accessed on 25 February 2026).
- Henny, L.; Thorncroft, C.D.; Hsu, H.-H.; Bosart, L.F. Extreme Rainfall in Taiwan: Seasonal Statistics and Trends. J. Clim. 2021, 34, 4711–4731. [Google Scholar] [CrossRef] [Scilit]
- Martin, S.J.; Mather, C.; Knott, C.; Bavington, D. ‘Landing’ Salmon Aquaculture: Ecologies, Infrastructures and the Promise of Sustainability. Geoforum 2021, 123, 47–55. [Google Scholar] [CrossRef] [Scilit]
- Chen, B.Y.; Huang, P.L.; Hou, Y.L.; Lan, H.Y.; Huang, C.T.; Nan, F.H. The Economic Feasibility of Aquavoltaics in Taiwan—A Case Study of Whiteleg Shrimp (Litopenaeus vannamei) Culture. Aquaculture 2024, 581, 740454. [Google Scholar] [CrossRef] [Scilit]
- Bhatti, U.A.; Bhatti, M.A.; Tang, H.; Syam, M.S.; Awwad, E.M.; Sharaf, M.; Ghadi, Y.Y. Global Production Patterns: Understanding the Relationship between Greenhouse Gas Emissions, Agriculture Greening and Climate Variability. Environ. Res. 2024, 245, 118049. [Google Scholar] [CrossRef] [Scilit]
- IRENA. Renewable Energy Statistics 2025; IRENA: Abu Dhabi, United Arab Emirates, 2025. [Google Scholar]
- Sethi, A.; Tiwari, S. Solar Photovoltaic Status Worldwide. Int. J. Tech. Res. Sci. 2020, Special, 33–35. [Google Scholar] [CrossRef] [Scilit]
- Fraas, L.; Partain, L. Solar Cells: A Brief History and Introduction. In Solar Cells and their Applications: Second Edition; John Wiley & Sons, Inc.: Hoboken, NJ, USA, 2010. [Google Scholar]
- Hoffert, M.I.; Caldeira, K.; Benford, G.; Criswell, D.R.; Green, C.; Herzog, H.; Jain, A.K.; Kheshgi, H.S.; Lackner, K.S.; Lewis, J.S.; et al. Advanced Technology Paths to Global Climate Stability: Energy for a Greenhouse Planet. Science 2002, 298, 981–987. [Google Scholar] [CrossRef] [Scilit]
- Raugei, M.; Bargigli, S.; Ulgiati, S. Life Cycle Assessment and Energy Pay-Back Time of Advanced Photovoltaic Modules: CdTe and CIS Compared to Poly-Si. Energy 2007, 32, 1310–1318. [Google Scholar] [CrossRef] [Scilit]
- SolarPower Europe. Global Market Outlook For Solar Power; SolarPower Europe: Brussels, Belgium, 2022. [Google Scholar]
- Almeida, R.M.; Schmitt, R.; Grodsky, S.M.; Flecker, A.S.; Gomes, C.P.; Zhao, L.; Liu, H.; Barros, N.; Kelman, R.; McIntyre, P.B. Floating Solar Power Could Help Fight Climate Change—Let’s Get It Right. Nature 2022, 606, 246–249. [Google Scholar] [CrossRef] [Scilit]
- Chang, H.H.; Lin, T.C. Solar Farm Policy and Farmland Price–A Land Zoning Perspective. J. Environ. Manag. 2023, 344, 118454. [Google Scholar] [CrossRef] [Scilit]
- Palmer-Wilson, K.; Donald, J.; Robertson, B.; Lyseng, B.; Keller, V.; Fowler, M.; Wade, C.; Scholtysik, S.; Wild, P.; Rowe, A. Impact of Land Requirements on Electricity System Decarbonisation Pathways. Energy Policy 2019, 129, 193–205. [Google Scholar] [CrossRef] [Scilit]
- Cheng, C.; Blakers, A.; Stocks, M.; Lu, B. 100% Renewable Energy in Japan. Energy Convers. Manag. 2022, 255, 115299. [Google Scholar] [CrossRef] [Scilit]
- Geng, B.; Zhang, X.; Liang, Y.; Bao, H. Do Favorable Land Price Policy Affect Renewable Energy Industry? Evidence from Photovoltaics. J. Clean. Prod. 2016, 119, 187–195. [Google Scholar] [CrossRef] [Scilit]
- Lee, M. Economic Feasibility Analysis and Policy Implication for Photovoltaic System at Cohousing in KOREA. Renew. Energy 2019, 144, 30–40. [Google Scholar] [CrossRef] [Scilit]
- Thapar, S.; Sharma, S.; Verma, A. Local Community as Shareholders in Clean Energy Projects: Innovative Strategy for Accelerating Renewable Energy Deployment in India. Renew. Energy 2017, 101, 873–885. [Google Scholar] [CrossRef] [Scilit]
- Tsuchiya, H. Electricity Supply Largely from Solar and Wind Resources in Japan. Renew. Energy 2012, 48, 318–325. [Google Scholar] [CrossRef] [Scilit]
- Hsiao, Y.J.; Chen, J.L.; Huang, C.T. What Are the Challenges and Opportunities in Implementing Taiwan’s Aquavoltaics Policy? A Roadmap for Achieving Symbiosis between Small-Scale Aquaculture and Photovoltaics. Energy Policy 2021, 153, 112264. [Google Scholar] [CrossRef] [Scilit]
- Huang, C.T.; Afero, F.; Hung, C.W.; Chen, B.Y.; Nan, F.H.; Chiang, W.S.; Tang, H.J.; Kang, C.K. Economic Feasibility Assessment of Cage Aquaculture in Offshore Wind Power Generation Areas in Changhua County, Taiwan. Aquaculture 2022, 548, 737611. [Google Scholar] [CrossRef] [Scilit]
- Millison, D.; George, L.; Acharya, J.; Wijayatunga, P. Enabling Policy and Regulatory Environment for Solar Power Development: Lessons in Asia-Pacific Region. Solar Compass 2022, 2, 100023. [Google Scholar] [CrossRef] [Scilit]
- Dalton, G.; Bardócz, T.; Blanch, M.; Campbell, D.; Johnson, K.; Lawrence, G.; Lilas, T.; Friis-Madsen, E.; Neumann, F.; Nikitas, N.; et al. Feasibility of Investment in Blue Growth Multiple-Use of Space and Multi-Use Platform Projects; Results of a Novel Assessment Approach and Case Studies. Renew. Sustain. Energy Rev. 2019, 107, 338–359. [Google Scholar] [CrossRef] [Scilit]
- Chen, W.Y.; Hsu, H.C. The Present Situation and Challenges of the Oyster Farming Industry in Taiwan. Taiwan J. Agric. Sci. 2016, 25, 45–58. [Google Scholar]
- Nguyen, T.A.T.; Nguyen, K.A.T.; Truong, H.C.; Jolly, C.M. Collective Action Governance and Benefits Distribution in the Sturgeon Value Chain in Lâm Đồng Province, Vietnam. Aquaculture 2020, 519, 734765. [Google Scholar] [CrossRef] [Scilit]
- Guofeng, M.; Jianyao, J.; Shan, J.; Zhijiang, W. Incentives and Contract Design for Knowledge Sharing in Construction Joint Ventures. Autom. Constr. 2020, 119, 103343. [Google Scholar] [CrossRef] [Scilit]
- Griffin, R.; Buck, B.; Krause, G. Private Incentives for the Emergence of Co-Production of Offshore Wind Energy and Mussel Aquaculture. Aquaculture 2015, 436, 80–89. [Google Scholar] [CrossRef] [Scilit]
- Ener Rusen, S.; Hammer, A.; Akinoglu, B.G. Estimation of Daily Global Solar Irradiation by Coupling Ground Measurements of Bright Sunshine Hours to Satellite Imagery. Energy 2013, 58, 417–425. [Google Scholar] [CrossRef] [Scilit]
- Charalambous, P.G.; Maidment, G.G.; Kalogirou, S.A.; Yiakoumetti, K. Photovoltaic Thermal (PV/T) Collectors: A Review. Appl. Therm. Eng. 2007, 27, 275–286. [Google Scholar] [CrossRef] [Scilit]
- Tripanagnostopoulos, Y.; Nousia, T.; Souliotis, M.; Yianoulis, P. Hybrid Photovoltaic/Thermal Solar Systems. Solar Energy 2002, 72, 217–234. [Google Scholar] [CrossRef] [Scilit]
- Ghanghermeh, A.; Roshan, G.; Halabian, A. Projecting Spatiotemporal Variations of Sunshine Duration with Regards to Climate Change in Iran as a Step towards Clean Energy. Sustain. Energy Technol. Assess. 2022, 53, 102630. [Google Scholar] [CrossRef] [Scilit]
- Alam, M.A.; Guttormsen, A.G. Risk in Aquaculture: Farmers’ Perceptions and Management Strategies in Bangladesh. Aquac. Econ. Manag. 2019, 23, 359–381. [Google Scholar] [CrossRef] [Scilit]
- Cantillo, J.; Van Caillie, D. Understanding European Aquaculture Companies’ Perceived Risks and Risk Management Practices. Aquac. Econ. Manag. 2023, 27, 599–637. [Google Scholar] [CrossRef] [Scilit]
- Rahman, M.T.; Nielsen, R.; Khan, M.A.; Ahsan, D. Perceived Risk and Risk Management Strategies in Pond Aquaculture. Mar. Resour. Econ. 2021, 36, 43–69. [Google Scholar] [CrossRef] [Scilit]
- Anderson, J.L.; Asche, F.; Garlock, T.; Chu, J. Aquaculture: Its Role in the Future of Food. Front. Econ. Glob. 2017, 17, 159–173. [Google Scholar] [CrossRef] [Scilit]
- Bush, S.R.; Belton, B.; Hall, D.; Vandergeest, P.; Murray, F.J.; Ponte, S.; Oosterveer, P.; Islam, M.S.; Mol, A.P.J.; Hatanaka, M.; et al. Certify Sustainable Aquaculture? Science 2013, 341, 1067–1068. [Google Scholar] [CrossRef] [Scilit]
- Froehlich, H.E.; Koehn, J.Z.; Holsman, K.K.; Halpern, B.S. Emerging Trends in Science and News of Climate Change Threats to and Adaptation of Aquaculture. Aquaculture 2022, 549, 737812. [Google Scholar] [CrossRef] [Scilit]
- Hu, C.; Zhang, X.; Reardon, T.; Hernandez, R. Value-Chain Clusters and Aquaculture Innovation in Bangladesh. Food Policy 2019, 83, 310–326. [Google Scholar] [CrossRef] [Scilit]
- Nielsen, R. Green and Technical Efficient Growth in Danish Fresh Water Aquaculture. Aquac. Econ. Manag. 2011, 15, 262–277. [Google Scholar] [CrossRef] [Scilit]
- Samat, N.; Goh, K.H.; See, K.F. Review of the Application of Cost–Benefit Analysis to the Development of Production Systems in Aquaculture. Aquaculture 2024, 587, 740816. [Google Scholar] [CrossRef] [Scilit]
- Sharma, K.R.; Leung, P. A Review of Production Frontier Analysis for Aquaculture Management. Aquac. Econ. Manag. 2003, 7, 15–34. [Google Scholar] [CrossRef] [Scilit]
- Bayazid, Y.; Umetsu, C.; Hamasaki, H.; Miyanishi, T. Measuring the Efficiency of Collective Floodplain Aquaculture of Bangladesh Using Data Envelopment Analysis. Aquaculture 2019, 503, 537–549. [Google Scholar] [CrossRef] [Scilit]
- Iliyasu, A.; Mohamed, Z.A.; Ismail, M.M.; Abdullah, A.M.; Kamarudin, S.M.; Mazuki, H. A Review of Production Frontier Research in Aquaculture (2001–2011). Aquac. Econ. Manag. 2014, 18, 221–247. [Google Scholar] [CrossRef] [Scilit]
- Sharma, K.R.; Leung, P.; Chen, H.; Peterson, A. Economic Efficiency and Optimum Stocking Densities in Fish Polyculture: An Application of Data Envelopment Analysis (DEA) to Chinese Fish Farms. Aquaculture 1999, 180, 207–221. [Google Scholar] [CrossRef] [Scilit]
- Vinh, N.P.; Huang, C.T.; Hsiao, Y.J.; Hieu, T.K.; Chen, L.H. Data Envelopment Analysis for Production Efficiency Improvement: An Empirical Application on Brine Shrimp Artemia Franciscana Culture in the Mekong Delta, Vietnam. Aquac. Res. 2020, 51, 2985–2996. [Google Scholar] [CrossRef] [Scilit]
- Ali, H.; Rahman, M.M.; Murshed-e-Jahan, K.; Dhar, G.C. Production Economics of Striped Catfish (Pangasianodon Hypophthalmus, Sauvage, 1878) Farming under Polyculture System in Bangladesh. Aquaculture 2018, 491, 381–390. [Google Scholar] [CrossRef] [Scilit]
- Castilho-Barros, L.; Owatari, M.S.; Mouriño, J.L.P.; Silva, B.C.; Seiffert, W.Q. Economic Feasibility of Tilapia Culture in Southern Brazil: A Small-Scale Farm Model. Aquaculture 2020, 515, 734551. [Google Scholar] [CrossRef] [Scilit]
- Pradhan, P.; Gadkari, P.; Arora, A.; Mahajani, S.M. Economic Feasibility of Agro Waste Pelletization as an Energy Option in Rural India. In Proceedings of the Energy Procedia, Hong Kong, China, 22–25 August 2019; Volume 158. [Google Scholar]
- Manzhos, S. On the Choice of the Discount Rate and the Role of Financial Variables and Physical Parameters in Estimating the Levelized Cost of Energy. Int. J. Financ. Stud. 2013, 1, 54–61. [Google Scholar] [CrossRef] [Scilit]
- Charnes, A.; Cooper, W.W.; Rhodes, E. Measuring the Efficiency of Decision Making Units. Eur. J. Oper. Res. 1978, 2, 429–444. [Google Scholar] [CrossRef] [Scilit]
- Hagedoorn, J. Inter-Firm R&D Partnerships: An Overview of Major Trends and Patterns since 1960. Res. Policy 2002, 31, 477–492. [Google Scholar] [CrossRef] [Scilit]
- Lin, Y.M. Economic Analysis of Litopenaeus Vannamei Farming of Taiwan. Master’s Thesis, National Taiwan Ocean University, Keelung City, China, 2019. (In Chinese) [Google Scholar]
- Zhang, C.; Guo, C.Y.; Shu, K.H.; Xu, S.L.; Wang, D.L. Comparative Analysis of the Growth Performance, Vitality, Body Chemical Composition and Economic Efficiency of the Main Cultivated Strains of Pacific White Shrimp (Litopenaeus Vannamei) in Coastal Areas of China. Aquaculture 2024, 587, 740856. [Google Scholar] [CrossRef] [Scilit]
- Mansaray, M.; Hayford, A.; Xiaojun, J.; Lin, Z.; Xinhua, Y. Economic Analysis of White-Leg Shrimp (Penaeus Vannamei) Production Case Study: Rudong County of Nantong City, Jiangsu Province, China. Asian J. Agric. Ext. Econ. Sociol. 2018, 26, 1–13. [Google Scholar] [CrossRef] [Scilit]
- Narkis, C.J.; Uma, K.; Rohini, A.; Vasanthi, R. An Economic Analysis of Shrimp (Litopenaeus Vannamei) in Nagapattinam District of Tamil Nadu. Asian J. Agric. Ext. Econ. Sociol. 2021, 39, 449–454. [Google Scholar] [CrossRef] [Scilit]
- Zhu, Z.; Song, Z.; Xu, S.; Wang, S.; Chen, X.; Wang, Y.; Zhu, Z. The Development of Fishery-Photovoltaic Complementary Industry and the Studies on Its Environmental, Ecological and Economic Effects in China: A Review. Energy Nexus 2024, 15, 100316. [Google Scholar] [CrossRef] [Scilit]
- Chopdar, R.K.; Sengar, N.; Giri, N.C.; Halliday, D. Comprehensive Review on Agrivoltaics with Technical, Environmental and Societal Insights. Renew. Sustain. Energy Rev. 2024, 197, 114416. [Google Scholar] [CrossRef] [Scilit]
- Widmer, J.; Christ, B.; Grenz, J.; Norgrove, L. Agrivoltaics, a Promising New Tool for Electricity and Food Production: A Systematic Review. Renew. Sustain. Energy Rev. 2024, 192, 114277. [Google Scholar] [CrossRef] [Scilit]
- Ray, N.E.; Holgerson, M.A.; Grodsky, S.M. Immediate Effect of Floating Solar Energy Deployment on Greenhouse Gas Dynamics in Ponds. Environ. Sci. Technol. 2024, 58, 22104–22113. [Google Scholar] [CrossRef] [Scilit]
- Yang, S.; Zhang, Y.; Tian, D.; Liu, Z.; Ma, Z. Water-Surface Photovoltaic Systems Have Affected Water Physical and Chemical Properties and Biodiversity. Commun. Earth Environ. 2024, 5, 632. [Google Scholar] [CrossRef] [Scilit]
- Pegler, L. Peasant Inclusion in Global Value Chains: Economic Upgrading but Social Downgrading in Labour Processes? J. Peasant. Stud. 2015, 42, 929–956. [Google Scholar] [CrossRef] [Scilit]
- Barrientos, S.; Gereffi, G.; Rossi, A. Economic and Social Upgrading in Global Production Networks: A New Paradigm for a Changing World. Int. Labour Rev. 2011, 150, 319–340. [Google Scholar] [CrossRef] [Scilit]
- Rossi, A. Does Economic Upgrading Lead to Social Upgrading in Global Production Networks? Evidence from Morocco. World Dev. 2013, 46, 223–233. [Google Scholar] [CrossRef] [Scilit]
- Vicol, M.; Neilson, J.; Hartatri, D.F.S.; Cooper, P. Upgrading for Whom? Relationship Coffee, Value Chain Interventions and Rural Development in Indonesia. World Dev. 2018, 110, 26–37. [Google Scholar] [CrossRef] [Scilit]
- Abebe, G.K.; Bijman, J.; Kemp, R.; Omta, O.; Tsegaye, A. Contract Farming Configuration: Smallholders’ Preferences for Contract Design Attributes. Food Policy 2013, 40, 14–24. [Google Scholar] [CrossRef] [Scilit]
- Kaminski, A.M.; Kruijssen, F.; Cole, S.M.; Beveridge, M.C.M.; Dawson, C.; Mohan, C.V.; Suri, S.; Karim, M.; Chen, O.L.; Phillips, M.J.; et al. A Review of Inclusive Business Models and Their Application in Aquaculture Development. Rev. Aquac. 2020, 12, 1881–1902. [Google Scholar] [CrossRef] [Scilit]
- Vermeulen, S.; Cotula, L. Making the Most of Agricultural Investment: A Survey of Business Models That Provide Opportunities for Smallholders; International Institute for Environment and Development: London, UK, 2010. [Google Scholar]
- Bakit, J.; Hurtado, A.; Márquez, R.; Villasante, S. Navigating Transformations from Artisanal Fishers to Entrepreneurial Scallop Farmers in Chile. Front. Mar. Sci. 2023, 10, 1128527. [Google Scholar] [CrossRef] [Scilit]
- Salmi, P. Post-Productivist Transformation as a Challenge for Small-Scale Fisheries: Changing Preconditions and Adaptation Strategies in the Finnish Archipelago Sea Region. Reg. Stud. Mar. Sci. 2018, 21, 67–73. [Google Scholar] [CrossRef] [Scilit]

Disclaimer/Publisher’s Note: The statements, opinions and data contained in all publications are solely those of the individual author(s) and contributor(s) and not of MDPI and/or the editor(s). MDPI and/or the editor(s) disclaim responsibility for any injury to people or property resulting from any ideas, methods, instructions or products referred to in the content. |
© 2026 by the authors. Licensee MDPI, Basel, Switzerland. This article is an open access article distributed under the terms and conditions of the Creative Commons Attribution (CC BY) license.