


Abstract
This study investigated the temporal variation and removal efficiency of solid waste, together with the dynamics of water quality parameters and microbial community structure, in a recirculating aquaculture system (RAS) for mandarin fish (Siniperca chuatsi) fed a formulated diet. The average fish weight was 384.62 ± 12.13 g, and the stocking density was 25 kg/m3. The results showed that: (1) the contents of the stomach and intestine exhibited a bimodal pattern, characterized by an initial increase followed by a decrease, and a subsequent secondary increase and decline. In the culture tanks, the total suspended solid (TSS) concentration at the main discharge outlet of the dual-channel bottom drainage system was highest immediately after feeding (0 h), reached its lowest level at 5 h post-feeding, and displayed a double-peak pattern during the 6–24 h post-feeding period. The temporal variations of in-tank TSS and chemical oxygen demand (COD) generally followed the same trend as the TSS concentration at the main discharge outlet. (2) Total ammonia nitrogen (TAN) reached its maximum at 6 h, whereas nitrite nitrogen (NO2−-N) peaked at 9 h. (3) The solid–liquid separation efficiencies of the dual-drain system, vertical flow clarifier, and Rotating drum microfilter were 30.40–58.33%, 51.30–76.61%, and 37.04–68.26%, respectively, with the highest removal efficiencies observed at 0 h post-feeding. (4) In the nitrifying biofilter, the TAN concentrations ranged from 0.22–0.99 mg/L at the inlet to 0.15–0.36 mg/L at the outlet. In contrast, NO2−-N concentrations exhibited negligible differences between the inlet and outlet at the corresponding sampling times. At the phylum level, Pseudomonadota, Bacteroidota, and the superphylum Patescibacteria dominated the biofilter microbial communities. At the genus level, Sediminibacterium and Limnohabitans were predominant in BF_1, whereas taxa affiliated with norank_f__Hyphomicrobiales_ and unclassified_o__Saccharimonadales dominated BF_2. Overall, the results indicated that increasing water circulation and tank flow rate at 0 h and during the 7–14 h post-feeding period may facilitate the timely removal of solid waste, and that the installation of a foam fractionator could contribute to the removal of dissolved and fine organic matter.
Keywords:
mandarin fish; recirculating aquaculture system (RAS); solid–liquid separation; nitrifying biofilter; microbial community Key Contribution:
This study systematically reveals the diurnal variation patterns of solid waste production in mandarin fish (Siniperca chuatsi) recirculating aquaculture systems (RAS) and its dynamic impact on solid–liquid separation efficiency. It elucidates the competitive relationship between heterotrophic microorganisms and nitrifying bacteria under high organic loading, providing a key microbiological basis for water quality regulation. Based on these findings, the study proposes specific protocols for operational adjustment and process optimization. Consequently, it offers significant theoretical and practical foundations for the precise management of RAS and for enhancing industrial productivity and efficiency.
1. Introduction
Industrial recirculating aquaculture systems (RAS) represent an efficient and intensive aquaculture model. By continuously circulating water between culture tanks and treatment units, RAS enables efficient use of water resources while maintaining favorable water quality conditions [1]. From an engineering perspective, the water treatment system in RAS can generally be divided into three functional modules: solids removal, biofiltration, and water quality regulation. A thorough understanding of the characteristics of pollutant generation during culture, as well as their removal and transformation within each treatment unit, is fundamental for achieving stable RAS operation and optimizing system performance.
In RAS, solid waste in the culture water consists of total suspended solids (TSS) and settleable solids. It primarily originates from uneaten feed, fish feces, microbial flocs, and inorganic suspended particles, with uneaten feed and feces serving as the major contributors to the overall solid load [2]. Suspended solids (SSs) span a wide range of particle sizes and can be classified into settleable solids, medium-sized particles, and fine particles [3]. Their transport and transformation within the water are influenced by multiple factors, including fish activity, hydrodynamic conditions, and the operational status of water treatment units. Solid–liquid separation represents a critical front-end process in RAS water treatment, aimed at removing solid waste to reduce the organic load on downstream units. Different types of solid–liquid separation devices demonstrate notable variation in removal efficiency for particles of different sizes [1,4,5]. The characteristics and load of solid waste further affect the performance of biofilters. As the core component of the RAS water treatment system, biofilters rely on biofilms formed on the surfaces of biological media to carry out purification processes. The microbial community within these biofilms metabolizes organic matter and converts total ammonia nitrogen (TAN) and nitrite nitrogen (NO2−-N) into nitrate nitrogen (NO3−-N), thereby maintaining stable water quality [6,7]. The composition and abundance of microbial communities in biofilters are key determinants of water treatment efficiency and operational stability.
The mandarin fish (Siniperca chuatsi) is an important high-value freshwater aquaculture species in China. In 2023, China’s mandarin fish aquaculture production reached 480,000 metric tons, representing an increase of 18.95% compared with 2022. The principal production regions were Guangdong, Hubei, Anhui, and Jiangxi Provinces [8]. Traditional pond culture remains the dominant production model for mandarin fish; however, it is constrained by challenges such as difficulties in water quality regulation, frequent disease outbreaks, and relatively low unit productivity. Moreover, this culture mode relies heavily on live bait fish, resulting in low feed utilization efficiency. With the advancement of formulated feed acclimation techniques, the potential for cultivating mandarin fish in RAS has gradually emerged [9,10]. Previous studies have demonstrated that, following live bait consumption, mandarin fish exhibit distinct temporal dynamics in gastric evacuation and digestion [11]. These physiological rhythms represent upstream processes in fecal production and provide a critical mechanistic basis for understanding both the intensity and temporal distribution of solid waste generation in the culture water. In RAS conditions and in formulated feed-based culture, the patterns of solid waste generation and their coupling with solid–liquid separation efficiency remain inadequately understood. Most prior research has concentrated on the structural configuration of solid–liquid separation equipment and its efficacy in removing suspended solids [12,13,14,15]. In industrialized RAS for mandarin fish, solid waste loads display pronounced temporal fluctuations. How these fluctuations affect solid–liquid separation efficiency, the supply of organic matter, and microenvironmental conditions within biofilters—subsequently driving adjustments in microbial community structure and functional stability, and eliciting dynamic responses in key water quality parameters—has yet to be systematically elucidated [1].
Against this backdrop, the present study focuses on a RAS for mandarin fish, systematically analyzing the relationships among solid waste generation and removal efficiency, water quality dynamics, and microbial community structure in biofilters, with the aim of providing theoretical insights and technical guidance for the operational management and process optimization of RAS for mandarin fish.
2. Materials and Methods
2.1. Experimental Materials
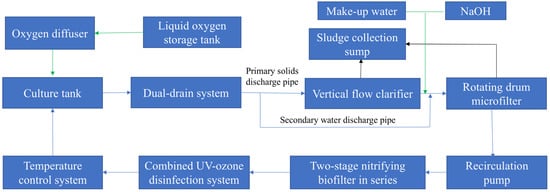
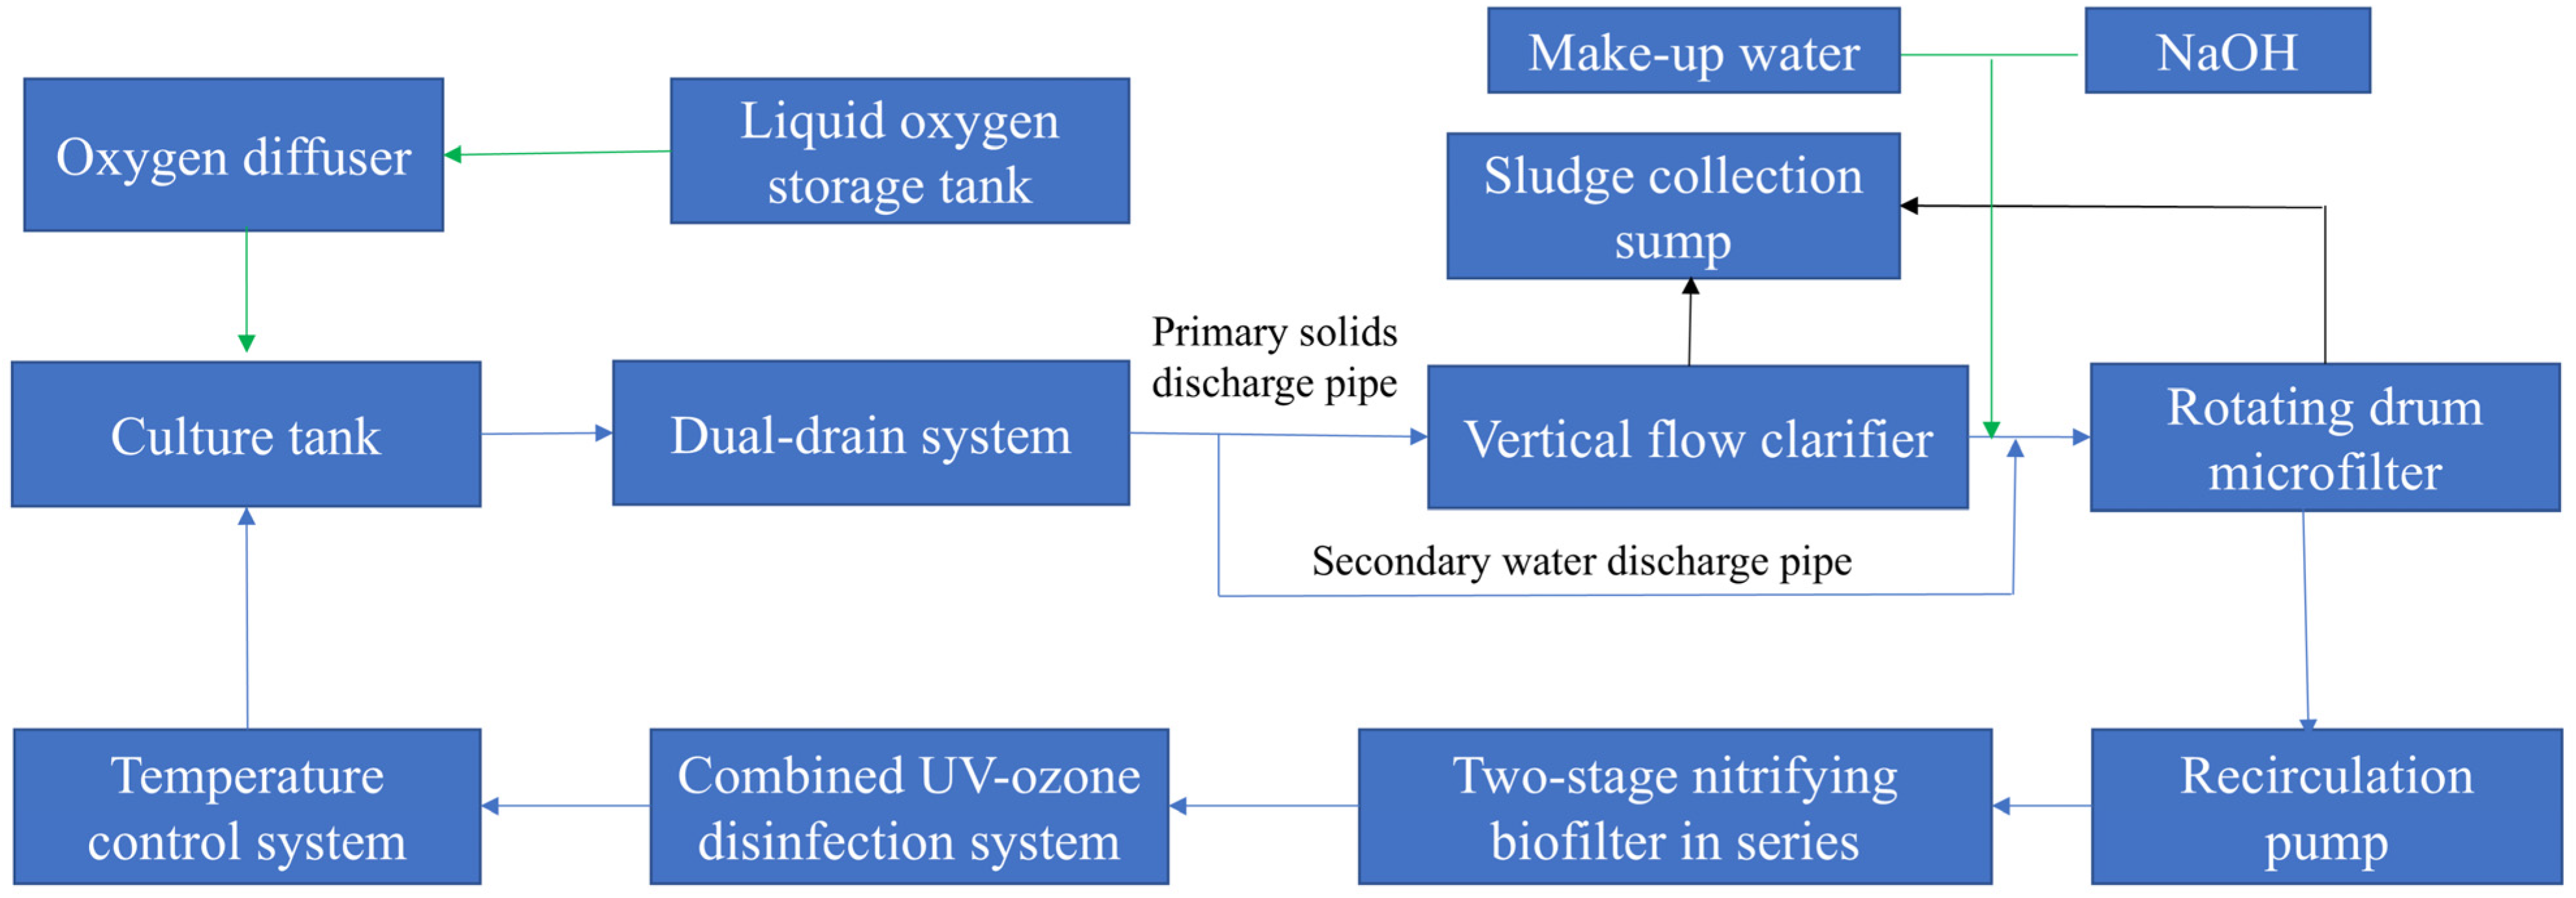
The experiment was conducted in a factory-scale recirculating aquaculture workshop at Huiquan Ecological Agriculture Co., Ltd. (Huangshan, China). The RAS employed in this studymainly consists of culture tank, a dual-drain system, a vertical flow clarifier, a rotating drum microfilter, a circulation pump, a two-stage nitrifying biofilter in series, a temperature control system, a combined UV-ozone disinfection system, liquid oxygen supply system with oxygen diffusers, and associated pumps and aeration equipment. The system configuration and process flow are illustrated in Figure 1.
Figure 1.
Schematic diagram of the RAS. Note: Blue arrows indicate the direction of recirculating water flow within the system; green arrows represent external inputs; black arrows denote waste discharge from the system.
One independent RAS unit comprises six circular culture tanks (tanks 1–6) with a pot-shaped bottom structure to facilitate the centralized collection of solid wastes. The effective culture water volume of each pond is 40 m3, resulting in a total culture volume of 240 m3. The biofilter had a total effective volume of 120 m3, and the overall system water volume is approximately 400 m3. Aeration within the culture tanks is provided by liquid oxygen supply system with oxygen diffusers, with six diffusers installed per tank. The solid–liquid separation module included a dual-drain system consisting of a 5.0 cm primary solids discharge pipe and a 15.0 cm secondary water discharge pipe, followed by a vertical flow clarifier (60 cm in diameter and 110 cm in height) and a rotating drum microfilter equipped with an automatic backwashing system operating at a recirculation rate of six times per day. Biological treatment was achieved using two nitrifying biofilters connected in series, designated as the primary biofilter (BF_1) and the secondary biofilter (BF_2), which operated in a staged configuration to remove TAN. The effective volumes of BF_1 and BF_2 are 66 m3 and 54 m3, respectively. Both biofilters were packed with high-density polyethylene (HDPE) biofilter media (PE75S), providing a specific surface area of 1600 m2/m3 and a bulk density of 12.917 kg/m3. Bottom aeration within the biofilters was supplied by a Roots-type positive displacement blower (Roots blower) with an airflow rate of 2.2 m3/min, thereby maintaining aerobic conditions for nitrification. Groundwater with an inlet temperature of 19 °C was used as the water source, with a daily water exchange rate of 3–5% of the total system volume. System temperature was maintained at 25.5–25.8 °C using a water- or ground-source heat pump (model HP-SX45T). Water disinfection was achieved using an ozone generator (model JR-SA-120g), operated for 3 h/d, in combination with continuous ultraviolet (UV) disinfection. System pH was adjusted by the addition of sodium hydroxide (NaOH). Detailed equipment specifications and operating parameters are summarized in Table 1.
Table 1.
System equipments and operating parameters of the RAS during the test.
The stocking density of mandarin fish was maintained at 25 kg/m3, corresponding to 2600 fish per pond. During the experimental period, mandarin fish had a mean body weight of 384.62 ± 12.13 g and a mean total length of 23.14 ± 0.35 cm. Preliminary trials indicated that under a twice-daily feeding regimen, feed intake during the second feeding event declined markedly, frequently resulting in feed refusal and increased feed wastage. Therefore, fish were fed once daily at 8:00 AM, at a feeding rate of 1.5% of the total biomass. A commercial extruded mandarin fish diet (No. 4 feed; Qingyuan Hailong Biotechnology Co., Ltd., Qingyuan, China) was used. The feed consisted of elongated pellets. To ensure the uniform dispersion of health-promoting additives and to soften the pellets for improved ingestion, they were sprayed with approximately 20% water (w/w) and conditioned for 1–2 h prior to each feeding event. The proximate composition of the experimental diet is presented in Table 2.
Table 2.
Proximate composition of the experimental diet.
In this study, all culture tanks were integrated within a single recirculating aquaculture system (RAS), sharing a common biofiltration unit, water treatment facilities, and hydraulic recirculation infrastructure. Although each tank was managed and sampled independently, they did not constitute fully independent system-level biological replicates. Therefore, the experimental unit was defined as the individual tank operating within the same RAS, and each tank was treated as one experimental replicate.
2.2. Measurement of Instantaneous Content of Stomach and Intestinal Contents
In the RAS, tanks 1, 3, and 5 were randomly selected as independent experimental units. Feeding was suspended for 48 h prior to the experiment. At the beginning of the trial, fish were subjected to a single satiation feeding using the formulated extruded diet described above, and any uneaten feed was removed 0.5 h after feeding. Sampling was conducted at 2 h intervals after feeding; from 24 h onward, the sampling interval was extended to 3 h until complete evacuation of stomach and intestinal contents was observed. At each sampling time point, three mandarin fish were randomly collected from each experimental tank. Fish were anesthetized with MS-222 (150 mg/L; Henan Nanhua Qianmu Biotechnology Co., Ltd., Zhengzhou, China), after which body length and body weight were measured. The stomach and intestine were then excised and weighed to obtain wet weight. Subsequently, the stomach and intestine were rinsed with physiological saline to remove residual contents, gently blotted dry, and weighed again to determine empty weight. The instantaneous contents of the stomach and intestine were calculated as the difference between wet and empty weights. Each tank was treated as an experimental replicate. For each sampling time point, measurements from the three tanks were averaged and used for dynamic analysis of the gastric and intestinal evacuation processes.
2.3. Measurement of Solid Waste Concentration and Water Quality
Water samples were collected independently from Tanks 1, 3, and 5, and each tanks treated as an independent experimental unit. The experiment was conducted with three replicates, and the mean value of each tank was used to represent the data at each sampling time point. Sampling was conducted hourly during 0–24 h post-feeding. Water samples were collected at the primary solids outlet of the dual-drain system, and TSS concentrations were determined using the gravimetric method and expressed as mg/L [16].
At 0, 2, 4, 8, 12, 16, 20, and 24 h after feeding, water samples were collected from a fixed location within each tank (50 cm from the tank wall and 80 cm below the water surface). A 50 mL sample was used for chemical oxygen demand (COD) determination by spectrophotometry [17], and an additional 100 mL sample was collected for TSS measurement using the gravimetric method [16].
Water samples (50 mL) were collected hourly at a fixed location within the culture pond (50 cm from the tank wall and at a depth of 80 cm) during 0–24 h post-feeding. The samples were filtered through a 0.45 µm membrane filter prior to analysis. Dissolved oxygen (DO) concentration and pH were measured using a multiparameter water quality analyzer (AR8407, Dongguan Wanchuang Electronic Products Co., Ltd., Dongguan, China). TAN and NO2−-N concentrations were determined in accordance with standard methods, using the indophenol blue method and spectrophotometry, respectively [18].
The TAN load was calculated using the following formula [4]:
In the formula: TANprod represents the TAN load produced per unit biomass, expressed as g TAN/(kg biomass d); F represents the daily feed amount, kg/d; P represents the crude protein content of the feed; B represents the total biomass in the system, kg.
At 0, 2, 4, 8, 12, 16, 20, and 24 h post-feeding, 100 mL water samples were collected simultaneously from the influent and effluent of each culture tank. For the effluent, water from the main discharge outlet and secondary drainage outlet (mixed at a 1:9 volume ratio, total volume 1000 mL) was thoroughly homogenized prior to sampling.
The TSS production rate is calculated as:
In the formula: TSSrate represents the TSS production rate per unit biomass, expressed as g TSS/(kg biomass d); F represents the daily feed amount, kg/d; D represents the apparent digestibility of feed dry matter, which is 0.81 [19]; B represents the total biomass in the system, kg.
2.4. Evaluation of Solid–Liquid Separation Efficiency
Water samples were collected simultaneously at 0, 2, 4, 8, 12, 16, 20, and 24 h after feeding from the main and auxiliary discharge outlets of the dual-drain system, as well as from the influent and effluent of the vertical flow clarifier unit and the corresponding culture tanks. Samples collected from replicate tanks were averaged to represent each time point. At the influent and effluent of the rotating drum microfilter, 100 mL water samples were randomly collected, and TSS concentrations were determined using the gravimetric method [16]. He discharge flow ratio between the main and auxiliary outlets of the dual-drain system was maintained at 1:9.
The solid–liquid separation efficiency of each stage in the solid–liquid separation device is calculated as:
In the formula: ηv represents the efficiency of the dual-drain system, expressed in percentage, %; ηs represents the solid removal efficiency of the vertical flow clarifier device, %; ηf represents the solid retention rate of the rotating drum microfilter, %; Ch represents the TSS concentration of the primary solids outlet, mg/L; Cl represents the TSS concentration of the secondary water outlet, mg/L; Cs,in represents the TSS concentration of the influent water entering the vertical flow clarifier tank, mg/L; Cs,out represents the TSS concentration of the effluent water exiting the vertical flow clarifier tank, mg/L; Cf,in represents the TSS concentration of the influent water entering the rotating drum microfilter, mg/L; Cf,out represents the TSS concentration of the effluent water exiting the rotating drum microfilter, mg/L; k represents the design flow ratio between the secondary water outlet and the primary solids outlet, with k = 9 for this system.
2.5. Removal Performance of the Biofilter for TAN and NO2−-N
Sampling was conducted hourly during 0–24 h post-feeding. At each sampling time point, 50 mL water samples were simultaneously collected from the influent and effluent of the biofilter. TAN and NO2−-N concentrations were determined using ultraviolet spectrophotometry in accordance with standard methods [18]. The entire experiment was repeated three times.
The hourly nitrification rate is calculated as:
In the formula: NRi represents the nitrification rate during the i-th hour, expressed as g TAN/(m3 biofilter volume h); Cin,i represents the ammonium-N concentration at the influent of the biofilter during the i-th hour, mg/L; Cout,i represents the total ammonium-N concentration at the effluent of the biofilter, mg/L; Q represents the water flow rate through the biofilter, L/h; and Vbio represents the effective volume of the biofilter in the recirculating aquaculture system, m3.
2.6. Composition of Microbial Community in Biological Filter
Filter media (Tongxiang Small Boss Special Plastic Products Co., Ltd., Jiaxing, China) samples were collected from two biofilters (BF_1 and BF_2) using a five-point sampling method. At each point, three pieces of filter media were collected, cut into small fragments, and pooled to form a composite sample. Approximately 15 g of each composite sample was placed into pre-labeled 50 mL centrifuge tubes (Jinbeirui Biotechnology (Shanghai) Co., Ltd., Shanghai, China) [20], followed by the addition of 40 mL of distilled water. For each biological filter, seven parallel composite samples were prepared (n = 7). All samples were immediately snap-frozen in liquid nitrogen upon collection and subsequently stored at −80 °C until further analysis.
The preserved samples were sent to Shanghai Majorbio Bio-pharm Technology Co., Ltd., Shanghai, China. for high-throughput sequencing on an Illumina MiSeq platform. The V3–V4 hypervariable region of the bacterial 16S rRNA gene was amplified by PCR using the universal primers 338F (5′-ACTCCTACGGGAGGCAGCAG-3′) and 806R (5′-GGACTACHVGGGTWTCTAAT-3′) [21].
The Chao1 and Simpson indices are calculated based on the measured data as follows:
In the formula above, Schao1 represents the estimated number of ASVs; Sobs represents the observed number of ASVs; n1 represents the number of ASVs containing only one sequence; n2 represents the number of ASVs containing only two sequences; Hshannon represents the Shannon diversity index; ni represents the number of sequences contained in the i-th ASV; and N represents the total number of sequences.
2.7. Data Analysis and Processing
The collected data were processed and organized using Microsoft Excel (2016). Temporal trends of water quality parameters were analyzed using a Linear Mixed Model (LMM), in which time and its squared term (time2) were included as continuous fixed effects to assess linear and quadratic trends, and tanks/replicates were treated as random intercepts to account for the non-independence of repeated measurements. Model parameters were estimated using restricted maximum likelihood (REML), and degrees of freedom were adjusted using the Satterthwaite method. Significance of fixed effects was evaluated via Type III F-tests with a significance level of α = 0.05. All statistical analyses were conducted in SPSS Statistics version 27.0.1.0 (IBM Corp., Armonk, NY, USA), and figures were generated using Origin 2024. Experimental data are presented as mean ± standard deviation ( ± SD).
Microbial community composition was analyzed using the Meiji Bioinformatics Platform (https://analysis.majorbio.com/asv/overview/task_id/apl1_s31i9ivg5j5n1is0fe4fa3, accessed on 3 December 2025), which provided systematic interpretation of microbiome data. Alpha diversity indices (Chao1 and Shannon) were calculated for each sample to evaluate community richness and evenness. Venn analysis was used to visualize shared and unique amplicon sequence variants (ASVs) between the two-stage biofilters, and bar plots were generated to display the relative abundance of dominant microbial taxa in each stage.
3. Results
3.1. Changes in the Content of the Stomach and Intestine in Mandarin Fish
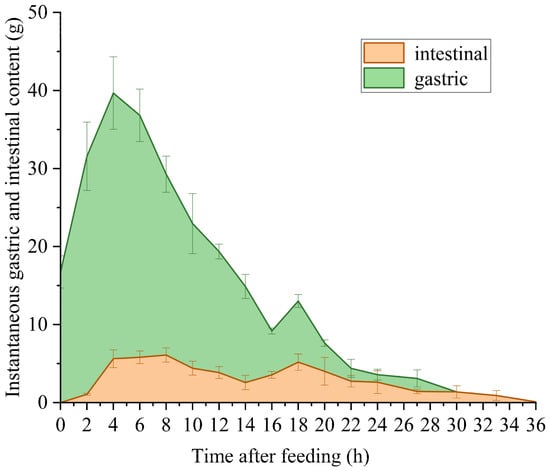
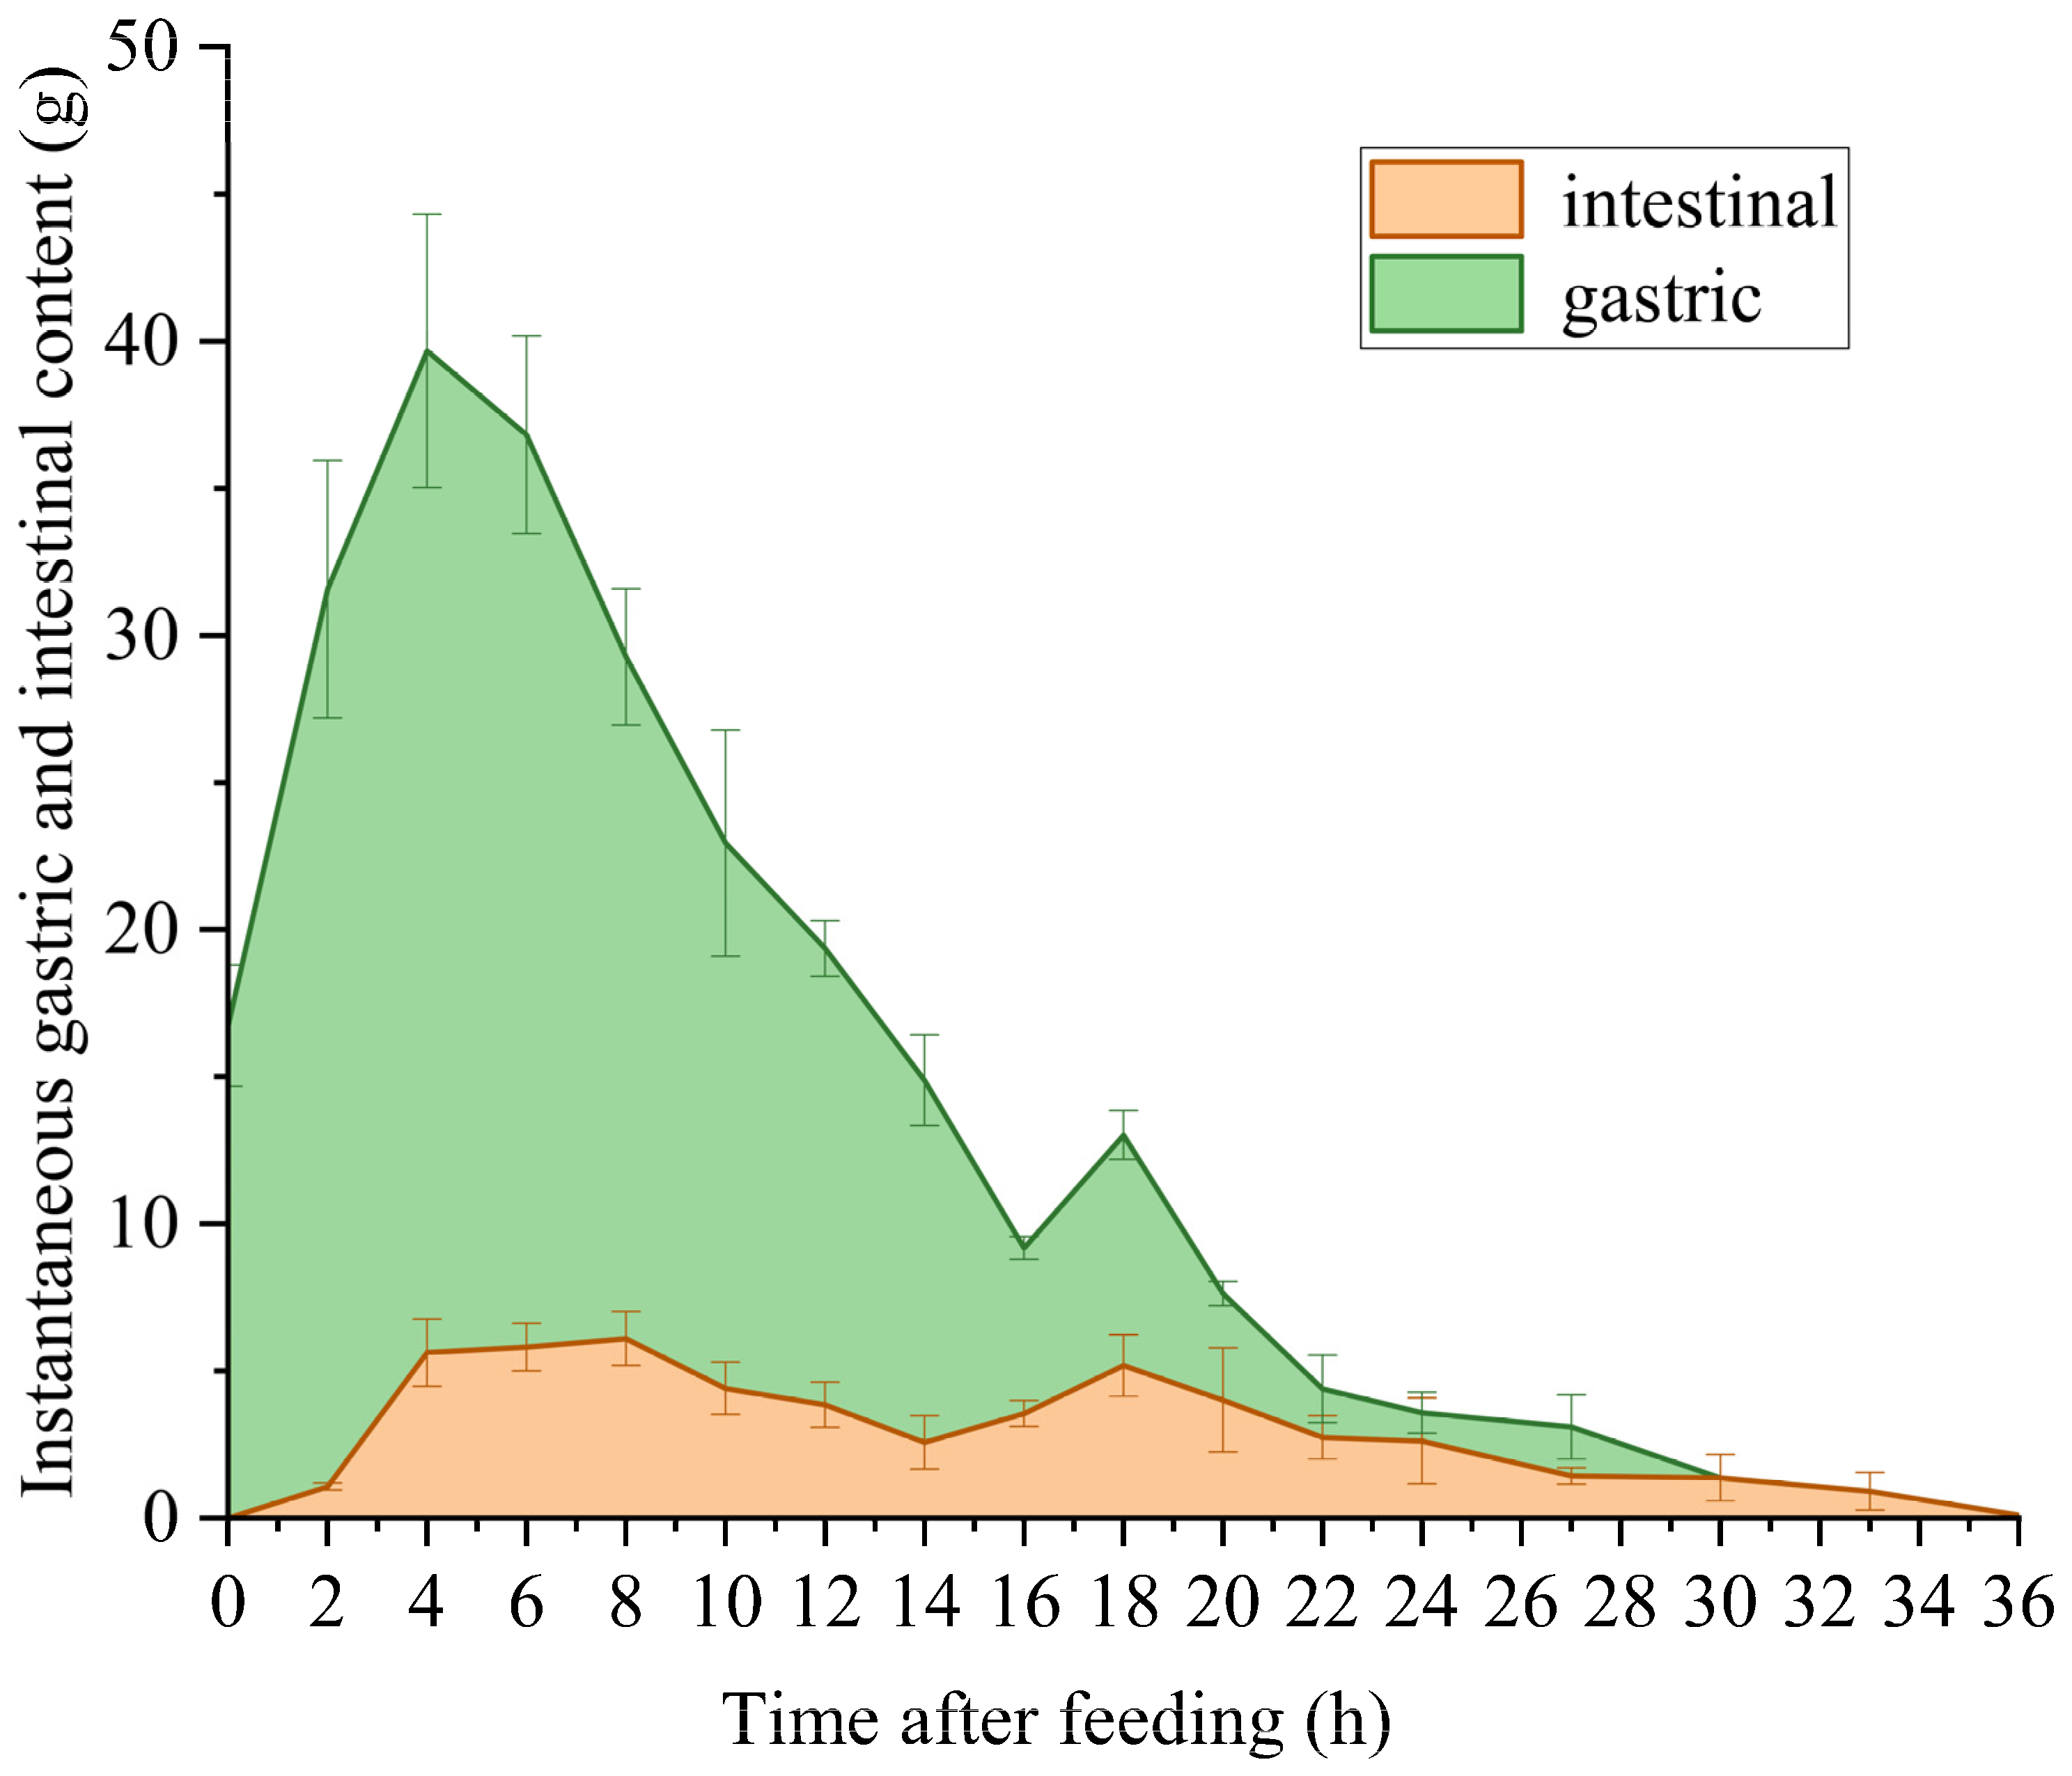
The gastric and intestinal contents of mandarin fish exhibited significant temporal variation (p < 0.05). Gastric content initially increased and then decreased over time. In contrast, intestinal content showed a more complex, multiphasic pattern, with an initial rise, followed by a decline, a secondary increase, and a final decrease. Gastric content increased initially and reached a peak at 4 h post-feeding, followed by a general decline. After reaching a trough at 16 h, a minor secondary peak was observed, after which gastric content continuously decreased until complete gastric emptying at 30 h post-feeding. In contrast, intestinal content showed a more complex, multiphasic pattern. It increased most rapidly between 2–4 h post-feeding, began to decline from 8 h, and reached the first trough at 14 h. Subsequently, intestinal content increased again and peaked at 18 h, followed by a gradual decrease until complete intestinal emptying at 39 h post-feeding (Figure 2).
Figure 2.
Instantaneous changes in stomach and intestinal contents of mandarin fish. Note: Values are presented as mean ± standard deviation (n = 3).
3.2. Changes in TSS Concentration and COD in the Main Discharge Outlet and Culture Tank During 24 h Post-Feeding
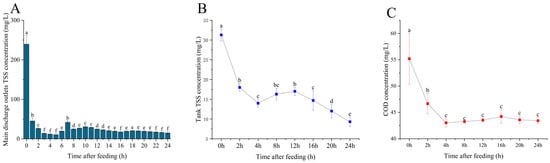
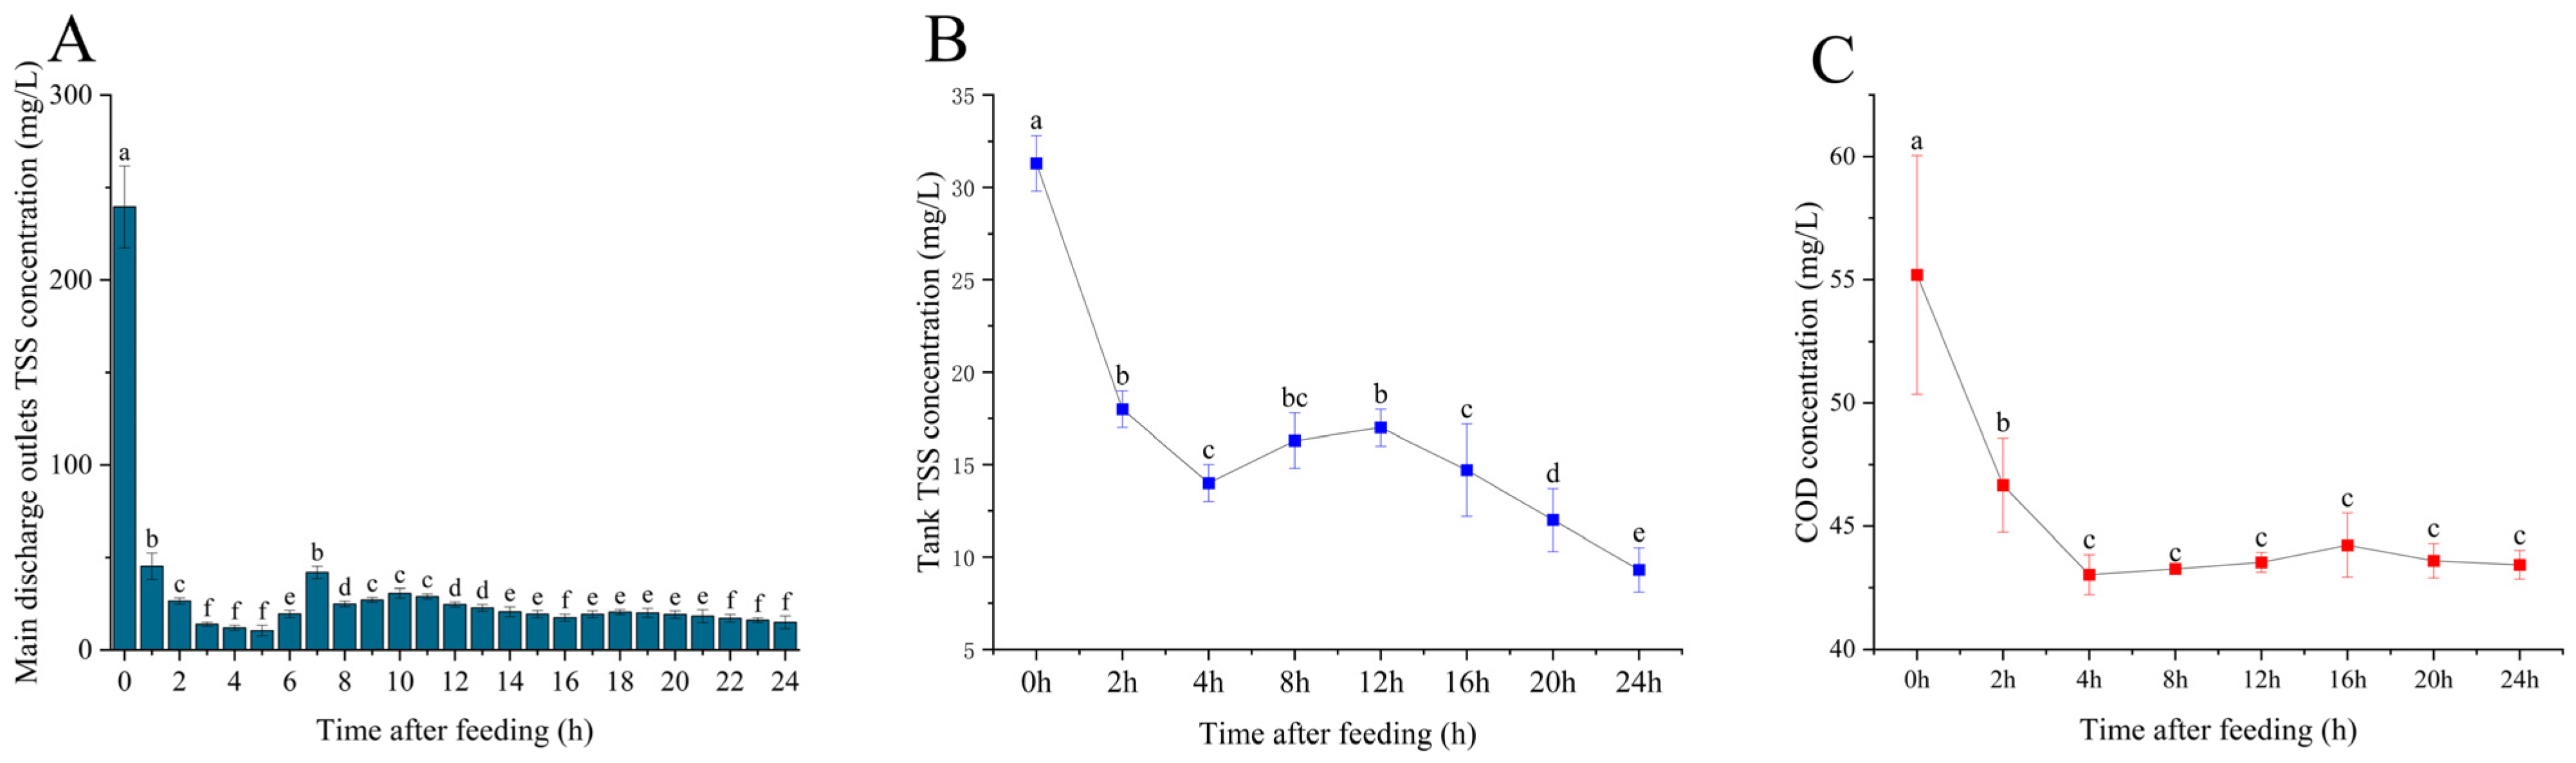
The concentrations of TSS at the main discharge outlet and within the culture tank, as well as COD, exhibited pronounced diurnal variations over the 0–24 h post-feeding period (TSS at the main discharge outlet, p < 0.05; TSS in the tank, p < 0.05; COD, p < 0.05), with ranges of 10.3–239.5 mg/L, 14.0–31.3 mg/L, and 43.0–55.2 mg/L, respectively. TSS at the main discharge outlet peaked immediately after feeding (0 h), decreased rapidly during 0–2 h, reached a minimum at 5 h, increased slightly from 5–6 h, and displayed a bimodalpattern from 6–24 h, with the first peak (6–16 h) being higher than the second peak (16–24 h) (Figure 3A). In the culture tank, TSS concentration was also highest at 0 h post-feeding, followed by a rapid decrease during 0–2 h and a slower decline during 2–4 h. A secondary peak was observed at 12 h, after which TSS gradually decreased (Figure 3B). COD concentration peaked at 0 h post-feeding, decreased during the first 4 h, showed a slight increase during 4–16 h, and subsequently declined after 16 h (Figure 3C).
Figure 3.
Temporal changes in TSS in the main drain and culture tank, and COD in the culture tank during 0–24 h post-feeding. (A) TSS concentration at the main discharge outlet, (B) TSS concentration in the culture tank, (C) COD concentration in the culture tank water. Note: Data are presented as mean ± standard deviation (n = 3). In the figure, different lowercase letters indicate significant differences between groups (p < 0.05), while the same lowercase letters indicate no significant differences between groups (p > 0.05).
The theoretical daily TSS production rate was 2.85 g TSS/(kg biomass d), and the theoretical TAN load was 0.6 g TAN/(kg biomass d) (Table 3).
Table 3.
TSS production and TAN loading.
3.3. Solid–Liquid Separation Efficiency
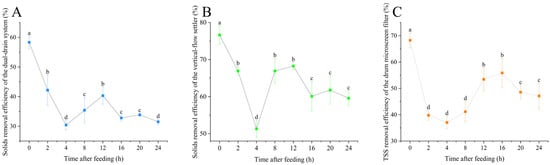
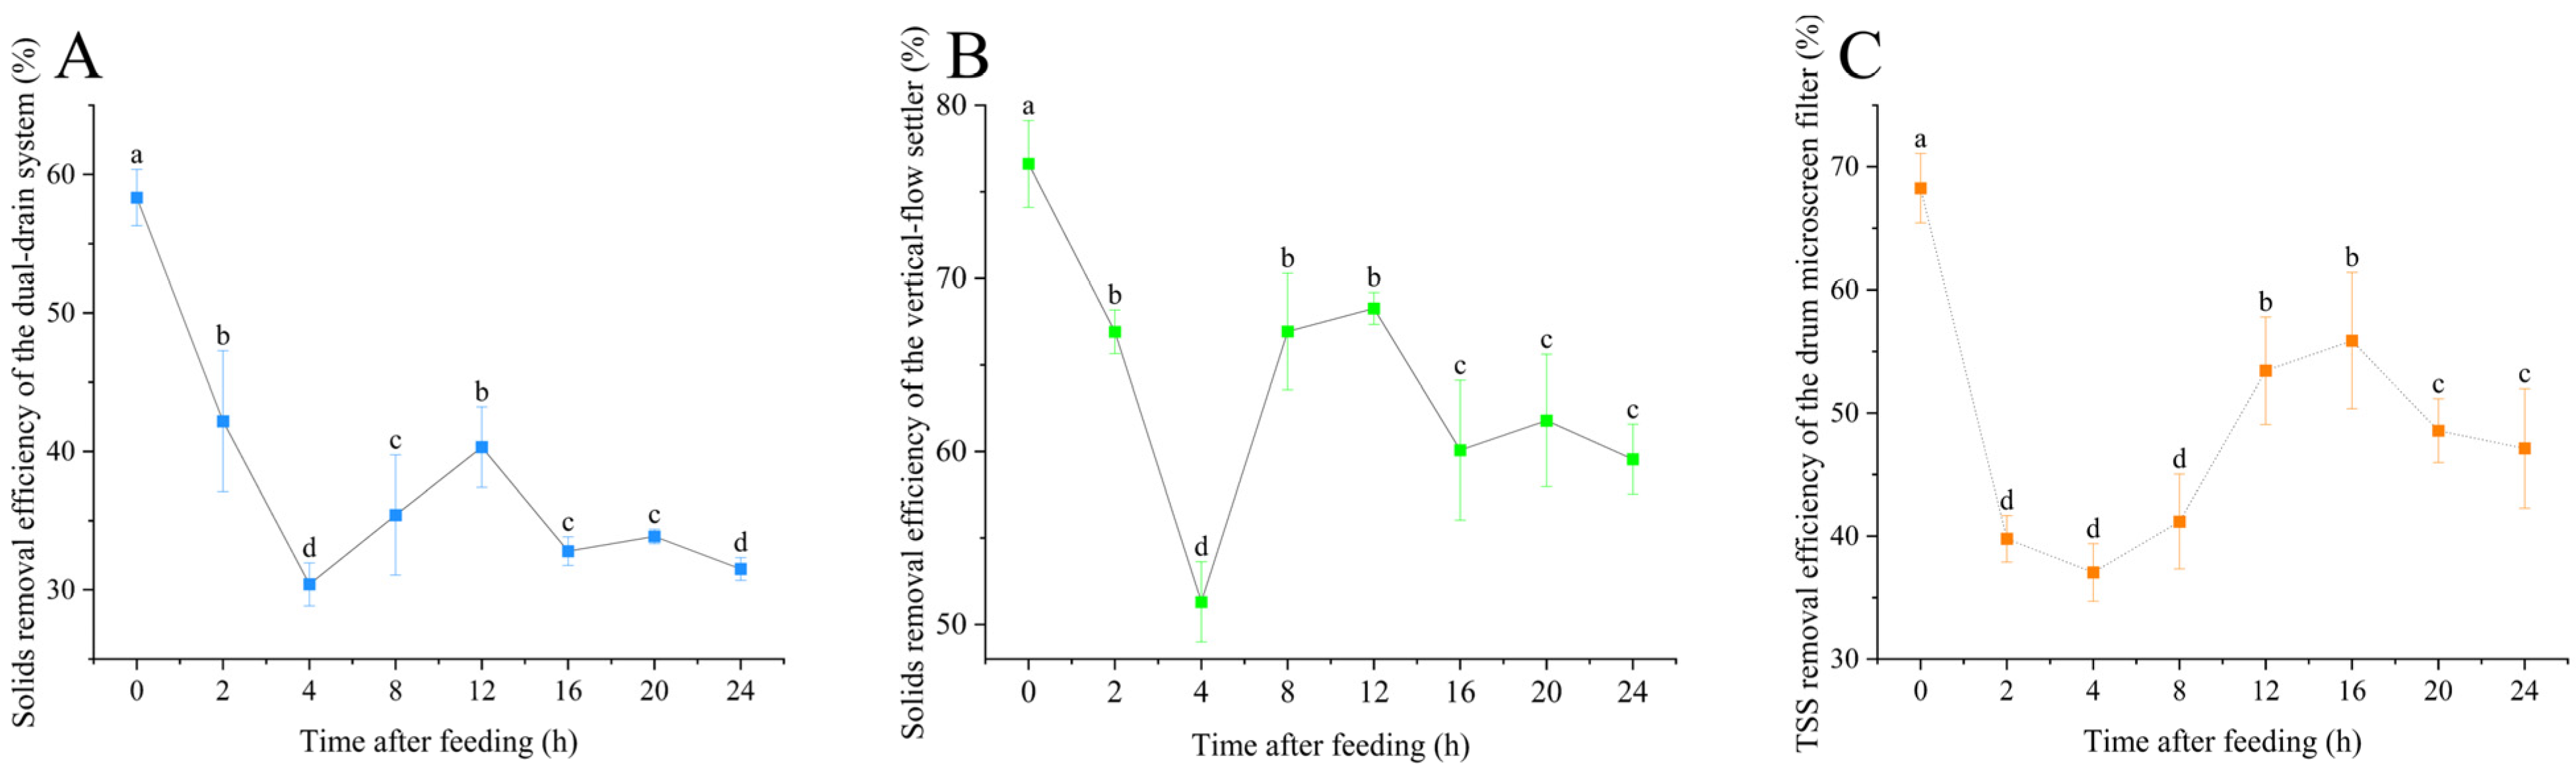
The separation efficiencies of the three solid–liquid separation devices exhibited pronounced diurnal variations. The dual-drain system showed significant daily fluctuations (p < 0.05), with efficiencies ranging from 30.40–58.33%, with the highest value observed at 0 h post-feeding (58.33%) and the lowest at 4 h (30.40%) (Figure 4A). The vertical flow clarifier exhibited no significant daily variation (p > 0.05), with efficiencies of 51.30–76.61%, reaching a maximum at 0 h and a minimum at 4 h post-feeding (Figure 4B). The microfilter also showed no significant daily variation (p > 0.05), with efficiencies ranging from 37.04–68.26%, peak at 0 h post-feeding and reaching the lowest value at 4 h (Figure 4C).
Figure 4.
Solid–liquid separation efficiency of the separation device after feeding. (A) Solids removal efficiency of the dual-drain system, (B) Solids removal efficiency of the vertical-flow senter, (C) TSS removal efficiency of the drum microscreen filter. Note: Data are presented as mean ± standard deviation (n = 3). In the figure, different lowercase letters indicate significant differences between groups (p < 0.05), while the same lowercase letters indicate no significant differences between groups (p > 0.05).
3.4. Water Quality Change in Culture Tank
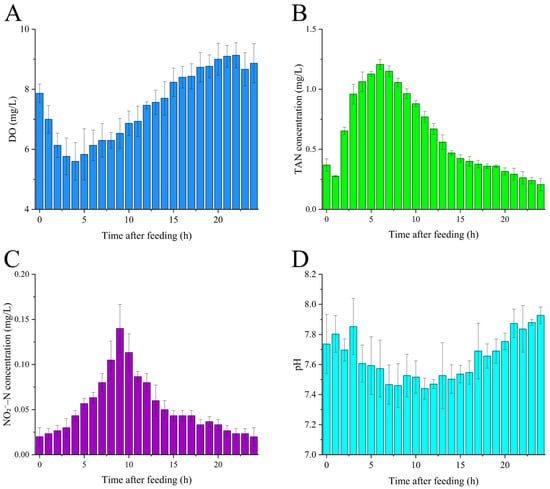
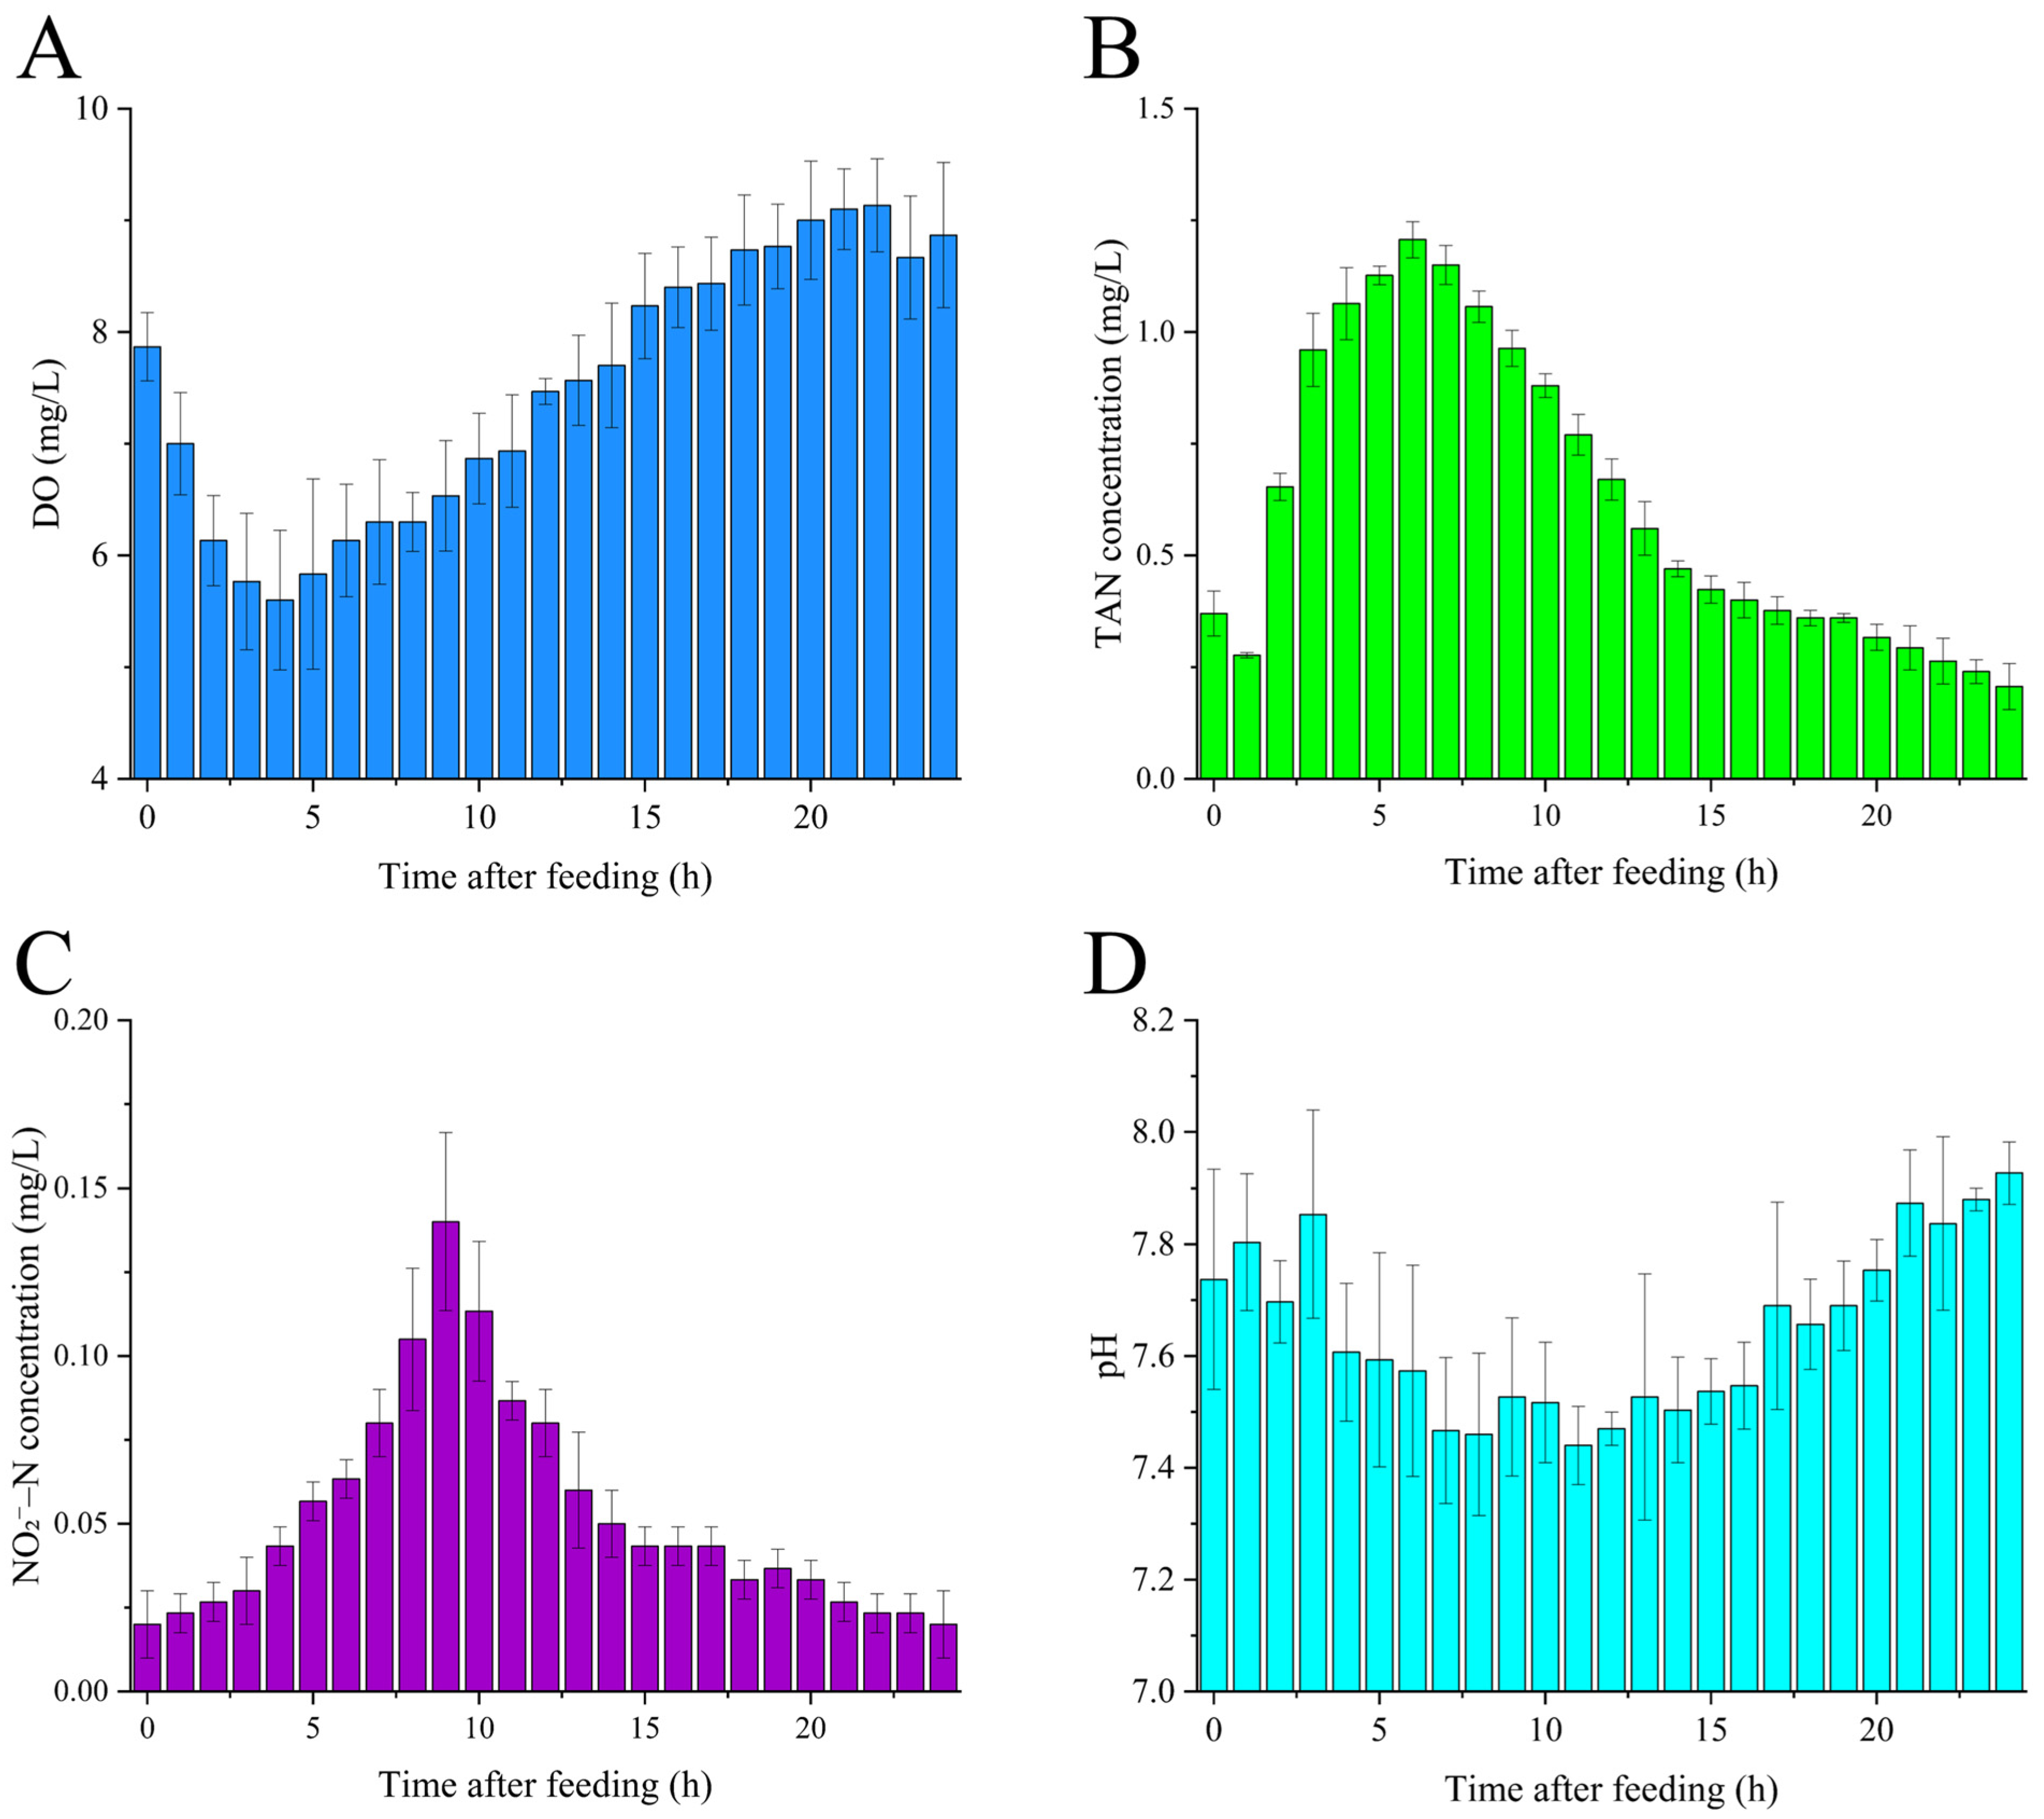
Following feeding, water quality parameters in the culture tank exhibited pronounced temporal dynamics. DO in the culture tank decreased significantly after feeding compared with pre-feeding levels (p < 0.05), declining from 8.87 mg/L before feeding to 7.87 mg/L post-feeding, DO exhibited a temporal pattern of initial decline followed by a gradual increase, reaching a minimum at 4 h post-feeding (Figure 5A). TAN concentration varied significantly over time (p < 0.05), showing an overall pattern of increase followed by a decrease. TAN gradually increased after feeding, peaking at 6 h post-feeding, and then decreased gradually (Figure 5B). Nitrite nitrogen (NO2−-N) concentration also changed significantly over time (p < 0.05), following a similar overall trend of initial rise and subsequent decline, with the peak occurring later than that of TAN; after a slight decrease during 0–2 h post-feeding, NO2−-N increased progressively to a maximum at 9 h and then gradually declined (Figure 5C). pH showed significant temporal variation (p < 0.05), exhibiting an initial decline after feeding, reaching a minimum at 11 h post-feeding, and subsequently rising, with the highest pH observed prior to feeding (Figure 5D).
Figure 5.
Patterns of water quality indicators in culture tank after feeding. (A) Dissolved oxygen concentration, (B) Total ammonia nitrogen concentration, (C) Nitrite nitrogen concentration, (D) pH. Note: Values are presented as mean ± standard deviation (n = 3).
3.5. Changes in Ammonia Nitrogen and Nitrite Concentrations in Biofilters
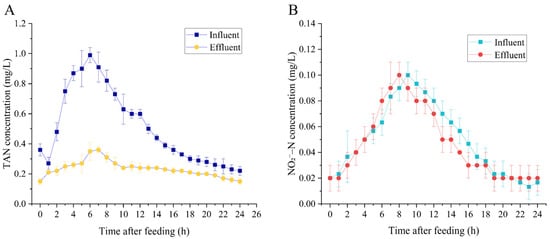
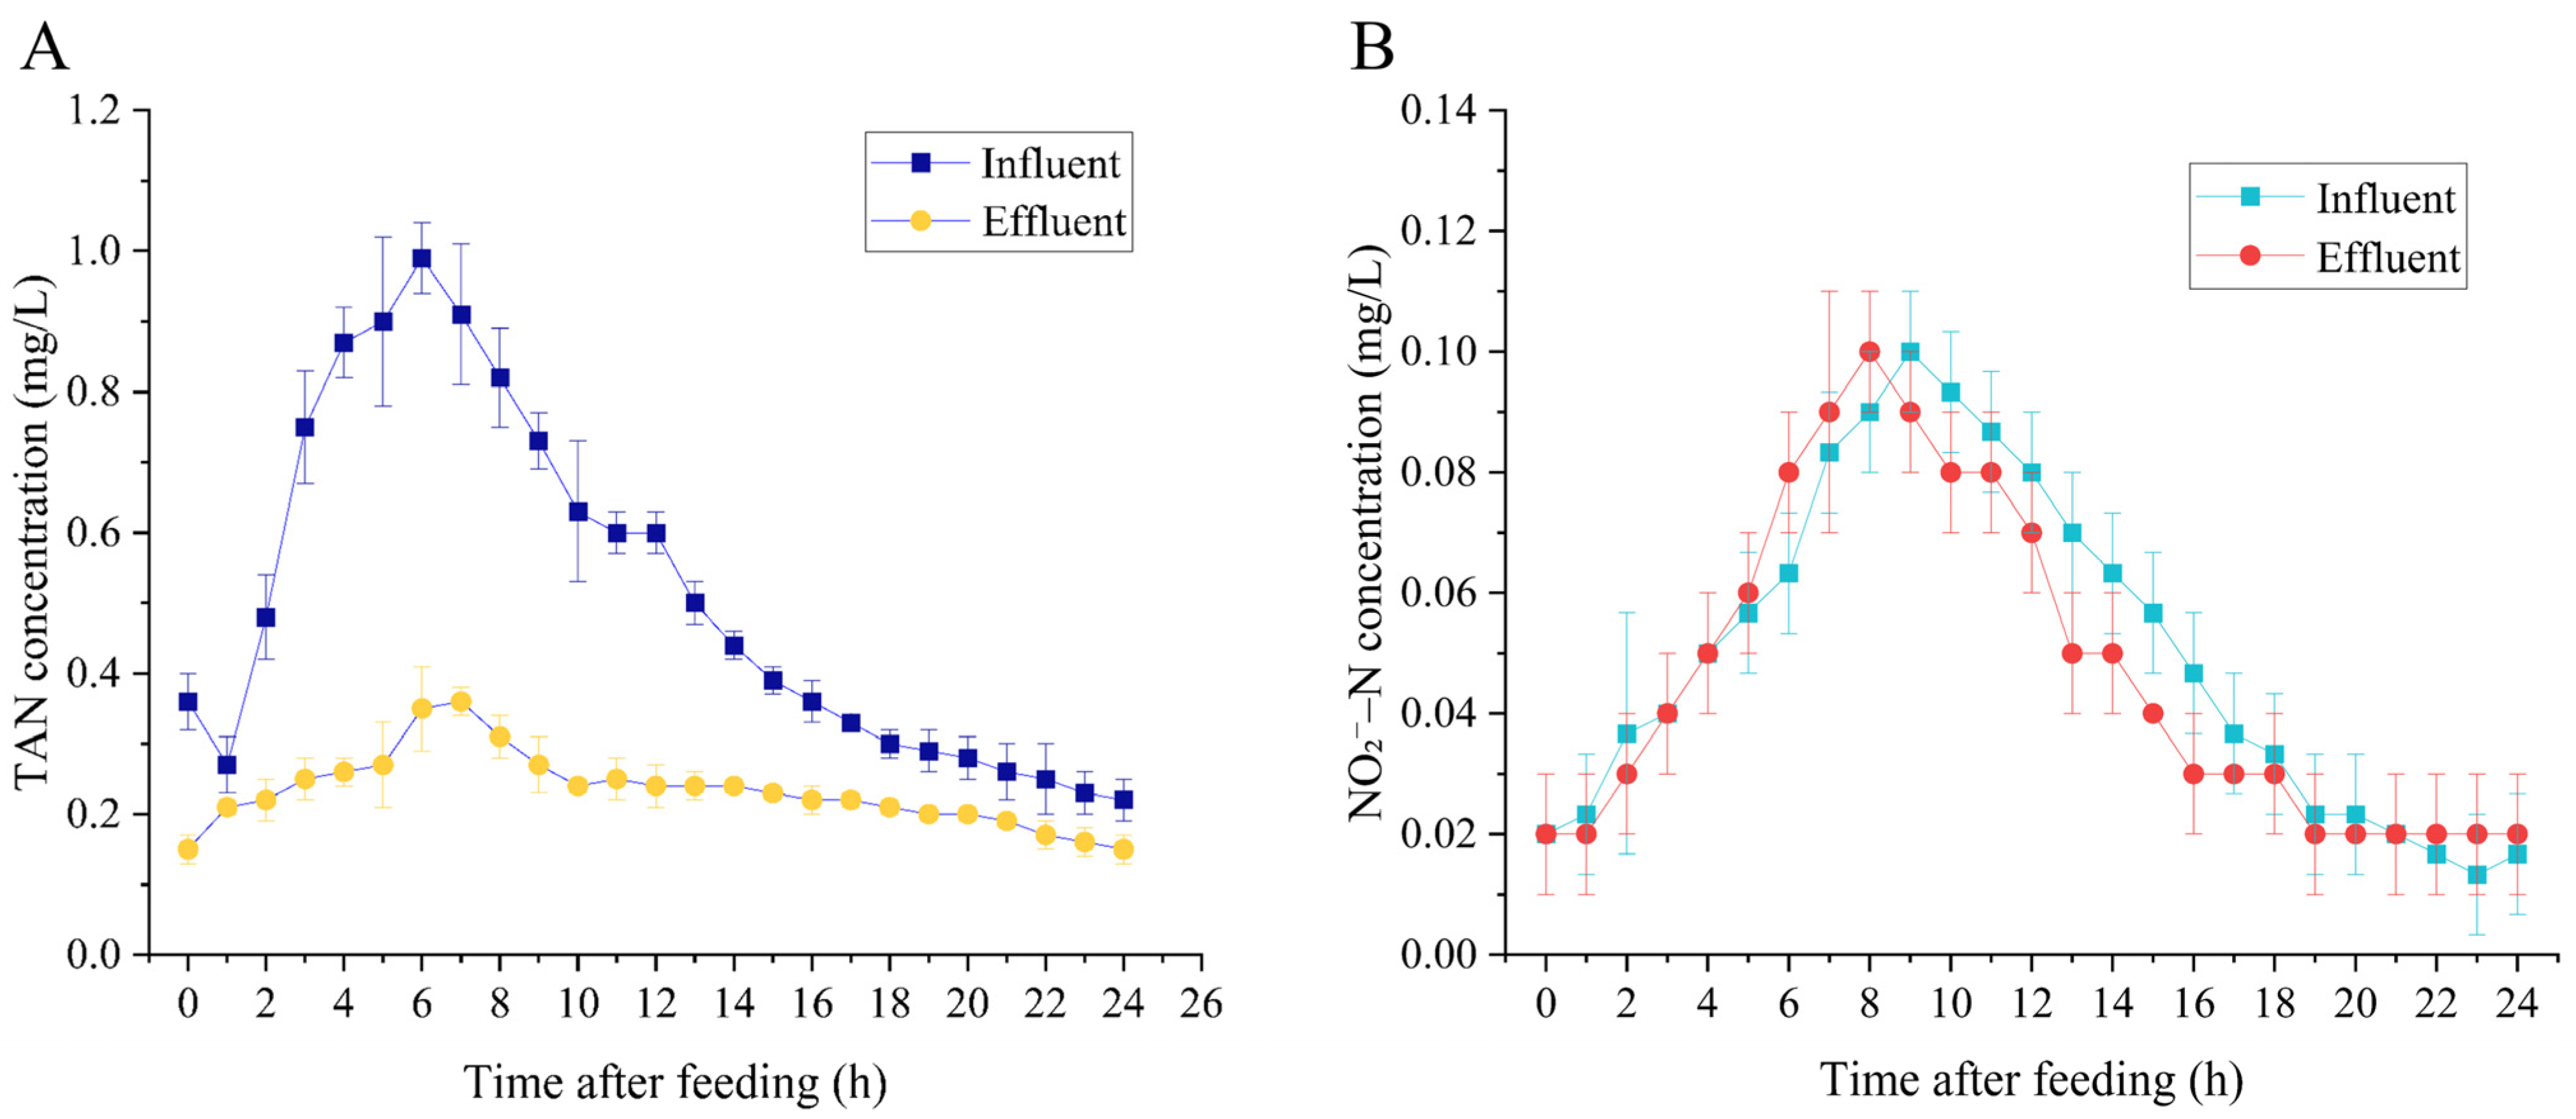
The biofilter effectively reduced TAN concentrations. TAN concentrations in the influent ranged from 0.22–0.99 mg/L, whereas effluent concentrations were maintained at a lower level of 0.15–0.36 mg/L. Influent TAN exhibited a distinct temporal pattern, decreasing during 0–1 h post-feeding, increasing during 1–6 h, and subsequently declining during 6–24 h, with a rapid decrease in the early phase followed by a more gradual decrease. In contrast, effluent TAN concentrations remained relatively stable at low levels throughout the experimental period (Figure 6A). Compared with TAN, the biofilter showed a weaker removal performance for NO2−-N. NO2−-N concentrations in the influent ranged from 0.02–0.10 mg/L, which was comparable to those measured in the effluent (0.02–0.10 mg/L), and no pronounced difference between influent and effluent concentrations was observed (Figure 6B).
Figure 6.
Changes in ammonia nitrogen and nitrite levels after feeding. (A) Diurnal variation in total ammonia nitrogen concentrations at the influent and effluent of the biofilter, (B) Diurnal variation in nitrite nitrogen concentrations at the influent and effluent of the biofilter. Note: Values are presented as mean ± standard deviation (n = 3).
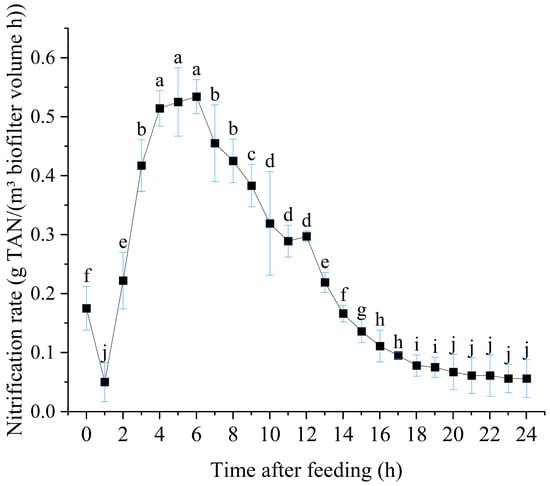
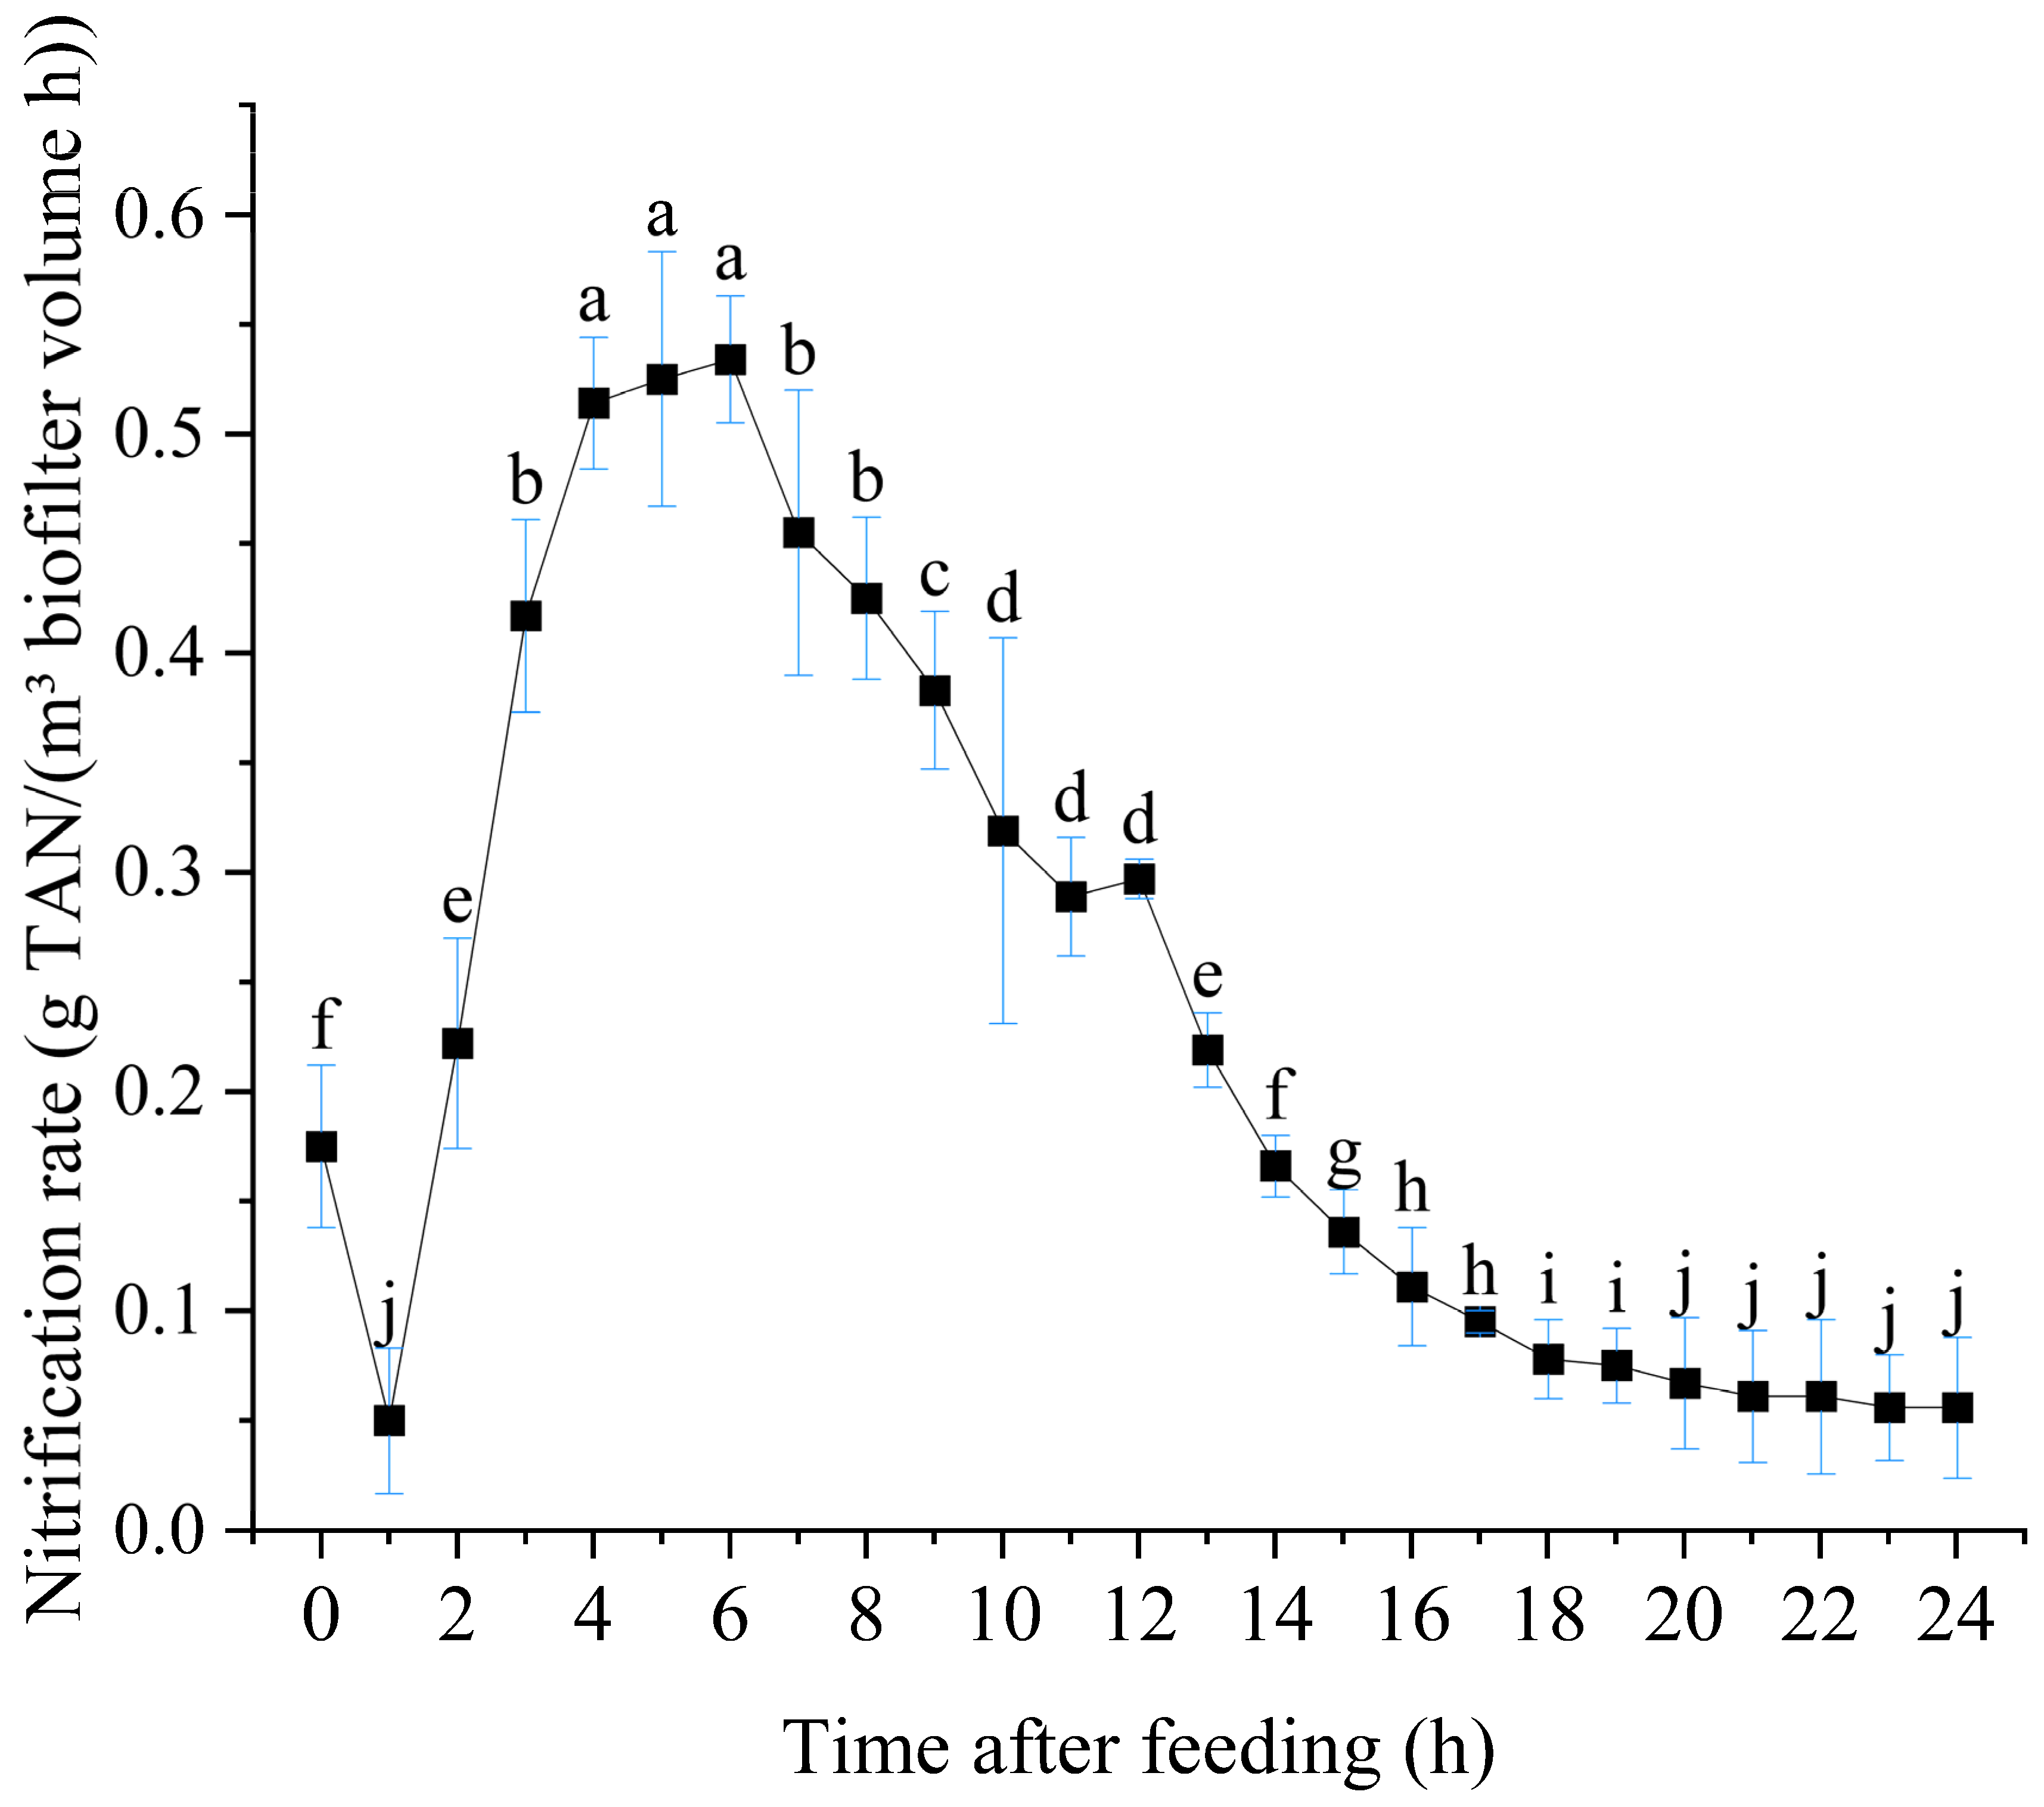
The nitrification rate of the biofilter exhibited a distinct temporal pattern, decreasing during 0–1 h post-feeding, increasing during 1–6 h, and subsequently declining thereafter. The rate reached a peak of 0.534 g TAN/(m3 biofilter volume h) at 6 h, followed by an overall gradual decrease throughout the remaining period (Figure 7).
Figure 7.
Nitrification rate of biofilter 24 h after feeding. Note: Data are presented as mean ± standard deviation (n = 3). In the figure, different lowercase letters indicate significant differences between groups (p < 0.05), while the same lowercase letters indicate no significant differences between groups (p > 0.05).
3.6. Microbial Communities in Biofilters
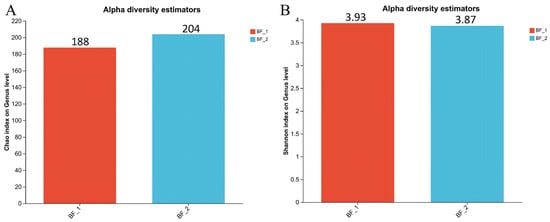
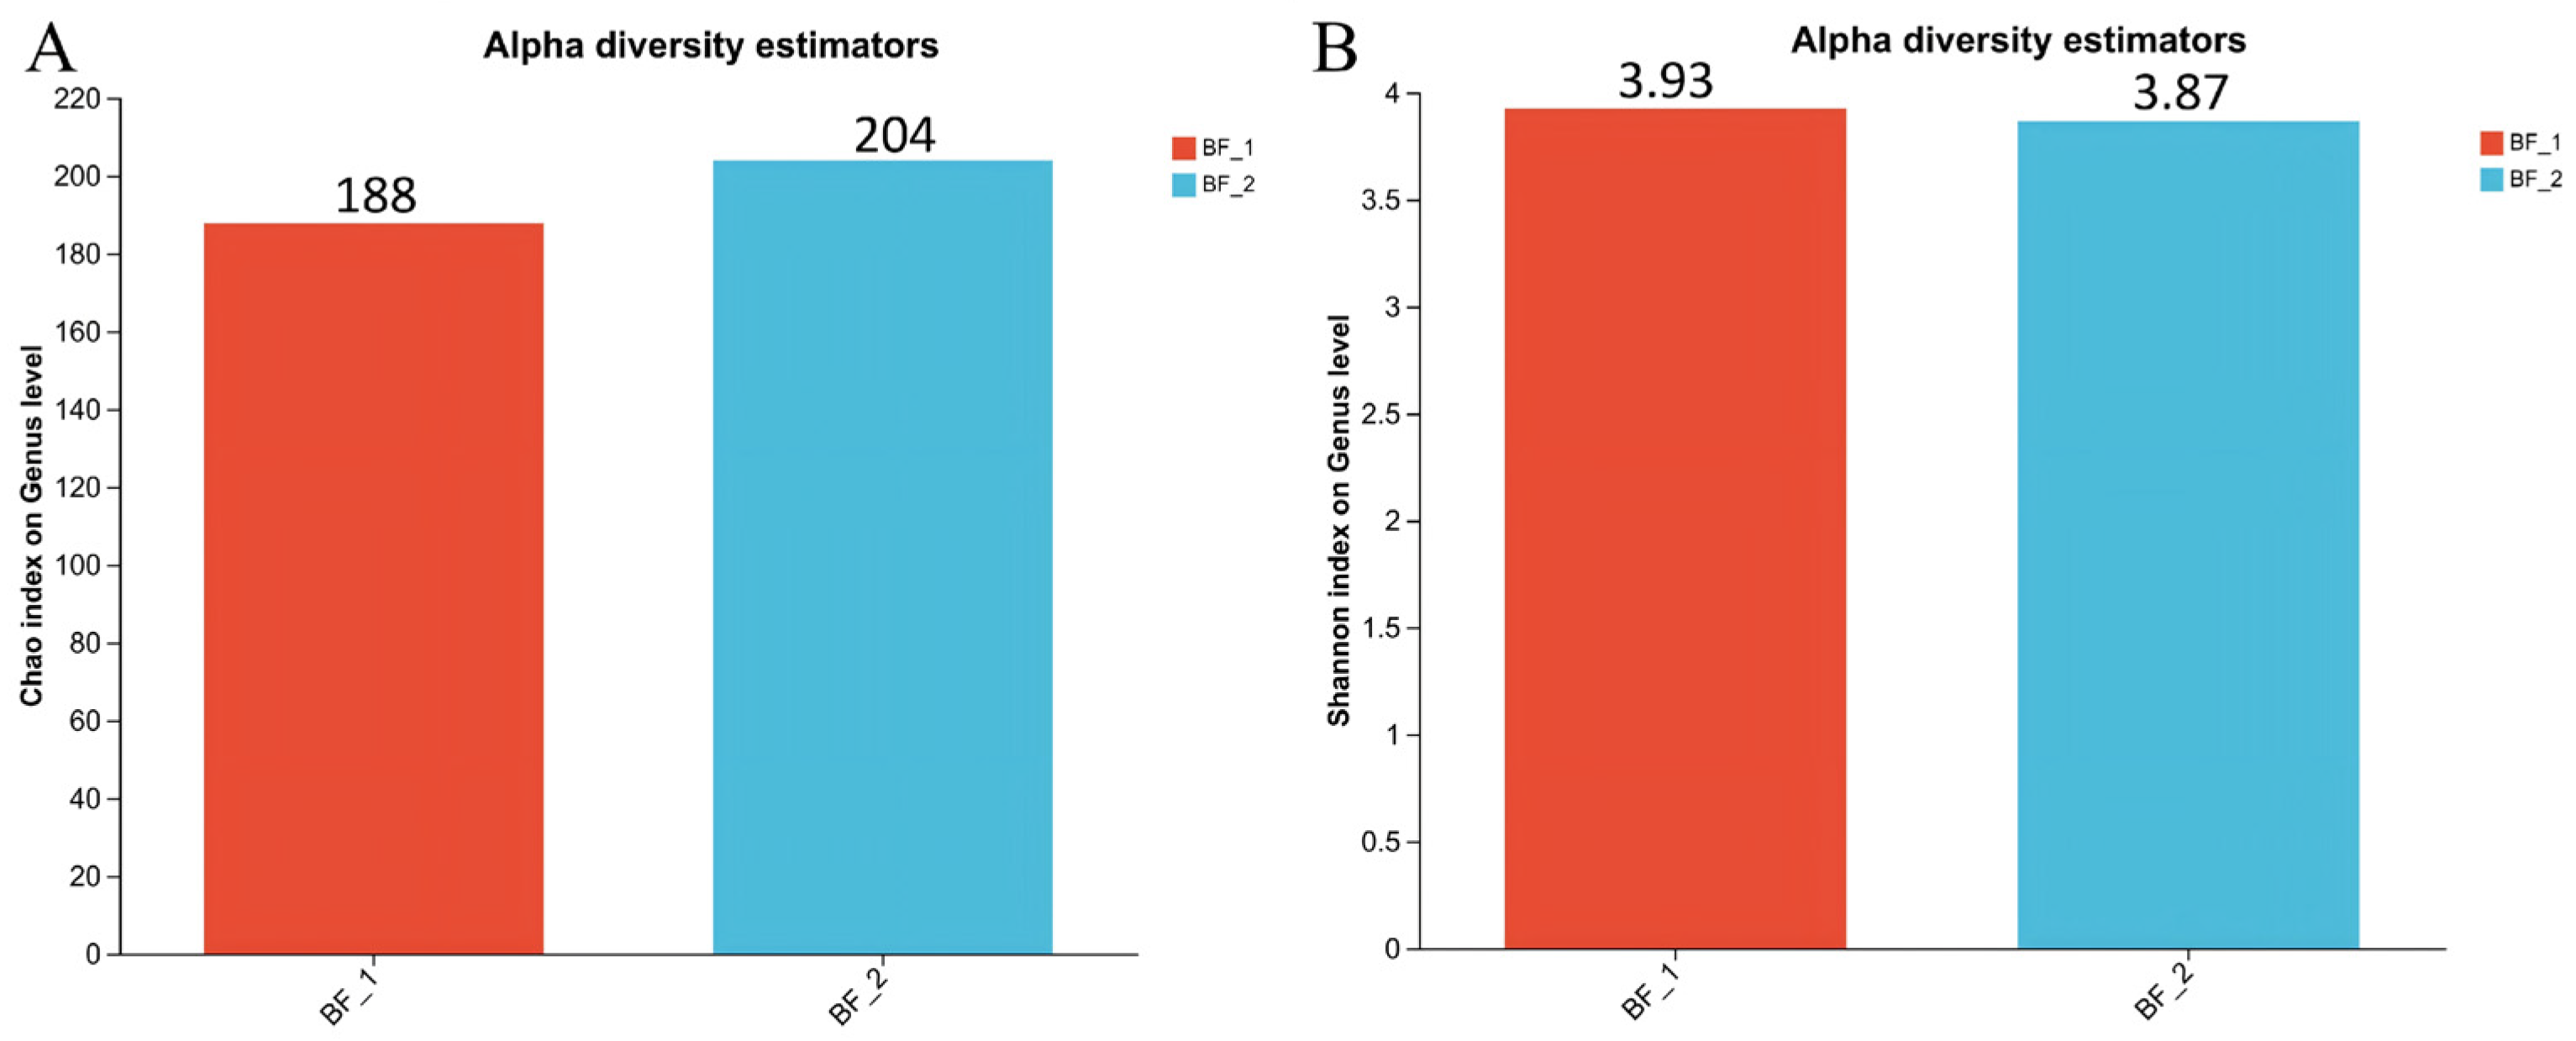
A total of 31 microbial phyla, 402 genera, and 1516 amplicon sequence variants (ASVs) were detected across the biofilters. The two biofilters shared 28 phyla (29 in BF_1 and 30 in BF_2), 259 genera (324 in BF_1 and 337 in BF_2), and 586 ASVs. Alpha diversity analysis indicated that BF_1 and BF_2 did not differ significantly in species richness (Chao1 index) or community diversity (Shannon index) (p > 0.05). The observed Chao1 value of BF_2 (204) was comparable to that of BF_1 (188), and the Shannon indices of BF_1 (3.93) and BF_2 (3.87) were similar, with no significant difference (Figure 8). These results suggest that both biofilters maintained broadly comparable microbial diversity structures at the community level.
Figure 8.
Alpha diversity of the microbial community at the genus level. (A) Chao1 index at the genus level, (B) Shannon index at the genus level. Note: Values are presented as mean ± standard deviation (n = 7).
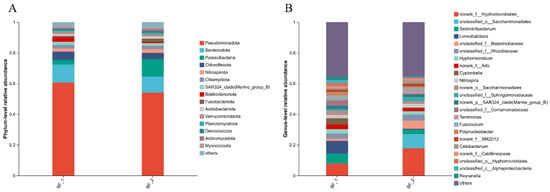
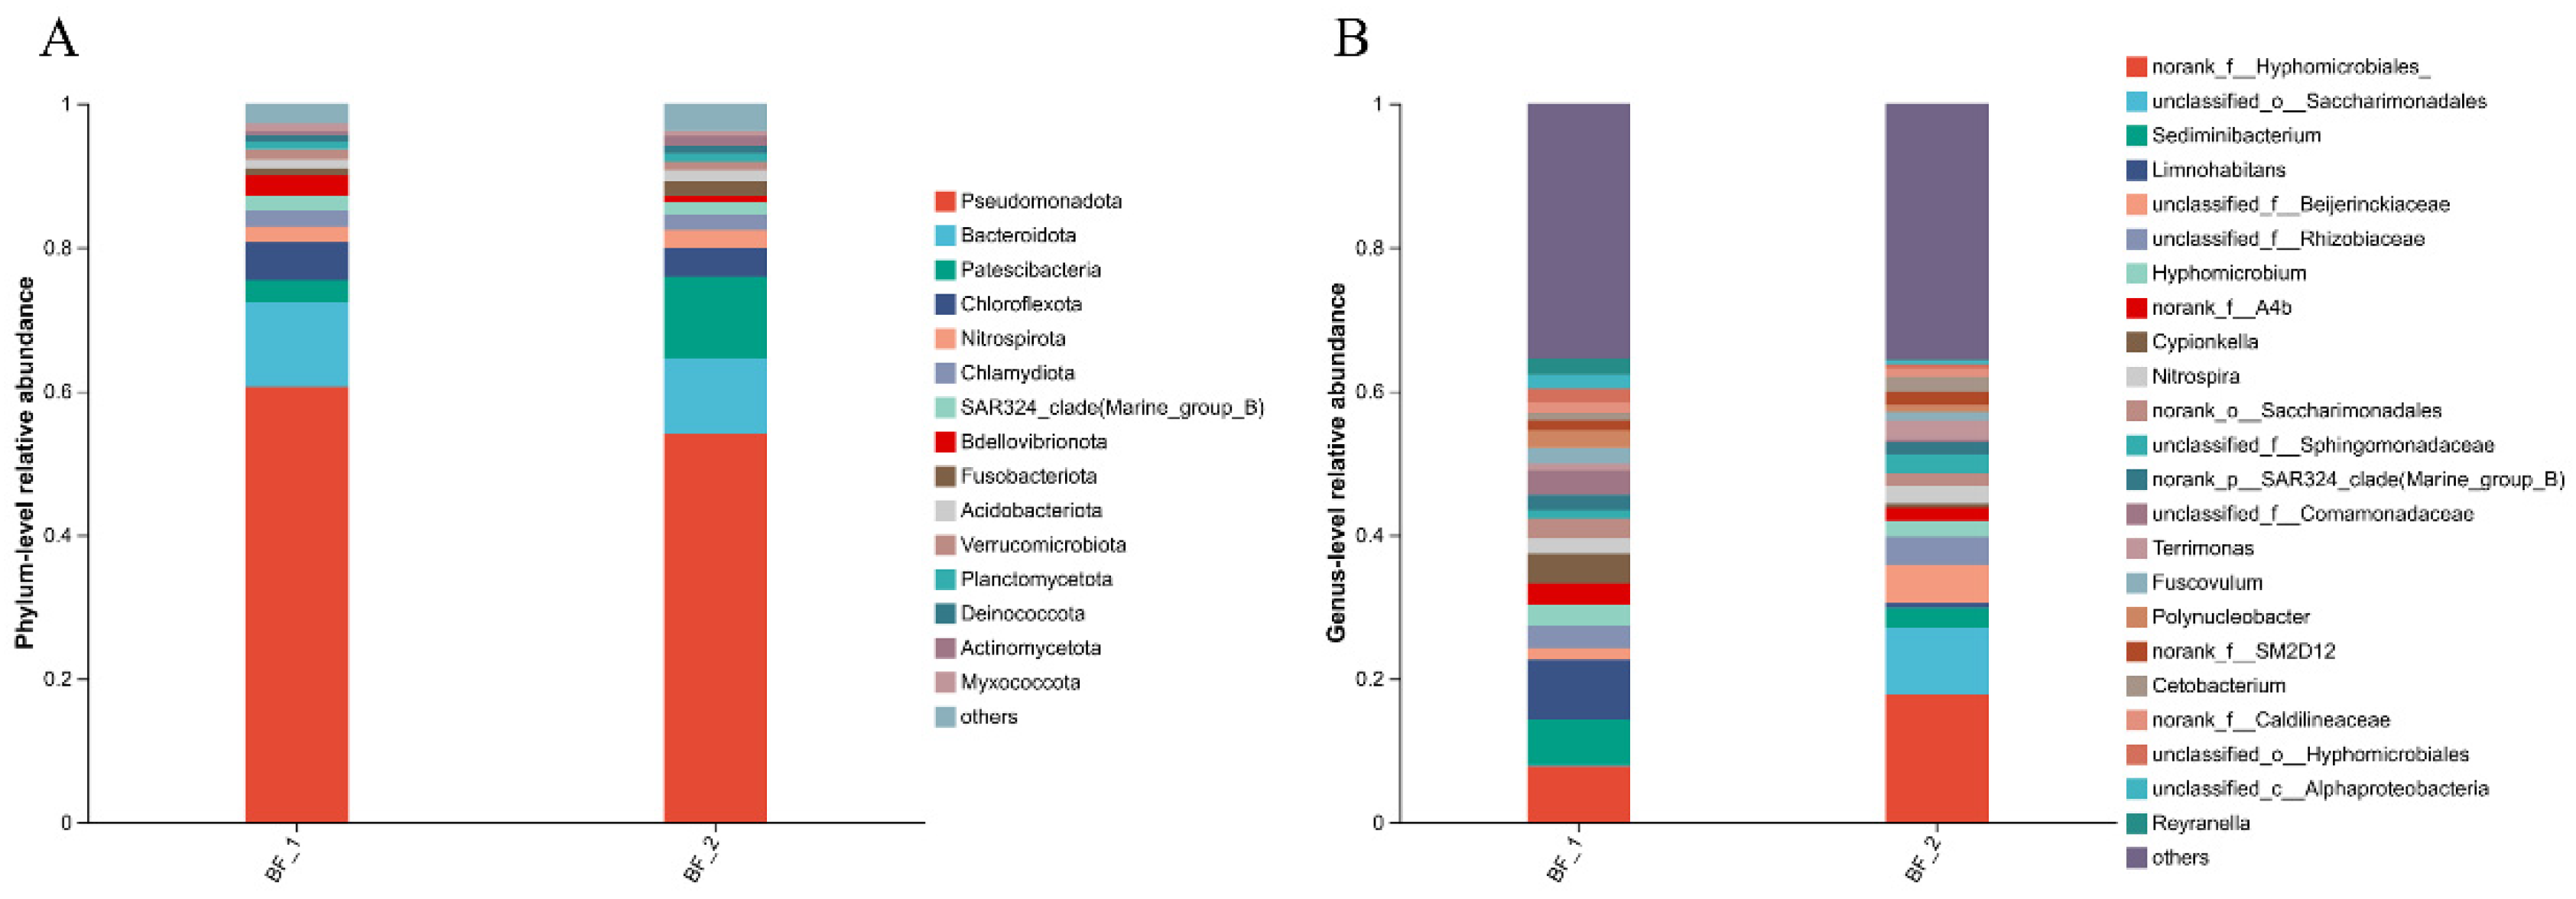
Phylum-level analysis indicated that the microbial community structures of BF_1 and BF_2 were highly similar, with Pseudomonadota dominating both communities and accounting for 54–61% of the total relative abundance. Other abundant phyla included Bacteroidota (10–12%), Patescibacteria (3–11%), and Chloroflexota (4–5%), whereas Nitrospirota (2%) and Actinobacteria (0.5–1.5%) were consistently detected at lower relative abundances (Figure 9A). At the genus level, the microbial communities in both biofilters comprised a diverse assemblage of taxa without a single genus showing absolute dominance. Although differences in relative abundance were observed between BF_1 and BF_2, the communities were primarily composed of taxa affiliated with Pseudomonadota and Bacteroidota. The dominant genera in BF_1 were norank_f__Hyphomicrobiales_ (8%), Sediminibacterium (8%), and Limnohabitans (6%), whereas BF_2 was characterized by a higher relative abundance of norank_f__Hyphomicrobiales_ (18%) and unclassified_o__Saccharimonadales (9%) (Figure 9B).
Figure 9.
Phylum and genus level community column chart. (A) Phylum level, (B) Genus level. Note: Values are presented as mean ± standard deviation (n = 7).
4. Discussion
4.1. Dynamics of Solid Waste Sources and Removal in Culture Tanks
In RAS, solid load mainly originates from uneaten feed and fish feces, and is primarily removed through sedimentation and filtration processes [2,22]. Feeding practices for mandarin fish differ from those of many other cultured species, as extruded feed typically requires pretreatment prior to feeding. To facilitate ingestion and digestion, pellets are commonly moistened with water, which softens the feed and promotes fragmentation, allowing fine particulate matter to be released into the water column during feeding. In addition, the elongated shape of the pellets, combined with the characteristic grasping and biting feeding behavior of mandarin fish [23], increases the likelihood of feed being crushed, abraded, or broken into fragments. Competitive feeding behavior further intensifies feed fragmentation. Collectively, these processes make fragmented and abraded feed an important contributor to solid waste immediately after feeding. Fecal production represents another major source of solid waste. Temporal changes in gastric and intestinal contents reflect postprandial digestion and excretion dynamics, with stomach contents increasing rapidly after feeding and subsequently declining during gastric emptying, while intestinal contents remain elevated, indicating the transfer and digestion of chyme. Notably, increases in solid waste concentration in the culture tanks exhibited a clear time lag relative to the decline in stomach contents, with staged elevations occurring mainly during the late phase of gastric emptying and the intestinal digestion period. This pattern supports the interpretation that fecal discharge following digestion and absorption likely constitutes a dominant source of solid waste during this stage. In RAS, such digestion-driven solid waste release dynamics may result in short-term fluctuations in particulate loading, with implications for the performance of solid–liquid separation units and the operational efficiency of biofilters. In this study, peaks in TSS concentration at the main discharge outlet of the culture tanks exhibited a clear temporal lag relative to the reduction in stomach contents, primarily occurring during the late stages of gastric emptying and intestinal digestion. This temporal pattern suggests that short-term fluctuations in solid load may be closely coupled with the digestive rhythms of the fish. Based on these observations, we propose that, under the experimental conditions, the solid waste discharged from the outlet in recirculating aquaculture systems (RAS) is primarily derived from feces formed after digestion and absorption, rather than from uneaten feed. Such digestion-driven release dynamics may produce predictable short-term fluctuations in particulate matter within the system, which could, in turn, periodically affect the performance of downstream solid–liquid separation units (e.g., microfilters) and biofilters. Future studies could directly test this hypothesis using tracer experiments or analyses of feces-specific markers.
The pronounced intra-day variability in TSS removal observed among the three solid–liquid separation units can be attributed primarily to feeding-driven fluctuations in solid loading and the dynamic evolution of particle size distribution. The TSS removal efficiencies of the dual-drain system, vertical flow clarifier, and drum microfilter ranged from 30.40–58.33%, 51.30–76.61%, and 37.04–68.26%, respectively. Higher removal efficiencies immediately after feeding and during fecal excretion likely reflect the presence of relatively intact and larger particles derived from uneaten feed and freshly produced feces. As time progressed, particles that were not promptly discharged gradually fragmented into finer fractions, which may explain the subsequent decline in separation performance. Consistent with previous studies on rainbow trout cultured in dual-drain systems [4], TSS concentrations at the primary drain were substantially higher than those at the secondary drain; however, the markedly elevated TSS concentrations at 0 h observed in this study likely reflect the specific feeding characteristics of mandarin fish and the use of moistened extruded feed. From 2–24 h post-feeding, TSS concentrations decreased to levels comparable to those reported for other cultured species. Differences in removal efficiency among separation units, particularly the relatively lower performance of the vertical flow clarifier and the higher efficiency of the drum microfilter compared with previous reports [12,13,24], further suggest that separation performance is strongly influenced by influent suspended solid characteristics, including concentration level, particle size distribution, and particle settleability, which collectively determine the effectiveness of solid–liquid separation in RAS.
The removal efficiency of TSS is widely regarded as a critical design and management target in RAS, yet acceptable concentration thresholds remain poorly defined and species dependent. Previous studies have proposed markedly different safe limits, ranging from 20.0–40.0 mg/L [25] to 25.0 mg/L with no detectable adverse effects on fish, while EIFAC [25] recommends maintaining TSS below 15.0 mg/L, and other reports have shown that tilapia can sustain production even at concentrations exceeding 100.0 mg/L [4]. Against this background, the present study provides species-specific evidence for mandarin fish, showing that daily TSS concentrations of 9.3–18.0 mg/L were not associated with observable adverse effects on survival or behavior under the experimental conditions, suggesting that this range falls within the species’ tolerance window. The temporal trend of TSS concentration in the culture tanks was positively correlated with that observed at the main discharge outlet. Compared with changes at the outlet, reductions in TSS within the water column exhibited a noticeable lag and occurred at a relatively slower rate. This behavior is consistent with reports that approximately 90% of particles in high-density RAS are smaller than 30 μm [26], a size fraction characterized by low settleability and limited removal efficiency by conventional mechanical filtration [25], highlighting the inherent challenge of TSS control in intensive RAS. In the present study, TSS was sampled at fixed locations within the culture tanks. Although continuous recirculation and aeration promoted a well-mixed water column, the spatial distribution of suspended particles was not systematically evaluated, and potential spatial heterogeneity cannot be entirely excluded.
COD in aquaculture water is mainly associated with oxygen-consuming reducing substances, including organic matter and certain oxidizable inorganic compounds, and its microbial degradation can exert considerable oxygen demand within recirculating aquaculture systems. In this study, COD exhibited a pronounced increase immediately after feeding, followed by a relatively stable level during the subsequent post-feeding period, suggesting that feed-derived organic inputs represent a major short-term driver of oxygen demand. Similar post-feeding COD dynamics have been reported in intensive RAS and are commonly attributed to the rapid release and transformation of particulate and dissolved organic matter. These findings imply that solid waste management during the early post-feeding phase plays a critical role in regulating both total suspended solids and COD levels, thereby contributing to water quality stability and supporting higher system carrying capacity under intensive culture conditions.
Based on the observed temporal patterns of solid waste generation, the present results suggest that recirculating aquaculture system management and equipment design for mandarin fish could be optimized to improve solid waste control. Enhanced water flow regulation and increased system circulation may facilitate the timely export of newly generated solids from culture tanks, thereby limiting their residence time in the system. Similarly, increasing the diameter of vertical flow clarifiers would reduce internal flow velocity and improve sedimentation efficiency. In addition, adjusting sludge discharge frequency and discharge intervals in accordance with solid waste production dynamics may further enhance removal performance. Overall, such strategies may help restrict the conversion of solid wastes into non-settleable fine particles and dissolved organic matter, thereby alleviating particulate and organic loading and reducing the operational burden of the system.
4.2. Feed-Driven Coupling of Fish Metabolism and Biofilter Performance in RAS
Previous studies have demonstrated that fluctuations in DO in culture tanks are primarily driven by fish physiological activity and environmental factors [27]. Under the conditions of the present study, DO reached a minimum of 5.60 ± 0.62 mg/L at 4 h post-feeding, approaching the lower threshold of 5 mg/L required for normal growth of mandarin fish [28]. This finding underscores the need to pay particular attention to the daily minimum DO level when managing feeding regimes in mandarin fish RAS. These results suggest the presence of two distinct ammonia excretion peaks in mandarin fish at 0 h and 6 h post-feeding. The initial peak observed immediately after feeding is likely associated with intense feeding competition among individuals and the resulting short-term stress responses. In contrast, the second peak at 6 h post-feeding is primarily attributable to enhanced protein catabolism during digestion and absorption, leading to increased excretion of nitrogenous metabolic products. Similar bimodal ammonia excretion patterns have been reported in other species, including southern catfish (Silurus meridionalis Chen) [29] and groupers (Epinephelus spp.) [30]. At water temperatures of 24–27 °C, the timing of ammonia excretion peaks in groupers closely matched those observed for mandarin fish in the present study, whereas southern catfish exhibited a delayed peak occurring 8–12 h post-feeding. This interspecific difference may, at least in part, be explained by species-specific metabolic characteristics, as mandarin fish and groupers, being obligate carnivores, generally exhibit higher standard metabolic rates than omnivorous species such as southern catfish. Consequently, protein catabolism following ingestion of high-protein diets may proceed more rapidly, resulting in earlier ammonia production and excretion peaks.
Nitrification is a microbially mediated process in which TAN is sequentially oxidized to nitrite (NO2−-N) and then to nitrate (NO3−-N), providing energy for ammonia-oxidizing bacteria (AOB) and nitrite-oxidizing bacteria (NOB), respectively [31]. In the present system, ammonia and nitrite oxidation occurred continuously throughout the culture period, but their relative intensities varied with feeding-induced nitrogen loading. Prior to feeding, low TAN and NO2−-N concentrations reflected limited nitrification activity. Following feeding, increased ammonia excretion stimulated AOB activity, leading to a rapid rise in TAN and a subsequent accumulation of NO2−-N. The temporal lag between the peaks of TAN and NO2−-N indicates that nitrite oxidation was initially unable to fully compensate for enhanced ammonia oxidation under elevated nitrogen inputs. As ammonia excretion declined at later stages post-feeding, nitrification capacity gradually exceeded nitrogen production, resulting in decreasing TAN and NO2−-N concentrations. These dynamics suggest that the daily peak concentrations of TAN and NO2−-N can serve as sensitive indicators of nitrification performance and overall system stability, providing a practical basis for optimizing biofilter capacity and operational management in recirculating aquaculture systems.
In this study, the pronounced diurnal fluctuation in TAN concentration at the inlet of the biological filter following feeding reflects the direct response of the system to postprandial metabolic activity of mandarin fish, whereas the consistently low and stable TAN concentration at the outlet highlights the effective buffering capacity of the biological filter against dynamic TAN loading. This pattern suggests that TAN removal in the system was predominantly governed by autotrophic nitrification, in agreement with previous studies describing the central role of biofilters in RAS [4]. The concurrent short-term increases in TSS and COD after feeding indicate a temporary elevation in organic loading, which may have altered the system C:N ratio and stimulated heterotrophic microbial activity. Under such conditions, heterotrophic assimilation could contribute to TAN transformation; however, given the relatively moderate COD levels observed, autotrophic nitrification likely remained the dominant TAN removal pathway. The diurnal variation of NO2−-N at both the inlet and outlet, characterized by a transient post-feeding increase followed by a gradual decline, further supports the interpretation that short-term NO2−-N accumulation was associated with enhanced TAN input and the transitional response of nitrification rather than a persistent limitation of nitrification capacity. Previous studies have demonstrated that increased organic loading can intensify competition between heterotrophic microorganisms and nitrifying bacteria for dissolved oxygen and biofilm space, potentially constraining nitrite oxidation and leading to temporary NO2−-N accumulation [32]. From a system operation perspective, the diurnal dynamics of NO2−-N therefore provide a useful indicator for evaluating the stability and resilience of RAS performance.
4.3. Functional Response of Biofilter Microbiota to Organic Loading in RAS
Alpha-diversity indices provide complementary insights into microbial community structure, with Chao1 commonly used to estimate species richness and Shannon index reflecting both richness and evenness. In the present study, BF_2 exhibited a higher Chao1 index than BF_1, indicating the detection of a greater number of low-abundance or rare genera in BF_2, which primarily contribute to estimates of community richness. Despite this increase in richness, the Shannon index remained relatively stable between the two biofilters, suggesting that the dominant community structure and species evenness were largely comparable between BF_1 and BF_2. These results indicate that the increased richness in BF_2 did not substantially alter the overall complexity of the microbial community.
The stable operation of RAS is closely linked to the structure and functional organization of aquatic microbial communities, which can be reshaped by variations in water physicochemical conditions and subsequently influence system water quality stability [33,34,35]. In the present study, BF_1 and BF_2 exhibited broadly similar microbial community structures at both the phylum and genus levels, with Pseudomonadota as the dominant phylum (>54%), accompanied by Bacteroidota and Chloroflexota, which are commonly associated with organic matter transformation. This community composition is consistent with those reported for RAS and engineered biofilters [21,36]. However, compared with studies in which Actinobacteriota, Pseudomonadota, and Bacteroidota jointly constituted dominant phyla [37], the relative abundance of Actinobacteriota was comparatively low in this system. This difference is likely related to the relatively high proportion of biodegradable organic matter in the biofilter influent. Previous studies have suggested that Actinobacteriota are typically oligotrophic or slow-growing taxa adapted to environments with low bioavailable organic carbon, whereas Pseudomonadota and Bacteroidota possess competitive advantages under higher organic substrate availability [32,38]. Under the operating conditions of the present system, although overall performance remained stable, the sustained input of biodegradable organic matter to the biofilter may have favored copiotrophic microorganisms, thereby contributing to the reduced relative abundance of Actinobacteriota.
Although the phylum Nitrospirota was present at a relatively low abundance in the microbial community, the detection of nitrification-related genera such as Nitrospira indicates that the system possessed a microbial basis supporting autotrophic nitrification. Previous studies have shown that nitrifying functional bacteria in biofilm-based systems often sustain high metabolic activity despite low biomass, and therefore their functional importance should not be evaluated solely based on relative abundance [39]. In the present study, TAN was removed relatively rapidly, whereas NO2−-N removal was comparatively slower and required multiple recirculation cycles to decline markedly. This operational pattern suggests that the nitrification process may have been constrained, at certain stages, by the subsequent oxidation of nitrite. Under conditions of elevated organic loading, competition from heterotrophic microorganisms for dissolved oxygen and biofilm space may weaken the ecological advantage of NOB, thereby affecting their population maintenance and metabolic activity and limiting the timely oxidation of NO2−-N generated during nitrification. Although the functional genes or activities of NOB were not directly quantified in this study, the observed operational characteristics are consistent with previous findings that NOB can be relatively inhibited under high organic load conditions, leading to transient NO2−-N accumulation.
Upon comparison of different treatment units, the relative abundance of norank_f__Hyphomicrobiales increased from 8% in BF_1 to 16% in BF_2, indicating a clear enrichment trend along the treatment flow. This pattern may be associated with the progressive consumption of readily degradable organic matter in the upstream biofilter. As a downstream unit, BF_2 receives influent characterized by lower concentrations of labile substrates while still retaining low-molecular-weight organic carbon and metabolic intermediates, thereby providing a more favorable ecological niche for facultative aerobic microorganisms tolerant of low dissolved oxygen. Previous studies have demonstrated that many members of Hyphomicrobiales are capable of biofilm formation and participate in the degradation of complex organic compounds, suggesting their potential to utilize dissolved or low-molecular-weight organic matter in both water and biofilm environments [40]. Under conditions where system COD was maintained at 43.0–55.2 mg/L and no independent denitrification unit was implemented, the enrichment of Hyphomicrobiales in BF_2 is therefore more likely to reflect a selective response driven by enhanced microenvironmental heterogeneity within the biofilm and shifts in organic substrate composition, rather than indicating substantial denitrification activity. In contrast, BF_1 directly receives raw water from the culture tank and bears a higher organic load, as evidenced by the enrichment of typical aerobic heterotrophs such as Sediminibacterium and Limnohabitans, highlighting its primary role in the rapid interception and initial degradation of suspended particles and dissolved organic matter. As organic matter is partially consumed and transformed in BF_1, changes in organic composition and oxygen utilization characteristics of the water entering BF_2 further promote the establishment of microbial taxa adapted to lower organic loads and microaerobic biofilm environments. Similar patterns of community stratification and functional differentiation have been widely reported in RAS and other biofilm-based treatment systems and are considered an important ecological mechanism supporting stable system operation under elevated organic loading conditions [41,42].
Based on the above analysis, further optimization of the front-end solid–liquid separation process is recommended. Building on the existing configuration, a tandem microfilter system could be implemented to enhance the retention of suspended solids, or a foam fractionation unit could be integrated to further reduce fine suspended particles and soluble organic matter in the water. Effective control of the organic load entering the biofilter would provide more competitive ecological niche conditions for AOB and NOB, thereby improving the overall removal performance of ammonia and nitrite and contributing to enhanced operational stability of the system.
It should be noted that all culture tanks in this study were part of a single RAS sharing common infrastructure. Although each tank was treated as an independent operational unit, they do not constitute fully independent biological replicates. Consequently, the mean ± SD values reported herein reflect variability among tanks within the same system, rather than variability across multiple independent systems. Future studies incorporating multiple fully independent RAS units as replicates would further enhance the statistical robustness of the results and provide stronger support for species-specific operational recommendations.
5. Conclusions
This study elucidates the coupling relationships among solid waste generation and removal, water quality dynamics, and microbial community functions in a mandarin fish recirculating aquaculture system. The results indicate that TSS at the system’s main discharge outlet originates primarily from uneaten feed and feces and exhibits pronounced diurnal variation, with its continuous imput serving as a key driver of the system’s pollutant load. In addition, the concentration level of TSS at the main discharge outlet partially influences the operational efficiency of upstream solid–liquid separation units. Meanwhile, temporal variations in key water quality parameters (TAN and NO2−-N) reflect shifts in the relative contributions of different functional microbial groups across nitrification stages within the biofilter, thereby characterizing the system’s response to organic load fluctuations. Under the current process configuration and operational conditions, periodic limitations in solid–liquid separation efficiency may allow heterotrophic microorganisms to become temporarily dominant, intensifying competition with nitrifying bacteria for attachment space and dissolved oxygen, and consequently constraining the nitrite oxidation process.
Author Contributions
Conceptualization, C.J. and J.Z.; methodology, C.J., J.Z. and M.W.; validation, C.J. and J.Z.; formal analysis, C.J. and H.M.; investigation, C.J., Q.Y. and Z.L.; resources, J.Z. and Q.Y.; data curation, C.J. and H.M.; writing—original draft preparation, C.J.; writing—review and editing, J.Z., C.J. and M.W.; visualization, C.J. and H.M.; supervision, J.Z. and C.J.; project administration, J.Z.; funding acquisition, J.Z. All authors have read and agreed to the published version of the manuscript.
Funding
This research was funded by the National Modern Agricultural Industrial Technology System Construction Special Project (CARS-46) under the Mandarin Fish Germplasm Resources and Variety Improvement Project (D-8021-23-0212) and the Huizhou Stinky Mandarin Fish Industry Research Institute’s Mandarin Fish Breeding Demonstration Base Construction Project (HZCGY2025001).
Institutional Review Board Statement
All animal experiments were conducted in accordance with the institutional guidelines of Shanghai Ocean University and the national regulations of China (Regulations for the Administration of Affairs Concerning Experimental Animals). The experimental protocols were specifically reviewed and approved by the Animal Ethics Committee of Shanghai Ocean University (Approval No. SHOU- DW-2025-392 and approval date: 12 June 2025). Every effort was made to minimize the number of animals used and to alleviate their suffering.
Data Availability Statement
The original contributions presented in this study are included in the article. Further inquiries can be directed to the corresponding author.
Acknowledgments
Jinkai Xu and Qianwen Yao provided the recirculating aquaculture system and experimental fish.
Conflicts of Interest
Author Qianwen Yao was employed by the company Huangshan Dingxin Eco-Agricultural Development Co., Ltd. The remaining authors declare that the research was conducted in the absence of any commercial or financial relationships that could be construed as a potential conflict of interest.
Abbreviations
The following abbreviations are used in this manuscript:
| RAS | Recirculating Aquaculture System |
| TSSs | Total Suspended Solids |
| COD | Chemical Oxygen Demand |
| TAN | Total Ammonia Nitrogen |
| NO2−-N | Nitrite Nitrogen |
| NO3−-N | Nitrate Nitrogen |
| AOB | Ammonia-Oxidizing Bacteria |
| NOB | Nitrite-Oxidizing Bacteria |
References
- Van Rijn, J. Waste treatment in recirculating aquaculture systems. Aquac. Eng. 2013, 53, 49–56. [Google Scholar] [CrossRef] [Scilit]
- Zhou, L.; Tang, R.; Liu, X.; Cheng, G.; Gu, Z.; Liu, S. Research progress of suspended particulate matter removal equipment in recirculating aquaculture system. J. Chin. Agric. Mech. 2023, 44, 78–86. [Google Scholar]
- Zhao, C.; Wu, G.; Sun, W.; Hu, W.; Ren, X.; Zhang, J.; Wang, X. Research progress and prospect of solid waste transport performance in recirculating aquaculture system: A review. J. Dalian Ocean Univ. 2025, 40, 174–184. [Google Scholar]
- Timmons, M.B.; Zhu, S. Recirculating Aquaculture Systems; Zhejiang University Press: Hangzhou, China, 2021. [Google Scholar]
- Cripps, S.J.; Bergheim, A. Solids management and removal for intensive land-based aquaculture production systems. Aquac. Eng. 2000, 22, 33–56. [Google Scholar] [CrossRef] [Scilit]
- Guerdat, T.C.; Losordo, T.M.; Classen, J.J.; Osborne, J.A.; DeLong, D.P. An evaluation of commercially available biological filters for recirculating aquaculture systems. Aquac. Eng. 2010, 42, 38–49. [Google Scholar] [CrossRef] [Scilit]
- Tao, Z.; Yuan, J.; Xie, S.; He, G.; Deng, H.; Li, M.; Wang, J.; Deng, Y.; Zhang, H.; Ouyang, M.; et al. Water quality and microbial community analysis in freshwater of pond embedded assembly tank recirculating aquaculture system. Fish. Mod. 2025, 52, 46–57. [Google Scholar]
- Fisheries Administration Bureau, Ministry of Agriculture and Rural Affairs. China Fisheries Statistical Yearbook 2004; China Agriculture Press: Beijing, China, 2024.
- Long, F.; Xiao, J.; Ding, L.; Yao, Y.; Qiu, J. Feed training and culture techniques of mandarin fish (Siniperca chuatsi) in an industrial recirculating aquaculture system. China Fish. 2025, 33–34. Available online: https://kns.cnki.net/kcms2/article/abstract?v=BoNITJRTahKFNhwjSP_18fBM6iqWuDU1FcpeZcydBgg7ZtgTy6YZ390Gz_MG7xmn5xj1fN9ymKLATM_O2EYz82NK19V24s_DYAVeyibi_w3jLkHkKpbt7BfUv6CMiCoQefm345SzKyWOJaTChSIgiAeu9VMHI7FZayDJWYNcPxNC9PEgnK6LOQ==&uniplatform=NZKPT&language=CHS (accessed on 20 February 2026).
- Zhang, Y. Experimental rearing of mandarin fish (Siniperca chuatsi) in a closed recirculating aquaculture system. China Fish. 2024, 31–33. Available online: https://kns.cnki.net/kcms2/article/abstract?v=BoNITJRTahK9Lo5bpoPm2tcxLIbVGyuD9azEV0XQ5t28lvIev5raVoiFGu7QtRm8gWC5XZXPRUKP9AussfqXn1gq2M24SRA6sLThxcWd7LqqyI0gwcKVajertQTFCFxwq9v5GwBBxdR-mQ3U4anaikAClBsGaANZlW19_Gq2a5HEaz8X5UGPxA==&uniplatform=NZKPT&language=CHS (accessed on 25 January 2026).
- Yao, X.; Zhang, Q.; Geletu, T.T.; Huang, X.; Zhang, L.; Zheng, J.; Zhao, Y.; Tang, S.; Zhao, J. Piezo1/2 regulates gastric pepsinogen secretion of mandarin fish. Fish Physiol. Biochem. 2025, 51, 97. [Google Scholar] [CrossRef] [Scilit]
- Khater, E.-S.G.; Ali, S.A.; Bahnasawy, A.H.; Awad, M.A. Solids removal in a recirculating aquaculture system. Misr J. Agric. Eng. 2011, 28, 1178–1196. [Google Scholar] [CrossRef] [Scilit]
- Johnson, W.; Chen, S. Performance evaluation of radial/vertical flow clarification applied to recirculating aquaculture systems. Aquac. Eng. 2006, 34, 47–55. [Google Scholar] [CrossRef] [Scilit]
- de Jesus Gregersen, K.J.; Olsson, P.; Pellicer-Nacher, C.; Pedersen, P.B. Effect of drum filter mesh size on RAS water quality. Aquac. Eng. 2025, 109, 102508. [Google Scholar] [CrossRef] [Scilit]
- Pfeiffer, T.; Baptiste, R.; Wills, P.S. Fine-solids removal by foam fractionation in a low-salinity marine recirculating aquaculture system (RAS). N. Am. J. Aquac. 2024, 86, 345–354. [Google Scholar] [CrossRef] [Scilit]
- GB 17378.4–2007; Ocean Monitoring Specifications: Part 4 Seawater Analysis. National Technical Committee for Standardization of Oceanography: Beijing, China, 2008.
- GB/T 14420–2024; Methods for Analysis of Boiler Water and Cooling Water: Determination of Chemical Oxygen Demand by Rapid Potassium Dichromate Method. China Standards Press: Beijing, China, 2024.
- State Environmental Protection Administration of China; Editorial Committee of Methods for Monitoring and Analysis of Water and Wastewater. Methods for Monitoring and Analysis of Water and Wastewater, 4th ed.; China Environmental Science Press: Beijing, China, 2002.
- Mo, A.; Sun, J.; Wang, Y.; Yang, K.; Yang, H.; Yuan, Y. Apparent digestibility of protein, energy and amino acids in nine protein sources at two content levels for mandarin fish, Siniperca chuatsi. Aquaculture 2019, 499, 42–50. [Google Scholar] [CrossRef] [Scilit]
- Zhang, H.; Song, X.; Liu, X.; Deng, D.; Huang, Z.; Zhai, J. Dynamic response of microbial community to water quality change in biofilter for recirculating aquaculture system of Oplegnathus punctatus. Chin. J. Environ. Eng. 2020, 14, 2176–2185. [Google Scholar]
- Luo, G.; Wu, Y.; Cao, B.; Liu, W.; Tan, H. Analysis of water and intestinal microbial communities in GIFT tilapia under different overwintering aquaculture systems. Fish. Mod. 2025, 52, 88–97. [Google Scholar]
- Zhang, Y.; Liao, Z.; Xu, H.; Mai, K. Aquaculture fish faeces: Characteristics, influencing factors and nutritional optimization strategies. J. Shanghai Ocean Univ. 2025, 34, 88–97. [Google Scholar]
- Wu, Z.; Hardy, W. Initial analysis of feeding behavior in juvenile mandarin fish (Siniperca chuatsi). Freshw. Fish. 1988, 18–21. Available online: https://kns.cnki.net/kcms2/article/abstract?v=BoNITJRTahJsaOCKWss8vFNAHNonf8gKCu5wlfxOp7OkmmEvZRhU-8WXWZV-PnVUz5cbJIrwjbJXqRVH3fQxcZU5NuNmfKo4fWaeFESm8n8iORAcsOjGje-rbWlpvQNneppD7GSfPt3k-DiubaHkgTMJXHT0zhLla611kQ5y2bT0-856K7ADQA==&uniplatform=NZKPT&language=CHS (accessed on 20 January 2026).
- Davidson, J.; Summerfelt, S.T. Solids removal from a coldwater recirculating system—Comparison of a swirl separator and a radial-flow settler. Aquac. Eng. 2005, 33, 47–61. [Google Scholar] [CrossRef] [Scilit]
- Ebeling, J.M.; Timmons, M.B. Recirculating aquaculture systems. In Aquaculture Production Systems; John Wiley & Sons, Inc.: Hoboken, NJ, USA, 2012; pp. 245–277. [Google Scholar] [CrossRef] [Scilit]
- Chen, S.; Timmons, M.B.; Aneshansley, D.J.; Bisogni, J.J., Jr. Suspended solids characteristics from recirculating aquacultural systems and design implications. Aquaculture 1993, 112, 143–155. [Google Scholar] [CrossRef] [Scilit]
- Buentello, J.A.; Gatlin, D.M., III; Neill, W.H. Effects of water temperature and dissolved oxygen on daily feed consumption, feed utilization and growth of channel catfish (Ictalurus punctatus). Aquaculture 2000, 182, 339–352. [Google Scholar] [CrossRef] [Scilit]
- Song, Y.; Zeng, M.; Zhou, H.; Zhou, Y.; Zhang, C.; Zhao, J. Effects of different dissolved oxygen levels on respiratory metabolism and related gene expression in mandarinfish Siniperca chuatsi. Fish. Sci. 2022, 41, 438–444. [Google Scholar]
- Li, Z.; Xie, X.; Cao, Z. Effect of feeding no oxygen consumption and ammonia excretion in Silurus meridionalis chen. Acta Hydrobiol. Sin. 2005, 247–252. Available online: https://www.cabidigitallibrary.org/doi/full/10.5555/20053179349 (accessed on 8 December 2025).
- Xing, D.; Song, X.; Peng, L.; Cheng, Y.; Zhai, J. Effects of temperature and salinity on oxygen consumption rate and ammonia excretion rate of junevile Epinephelus groupers. Fish. Mod. 2017, 44, 7–14. [Google Scholar]
- Xu, C.; Shen, F.; Xu, H.; Meng, S.; Song, C.; Fan, L.; Qiu, L.; Li, D.; Fang, L.; Liu, Z.; et al. Research progress and prospect of nitrogen cycling and corresponding functional microbes in aquaculture environments. Chin. Agric. Sci. Bull. 2025, 41, 157–164. [Google Scholar]
- Navada, S.; Knutsen, M.F.; Bakke, I.; Vadstein, O. Nitrifying biofilms deprived of organic carbon show higher functional resilience to increases in carbon supply. Sci. Rep. 2020, 10, 7121. [Google Scholar] [CrossRef] [Scilit]
- Zhang, H.; Ma, S.; Li, Q.; Fu, X.; Zhang, Y.; Qu, K. Analysis of the changes of microbial community structure on bio-carrier of recirculating aquaculture systems(RAS). Environ. Sci. 2011, 32, 231–239. [Google Scholar]
- Sugita, H.; Nakamura, H.; Shimada, T. Microbial communities associated with filter materials in recirculating aquaculture systems of freshwater fish. Aquaculture 2005, 243, 403–409. [Google Scholar] [CrossRef] [Scilit]
- Lu, Z.; Lin, W.; Li, Q.; Wu, Q.; Ren, Z.; Mu, C.; Wang, C.; Shi, C.; Ye, Y. Recirculating aquaculture system as microbial community and water quality management strategy in the larviculture of Scylla paramamosain. Water Res. 2024, 252, 121218. [Google Scholar] [CrossRef] [Scilit]
- Du, Y.; Deng, D.; Li, C.; Wang, F.; Shan, H. Relationship between concentrations of ammonia and nitrite in water, microbial community structure and abundance of nitrogen cycling function genes. Prog. Fish. Sci. 2025, 46, 222–235. [Google Scholar]
- Jiang, Y.; Yang, Q.; Liu, G.; Qiu, W.; Shi, W.; Guan, W. A study on microbial ecology in recirculating aquaculture systems in Ningxia. J. Dalian Ocean Univ. 2025, 40, 821–830. [Google Scholar]
- Barka, E.A.; Vatsa, P.; Sanchez, L.; Gaveau-Vaillant, N.; Jacquard, C.; Klenk, H.-P.; Clément, C.; Ouhdouch, Y.; van Wezel, G.P. Taxonomy, physiology, and natural products of Actinobacteria. Microbiol. Mol. Biol. Rev. 2016, 80, 1–43. [Google Scholar] [CrossRef] [Scilit]
- Daims, H.; Lebedeva, E.V.; Pjevac, P.; Han, P.; Herbold, C.; Albertsen, M.; Jehmlich, N.; Palatinszky, M.; Vierheilig, J.; Bulaev, A. Complete nitrification by Nitrospira bacteria. Nature 2015, 528, 504–509. [Google Scholar] [CrossRef] [Scilit]
- Lee, K.; Lee, H.K.; Choi, T.-H.; Cho, J.-C. Robiginitomaculum antarcticum gen. nov., sp. nov., a member of the family Hyphomonadaceae, from Antarctic seawater. Int. J. Syst. Evol. Microbiol. 2007, 57, 2595–2599. [Google Scholar] [CrossRef] [Scilit] [PubMed]
- Schreier, H.J.; Mirzoyan, N.; Saito, K. Microbial diversity of biological filters in recirculating aquaculture systems. Curr. Opin. Biotechnol. 2010, 21, 318–325. [Google Scholar] [CrossRef] [Scilit] [PubMed]
- Rieder, J.; Kapopoulou, A.; Bank, C.; Adrian-Kalchhauser, I. Metagenomics and metabarcoding experimental choices and their impact on microbial community characterization in freshwater recirculating aquaculture systems. Environ. Microbiome 2023, 18, 8. [Google Scholar] [CrossRef] [Scilit] [PubMed]

Disclaimer/Publisher’s Note: The statements, opinions and data contained in all publications are solely those of the individual author(s) and contributor(s) and not of MDPI and/or the editor(s). MDPI and/or the editor(s) disclaim responsibility for any injury to people or property resulting from any ideas, methods, instructions or products referred to in the content. |
© 2026 by the authors. Licensee MDPI, Basel, Switzerland. This article is an open access article distributed under the terms and conditions of the Creative Commons Attribution (CC BY) license.