


Abstract
Environmental DNA (eDNA) has the potential for quantitative biomass estimation, but its application in open marine cages remains challenging due to biological variability and seawater current conditions. Here, we evaluated an eDNA-based framework for estimating biomass of cage-cultured Thamnaconus modestus by integrating controlled experiments with field calibration under different current conditions. Under controlled conditions, eDNA concentration increased with total fish biomass, whereas eDNA signals per unit biomass showed patterns associated with individual body size and population size structure. Based on five field calibration observations, pond-to-cage conversion coefficients showed a positive association with model-derived instantaneous seawater current speed. This relationship was preliminarily evaluated using three temporally separated observations from a single cage site (site B), resulting in absolute percentage errors of 11.6%, 23.2%, and 26.8% and an overall mean absolute percentage error (MAPE) of 20.5%. These preliminary results suggest that combining size-matched biological references with current-dependent calibration may provide a potential approach for improving eDNA-based biomass estimation in marine cages.
Keywords:
environmental DNA; Thamnaconus modestus; cage aquaculture; biomass estimation; body size; seawater current speed Key Contribution:
This study suggests that fish body size, population structure, and seawater current speed represent potential sources of variation in eDNA–biomass relationships. The results provide preliminary support for the potential application of eDNA-based approaches for biomass estimation in outdoor cage aquaculture systems.
1. Introduction
In recent years, increasing pressures on global aquatic ecosystems caused by overfishing and extreme climate events have become major concerns for marine resource management [1,2,3,4,5]. To alleviate the shortage of natural fishery resources, many countries have continuously promoted the development of aquaculture, and the large-scale farming of economically important fish species has substantially increased aquaculture production [6]. However, the rapid expansion of marine aquaculture has also increased ecological pressure associated with intensive development. On the one hand, the continuous input of uneaten feed, excreta, and metabolic waste into marine environments can lead to nutrient enrichment, organic matter accumulation in sediments, and consequent alterations in the structure and function of benthic ecosystems [7]. On the other hand, the area of coastal aquaculture has continued to expand, and in some regions the scale of development has approached the ecological carrying capacity threshold [8]. Marine cage aquaculture has consequently become an increasingly important component of modern aquaculture production. Cage systems provide large culture volumes and continuous water exchange with the surrounding environment, which can improve culture conditions but also complicate quantitative biomass assessment. In particular, the open nature of cage systems means that biological signals released by cultured organisms can be rapidly redistributed beyond the cage boundary, creating challenges for non-invasive biomass assessment.
In cage aquaculture, biomass assessment is a crucial basis for scientific feeding management, cost control, and production efficiency improvement [9,10]. This is because errors in biomass assessment may not only lead to feed waste and increased production costs, but may also induce disease outbreaks due to improper feeding and thereby aggravate environmental burdens in aquaculture systems [11]. However, sea-based cage farming is conducted in open-water environments, and the large cage size and high farming capacity make accurate biomass assessment particularly challenging. Currently, commonly used biomass assessment methods mainly include manual counting, optical imaging [12], and acoustic detection [13]. Nevertheless, these methods generally suffer from high costs and operational complexity [14,15], and their performance is readily affected by harsh sea conditions [16], high water pressure [17], and complex fish swimming behavior [18]. Therefore, efficient and non-invasive biomass assessment is urgently needed.
Environmental DNA (eDNA) refers to DNA fragments released by organisms into the surrounding environment. In aquatic systems, eDNA can exhibit a characteristic “plume” distribution pattern [19,20], which provides theoretical support for the assessment of species abundance and spatial distribution patterns [21,22,23]. eDNA approaches offer high sensitivity, non-invasive sampling, and standardized molecular detection and have been increasingly applied to aquatic resource assessment, showing considerable potential for biomass estimation [24,25]. For example, previous studies have shown that eDNA can be effectively used to assess biomass and spatial distribution in aquatic organisms. Takahara et al. [26] provided one of the earliest quantitative assessments of fish biomass using eDNA and found a significant positive correlation between eDNA concentration and fish biomass. Subsequently, Yamamoto et al. [27] and Sun et al. [28] combined eDNA analysis with field surveys and fishery surveys, respectively, further confirming the feasibility of eDNA technology for the assessment of marine fish and crustacean resources. These studies suggest that eDNA has strong potential for aquatic biomass assessment and also provide a theoretical basis for its application in cage aquaculture. Nevertheless, eDNA concentration is not determined by biomass alone. Biological characteristics, particularly individual body size and population size structure, can alter the detectable eDNA signal generated per unit biomass, whereas environmental processes influence the persistence and spatial redistribution of eDNA after release [29,30]. These sources of variation become particularly important in marine cage aquaculture, where cultured fish are enclosed but water is continuously exchanged with the surrounding environment. Advection, dispersion, dilution, tidal exchange, and other hydrodynamic processes can redistribute locally released eDNA and thereby weaken the direct correspondence between local eDNA concentration and the biomass contained within a cage [20,31]. Among these processes, seawater current speed was selected as the primary calibration variable because it provides a practical field-measurable indicator of water exchange differences among marine cages and may influence the transport and dilution of locally released eDNA [20,31]. Although other hydrodynamic factors, such as current direction, tides, turbulence, and stratification, may also affect eDNA transport and spatial distribution [20,31], these factors are often difficult to quantify consistently under field conditions. In contrast, current speed provides a practical field-measurable indicator of differences in water exchange among cage sites. Therefore, current speed was considered a practical proxy for variation in eDNA transport conditions affecting eDNA–biomass relationships within the empirical calibration framework developed in this study, rather than a complete descriptor of all hydrodynamic processes. Quantitative transfer of an eDNA–biomass relationship from enclosed culture systems to open marine cages may consequently require both biological calibration and explicit consideration of seawater current conditions.
Thamnaconus modestus, belonging to the order Tetraodontiformes, family Monacanthidae, and genus Thamnaconus, is a warm-temperate demersal economic fish species mainly distributed in the coastal waters of China, Japan, and the Korean Peninsula [32]. Owing to its high economic value and stable market demand, as well as the strong compatibility of its biological characteristics with sea-based cage culture conditions, T. modestus has become an important species in cage aquaculture along the northern coast of China, and large-scale farming technologies for this species have been gradually promoted in major farming areas nationwide [33,34,35,36]. As a typical cage-cultured marine fish species, T. modestus provides an appropriate model for evaluating whether biological characteristics and current-dependent variation can be incorporated into eDNA-based biomass estimation frameworks. The quantitative characteristics of eDNA signals under cage culture conditions and the factors affecting the transfer of eDNA–biomass relationships from controlled environments to open marine cages remain insufficiently understood. Therefore, this species provides an opportunity to investigate how biological variability and seawater current conditions influence the reliability of eDNA-based biomass estimation in marine cage systems. Accordingly, this study used T. modestus as a model species to develop a preliminary eDNA-based framework for biomass estimation in marine cage aquaculture. Specifically, we investigated three key issues: (1) whether total fish biomass can be quantitatively reflected by eDNA concentration under controlled conditions; (2) whether individual body size and population size structure influence eDNA signals per unit biomass; and (3) whether current-dependent calibration can improve the transferability of eDNA-based biomass estimates from enclosed culture systems to open marine cages. We hypothesized that (1) eDNA concentration would increase with increasing total fish biomass, (2) differences in individual size and population structure would modify the relationship between eDNA concentration and biomass, and (3) seawater current speed would contribute to variation in pond-to-cage conversion coefficients by influencing local eDNA transport and dilution. To test these hypotheses, we first conducted controlled experiments to quantify the effects of biomass, body size, and population structure on eDNA signals. We then calculated pond-to-cage conversion coefficients from five cage observations across a gradient of seawater current speed and examined their relationship with model-derived instantaneous current speed, followed by evaluation using temporally separated observations from the same farming area.
2. Materials and Methods
2.1. Experimental Materials
Thamnaconus modestus used in the controlled experiments and reference pond samples were obtained from Tianyuan Aquatic Enterprise, Yantai, Shandong Province, China. Live fish were transported to Yantai University for temporary holding before the controlled experiments. Field cage samples were collected separately from aquaculture sites in Yantai. All experimental and sampling equipment was disinfected with sodium hypochlorite solution and thoroughly rinsed with deionized water before use. Background water samples were collected before the controlled experiments to confirm the absence of detectable target DNA contamination.
2.2. Controlled Experimental Design
Controlled experiments were conducted at Yantai University to evaluate how total fish biomass, individual body size, and population size structure were associated with variation in the eDNA signal of T. modestus. Experimental fish were maintained in identical tanks under standardized conditions of 16.5 ± 0.5 °C, salinity 32.0, pH 8.20, and dissolved oxygen > 5 mg L−1. Each tank contained 100 L of seawater. Each treatment was established in a single experimental tank, which was treated as the experimental unit. Therefore, statistical comparisons were interpreted at the treatment level rather than as independent biological replicates. Total fish biomass was defined as the summed wet mass of all individuals within each experimental tank.
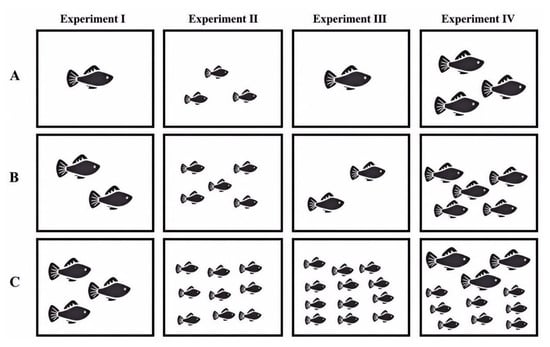
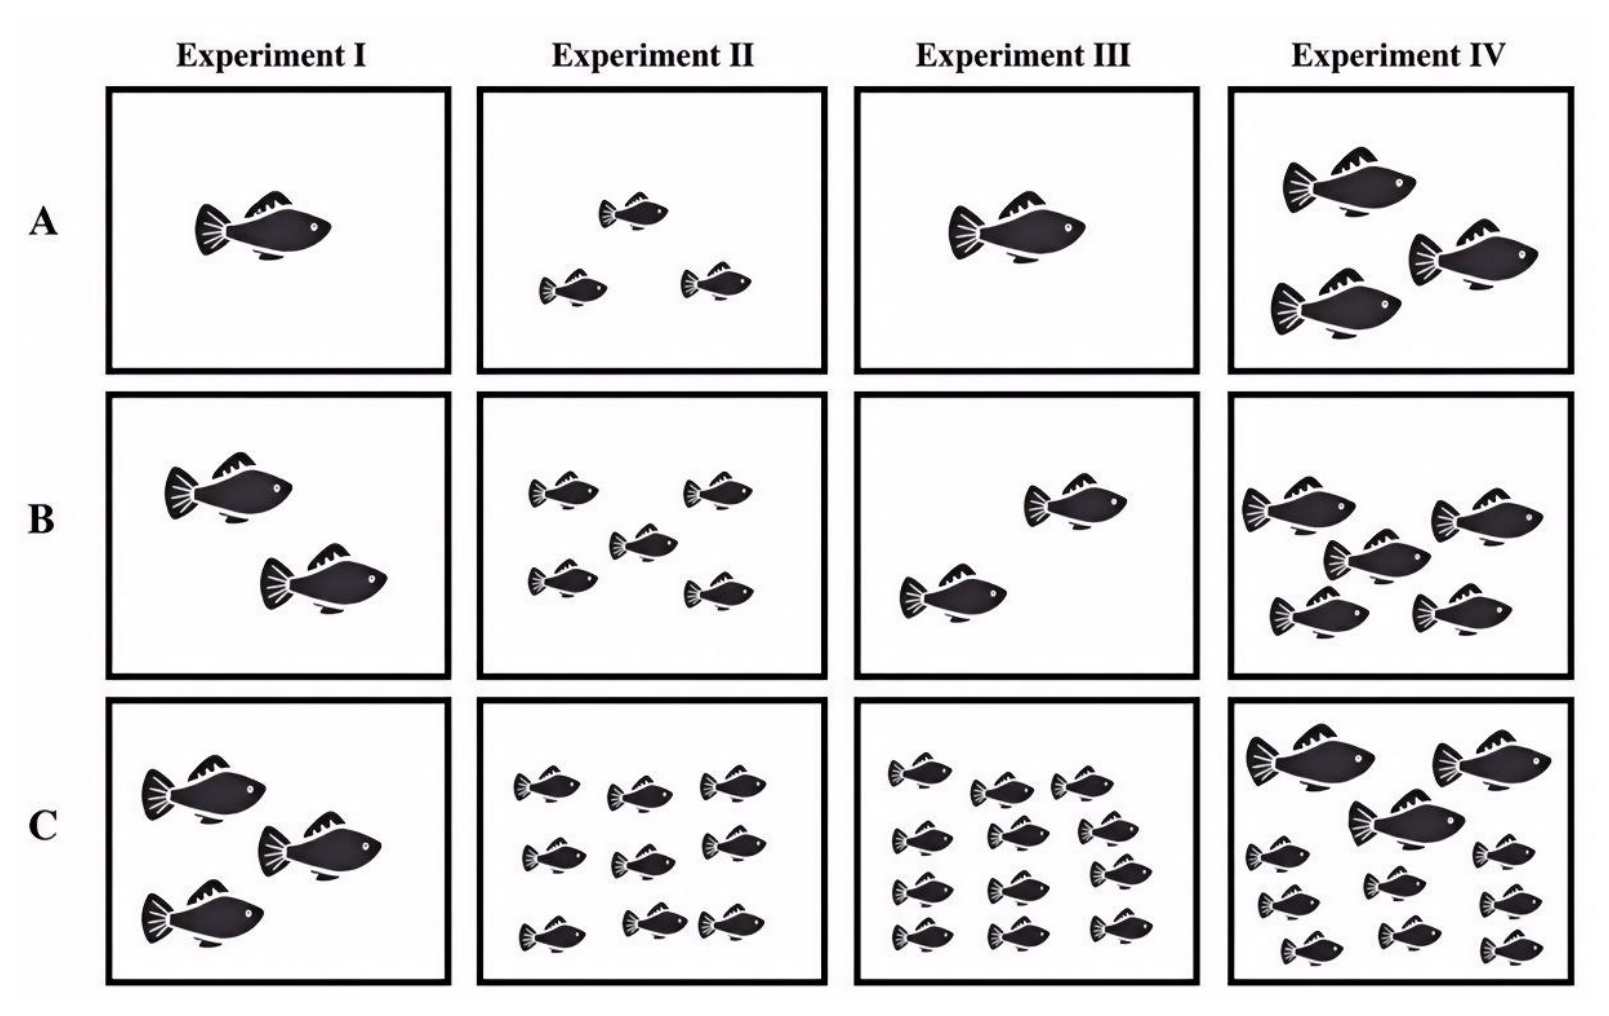
Four experiments were established (Figure 1; Table 1). Experiments I and II examined the relationship between total biomass and eDNA concentration within larger and smaller body-size classes, respectively. Within each experiment, individual body mass varied relatively little among biomass treatments. Experiment III compared groups differing substantially in individual body size while maintaining broadly comparable total biomass. Experiment IV further examined patterns associated with population size structure under comparable total-biomass conditions.
Figure 1.
Schematic overview of the controlled experiments used to evaluate variation in Thamnaconus modestus eDNA signals associated with total biomass, individual body size, and population size structure. Columns represent Experiments I–IV, and rows A–C represent the corresponding treatments.
Table 1.
Experimental design and population characteristics of the controlled tank experiments.
Fish were acclimated to the experimental tanks for 24 h before the experiment. Water samples (100 mL) were collected at 48, 72, and 96 h after the start of the experiment for eDNA quantification. Because sampling time was not treated as an experimental factor, the measurements collected at 48, 72, and 96 h were considered temporal observations from the same experimental unit rather than independent biological replicates. Therefore, repeated measurements within each treatment were averaged before subsequent biomass-related analyses.
2.3. Field Calibration and Size-Matched Pond References
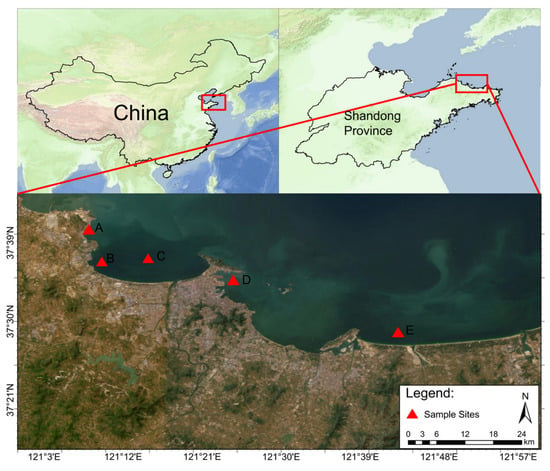
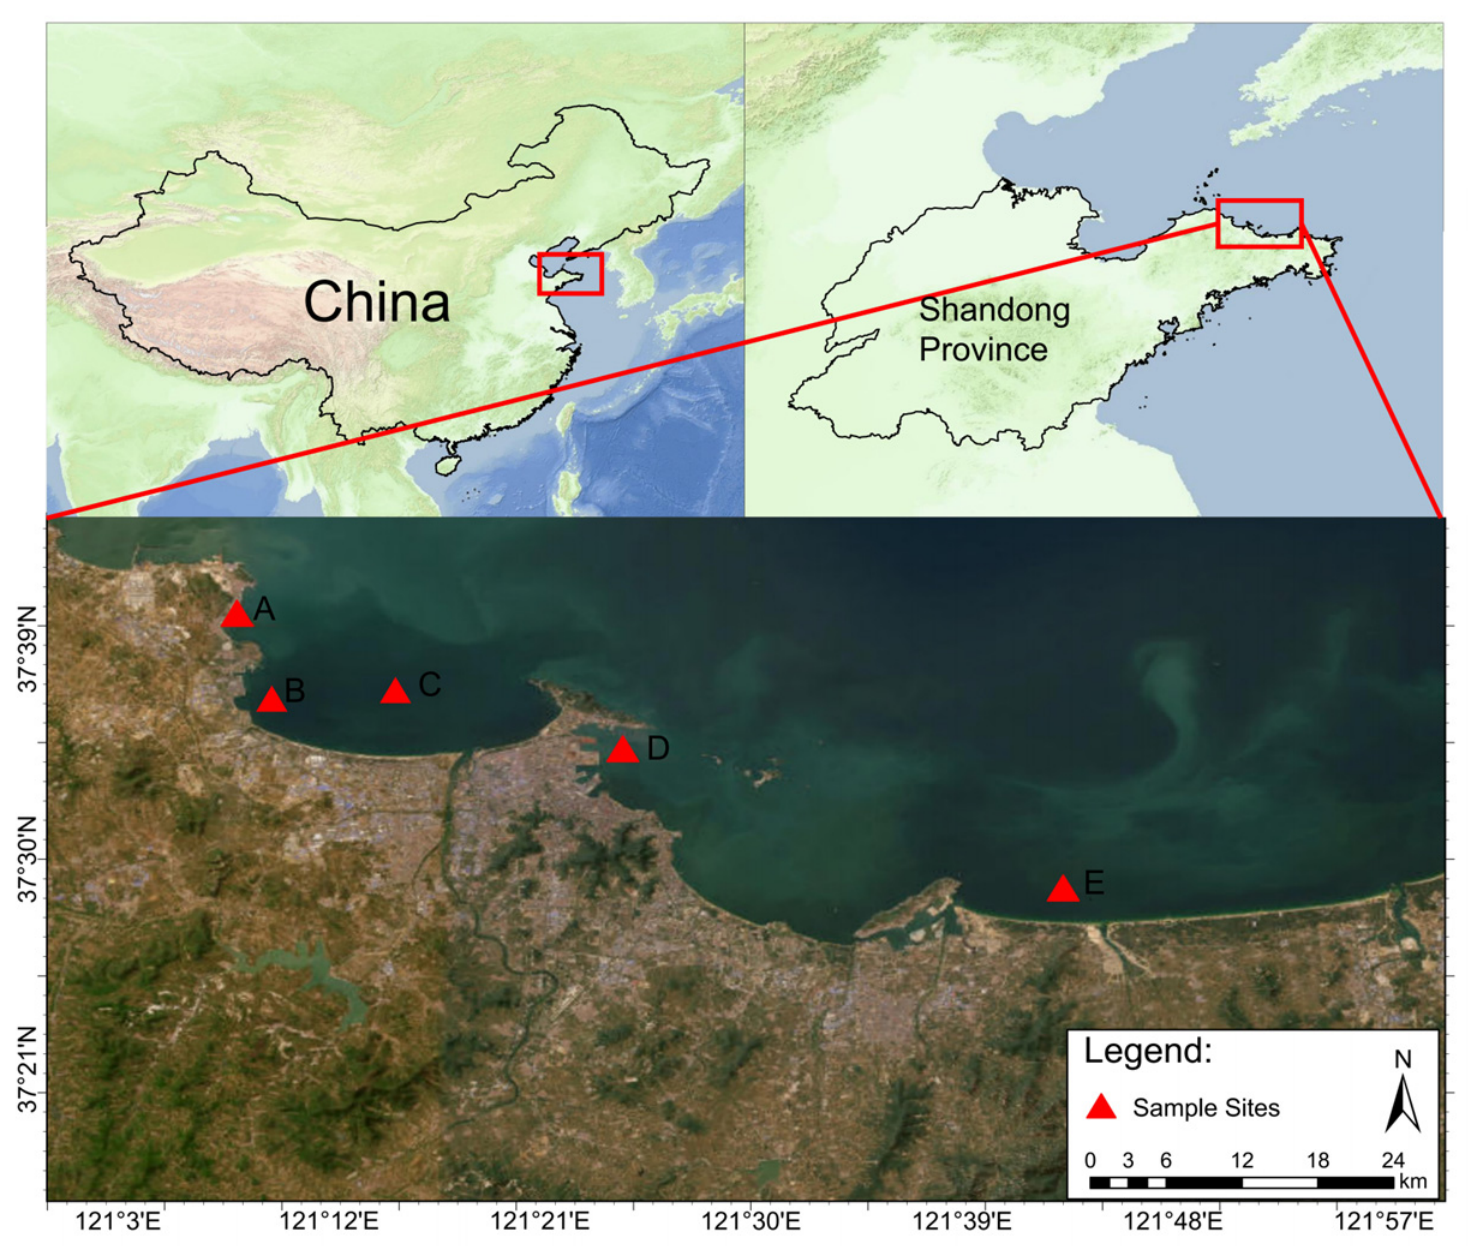
Field calibration was based on five cage observations from aquaculture waters near Yantai, Shandong Province, China (Figure 2). The approximate water volumes of the reference ponds and field cages were recorded to characterize the differences in system scale between enclosed pond and open-water cage environments (Table S1). Three additional observations were collected at sampling site B on separate dates and reserved exclusively for temporal evaluation. These observations were not used to fit or adjust the calibration relationship. Sampling coordinates and times are provided in Table 2. Two calibration observations were obtained from site A under the same model-derived current condition. These observations did not represent repeated measurements of the same cage population but corresponded to different cage populations with substantially different mean individual body masses and biomass levels. Therefore, they were retained as separate biological observations, although they shared the same geographic location and model-derived current condition.
Figure 2.
Locations of cage observations used for field calibration and temporal validation near Yantai, Shandong Province, China.
Table 2.
Field information for calibration and temporal evaluation observations.
To minimize feeding-related variability, all cage-water samples were collected 30 min after routine feeding had ended, as feeding can induce pronounced vertical redistribution of fish within sea cages [37]. Thamnaconus modestus is a demersal species with a depth-associated vertical distribution in the wild [38], and field observations in the present study indicated that individuals were predominantly distributed in the middle-to-lower portion of the cages during the post-feeding period. Water samples were therefore collected at a standardized depth of approximately 4 m. Because eDNA concentrations around marine fish cages can vary among water-column depths [39], this standardized depth was used to maximize comparability among cage observations rather than to define a species-specific optimal sampling depth. Three replicate 3-L water samples were collected from each cage and transported on ice for filtration. Physicochemical conditions were relatively stable among cage observations. Across the five calibration observations, pH was 8.23, salinity ranged from 31.0 to 31.8, and water temperature ranged from 23.4 to 24.6 °C. At sampling site B, the three temporal evaluation observations had a pH of 8.23, salinity of 31.2, and temperatures of 24.1–25.1 °C. The reference pond had a pH of 8.20, salinity of 31.8, and a water temperature of 16.5 °C. Given the close agreement in pH and salinity between pond and cage environments, no separate correction was applied for these variables. Although temperature differed more substantially, the empirical pond-to-cage conversion coefficient (K) was derived under the actual conditions of both systems and therefore incorporated the combined effects of environmental differences between pond and cage environments. To maintain a parsimonious calibration framework, no additional environment-specific correction terms were included in the present model.
Mean individual body mass was estimated from 10 randomly selected fish from each cage. The coefficient of variation (CV) among the 10 sampled individuals was calculated to characterize the variation in mean body mass estimates for each cage. Observed cage biomass (Bobs) was calculated as the number of fish present in the cage multiplied by the mean individual body mass determined from the 10 randomly sampled fish. The approximate number of fish stocked in each cage was obtained from farm inventory records provided by the farm operator (Table S2). For each cage observation, the reference pond population closest in mean body mass was selected as the size-matched reference to minimize potential biological variation associated with differences in fish size. The differences in mean individual body mass between cage populations and their matched pond references were calculated (Table S2). Because eDNA production per unit biomass may vary among fish size classes, size-matched references were used to reduce potential bias associated with size-dependent differences in eDNA signals. Reference pond samples were collected and processed using the same sampling volume, filtration, DNA extraction, and qPCR procedures as those used for cage samples. Four size-matched pond reference populations were used, spanning mean body masses of 6.2–374.9 g. Their corresponding eDNA signals per unit biomass ranged from 827.67 to 7820.7 copies L−1 g−1 (Table 3). Three replicate 3 L water samples were collected from each reference pond and processed identically to cage samples.
Table 3.
Size-matched pond reference eDNA signals.
For calibration cages with known biomass, the cage eDNA signal per unit biomass was calculated as
where Ecage is the measured eDNA concentration in cage water and Bobs is the observed cage biomass.
For each pond reference, the eDNA signal per unit biomass was calculated as
where Epond is the measured eDNA concentration in pond water and Bpond is the total fish biomass in the corresponding reference pond.
The pond-to-cage conversion coefficient was then defined as
where Spond is the size-matched pond reference eDNA signal per unit biomass.
2.4. Seawater Current Speed and Pond-to-Cage Conversion Analysis
Seawater current data corresponding to each cage observation were obtained from the Global Ocean Physics Analysis and Forecast product of the Copernicus Marine Service (Product ID: GLOBAL_ANALYSISFORECAST_PHY_001_024; dataset: cmems_mod_glo_phy-cur_anfc_0.083deg_PT6H-i). Because direct current measurements were not available at the cage locations, model-derived current fields were used as a proxy for local current conditions. Zonal (u) and meridional (v) current components were extracted according to the geographic coordinates of each cage. Because cage-water samples were collected at approximately 4 m depth, the u and v components from the two model layers nearest to the sampling depth (3.82 and 5.08 m) were averaged. Horizontal current speed was then calculated as
where u and v represent the mean zonal and meridional current components across the two selected depth layers, respectively. The Copernicus dataset provides instantaneous current fields at 6-h intervals. Field sampling times recorded in China Standard Time (UTC+8) were converted to UTC before temporal matching. For each cage observation, the instantaneous model field nearest in time to the actual sampling event was selected. Thus, V represents the model-derived instantaneous seawater current speed nearest to the sampling time.
2.5. eDNA Extraction and qPCR
All water samples were filtered through 0.45 μm glass-fiber filters. Filtration blanks consisting of deionized water were included to monitor potential cross-contamination. Filtration equipment was disinfected with sodium hypochlorite solution and thoroughly rinsed with deionized water between samples. Filters were immediately frozen in liquid nitrogen, transferred to sterile 2-mL microcentrifuge tubes, and stored at −80 °C until DNA extraction using a Soil Genomic DNA Extraction Kit (Shanghai JizhenBio Biotech Co., Ltd., Shanghai, China).
eDNA was quantified using TaqMan-based quantitative real-time PCR (qPCR) targeting the mitochondrial ND2 gene of T. modestus. The primer and probe sequences were as follows: forward primer, 5′-CGGCTCAAATAACACTTCCCTTAG-3′; reverse primer, 5′-TCGCCATAATTCCTGGTGTCA-3′; and probe, 5′-CACCTCCATGATAGCAAT-3′.
Each 20 μL reaction contained 10 μL of 2× AceQ Universal U+ Probe Master Mix V2 (Vazyme Biotech Co., Ltd., Nanjing, China), 7 μL of ddH2O, 0.4 μL of each primer, 0.2 μL of probe, and 2 μL of DNA template. Thermal cycling consisted of 37 °C for 2 min, 95 °C for 5 min, followed by 45 cycles of 95 °C for 10 s and 60 °C for 30 s.
Each sample was analyzed in three technical replicates, and the mean copy number was used for subsequent analyses. Technical replicates were first averaged within each water sample, after which the three field replicates were averaged to obtain a single eDNA concentration for each cage observation. Absolute quantification was based on 10-fold serial dilutions of a recombinant plasmid containing the target sequence, with each standard analyzed in triplicate. Three no-template controls were included on each qPCR plate and remained negative throughout the study. All standard curves had R2 ≥ 0.99. Amplicon identity was further verified by agarose gel electrophoresis and Sanger sequencing of a randomly selected subset of products. The gel electrophoresis results and qPCR standard curve are provided in Supplementary Figures S1 and S2, respectively.
2.6. Temporal Evaluation
The current–conversion relationship derived from the five calibration observations was evaluated using three temporally separated observations collected at sampling site B on different dates. None of these observations was used for model fitting. For each temporal evaluation observation, Kpred was estimated from the corresponding model-derived instantaneous current speed using the calibration equation and compared with the observed coefficient (Kobs).
Cage biomass was subsequently estimated as
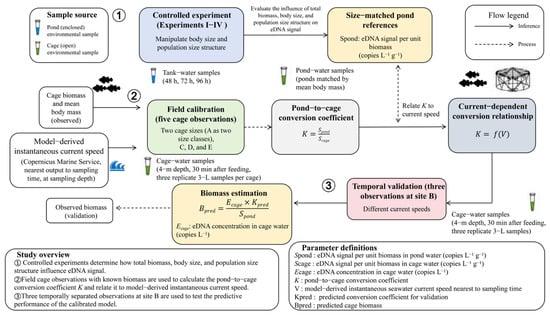
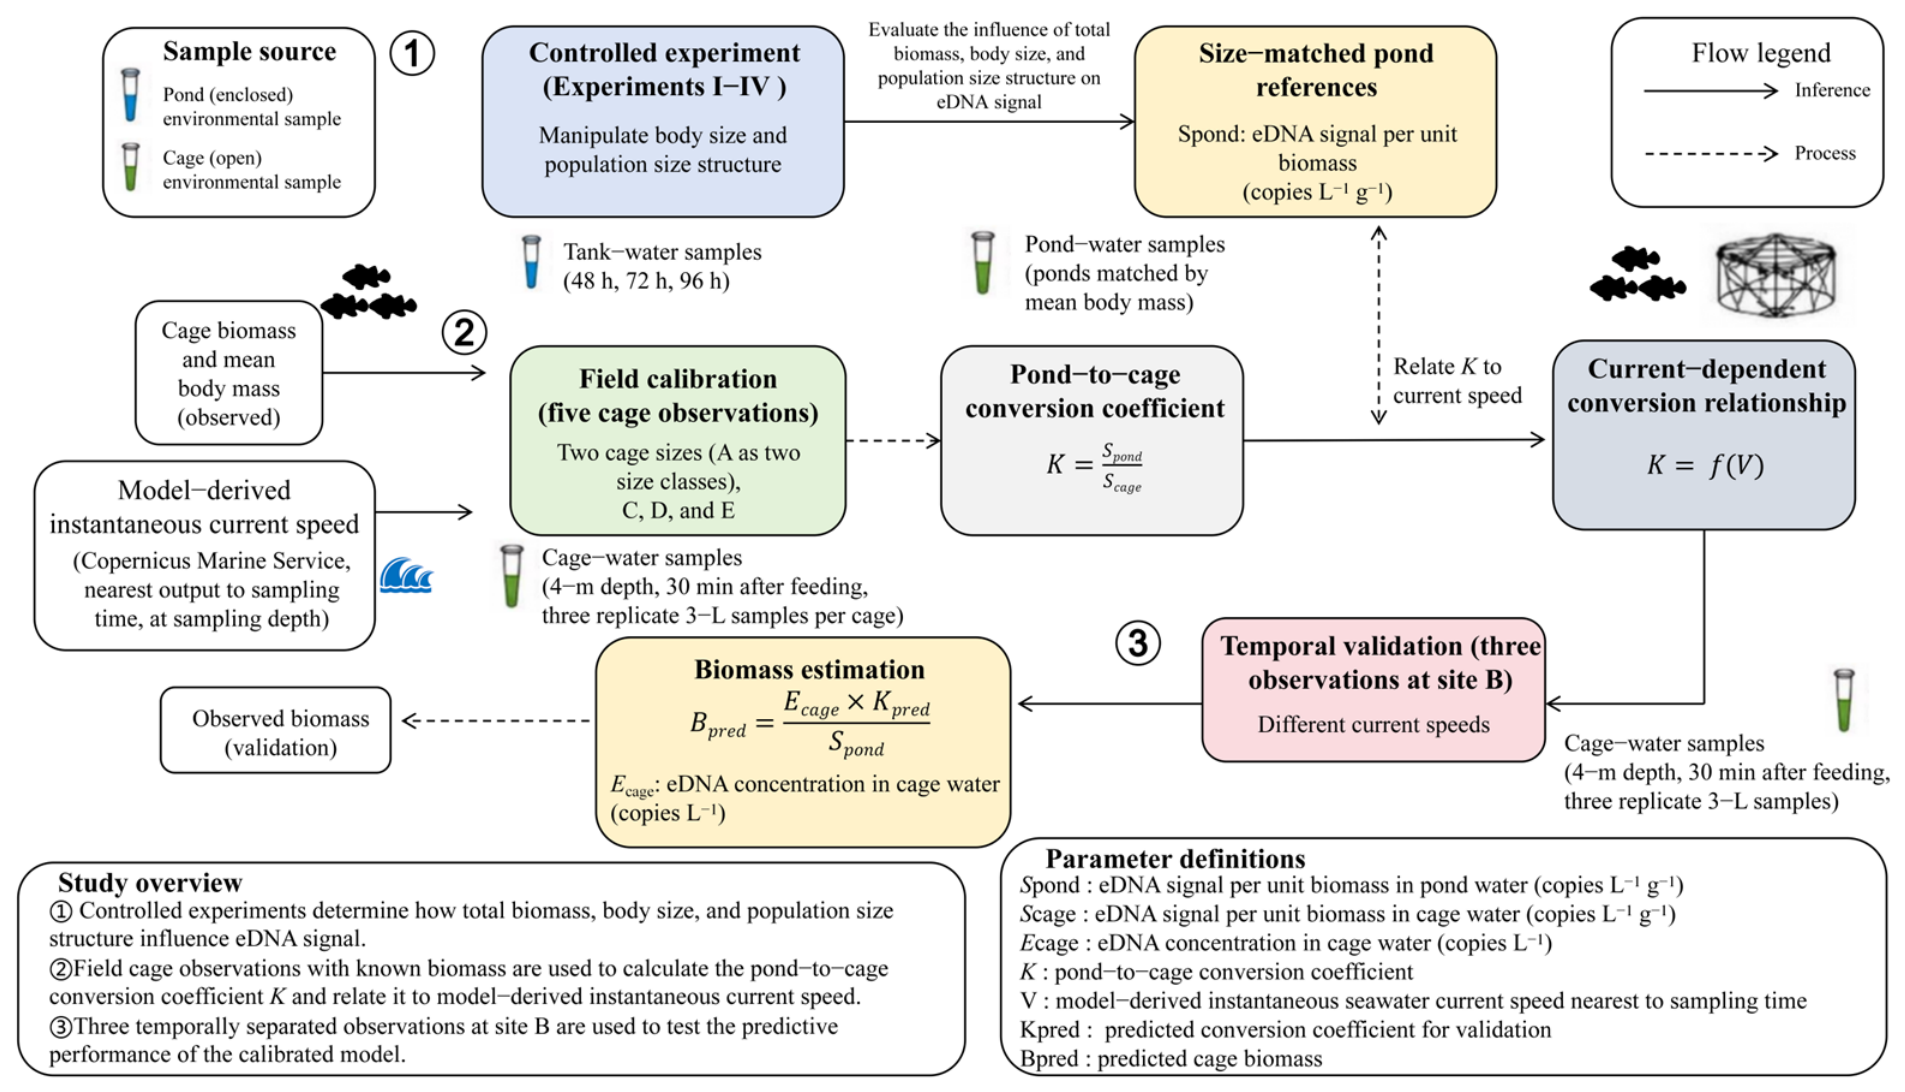
where Ecage is the measured cage-water eDNA concentration, Kpred is the current-dependent predicted pond-to-cage conversion coefficient, and Spond is the size-matched pond reference eDNA signal per unit biomass. The overall workflow for current-dependent calibration and biomass estimation is summarized in Figure 3.
Figure 3.
Framework for eDNA-based biomass estimation using size-matched pond references and current-dependent pond-to-cage calibration.
2.7. Statistical Analysis
For Experiments I and II, eDNA concentrations measured at 48, 72, and 96 h represented repeated measurements of the same experimental unit and were therefore averaged to obtain a single treatment-level value. Total biomass and treatment-level eDNA concentration were log10-transformed before analysis. Their association was evaluated using Pearson’s correlation and ordinary least-squares linear regression.
Body-size and population-structure variation were evaluated descriptively at the treatment level using eDNA signal per unit biomass; no replicate-based inferential tests were applied to these comparisons.
For field calibration, the relationship between model-derived instantaneous seawater current speed (V) and the pond-to-cage conversion coefficient (K) was evaluated using ordinary least-squares linear regression and Pearson’s correlation. Given the limited number of calibration observations, a leave-one-out sensitivity analysis was performed to evaluate the robustness of the K–V relationship. Each calibration observation was sequentially removed, and the linear regression model was refitted using the remaining observations. Validation performance was quantified by comparing predicted and observed cage biomass using absolute percentage error (APE):
and mean absolute percentage error (MAPE):
The 95% confidence interval of the regression line was visualized in the K–V relationship figure. All statistical analyses were conducted in R (version 4.6.1), with statistical significance assessed at p < 0.05.
3. Results
3.1. Association Between Total Fish Biomass and eDNA Concentration
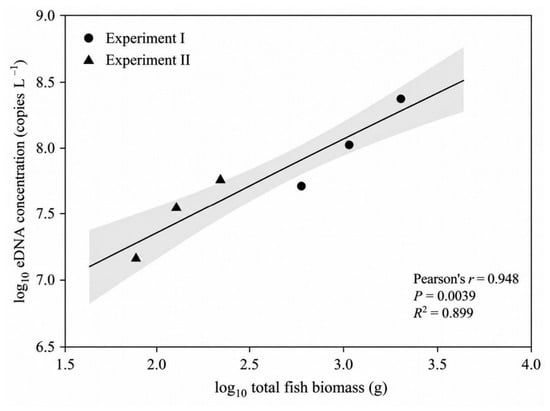
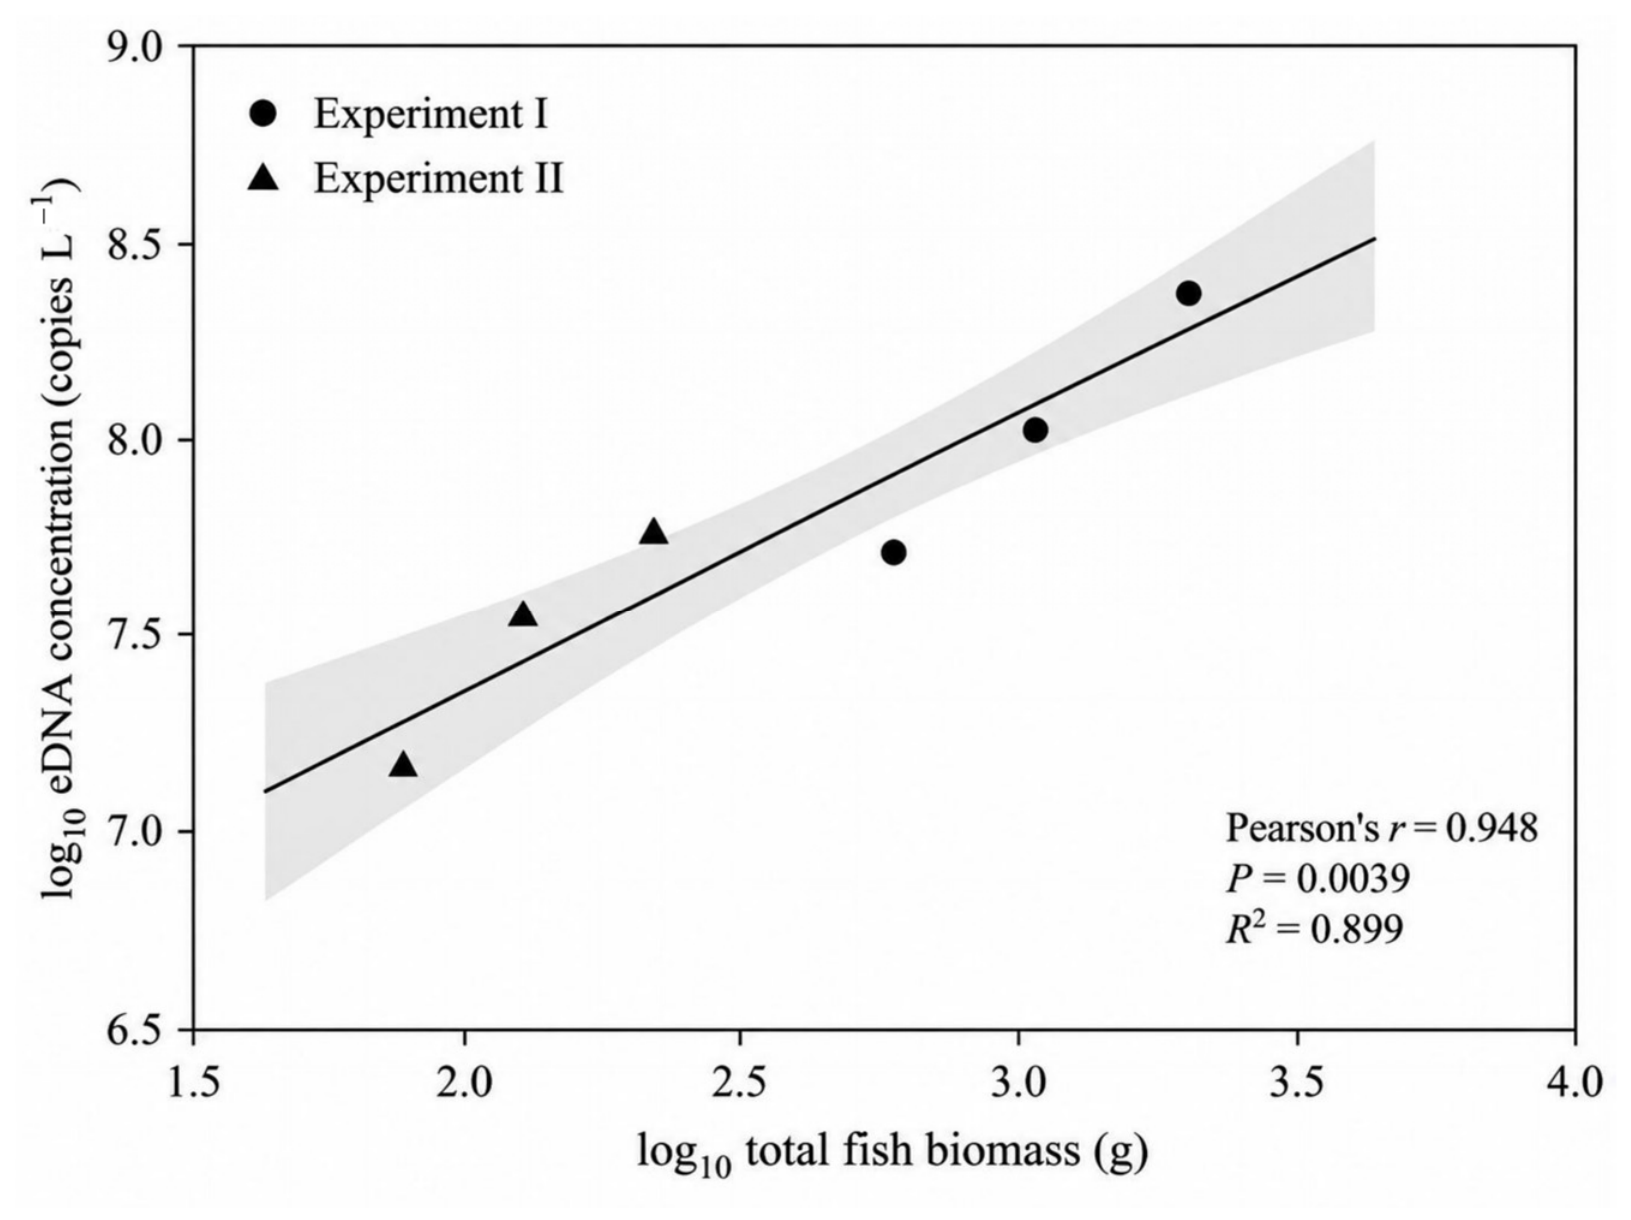
After averaging the repeated measurements at 48, 72, and 96 h within each treatment, eDNA concentration increased consistently with total fish biomass in both Experiments I and II (Figure 4). Across the six treatment-level observations, log10-transformed eDNA concentration was positively associated with log10-transformed total fish biomass (Pearson’s r = 0.948, p = 0.0039; R2 = 0.899), with the 95% confidence interval of the regression shown in Figure 4. Within each body-size class, eDNA concentration increased monotonically across the three biomass treatments. These results provide preliminary evidence of a positive association between eDNA concentration and fish biomass across the experimental conditions examined. The pooled regression represents an overall association across the two examined body-size classes.
Figure 4.
Relationship between total fish biomass and eDNA concentration in Experiments I and II. Each point represents a treatment-level mean obtained by averaging eDNA concentrations measured at 48, 72, and 96 h. Both variables were log10-transformed before analysis. The solid line represents the ordinary least-squares regression, and the shaded band denotes the 95% confidence interval (n = 6 treatment-level observations).
3.2. Variation in eDNA Signal per Unit Biomass Associated with Body Size and Population Structure
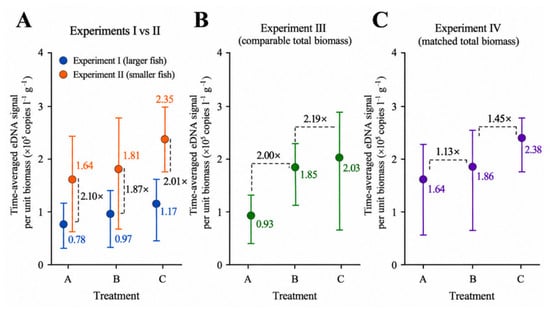
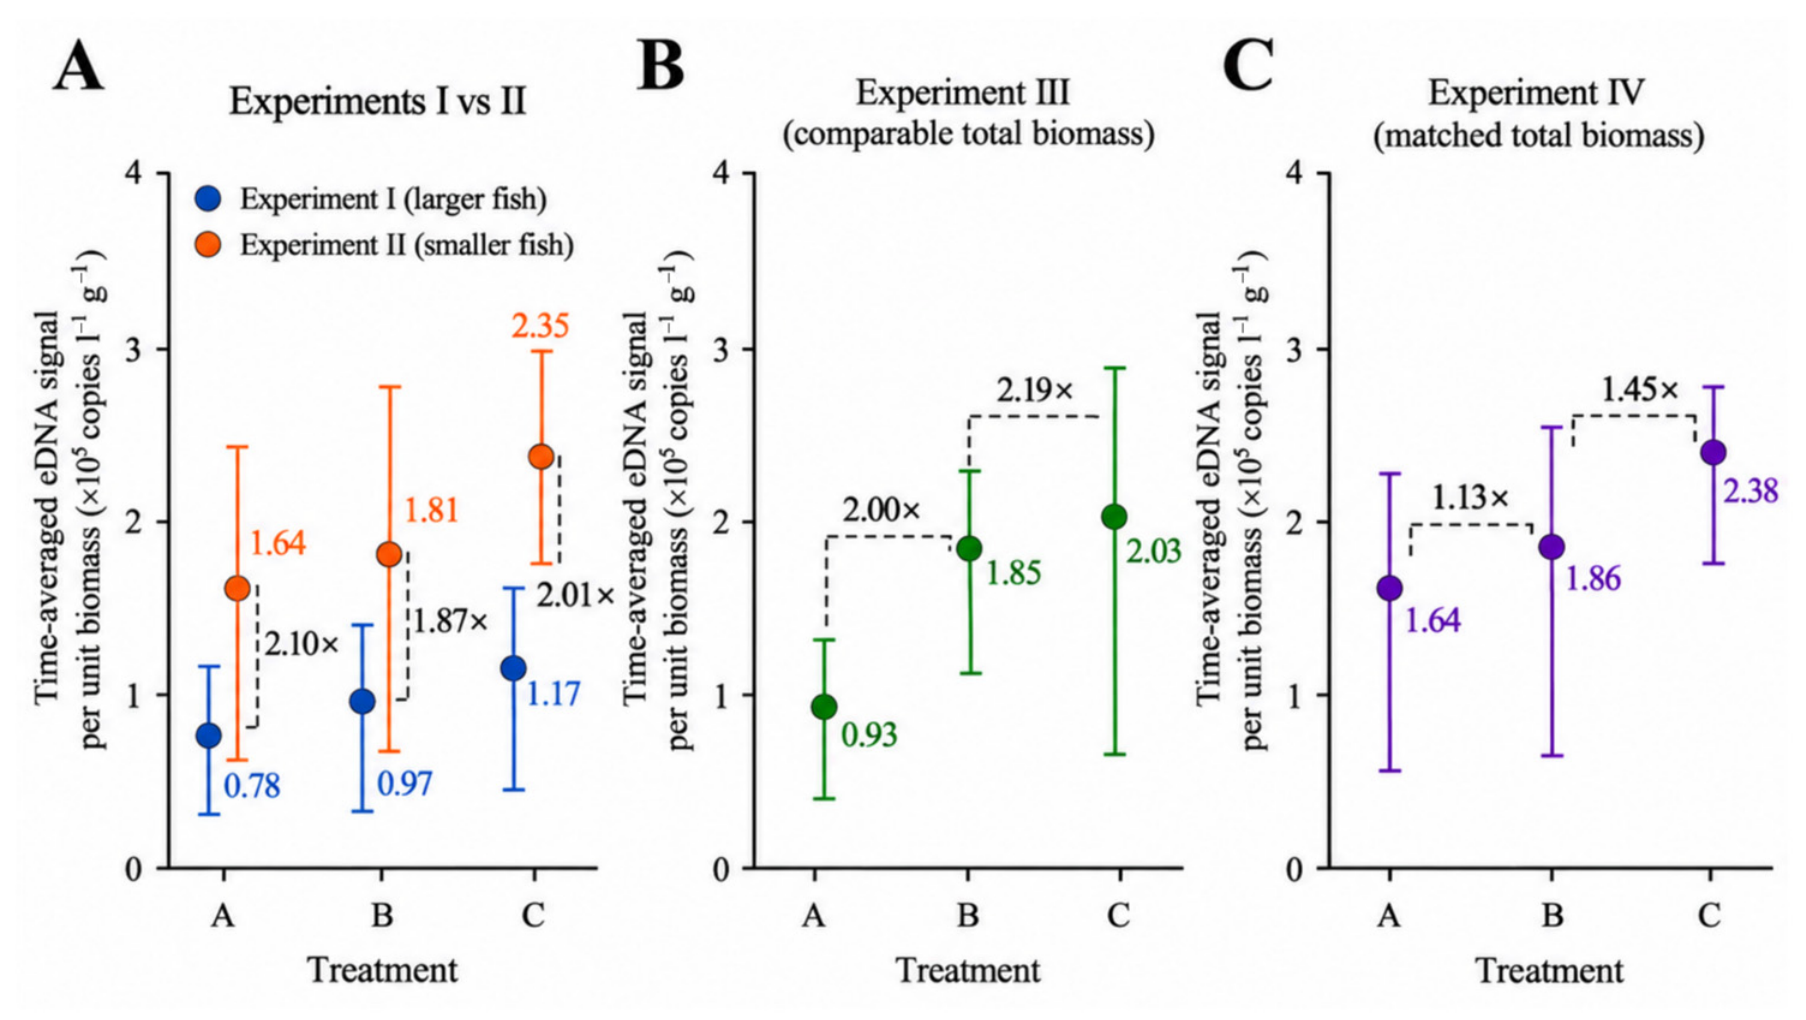
Time-averaged eDNA signal per unit biomass differed consistently between the two body-size classes represented by Experiments I and II (Figure 5A). Treatments containing smaller fish (Experiment II) showed 1.87–2.10-fold higher eDNA signals per unit biomass than the corresponding treatments containing larger fish (Experiment I). This pattern suggests that detectable eDNA signals per unit biomass may vary with fish body size.
Figure 5.
Variation in eDNA signal per unit biomass with fish body size and population structure. (A) Comparison of larger-bodied (Experiment I) and smaller-bodied (Experiment II) treatments. (B) Experiment III, in which individual body size varied substantially under broadly comparable total biomass. (C) Experiment IV, in which population size structure varied under closely matched total biomass. Values represent treatment-level means obtained by averaging measurements at 48, 72, and 96 h. Error bars indicate the range of eDNA concentrations across the three sampling times (48, 72, and 96 h).
Experiment III further showed a similar pattern of body-size-associated variation, because total biomass remained broadly comparable among treatments (449.2–502.3 g), whereas mean individual body mass decreased from 502.3 g in treatment A to 247.7 g in treatment B and 25.0 g in treatment C (Figure 5B). The time-averaged eDNA signal per unit biomass was approximately 2.00-fold higher in treatment B and 2.19-fold higher in treatment C than in treatment A. Thus, a pronounced difference in eDNA signal per unit biomass was observed when differences in total biomass were minimized.
Experiment IV showed a similar population-structure-associated pattern under closely matched total biomass (1782.2–1842.3 g; Figure 5C). As mean individual body mass decreased and the number of fish increased, the observed eDNA signal per unit biomass increased across treatments A–C. Relative to treatment A, the signal was 1.13-fold higher in treatment B and 1.45-fold higher in treatment C.
3.3. Pond-to-Cage Conversion Coefficient Is Positively Associated with Seawater Current Speed
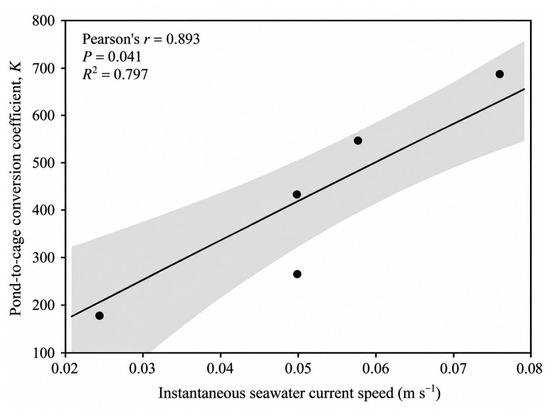
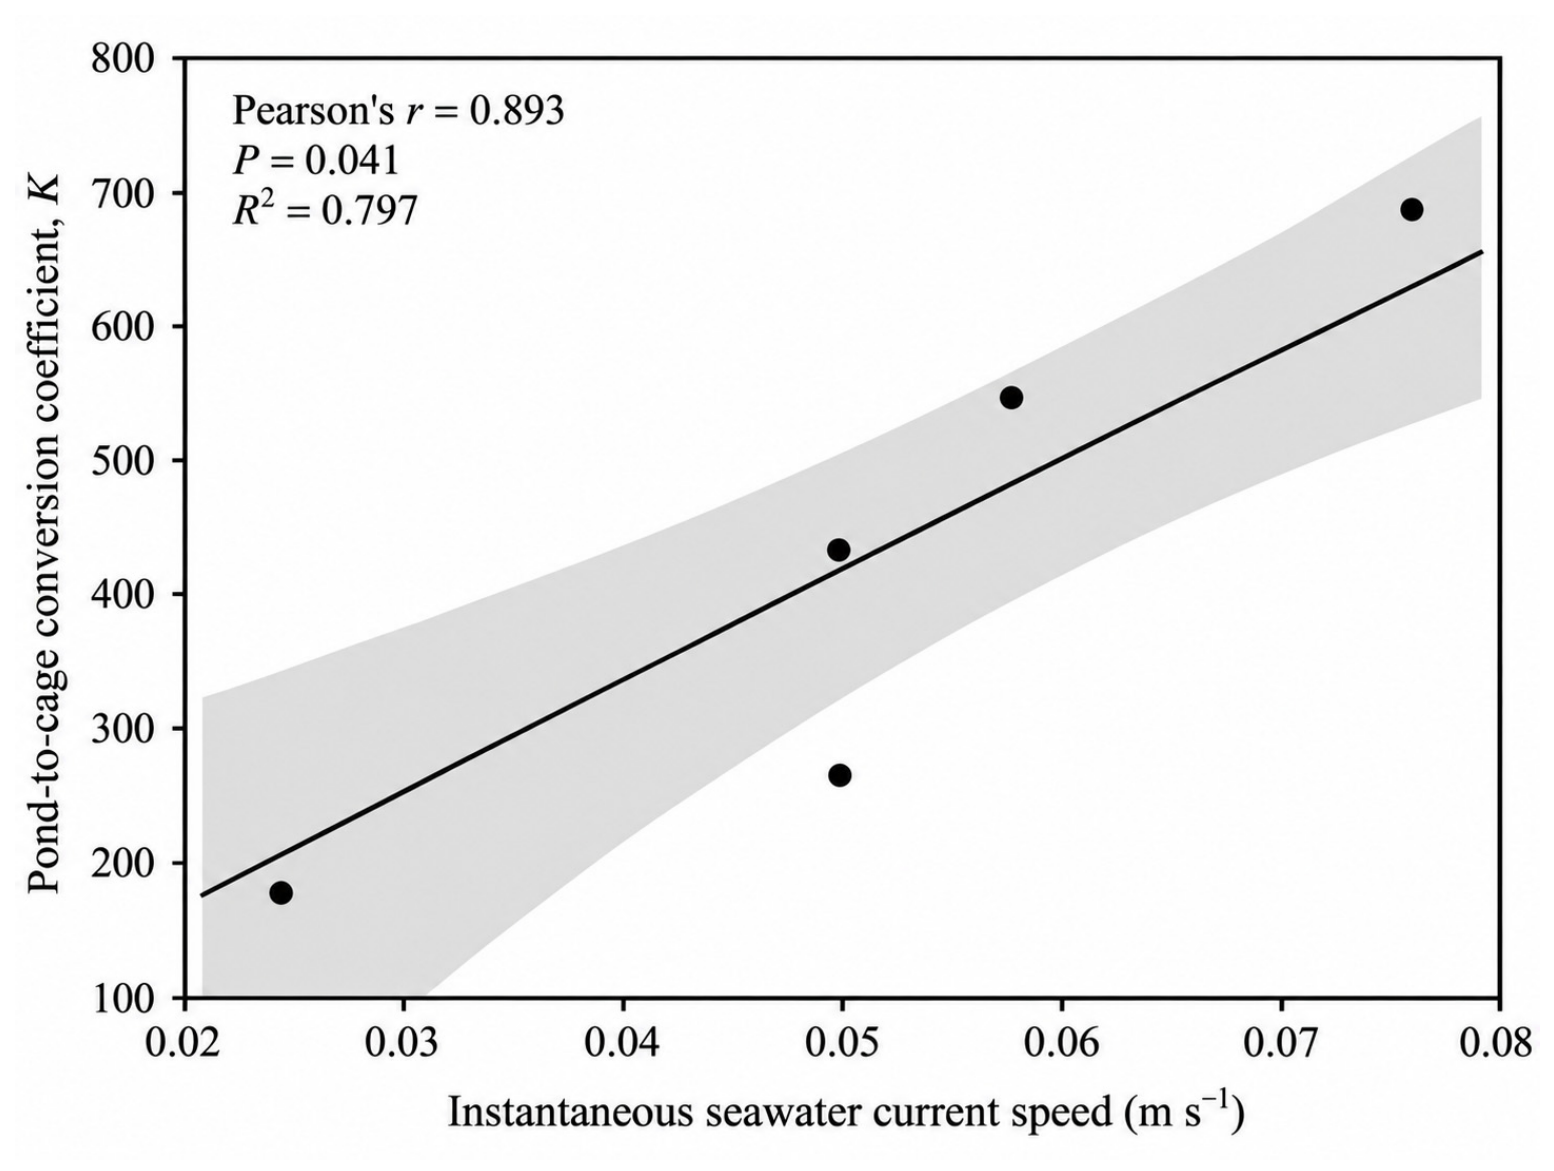
Across the five calibration observations, model-derived instantaneous seawater current speed ranged from 0.0247 to 0.0761 m s−1. The pond-to-cage conversion coefficient (K) showed a positive association with current speed (Pearson’s r = 0.893, p = 0.041; Figure 6). Linear regression explained 79.7% of the variation in K (R2 = 0.797). The fitted model yielded a slope of 9915.55 (95% CI: 734.57–19,096.53) and an intercept of −106.48 (95% CI: −616.05–403.08), resulting in the empirical relationship:
where V is the model-derived instantaneous seawater current speed temporally matched to each cage observation. Within the observed calibration range, higher current speed was associated with larger pond-to-cage conversion coefficients. Leave-one-out sensitivity analysis showed that the positive direction of the K–V association was maintained after the removal of each individual calibration observation, although the strength of the regression varied among iterations due to the limited sample size (Table S3).
K = 9915.55V − 106.48,
Figure 6.
Relationship between model-derived instantaneous seawater current speed and the pond-to-cage conversion coefficient (K) across the five calibration observations. The solid line represents the ordinary least-squares regression, and the shaded band denotes the 95% confidence interval.
3.4. Temporal Validation of the Current-Dependent Calibration
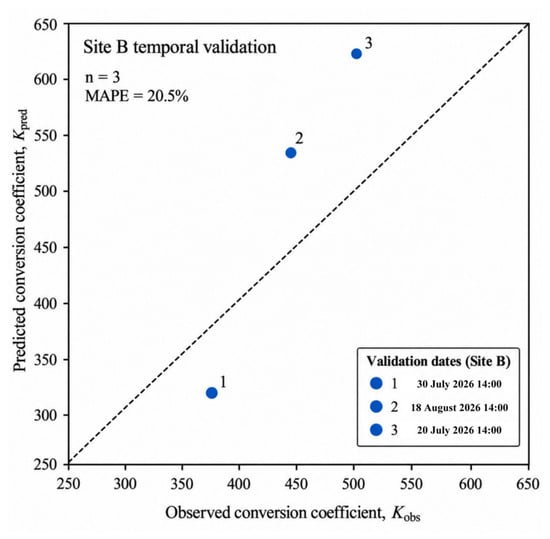
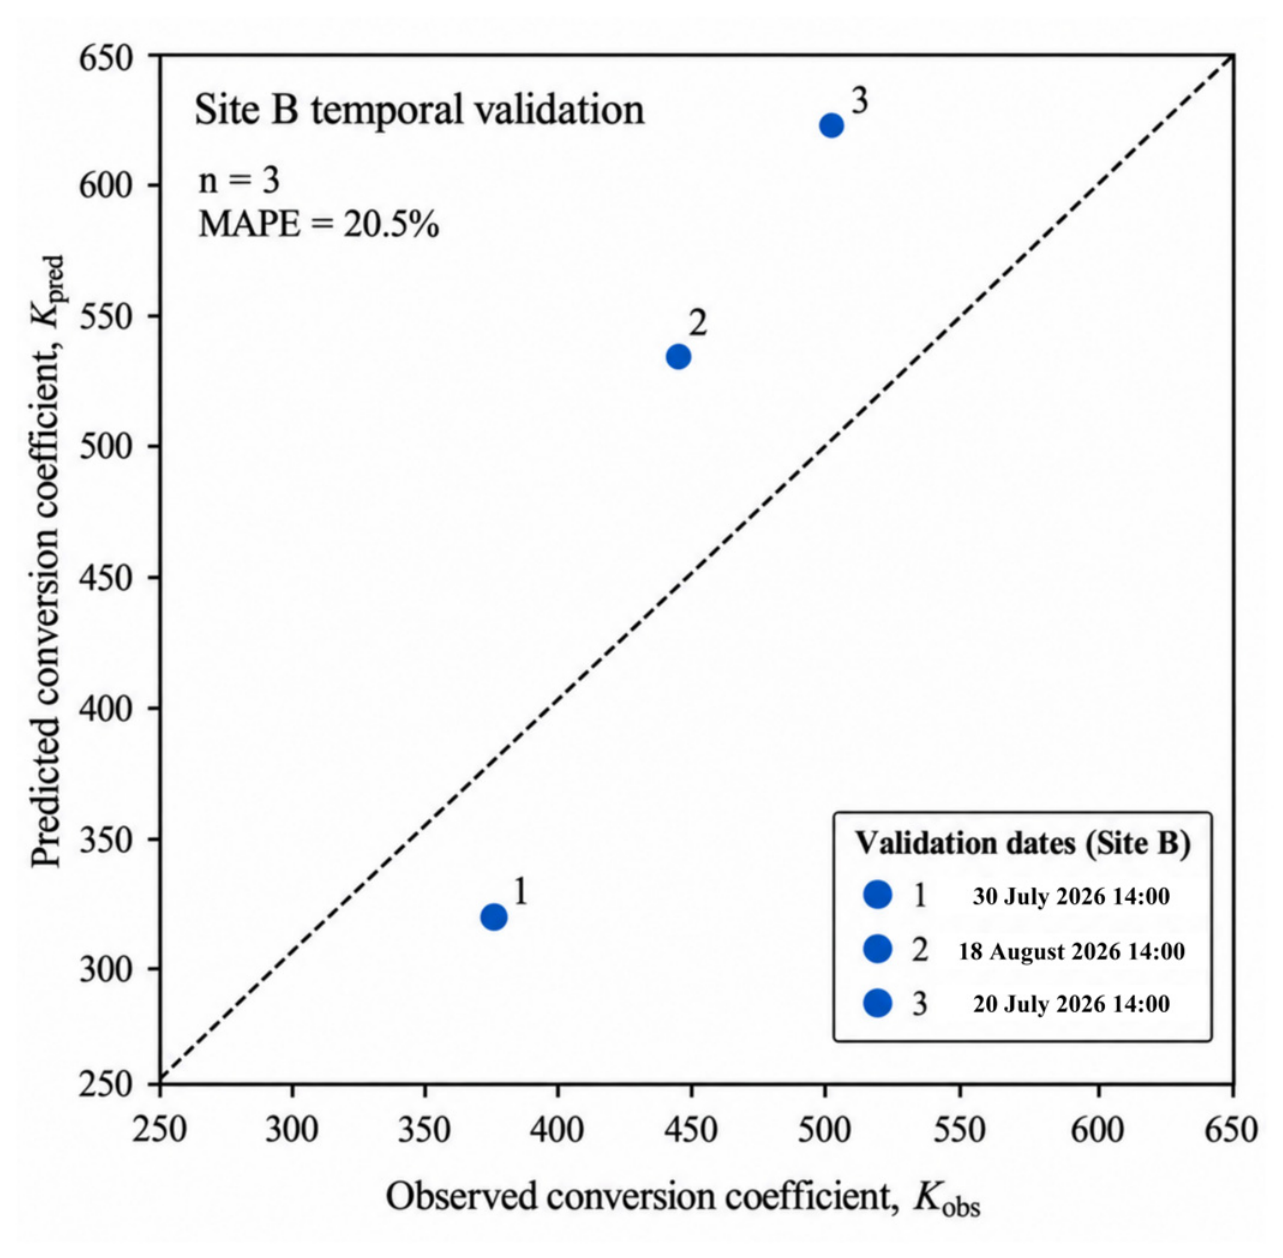
The current-dependent calibration was further examined using three temporally separated observations collected at site B, none of which was used for model fitting. The corresponding model-derived instantaneous current speeds were 0.0419, 0.0637, and 0.0733 m s−1. The observed pond-to-cage conversion coefficients (Kobs) were 349.4, 426.27, and 489.1, whereas the corresponding coefficients predicted from the current-speed calibration (Kpred) were 309.0, 525.1, and 620.3, respectively.
The resulting absolute percentage errors in biomass prediction were 11.6%, 23.2%, and 26.8%, yielding an overall mean absolute percentage error (MAPE) of 20.5%. These results provide preliminary evidence that the current-dependent calibration may reflect temporal variation in conversion coefficients within the same farming region, although prediction errors varied among sampling dates. The comparison between the predicted and observed conversion coefficients is shown in Figure 7.
Figure 7.
Temporal evaluation of the current-dependent pond-to-cage calibration at site B. Predicted conversion coefficients (Kpred) were derived from the corresponding model-derived instantaneous seawater current speeds and compared with observed coefficients (Kobs). The dashed line represents the 1:1 relationship between predicted and observed values.
4. Discussion
4.1. eDNA Concentration as an Indicator of Fish Biomass
A quantitative relationship between organismal biomass and detectable eDNA is a prerequisite for using eDNA as a biomass-monitoring tool. In the present study, treatment-level eDNA concentration was strongly and positively associated with total fish biomass under controlled conditions (r = 0.948, p = 0.0039; R2 = 0.899). Importantly, eDNA concentration increased consistently with biomass within both body-size classes, providing preliminary evidence supporting the potential use of eDNA concentration as an indicator of T. modestus biomass under controlled conditions.
Positive biomass–eDNA relationships have been reported across a range of aquatic taxa and experimental settings [23,26,38,39]. Takahara et al. [26] demonstrated a quantitative relationship between carp biomass and eDNA concentration, while similar associations have subsequently been reported for marine fishes and cultured aquatic species [23,38,39]. Collectively, these studies support the general premise that higher biomass can be associated with increased detectable target DNA in the surrounding water [37,40]. Recent studies are particularly relevant here: J. Zhang et al. [41] reported significant relationships between eDNA concentration and biomass in Gnathanodon speciosus, while Liu et al. [42] experimentally evaluated eDNA-based biomass estimation in Acanthopagrus schlegelii.
Nevertheless, the strength and transferability of this relationship depend on the biological and environmental context in which eDNA is measured. In enclosed experimental systems, losses through water exchange and horizontal transport are relatively constrained, allowing changes in biomass to be more directly reflected in local eDNA concentration [20,31]. Open marine cages differ fundamentally because water is continuously exchanged with the surrounding environment, allowing released eDNA to be transported and diluted away from its source [20,31,40,41]. Consequently, a positive biomass–eDNA relationship established under controlled conditions provides the biological basis for biomass monitoring, but cannot by itself be assumed to transfer quantitatively to field cages without additional calibration. Murakami et al. [39], using experimentally caged marine fish, showed that most detectable eDNA remained concentrated relatively close to the cage, illustrating the strong spatial dependence of marine eDNA signals.
4.2. Body Size and Population Structure as Sources of Variation in the eDNA–Biomass Relationship
Beyond total biomass, the controlled experiments revealed consistent treatment-level variation in eDNA signal per unit biomass associated with fish body size and population structure. Smaller-bodied treatments in Experiments I and II were associated with approximately twofold higher mass-specific eDNA signals than larger-bodied treatments. More importantly, Experiment III showed a similar pattern while total biomass remained broadly comparable: decreasing mean individual body mass from 502.3 to 25.0 g was accompanied by an approximately 2.2-fold increase in eDNA signal per unit biomass. Experiment IV further showed that, under closely matched total biomass, a population comprising more and smaller individuals produced a higher mass-specific eDNA signal.
The observed pattern is consistent with previous evidence that eDNA production does not necessarily scale isometrically with fish biomass [37,38,42,43]. Maruyama et al. [43], for example, found that although adult fish released more eDNA on a per-individual basis, juveniles showed a slightly higher release rate per unit body mass. However, body-size effects are not universal: Hervé et al. [44] detected no significant difference in biomass-standardized eDNA among adult size classes of tench. Together, these findings suggest that the relationship between body size and mass-specific eDNA signal is likely to depend on species, developmental stage, and experimental context rather than follow a single universal scaling rule. J. Zhang et al. [41] likewise found that body weight and fork length were associated with eDNA concentration in G. speciosus, further supporting the need to consider organism size in quantitative eDNA applications.
Several biological processes may contribute to this size dependence. Smaller individuals may have higher mass-specific metabolic activity, a larger surface-area-to-mass ratio, or different levels of swimming activity, mucus production, and epithelial turnover, potentially increasing the amount of biological material entering the water per unit biomass [42,44,45]. These mechanisms were not measured directly here and therefore remain hypotheses rather than demonstrated explanations.
This biological variation has potential implications for quantitative biomass estimation. A single eDNA-to-biomass conversion factor applied across growth stages could systematically bias biomass estimates as cultured fish grow and population size structure changes [37,38,42,43]. The use of size-matched pond references in the present calibration therefore provides a biologically informed means of reducing this source of variation. More broadly, future calibration frameworks should either stratify reference relationships by growth stage or explicitly incorporate population size structure when sufficient data are available.
4.3. Seawater Current Speed Is Associated with Variation in Pond-Based eDNA Calibration
The field calibration revealed a positive association between model-derived seawater current speed and the pond-to-cage conversion coefficient (K). Across the five calibration observations, the pond-to-cage conversion coefficient (K) increased with model-derived instantaneous current speed (r = 0.893, p = 0.041), with the linear relationship explaining 79.7% of the observed variation in K. This pattern suggests that a fixed pond-to-cage conversion coefficient may not fully capture the variability among cage environments with different hydrodynamic conditions.
A plausible explanation is that faster water movement may reduce the local retention of eDNA released within a cage by increasing transport and dilution relative to more weakly flowing conditions [20,31]. Previous studies have shown that water movement can substantially alter the spatial distribution and local concentration of aquatic eDNA through downstream or horizontal transport [20,31]. In the present study, a larger K at higher current speed may reflect a greater difference between the eDNA signal per unit biomass measured in the enclosed pond and that detected locally within the cage. Shogren et al. [46], for example, experimentally manipulated water velocities of 0.1–0.8 m s−1 and demonstrated that flow conditions affect eDNA persistence and detection, whereas coastal studies have shown that ocean transport can redistribute eDNA away from its source.
Importantly, current speed should not be interpreted as the sole determinant of the conversion coefficient. The five calibration observations were obtained from field cages that also differed in fish size, local environmental context, and other unmeasured characteristics, and the two cages sampled concurrently at site A yielded different K values despite sharing the same current-speed estimate. Pond-reference selection may represent an additional source of uncertainty in empirical eDNA calibration. In this study, size-matched references were specifically selected because body size-related differences in eDNA signals were observed in the controlled experiments. Therefore, replacing size-matched references with substantially different body-size populations may introduce additional biological variation associated with fish size, making it difficult to distinguish reference-selection uncertainty from size-related biological effects. Nevertheless, differences among available size-matched reference populations may still influence the estimated conversion coefficient, and future calibration efforts incorporating multiple replicate size-matched references are needed to further quantify this uncertainty. Thus, the observed current–K relationship is best regarded as an empirical field calibration rather than a mechanistic transport model. The leave-one-out analysis further showed that the positive direction of the current–K association was maintained across all iterations, although the statistical significance varied depending on individual calibration observations (Table S3). Therefore, this relationship should be interpreted as an exploratory empirical pattern rather than a definitive predictive relationship. Importantly, the observed current–K relationship is conditional on the pond-reference assignments used in this study, and its apparent strength may partly reflect the reference-selection procedure. Future studies incorporating multiple replicate size-matched pond references and broader calibration datasets will be necessary to further evaluate the transferability of this relationship. Nevertheless, incorporating current speed explicitly may provide a more context-specific basis for transferring pond-derived eDNA references to open cages than applying a single invariant conversion coefficient.
4.4. Predictive Performance, Limitations, and Future Refinement
The temporally separated observations at site B provided an initial assessment of the predictive performance of the current-dependent calibration within the same farming region. Across the three temporal evaluation dates, absolute percentage errors in biomass prediction ranged from 11.6% to 26.8%, with an overall MAPE of 20.5%. Given that none of these observations contributed to model fitting, the results provide preliminary evidence that the calibration may accommodate temporal variation in current conditions within the same farming area, rather than representing a comprehensive evaluation of predictive performance.
The site-B temporal evaluation also provides useful context for interpreting the role of current speed. The three observations were collected at the same location, while model-derived instantaneous current speed varied from 0.0419 to 0.0733 m s−1 and the observed conversion coefficient increased from 349.4 to 489.1. During these observations, pH and salinity remained unchanged and water temperature varied only modestly. This within-site pattern reduces, although does not eliminate, confounding by spatial differences among farms and is consistent with the current-dependent relationship identified from the calibration dataset.
Several limitations define the scope of the present model. First, the controlled experiments (Experiments I–IV) lacked independent biological replication at the treatment level. Each treatment was conducted in a single experimental tank, meaning that the tank rather than individual sampling events represented the experimental unit. Although measurements collected at 48, 72, and 96 h were averaged before analysis to avoid treating temporal observations as independent replicates, the limited number of independent experimental units restricts the strength of statistical inference. In addition, the biomass–eDNA relationship in Experiments I and II was estimated from only six treatment-level observations. Although the observed association was strong, the small sample size may result in uncertainty in correlation and regression estimates. In addition, the pooled biomass–eDNA relationship should be interpreted as an overall pattern across the tested biomass and body-size ranges rather than a universal relationship independent of body size. Therefore, the results from Experiments I–IV should be interpreted as preliminary patterns associated with biomass, body size, and population structure rather than definitive causal effects, and require further evaluation using larger replicated datasets. Second, the calibration was based on only five cage observations spanning a current-speed range of 0.0247–0.0761 m s−1, and the resulting relationship should therefore be regarded as an empirical interpolation within this range rather than a general model for unrestricted extrapolation. Third, current speed was derived from a gridded ocean physics product providing instantaneous current fields at 6-h intervals. Because field sampling did not always coincide exactly with a model output time, the instantaneous field nearest to each sampling event was used. Consequently, short-term fluctuations in water movement between the actual sampling time and the matched model output were not resolved, which may introduce additional uncertainty into the estimated current-conversion coefficient relationship. Fourth, although size-matched pond references reduced biological variation associated with fish size, the limited number of available reference groups may introduce uncertainty when cage populations differ from the available size classes. Other sources of variability—including feeding behavior, cage configuration, local environmental conditions, and biological state—may still contribute to prediction error [20,31]. In addition, the biomass values used for cage calibration were estimated rather than directly measured. Cage biomass was calculated from the estimated number of fish based on farm inventory records and the mean individual body mass obtained from 10 sampled individuals. Therefore, uncertainties associated with fish abundance and mean body mass estimates may propagate into the calculated cage eDNA signal per unit biomass, the pond-to-cage conversion coefficient, and the resulting biomass prediction error. In addition, differences in system scale between pond and cage environments may introduce further uncertainty into empirical eDNA calibration. The approximate water volumes of the reference ponds and field cages were documented (Table S1); however, variation in cage water volume among sampling sites was not explicitly incorporated into the current conversion coefficient framework. Such differences may influence eDNA dilution and retention under field conditions and should be considered in future calibration efforts.
Physicochemical conditions were recorded but were not explicitly parameterized in the present parsimonious model. The relatively small differences in pH and salinity between pond and cage environments were not treated as separate correction terms, whereas the larger temperature contrast was not independently resolved in the present model. Instead, temperature-related variation, together with other environmental differences between pond and cage conditions, was considered part of the overall environmental contrast represented by the empirical pond-to-cage relationship. Future work should therefore evaluate whether explicitly incorporating experimentally derived responses to temperature, pH, salinity, or other environmental variables provides additional explanatory and predictive power beyond current speed alone [29,30,38,43,45]. Expansion of the calibration dataset across broader environmental conditions and independent farming locations will be necessary to determine the generality and practical limits of the approach [37,47,48]. Controlled marine experiments have shown that temperature can strongly affect eDNA persistence, while pH may exert weaker but detectable effects, supporting the value of testing such variables explicitly in future multivariate calibration frameworks.
Another potential source of uncertainty is the spatial origin of detected eDNA signals in open-water cage systems. Because eDNA can persist in aquatic environments and be transported by water movement, eDNA collected at a specific cage location may not exclusively represent material released from the target cage but may also include contributions from adjacent cages. Such lateral transport among neighboring cages could introduce additional variability into the estimated pond-to-cage conversion coefficient. Although the current-dependent calibration framework partially accounts for hydrodynamic effects, future applications should consider cage spacing, current direction, and local water exchange patterns to further evaluate spatial connectivity among cages.
5. Conclusions
This study provides preliminary evidence that eDNA-based approaches have potential for biomass estimation of cage-cultured Thamnaconus modestus. Under controlled conditions, eDNA concentration showed a positive association with total fish biomass, while eDNA signal per unit biomass showed patterns associated with body size and population structure. Field calibration further suggested a positive association between the pond-to-cage conversion coefficient and seawater current speed, while temporal evaluation within a single farming area resulted in biomass estimation errors of 11.6–26.8% (MAPE = 20.5%). These findings suggest that combining size-matched biological references with current-dependent calibration may represent a promising approach for improving the transferability of eDNA-based biomass estimation in marine cages, although further validation across broader environmental conditions and farming locations is required.
Supplementary Materials
The following supporting information can be downloaded at: https://www.mdpi.com/article/10.3390/fishes11100579/s1, Figure S1: Agarose gel electrophoresis of PCR amplification products; Figure S2: Quantitative PCR standard curve; Table S1: Approximate water volumes of pond and cage calibration systems; Table S2: Cage population information and size-matched pond-reference assignments for calibration and temporal evaluation observations; Table S3: Leave-one-out sensitivity analysis of the current speed–pond-to-cage conversion coefficient (K) relationship; Table S4: eDNA concentrations in Experiments I and II; Table S5: eDNA concentrations in Experiment III; Table S6: eDNA concentrations in Experiment IV; Table S7: Data used for the seawater-current-speed calibration shown in Figure 6; Table S8: Data used for the temporal validation shown in Figure 7.
Author Contributions
Z.C. (Methodology, Validation, Writing—original draft, Data curation), Q.H. (Data curation), H.L. (Resources), Y.T. (Conceptualization), Y.P. (Visualization), Z.W. (Conceptualization, Writing—review & editing). All authors have read and agreed to the published version of the manuscript.
Funding
This study was supported by the Development Plan of Youth Innovation Team in Colleges and Universities of Shandong Province (2025KJI006) and the Natural Science Foundation of Shandong Province (ZR2024MD076).
Institutional Review Board Statement
All procedures involving live fish were conducted in accordance with the institutional guidelines for the care and use of aquatic animals at Yantai University. The experimental procedures involved routine husbandry practices and non-invasive water sampling for eDNA analysis. According to the requirements of the institution, formal ethical approval was not required for this study.
Informed Consent Statement
Not applicable.
Data Availability Statement
The datasets generated and analyzed during the current study are provided in the Supplementary Materials.
Conflicts of Interest
Author Haizhou Li was employed by Yantai Bajiaowan Marine Technology Co., Ltd. The company provided access to commercial cage farming sites and associated farming information used in this study but had no involvement in study design, data collection procedures, data analysis, interpretation of results, or the decision to publish the manuscript. The remaining authors declare that the research was conducted in the absence of any commercial or financial relationships that could be construed as potential conflicts of interest.
References
- Ye, R.J. Measuring Externalities of Offshore Cage Culture in Zhoushan and Policies of Internalizing These Externalities. Master’s Thesis, Zhejiang Ocean University, Zhejiang, China, 2020. [Google Scholar]
- Gao, Q.F.; Zhang, G.; Dong, S.L. Reviews on cage-culture ecology. Period. Ocean Univ. China 2019, 49, 7–17. [Google Scholar] [CrossRef]
- Chen, K.; Zhang, X.M.; Liu, X.Y.; Huang, H.; Xu, H.Z.; Shi, W.K.; Zhang, J.H.; Liu, Y.Y. Status and development trends of marine ranching in China. Fish. Inf. Strategy 2020, 35, 12–21. [Google Scholar] [CrossRef]
- Cao, F.L.; Xia, L.H.; Guo, Z.X.; Feng, H.Y. Advances in mariculture contamination. Guangdong Agric. Sci. 2015, 22, 97–105. [Google Scholar] [CrossRef]
- He, Y.Q.; Zheng, Q.H.; Wen, W.Y.; Zhang, Y.Y. A study on seawater environment affected by cage mariculture in Daya Bay. Trop. Oceanol. 1996, 15, 22–27. [Google Scholar]
- FAO. The State of World Fisheries and Aquaculture 2024: Blue Transformation in Action; Food and Agriculture Organization of the United Nations: Rome, Italy, 2024. [Google Scholar] [CrossRef] [Scilit]
- Price, C.; Black, K.D.; Hargrave, B.T.; Morris, J.A. Marine cage culture and the environment: Effects on water quality and primary production. Aquac. Environ. Interact. 2015, 6, 151–174. [Google Scholar] [CrossRef] [Scilit]
- Li, D.H.; Han, L.M. Research on constructing a new food security guarantee system through land-sea coordination. Soc. Sci. J. 2019, 6, 109–117. [Google Scholar]
- Dorval, E.; Lynn, K.; Porzio, D.; Nguyen, T.; Grady, K. Computing bias and variance for Pacific sardine (Sardinops sagax) biomass estimated from aerial surveys in California nearshore waters. Fish. Res. 2024, 274, 106999. [Google Scholar] [CrossRef] [Scilit]
- Palermino, A.; De Felice, A.; Canduci, G.; Biagiotti, I.; Costantini, I.; Centurelli, M.; Leonori, I. Preliminary target strength measurement of Sprattus sprattus and its influence on biomass estimates in the Adriatic Sea (Mediterranean Sea). Fish. Res. 2023, 266, 106777. [Google Scholar] [CrossRef] [Scilit]
- Hwang, H.K.; Son, M.H.; Myeong, J.I.; Kim, C.W.; Min, B.H. Effects of stocking density on the cage culture of Korean rockfish (Sebastes schlegeli). Aquaculture 2014, 434, 303–306. [Google Scholar] [CrossRef] [Scilit]
- Meng, J.; Du, H.; Zhao, Y.P.; Ye, Z.Y.; Liu, S.C. An extraction method of fish vector field for marine cage culture based on UAV vision. Aquac. Eng. 2022, 98, 102276. [Google Scholar] [CrossRef] [Scilit]
- Nishikawa, H.; Matsuoka, D.; Nishimori, Y.; Yamaguchi, T.; Ito, M.; Watanabe, Y.; Sugiyama, D.; Kuwatani, T.; Ishikawa, Y. Estimation of the fish number in farming cage from the fish finder echo images via machine learning. Aquac. Eng. 2025, 109, 102505. [Google Scholar] [CrossRef] [Scilit]
- Taylor, M.H.; Haslob, H.; Hünerlage, K.; Kempf, A. Estimation of brown shrimp stock and fishery dynamics in the German Bight using a novel biomass index. Fish. Res. 2025, 291, 107547. [Google Scholar] [CrossRef] [Scilit]
- Zhang, S.; Shao, P.; Zhong, H.; Wu, Y.; Du, C. Biomass estimation in shrimp aquaculture using multimodal deep learning approaches. Ecol. Inform. 2025, 92, 103531. [Google Scholar] [CrossRef] [Scilit]
- Almansa, C.; Reig, L.; Oca, J. The laser scanner is a reliable method to estimate the biomass of a Senegalese sole (Solea senegalensis) population in a tank. Aquac. Eng. 2015, 69, 78–83. [Google Scholar] [CrossRef] [Scilit]
- Rani, S.V.J.; Ioannou, I.; Swetha, R.; Lakshmi, R.M.D.; Vassiliou, V. A novel automated approach for fish biomass estimation in turbid environments through deep learning, object detection, and regression. Ecol. Inform. 2024, 81, 102663. [Google Scholar] [CrossRef] [Scilit]
- Zhang, T.; Yang, Y.; Liu, Y.; Liu, C.; Zhao, R.; Li, D.; Shi, C. Fully automatic system for fish biomass estimation based on deep neural network. Ecol. Inform. 2024, 79, 102399. [Google Scholar] [CrossRef] [Scilit]
- Wood, Z.T.; Erdman, B.F.; York, G.; Trial, J.G.; Kinnison, M.T. Experimental assessment of optimal lotic eDNA sampling and assay multiplexing for a critically endangered fish. Environ. DNA 2020, 2, 407–417. [Google Scholar] [CrossRef] [Scilit]
- Laporte, M.; Bougas, B.; Côté, G.; Champoux, O.; Paradis, Y.; Morin, J.; Bernatchez, L. Caged fish experiment and hydrodynamic bidimensional modeling highlight the importance to consider 2D dispersion in fluvial environmental DNA studies. Environ. DNA 2020, 2, 362–372. [Google Scholar] [CrossRef] [Scilit]
- Doi, H.; Inui, R.; Akamatsu, Y.; Kanno, K.; Yamanaka, H.; Takahara, T.; Minamoto, T. Environmental DNA analysis for estimating the abundance and biomass of stream fish. Freshw. Biol. 2017, 62, 30–39. [Google Scholar] [CrossRef] [Scilit]
- Tillotson, M.D.; Kelly, R.P.; Duda, J.J.; Hoy, M.; Kralj, J.; Quinn, T.P. Concentrations of environmental DNA (eDNA) reflect spawning salmon abundance at fine spatial and temporal scales. Biol. Conserv. 2018, 220, 1–11. [Google Scholar] [CrossRef] [Scilit]
- Salter, I.; Joensen, M.; Kristiansen, R.; Steingrund, P.; Vestergaard, P. Environmental DNA concentrations are correlated with regional biomass of Atlantic cod in oceanic waters. Commun. Biol. 2019, 2, 461. [Google Scholar] [CrossRef] [Scilit] [PubMed]
- Kelly, R.P.; Port, J.A.; Yamahara, K.M.; Crowder, L.B. Using environmental DNA to census marine fishes in a large mesocosm. PLoS ONE 2014, 9, e86175. [Google Scholar] [CrossRef] [Scilit] [PubMed]
- Diao, C.Y.; Wang, W.; Xian, W.W.; Zhang, H. Research progress, current status and prospects of environmental DNA technology in fishery resource biomass assessment. Mar. Sci. 2022, 46, 135–144. [Google Scholar] [CrossRef]
- Takahara, T.; Minamoto, T.; Yamanaka, H.; Doi, H.; Kawabata, Z. Estimation of fish biomass using environmental DNA. PLoS ONE 2012, 7, e35868. [Google Scholar] [CrossRef] [Scilit] [PubMed]
- Yamamoto, S.; Minami, K.; Fukaya, K.; Takahashi, K.; Sawada, H.; Murakami, H.; Tsuji, S.; Hashizume, H.; Kubonaga, S.; Horiuchi, T.; et al. Environmental DNA as a “snapshot” of fish distribution: A case study of Japanese jack mackerel in Maizuru Bay, Sea of Japan. PLoS ONE 2016, 11, e0149786. [Google Scholar] [CrossRef] [Scilit] [PubMed]
- Sun, S.; Lyu, D.; Qian, T.; Shan, X.; Wang, W. Evaluate the biomass of Fenneropenaeus chinensis from the Southern Coast of Shandong Peninsula using eDNA. Water 2023, 15, 342. [Google Scholar] [CrossRef] [Scilit]
- Strickler, K.M.; Fremier, A.K.; Goldberg, C.S. Quantifying effects of UV-B, temperature, and pH on eDNA degradation in aquatic microcosms. Biol. Conserv. 2015, 183, 85–92. [Google Scholar] [CrossRef] [Scilit]
- McCartin, L.J.; Vohsen, S.A.; Ambrose, S.W.; Layden, M.; McFadden, C.S.; Cordes, E.E.; McDermott, J.M.; Herrera, S. Temperature controls eDNA persistence across physicochemical conditions in seawater. Environ. Sci. Technol. 2022, 56, 8629–8639. [Google Scholar] [CrossRef] [Scilit] [PubMed]
- Andruszkiewicz, E.A.; Koseff, J.R.; Fringer, O.B.; Ouellette, N.T.; Lowe, A.B.; Edwards, C.A.; Boehm, A.B. Modeling environmental DNA transport in the coastal ocean using Lagrangian particle tracking. Front. Mar. Sci. 2019, 6, 477. [Google Scholar] [CrossRef] [Scilit]
- Xu, X.L. Study on the ecology of filefish (Thamnaconus modestus). Fish. Sci. Technol. Inf. 1978, 3, 15–17. [Google Scholar] [CrossRef]
- Zhang, Z. Studies on Growth, Development, Feeding Characteristics, Digestive and Endocrine Physiology of Larval, Juvenile, and Young Thamnaconus modestus. Master’s Thesis, Yantai University, Yantai, China, 2021. [Google Scholar]
- Xu, X.L.; Zheng, Y.J.; Liu, S. Estimation of stock size of filefish Thamnaconus modestus in the East China Sea and Yellow Sea. Oceanol. Limnol. Sin. 1992, 23, 652–656. [Google Scholar] [CrossRef]
- Chen, H.J.; Feng, C.; Yang, P.R.; Xu, J.T.; Zhang, Q.H.; Xu, J.H.; Zhang, L.L.; Zhang, J.X.; Ying, N. Current situation and prospect of the research on the culture of Thamnaconus modestus. J. Jiangsu Ocean Univ. (Nat. Sci. Ed.) 2023, 32, 25–29. [Google Scholar] [CrossRef]
- Chinese Academy of Fishery Sciences. On-Site Acceptance of the Pilot-Scale Seed Breeding of Thamnaconus modestus Organized by East China Sea Fisheries Research Institute. 2021. Available online: https://www.cafs.ac.cn/info/1024/38331.htm (accessed on 24 May 2026).
- Juell, J.E.; Fernö, A.; Furevik, D.; Huse, I. Influence of hunger level and food availability on the spatial distribution of Atlantic salmon (Salmo salar L.) in sea cages. Aquac. Res. 1994, 25, 439–451. [Google Scholar] [CrossRef] [Scilit]
- Kim, H.R.; Choi, J.H.; Park, W.G. Vertical Distribution and Feeding Ecology of the Black Scraper, Thamnaconus modestus, in the Southern Sea of Korea. Turk. J. Fish. Aquat. Sci. 2013, 13, 249–259. [Google Scholar] [CrossRef] [PubMed]
- Murakami, H.; Yoon, S.; Kasai, A.; Minamoto, T.; Yamamoto, S.; Sakata, M.K.; Horiuchi, T.; Sawada, H.; Kondoh, M.; Yamashita, Y.; et al. Dispersion and degradation of environmental DNA from caged fish in a marine environment. Fish. Sci. 2019, 85, 327–337. [Google Scholar] [CrossRef] [Scilit]
- Rourke, M.L.; Fowler, A.M.; Hughes, J.M.; Broadhurst, M.K.; DiBattista, J.D.; Fielder, S.; Wilkes Walburn, J.; Furlan, E.M. Environmental DNA (eDNA) as a tool for assessing fish biomass: A review of approaches and future considerations for resource surveys. Environ. DNA 2022, 4, 9–33. [Google Scholar] [CrossRef] [Scilit]
- Zhang, J.; Chen, X.; Zhou, Q.; Diao, C.; Jia, H.; Xian, W.; Zhang, H. Species identification and biomass assessment of Gnathanodon speciosus based on environmental DNA technology. Ecol. Indic. 2024, 160, 111821. [Google Scholar] [CrossRef] [Scilit]
- Liu, Y.; Zhang, M.Y.; Wang, L.M.; Yang, C.P.; Yang, Y.K.; Xie, Q.J.; Liu, M.T.; Chen, C.; Jia, C.B.; Shan, B.B. Experimental assessment of Acanthopagrus schlegelii biomass based on environmental DNA technology. Sci. Rep. 2024, 14, 32029. [Google Scholar] [CrossRef] [Scilit] [PubMed]
- Maruyama, A.; Nakamura, K.; Yamanaka, H.; Kondoh, M.; Minamoto, T. The release rate of environmental DNA from juvenile and adult fish. PLoS ONE 2014, 9, e114639. [Google Scholar] [CrossRef] [Scilit] [PubMed]
- Hervé, A.; Domaizon, I.; Baudoin, J.M.; Dejean, T.; Gibert, P.; Valentini, A.; Logez, M. Do temperature and population size structure influence the quantity of fish eDNA in water? Front. Environ. Sci. 2023, 11, 1193393. [Google Scholar] [CrossRef] [Scilit]
- Jo, T.; Murakami, H.; Yamamoto, S.; Masuda, R.; Minamoto, T. Effect of water temperature and fish biomass on environmental DNA shedding, degradation, and size distribution. Ecol. Evol. 2019, 9, 1135–1146. [Google Scholar] [CrossRef] [Scilit] [PubMed]
- Shogren, A.J.; Tank, J.L.; Egan, S.P.; August, O.; Rosi, E.J.; Hanrahan, B.R.; Renshaw, M.A.; Gantz, C.A.; Bolster, D. Water flow and biofilm cover influence environmental DNA detection in recirculating streams. Environ. Sci. Technol. 2018, 52, 8530–8537. [Google Scholar] [CrossRef] [Scilit] [PubMed]
- Klymus, K.E.; Richter, C.A.; Chapman, D.C.; Paukert, C.P. Quantification of eDNA shedding rates from invasive bighead carp Hypophthalmichthys nobilis and silver carp Hypophthalmichthys molitrix. Biol. Conserv. 2015, 183, 77–84. [Google Scholar] [CrossRef] [Scilit]
- Ledger, K.J.; Rew Hicks, M.B.; Hurst, T.P.; Larson, W.; Baetscher, D.S. Validation of environmental DNA for estimating proportional and absolute biomass. Environ. DNA 2024, 6, e70030. [Google Scholar] [CrossRef] [Scilit]

Disclaimer/Publisher’s Note: The statements, opinions and data contained in all publications are solely those of the individual author(s) and contributor(s) and not of MDPI and/or the editor(s). MDPI and/or the editor(s) disclaim responsibility for any injury to people or property resulting from any ideas, methods, instructions or products referred to in the content. |
© 2026 by the authors. Licensee MDPI, Basel, Switzerland. This article is an open access article distributed under the terms and conditions of the Creative Commons Attribution (CC BY) license.