


Abstract
This study examines the socio-economic structure of Rumnos, a village in the district of Devrek in the Ottoman province of Bolu (now in Devrek district, Zonguldak Province, Türkiye), on the basis of Temettuat Register no. 3378, dated 1844–1845. The analysis is confined to a single village and makes no comparisons, and its findings cannot be generalized to the country as a whole; nevertheless, they may provide a model for future research. According to this particular volume of the Temettuat Register, agriculture and animal husbandry were the village’s principal sources of income. The prevalence of occupations directly related to agriculture is remarkable, as it generates the majority of wealth. The types of taxes paid by the tax-liable heads of household, together with their incomes derived from their occupational activities, were identified, and their overall tax burdens were determined. An income distribution analysis using statistical methods was conducted for this study. A Lorenz curve was constructed, and the Gini coefficient was calculated as 0.33. The analysis determined that there was a moderate level of inequality in the income distribution among the households in the village of Rumnos.
1. Introduction
This study aimed to contribute to the still limited body of research on economic ine-quality in the Ottoman Empire. It identified the economic and social structural character-istics of the village of Rumnos, which was located in the district of Devrek in the Bolu Province of the Ottoman Empire (now located in the district of Devrek in the Zonguldak Province), based on a volume of the Temettuat Register data obtained from the Ottoman Archive in the Directorate of the State Archive. This village is a rural settlement that drives its income from agriculture. It deserves to be studied because it serves as an example for the country as a whole, which had a pre-industrial agricultural economy. In addition, the study analyzed the quantitative data derived from the register to offer social and eco-nomic evaluations within the limits of what this data includes. The study sought to inves-tigate whether income inequality existed in the village of Rumnos. The primary data source for the study was one of a series of tax surveys known as the Temettuat Registers, which are preserved in the Ottoman Archives and were compiled across a large part of the empire in the years 1844–45.1
This study provides a multidimensional contribution to the literature on Ottoman economic history. First, using the data contained in the Temettuat Register number 3378, the study evaluated the sociocultural structure of the residents of the village of Rumnos. The study evaluated a sample of the conditions of people in Ottoman countryside.
In the next section of this article, the history of the village of Rumnos, its surroundings, and the transformations it underwent since its founding to the mid-19th are presented. The third section provides information on the Temettuat Registers, which constitute significant fiscal records of the Ottoman reform period after the Tanzimat Edict (1839).
In the fourth section is an examination of the social structure of Rumnos based on the data obtained from the Temettuat Register number 3378. This section also presents the qualitative analysis of the residents’ demographic characteristics and estimated population and prevalent occupations. In the fifth section, the annual household incomes and income distribution are described together with the types and quantities of landholdings, livestock, agricultural products, and taxes. Based on the quantitative findings, the economic structure of the village is described. In the sixth section, the types and amounts of taxes collected are presented using the numerical data that were obtained from the Temettuat Register number 3378. In the seventh section, information is provided about the concept of income distribution and the income distribution of the village of Rumnos determined. The results obtained in the study are analyzed in the eighth and final chapter.
2. The Settlement Under Examination: The Village of Rumnos
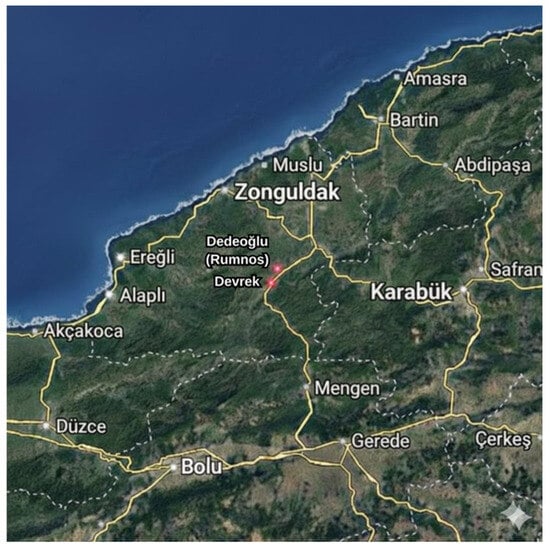
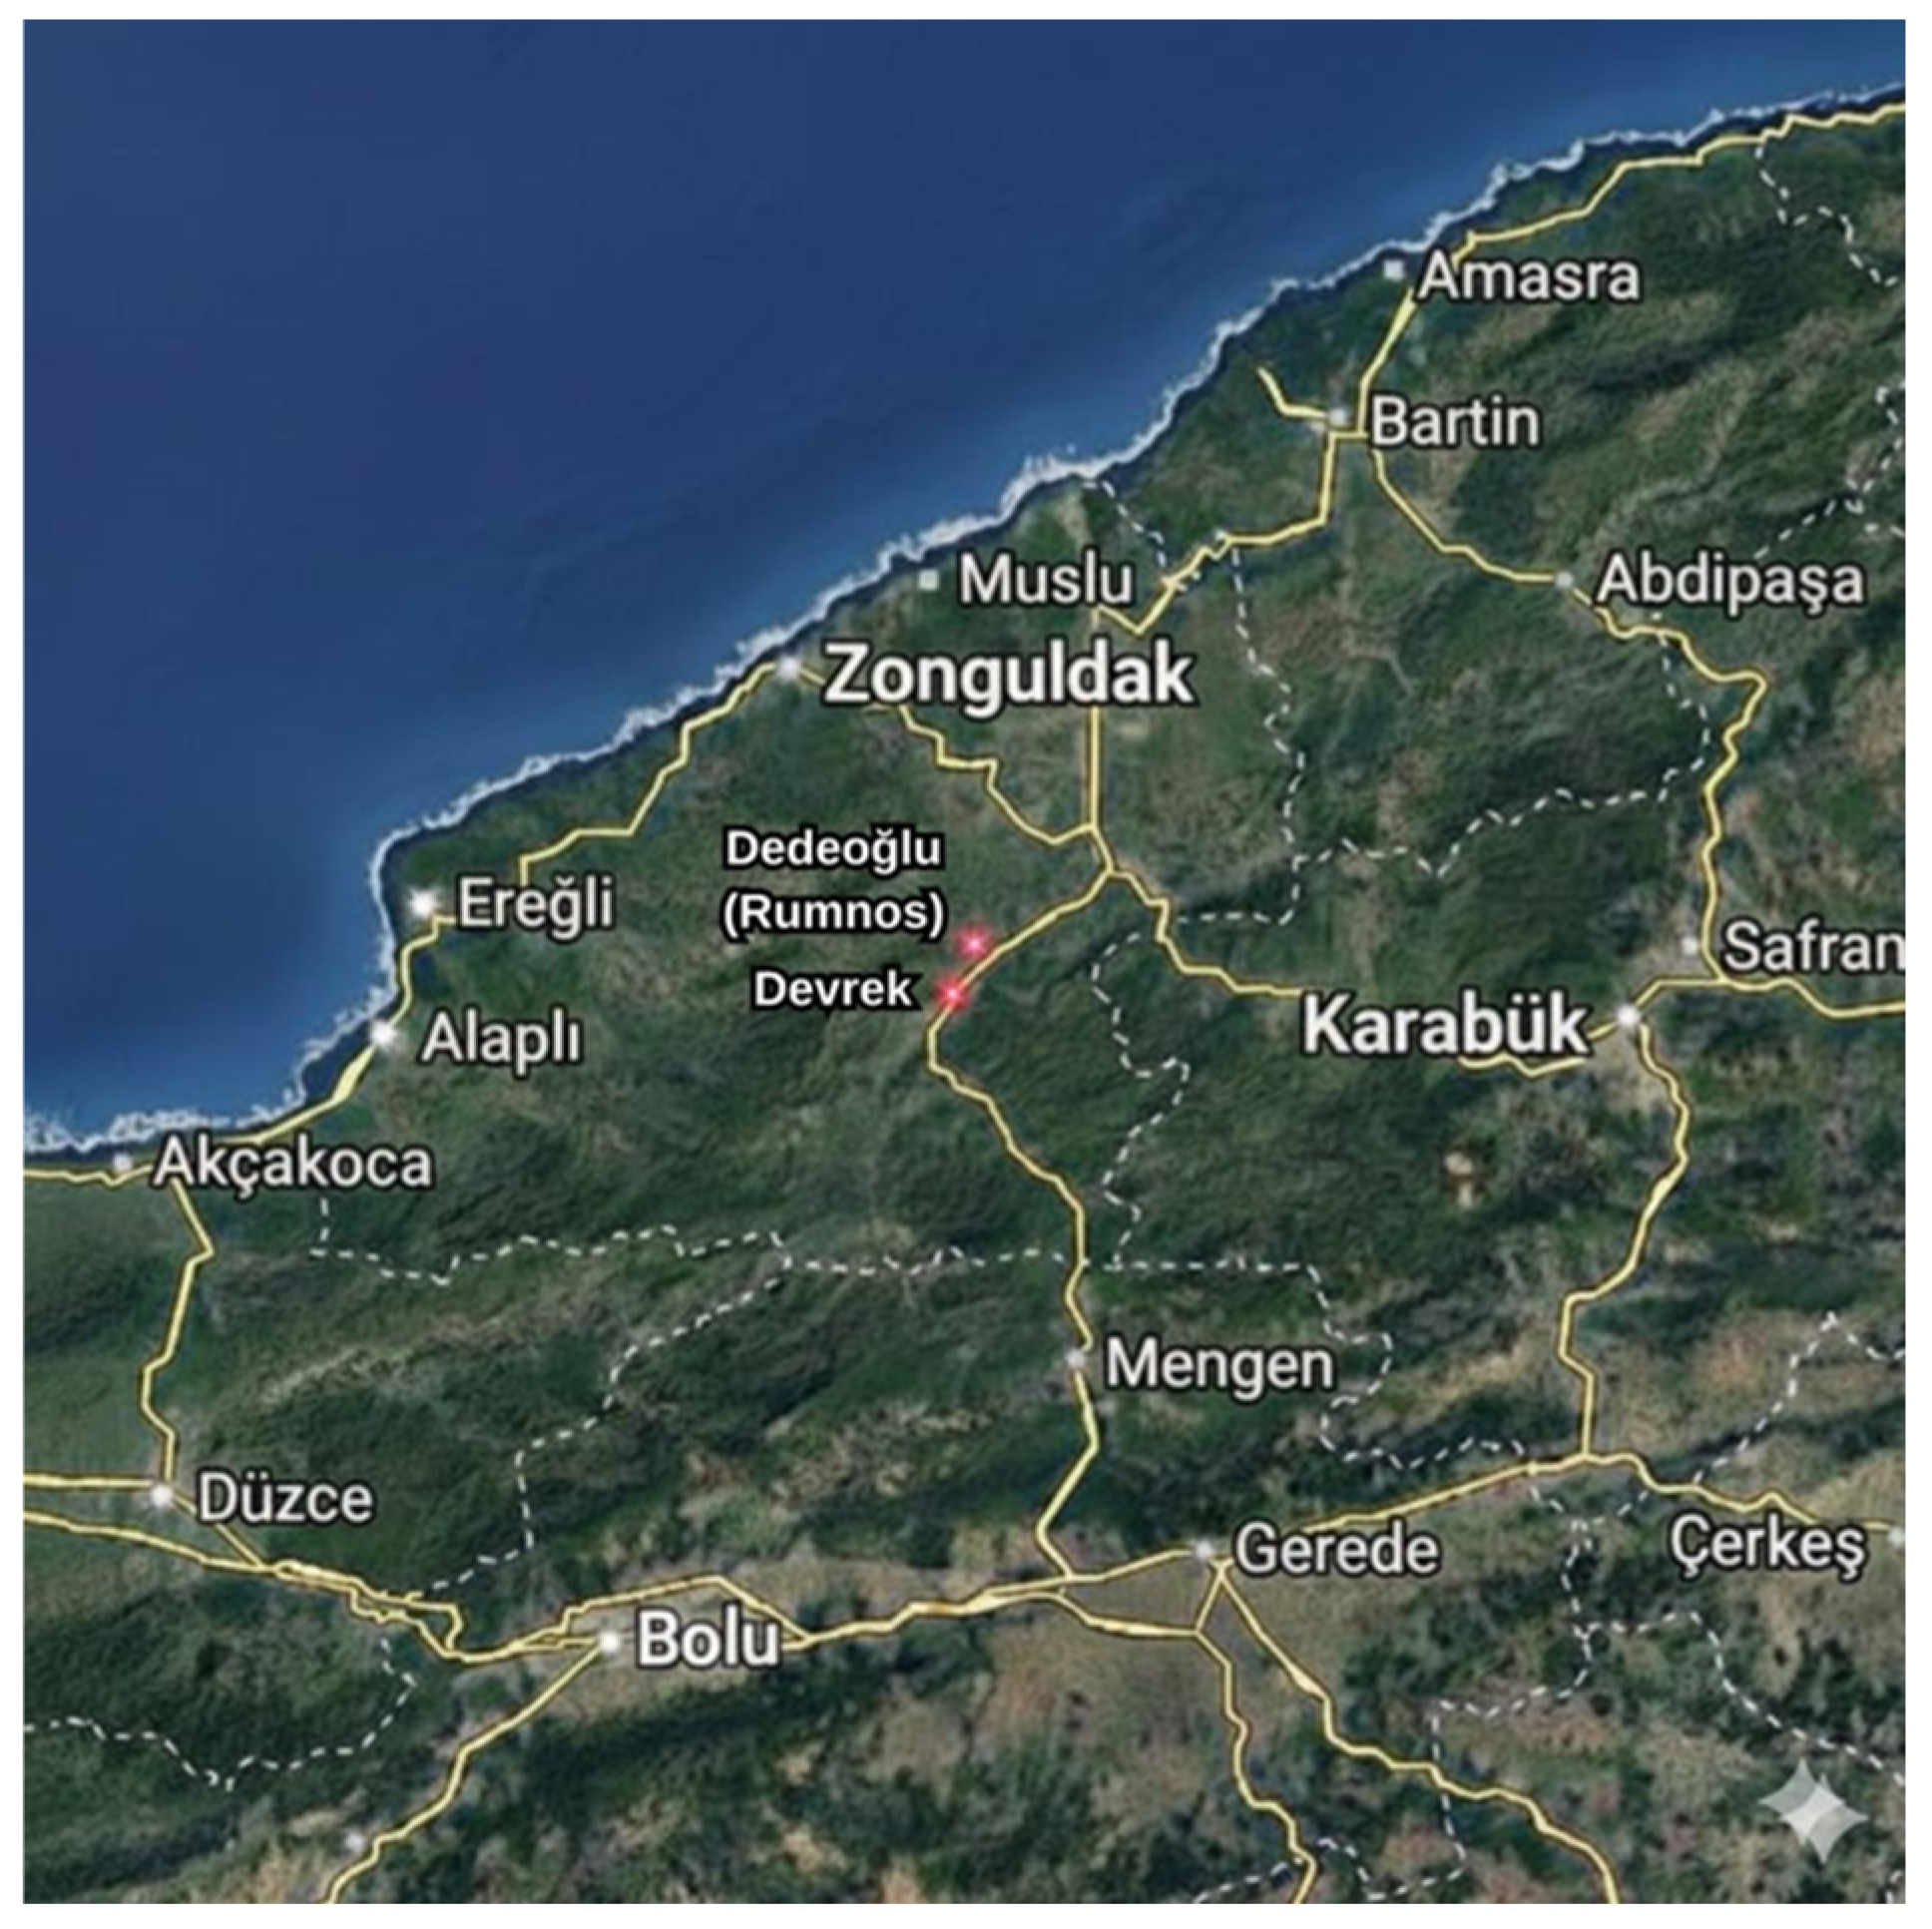
The volume of the Temettuat Registers pertaining to the village of Rumnos was the source of the data analyzed for this study. The present-day name of the village is Dedeoğlu, and it is located in the district of Devrek in Zonguldak Province, in the northwestern part of the Anatolian Peninsula in Turkey (Figure 1). At the time under examination, the administrative unit to which the village belonged was the district of Devrek. In the 1840s, the district of Devrek was administratively affiliated with the Province of Bolu within the Ottoman Empire.
Figure 1.
Location of the village of Rumnos, https://maps.app.goo.gl/prviio2EHdC2r3Xs6. Base map source: Google Maps (accessed on 15 June 2026).
The village of Rumnos takes its name from the Byzantine Emperor Romanos IV Diogenes, who established a military camp in the region with his soldiers in 1071 to fight the Turks (Birgören 2008). The village is located in close proximity to the district center of Devrek. For this reason, in order to provide information about the historical background of the village, it is appropriate to consider the history of the Devrek district center.
Settlement in the Devrek region began during the Chalcolithic Age, around 5500 BCE. The earliest known political power in this inhabited area was the Phrygians. Subsequently, the region came under the control of the Lydians, the Persians, and the Empire of Alexander the Great (Karauğuz 2013).
Following the dissolution of Alexander’s empire, the Devrek region became part of the Seleucid Empire. With the collapse of Seleucid authority in the region, the Kingdom of Bithynia emerged in the lands west of the Bartin River, and Devrek subsequently became part of this newly formed kingdom. By 280 BCE, the Kingdom of Pontus had established its dominance over the Black Sea coastal regions of Anatolia (Devrek Kültür Derneği 1970). In subsequent historical periods, intense conflicts between the Roman Empire and the Kingdom of Pontus took place in this region. The region encompassing Devrek was annexed by the Roman Empire in 74 BCE. In 64 BCE, following an administrative reform, the region was officially incorporated into the Roman provincial system under the name Bithynia et Pontus (Konukçu 1993).
After the Roman Empire was divided in 395 CE, the entirety of Anatolia came under the sovereignty of the Byzantine Empire. The Devrek region remained under the rule of the Byzantine Empire for an extended period, until the 11th century. However, the region was occasionally subjected to external interventions and invasions. In 711, Arab forces advanced as far as Devrek and its surrounding areas. Arab forces launched renewed incursions into the Devrek region in the years 798–799 and again in 900. On each occasion, following the conclusion of peace agreements between the Islamic State and the Byzantines, the Muslim forces withdrew from the region (Çelikdönmez 2000).
As a result of the Battle of Manzikert in 1071, the Western Black Sea region, including Devrek, was captured in 1084 by Emir Karatekin, one of the commanders of the Seljuks Empire2, who subsequently established a beylik3 in the area (Öztuna 1983). From that date until 1197, the region became a battleground and frequently changed hands. In 1086, Devrek once again came under Byzantine control. Following the Crusade of 1204, the Genoese became influential along the Western Black Sea coasts and in Devrek. In 1197, the region was reconquered by the Turks for the second time, and a lasting Turkish sovereignty was established.
Devrek and its surroundings came under Ottoman rule in 1392. Although Ottoman control over the region was lost following the Battle of Ankara in 1402, it was definitively incorporated into the Ottoman Empire during Sultan Mehmed II’s Western Black Sea campaign in 1461 (Çelikdönmez 2000). In records dating to the reign of Sultan Selim I (1512–1520), the region that included Devrek was referred to as Hızırbey Province. The administrative importance of Devrek increased, and it became the seat of a kadılık (Islamic judicial district) (Sakaoğlu 1973).
Devrek’s location along a commercial route made it a frequent stop for caravans engaged in trade throughout the Western Black Sea region and a period of revitalization was experienced beginning in the 18th century. Moreover, during this period, handicrafts flourished, and the production of forestry, furniture, and walking sticks increased significantly.
3. The Temettuat Registers: The Primary Data Source
The Ottoman Empire, in which the village of Rumnos is located, has its own unique economic characteristics. It has a pre-industrial economic structure but was never a primitive economy. It did not exhibit the feudal or similar economic structures that existed in medieval Europe. The production was not exchanged for barter, peasants did not work for state estates, and an exchange economy existed. State authority avoided interfering in the economy (Genç 2000).
Although the Ottoman Empire was an unindustrialized country where the majority of investment was made in the agriculture sector, its integration into the system established by the capitalist states “with its peripheralized character” is an indicator of the fact that it had capitalist properties. The Ottoman Empire contacted the capitalist global economy of Europe. Although there were wars between the two parties, economic relations consistently developed. In this process Europe and the world economy took the Ottoman Empire in its scope. At this point, the Ottoman Empire was no longer a world empire, but a state in the boundaries of the capitalist world economy. Production in the Ottoman Empire was “peripheralized” (Wallerstein 1979).
With the industrial revolution in the European states, the Ottoman Empire that did not have a closed economic structure at all experienced a process whereby its opening to and trading with the world increased even more. Until the late 18th century, France was the Ottoman Empire’s primary European trading partner. However, trade with France which previously constituted approximately 60 percent of total Ottoman foreign trade declined due to the French Revolution of 1789, the attempt to invade Egypt, and the Napoleonic Wars. In this process, the United Kingdom emerged as the preeminent trading partner, ascending to the first rank and permanently maintaining this dominance. In 1838, the Ottoman Empire and the United Kingdom signed a treaty that expanded the already existing free trade concessions. Subsequently, the Ottoman Empire proceeded to sign similar agreements with other European powers. As a consequence of this process, the foreign trade structure of the Ottoman Empire transformed into “one of the most liberal trade regimes in the world” (Issawi 1982).
Until the mid-19th century the European eyalets of the Ottoman Empire had dominance in foreign trade. Anatolian and the Arabian eyalets followed. After this period, losses of land and wars led to their decline and Anatolian eyalets occupied the first rank. In the process in tax records examined in this study, exports by Anatolian eyalets increased by 3.5 times from the 1840s to 1870s while imports increased by 4.3 times (Quataert 2000).
It had a constant direct connection with European eyalets. Europeans that enjoyed special privileges until the beginning of the 19th century mostly employed non-Muslim Ottoman subjects who were culturally proximate to help in their busy trade relations. However, after this date non-Muslim Ottoman subjects came forward in the Ottoman foreign trade sector, becoming the most important commercial intermediary. Such people that constituted a local capitalist group were dominant in various towns and ports of the Ottoman Empire as well as establishing businesses in European towns (Issawi 1980).
One reflection of participation of the Ottoman Empire in the capitalist world economy was state interventions being as few as possible. The Ottoman economy was not closed in money markets just like it was in trade. The state avoided intervening in the market. The reason for this was connected to preferences of the state administrators in addition to their means. The Ottoman Empire that was spread over a broad geography was divided into many units with unclear boundaries in the money market (Barkan 1975).
The Ottoman Empire did not have financial or economic power to ensure sovereignty of its single currency. Local currencies in newly conquered territories were not demonetized, but they were used alongside the Ottoman gold sultani and silver akçe. In the Balkans that enjoyed a high volume of trade with Europe, the circulation of European coinage persisted. The Spanish real emerged as the primary currency and unit of account in Tunis from the 17th century onward. Persian currency was utilized in the eastern provinces, and pre-conquest currencies continued to circulate in Egypt and the Crimea (Pamuk 1995).
Even during the mid-15th century, when the most stringent interventions took place, foreign currencies were freely integrated into the Ottoman monetary market. Throughout the 16th and 17th centuries, vast quantities of precious metals arriving in Europe from the Americas were minted and subsequently generated a monetary flow eastward that encompassed the Ottoman Empire. Additionally, following the closure of domestic within the Ottoman Empire from the 1640s onward, foreign currencies came to dominate the internal market. In this process, the economy of the Ottoman Empire became more deeply integrated with the European economy. The expanding volume of European precious metals and money accelerated the incorporation of towns into the European capitalist economy. Concurrently, the monetization of the economy proliferated, consolidating the linkages between urban and rural settlements. Rural centers were systematically drawn into the monetary economy, becoming structural components of the market in both production and consumption (Pamuk 1995).
In the Ottoman Empire, the structure of provincial economies, social hierarchy, and income distribution was closely linked to the fiscal policies implemented by the central administration. Particularly from the 18th century onward, the increase in military expenditures intensified pressure on the central treasury and made necessary the reorganization of provincial revenues (Pamuk 2008).
The iltizam (tax farming) system, under which taxes were collected through intermediaries, had become a serious problem, imposing heavy burdens on the Ottoman population. The objective of the new taxation system was to ensure the fair collection of taxes in accordance with individuals’ economic capacity through the conduct of temettuat surveys (Öztürk 1996).
Fiscal centralization was pursued, and it was intended that taxes be collected locally, in full, and at specified times of the year. Taxes were collected through officials sent directly from the central government, in cooperation with local tax councils established to work alongside them (Cezar 1986). Following the proclamation of the Tanzimat Edict, the practice of tax farming (iltizam), whereby taxes were collected by private intermediaries, was abolished. During the same period, the timar system was also eliminated, and taxation became fully centralized and incorporated into the state budget (Tabakoğlu 2016).
Before the Tanzimat period, the collection of taxes levied under Islamic law at various rates was brought to an end. Taxation was thereafter limited to the tithe (öşür), levied at a rate of one-tenth on agricultural products; the adet-i ağnam, collected per head of sheep; and the cizye, imposed on adult non-Muslim males in lieu of military service. Likewise, until 1840, the numerous types of customary (örfi) taxes, which had been collected through various methods, were consolidated into a single tax under the name vergi-i mahsusa (profit tax). This tax was a direct income tax levied on individuals, previously implemented in many other countries before Ottoman Empire. It was applied for the first time in the Ottoman Empire in the 1840s (Güran 1988).
In addition, the various treasuries operating under different names were abolished and consolidated. Thus, the single treasury and single budget system was reinstated which had been abandoned in 1793 (Cezar 1986). In the regions where the Tanzimat reforms were implemented, the iltizam system was abolished in 1840, as promised in the Edict. With the establishment of the newly formed Muhassıllık4 Administration in the 1840s, state revenues began to be collected by salaried tax collectors appointed and dispatched from the central government (Şener 1990).
The Temettuat Registers, recorded in the 1840s in the Ottoman Empire, contain rich and detailed information on the socio-economic conditions of that period. These registers occupy a significant place within the holdings of the Ottoman Archives. The term temettuat is the plural form of the Arabic word temettü, which means profit or gain. It derives from the Arabic word matāʿ, which corresponds to the modern Turkish word meta, meaning commercial goods or merchandise. After the Tanzimat Edict5 (1839) the new taxation system was introduced, and the Temettuat Registers consist of wealth survey records compiled for the new taxation system (Kütükoğlu 1995).
The Tanzimat Reform period was reflected in fiscal matters with efforts to centralize revenue collection processes and to establish a fairer taxation system (Shaw and Shaw 1977). For this reason, it became necessary to determine the payment capacity of taxpayers, and the primary step in this process was to identify their assets and incomes. Before the Tanzimat Edict (1839) taxes were collected indirectly through intermediaries. During this period, attempts were made to simplify the tax system and abolish privileges, with the objective of collecting taxes directly and in an orderly manner.
During this process, the state standardized its record-keeping systems to enhance its fiscal oversight capacity; tax assessments thus evolved beyond being merely instruments of revenue collection and became documents that produced information about the social and economic structure (Genç 2000). These records—particularly the cizye, temettuat, and other tax registers—constitute primary sources for understanding the economic fabric of the Ottoman provinces, because they contain indicators related to production, wealth, property, and social status (Inalcik 1994).
In the registers, individuals serving in state-related positions were recorded, as were those who had gone to military service, individuals who were disabled or incapacitated, and orphans and fatherless children within the settlements. Place names also provide information regarding agricultural activities or the geographical characteristics of the settlement. In this respect, the Temettuat Registers constitute important sources not only for economic history but also for geographical features, human geography, and social history (Akgündüz and Öztürk 2000).
The records are significant not only for understanding the income structure of the provincial economy but also for comprehending how the post-Tanzimat fiscal system functioned at the provincial level. The organization of the register reflects the bureaucratic reforms of the period by featuring a standardized column structure. The names of taxpayers, their settlements, social classifications, and the amounts of taxes assessed were recorded in a systematic manner. This structure demonstrates the increasing capacity of the Ottoman fiscal administration in the mid-19th century to collect data and exercise oversight in the provinces (Findley 1980).
Most of the registers were recorded in the name of a single administrative unit and were submitted by appointed officials from the various provinces under the designation of a specific neighborhood or village. The first Temettuat Register records were kept in a small number of settlements in 1840–41. The register examined in this study belonged to the second records conducted in 1844–45. These records differ significantly from earlier fiscal surveys. The first records were kept only by officials appointed from the central government. In contrast, the second records were carried out under the oversight of Agricultural Directors6 and their deputies, with data collection entrusted to local authorities.
The second survey also differs from the first in terms of both form and content. While the 1840–41 register included the estimated value of cultivated lands, the 1844–45 register documented the annual income by assets. In the first register document, a value column was used, whereas in the second register the phrase annual income was used (Güran 2000).
In the register dated 1840–41, the physical descriptions of the heads of household were included. The most significant feature that distinguishes the next survey dated 1844–45 from the previous one is that it provides both the actual income for the year 1844–45 and the estimated income for 1845–46 derived from the individual’s movable and immovable assets. In the previous survey, only the values of the movable and immovable assets owned were recorded (Öztürk 2003).
In addition, the covers of the registers contain information about the respective settlements and their local administrators. On the inner pages, the registered households of taxpayers are listed in a consecutive manner. Each household’s head was, by default, considered a taxpayer; however, there were also households in which multiple individuals were registered as taxpayers. The additional taxpayers were typically adult male members of the household, whose personal information and occupations were also recorded. There are also instances in which women were recorded as the head of household.
Following the house number, the name of the head of household, the father’s name and occupation and family lineage were recorded. The registers indicate whether the land was cultivated, planted with perennial crops, or left fallow.
In general, Temettuat Registers provide detailed information on a region’s demographic and ethnic composition, individuals’ movable and immovable assets, annual income, the size of enterprises, total and itemized tax burdens, labor force, occupations, types of agricultural products and livestock raised, as well as commercial and industrial establishments.
The Temettuat Registers are classified in the Ottoman Archives of the Presidency of State Archives under the Ministry of Finance catalog. A total of 17,747 files were compiled between 1840 and 1846. The registers were not compiled across the entire empire; rather, they were implemented in the Balkan and Anatolian provinces.
4. The Social Structure of the Village of Rumnos
The Temettuat Registers were not originally intended for the purpose of determining population figures. However, the recording of households leads to the production of information regarding the individuals residing within them. Household characteristics were examined, and sociological and economic assessments were conducted. Population estimates were made based on the number of houses in this paper.
4.1. Household Structure and Estimated Population
There were 20 households recorded in Temettuat Register number 3378. In 12 out of the 20 recorded households, only one adult male was recorded, and in each case, he was listed as the head of household. However, eight households contained more than one adult male, and in three of these households, more than one male was recorded as having an income. In household number 2, the head of the household’s son was listed. However, no occupation or income was specified for him. In household number 6, the head of household’s son was recorded. But no income was specified for the household’s son; instead, it was stated that he was serving in the military.
In the village of Rumnos, in household number 12, the head of household’s son was identified as a farmer, and his income of 300 kuruş7 from zuhurattan (a nonagricultural occupation) was included in the total household calculation. In household number 13, no occupation or income was recorded for the head of household’s son. In household number 14, the head of the household’s son was noted as being in military service in Istanbul; no other occupation or income was recorded for him. In household number 15, the head of household’s brother was recorded as having an annual income of 300 kuruş from work as a rençber (farmer).
In household number 16, the head of the household’s son, whose occupation was listed as “agriculturalist”, had no nonagricultural income. In household number 18, the head of household’s brother was identified as a farmer with a nnonagriculturalincome of 250 kuruş, which was included in the household’s total income. In household number 19, the head of household’s elder brother was listed; however, no income was recorded for him. Instead, it was explained that he had been living outside of the village for the previous 30 years.
According to the register of the village of Rumnos, the entire population consisted of Muslims. In various regions of Anatolia and near the village of Rumnos, people of different religions lived together, but no Christians or Jews resided in the village of Rumnos.
To draw inferences regarding the total population, it was necessary to consider not only the number of households but also the structure of the Ottoman society. The Ottoman family structure was characterized by a relatively small number of children, with most households typically having one, two, or three children. This pattern showed little variation regardless of whether the family lived in a rural or urban area, or whether they were Muslim or non-Muslim. The estimated total population can therefore be calculated by multiplying the total number of houses by the probable number of individuals residing in each Ottoman houses (Tabakoğlu 2008).
One of the most important Turkish economic historians, Ömer Lütfi Barkan—who examined the 16th century Tahrir Registers8 which were state records compiled for revenue assessment—suggested that the actual population could be estimated by multiplying the number of households by five (Barkan 1953). He believed this was the most appropriate coefficient for the Ottoman family structure. Many historians who have studied Ottoman demographic structure have accepted this coefficient and conducted their estimations accordingly (Çakır 2003). Therefore, taking into consideration the historical and social structure of the Ottoman Empire, and assuming that five individuals resided in 20 households in the village of Rumnos, it can be estimated that approximately 100 people most likely lived in Rumnos.
4.2. Occupations of Heads of Household and Occupational Diversity in Rumnos
From its foundation to its dissolution, the economic structure of the Ottoman Empire was agrarian in all respects. Although European countries were experiencing the transformative effects of the Industrial Revolution when the Temettuat Registers were compiled, the Ottoman Empire was unable to undergo a comparable transformation. The data pertaining to the small settlement of Rumnos likewise reflect the general structure of the Ottoman economy.
As Table 1 demonstrates, the occupations of 13 heads of household were recorded as belonging to agricultural activities.9 In addition, the occupations of four of the heads of household were specifically recorded as “farmer”. Apart from these, the head of household number 9 was described as elderly and infirm for work, and no occupation was recorded for him. Two of the household heads were noted as being in military service. The head of household number 18 was a tımarlı sipahi (Timariot cavalryman), who earned rental income from land that was allocated to him. The head of household number 19 was listed as a soldier and noted as mefkût—a missing person whose whereabouts or status were unknown—possibly following the Battle of Nizip.10
Table 1.
Occupations and incomes of the households.
When these data are taken into consideration, it can be observed that the occupations of 17 heads of household—which constituted the majority of the village—were directly related to agricultural activities. An examination of all occupational categories indicates a lack of diversity in terms of occupation. Therefore, the social and economic characteristics of the village population suggest the existence of an entirely agriculture-dependent population.
Of the 20 households in Rumnos, three were recorded as having more than one income earner. Nine of the 20 households were recorded as having more than one adult male. The records indicate that the household heads had six sons and three brothers. Of these nine individuals, two had no occupation, two were soldiers, one was an agricultural worker, and one lived outside the village. Only one had the same occupation as the household head; both were agricultural workers. The remaining three were farmers, and they alone earned an income. Their respective incomes were 300, 300, and 250 kuruş, totalling 850 kuruş, which accounted for 2.7 per cent of the village’s total income. Their incomes were low, and their contribution to household income was insignificant.
5. The Economic Structure of the Village of Rumnos
5.1. Annual Incomes of the Village and Households
The total recorded income of Rumnos for the year 1844–45 amounted to 30,625 kuruş. As Table 2 demonstrates, the household with the highest total income was household number 12, with 3806 kuruş. It was followed by household number 11, with 3552 kuruş, and household number 18, with 2764 kuruş. Household number 19 had no recorded income for military service for the year 1844–45. The second-lowest income was recorded by household number 9 with 380 kuruş, while household number 6 earned 807 kuruş, making it the third-lowest in total income.
Table 2.
Annual household incomes (1844–45).
Out of the village’s total income, 21,693 kuruş, which constituted approximately 70% of the village’s total income, came directly from agricultural production. The household with the highest agricultural income was household number 12, which earned 81% of its total income from agriculture. Household number 11, with 3002 kuruş in agricultural earnings, derived 84% of its total income from farming, ranking second. Household number 18 ranked third, generated 2514 kuruş—90% of its total income—from agriculture. The only household with no agricultural income is household number 19, because he did not cultivate his land. The second-lowest agricultural income was recorded by household number 9, which earned 280 kuruş from agriculture, thereby amounting to 73% of its total annual income. The third-lowest agricultural income is 507 kuruş. It was observed in household number 6 and number 7. Household number 6 earned 507 kuruş from agriculture and derived 62% of its total income from it. Also, household number 7 earned 507 kuruş from agriculture and derived 55% of its total income from it.
The third-lowest agricultural incomes were observed in household number 6 and number 7, which earned 507 kuruş from agriculture. Household number 6 earned 507 kuruş from agriculture and derived 62% of its total income from it. Household number 7 earned 507 kuruş from agriculture and derived 55% of its total income from it.
In the records, nonagricultural incomes were designated as zuhurattan11. As Table 2 demonstrates, this category of annual income amounted to 8932 kuruş, which corresponded to 29% of the village’s total income for 1844–45. The highest nonagricultural income belonged to household number 12 and constituted 18% of its total income. The head of this household earned 415 kuruş and the head of household’s son earned 300 kuruş, which amounted to a total of 715 kuruş from nonagricultural activities. The household with the second highest nonagricultural income was household number 11, which earned 550 kuruş—or 15—of its total income from nonagricultural activities.
A considerable number of households also earned 500 kuruş or more each from nonagricultural activities. Household number 19 did not have income and had no income from nonagricultural activities. The second-lowest nonagricultural income belonged to household number 9 and amounted to 100 kuruş, which constituted 26% of its total income. Households number 18 and number 20 earned 250 kuruş from nonagricultural activities. Household number 18’s agricultural earnings constituted 9% of its total income and number 20’s earnings corresponded to 28% of its total income.
The zuhurattan income referred to revenue not derived from cultivated land and indicated engagement in nonagricultural occupations. This distinction is also significant for assessing the extent to which a household was dependent on land ownership and agricultural production. These distinctions indicate that either the heads of household or the other income-earning adult males within the households did not have permanent nonagricultural occupations but they could earn income from nonagricultural activities. However, despite all this evaluated individually at the household level or collectively at the village level, the majority of the total income was derived from agricultural activities.
5.2. Household Income Distribution
One of the primary aims of this study is to determine income inequality in the village of Rumnos. For this reason, income distribution calculations were performed.
As Table 3 demonstrates, an analysis of the village’s income distribution revealed that two households—representing 10% of all households—fell within the lowest income bracket by earning less than 500 kuruş. These households accounted for only 1.24% of the total village income, with an average income of 190 kuruş. Six households—30% of the total number of households in the village—fell within the 500–1500 kuruş income bracket. The households in this income bracket earned a total of 9083 kuruş (and average of 907 kuruş per household) which corresponded to 17.77% of the village’s total income.
Table 3.
Household income distribution of the village of Rumnos.
Another six households with average household incomes of 1839 kuruş fell within the 1500–2500 kuruş income bracket, the total income of which was 11,038 kuruş, representing 36.04% of the village’s overall income. One household constituted the 2500–3500 kuruş income bracket and represented 5% of the total number of households in the village. The total income in this bracket was 2764 kuruş, which constituted 9.02% of the village’s overall income. In the highest income bracket—above 3500 kuruş—were two households that represented 10% of the total number of households in the village. The total income in this bracket amounted to 7358 kuruş, thereby representing 24.02% of the village’s overall income. The average income of the households in this bracket was 3679 kuruş. Taking the total income of the village into consideration, the overall average household income was calculated as 1531 kuruş.
5.3. Land Use and Agricultural Income
An examination of the annual income derived from agricultural land indicated that in 1844–45 the village’s total agricultural income amounted to 18,181.5 kuruş. Within this total, the highest income (2766 kuruş) belonged to household number 12. For the year 1845–46, projected estimates were made by officials after examining revenues from previous years. It was anticipated that the highest income would again belong to household number 12, amounting to 3226 kuruş, while the lowest projected income (5 kuruş) was expected for household number 19 (Table 4).12
Table 4.
Cultivated and uncultivated fields and their revenues in the village.
An examination of the cultivated lands indicated that, with the exception of household number 1 and 2, all households cultivated half of their total landholdings in the year 1844–45, leaving the other half fallow. In the following year, the remaining lands were cultivated, and no land was left fallow.
In the Ottoman Empire, agricultural lands were cultivated according to the Timar System. According to the Timar System agricultural lands and holdings were classified into three categories according to their size, regardless of whether they were privately owned. Holdings with an area of less than 10 decares were classified as small-scale; those between 10 and 50 decares as medium-scale; and those of 50 decares or more as large-scale enterprises (Güran 1998).
As Table 5 demonstrates, the total amount of cultivated land in Rumnos amounts to 418 decares and the average landholding per household was 20.9 decares. Based on land size classifications detailed in Table 5, two households were identified as large-scale farms, and together they held 30.6% of the total arable land. Household number 11 possessed the largest amount of land with 70 decares. The average size of the landholding of the households in this category was 64 decares. Thirteen households in Rumnos fell into the medium-scale landholding category. Holdings within the medium-scale category accounted for 63.1% of the total land, with an average of 20.3 decares per household.
Table 5.
Types of agricultural holdings.
In addition, five households were classified as small-scale farms. The total land within the small-scale category amounted to 26 decares, with an average of 5.2 decares per household. The household with the smallest landholding was number 19, which owned four decares. A review of the village as a whole indicated that there were no landless households. The majority of households possessed landholdings that placed them within the medium-scale farm category.
In the Temettuat Registers, the actual income figures for the year 1844–45 were recorded, whereas the figures for 1845–46 were projected estimates. When the income data from both years were compared, it was observed that in the majority of households, the estimated income for 1845–46 exceeded that of the previous year. As Table 6 demonstrates, in 1845–46, the cultivated land increased from 189 decares to 196 decares, representing an increase of seven decares, or 3%. However, the estimated income rose more significantly, from 18,181 kuruş to 20,932.5 kuruş, reflecting an approximate 15% increase. At the household level, it was estimated that five households would experience a decrease in annual agricultural income. The most substantial decline was observed in household number 11, with a reduction of 477 kuruş. Conversely, the largest increase occurred in household number 2, for which estimated annual income rose by 285%, increasing from 441 kuruş to 1261 kuruş compared to the previous year. The reason for the massive increase in revenue is this: House number 2 owned 31 decares in 1844–45 but 22 decares in 1845–46. The nine decares that had not been cultivated the previous year were sold, and the proceeds were added to the following year’s earnings.
Table 6.
Differences in agricultural land incomes by years.
6. Taxes
In the Ottoman Empire, there were two principal types of taxation. The first consisted of Islamic (religious) taxes, which all Islamic states were authorized to collect under Islamic law (Sharia). These taxes were levied strictly in accordance with religious rules. The tithe (öşür or aşar) on agricultural products, the livestock tax (resm-i ağnam), and the market taxes (bac) collected from the urban population engaged in commercial activities are examples of such taxes (Tabakoğlu 2016).
On the other hand, there were örfi (customary) taxes, which emerged over time to enable the state to fulfill its executive functions and were collected from the population in extraordinary circumstances. In the early period of the Ottoman Empire, such taxes were largely imposed during wartimes; over time, however, they became routine and customary, being collected even in peacetime. From the late century onward, during the reform period, the centralization of the state necessitated a large army and an expanded class of officials and bureaucrats. The expenses associated with these developments led to the introduction of new taxes and a new taxation system alongside the existing ones (Tabakoğlu 2016).
The vergi-i mahsusa (profit tax) was introduced by the Ministry of Finance as a single tax replacing numerous örfi taxes following the proclamation of the Tanzimat Edict in 1839. Implemented from 1840–41 onward, it functioned as a form of income tax that was levied—except for certain exemptions—on individuals without regard to privilege in proportion to their economic status.
The amount of this tax was determined by the Ministry of Finance at the provincial level. The levied sum for each province was then distributed among the districts and subsequently apportioned among neighborhoods and villages. The district governor and members of the local tax council determined the amount to be levied on towns and villages in a meeting attended by figures such as the imam, priest, and headman, depending on the ethnic and religious composition of the population. Ultimately, at the village and neighborhood level, the assessed amount was apportioned among individuals according to their capacity to pay (Öztürk 1996).
The öşür, which was an important tax in rural areas, consisted of levies imposed on agricultural produce. It was applied at rates varying from one-fifth to one-tenth (öşür), depending on the characteristics and location of the settlement. These taxes were levied on the produce of grains and legumes, but payments for fibrous products, vegetables and fruits, as well as livestock and customs duties, could also be made in cash. Since agriculture constituted the most important sector of the Ottoman Empire, the öşür remained one of the principal sources of state revenue under the new fiscal arrangements, as it had been prior to the Tanzimat period.
In the village of Rumnos, the apportioned tax was levied on 19 heads of household for the year 1844–45. The total amount of vergi-i mahsusa (profit tax) collected was 4.614 kuruş. Each household paid an average of 242 kuruş in this tax. Additionally, the öşür tax was collected from 19 households. A total of 2329.5 kuruş in öşür tax was collected. Each household paid an average of 122 kuruş in öşür tax. In total, 6943 kuruş of all taxes were collected from 19 households. Each household paid an average of 365 kuruş in taxes in total (Table 7).
Table 7.
Types and amounts of taxes.
7. Income Distribution Analysis
Income distribution in a unit of settlement or country is how the resulting income is shared among households. Although there are several factors and concepts that demonstrate living quality or quantity, data in this study is taxes and income of households in tax records. It is possible to present income distribution of households in this study. Household income distribution, which is also known as individual income distribution, is based on the amount of income, rather than the type of means of income (Çalışkan 2010). Examined from this perspective, occurrence of the industrial revolution or the existence of an economic structure with capitalist properties are not requirements to investigate income distribution.
Low-income inequality is not the only data in determining quality of life among individuals or households. Additionally, despite being a modern economic measurement process or conducting an income-oriented analysis, it does not evaluate monetary income and consumption expenditure exclusively. While the Gini coefficient is used in economics to measure income distribution and poverty, it also collected attention across various other disciplines. For instance, Cullis and van Koppen analyzed water consumption in South Africa’s Olifants Water Management Area using the Gini coefficient and the Lorenz curve. Their findings revealed that 95 percent of the available water was consumed by a mere 0.6 percent of the rural population, leaving the remaining 99 percent of the population to share just 5 percent of the water resource (Cullis and van Koppen 2007).
Income distribution is an economic indicator that determines the proportions in which total income is shared among individuals or households. This concept reflects development processes in terms of both economic efficiency and social justice (Todaro and Smith 2015). It is a social structure in which everyone, regardless of their affiliation, can participate fully and equally, is physically and psychologically safe, has their personality recognized and respected, and where resources are distributed fairly and are sustainable (Adams et al. 2007).
Many economists, thinkers, and scholars have developed ideas concerning income distribution. The first intellectual movement to attempt a systematic synthesis on the subject in the history of economics was the Physiocrats. The distribution and circulation of wealth among social classes were explained by Physiocratic scholars, through “tableau économique (economic table)”. This formulation prompted more radical thinkers to criticize the unequal distribution of goods between the rich and the propertyless (Rubin 1979).
Classical economists such as Adam Smith and David Ricardo viewed income distribution as a natural consequence of the market mechanism. According to them, income is generated through factors of production (labor, capital, and land), and income distribution is evaluated as the earnings of these factors (Ricardo 1951). Similarly, Karl Marx presented an explanation of income distribution, arguing that inequality stems from imbalances in the ownership structure of the means of production (Marx 1976). Neoclassical economists, on the other hand, developed an income distribution theory based on marginal productivity and market conditions. According to their approach, without state intervention, under perfect competition, each factor of production receives a return equivalent to its contribution to the final product; total output is distributed among all factors of production (labor, capital, and land) leaving no surplus (Kazgan 2004). Although the Ottoman Empire had a pre-industrial economic structure, it did not have a primitive one. The Temettuat Registers contain a wealth of data that can be examined using modern economic concepts. The number of such studies has increased in recent years.13
From the early 20th century onward, studies on income distribution increasingly relied on statistical measurements and empirical analyses. In 1955, Simon Kuznets introduced the Kuznets Curve, revealing the link between economic growth and poverty and inequality.14 He found that per capita national income increases with economic growth and development, but income inequality also increases in the initial stages of economic development. This is because, with industrialization, those who initially benefit from increased income accumulate wealth and capital, leading to even greater wealth and income inequality. He suggested that this increasing income inequality begins to decrease after a certain turning point as economic development continues, and that the course of change is in the shape of an inverted U (Kuznets 1955). This model led, for many years, to the interpretation of income inequality in developing countries as a “temporary cost” of the development process (Van Zanden 1995).
However, subsequent studies including examples from certain regions of Europe and Japan have questioned the validity of this thesis (Chor 2005). It has been observed that inequality increased in some regions without economic development, while in others experiencing growth, inequality did not increase (Alfani 2021).
Later studies have acknowledged that factors of production—labor, capital, and land—other than economic change also play a role in changes in income inequality (Ryckbosch 2016). This trend in rising inequality is explained by the dynamics of what is named the “globalization” process, including but not limited to neoliberal policies such as trade and finance liberalizations, technological change favoring skilled labor, division of labor across countries, changes in labor market institutions and transition of socialist countries to “free” market economies (Cornia 2004).
In an analysis of income distribution, static, dynamic, objective, and normative measures are employed. In static measures, income distribution ratios are presented graphically, whereas dynamic measures utilize matrix algebra. Objective measures express income distribution in arithmetic and geometric terms.
The static measures of income distribution include the income distribution frequency curve and the Lorenz curve. In the distribution frequency curve, income is plotted on the horizontal axis and the relative frequency of the population on the vertical axis, thereby providing a simple representation of income distribution. The American statistician Max Otto Lorenz developed the Lorenz curve as a diagrammatic method to represent income distribution. The Lorenz curve shows, in percentage terms, how much of a country’s total income is received by what proportion of the population (Sönmez 2001).
Various income distribution measures have been developed in connection with the static Lorenz curve. However, income concentration indicators calculated on the basis of the Lorenz curve and the distribution function are classified as dynamic measures. Among these are the Kuznets Ratio and the Gini coefficient, developed by the Italian economist and statistician Corrado Gini. The Gini coefficient expresses the level of inequality with a single numerical value, thereby enabling the comparison of different income distributions (Sönmez 2001).
As the coefficient approaches 0, inequality decreases; when it equals 0, perfect equality prevails, and total income is distributed equally among the population. As the coefficient approaches 1, inequality increases; when it equals 1, maximum inequality occurs, meaning that all income is received by a single individual (Xu 2003).
As Table 8 demonstrates, to examine the income distribution, quintile (20%) groupings, the Lorenz curve, and the Gini coefficient analyses were applied. First, households were ranked in ascending order according to their total incomes. Subsequently, the income and population distribution corresponding to each 20 percent group were calculated. For the graphical evaluation of income inequality, the Lorenz curve was constructed, and the Gini coefficient was employed as the quantitative measure of distribution.
Table 8.
Distribution of income by 20 percent quintiles.
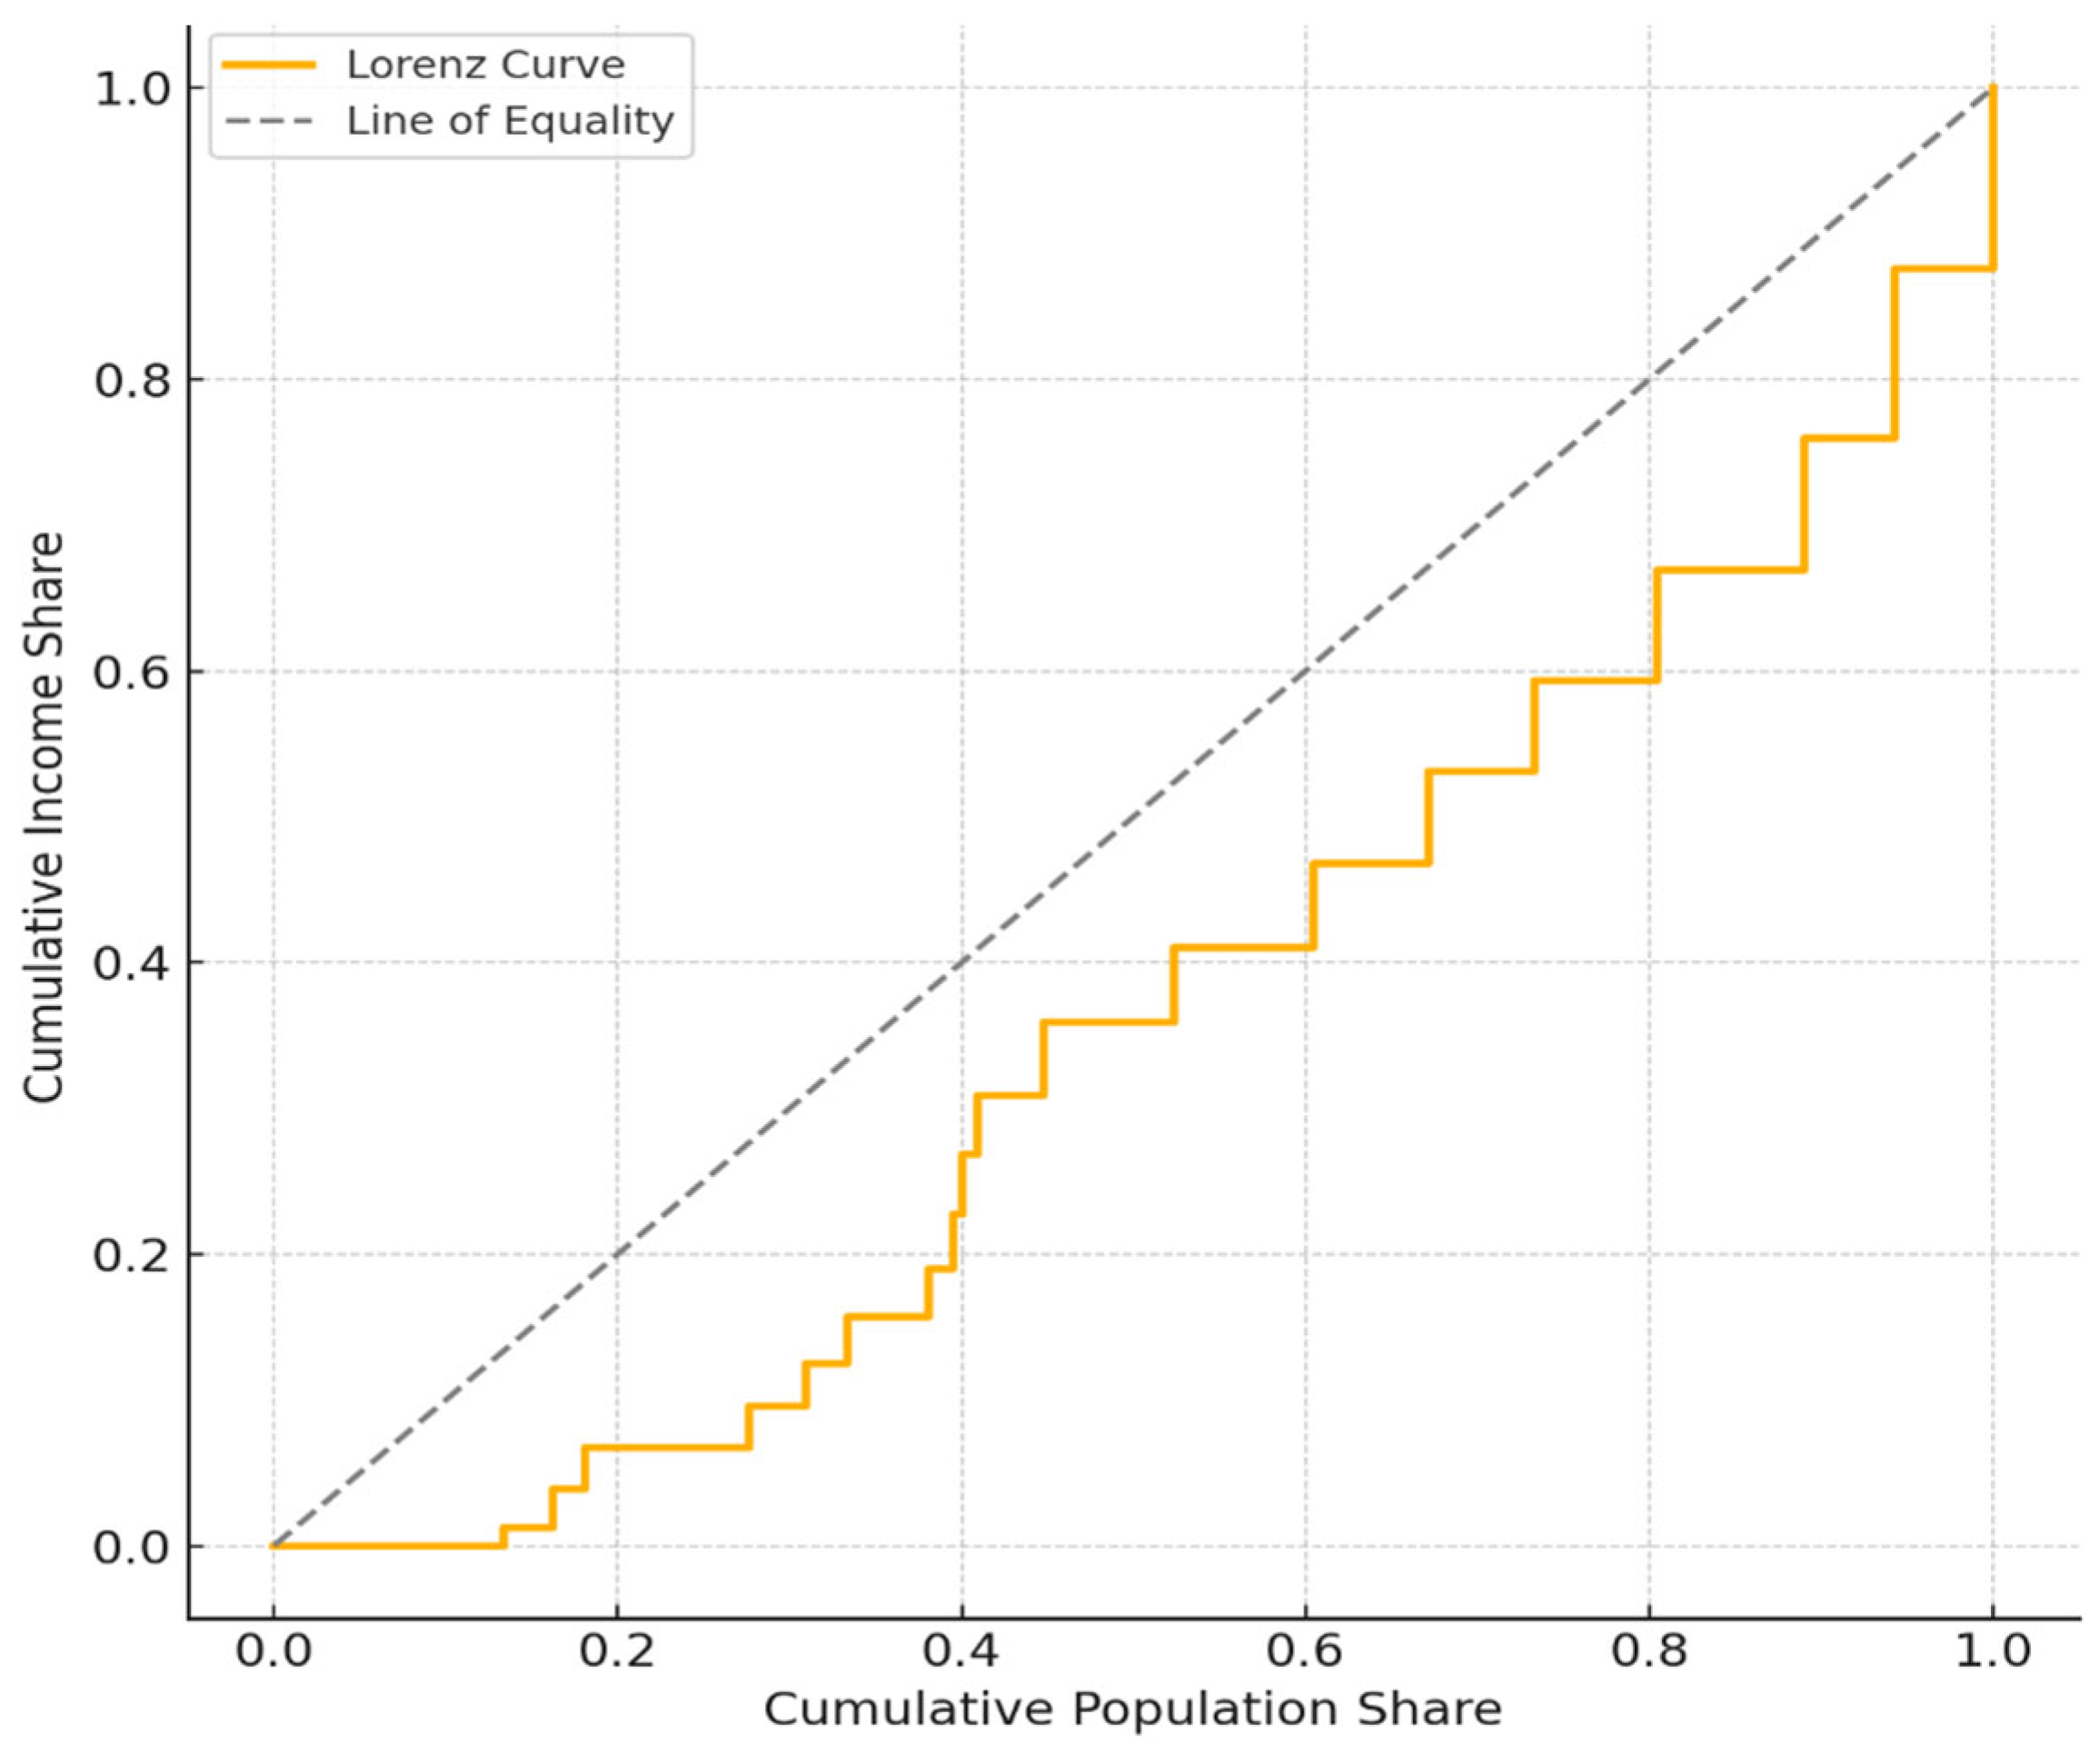
The data in the Temettuat Records shows the social issues examined in numerous nonbiased studies. As Table 9 demonstrates, a Lorenz curve was constructed, and cumulative percentage values were analyzed. The Gini coefficient is defined as the ratio of the area between the line of perfect equality and the Lorenz curve to the total area under the line of perfect equality. Based on the Lorenz curve, the Gini coefficient measures the deviation of cumulative income shares from cumulative population shares within a society.
Table 9.
Population–income table (ranked and cumulative).
On the vertical axis of the Lorenz curve, the cumulative percentages of total income are displayed, while the horizontal axis represents the cumulative percentages of the population. Since 100 percent of total income is shown on the vertical axis and 100 percent of the population on the horizontal axis, the diagram takes the shape of a square. The line connecting the origin to the opposite corner represents the line of perfect equality. At every point along this line, which expresses an absolutely equal distribution of personal incomes within a population, a given percentage of the population receives an equivalent percentage of total income.
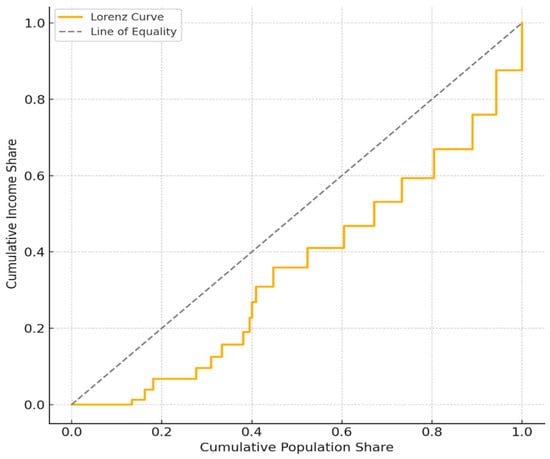
As Figure 2 demonstrates, as income inequality increases, the Lorenz curve bends farther down. When there is progress toward income inequality, it moves upward, approaching the 45-degree line of perfect equality. Direct taxes have a corrective effect on income distribution inequality by shifting the curve upward.
Figure 2.
The Lorenz curve of the village of Rumnos (1844–45).
An examination of the income distribution among the 20 households analyzed in this study reveals a significant disparity between the lower and upper segments of the population. When households are ranked from the lowest to the highest income, the poorest 20 percent earned only 3.32 percent of the village’s total income, whereas the richest 20 percent earned 71.15 percent of total income. The Gini coefficient calculated to measure the level of inequality in income distribution was found to be 0.33. This value indicates a moderate level of income inequality among the households included in the study. The Lorenz curve demonstrates a noticeable deviation from the line of perfect equality, highlighting the concentration of income particularly within the upper income quintile.
Calculation of the Gini coefficient and Lorenz curve may be insignificant when interpreted considering the Ottoman Empire and the settlement unit in question were not economic structures. However, income distribution inequality has a contribution on interpretation of a historic economic structure. Interpretation of a moderate level of income inequality varies. Calculation of Gini coefficient may be accepted as a measure demonstrating capital accumulation and commercialization of agricultural economy. Another criterion demonstrating commercialization of output in the agriculture sector is the distribution of income among households in villages.
Equality in income distribution is considered positive in modern economies as a requirement of a social welfare state, however in pre-industrial economies it is an indicator of obstruction of capital accumulation and the fact that savings required to realize investments cannot be generated through the accumulation of income out of the national income. Therefore, it can be argued that an equitable distribution of income, alongside the state’s effort to maintain high taxation in order to redistribute capital and income among individuals in alignment with an egalitarian framework, implies an official desire to perpetuate the traditional economic structure. Simultaneously, the profile of income distribution offers insights into profitability within the sectors where income is generated. A substantial income gap indicates high profitability within the sectors occupied by top-tier earners and that they can reinvest this premium income into lucrative fields (Küçükkalay and Efe 2006).
Based on these findings, a moderate Gini coefficient signifies that the upper-income group has a major share of capital, indicating the possibility of increased capital accumulation. Utilizing the Gini coefficient and the Lorenz curve verified that the Ottoman Empire had an open economy with minimal state intervention, reflecting the structural power of capital.
8. Conclusions
The economy of the Ottoman Empire was characterized by a non-industrial structure with a predominantly agrarian focus. As a reflection of the fact that the majority of gross domestic product of the Ottoman Empire was generated in the agricultural sector, income distribution and inequality were closely linked to land, which was the primary means of production. In the village of Rumnos, land ownership did not exhibit an equitable structure. When households possessing large- and small-scale landholdings were compared, only two households owned more than 50 decares of land, with an average holding of 128 decares per household. In contrast, five households possessed small-scale landholdings, with an average of only 5.2 decares per household. Land ownership had a significant impact on income distribution and inequality.
An examination of the religious composition of the inhabitants of Rumnos reveals that there were no non-Muslim residents, nor were there any female heads of households. Moreover, it was observed that only a few of the male heads of household lived with tax-liable sons or grandsons. Based on the number of households, the population for the year 1844–45 was estimated to be approximately 100 individuals.
Moreover, there were no landless households in the village; all households possessed agricultural land of varying amounts. The majority of income was derived from agriculture and animal husbandry. Only the head of household number 19 was recorded as being military personnel, who was a missing person, and it was noted that he had no income from agriculture. With the exception of this household, whose head was absent due to military service, there were no other heads of household with connections to urban centers or other settlements. It can therefore be inferred that the heads of households in the village maintained weak ties with distant settlements. The fact that only three households in the 20-household village possessed a single riding or pack animal further supports this conclusion.
According to occupations and income data; agriculture and animal husbandry were not the sole sources of income for the households. Although total income included income classified as supplementary or incidental, occupations and incomes were predominantly agriculture-related.
The vergi-i mahsusa (profit tax), the amount of which was determined at the administrative unit level and apportioned among districts and villages, was calculated as 4614 kuruş. No tax was levied on household number 19, while all of the other households were assessed with specific amounts of tax.
Within the village, there was a direct proportional relationship between the amount of income and the size of landholdings. Household numbers 11 and 12, which had the highest incomes, also possessed the largest landholdings. In the Temettuat Register number 3378 records of Rumnos, there was no evidence of the presence of recipients of alms (iane) or orphans who, in the other villages, were recorded as dependent on the assistance of others. Likewise, there were no landless laborers—such as farmhands, wage laborers, or servants—who earned their livelihood through working for others. Income distribution in the village was analyzed using the Gini coefficient and the Lorenz curve, which revealed a moderate level of inequality among households.
Funding
This research received no external funding.
Institutional Review Board Statement
Not applicable.
Informed Consent Statement
Not applicable.
Data Availability Statement
The original contributions presented in this study are included in the article. Further inquiries can be directed to the corresponding author.
Conflicts of Interest
The author declares no conflicts of interest.
Abbreviations
The following abbreviations are used in this manuscript:
| BCE | Before Common Era |
| CE | Common Era |
Notes
| 1 | Temettuat Register records were compiled in the year 1260 according to the Hijri calendar. This corresponds to the years 1844–45 according to the Gregorian calendar. The Gregorian calendar will be used in this study. |
| 2 | The Seljuk Empire was founded in the eleventh century. It established dominance in Western Asia, Iran, and Mesopotamia. In 1071, it defeated the Byzantine Empire in the Battle of Manzikert and established its dominance in Anatolia. |
| 3 | Beylik is a state ruled by a bey, equivalent to a duchy or principality in Europe. |
| 4 | The name given to officials who collect taxes and duties belonging to the state. |
| 5 | The Tanzimat Edict was proclaimed by Sultan Abdülmecid in 1839. It initiated the most important modernization movement of the Ottoman Empire. |
| 6 | Officials appointed by the central government to manage local agricultural affairs. |
| 7 | It was the official currency of the Ottoman Empire. Between 1844 and 1914, it consisted of 1 gram of silver in metallic form. |
| 8 | A census conducted in the Ottoman financial system for the purpose of determining taxes. |
| 9 | Arabic: Erbab-ı ziraat. |
| 10 | It is an Arabic term. Meaning: A person who is absent from the place where he is sought and whose status, whether dead or alive, is unknown; a missing person (mefkût). |
| 11 | Zuhurattan is an Arabic term that means “unusual or extraordinary.” In Temettüat Registers, it is also used to mean “nonagricultural”. |
| 12 | For the year 1845–46, projected incomes were made by officials after examining revenues from previous years. |
| 13 | Sample theses: Muhammet Arıcı. 2026. Osmanlı Taşrasında Kırsal Hayat: 1844 (h.1260) Temettuat Defterine Göre Çubuk Kazası Köylerinin Sosyo-ekonomik Yapısının Nicel Analizi [Rural life in the Ottoman provinces: A quantitative analysis of the socio-economic structure of villages in the Çubuk district based on the 1844 (h.1260) Temettuat Registers]. Master’s Degree, Bursa Uludağ Univesity, Bursa, Türkiye. Muhammed Emin Okhan. 2019. Temettüat Kayıtlarına Göre 19. Yüzyılın Ortalarında Niş Kazasında Nüfus, Yerleşim ve Ekonomi. [According to Temettuat Registers Demography, Settlement and Economy in Nish County in the Middle of the 19th Century]. Master’s Degree, Marmara Üniversitesi, İstanbul, Türkiye. |
| 14 | Simon Kuznets was a Russian-American economist and statistician who helped establish modern national income accounting and was awarded the 1971 Nobel Memorial Prize in Economics for his work on economic growth. |
References
Archival Sources
BOA.ML.VRD.TMT.d.3378.Published Sources
- Adams, Maurianne, Lee Anne Bell, and Pat Farr. 2007. Theoretical foundations for social justice education. In Teaching for Diversity and Social Justice. Edited by Maurianne Adams, Lee Anne Bell and Pat Farr. London: Routledge, pp. 3–15. [Google Scholar] [CrossRef] [Scilit]
- Akgündüz, Ahmet, and Said Öztürk. 2000. Yozgat Temettuat Defterleri [Yozgat Temettuat Registers]. Yozgat: Yimpaş Holding Yayınları. [Google Scholar]
- Alfani, Guido. 2021. Economic inequality in preindustrial times: Europe and beyond. Journal of Economic Literature 59: 3–44. [Google Scholar] [CrossRef] [Scilit]
- Barkan, Ömer Lütfi. 1953. Tarihi Demografi Araştırmaları ve Osmanlı Tarihi [Historical demographic research and Ottoman history]. Türkiyat Mecmuası 10: 1–26. [Google Scholar]
- Barkan, Ömer Lütfi. 1975. The Price Revolution of the Seventeenth Century: A Tuning Point in the Economic History of the Near Eeast. International Journal of Middle East Studies 6: 3–28. [Google Scholar]
- Birgören, Hamdi. 2008. Müstakil Bolu Sancağı Salnamesi Hicri 1334–Miladi 1916 [The Independent Sanjak of Bolu Yearbook Hijri 1334–Gregorian 1916]. Bolu: Bolu Belediyesi Bolu Araştırmaları. [Google Scholar]
- Cezar, Yavuz. 1986. Osmanlı Maliyesinde Bunalım ve Değişim Dönemi, (18. Yüzyıldan Tanzimat’a) Mali Tarih [Crisis and Transformation in Ottoman Finance: Financial History from the 18th Century to the Tanzimat]. İstanbul: Alan Yayınları. [Google Scholar]
- Chor, Davin. 2005. Institutions, wages, and inequality: The case of Europe and its periphery (1500–1899). Explorations in Economic History 42: 547–66. [Google Scholar] [CrossRef] [Scilit]
- Cornia, Giovanni Andrea. 2004. Inequality, Growth and Poverty in an Era of Liberalization and Globalization. Oxford: Oxford University Press. [Google Scholar] [CrossRef] [Scilit]
- Cullis, James, and Barbara van Koppen. 2007. Applying the Gini Coefficient to Measure İnequality of Water Use in the Olifants River Water Management Area, South Africa. IWMI Research Report 113. Colombo: International Water Management Institute. 25p. [Google Scholar]
- Çakır, Coşkun. 2003. Türkiye’de iktisat tarihi çalışmalarının tarihi üzerine bir deneme [An essay on the history of economic history studies in Turkey]. Türkiye Araştırmaları Literatür Dergisi 1: 7–63. [Google Scholar]
- Çalışkan, Şadan. 2010. Türkiye’de Gelir Eşitsizliği ve Yoksulluk. Sosyal Siyaset Konferansları Dergisi 59: 9. [Google Scholar]
- Çelikdönmez, Ömür. 2000. Devrek Tarihi [History of Devrek]. Ankara: Devrek Ticaret ve Sanayi Odası. [Google Scholar]
- Devrek Kültür Derneği. 1970. Devrek ve Çevresi Tarihi. Devrek Dergisi [Devrek Journal] 1. [Google Scholar]
- Findley, Carter V. 1980. Bureaucratic Reform in the Ottoman Empire: The Sublime Porte, 1789–1922. Princeton: Princeton University Press. [Google Scholar]
- Genç, Mehmet. 2000. Osmanlı İmparatorluğu’nda Devlet ve Ekonomi [State and Economy in the Ottoman Empire]. İstanbul: Ötüken Yayınları. [Google Scholar]
- Güran, Tevfik. 1988. Tanzimat döneminde Osmanlı maliyesi: Bütçeler ve hazine hesapları (1841–1861) [Ottoman finance in the Tanzimat period: Budgets and treasury accounts (1841–1861)]. Belgeler 13: 213–360. [Google Scholar]
- Güran, Tevfik. 1998. 19. Yüzyıl Osmanlı Tarımı [19th Century Ottoman Agriculture]. İstanbul: Eren Yayınları. [Google Scholar]
- Güran, Tevfik. 2000. XIX. yüzyıl temettüat tahrirleri [Nineteenth century temettuat surveys]. In Osmanlı Devletinde Bilgi ve İstatistik [Information and Statistics in the Ottoman State]. Edited by Halil İnalcık and Şevket Pamuk. Ankara: Türkiye Cumhuriyeti Başbakanlık İstatistik Enstitüsü. [Google Scholar]
- Inalcik, Halil. 1994. An Economic and Social History of the Ottoman Empire, 1300–1914. Cambridge: Cambridge University Press. [Google Scholar]
- Issawi, Charles. 1980. The Economic History of Turkey, 1800–1914. The University of Chicago, Publications of the Center for Middle Eastern Studies, no. 13. Chicago and London: The University of Chicago Press, p. 62. [Google Scholar]
- Issawi, Charles. 1982. An Economic History of the Middle East and North Africa, Columbia. Economic History of the Modern World Series. New York: Columbia University Press, p. 76. [Google Scholar]
- Karauğuz, Güngör. 2013. Tarih Sohbetleri Devrek’le İlgili Bir Çift Sözüm Var [Historical Conversations: A Few Words About Devrek]. Konya: Akbil Yayınları. [Google Scholar]
- Kazgan, Gülten. 2004. İktisadi Düşünce veya Politik İktisadın Evrimi [Economic Thought or the Evolution of Political Economy], 11th ed. İstanbul: Remzi Kitabevi. [Google Scholar]
- Konukçu, Enver. 1993. Cumhuriyetin 70. Yılında Bolu [Bolu in the 70th Year of the Republic]. İstanbul: Bolu Gazeteciler Cemiyeti. [Google Scholar]
- Kuznets, Simon. 1955. Economic growth and income inequality. American Economic Review 45: 1–28. [Google Scholar]
- Küçükkalay, A. Mesud, and ve Ayla Efe. 2006. Osmanlı Ziraî Sektörünün Ticarileşebilme İmkânı Üzerine Bir Deneme: 1844–45 Alpu Köyü Örneği. OTAM Ankara Üniversitesi Osmanlı Tarihi Araştırma ve Uygulama Merkezi Dergisi 20: 245–79. [Google Scholar] [CrossRef] [Scilit]
- Kütükoğlu, Mübahat Solmaz. 1995. Osmanlı sosyal ve iktisadî tarihi kaynaklarından temettüât defterleri [Temettuat registers as sources of Ottoman social and economic history]. Belleten 49: 395–412. [Google Scholar] [CrossRef] [Scilit]
- Marx, Karl. 1976. Capital: A Critique of Political Economy. London: Penguin Books, vol. 1. [Google Scholar]
- Öztuna, Yılmaz. 1983. Büyük Türkiye Tarihi [Great History of Turkey]. İstanbul: Ötüken Yayınları, vol. 1. [Google Scholar]
- Öztürk, Said. 1996. Tanzimat Döneminde Bir Anadolu Şehri Bilecik [An Anatolian City in the Tanzimat Period: Bilecik]. İstanbul: Kitabevi Yayınları. [Google Scholar]
- Öztürk, Said. 2003. Türkiye’de temettüat çalışmaları [Temettuat studies in Turkey]. Türkiye Araştırmaları Literatür Dergisi 1: 287–304. [Google Scholar]
- Pamuk, Şevket. 1995. Money in the Ottoman Empire, 1326–1914. In The Ottoman Empire: Its Economy and Society, 1300–1914. Edited by Halil İnalcık and Donald Quateart. Cambridge: Cambridge University Press, pp. 947–84, 952. [Google Scholar]
- Pamuk, Şevket. 2008. Osmanlı’dan Cumhuriyet’e Küreselleşme, İktisat Politikaları ve Büyüme: Seçme Eserleri [From the Ottoman Empire to the Republic: Globalization, Economic Policies and Growth: Selected Works]. İstanbul: Türkiye İş Bankası Kültür Yayınları, vol. 2. [Google Scholar]
- Quataert, Donald. 2000. Osmanlı İmparatorluğunun Ekonomik ve Sosyal Tarihi Cilt 2 1600–1914. Edited by Halil İnalcık and Donald Quataert. Cambridge: Cambridge University Press, p. 949. [Google Scholar]
- Ricardo, David. 1951. The Principles of Political Economy and Taxation. Cambridge: Cambridge University Press. [Google Scholar]
- Rubin, Isaac Ilych. 1979. A History of Economic Thought. Translated by Don Filtzer. London: Ink Links. [Google Scholar]
- Ryckbosch, Wouter. 2016. Economic inequality and growth before the industrial revolution: The case of the Low Countries (fourteenth to nineteenth centuries). European Review of Economic History 20: 1–22. [Google Scholar] [CrossRef] [Scilit]
- Sakaoğlu, Necdet. 1973. Zonguldak İl Yıllığı [Zonguldak Provincial Yearbook]. Zonguldak: Zonguldak Valiliği. [Google Scholar]
- Shaw, Stanford Jay, and Ezel Kural Shaw. 1977. History of the Ottoman Empire and Modern Turkey: Reform, Revolution, and Republic: The Rise of Modern Turkey, 1808–1975. Cambridge: Cambridge University Press. [Google Scholar] [CrossRef] [Scilit]
- Sönmez, Mustafa. 2001. Türkiye’de Gelirin Adaletsiz Bölüşümü [Unjust Distribution of Income in Turkey]. İstanbul: Om Yayınevi. [Google Scholar]
- Şener, Abdüllatif. 1990. Tanzimat Dönemi Osmanlı Vergi Sistemi [The Ottoman Tax System in the Tanzimat Period]. İstanbul: İşaret Yayınları. [Google Scholar]
- Tabakoğlu, Ahmet. 2008. İslam İktisadına Giriş [Introduction to Islamic Economics]. İstanbul: Dergah Yayınları. [Google Scholar]
- Tabakoğlu, Ahmet. 2016. Osmanlı Mali Tarihi [Ottoman Financial History]. İstanbul: Dergah Yayınları. [Google Scholar]
- Todaro, Michael P., and Stephen C. Smith. 2015. Economic Development, 12th ed. London: Pearson Education. [Google Scholar]
- Van Zanden, Jan Luiten. 1995. Tracing the beginning of the Kuznets curve: Western Europe during the early modern period. The Economic History Review 48: 643–64. [Google Scholar] [CrossRef]
- Wallerstein, I. 1979. The Ottoman Empire and the Capitalist World-Economy: Some Questions for Research. Review (Fernand Braudel Center) 2: 389–98. [Google Scholar]
- Xu, Kuan. 2003. How Has the Literature on Gini’s İndex Evolved in the Past 80 Years? Working Paper. Halifax: Dalhousie University. [Google Scholar] [CrossRef] [Scilit]

Disclaimer/Publisher’s Note: The statements, opinions and data contained in all publications are solely those of the individual author(s) and contributor(s) and not of MDPI and/or the editor(s). MDPI and/or the editor(s) disclaim responsibility for any injury to people or property resulting from any ideas, methods, instructions or products referred to in the content. |
© 2026 by the author. Licensee MDPI, Basel, Switzerland. This article is an open access article distributed under the terms and conditions of the Creative Commons Attribution (CC BY) license.