


Simple Summary
Neuroendocrine carcinoma of the cervix is a rare, aggressive cancer, and predicting survival before treatment remains difficult. We studied magnetic resonance images from 128 patients at two hospitals. A model using three measurements extracted from the images identified groups with different survival outcomes in patients from the second hospital. Performance was less consistent when model development was repeated. These findings suggest that information from routine imaging may help assess prognosis before treatment. Further testing in larger patient groups is needed before this approach can guide clinical care.
Abstract
Background: Neuroendocrine carcinoma of the cervix (NECC) is a rare malignancy, and pretreatment overall survival (OS) assessment remains limited. We developed and externally validated an MRI radiomics model for OS risk stratification. Methods: This retrospective study included 128 patients: Center 1 served as the development cohort (n = 90), and Center 2 as the independent external validation cohort (n = 38). The model was selected using development data and locked before validation. Evaluation included Harrell C-index, inverse-probability-of-censoring-weighted (IPCW) AUC, calibration, Brier score, decision-curve analysis, and survival stratification. Results: The model comprised three intratumoral T2-weighted imaging features fitted using CoxBoost 1.5.2. Its external C-index was 0.737 (95% CI, 0.615–0.850), compared with 0.633 (95% CI, 0.523–0.749) for the revised clinical model; the paired difference was 0.104 (95% CI, −0.018 to 0.226). A nested sensitivity analysis of the automated selection procedure yielded a mean C-index of 0.592 (SD, 0.049). IPCW AUCs were 0.741 (95% CI, 0.562–0.891) at 3 years and 0.763 (95% CI, 0.583–0.919) at 5 years. At 3 and 5 years, calibration intercepts were 0.03 and −0.09, slopes 1.14 and 1.20, and Brier scores 0.202 and 0.195, respectively. Exploratory decision-curve analysis suggested potential net benefit over selected thresholds. Hazard ratios (HRs; 95% CIs) for high versus low risk were 1.96 (1.06–3.62) and 3.61 (1.39–9.38) in the development and external cohorts, respectively. Corresponding HRs per development-cohort SD increase in the score were 1.83 (1.29–2.60) and 2.42 (1.45–4.04). Conclusions: The pretreatment MRI radiomics model showed external prognostic discrimination for OS in NECC, but superiority over the pretreatment clinical model was not demonstrated. Further independent validation is needed.
1. Introduction
Neuroendocrine carcinoma of the cervix (NECC) is a rare, high-grade cervical malignancy characterized by early lymphatic and hematogenous dissemination, frequent recurrence, and poor survival [1,2]. Across retrospective series and recent prognostic studies, reported 5-year overall survival (OS) rates have often been below 40% despite multimodal treatment [1,3]. A population-based analysis likewise found substantially higher mortality in NECC than in cervical squamous cell carcinoma or adenocarcinoma [4]. The rarity of NECC has precluded large prospective trials. Although Version 1.2021 of the National Comprehensive Cancer Network Cervical Cancer Guidelines introduced a dedicated diagnostic and treatment pathway for small-cell NECC, current recommendations remain based mainly on retrospective evidence, expert consensus, and extrapolation from other neuroendocrine carcinomas or more common cervical cancer histologic types [1,2]. Nevertheless, outcomes vary considerably among patients with similar disease stage and initial management [2,3,5]. More refined pretreatment prognostic stratification is therefore needed.
The International Federation of Gynecology and Obstetrics (FIGO) stage remains the principal framework for risk assessment but does not fully capture survival heterogeneity in NECC [2,3]. Several reported prognostic factors, including pathological nodal involvement, lymphovascular space invasion, and margin status, are available only after surgery and cannot be applied uniformly to patients receiving nonsurgical treatment [6,7]. Some prognostic models derived from registry or institutional data include treatment-related or postoperative variables that are unavailable before treatment [3,8]. A broadly applicable prognostic model should therefore use only information available before treatment, regardless of the initial management strategy.
Pelvic magnetic resonance imaging (MRI) is routinely performed before treatment for cervical cancer and provides a detailed assessment of primary-tumor morphology and local disease extent [9,10]. Radiomics extends conventional image interpretation by quantifying signal intensity, spatial texture, and multiscale imaging heterogeneity [11]. Radiomic features may encode tissue-scale spatial patterns related to tumor morphology, histology, and molecular organization, although such biological interpretations require direct validation [12]. Pretreatment MRI radiomics has shown prognostic potential in cervical cancer cohorts dominated by squamous cell carcinoma and adenocarcinoma [13,14,15], including a recent three-center OS study with independent external validation [16]. A systematic review of cervical-cancer prediction models nevertheless identified external and prospective validation as continuing priorities [17]. However, these findings may not generalize to NECC because of its distinct biological behavior, metastatic pattern, and clinical course [1,2]. NECC-specific radiomics evidence is limited, and external validation in independent cohorts is rare. Recent studies have continued to evaluate T2WI–clinical integration and combined intratumoral–peritumoral modeling [18,19], but whether these approaches consistently improve prognostic performance across endpoints and validation settings remains uncertain [14,15,20,21]. Studies in glioma, lung adenocarcinoma, and head and neck squamous cell carcinoma have integrated radiomics with single-cell transcriptomic analyses to investigate the cellular and molecular basis of imaging-defined phenotypes [22,23,24]. Recent single-cell studies have begun to map the cellular heterogeneity of small-cell NECC [25,26], but the biological correlates of MRI-derived prognostic risk remain poorly understood.
We therefore developed a pretreatment MRI radiomics model for OS risk stratification in patients with NECC at one center and externally validated it in an independent cohort from a second center. We evaluated clinical, intratumoral radiomics, peritumoral radiomics, combined radiomics, and clinicoradiomics models using complementary measures for censored survival outcomes, including discrimination, calibration, and decision-analytic net benefit. As an ancillary hypothesis-generating analysis, we explored patient-level associations between the MRI-derived OS risk score and cellular and pathway features in a small subset with matched single-nucleus RNA sequencing data from formalin-fixed paraffin-embedded tissue.
2. Materials and Methods
2.1. Study Design and Participants
This retrospective study identified consecutive patients treated between 14 July 2007 and 4 May 2024 from the pathology, medical-record, and picture-archiving systems of Fujian Cancer Hospital (Center 1) and Fujian Provincial Hospital (Center 2). Pathologists experienced in gynecologic tumor diagnosis reviewed the original slides of all 128 included cases using the fifth edition of the World Health Organization Classification of Female Genital Tumours (WHO Classification of Tumours Editorial Board, 2020). Seventy-one patients were also included in our previous study of DWI-derived apparent diffusion coefficients and prognosis [10].
Eligible patients were aged 18–80 years, had pathologically confirmed small-cell or large-cell NECC, and underwent pelvic MRI within 14 days before initial antitumor treatment. Required sequences were axial T2-weighted imaging (T2WI), diffusion-weighted imaging (DWI), and contrast-enhanced T1-weighted imaging (T1WI-CE). Sufficient clinicopathologic information, survival status, and follow-up dates to determine OS were required.
Exclusions were unavailable pretreatment MRI or axial T2WI; motion artifacts preventing reliable radiomics analysis; insufficient tumor visibility or boundary definition for segmentation on otherwise usable MRI; incomplete essential clinicopathologic or survival data; well-differentiated neuroendocrine tumors; or another active malignancy within 5 years, except adequately treated nonmelanoma skin cancer or carcinoma in situ. Seven patients lacked essential clinical records (n = 1) or reliable OS follow-up dates (n = 6).
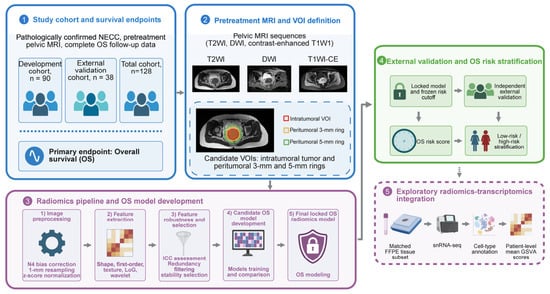
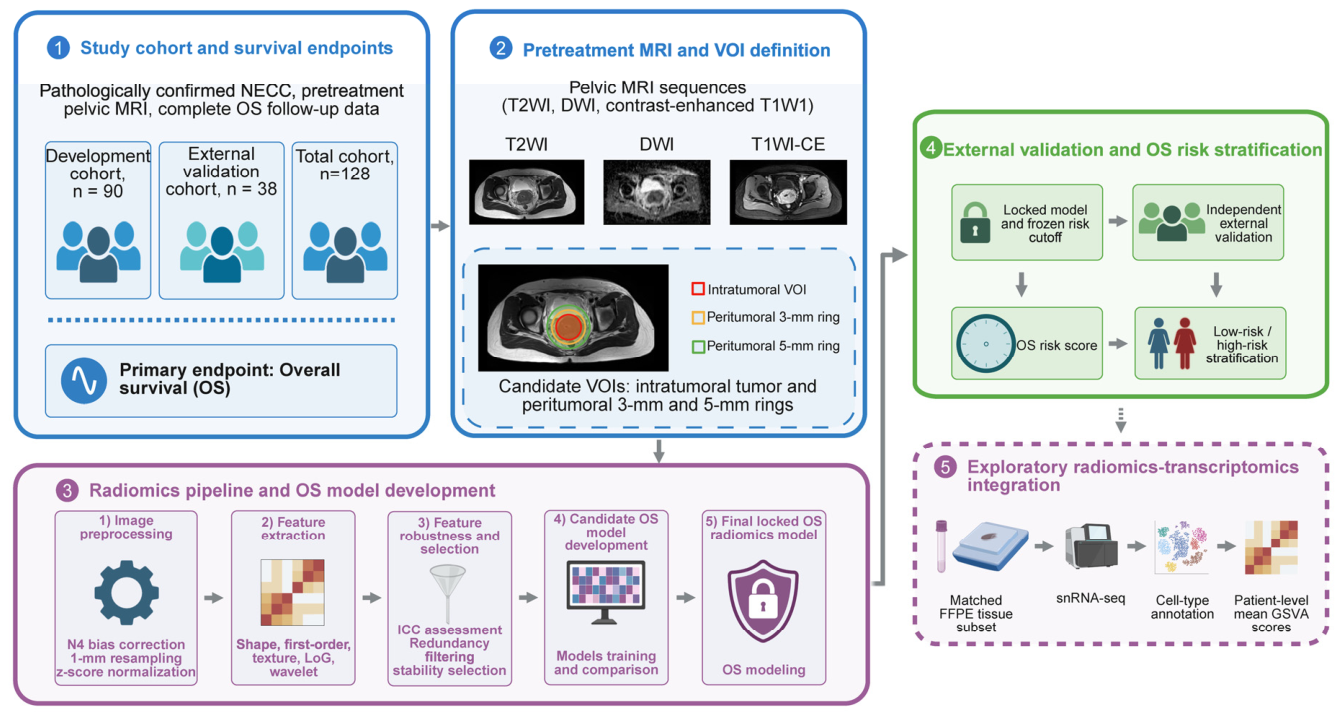
Center 1 provided the development cohort and Center 2 the external validation cohort; allocation followed hospital of origin, without random splitting. Figure 1 summarizes the workflow. Feature processing, model fitting, score orientation, baseline-risk estimation, and cutoff determination used the development cohort only. The fitted models and cutoff were applied to the external cohort without refitting, recalibration, or threshold revision.
Figure 1.
Study workflow for MRI radiomics model development and external validation. The blue panels show the study cohorts, pretreatment MRI, and VOI definition. The solid purple panel shows radiomics model development, the green panel shows independent external validation and OS risk stratification, and the dashed purple panel shows the exploratory radiomics–transcriptomics analysis. Gray arrows indicate the workflow direction. In the MRI inset, the red, orange, and green contours and corresponding squares denote the intratumoral VOI, the 3-mm peritumoral ring, and the 5-mm peritumoral ring, respectively. DWI = diffusion-weighted imaging, FFPE = formalin-fixed paraffin-embedded, GSVA = gene set variation analysis, ICC = intraclass correlation coefficient, LoG = Laplacian of Gaussian, MRI = magnetic resonance imaging, NECC = neuroendocrine carcinoma of the cervix, OS = overall survival, snRNA-seq = single-nucleus RNA sequencing, T1WI = T1-weighted imaging, T1WI-CE = contrast-enhanced T1-weighted imaging, T2WI = T2-weighted imaging, VOI = volume of interest.Please also correct “T1W1” to “T1WI” in the upper MRI sequence description within Figure 1.
The Ethics Committee of Fujian Cancer Hospital approved the multicenter project (approval No. K2021-043-01; ethical review on 29 April 2021; approval letter signed and stamped on 6 May 2021). The approved protocol (version 1.1, dated 9 April 2021) included retrospective and prospective collection of clinical, pathological, MRI, and follow-up data for NECC staging and prognostic research, including exploratory tissue analyses, with a planned study period extending to December 2028. Fujian Cancer Hospital led the project, with Fujian Provincial Hospital participating and providing external-validation data. The present OS analysis used the retrospective component. Retrieval and collation of research data began in July 2021, after ethics approval, through periodic retrospective searches of existing clinical and MRI records generated during routine care. These records concerned patients treated between 14 July 2007 and 4 May 2024. Informed consent was waived for the retrospective clinical and MRI analyses. All eight tissue-analysis patients provided written institutional biobank consent for research use of residual samples and associated clinical information, including genetic testing. Data were de-identified, and the study followed the Declaration of Helsinki. Reporting was checked against TRIPOD+AI and CLEAR (Supplementary Checklists S1 and S2).
2.2. Outcome and Clinical Reference Model
The primary endpoint was OS, defined from initiation of the first antitumor treatment to death from any cause. Patients without a recorded death were censored at the last confirmed contact. Follow-up was obtained from medical and imaging records and telephone contact and closed on 20 October 2025. Three- and five-year OS were the principal prediction horizons; 1-year discrimination was also evaluated because of the early mortality risk associated with NECC.
FIGO stage was reviewed in all 128 patients using the 2018 classification, original pretreatment gynecological examination records, and imaging findings. The clinical reference model was reconstructed during revision using the development cohort. To limit model complexity, FIGO stage was represented as a binary variable (I–IIA2 versus IIB–IV) and left unpenalized during least absolute shrinkage and selection operator (LASSO)–Cox selection of the other candidates, using fivefold cross-validation and lambda.min. FIGO stage, hemoglobin, and the prognostic nutritional index (PNI) were then jointly fitted in an ordinary Cox model without further variable selection. In a sensitivity analysis, FIGO stages I–IV were entered categorically, with hemoglobin and PNI retained and all coefficients re-estimated in the development cohort. The candidate variables and modeling details are provided in Supplementary Table S1 and the Supplementary Methods. All clinical and imaging variables used in this OS analysis, outcomes, and initial treatment categories were complete in both cohorts; no imputation was required (Supplementary Table S1).
Initial treatment strategies were grouped as surgery-based treatment, nonsurgical radiotherapy with or without chemotherapy, or chemotherapy alone. Treatment variables were excluded from the pretreatment prediction models.
2.3. MRI Preprocessing, Segmentation, and Radiomics Extraction
All MRI data from 2007–2024 were retrieved from the hospitals’ picture archiving and communication systems (PACS) as original Digital Imaging and Communications in Medicine (DICOM) images. No scanned films, screenshots, or other digitized analogue images were used. Radiomics analysis used axial T2WI, DWI acquired at b = 800 s/mm2, and axial T1WI-CE. Development-cohort scans comprised 28 (31.1%) on a 1.5-T Signa EXCITE III HD, 30 (33.3%) on a 3.0-T Discovery MR750w (both GE Healthcare, Waukesha, WI, USA), and 32 (35.6%) on a 3.0-T MAGNETOM Prisma (Siemens Healthcare GmbH, Erlangen, Germany). External-cohort counts were 16 (42.1%), 10 (26.3%), and 12 (31.6%), respectively. All examinations were performed using a 12-channel body phased-array coil. Slice thickness was 6 mm for T2WI and DWI and 3–6 mm for T1WI-CE; TR/TE, field of view, and matrix varied by platform (Supplementary Table S2). Images underwent isotropic resampling to 1.0 × 1.0 × 1.0 mm3, N4 bias-field correction, within-volume z-score intensity normalization, and rigid registration of DWI and T1WI-CE to T2WI space. Initial resampling used linear interpolation for images and nearest-neighbor interpolation for masks; PyRadiomics version 3.0.3 used B-spline interpolation during feature extraction. No feature-level batch harmonization was applied.
A pelvic radiologist with 11 years of experience delineated tumors on axial T2WI using 3D Slicer 5.8.1 on a Lenovo computer, with DWI and T1WI-CE as anatomical references. Cystic, necrotic, and hemorrhagic components were retained. A senior pelvic radiologist with 20 years of experience reviewed all volumes of interest (VOIs); modifications were resolved by consensus, and consensus-approved VOIs were used for analysis. Both readers were blinded to survival outcomes. Initial segmentation took place from 21 October to 20 December 2025; review and independent resegmentation of 36 development-cohort patients took place from 4 January to 10 February 2026. Three-dimensional 3-mm and 5-mm peritumoral ring VOIs were generated by outward dilation and subtraction of the intratumoral VOI, followed by removal of noncontiguous luminal structures and obvious normal-organ signal.
Features were extracted using PyRadiomics version 3.0.1 with a fixed bin width of 25. Each sequence–region combination yielded 1502 features from original images and Laplacian-of-Gaussian (σ = 1, 3, and 5 mm), wavelet, square, square-root, logarithmic, and exponential transformations. Detailed settings and feature accounting are provided in the Supplementary Methods and Supplementary Tables S3 and S4.
2.4. Feature Selection and Model Development
Peritumoral VOIs were regenerated from the 36 independent repeat segmentations. Interobserver reproducibility was quantified using ICC(2,1), a two-way random-effects, absolute-agreement, single-measure intraclass correlation coefficient. Features with ICC point estimates ≥0.75 were retained, using the conventional threshold for good reliability as a screening criterion [27].
Development-cohort processing removed zero-variance features and reduced within-sequence redundancy at absolute Spearman correlation > 0.90, retaining the feature with the larger absolute univariable Cox z statistic. Univariable Cox screening and bootstrap elastic-net Cox stability selection retained three intratumoral T2WI features. Development-derived feature-scaling parameters were applied unchanged to the external cohort.
Candidate algorithms were random survival forest, CoxBoost, gradient boosting with a Cox loss, XGBoost with a Cox survival objective, LASSO-Cox, and a radial-kernel support vector machine benchmark. CoxBoost used 60 boosting steps and a penalty parameter of 0.3. The three-feature intratumoral T2WI–CoxBoost model was selected through joint assessment of development-cohort C-index, calibration, and decision curves. The feature set, fitted parameters, score orientation, baseline hazard, and risk-stratification cutoff were fixed before external validation.
The radiomics score was the CoxBoost linear predictor generated from the three retained features; higher values indicated higher relative mortality hazard. Feature identities, filters, coefficients, scaling parameters, baseline cumulative hazards, the exact cutoff, and worked prediction examples are provided in Supplementary Data S1. Four comparator families were specified before external results were examined: clinical, 5-mm peritumoral T1WI-CE–CoxBoost, combined intratumoral–peritumoral, and clinicoradiomics models. During revision, the clinical, combined intratumoral–peritumoral, and clinicoradiomics implementations were reconstructed using development data after the original external results were known. Their evaluation in the same external cohort constitutes an exploratory comparison, distinct from validation of the original locked primary model. The combined radiomics score averaged the development-standardized, fixed intratumoral and peritumoral scores. The revised clinicoradiomics model combined both scores with FIGO stage, hemoglobin, and PNI using ridge Cox regression. Details are provided in the Supplementary Methods and Supplementary Data S2. Development-cohort performance was reported as apparent, in-sample performance.
An additional sensitivity analysis used ten repeats of fivefold nested cross-validation, with fivefold inner cross-validation, in the development cohort. An automatic procedure evaluated 126 region–sequence–algorithm combinations, repeating feature processing and model selection within the training partitions. Selection used the inner cross-validated Harrell C-index. A secondary analysis fixed the intratumoral T2WI–CoxBoost configuration while repeating feature selection and fitting. Repeat-level C-indices were weighted across outer folds by comparable-pair counts; selection frequencies used all 50 outer fits. A further sensitivity analysis repeated the nested evaluation after excluding elastic-net bootstrap attempts with convergence warnings or invalid solutions. Selection frequencies were recalculated from retained attempts without replacement. Details are provided in the Supplementary Methods.
2.5. External Validation and Performance Assessment
The development-median radiomics score (0.110) defined high risk as scores above the cutoff in both cohorts. Discrimination was assessed using Harrell’s C-index and cumulative/dynamic time-dependent AUCs at 1, 3, and 5 years with inverse probability of censoring weighting (IPCW).
Sensitivity analyses assessed the fixed radiomics score by MRI platform, field strength, acquisition year, and center using Kruskal–Wallis, Wilcoxon rank-sum, or Spearman tests, with Holm adjustment across seven comparisons. External C-indices were evaluated by platform, field strength, acquisition era (2007–2015 versus 2016–2024), and after excluding each platform in turn; bootstrap resampling was confined to each evaluated subset.
An exploratory Cox model in the external cohort assessed the association between the fixed radiomics score and OS, with baseline hazards stratified by initial treatment strategy. Discrimination was assessed only within-treatment patient pairs, with bootstrap resampling stratified by treatment (Supplementary Methods).
Fixed-horizon mortality risks were derived from the CoxBoost linear predictor and the development-cohort Breslow baseline cumulative hazard. IPCW Brier scores were evaluated at 1, 3, and 5 years. At the principal 3- and 5-year horizons, reference Brier scores used development-cohort Kaplan–Meier mortality risks assigned uniformly to external patients with identical IPCW weights. Calibration intercepts and slopes were estimated by patient-level IPCW-weighted logistic regression; grouped risks were used only for visualization. Predictions were not recalibrated.
Potential clinical usefulness was explored using IPCW time-dependent decision-curve analysis at 3 and 5 years over threshold probabilities from 0.10 to 0.50. Model-directed action was defined as intensified follow-up, additional imaging surveillance, or multidisciplinary reassessment rather than automatic treatment modification. Because no validated NECC-specific intervention threshold exists, these analyses were considered exploratory.
2.6. Exploratory Imaging-Transcriptomic Analysis
This hypothesis-generating analysis included eight patients from Fujian Cancer Hospital with paired pretreatment MRI and single-nucleus RNA-sequencing data (Supplementary Table S5). Matched formalin-fixed paraffin-embedded tumor tissue was profiled using the 10x Genomics Chromium Fixed RNA Profiling workflow. Patient-level cell proportions and mean gene set variation analysis (GSVA) pathway scores were correlated with intratumoral and peritumoral OS scores separately. Spearman tests required ≥7 paired observations. Exact two-sided permutation p values underwent Benjamini–Hochberg false discovery rate (FDR) adjustment across all eligible cell-proportion and pathway tests within each regional score. Molecular data did not inform model development or validation (Supplementary Methods).
2.7. Statistical Analysis
Continuous variables were summarized as mean (standard deviation [SD]) or median (interquartile range [IQR]), and categorical variables as n (%). Standardized mean differences assessed cohort balance. Follow-up and its 95% confidence interval (CI) were estimated by reverse Kaplan–Meier analysis. Kaplan–Meier curves and log-rank tests compared risk groups. Cox regression estimated hazard ratios (HRs) for risk groups and per development-cohort SD increase in the continuous score. Schoenfeld residuals assessed proportional hazards. C-indices, paired C-index differences, AUCs, calibration intercepts and slopes, and Brier scores used percentile 95% CIs from 5000 patient-level bootstrap resamples with fixed predictions. Model comparisons used identical resampled patients; censoring distributions were re-estimated for IPCW measures. Primary survival tests were two-sided, with p < 0.05 denoting statistical significance. Analyses used R (version 4.6.1) and Python (versions 3.10.19 and 3.12.14), as detailed in Supplementary Methods.
3. Results
3.1. Patient Cohort and Follow-Up
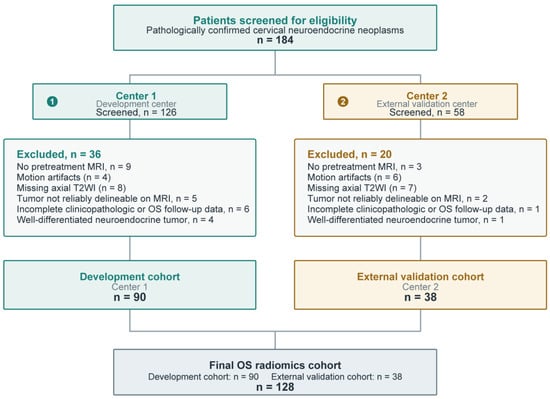
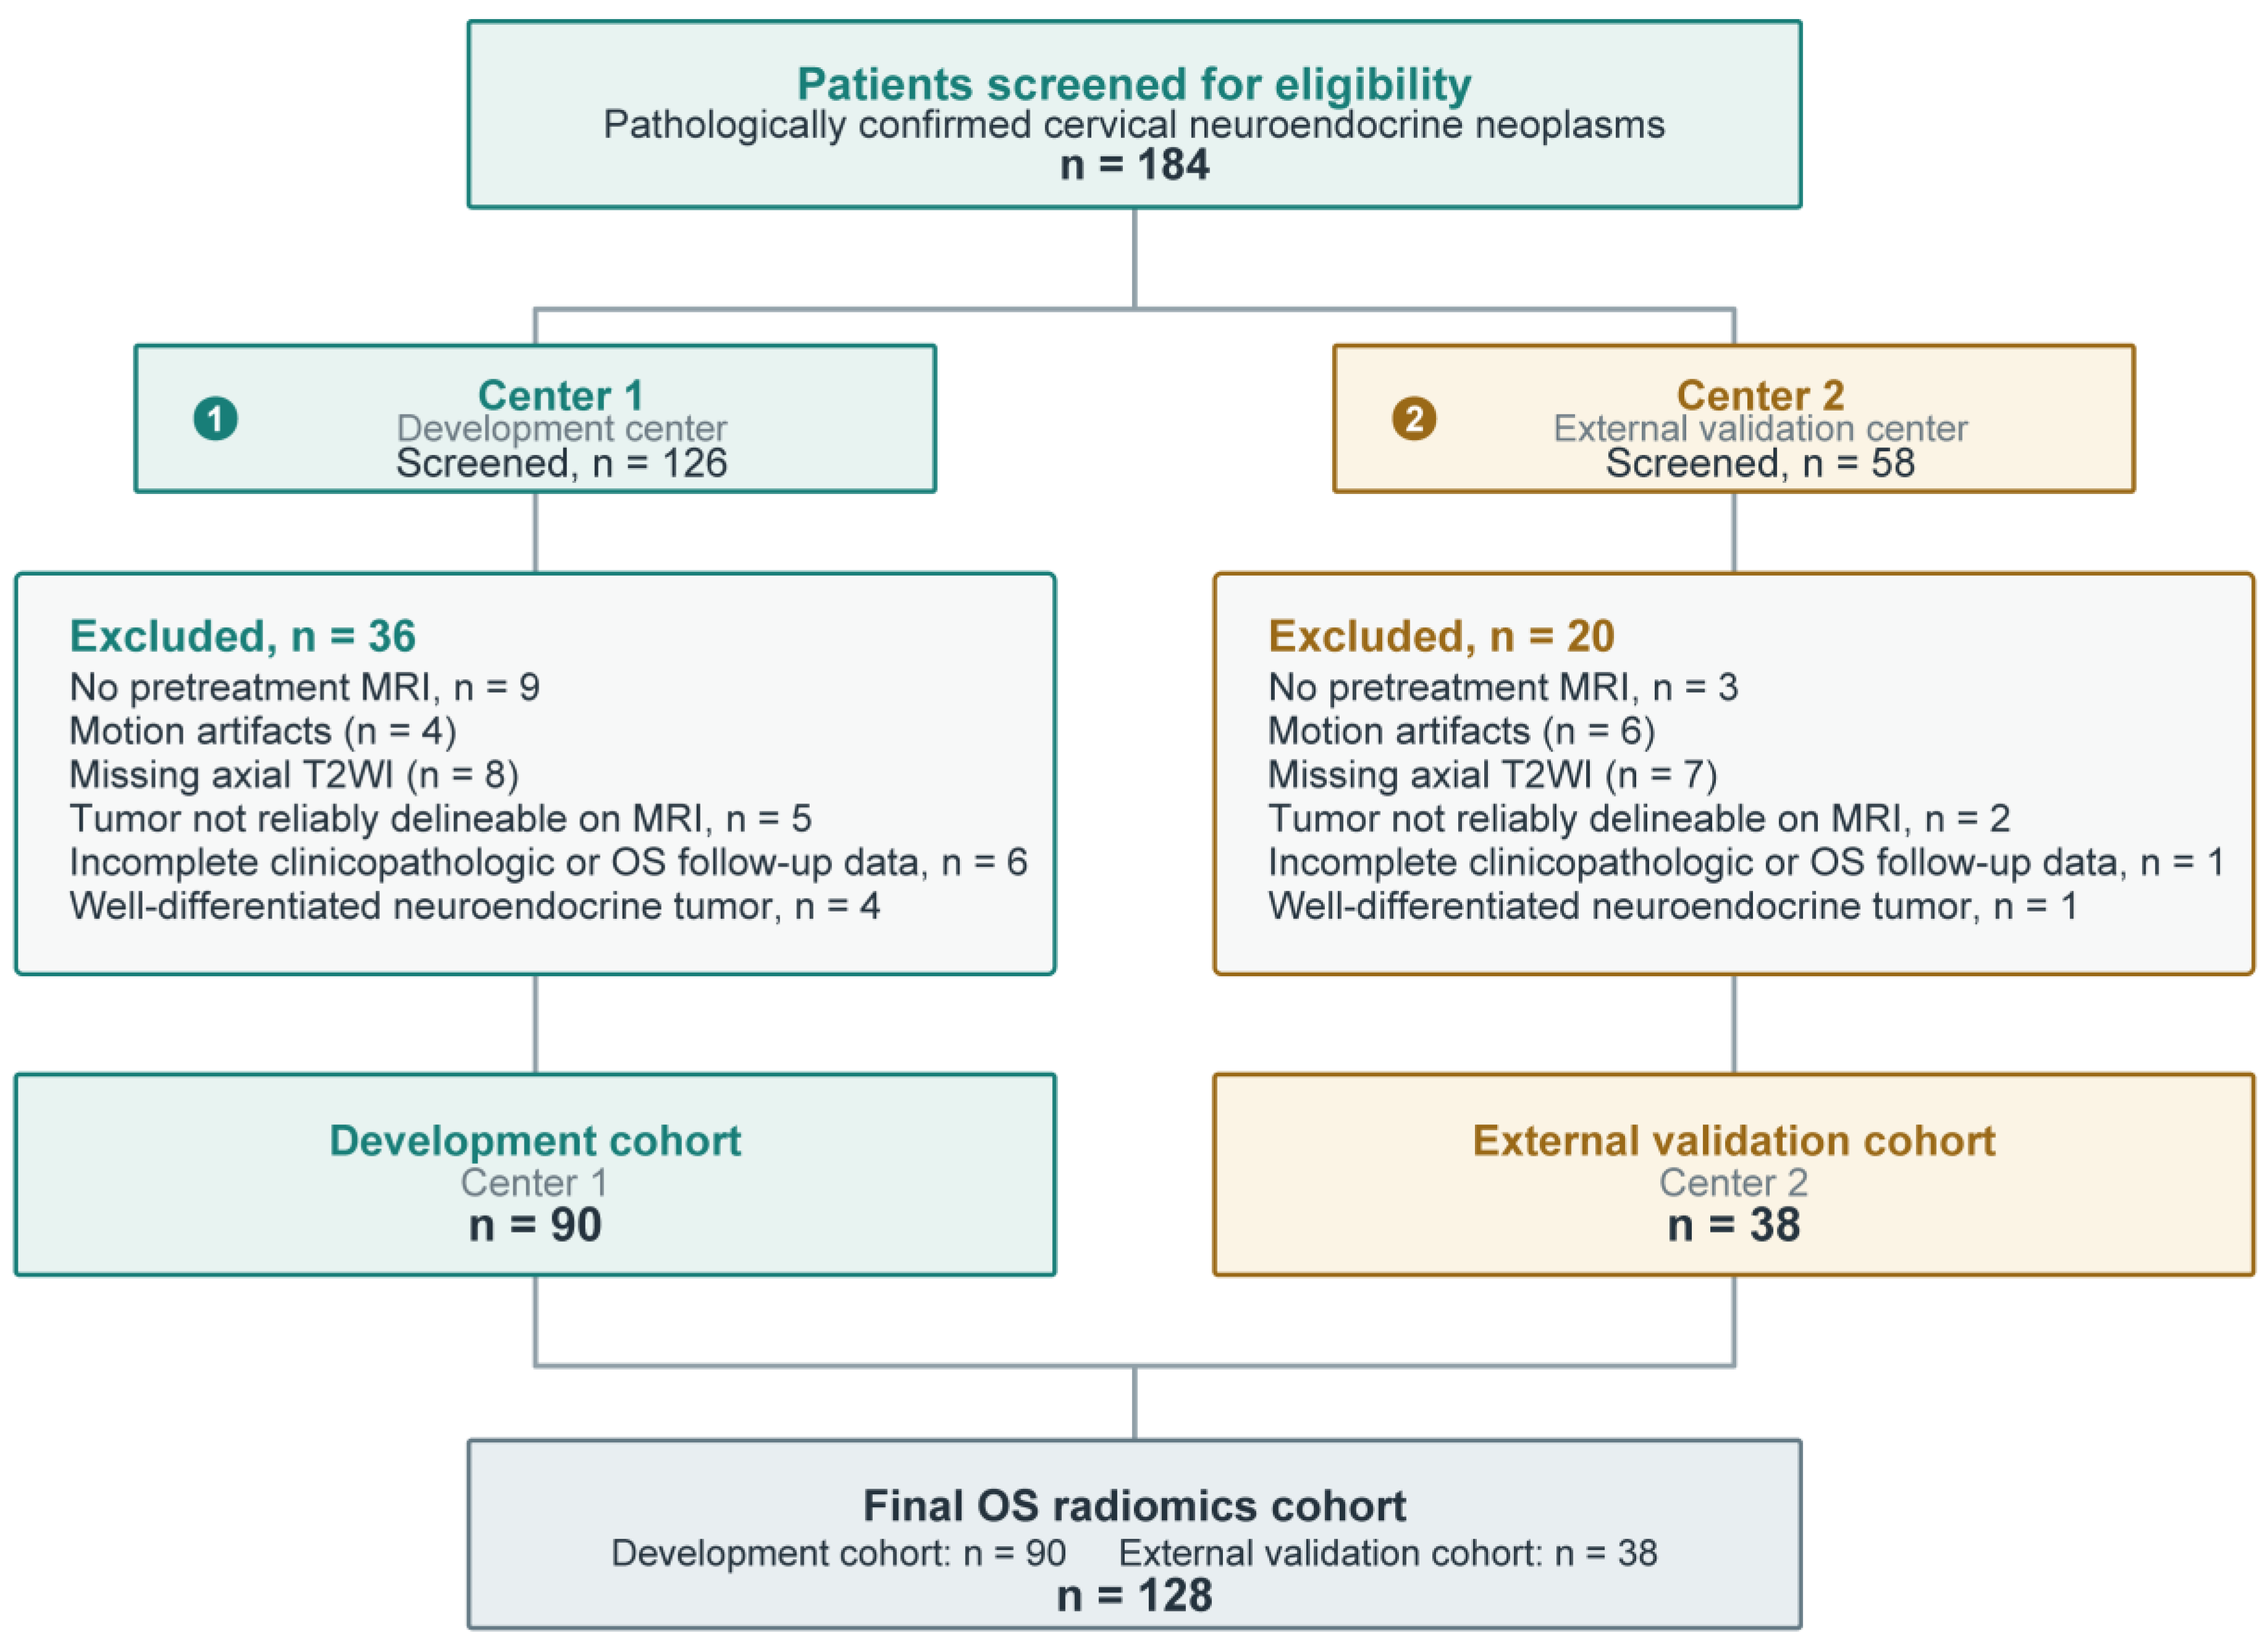
Of 184 patients screened, 128 were included: 90 in the development cohort and 38 in the independent external validation cohort (Figure 2). The median age was 49.0 years (IQR, 43.8–57.0); 121 patients (94.5%) had small-cell NECC, and 80 (62.5%) had pure NECC histology. FIGO stage showed the largest between-cohort imbalance (SMD, 0.513), with relatively more stage III disease in the development cohort and more stage II disease in the external cohort (Table 1). Median follow-up was 67.2 months (95% CI, 58.6–87.0) overall, 60.5 months (95% CI, 43.8–82.7) in the development cohort, and 95.3 months (95% CI, 66.3–122.9) in the external validation cohort. There were 61 deaths, including 43 in the development cohort and 18 in the external validation cohort.
Figure 2.
Patient selection and cohort allocation for overall survival analysis. Screening and center-based allocation of eligible patients to the development cohort (n = 90) and independent external validation cohort (n = 38). Reasons for exclusion are shown.
Table 1.
Characteristics of the Overall, Development, and External Validation Cohorts.
3.2. Model Development and External Validation
Apparent development C-indices were 0.678 for the primary radiomics model and 0.631 for the revised clinical model containing binary FIGO stage, hemoglobin, and PNI (Table 2).
Table 2.
Comparative Performance of Clinical and MRI-Based Models for Overall Survival.
The nested sensitivity analysis yielded mean C-indices of 0.592 (SD, 0.049) for complete selection and 0.558 (SD, 0.051) for fixed intratumoral T2WI–CoxBoost with feature re-selection. The original configuration was selected in 1/50 outer fits; neither analysis retained all three original features together (Supplementary Data S3; Supplementary Figures S1 and S2). After conservative warning exclusion, the corresponding mean C-indices were 0.597 (SD, 0.040) and 0.554 (SD, 0.055). The selected configuration changed in 43/50 outer fits, and the original configuration was selected in 0/50; neither analysis recovered the three original features together (Supplementary Data S3).
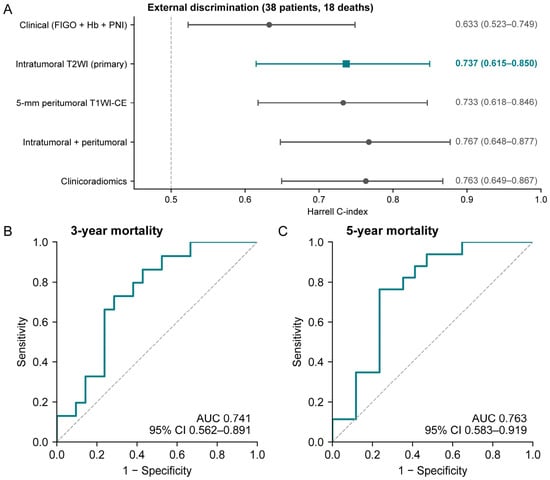
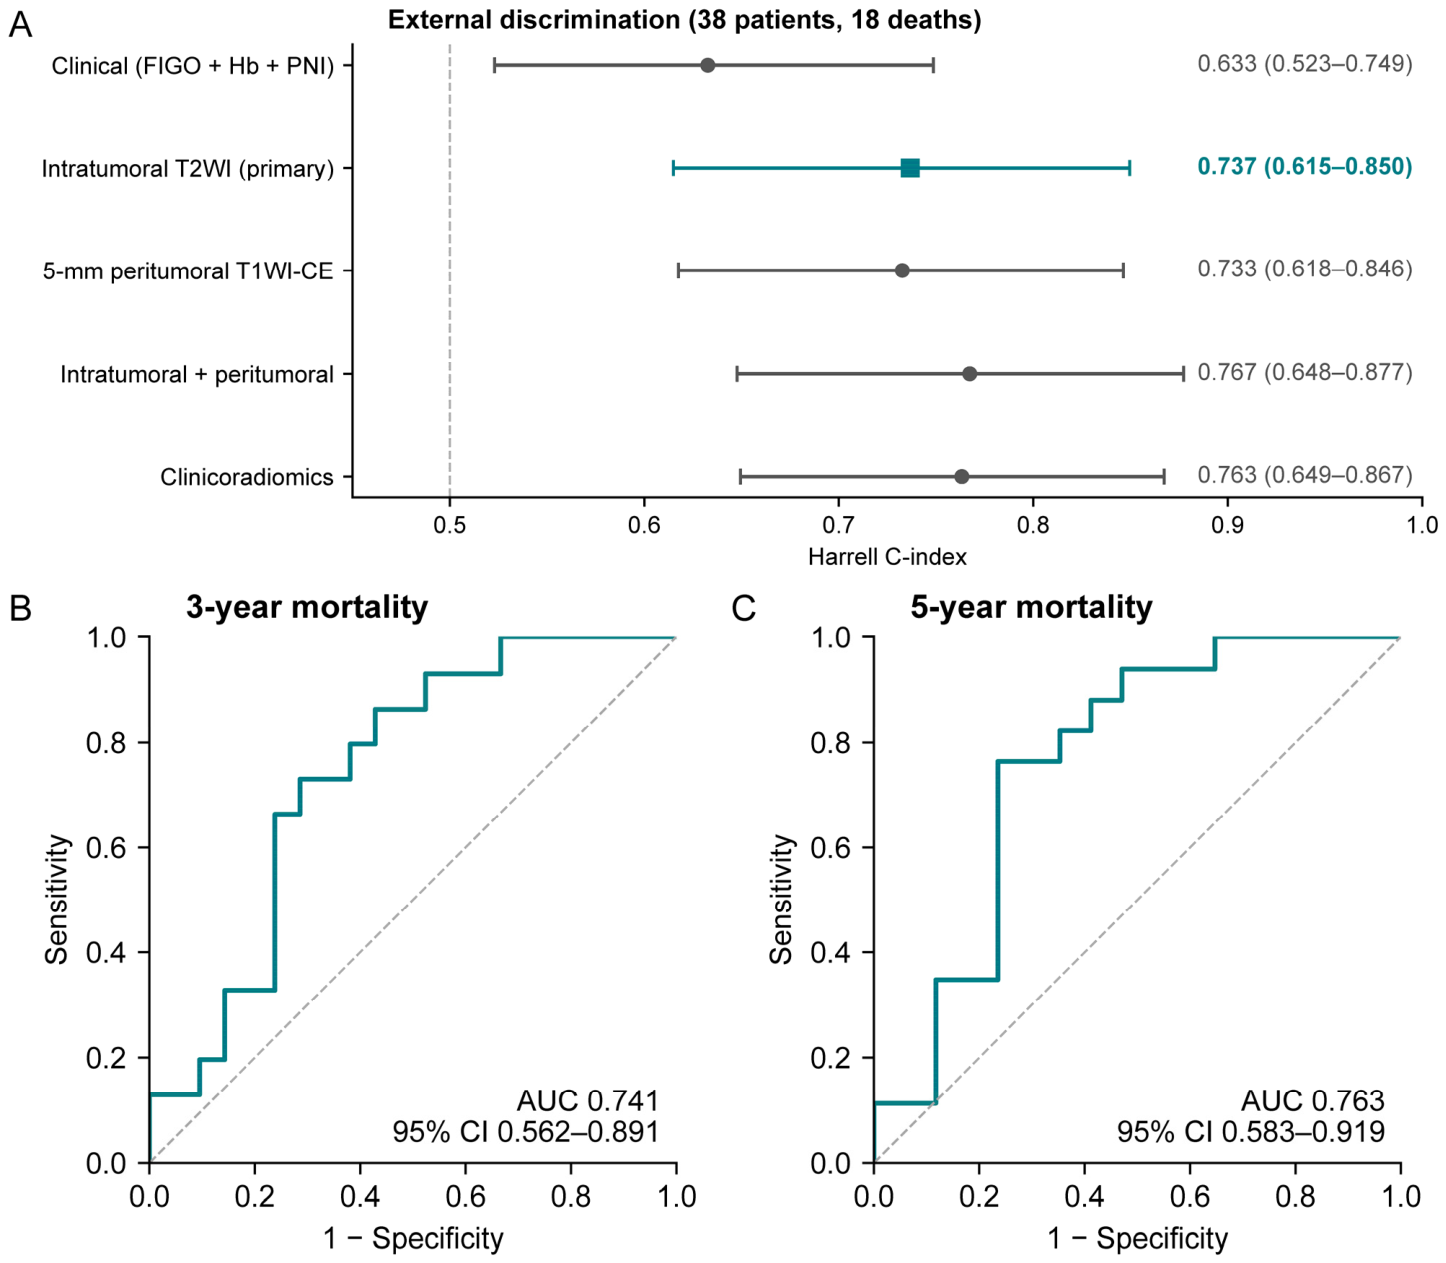
The four-category FIGO clinical model had an external C-index of 0.724 (95% CI, 0.604–0.836), an increase of 0.092 (95% CI, 0.037–0.147) over the binary-stage model. The paired difference between the radiomics and four-category clinical models was 0.012 (95% CI, −0.115 to 0.150; Supplementary Data S2). Peritumoral, combined intratumoral–peritumoral, and revised clinicoradiomics C-indices were 0.733, 0.767, and 0.763, respectively (Figure 3A; Table 2). Combined-minus-primary and clinicoradiomics-minus-primary differences were 0.031 (95% CI, −0.036 to 0.112) and 0.027 (95% CI, −0.044 to 0.109). Primary-model IPCW AUCs at 1, 3, and 5 years were 0.810 (95% CI, 0.571–1.000), 0.741 (95% CI, 0.562–0.891), and 0.763 (95% CI, 0.583–0.919), respectively (Figure 3B,C; Table 2; Supplementary Data S2).
Figure 3.
External discrimination of the primary radiomics model and revised comparators. (A) Harrell C-indices in 38 external patients (18 deaths); bars show 95% confidence intervals from 5000 patient bootstrap resamples. The primary intratumoral T2WI–CoxBoost model is indicated by a teal square. (B,C) IPCW cumulative/dynamic ROC curves of the primary model for 3- and 5-year mortality. In panel A, teal denotes the primary model, gray denotes the comparator models, and the dashed vertical line marks a C-index of 0.5. In panels B and C, the teal lines are the primary model’s ROC curves, and the dashed gray diagonals indicate chance discrimination. The censoring distribution was re-estimated in each bootstrap resample. The clinical model contains binary FIGO stage, hemoglobin, and PNI; the combined and clinicoradiomics comparators were reconstructed during revision as described in the Methods. CI, confidence interval; IPCW, inverse probability of censoring weighting; PNI, prognostic nutritional index.
Exploratory comparisons detected no statistically significant differences in the fixed radiomics score by MRI platform, field strength, or center, or an association with acquisition year (all Holm-adjusted p ≥ 0.885). External C-indices were 0.760 (95% CI, 0.555–0.966) at 1.5 T and 0.779 (95% CI, 0.605–0.918) at 3.0 T. Estimates for 2007–2015 and 2016–2024 were 0.657 (95% CI, 0.464–0.861) and 0.806 (95% CI, 0.628–0.940), respectively. Excluding each platform in turn yielded C-indices of 0.712–0.779 (Supplementary Data S4).
3.3. External Calibration and Decision-Curve Analysis
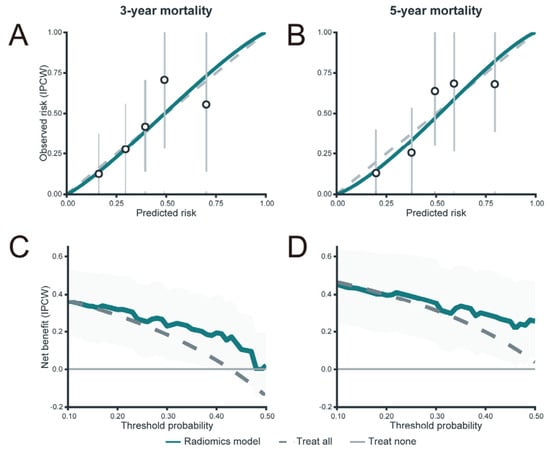
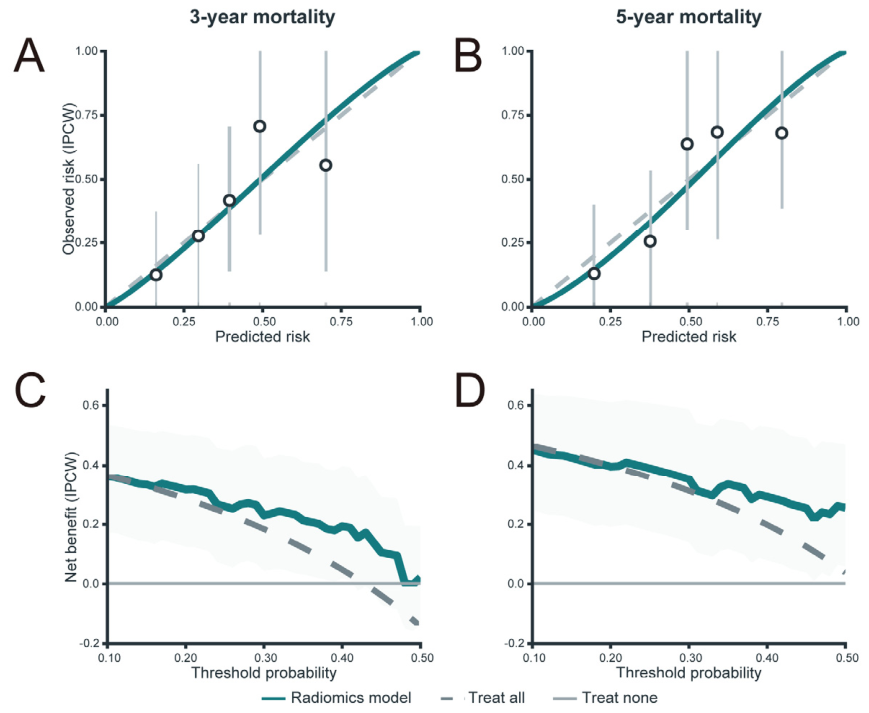
At 3 years, the calibration intercept was 0.035 (95% CI, −0.752 to 0.730), the calibration slope was 1.138 (95% CI, 0.369 to 2.726), and the Brier score was 0.202 (95% CI, 0.149 to 0.256). At 5 years, the corresponding estimates were −0.088 (95% CI, −0.840 to 0.615), 1.199 (95% CI, 0.410 to 3.483), and 0.195 (95% CI, 0.143 to 0.253), respectively (Figure 4A,B). Null-model Brier scores were 0.242 and 0.251 at 3 and 5 years, respectively. At 1, 3, and 5 years, cumulative deaths numbered 5, 15, and 17, and patients remaining at risk numbered 32, 21, and 17, respectively. The corresponding numbers censored before each horizon were 1, 2, and 4. The radiomics model’s net-benefit point estimates exceeded those of treat-none across most evaluated thresholds and treat-all over selected threshold ranges (Figure 4C,D).
Figure 4.
External calibration and decision-curve analysis of the primary radiomics model. All panels evaluate the primary intratumoral T2WI–CoxBoost model in the independent external validation cohort (n = 38). (A,B), IPCW calibration at 3 years (A) and 5 years (B). Circles represent grouped IPCW-observed mortality risks, vertical bars indicate bootstrap 95% confidence intervals, the solid teal line represents the estimated calibration curve based on the IPCW calibration intercept and slope, and the dashed diagonal denotes ideal calibration. Rug marks show the distribution of predicted risks. (C,D), IPCW decision-curve analyses at 3 years (C) and 5 years (D) across threshold probabilities of 0.10–0.50. The teal, dashed gray, and horizontal gray lines represent the radiomics model, treat-all, and treat-none strategies, respectively; shaded bands indicate pointwise bootstrap 95% confidence intervals. Decision-curve analyses were exploratory. IPCW, inverse probability of censoring weighting; T2WI, T2-weighted imaging.
3.4. Radiomics-Based OS Risk Stratification
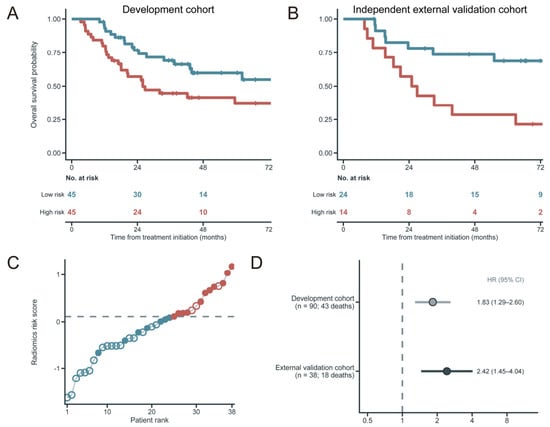
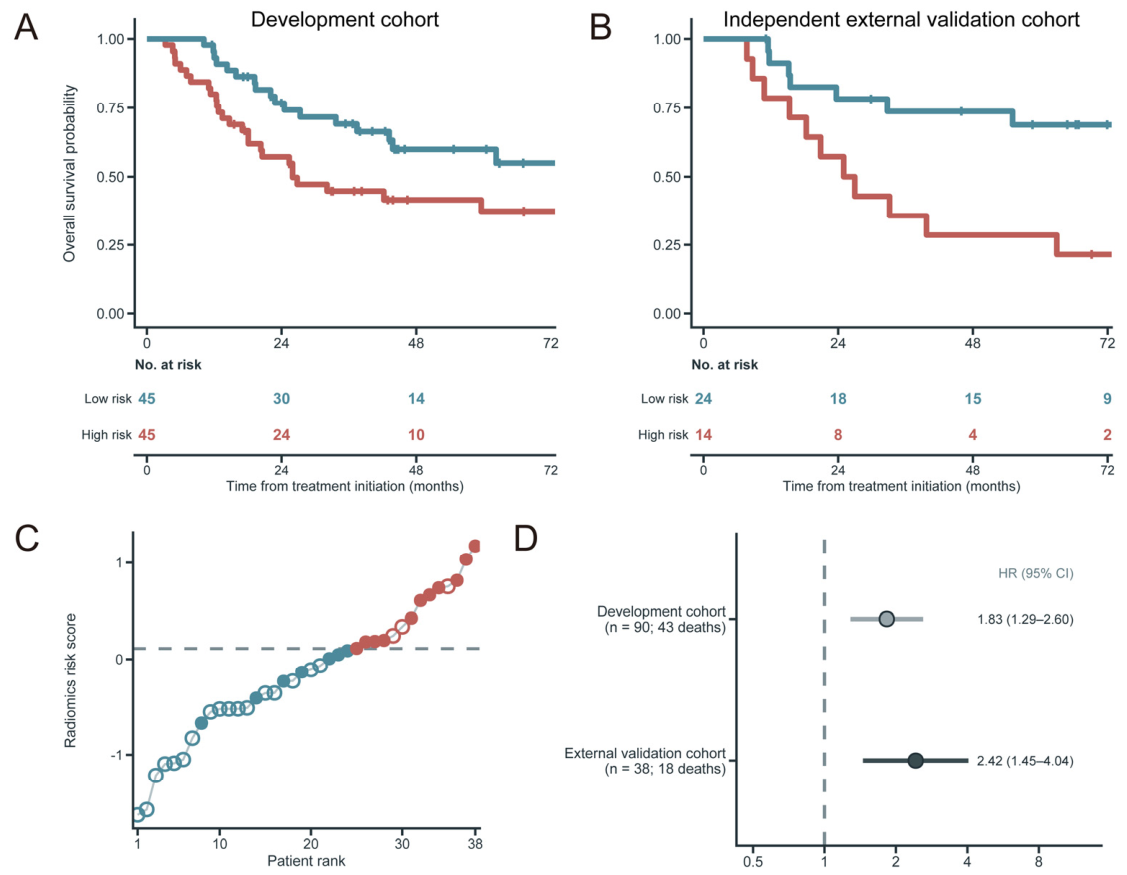
Using the fixed cutoff of 0.110, high-risk patients had shorter OS in the development cohort (HR, 1.96; 95% CI, 1.06–3.62; log-rank p = 0.028) and external cohort (HR, 3.61; 95% CI, 1.39–9.38; log-rank p = 0.005) (Figure 5A–C). HRs per development-cohort SD increase in the continuous score were 1.83 (95% CI, 1.29–2.60) and 2.42 (95% CI, 1.45–4.04), respectively (Figure 5D). Global Schoenfeld p values for risk-group and continuous-score models were 0.100 and 0.084 in development and 0.570 and 0.723 externally, respectively.
Figure 5.
Overall survival risk stratification using the radiomics score. (A,B), Kaplan–Meier curves in the development (A) and external validation (B) cohorts using the development-median cutoff (0.110). In panels A and B, the blue and red curves represent the low- and high-risk groups, respectively. Tick marks on the curves indicate censored observations, and the tables show the numbers at risk. Tables show numbers at risk. (C) External scores ordered from lowest to highest. The dashed line marks the cutoff, colors indicate risk groups, and open/filled circles denote censored observations/deaths. (D) Univariable Cox HRs per development-cohort SD increase in the continuous score. Points and horizontal bars show HRs and 95% CIs; the dashed line denotes HR = 1. CI, confidence interval; HR, hazard ratio; SD, standard deviation.
After stratification by initial treatment, the external HR per 1-SD increase in the score was 1.90 (95% CI, 1.10–3.30; p = 0.022). The C-index based on within-treatment patient pairs was 0.680 (95% CI, 0.489–0.836) (Supplementary Data S5).
3.5. Exploratory Imaging–Transcriptomic Associations
The eight-patient subset showed heterogeneous cell-state composition (Supplementary Tables S6–S8 and Supplementary Figures S3 and S4). No cell-proportion or pathway association met the FDR threshold of 0.05. Descriptive correlations are presented in Supplementary Figure S5 and Supplementary Data S6.
4. Discussion
In this study, the three-feature intratumoral T2WI–CoxBoost model yielded an external C-index of 0.737, compared with 0.633 for the revised clinical reference model; the paired confidence interval did not establish superiority. Its higher external C-index compared to apparent development (0.737 vs. 0.678) may reflect sampling variation and differences in case mix. The FIGO stage imbalance (SMD, 0.513) indicates cohort differences but does not establish a wider external prognostic spread. The nested C-index of 0.592 evaluated repeated feature and model selection, whereas the external C-index of 0.737 evaluated the original locked model. Smaller training samples and an automated selection rule that differed from the original joint assessment may contribute to this discrepancy. Nevertheless, the modest internal discrimination limits confidence that the observed external performance can be reproduced when model development is repeated. The external result supports prognostic discrimination in the evaluated cohort, but further validation of the locked model in larger independent cohorts is needed. The development-derived cutoff separated external survival outcomes, while calibration and decision-curve findings remained exploratory.
Most prognostic evidence in NECC has come from retrospective studies in which stage, tumor burden, nodal involvement, pathological findings, and treatment were associated with outcome [2,3,7]. These factors remain clinically important, but postoperative findings cannot support a uniform pretreatment assessment across surgical and nonsurgical management pathways. Clinical-model discrimination was higher when FIGO stages I–IV were retained, showing that the clinical comparison was sensitive to stage coding. Radiomics superiority was not established with either stage specification. Quantitative MRI may capture aspects of tumor architecture and heterogeneity that are not represented by stage alone [12,15,28].
The primary model used three features from routine T2WI. Previous cervical-cancer studies have also shown prognostic value for T2WI radiomics in externally evaluated cohorts [28,29]. Recent studies provide complementary evidence: a three-center MRI radiomics nomogram predicted OS in an independent external cohort [16], while a T2WI–clinical model improved PFS prediction over clinical variables alone under repeated nested cross-validation [18]. Together with studies reporting little or no improvement from adding sequences or clinical variables [14,15], these findings indicate that the contribution of additional inputs depends on the cohort, endpoint, and validation setting. The nested sensitivity analysis did not identify a consistently preferred configuration, and the three original features were never selected together even when the intratumoral T2WI–CoxBoost configuration was fixed. Excluding bootstrap attempts with convergence warnings altered feature and configuration selection but had little effect on mean internal discrimination. This instability limits confidence in the reproducibility of the specific three-feature signature.
The combined intratumoral–peritumoral model had the highest external C-index point estimate, but its paired difference from the primary model included zero. Peritumoral tissue may contain complementary prognostic information [20]. A recent multicenter cervical-cancer study similarly used tumor and 5-mm peritumoral MRI features for externally tested postoperative recurrence prediction and linked its radiomic signature to a TRIM29–cell-cycle regulatory axis [19]. Peritumoral modeling required additional VOI generation and feature extraction. The paired comparisons did not establish an improvement from the revised clinicoradiomics model. Because previous studies have reported both positive and negligible gains from clinical–radiomics integration [14,18,21], additional predictor domains should be retained only when they provide reproducible improvement in independent data.
The external analyses also clarify the model’s most plausible use. For risk stratification, the central question is whether higher scores consistently identify patients with poorer outcomes. For individualized counselling, the predicted 3- or 5-year mortality probability must also remain accurate in a new population [30]. The present results more strongly support risk stratification than precise estimation of individual mortality probabilities. The development-derived cutoff can be used to define comparable risk groups in future studies, but it should not yet guide treatment. Decision-curve analysis suggested potential benefit at some thresholds, although clinical use would require a defined intervention and prospective evidence that score-guided management improves care [11]. The small external cohort limits the precision of calibration and net-benefit estimates, particularly at 5 years, so these findings remain exploratory. A logical next step is to evaluate whether the score can improve patient selection for closer follow-up or multidisciplinary assessment.
Single-cell profiling has described cellular heterogeneity in NECC [25], while molecular studies have identified outcome-associated alterations such as RB1 [31]. Radiogenomic studies in cervical cancer have reported immune and stromal associations [32] and a TRIM29–cell-cycle link [19], with related findings in other cancers [22,23,24]. This hypothesis-generating analysis of eight patients identified no associations that survived FDR correction and does not establish a biological mechanism.
Several limitations should be acknowledged. First, the sample size was modest because of the rarity of NECC, and the external cohort included only 38 patients and 18 deaths. This limited the precision of risk stratification, calibration, model comparisons, and decision analysis. Second, differences in MRI platforms, field strengths, and acquisition protocols over time may affect image contrast and texture, altering radiomic feature values. No feature-level harmonization was performed, and common preprocessing cannot be assumed to eliminate these effects. Nonsignificant comparisons of the composite score and wide subgroup confidence intervals do not establish scanner independence or feature stability across platforms. Both participating hospitals are located in Fuzhou and collaborated under the same approved multicenter protocol. Further validation across other regions, institutions, and MRI platforms is warranted. Third, the nested sensitivity analysis showed limited internal discrimination and selection stability. Its automatic rule did not exactly reproduce the original joint assessment of discrimination, calibration, and decision curves, and frequent penalized-model convergence warnings further limit interpretation. The revised clinical and dependent comparators also require evaluation in new data. Fourth, manual segmentation may limit scalability. Requiring usable axial T2WI and reliably delineable tumors may restrict applicability. Treatment heterogeneity and selection into observed treatment pathways may limit the model’s applicability in other clinical settings. The score estimates prognosis under the treatment patterns represented here and should not be interpreted as predicting treatment benefit. Finally, the molecular subset was too small for confirmatory inference.
This study developed and externally validated a pretreatment MRI radiomics model for OS risk stratification in NECC. This disease-specific focus is important because NECC is rare but highly aggressive and has received little attention in prognostic radiomics research. Other strengths include center-based external validation, outcome-blinded segmentation, repeat-segmentation reproducibility assessment, and stability-oriented feature reduction. The study also evaluated discrimination, calibration, prediction error, risk stratification, and potential net benefit using methods appropriate for censored outcomes. Molecular analyses were performed only after the imaging model had been fixed and therefore did not influence its development or validation.
5. Conclusions
A pretreatment MRI radiomics model based on three intratumoral T2WI features stratified OS risk in an independent cohort of patients with NECC. These findings support the potential of routine MRI for noninvasive prognostic assessment in this rare malignancy. Further multicenter validation is needed before clinical implementation.
Supplementary Materials
The following supporting information can be downloaded at: https://www.mdpi.com/article/10.3390/tomography12110165/s1, Detailed study methods and statistical analyses. Figure S1. Internal performance and configuration stability. Figure S2. Marginal selection frequencies. Figure S3. Supporting cluster annotation of the single-nucleus RNA-sequencing dataset. Figure S4. Single-nucleus transcriptomic landscape of the matched molecular subset. Figure S5. Exploratory associations with regional OS radiomics scores. Table S1. Definitions and completeness of pretreatment variables. Table S2. Scanner-specific MRI acquisition protocols for the overall survival cohort. Table S3. Image preprocessing, segmentation, and radiomics feature-extraction protocol. Table S4. Feature-count trajectory during radiomics feature selection for overall survival. Table S5. Matched FFPE snRNA-seq subset: clinical eligibility, specimen, and quality-control summary. Table S6. Nucleus-level metadata for the FFPE snRNA-seq dataset. Table S7. Patient-level distribution of major cell types in the matched molecular subset. Table S8A. Patient-level proportional distributions of B cell subsets. Table S8B. Patient-level proportional distributions of T cell subsets. Table S8C. Patient-level proportional distributions of epithelial cell subsets. Table S8D. Patient-level proportional distributions of fibroblast subsets. Table S8E. Patient-level proportional distributions of macrophage subsets. Table S9. Cell-type annotation and representative marker genes in the FFPE snRNA-seq dataset. Supplementary Data S1. Fixed intratumoral T2WI OS model. Supplementary Data S2. Revised model comparisons, external fixed-horizon performance, and FIGO stage sensitivity analysis. Supplementary Data S3. Repeated nested cross-validation and convergence sensitivity analyses. Supplementary Data S4. Acquisition heterogeneity and fixed-score sensitivity analyses. Supplementary Data S5. Initial treatment and external sensitivity analyses. Supplementary Data S6. Selected exploratory correlations of OS radiomics scores with cell-state abundance and pathway activity. Supplementary Checklist S1. TRIPOD+AI reporting checklist. Supplementary Checklist S2. CLEAR reporting checklist.MRI_feature.yaml. Radiomics feature-extraction configuration. OS_Primary_Model.zip. Fixed primary radiomics model specification, parameters, and prediction code. Revised_Clinical_Comparisons.zip. Model specifications, baseline cumulative hazards, and code for the revised comparator analyses. OS_Transcriptomic_Code.zip. Code for the exploratory molecular association analyses [33,34], Supplementary Methods: Detailed methods for cohort selection, MRI preprocessing and radiomics feature extraction, prognostic model development and validation, and exploratory transcriptomic analysis..
Author Contributions
J.C. and Y.S. conceived and designed the study. J.C., R.L., and H.Y. collected the clinical data. X.C. and N.M. collected and curated the MRI data. J.C., X.C., and N.M. performed MRI image review and tumor segmentation. F.J., X.C., and N.M. performed radiomics feature extraction, feature selection, and model development. J.C., F.J., and R.L. performed statistical analysis. J.C., F.J., and H.Y. interpreted the imaging and clinical results. J.C. and F.J. drafted the manuscript. Y.S. critically revised the manuscript for important intellectual content. X.C. and N.M. critically reviewed the imaging-related methods and their reporting in the manuscript. J.C. supervised the study and obtained funding. All authors have read and agreed to the published version of the manuscript.
Funding
This work was supported by the Natural Science Foundation of Fujian Province (No. 2023J011251) and the Fujian Provincial Health Technology Project (No. 2022QNB001).
Institutional Review Board Statement
The study was approved by the Ethics Committee of Fujian Cancer Hospital (approval No. K2021-043-01; ethical review on 29 April 2021; approval letter signed and stamped on 6 May 2021) and was conducted in accordance with the Declaration of Helsinki.
Informed Consent Statement
The requirement for informed consent for the retrospective analysis of clinical and MRI data was waived by the Ethics Committee of Fujian Cancer Hospital. All eight patients in the exploratory tissue-based analysis provided written informed consent through the institutional biobank for research use of their residual biological samples and associated clinical information, including genetic testing.
Data Availability Statement
Summary results and model parameters are provided in the Supplementary Materials. Complete molecular association results are available from the corresponding author upon reasonable request. De-identified patient-level clinical, imaging, and molecular data are available from the corresponding author upon reasonable request, subject to institutional approval and the applicable consent requirements. The approved study protocol is available from the corresponding author upon reasonable request and with institutional permission. Code and model parameters for reproducing the primary radiomics predictions are provided in OS_Primary_Model.zip. Code and baseline cumulative hazards for the revised comparator models are provided in Revised_Clinical_Comparisons.zip. Code for the molecular association analyses is provided in OS_Transcriptomic_Code.zip. Other analysis code is available from the corresponding author upon reasonable request.
Acknowledgments
The authors thank Yunxing Dai for his assistance with clinical data management and technical support. Codex CLI version 0.158.0-alpha.2. (OpenAI; model identifiers: gpt-6-astra and gpt-6.1-sol) was used to assist with coding and language editing. No AI tools were used for the generation of scientific content, data analysis, or interpretation. All AI-assisted outputs were reviewed by the authors, who confirm the originality of the work and take full responsibility for its accuracy and integrity.
Conflicts of Interest
The authors declare no conflicts of interest. The sponsors had no role in the design, execution, interpretation, or writing of the study. They had no role in the choice of research project or the decision to publish the results. This manuscript does not contain identifiable individual patient data or images.
References
- Ren, X.; Wu, W.; Li, Q.; Li, W.; Wang, G. Advances in Research, Diagnosis, and Treatment of Neuroendocrine Cervical Carcinoma: A Review. Oncol. Rev. 2023, 17, 11764. [Google Scholar] [CrossRef] [Scilit] [PubMed]
- Salvo, G.; Flores Legarreta, A.; Ramalingam, P.; Jhingran, A.; Bhosale, P.; Saab, R.; Gonzales, N.R.; Chisholm, G.B.; Frumovitz, M. Clinicopathologic characteristics, oncologic outcomes, and prognostic factors in neuroendocrine cervical carcinoma: A Neuroendocrine Cervical Tumor Registry study. Int. J. Gynecol. Cancer 2023, 33, 1359–1369. [Google Scholar] [CrossRef] [Scilit] [PubMed]
- Yu, C.; Wu, X.; Zhang, S.; Zhang, L.; Zhang, H.; Yang, H.; Zhao, M.; Li, Z. Prognostic model for survival in patients with neuroendocrine carcinomas of the cervix: SEER database analysis and a single-center retrospective study. PLoS ONE 2024, 19, e0296446. [Google Scholar] [CrossRef] [Scilit] [PubMed]
- Yu, H.; Lin, Y.; Lin, J.; Xie, N.; Liu, L.; Deng, S.; Sun, Y. Causes of death analysis and the prognostic model construction in neuroendocrine carcinoma of the cervix: A SEER-based study. Cancer Med. 2024, 13, e70066. [Google Scholar] [CrossRef] [Scilit] [PubMed]
- Chen, J.; Sun, Y.; Chen, L.; Zang, L.; Lin, C.; Lu, Y.; Lin, L.; Lin, A.; Dan, H.; Chen, Y.; et al. Prognostic factors and treatment of neuroendocrine tumors of the uterine cervix based on the FIGO 2018 staging system: A single-institution study of 172 patients. PeerJ 2021, 9, e11563. [Google Scholar] [CrossRef] [Scilit] [PubMed]
- Zhang, Q.; Xiong, Y.; Ye, J.; Zhang, L.; Li, L. Influence of clinicopathological characteristics and comprehensive treatment models on the prognosis of small cell carcinoma of the cervix: A systematic review and meta-analysis. PLoS ONE 2018, 13, e0192784. [Google Scholar] [CrossRef] [Scilit] [PubMed]
- Jia, M.; Pi, J.; Zou, J.; Feng, M.; Chen, H.; Lin, C.; Yang, S.; Deng, Y.; Xiao, X. A Nomogram Model Based on Neuroendocrine Markers for Predicting the Prognosis of Neuroendocrine Carcinoma of Cervix. J. Clin. Med. 2023, 12, 1227. [Google Scholar] [CrossRef] [Scilit] [PubMed]
- Liu, J.; Lyu, Y.; He, Y.; Ge, J.; Zou, W.; Liu, S.; Yang, H.; Li, J.; Jiang, K. Competing risk nomogram and risk classification system for evaluating overall and cancer-specific survival in neuroendocrine carcinoma of the cervix: A population-based retrospective study. J. Endocrinol. Invest. 2024, 47, 1545–1557. [Google Scholar] [CrossRef] [Scilit] [PubMed]
- Fischerova, D.; Frühauf, F.; Burgetova, A.; Haldorsen, I.S.; Gatti, E.; Cibula, D. The Role of Imaging in Cervical Cancer Staging: ESGO/ESTRO/ESP Guidelines (Update 2023). Cancers 2024, 16, 775. [Google Scholar] [CrossRef] [Scilit] [PubMed]
- Chen, J.; Ma, N.; Sun, M.; Chen, L.; Yao, Q.; Chen, X.; Lin, C.; Lu, Y.; Lin, Y.; Lin, L.; et al. Prognostic value of apparent diffusion coefficient in neuroendocrine carcinomas of the uterine cervix. PeerJ 2023, 11, e15084. [Google Scholar] [CrossRef] [Scilit] [PubMed]
- Huang, E.P.; O’Connor, J.P.B.; McShane, L.M.; Giger, M.L.; Lambin, P.; Kinahan, P.E.; Siegel, E.L.; Shankar, L.K. Criteria for the translation of radiomics into clinically useful tests. Nat. Rev. Clin. Oncol. 2023, 20, 69–82. [Google Scholar] [CrossRef] [Scilit] [PubMed]
- Tomaszewski, M.R.; Gillies, R.J. The Biological Meaning of Radiomic Features. Radiology 2021, 298, 505–516. [Google Scholar] [CrossRef] [PubMed]
- Zheng, R.R.; Cai, M.T.; Lan, L.; Huang, X.W.; Yang, Y.J.; Powell, M.; Lin, F. An MRI-based radiomics signature and clinical characteristics for survival prediction in early-stage cervical cancer. Br. J. Radiol. 2022, 95, 20210838. [Google Scholar] [CrossRef] [Scilit] [PubMed]
- Zhang, X.; Zhao, J.; Zhang, Q.; Wang, S.; Zhang, J.; An, J.; Xie, L.; Yu, X.; Zhao, X. MRI-based radiomics value for predicting the survival of patients with locally advanced cervical squamous cell cancer treated with concurrent chemoradiotherapy. Cancer Imaging 2022, 22, 35. [Google Scholar] [CrossRef] [Scilit] [PubMed]
- Wagner-Larsen, K.S.; Hodneland, E.; Fasmer, K.E.; Lura, N.; Woie, K.; Bertelsen, B.I.; Salvesen, Ø.; Halle, M.K.; Smit, N.; Krakstad, C.; et al. MRI-based radiomic signatures for pretreatment prognostication in cervical cancer. Cancer Med. 2023, 12, 20251–20265. [Google Scholar] [CrossRef] [Scilit] [PubMed]
- Lin, Y.; Gao, Y.; Weng, T. Construction and Validation of a MRI-Based Radiomic Nomogram to Predict Overall Survival in Patients with Local Advanced Cervical Cancer: A Multicenter Study. Acad. Radiol. 2024, 31, 4372–4382. [Google Scholar] [CrossRef] [Scilit] [PubMed]
- Jha, A.K.; Mithun, S.; Sherkhane, U.B.; Jaiswar, V.; Osong, B.; Purandare, N.; Kannan, S.; Prabhash, K.; Gupta, S.; Vanneste, B.; et al. Systematic review and meta-analysis of prediction models used in cervical cancer. Artif. Intell. Med. 2023, 139, 102549. [Google Scholar] [CrossRef] [Scilit] [PubMed]
- Tang, S.; Yen, A.; Wang, K.; Albuquerque, K.; Wang, J. Progression-Free Survival Prediction for Locally Advanced Cervical Cancer After Chemoradiotherapy With MRI-based Radiomics. Clin. Oncol. (R Coll. Radiol.) 2025, 38, 103702. [Google Scholar] [CrossRef] [Scilit] [PubMed]
- Chen, S.; Zhang, Y.; Chen, D.; Dang, J.; Chen, L.; Yang, W. AI-assisted Radiomic Model for Cervical Cancer Recurrence Prediction: A Multicenter Retrospective Study with Experimental Validation. Radiol. Imaging Cancer 2026, 8, e250618. [Google Scholar] [CrossRef] [Scilit] [PubMed]
- Xin, W.; Rixin, S.; Linrui, L.; Zhihui, Q.; Long, L.; Yu, Z. Machine learning-based radiomics for predicting outcomes in cervical cancer patients undergoing concurrent chemoradiotherapy. Comput. Biol. Med. 2024, 177, 108593. [Google Scholar] [CrossRef] [Scilit] [PubMed]
- Liu, B.; Sun, Z.; Xu, Z.L.; Zhao, H.L.; Wen, D.D.; Li, Y.A.; Zhang, F.; Hou, B.X.; Huan, Y.; Wei, L.C.; et al. Predicting Disease-Free Survival With Multiparametric MRI-Derived Radiomic Signature in Cervical Cancer Patients Underwent CCRT. Front. Oncol. 2022, 11, 812993. [Google Scholar] [CrossRef] [Scilit] [PubMed]
- Li, G.; Li, L.; Li, Y.; Qian, Z.; Wu, F.; He, Y.; Jiang, H.; Li, R.; Wang, D.; Zhai, Y.; et al. An MRI radiomics approach to predict survival and tumour-infiltrating macrophages in gliomas. Brain 2022, 145, 1151–1161. [Google Scholar] [CrossRef] [Scilit] [PubMed]
- Senosain, M.F.; Zou, Y.; Patel, K.; Zhao, S.; Coullomb, A.; Rowe, D.J.; Lehman, J.M.; Irish, J.M.; Maldonado, F.; Kammer, M.N.; et al. Integrated Multi-omics Analysis of Early Lung Adenocarcinoma Links Tumor Biological Features with Predicted Indolence or Aggressiveness. Cancer Res. Commun. 2023, 3, 1350–1365. [Google Scholar] [CrossRef] [Scilit] [PubMed]
- Chen, X.; Jiang, H.; Pan, M.; Feng, C.; Li, Y.; Chen, L.; Luo, Y.; Liu, L.; Peng, J.; Hu, G. Habitat radiomics predicts occult lymph node metastasis and uncovers immune microenvironment of head and neck cancer. J. Transl. Med. 2025, 23, 498. [Google Scholar] [CrossRef] [Scilit] [PubMed]
- Xiang, X.; Tao, X.; Hua, K.; Jiang, H.; Ding, J. Single-cell RNA sequencing reveals tumor heterogeneity in small cell neuroendocrine cervical carcinoma. Commun. Biol. 2025, 8, 184. [Google Scholar] [CrossRef] [Scilit] [PubMed]
- Wang, T.; Zhang, L.; Mei, S.; Wang, B.; Liu, J.; Yang, W.; Liao, J.; Wang, C. Single-cell RNA sequencing highlights the unique tumor microenvironment of small cell neuroendocrine cervical carcinoma. J. Transl. Med. 2025, 23, 19. [Google Scholar] [CrossRef] [Scilit] [PubMed]
- Koo, T.K.; Li, M.Y. A Guideline of Selecting and Reporting Intraclass Correlation Coefficients for Reliability Research. J. Chiropr. Med. 2016, 15, 155–163. [Google Scholar] [CrossRef] [Scilit] [PubMed]
- Marsilla, J.; Weiss, J.; Ye, X.Y.; Welch, M.; Milosevic, M.; Lyng, H.; Hompland, T.; Bruheim, K.; Tadic, T.; Haibe-Kains, B.; et al. A T2-weighted MRI-based radiomic signature for disease-free survival in locally advanced cervical cancer following chemoradiation: An international, multicentre study. Radiother. Oncol. 2024, 199, 110463. [Google Scholar] [CrossRef] [Scilit] [PubMed]
- Wei, G.; Jiang, P.; Tang, Z.; Qu, A.; Deng, X.; Guo, F.; Sun, H.; Zhang, Y.; Gu, L.; Zhang, S.; et al. MRI radiomics in overall survival prediction of local advanced cervical cancer patients tread by adjuvant chemotherapy following concurrent chemoradiotherapy or concurrent chemoradiotherapy alone. Magn. Reson. Imaging 2022, 91, 81–90. [Google Scholar] [CrossRef] [Scilit] [PubMed]
- McLernon, D.J.; Giardiello, D.; Van Calster, B.; Wynants, L.; van Geloven, N.; van Smeden, M.; Therneau, T.; Steyerberg, E.W. Assessing Performance and Clinical Usefulness in Prediction Models With Survival Outcomes: Practical Guidance for Cox Proportional Hazards Models. Ann. Intern. Med. 2023, 176, 105–114. [Google Scholar] [CrossRef] [Scilit] [PubMed]
- Flores Legarreta, A.; Salvo, G.; Gonzales, N.R.; Chisholm, G.; Hillman, R.T.; Frumovitz, M. RB1 alteration and poor prognosis in women with high-grade neuroendocrine carcinoma of the uterine cervix: A NeCTuR study. J. Gynecol. Oncol. 2023, 34, e50. [Google Scholar] [CrossRef] [Scilit] [PubMed]
- Feng, Y.; Sun, Z.; Li, Y.; Wang, F.; Li, Q.; Ma, J.; Zhang, X.; Ye, H.; Lv, X.; Wang, Z.; et al. A machine learning-based framework for prognostic prediction and tumor microenvironment characterization of locally advanced cervical cancer with concurrent chemoradiotherapy. npj Precis. Oncol. 2025, 10, 31. [Google Scholar] [CrossRef] [Scilit] [PubMed]
- Collins, G.S.; Moons, K.G.M.; Dhiman, P.; Riley , R.D.; Beam , A.L.; Van Calster, B.; Ghassemi , M.; Liu , X.; Reitsma , J.B.; van Smeden, M.; et al. TRIPOD+AI statement: updated guidance for reporting clinical prediction models that use regression or machine learning methods. BMJ 2024, 385, e078378. [Google Scholar] [CrossRef] [Scilit]
- Kocak, B.; Baessler , B.; Bakas , S.; Cuocolo , R.; Fedorov , A.; Maier-Hein, L.; Mercaldo, N.; Müller, H.; Orlhac, F.; Pinto dos Santos, D.; et al. CheckList for EvaluAtion of Radiomics research (CLEAR): a step-by-step reporting guideline for authors and reviewers endorsed by ESR and EuSoMII. Insights Imaging 2023, 14, 75. [Google Scholar] [CrossRef] [Scilit]

Disclaimer/Publisher’s Note: The statements, opinions and data contained in all publications are solely those of the individual author(s) and contributor(s) and not of MDPI and/or the editor(s). MDPI and/or the editor(s) disclaim responsibility for any injury to people or property resulting from any ideas, methods, instructions or products referred to in the content. |
© 2026 by the authors. Licensee MDPI, Basel, Switzerland. This article is an open access article distributed under the terms and conditions of the Creative Commons Attribution (CC BY) license.