


Abstract
The risk of dying or being injured as a result of traffic collisions is higher for medical emergency responders than for other professional drivers. This systematic review synthesizes the literature regarding the collisions of ambulances, focusing on the prevalence and characteristics surrounding such events. Keywords including paramedics and traffic collisions were searched in papers available in PubMed from January 1990 to July 2021. Two independent reviewers screened the abstracts of 2494 papers and ended up with 93 full-text articles to assess for eligibility, of which 26 papers were finally kept for this review. There was a total of 18 studies conducted in the United States, followed by 3 in Turkey, 2 in Taiwan, 1 in both the United States and Canada, 1 in France, and 1 in Poland. There is a high record of injury and fatal collisions for ambulances compared to other commercial or similarly sized vehicles. Drivers less than 35 years old with low experience and a history of citations are more likely to be involved in such collisions. Ambulance collisions are more likely to happen in urban areas and intersections are the riskiest locations. Most collisions occur when the ambulance is responding to an emergency call (i.e., going to the patient or the hospital) and using lights and sirens. Tailored preventive policies and programs for improving paramedics’ safety should be sought to reduce the burden of these occupational collisions.
1. Introduction
Work-related collisions are one of the main causes of death at work and it is estimated that 33% of drivers involved in traffic collisions are professional drivers [1]. Numerous studies have identified that a significant percentage of emergency medical services injuries and mortality are due to traffic collisions [2]. For instance, it is found that 41.3% of work-related injuries (WRIs) were due to ambulance collisions and traffic collisions are the main cause of these injuries (31.9%) [3]. Another study showed that 81.4% of WRIs were due to ambulance collisions, leading to the death of three paramedics and seven civilian drivers between March 2014 and July 2014 in Turkey [4].
The risk of occupational death, mainly due to traffic collisions, is high in emergency medical services [5,6,7,8,9]. The national crash fatality rates, in the United States (U.S.), for emergency vehicle (EV) personnel are 2.5–4.8 times higher than the national average for all occupations [10]. Compared to overall traffic collisions, ambulance traffic collisions were 1.7 times more likely to result in death and 1.9 times more likely to include injuries [11]. More specifically, among work-related collisions, those of emergency respondents are the leading cause of mortality [12]. In the U.S., ambulances are reported to be involved in more than 6500 crashes per year, 35% of which are associated with at least one injury and/or fatality [12]. Another study showed that the overall injury rate in emergency medical services in the U.S. was 34.6 per 100 full-time workers per year between 1 January 1998 and 15 July 2002 [13].
A review study of rural ambulance crashes showed that the frequency and severity of ambulance collisions are greater than those of crashes involving vehicles of a similar size and weight [14]. Additionally, the percentage of injury-causing collisions for ambulances (76%) is more than for other similar-sized vehicles (61%) [15]. Furthermore, it is found that there are high rates of ambulance collisions in different countries, e.g., 5 collisions per 10,000 ambulance responses in the U.S. in 2016 [16], 1 ambulance collision per 8598 ambulance runs in Taiwan from January 2011 to October 2016 [11], and 13.3 collisions per 100,000 miles traveled in the U.S. from June 1989 to August 1991 [17].
The estimated cost of occupational injuries associated with work-related collisions is high compared to industrial accidents [18]. For instance, the cost of these collisions was about CAD 2.70 billion in Quebec, Canada, from 2001 to 2015 [18]. Social costs of involvement in traffic collisions for emergency responders (ERs) are thus expected to be higher than for others [19]. Moreover, if an ambulance carrying a patient is involved in a road crash, it poses a threat to the patient, ERs, and other road users [20]. ERs’ crashes also incur many lawsuits costing millions of dollars due to the loss of lives, the associated injuries, and property damage depending on the jurisdictions where they happen. It is estimated that the global cost of ER collisions is USD 250 billion annually [12]. In the United States, the cost of ER crashes has been estimated to be USD 35 billion annually [12]. Additionally, research has shown that the probability of being killed or injured in a collision involving a civilian driver is higher than that of a crash involving a paramedic, meaning that the total cost of such collisions could be significantly greater than current estimates suggest [21].
Ambulance drivers face a greater risk of collisions than other commercial drivers due to the nature of their work, resulting in injuries and fatalities among not only emergency responders but also ambulance occupants and other road users. The objectives of the study are to conduct a systematic literature review to analyze the prevalence of ambulance collisions and to identify variables that explain such events, including driver or collision characteristics. Our hypothesis is that paramedics experience a higher prevalence of collisions compared to other commercial drivers. Additionally, it is hypothesized that factors such as ambulance drivers’ age, experience, sex, and history of collisions, collision characteristics such as time, date, and mechanism of collisions, response mode of ambulances, and weather conditions can increase the probability of collisions.
The methods used in the article include a systematic literature review through PubMed using specific keywords, blind screening of identified papers by two independent reviewers, and assessment of the quality of the papers using the QualSyst method. In the final review stage, the Results section summarizes the prevalence of collisions, driver and collision characteristics, weather conditions, response modes, and the use of lights and sirens during collisions from the selected papers. This is the first study, to our knowledge, including such a systematic literature review focusing on the prevalence of paramedic collisions and relevant factors involved in such events to improve the safety of emergency responders, ambulance occupants, and other road users.
2. Method
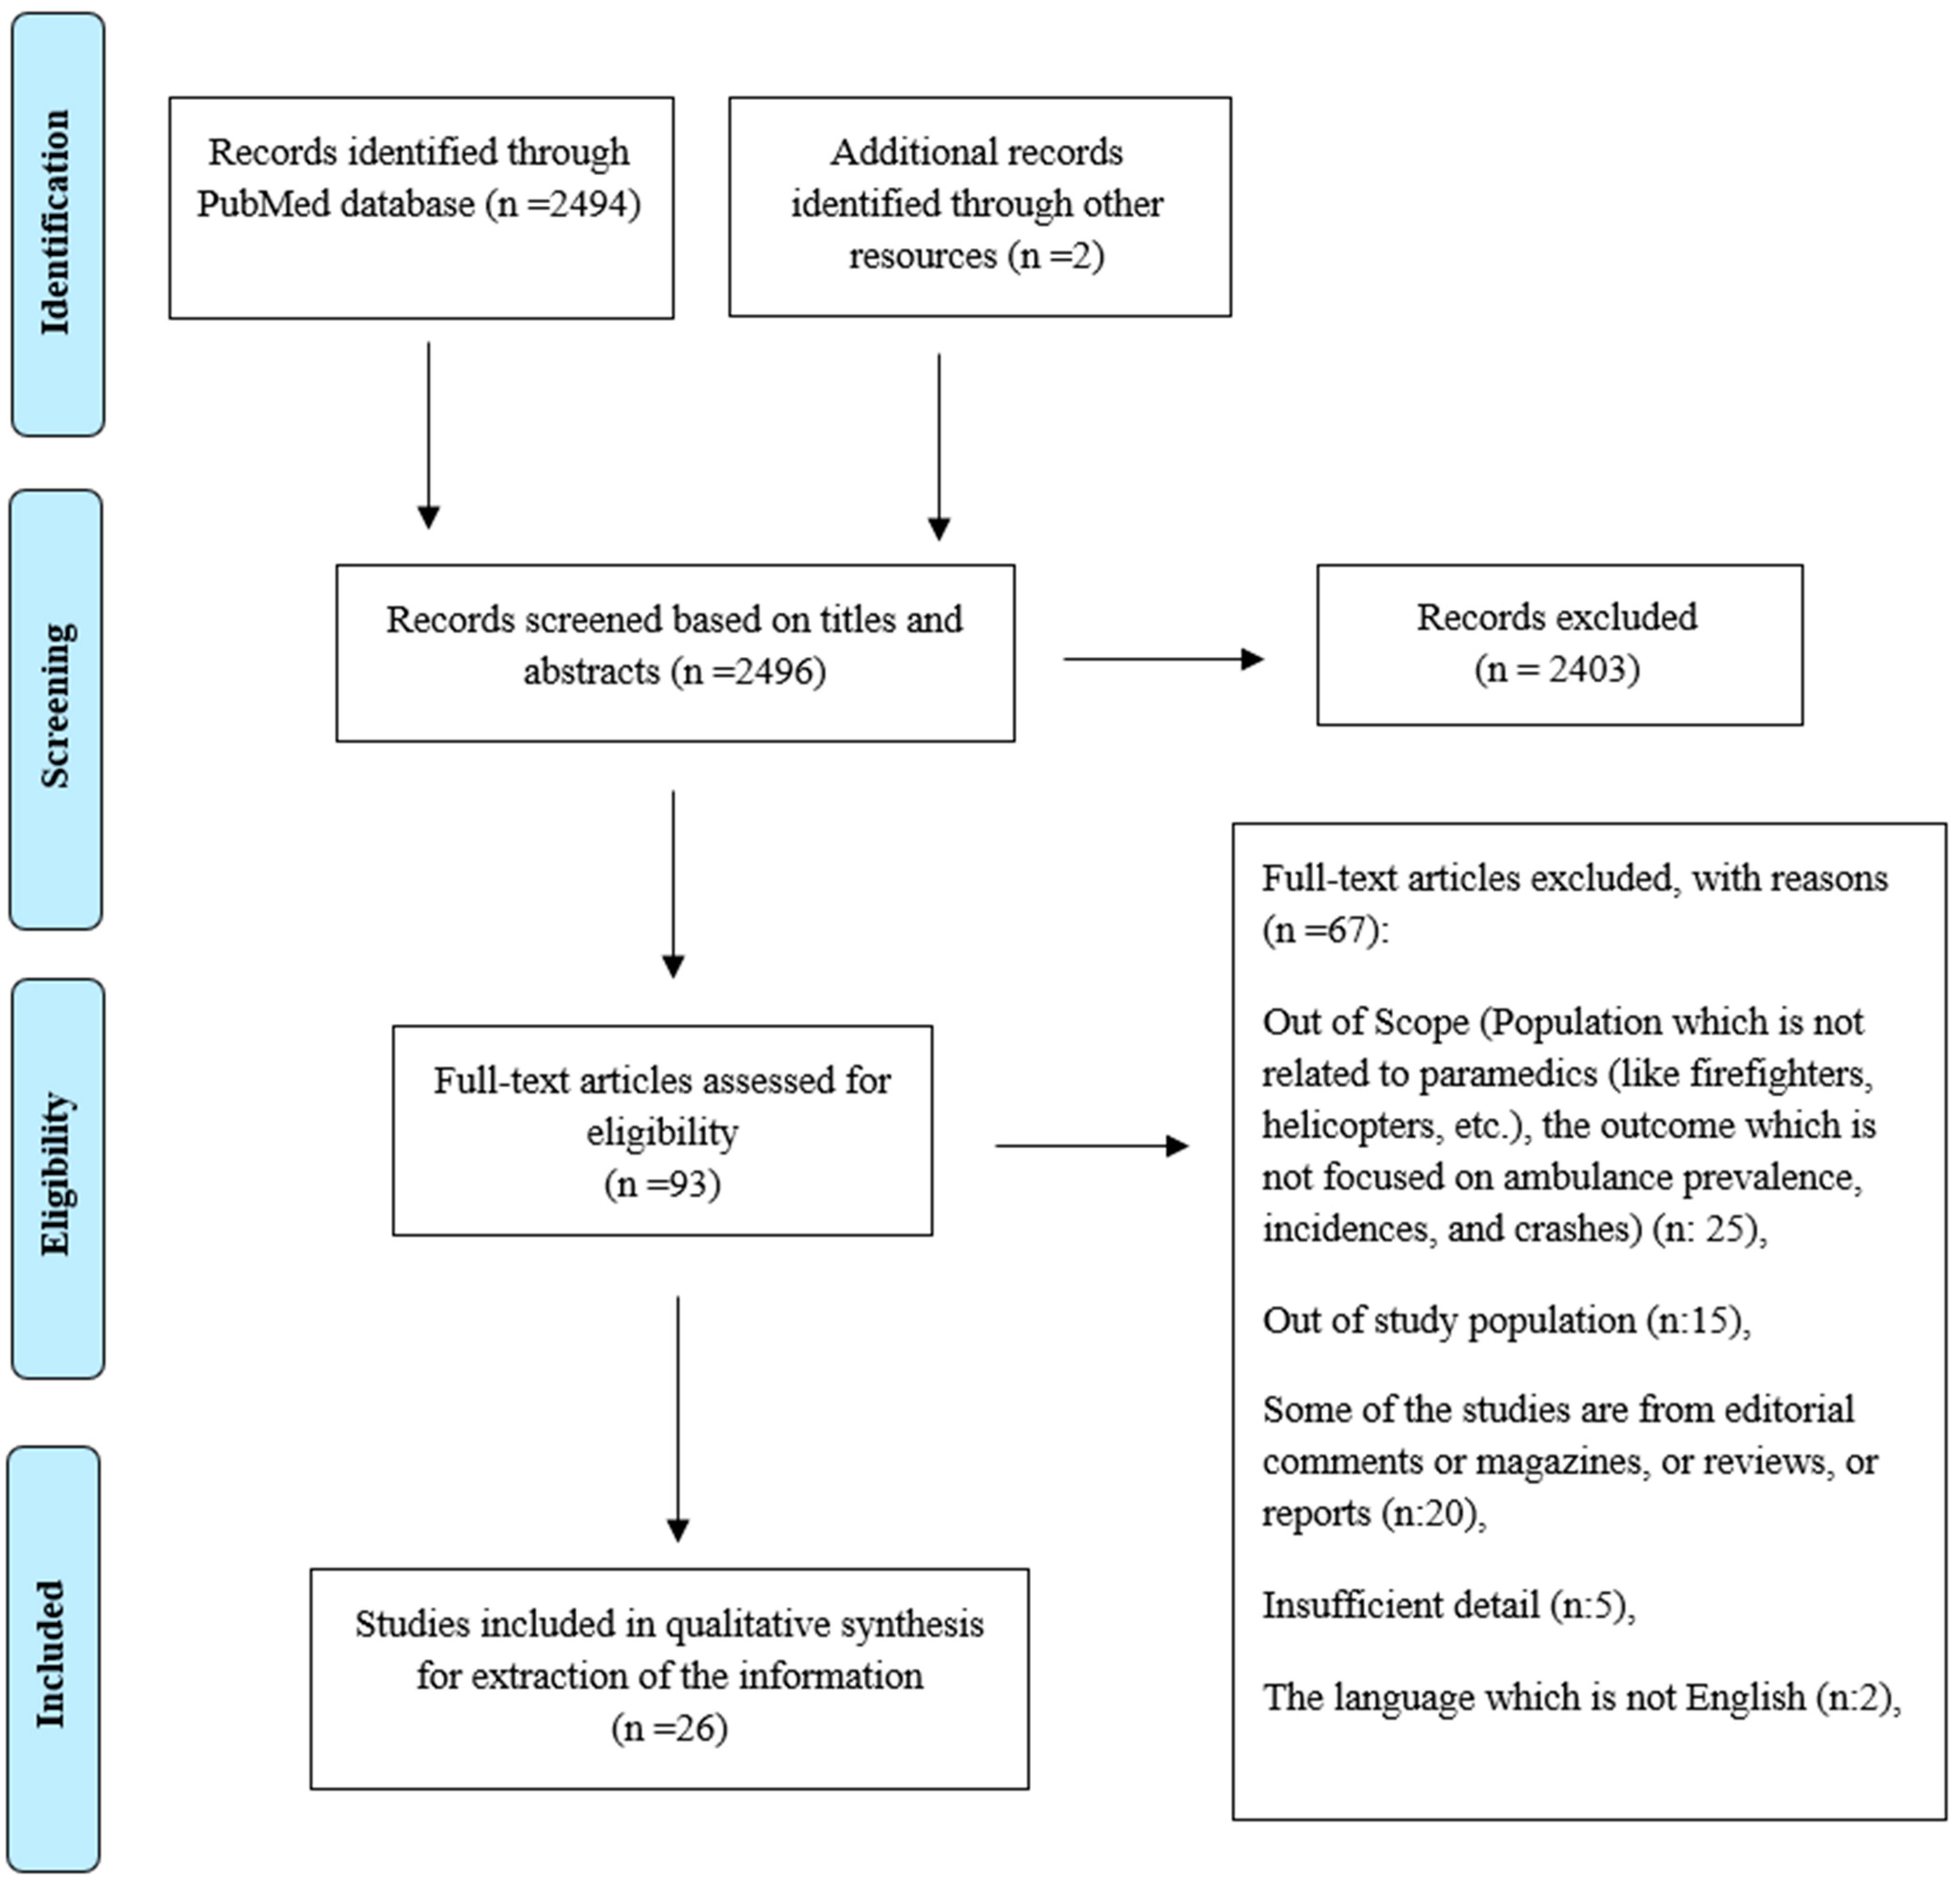
This systematic review was carried out through steps that are described below in Figure 1. In the first step of this review, we utilized the PubMed search engine, since it is a very comprehensive database of health-related subjects, developed by the National Library of Medicine [22]. Then, we defined keywords and the pattern of our search. The keywords were classified into two groups. The first group of words (ambulance, emergency service vehicle, emergency medical service vehicle, emergency medical vehicle, and emergency response) referred to the study population. The second group defined the outcome of interest (fatal, injury, crash, collision, traffic collision, incident). Any article that contained one or more words of each group in the abstract or the title was included only if it was published between January 1990 and July 2021. By these search patterns, 2494 papers were obtained from the PubMed search engine. In the second step, two independent reviewers blind-screened all identified papers by reading the above-mentioned 2494 titles and abstracts using independent Excel spreadsheets that were then compared for inclusion or exclusion of papers. If the paper’s relevance could not be determined with the title and abstract, the full text was carefully reviewed to ensure that it was aligned with our specific keywords. After this initial step, 93 papers were selected for a full read. In this third step, the two reviewers independently read all the papers and decided on the papers to be excluded or included. For deciding on the papers, the reviewers had five exclusion criteria adjusted to the scope of this systematic literature review (SLR). These exclusion criteria are listed below.
Figure 1.
Flow diagram of the paper selection process based on PRISMA.
The English version of the paper was not available (due to linguistics limitations).
Reviews, editorials, commentary articles as well as qualitative studies.
Target population of the study was not paramedics.
The outcome of the interest was not describing road safety, i.e., crashes, injuries, and road fatalities.
Insufficient detail of either population or outcome that prevented concluding whether it is completely relevant.
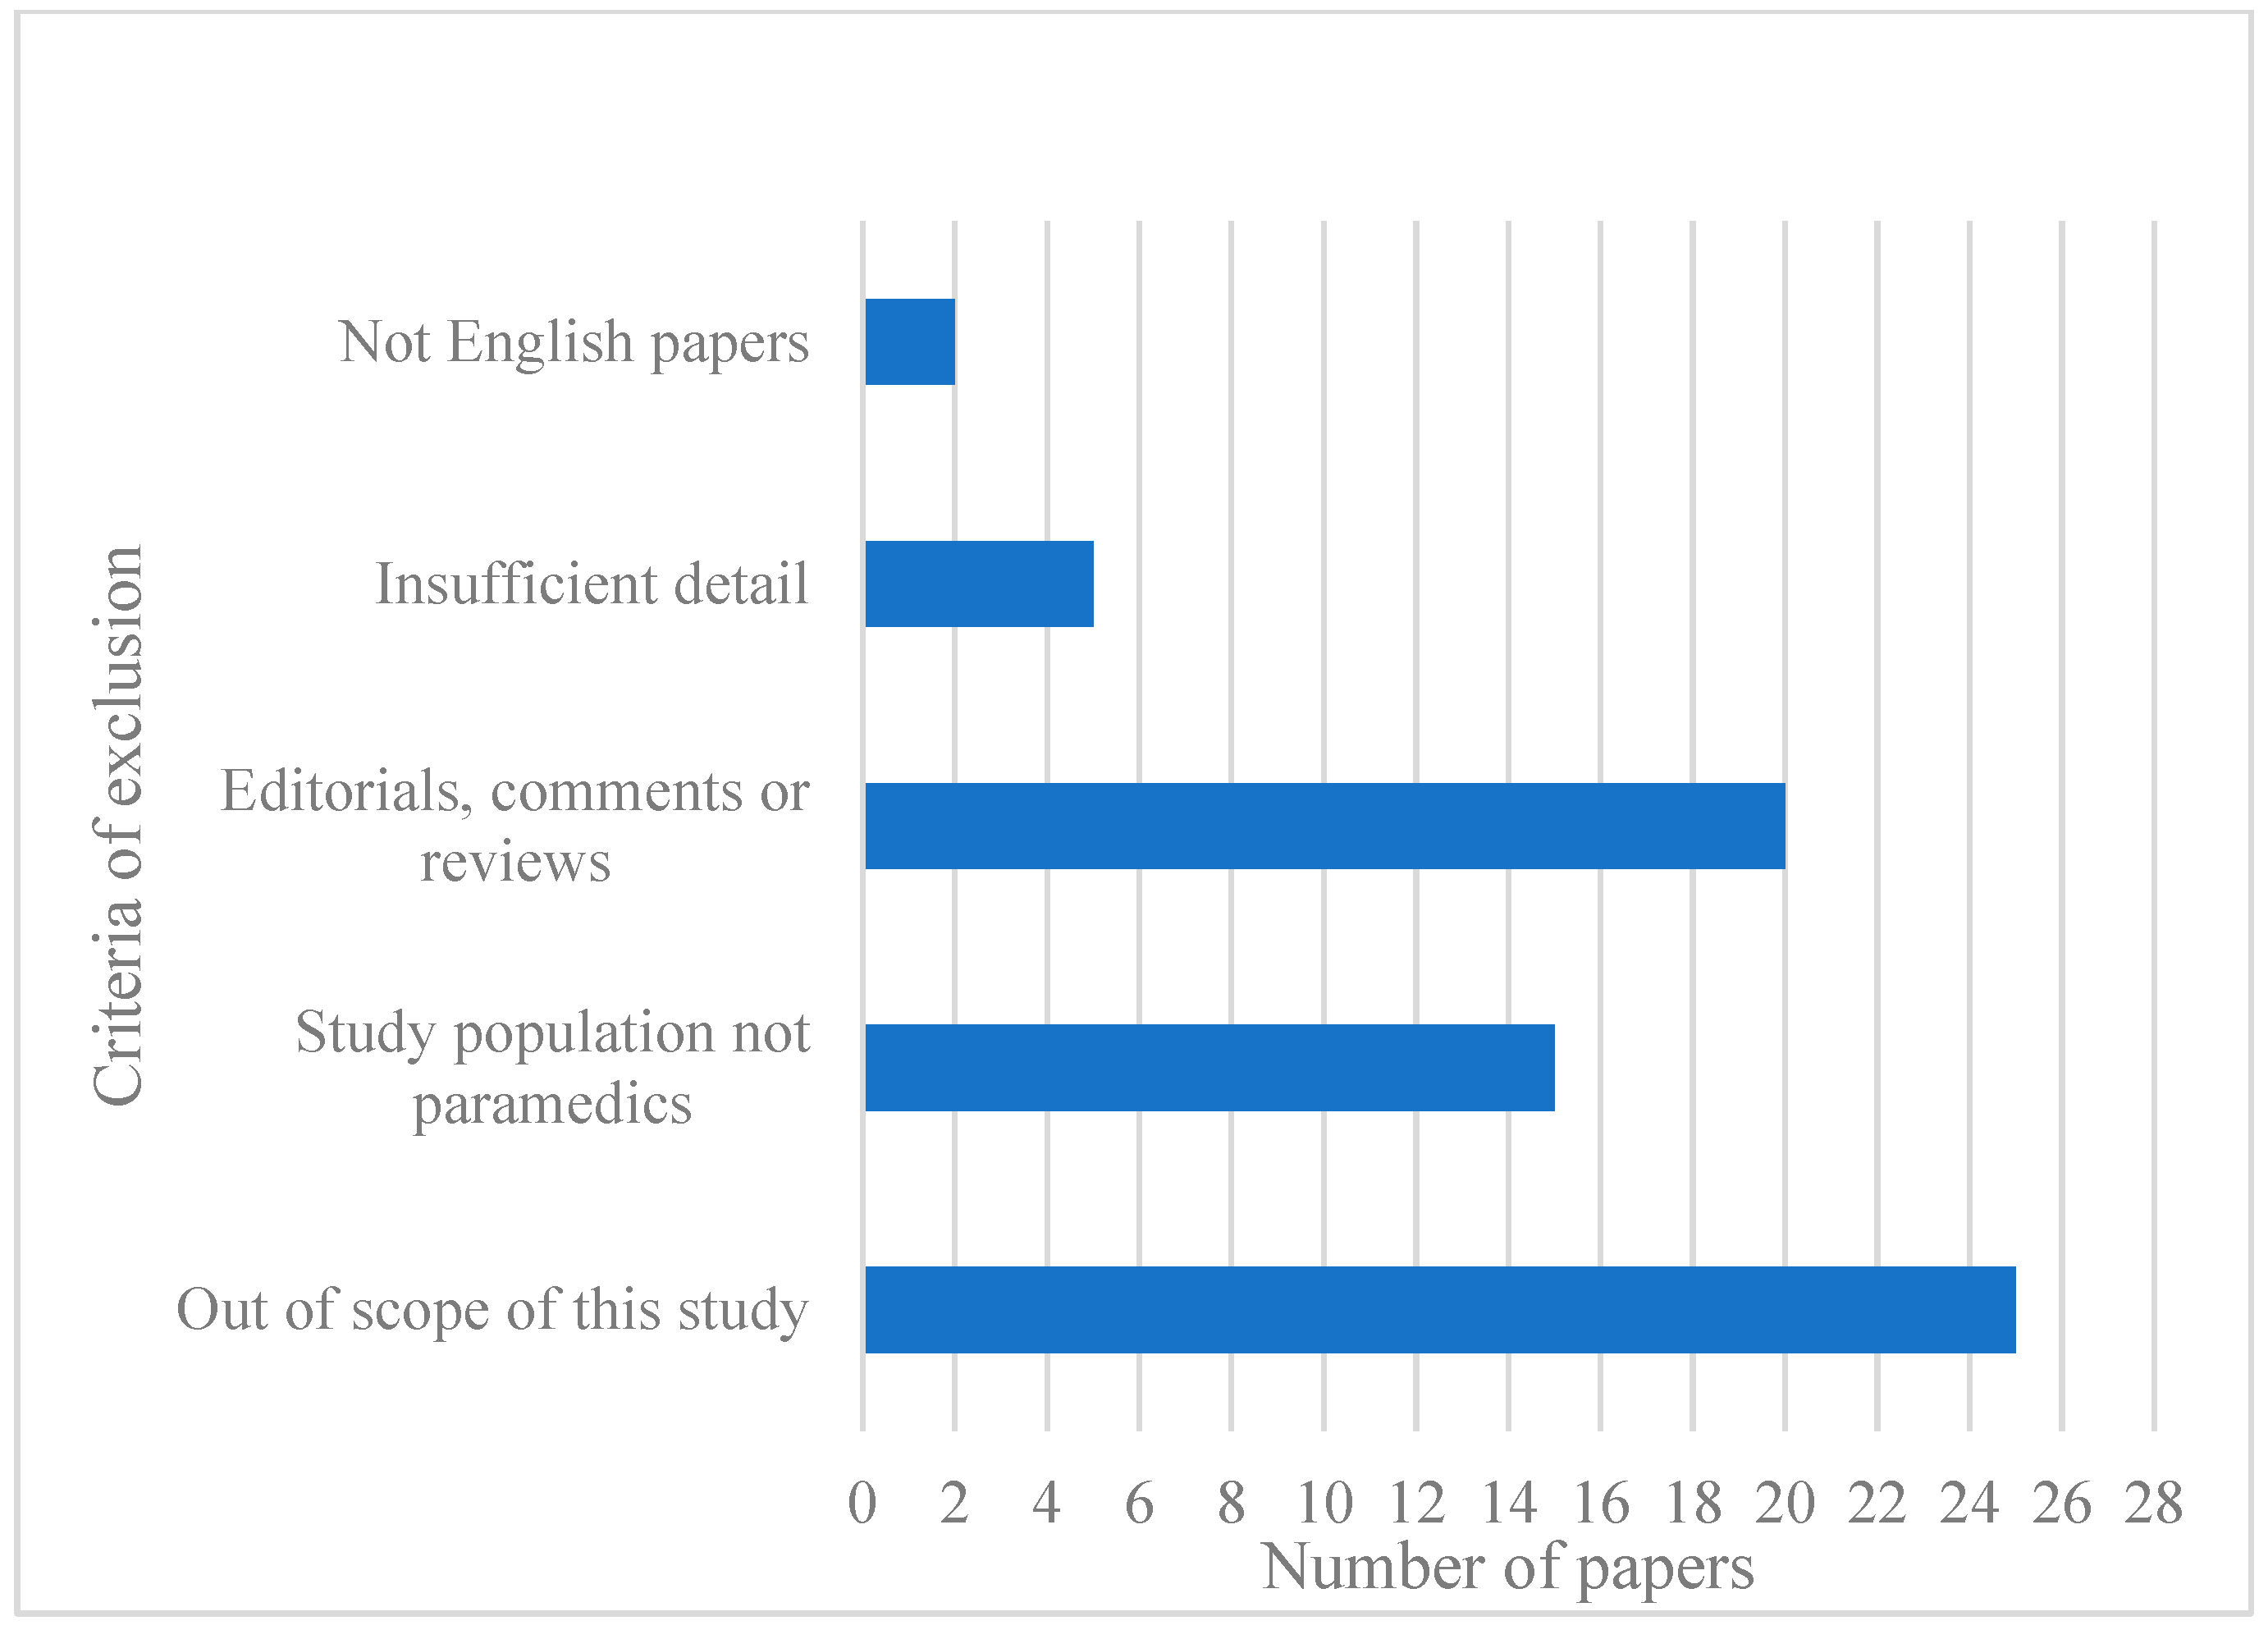
The number of papers excluded due to each of the criteria is presented in Figure 2. Finally, 24 papers were considered for the SLR. Of note, in the final step, while the reviewers read all the papers to decide on their relevancy, two other papers that were cited in the initial 24 papers were in the scope of this study and thus were kept for final analysis. Thereafter, all 26 papers were assessed by the QualSyst method formulated by [23]. Using this method, each of the reviewers gave a score to each paper based on 14 questions, i.e., a score between 0 and 1, with a score closer to 1 meaning higher quality of the paper. Table 1 provides a summary of the QualSyst scores assigned to the papers included in this study. These scores, which represent the average of the scores given by the two reviewers, indicate a high level of quality for the majority of the papers. As such, the results of these papers are likely to be considered a valuable contribution to their respective fields.
Figure 2.
The criteria of exclusion of the papers at step four.
Table 1.
Summary of papers included in the final review.
3. Results
The overall information of 26 papers included in the current study is shown in Table 1. This table summarizes these papers in different categories, consisting of authors’ names, the year, the title of the paper, the studied country, the method, e.g., statistical tools, studied period, and QualSyst scores (ranging from 0.55 to 0.98). Sixty-nine percent of studies (n = 18) occurred in the U.S. and descriptive analysis or statistics, e.g., mean, was used in 58% of them (n = 15).
Table 2 shows the percentage of studies using data from governmental institutions, private institutions, or public access or survey or questionnaire results in presenting the prevalence of ambulance collisions or explanatory variables such as drivers’ characteristics. It shows that most of our selected studies used data and, for instance, 58% of papers (out of 20) used datasets for showing the prevalence of collisions. This trend is also found for the independent variables.
Table 2.
Percentage of papers in desired categories.
Additionally, Table A1 in Appendix A provides additional details regarding the prevalence of ambulance collisions and the factors associated with them, as reported in the selected papers.
3.1. Prevalence of Collisions
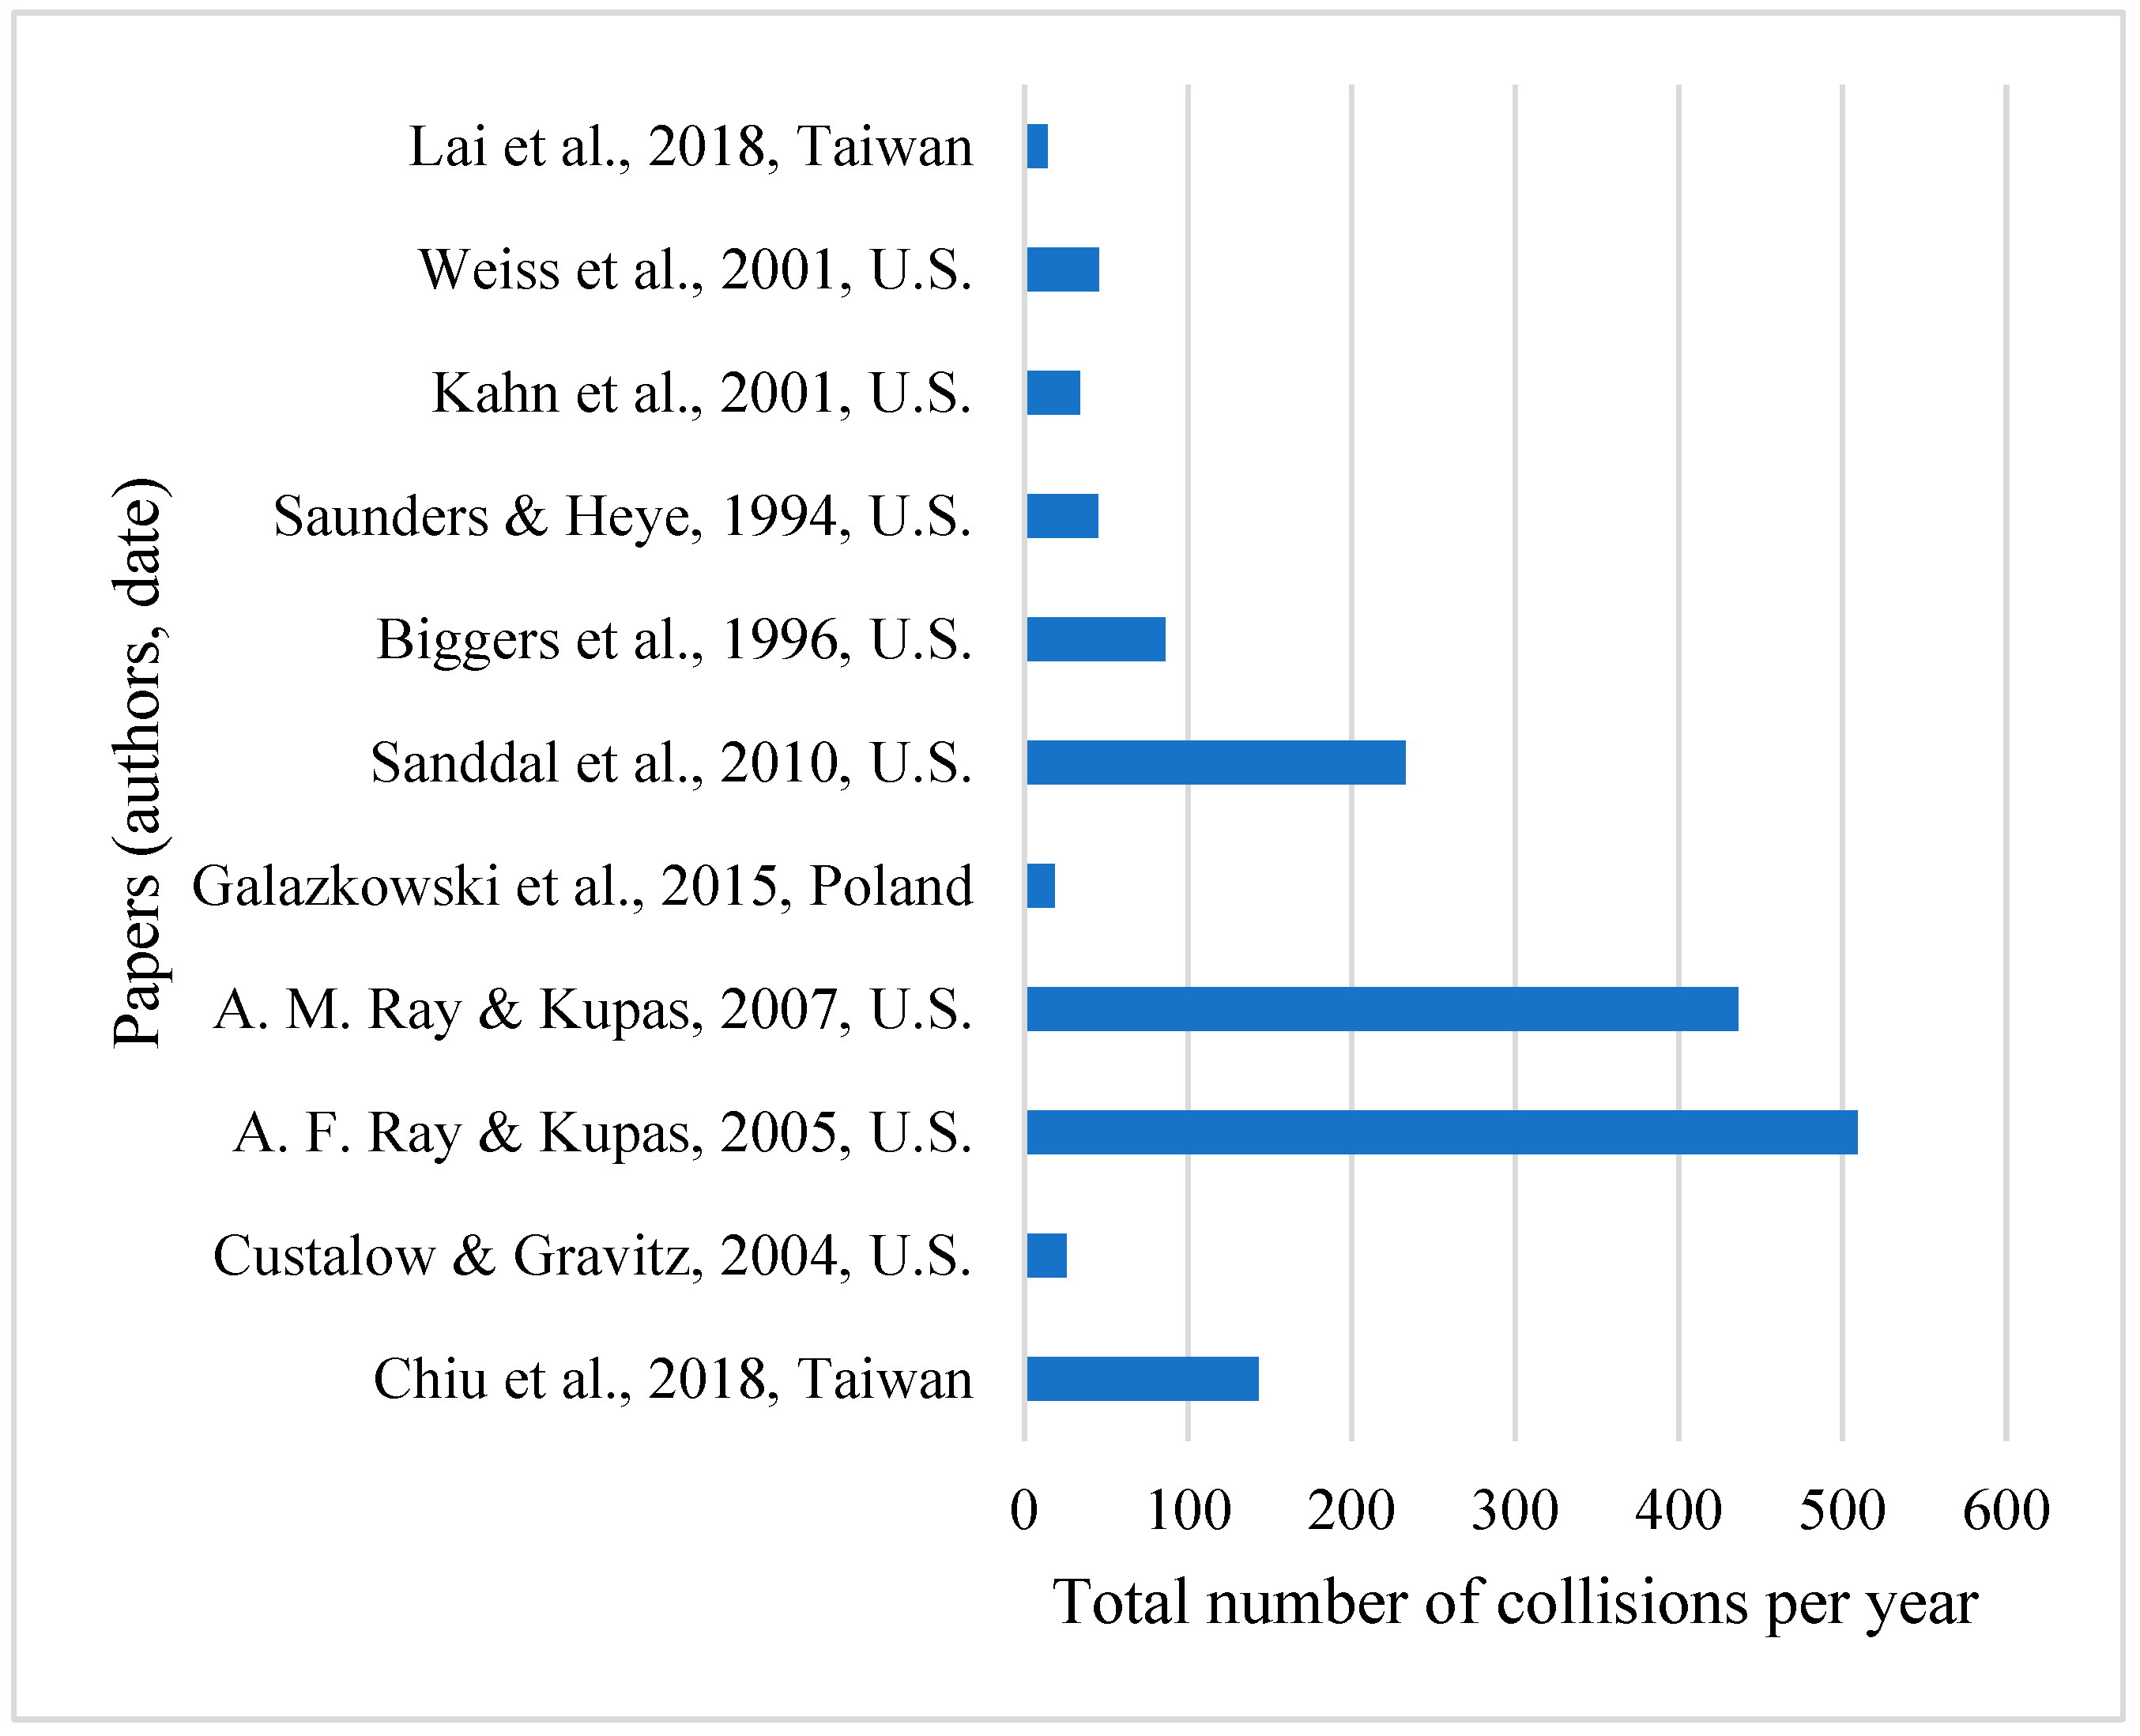
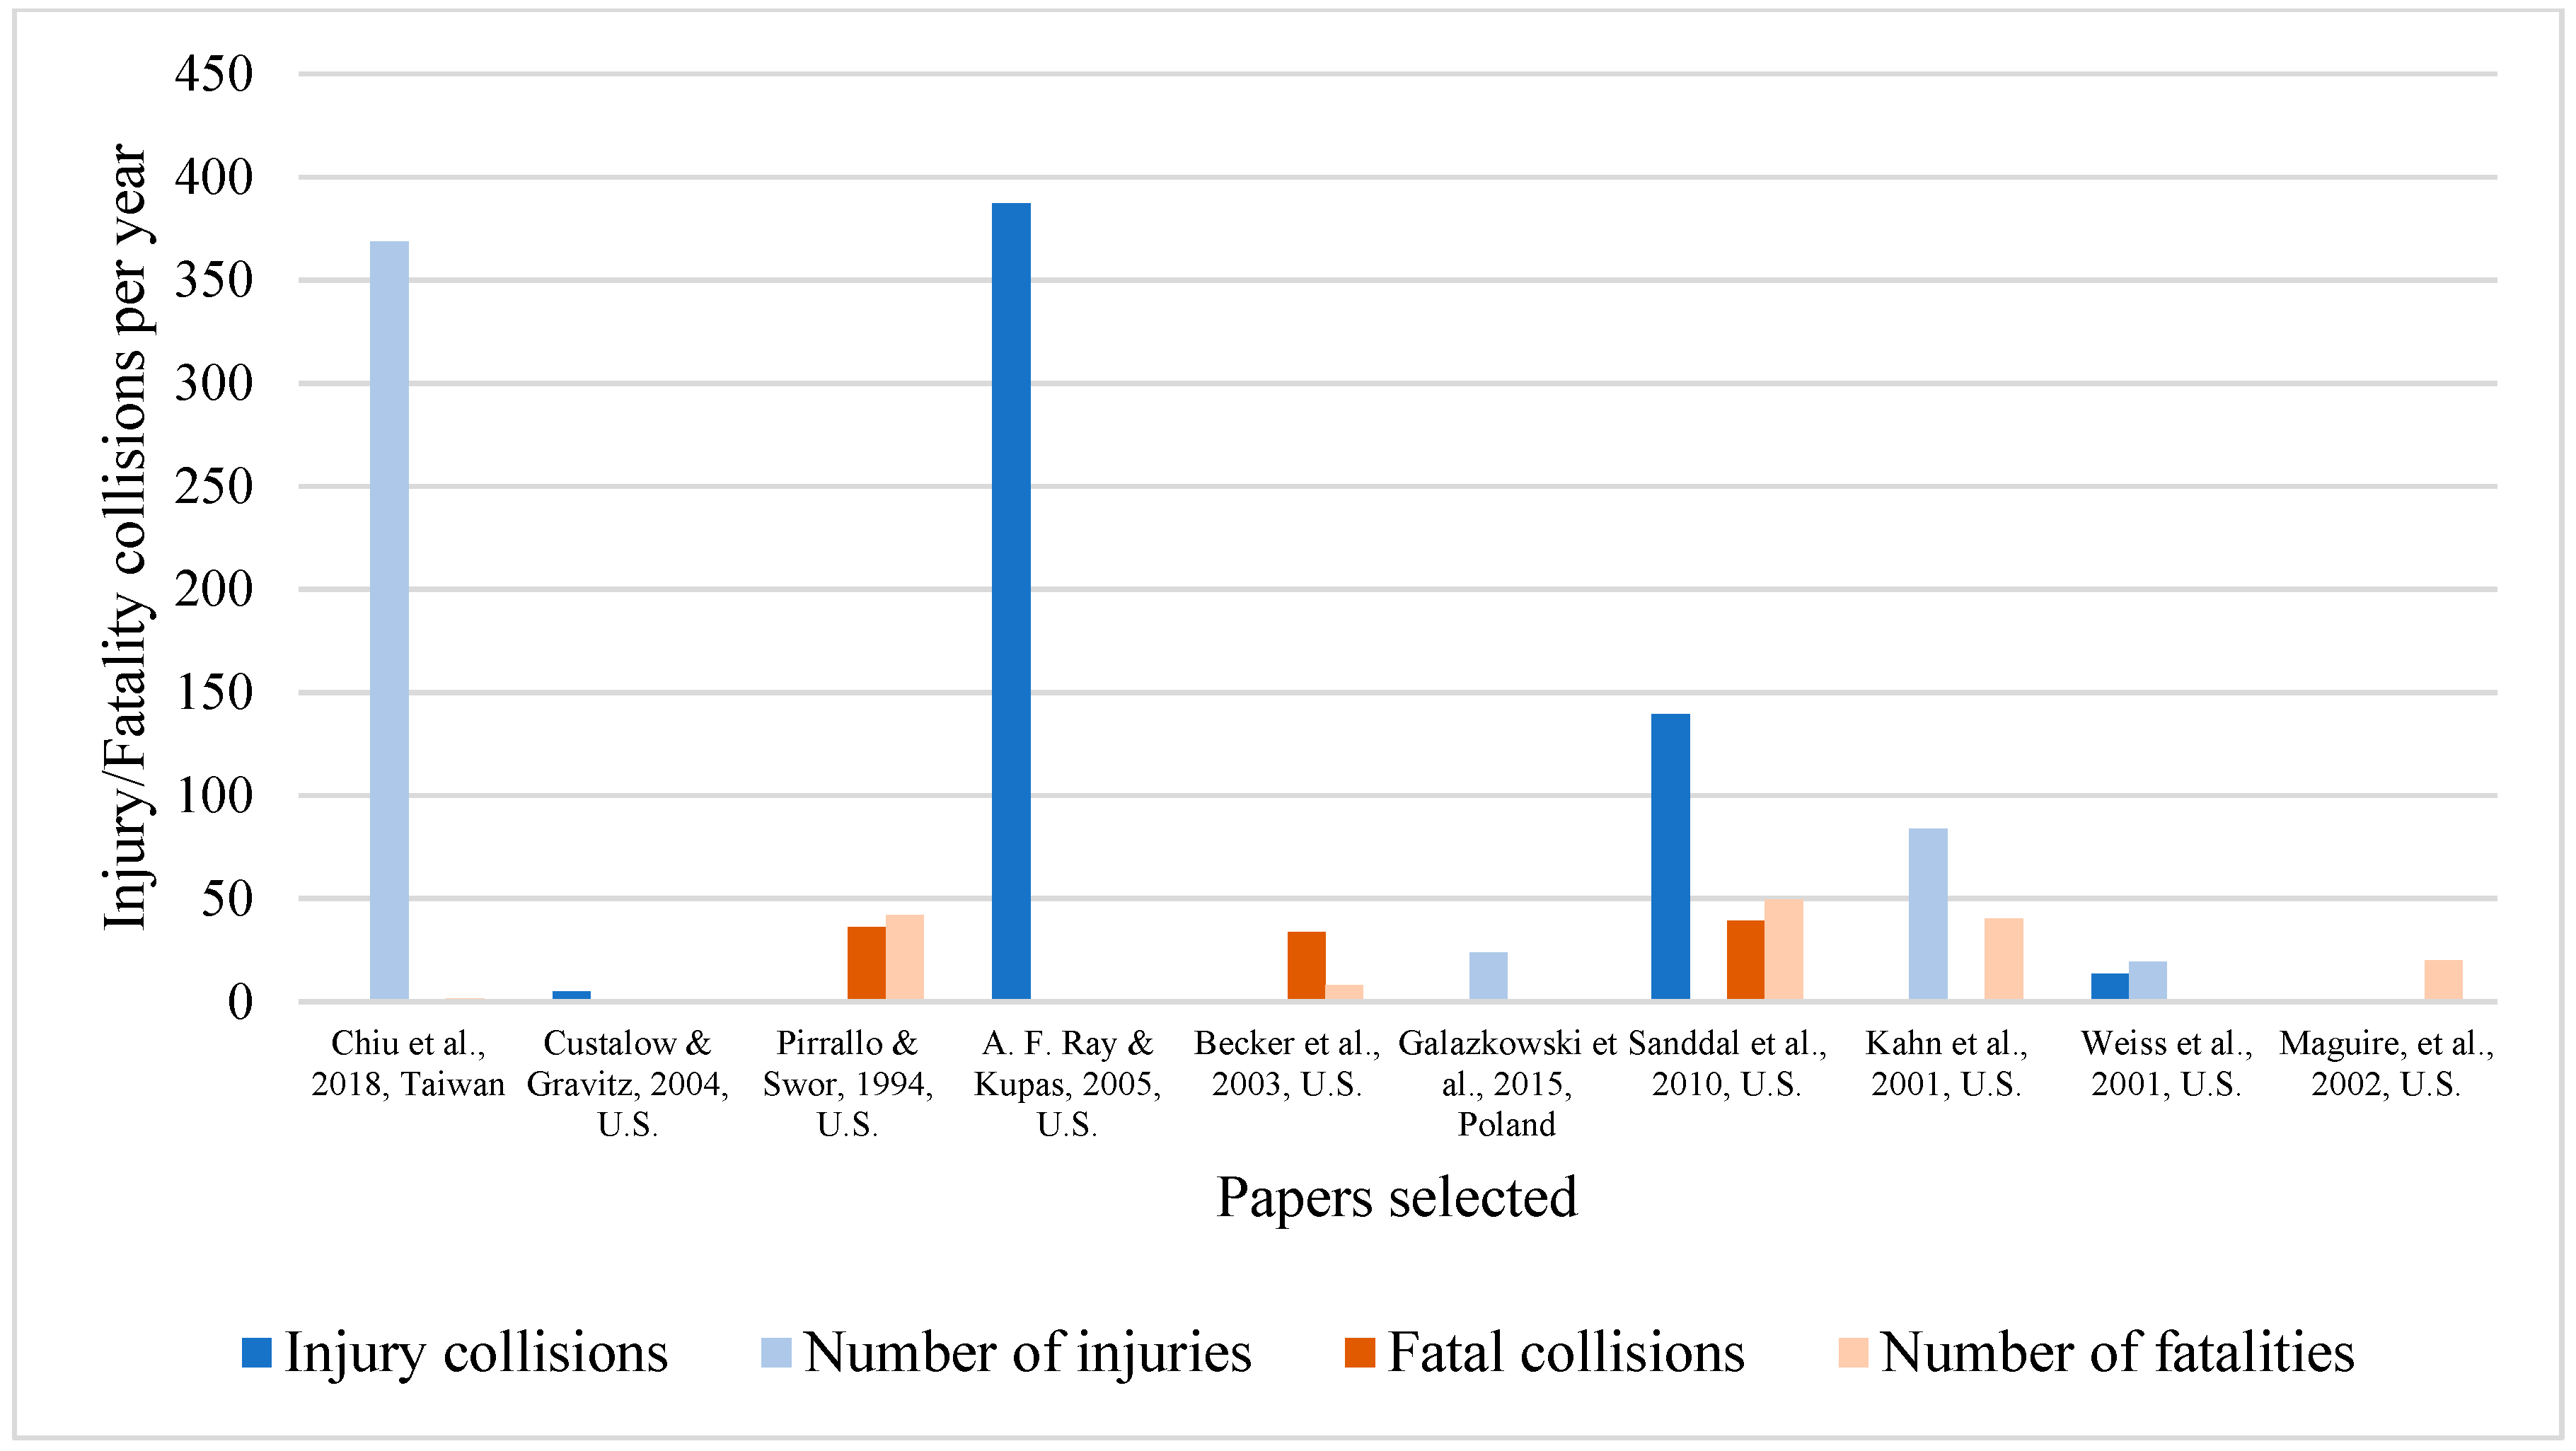
The number of reported collisions per year is shown in Figure 3. It shows that there is a yearly average of 144.6 collisions in the selected studies. The highest records are 509.5 and 436.25 from the studies of Ray and Kupas in 2005 [15] and 2007 [29] reported for ambulance collisions in the U.S., respectively. In Taiwan (n = 14) and Poland (n = 18.5), there is the lowest reported prevalence of collisions [30,36]. In addition, Figure 4 shows the number of injury-causing collisions, injured persons, fatal collisions, and deaths per year. Among the selected studies, 387.3 injury-causing collisions [15] and 368.8 injuries [11] are the highest records. In addition, the highest averages of 39.5 (49.5 deaths) and 36.3 (42 deaths) fatal collisions per year were presented by Sanddal et al. in 2010 [21] and Pirrallo and Swor in 1994 [25].
Figure 3.
Total number of ambulance collisions recorded per year in different studies [11,15,17,21,24,29,30,31,33,34,36].
Figure 4.
Number of injury-causing collisions, injured persons, fatal collisions, and deaths in different studies [11,15,21,24,25,27,30,33,34,41].
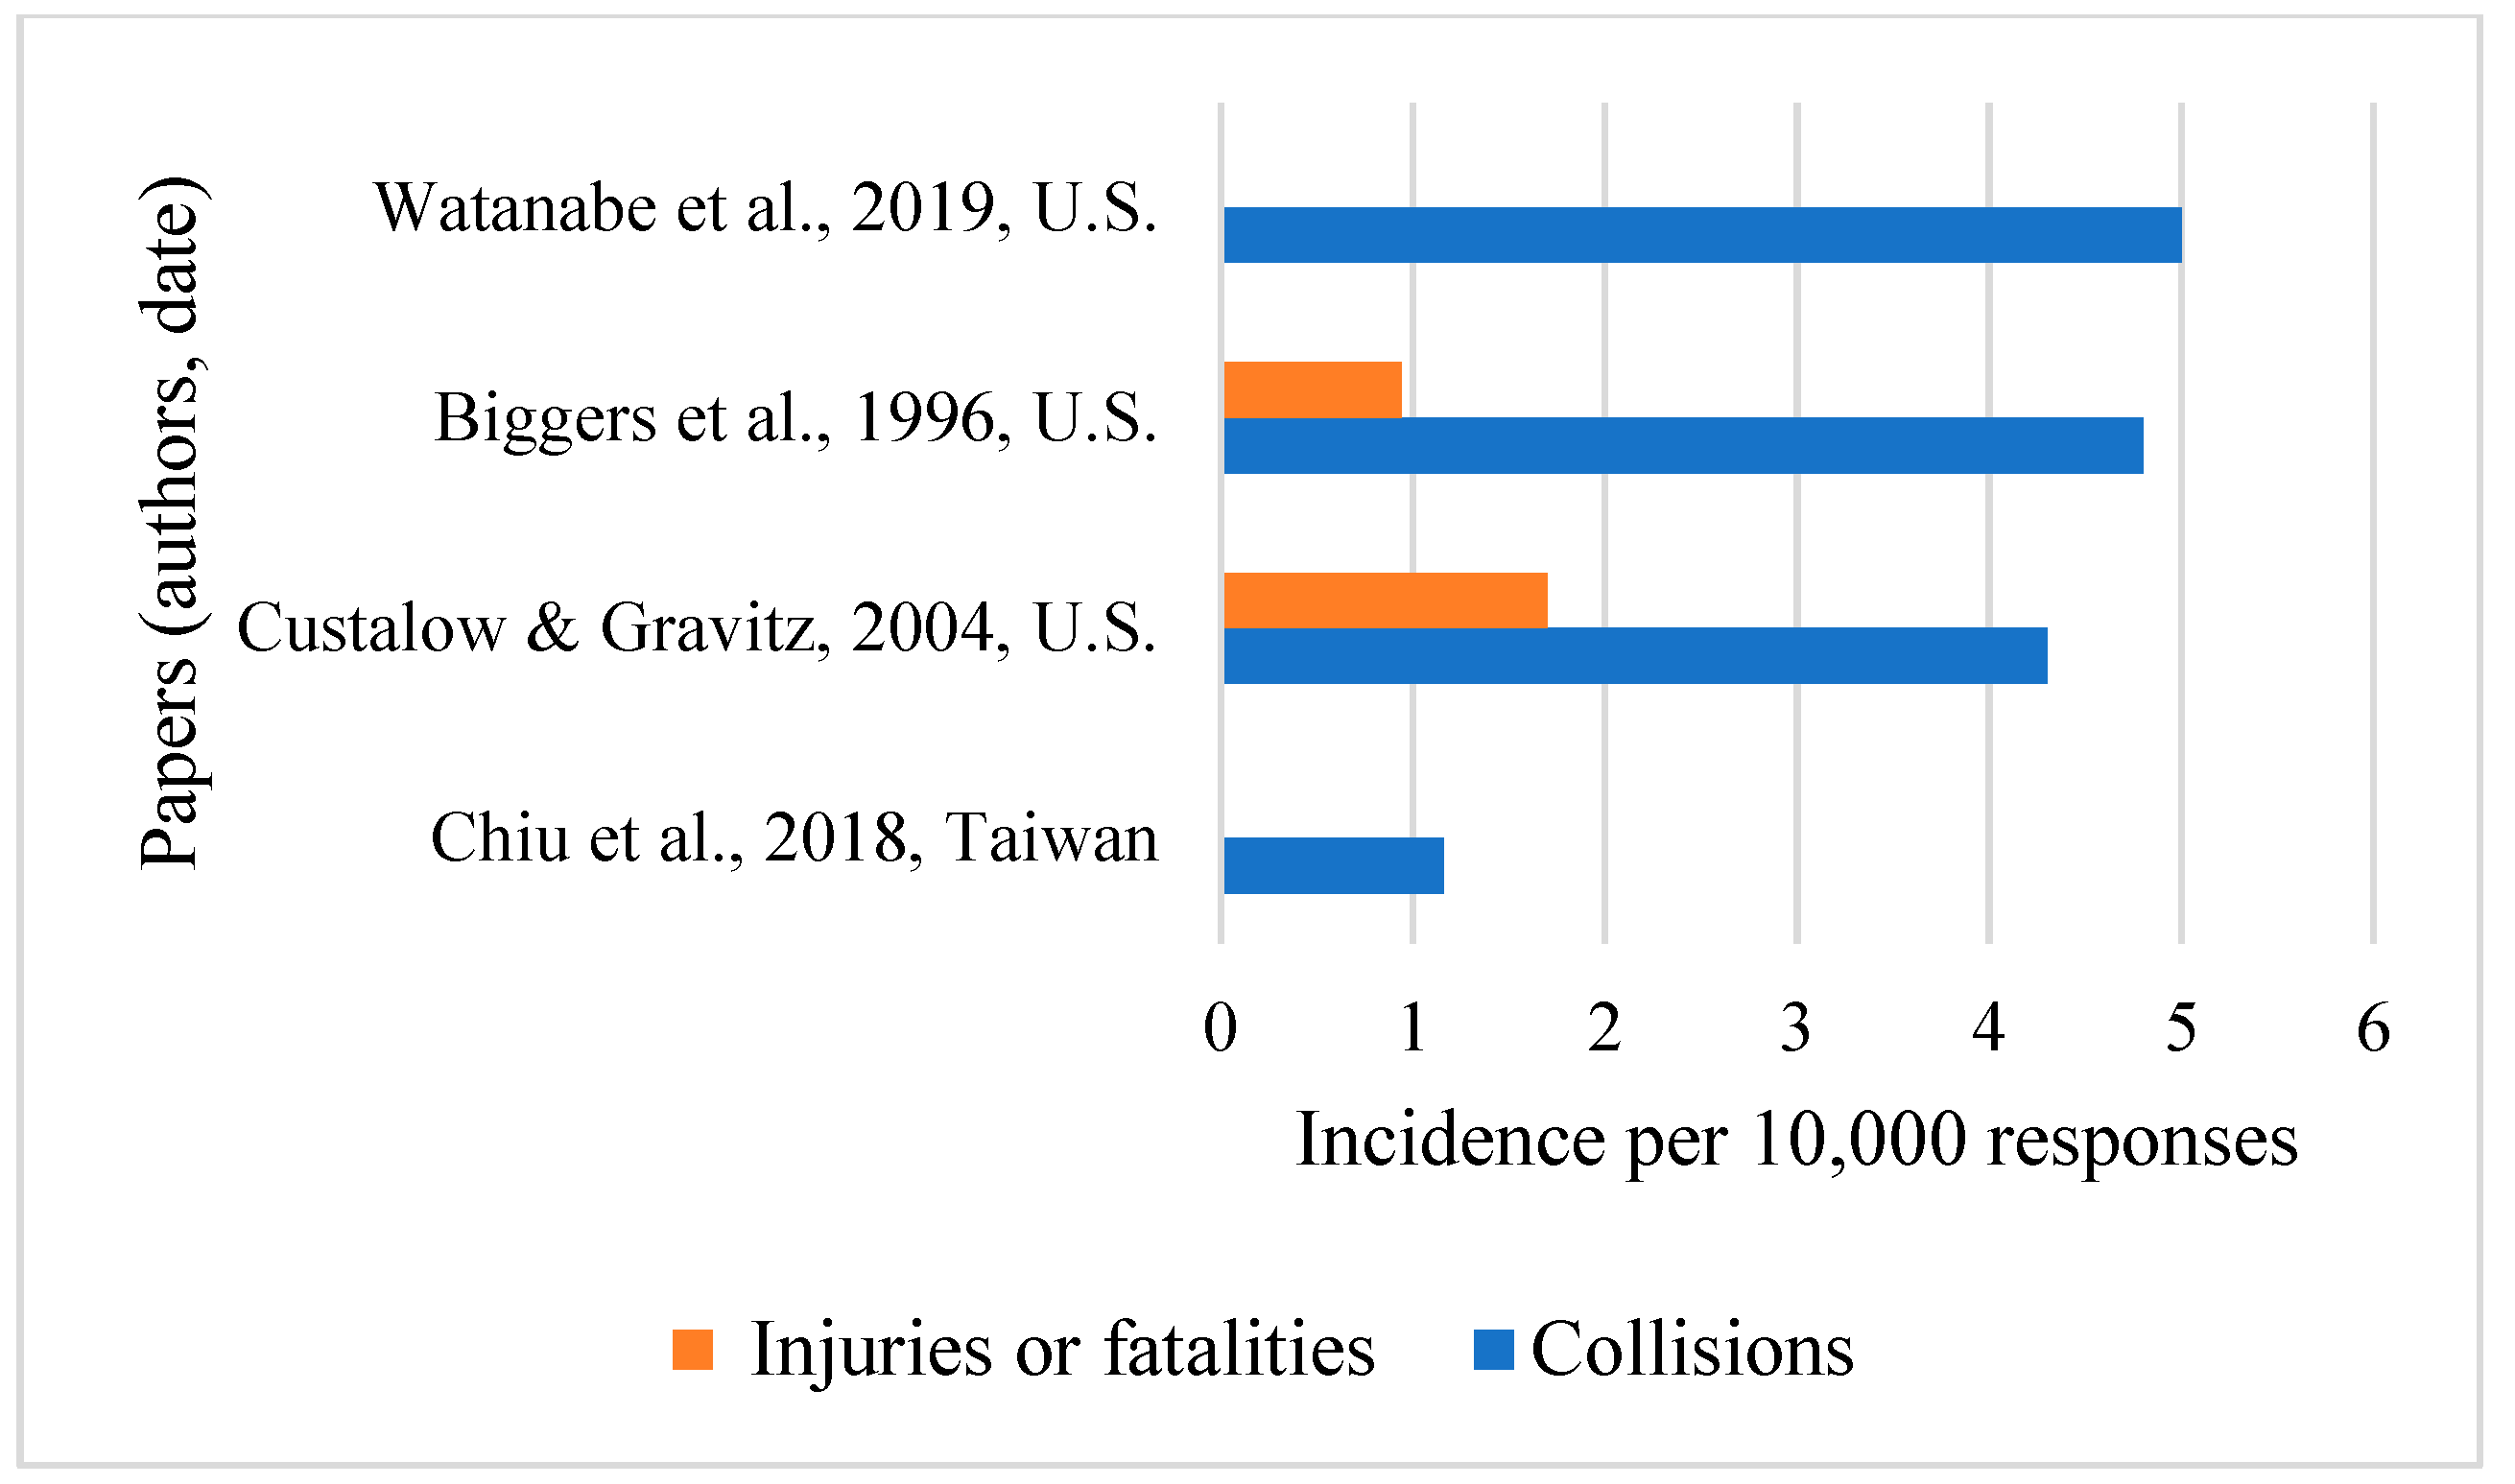
Two studies reported 1.7 injuries or fatalities and 0.94 injuries per 10,000 responses (see Figure 5) [24,31]. Additionally, the highest records of 5 and 4.8 collisions per 10,000 ambulance responses are given by [16] and [31], respectively. In addition, 13.3 ambulance collisions per 100,000 miles traveled occurred in the U.S. from June 1989 to August 1991 [17]. Seventy-three surveys found a mean of 0.82 per polled paramedic. Seventy-eight percent (57) of paramedics reported either being involved in a collision or witnessing at least one wake-effect collision [28].
Figure 5.
Incidence of collisions and injuries or fatalities per 100,000 ambulance responses in different studies [11,16,24,31].
3.2. Characteristics of Drivers
3.2.1. Age and Experience
In total, six papers reported the age characteristics of the study group. In three papers, the average age of ambulance drivers involved in collisions was between 30 and 35 years old [24,35,37]. One of the studies had a younger population, with an average age of under 30 years old [30], while another study had an average age of 47 for the group of paramedics they evaluated [40]. One paper mentioned that 25% of the emergency medical service (EMS) injuries were in those less than 25 years old [2]. A study by Studnek and Fernandez [37] also highlights that the likelihood of being involved in a collision increases with a decrease in the ambulance driver’s age. Only one study reported the experience of the ambulance drivers involved in the collisions with the minimal experience reported being 3 years and the maximum 12 years (average: 8.1 years) [28].
3.2.2. Sex
Four papers had details on the injuries or fatalities regarding the sex of the paramedic who drove. Although all these papers mentioned that, in the vast majority of the collisions (either fatal or injury), more males were involved, the percentage of them involved differs from 71% to 100% [11,24,30,35]. A study by Galazkowski and Binkowska [30] also mentioned that the trend of females involved in collisions increased from 2011 to 2012.
3.2.3. History of Collisions
Only three papers reviewed the history of collisions of the ambulance drivers. In one of these studies, the majority of the emergency drivers (more than 70%) had a history of multiple collisions [24]. Contrarily, in two other studies only 30% to 40% of the emergency drivers were involved in a collision more than once [31,33].
3.2.4. Traffic Citation
Six studies investigated the traffic citations related to ambulance drivers’ and civilian drivers’ interactions with each other and with road regulations on the roads. While EMS drivers are expected to follow all traffic regulations, they are also granted certain legal exemptions in emergency situations, such as speeding. In this regard, a study examining the behavior of EMS drivers found that they were more likely to commit some traffic violations when responding to an emergency call than when driving in non-emergency modes (88.2% vs. 11.8%, respectively) [25]. However, another study mentions that there is no difference between fatal emergency and non-emergency crashes according to traffic citations [33]. Two studies analyzed the percentage of ambulance collisions involving civilian drivers who received traffic citations. However, the studies reported different numbers (8% (n = 39) vs. 88.8% (n = 16)), possibly due to differences in data sources [21,31]. It is highlighted in another study that impaired civilian drivers increase the odds ratio of injury collisions by 6.1 [24]. Moreover, the study by Weiss [34] shows that both ambulance and civilian drivers are cited more often in urban areas than in rural areas.
3.2.5. Seat Belts
Six papers studied seat belt use of emergency drivers, as it is one of the most important surrogate measures of road safety. The results of four papers strongly confirm that while seat belt use is widely accepted by the occupants of the front seats of the ambulance, i.e., the drivers, in most cases, it is often neglected by the occupants of the rear seats, i.e., patients or EMS personnel [26,32,35,38]. This is mainly because the seat belt restricts the movements of the occupants and prevents them from doing their tasks, as mentioned in the study of Fournier [32]. Furthermore, one study shows that the rear compartment has increased odds of incapacitating and fatal injuries of 2.7 (95% CI 2.0–3.7) compared to the front seat. Moreover, unrestrained occupants have increased odds of incapacitating and fatal injuries of 2.5 (95% CI 1.8–3.6) compared to those who are properly restrained. Unrestrained rear occupants have increased odds of incapacitating and fatal injuries of 2.8 (95% CI 1.8–4.2) compared to unrestrained front occupants [33]. The study by Weiss [34] shows that those who did not use seat belts had more injuries in rural areas compared to urban areas. Fortunately, the frequency of using a seat belt for the front seat for work-related and non-work-related trips, from 2002 to 2008, increased by 15.1% and 10%, respectively [26].
3.2.6. Liability of Collision
Four papers investigated the liability of ambulance collisions. Three papers confirmed that in the minority of the cases, ambulance drivers are responsible for the collisions. The percentage of ambulance drivers liable for collisions varies from 6% to 48.9% [17,21,31]. However, the study by Saunders and Heye [17] found that ambulance drivers were responsible for 67% of collisions during unsafe backing up or reversing due to limited visibility. Moreover, the use of lights and sirens is often cited as a reason for drivers colliding with ambulances. When these warning devices are activated, drivers more frequently fail to yield the right of way to the ambulance compared to cases of inattention. Surprisingly, when ambulances use lights and sirens, inattention increases while failure to yield decreases [17].
3.3. Collision Characteristics
3.3.1. Time of Day/Day of the Week
The timeline of the collisions was a topic that was frequently discussed in the papers included in our study, since 10 papers worked on the daily, weekly, or monthly variances of the collisions. The most agreed upon result is the higher frequency of collisions in the afternoon (after 12 noon), rather than in other periods of the day, which is concluded in three studies [11,21,33]. This is not in line with two studies in which the result shows that the frequency of the collisions is highest in the evening [15,36].
Five papers also found no significant difference between weekdays and weekends, considering the frequency of the collisions [29,30,31,33,34]. However, three papers had results showing significant variations in the week. The first one concluded that collisions are more frequent on the weekends [15]. The second one, though, found the highest frequency on Saturdays and Mondays [25], while the last one found that the most collisions happen on Fridays [31].
Only one study evaluated monthly variations in ambulance collisions. This study shows that although there is no statistical difference (p = 0.201) between monthly variations, January, May, and December had more collisions compared to other months [21].
3.3.2. Type of Collision
Eight studies analyzed the type of maneuvers that lead to the collisions. Although many of the studies had similar approaches in reviewing maneuvers and vehicles’ movements before collisions, it is agreed by three papers that angle collisions are the most frequent in urban areas [15,25,29]. Another study showed that EMS vehicles experience 33% of their collisions while moving forward and only 17% while turning [17]. Given that angle crashes are the most common type of collision, the fact that ambulances are involved in only 17% of these incidents when turning suggests that they are not the primary cause of such collisions. The study of Biggers and Zachariah [31] showed that a frequent type of collision for ambulances is when they are hit in the back. Furthermore, there is evidence that ambulances were struck by another vehicle more frequently than they struck other vehicles (45% vs. 32%) [21]. However, this study also mentions that 14% of ambulance collisions at intersections are rollovers, which implies the high speed of ambulances. Results from Ersoy [40] also showed that, after collisions between two vehicles, rollover is the most frequent type of ambulance collision (57.14% vs. 19.05%).
Two studies compared the differences between rural and urban EMS collisions; the first study shows that rural ambulances were significantly more likely to have an impact at the front while urban ambulances were more likely to have back-end collisions. There is an equal chance to be impacted on the side in rural and urban areas [34]. The second one stated that angle collisions are the most frequent collision type in urban areas (54%), whereas striking a fixed object is the most frequent one in rural areas (33%) [29].
3.3.3. Transportation Mode
Six studies looked into the modes of transportation involved in ambulance collisions. Four studies’ results confirm that non-motorized road users such as pedestrians and bicyclists are less likely to be involved in these collisions. The percentage of collisions between non-motorized road users and ambulances varies around 15.6% and 9% for bicyclists and pedestrians, respectively [25,33]. Two other studies have shown that less than 5% of collisions involve pedestrians [15,29]. Conversely, motorcycles have very concerning situations regarding their collisions with ambulances. There is evidence that motorcycles are involved in the majority of ambulance collisions (63.6%) and this becomes worse in terms of fatal collisions specifically (88.9%) [11]. Another study also claims that in only half of ambulance collisions is another vehicle involved [4]. The study of Ray and Kupas [29] compared the modes involved in rural and urban areas. The results say that a collision involving more than one vehicle (88% vs. 56%, p < 0.0001) and more than four people (35% vs. 23%, p < 0.0001) is more likely in urban compared to rural areas.
3.3.4. Type of Environment
Eleven papers (42%) considered the environments of the EMS collisions. Many studies’ results in this section had a great consistency, and it increases the importance and reliability of the results on this subject. In four studies, it was concluded that EMS collisions are more likely to happen in urban areas than rural areas [11,21,34,36] while there is weak evidence that more collisions happened outside of cities [40]. In addition, it is found that operator errors in urban areas are more common than in rural areas (93% vs. 75%, respectively) [29]. It is worth mentioning that one study’s result denies any difference between urban and rural EMS collisions in terms of their severity [29]. Seven papers also addressed intersections as the most dangerous part of urban areas for EMS vehicles [11,15,21,24,29,33,36] while one paper disagreed with this [31]. Another study interestingly reveals that although the majority of ambulance collisions happened on urban streets, a considerable portion (i.e., 20.8%) of these collisions took place in parking lots or at hospitals. Conversely, freeway collisions show a negligible percentage in this study (0.7%) [17]. However, the study of Ersoy [40] disagrees with there being a negligible portion of ambulance collisions on highways (66%).
3.4. Weather Conditions
Five papers considered weather variables associated with the frequency of collisions. Four papers strongly confirmed that most of the collisions happen in clear weather (ranging from 68% to 77%). However, the percentages of collisions that happen in adverse conditions are also calculated. Snowy weather conditions cover 5% to 13% of the collisions in two different studies in the U.S. [24,29]. Rain or light precipitation is associated with 3.7% of the collisions [17]. Two studies reported the percentage of collisions that happen at night and this is between 25% and 28.1% [17,29]. There is weak evidence that weather conditions that lead to a slippery or icy surface (i.e., snow or rain in a certain range of temperatures) are more dangerous than those causing decreased visibility such as rain or fog [21].
3.5. Response Mode/Lights and Sirens
The variable most frequently investigated in all the papers identified is the use of lights and sirens. This shows the prominence and importance of this variable in the collisions of EMS vehicles. Several studies support the assumption that the majority of collisions involving emergency medical services (EMSs) occur when the ambulance is using lights and sirens [21,24,39] or responding to a call, i.e., either going to the scene or caring for the patient on the way to hospital and during emergency use [21,25,33,35]. On the contrary, three papers found that there is no significant difference in the frequency or the severity of ambulance collisions in or out of emergency mode [17,27,30,31].
4. Discussion
Most (58.7%) fatal ambulance crashes resulted in the disabling of the ambulance, requiring towing of the vehicle (90.4%) [25]. Such major damage shows that the risk of being involved in collisions for paramedics and ambulance occupants cannot be ignored. Bentley and Levine [26] found that the percentage of “excellent” health in paramedics decreased from 1999 to 2008 (38.5% vs. 32.2%, respectively). Moreover, Sterud et al. [42] noticed that the frequency of health problems among ambulance drivers is greater in comparison to that of the broader working population. Sleeping problems (20–27%), back problems (20–24%), and hearing problems (7–10%) are among the top health issues. Regarding sleepiness, 8.0% of ambulance drivers faced difficulty in driving for short distances and 17.5% for long distances. Additionally, Studnek and Fernandez [37] noticed that emergency medical service professionals with sleep problems were more likely to be involved in a crash than those who did not face this problem (14.9% vs. 7.5%, respectively). According to the importance of ambulance safety, the current study compares the prevalence of paramedics’ crashes in different locations and times as well as investigates the factors surrounding such events.
Characteristics of drivers played an important role in the safety of emergency medical services. In this regard, male, younger (male and female around 30 years old), and paramedics with low experience in driving an ambulance may be more at risk of traffic collisions in comparison with their counterparts. The history of collisions and traffic violations, including failure to yield the right of way and not wearing a seat belt, was a significant factor in determining the probability of being responsible for a collision and predicting the severity of collisions for both paramedics and non-emergency drivers.
Regarding collision characteristics, angle collisions are the most common type of collision, particularly in urban areas. Additionally, the timing of collisions varies throughout the day and week, with most studies indicating a higher frequency in the afternoon, but some finding the highest frequency in the evening. While five papers found no significant difference between weekdays and weekends, three papers had conflicting results on which days had the most collisions (see Appendix A for further details). According to the type of environment, ambulance collisions are more likely to occur in urban areas, particularly at intersections, compared to rural areas. A study conducted by Wiwekananda et al. [43] supports this finding and highlights the significant effect of intersections on ambulance crashes and delays.
There is no statistical difference between the use of different response modes (emergency and non-emergency) among years of manufacture of the vehicles [25]. However, being in emergency mode and using warning lights and sirens (WLSs) in ambulances has been shown to increase the probability of being involved in crashes.
Exposure variables such as kilometers driven were not accessible for all the selected studies which made it difficult to compare and evaluate the prevalence of ambulance collisions. In addition, although several studies have indicated that civilian drivers are more often responsible for collisions than ambulance drivers [21,31], no literature has evaluated human errors focusing specifically on such drivers in a simulated environment. To address this gap, future research could design scenarios to investigate the role of exposure variables or civilian drivers in ambulance collisions, such as driver distraction or non-compliance with traffic laws. This would help in enhancing our comprehension of factors involved in ambulance collisions and develop strategies to prevent them in the future.
This study faced difficulty in obtaining the data in all selected papers to run a quantitative analysis. As a result, it was not feasible to quantify the effect of explanatory variables (e.g., age or experience of drivers) on the number of ambulance collisions. Moreover, comparing the selected studies posed a challenge due to factors such as varying sample sizes across studies. To address these issues, we suggest that further investigation (e.g., quantitative analysis) is needed to analyze the data that come from studies chosen by the QualSyst method. This approach quantifies the effect of factors involved in ambulance collisions from selected studies.
The research underscores the importance of ensuring ambulance safety and highlights the risks faced by paramedics and other occupants. Specifically, the study highlights factors that contribute to ambulance collisions, including the use of WLSs and hazardous locations such as intersections in urban settings. It is recommended to determine the effect of other variables, such as driver distraction or failure to follow traffic laws, in ambulance collisions involving civilian drivers. The traffic regulations in urban areas, especially at intersections, should consider the potential hazards for ambulance operations. This could include measures such as giving ambulance vehicles the right of way or changing traffic signals to green during emergencies. Additionally, targeted training programs should be implemented for specific groups such as inexperienced young paramedics or those with a history of collisions or traffic violations, in order to decrease the occurrence of collisions. By identifying the risk factors, the study offers valuable insights that can be used to promote greater attention to ambulance safety and by policymakers to develop effective prevention strategies, thus making a significant contribution to the field.
5. Conclusions
Traffic collisions with ambulances are a major concern regarding the health and safety of paramedics, ambulance occupants, and other road users. There is a high incidence of collisions involving ambulances compared to other commercial or same-sized vehicles. In this regard, using WLSs for responding to calls is linked with an increase in the burden of collisions. In addition, in urban areas and especially at intersections, the risk of collision is greater than in other locations. Little driving experience, being younger, and having a history of collisions or traffic citations (e.g., not wearing a seat belt) can raise the chance of being involved in a traffic collision, collision severity, or liability of a collision. The results synthesized in this systematic literature review can help policymakers to implement educational programs focusing on target populations and the main variables involved in collisions of first responders.
Author Contributions
Conceptualization, M.D. and M.L.; methodology, M.D., Z.G. and M.L.; formal analysis and investigation, M.D. and M.L.; data collection, M.D. and Z.G.; writing—original draft preparation, M.D. and M.L.; writing—review and editing, M.D., Z.G. and M.L. All authors have read and agreed to the published version of the manuscript.
Funding
This research was not funded.
Institutional Review Board Statement
Not applicable.
Informed Consent Statement
Not applicable.
Data Availability Statement
Not applicable.
Acknowledgments
The authors would like to thank Sarah Simmons from the University of British Columbia for her substantial contributions in reviewing the manuscript.
Conflicts of Interest
The authors declare no conflict of interest.
Appendix A
Table A1.
Findings from included studies.
References
- European Agency for Safety and Health at Work (EU-OSHA). Commuting Accidents. 2019. Available online: Oshwiki.org (accessed on 19 April 2023).
- Reichard, A.A.; Jackson, L.L. Occupational injuries among emergency responders. Am. J. Ind. Med. 2010, 53, 1–11. [Google Scholar] [CrossRef] [Scilit] [PubMed]
- Yilmaz, A.; Serinken, M.; Dal, O.; Yaylacı, S.; Karcioglu, O. Work-related Injuries Among Emergency Medical Technicians in Western Turkey. Prehosp. Disaster Med. 2016, 31, 505–508. [Google Scholar] [CrossRef] [Scilit]
- Gülen, B.; Serinken, M.; Hatipoğlu, C.; Özaşır, D.; Sönmez, E.; Kaya, G.; Akpınar, G. Work-related injuries sustained by emergency medical technicians and paramedics in Turkey. Turk. J. Trauma Emerg. Surg. 2016, 22, 145–149. [Google Scholar]
- Heightman, A. Crew & Patient Safety Receive High Priority. JEMS J. Emerg. Med. Serv. 2006, 31, 114. [Google Scholar]
- Heightman, A. Protect your rear. Putting your best lights forward. JEMS J. Emerg. Med. Serv. 2009, 34, 12. [Google Scholar]
- Nordberg, M. In Winter Park, employee safety comes first. Emerg. Med. Serv. 2006, 35, 79. [Google Scholar]
- Nordberg, M. Driving online. Internet-based program for emergency vehicle safe operations now available. Emerg. Med Serv. 2006, 35, 40. [Google Scholar] [PubMed]
- Sagarra, S.E. New ambulance design aims to improve safety. EMS World 2015, 44, 42–44. [Google Scholar]
- Savolainen, P.T.; Dey, K.C.; Ghosh, I.; Karra, T.L.; Lamb, A. Investigation of Emergency Vehicle Crashes in the State of Michigan; Nextrans Center (US): West Lafayette, IN, USA, 2009. [Google Scholar]
- Chiu, P.-W.; Lin, C.H.; Wu, C.L.; Fang, P.H.; Lu, C.H.; Hsu, H.C.; Chi, C.H. Ambulance traffic accidents in Taiwan. J. Formos. Med. Assoc. 2018, 117, 283–291. [Google Scholar] [CrossRef] [Scilit]
- Fetto Law Group. Statistics on Emergency Vehicle Accidents in the United States. 2019. Available online: https://www.fettolawgroup.com/Personal-Injury-Blog/ (accessed on 19 April 2023).
- Maguire, B.J.; Hunting, K.L.; Guidotti, T.L.; Smith, G.S. Occupational Injuries among Emergency Medical Services Personnel. Prehosp. Emerg. Care 2005, 9, 405–411. [Google Scholar] [CrossRef] [Scilit]
- Sanddal, N.D.; Albert, S.; Hansen, J.D.; Kupas, D.F. Contributing Factors andIssues Associated with Rural Ambulance Crashes: Literature Review andAnnotated Bibliography. Prehosp. Emerg. Care 2008, 12, 257–267. [Google Scholar] [CrossRef] [Scilit]
- Ray, A.F.; Kupas, D.F. Comparison of Crashes Involving Ambulances with Those of Similar-Sized Vehicles. Prehos. Emerg. Care 2005, 9, 412–415. [Google Scholar] [CrossRef] [Scilit]
- Watanabe, B.L.; Patterson, G.S.; Kempema, J.M.; Magallanes, O.; Brown, L. Is Use of Warning Lights and Sirens Associated with Increased Risk of Ambulance Crashes? A Contemporary Analysis Using National EMS Information System (NEMSIS) Data. Ann. Emerg. Med. 2019, 74, 101–109. [Google Scholar] [CrossRef] [Scilit]
- Saunders, C.E.; Heye, C.J. Ambulance Collisions in an Urban Environment. Prehosp. Disaster Med. 1994, 9, 118–124. [Google Scholar] [CrossRef] [Scilit] [PubMed]
- Lebeau, M.; Duguay, P. Le Coût des Accidents Routiers au Travail Survenus au Québec de 2001 à 2015; Institut de Recherche Robert-Sauvé en Santé et en Sécurité du Travail: Montréal, QC, Canada, 2021. [Google Scholar]
- National Highway Traffic Safety Administration (NHTSA). Estimate of Crashes Involving Emergency Vehicles by Year, Emergency Vehicle and Emergency Use, 2001–2010. General Estimates System (GES). Fatality Analysis Reporting System (FARS); National Highway Traffic Safety Administration (NHTSA): Washington, DC, USA, 2010.
- American Medical Association. Principles of Medical Ethics of the American Medical Association; American Medical Association: Chicago, IL, USA, 1903. [Google Scholar]
- Sanddal, T.L.; Sanddal, N.D.; Ward, N.; Stanley, L. Ambulance Crash Characteristics in the US Defined by the Popular Press: A Retrospective Analysis. Emerg. Med. Int. 2010, 2010, 525979. [Google Scholar] [CrossRef] [Scilit]
- White, J. PubMed 2.0. Med. Ref. Serv. Q. 2020, 39, 382–387. [Google Scholar] [CrossRef] [Scilit] [PubMed]
- Kmet, L.M.; Cook, L.S.; Lee, R.C. Standard Quality Assessment Criteria for Evaluating Primary Research Papers from a Variety of Fields; Alberta Heritage Foundation for Medical Research: Edmonton, AB, Canada, 2004. [Google Scholar]
- Custalow, C.B.; Gravitz, C.S. Emergency medical vehicle collisions and potential for preventive intervention. Prehosp. Emerg. Care 2004, 8, 175–184. [Google Scholar] [CrossRef] [Scilit] [PubMed]
- Pirrallo, R.G.; Swor, R.A. Characteristics of Fatal Ambulance Crashes During Emergency and Non-emergency Operation. Prehosp. Disaster Med. 1994, 9, 125–132. [Google Scholar] [CrossRef] [Scilit]
- Bentley, M.A.; Levine, R. A National Assessment of the Health and Safety of Emergency Medical Services Professionals. Prehosp. Disaster Med. 2016, 31, S96–S104. [Google Scholar] [CrossRef] [Scilit] [PubMed]
- Becker, L.; Zaloshnja, E.; Levick, N.; Li, G.; Miller, T. Relative risk of injury and death in ambulances and other emergency vehicles. Accid. Anal. Prev. 2003, 35, 941–948. [Google Scholar] [CrossRef] [Scilit]
- Clawson, J.J.; Martin, R.L.; Cady, G.A.; Maio, R.F. The Wake-Effect—Emergency Vehicle-Related Collisions. Prehosp. Disaster Med. 1997, 12, 41–44. [Google Scholar] [CrossRef] [Scilit]
- Ray, A.M.; Kupas, D.F. Comparison of Rural andUrban Ambulance Crashes in Pennsylvania. Prehosp. Emerg. Care 2007, 11, 416–420. [Google Scholar] [CrossRef] [Scilit]
- Gałązkowski, R.; Binkowska, A.; Samoliński, K. Occupational injury rates in personnel of emergency medical services. Ann. Agric. Environ. Med. 2015, 22, 680–684. [Google Scholar] [CrossRef] [Scilit]
- Biggers, W.A.; Zachariah, B.S.; Pepe, P.E. Emergency Medical Vehicle Collisions in an Urban System. Prehosp. Disaster Med. 1996, 11, 195–201. [Google Scholar] [CrossRef] [Scilit]
- Fournier, M.; Chenaitia, H.; Masson, C.; Michelet, P.; Behr, M.; Auffray, J.-P. Crew and Patient Safety in Ambulances: Results of a Personnel Survey and Experimental Side Impact Crash Test. Prehosp. Disaster Med. 2013, 28, 370–375. [Google Scholar] [CrossRef] [Scilit]
- Kahn, C.A.; Pirrallo, R.G.; Kuhn, E.M. Characteristics of fatal ambulance crashes in the United States: An 11-year retrospective analysis. Prehosp. Emerg. Care 2001, 5, 261–269. [Google Scholar] [CrossRef] [Scilit]
- Weiss, S.J.; Ellis, R.; Ernst, A.A.; Land, R.F.; Garza, A. A comparison of rural and urban ambulance crashes. Am. J. Emerg. Med. 2001, 19, 52–56. [Google Scholar] [CrossRef] [Scilit]
- Schwartz, R.J.; Benson, L.; Jacobs, L.M. The Prevalence of Occupational Injuries in EMTs in New England. Prehosp. Disaster Med. 1993, 8, 45–50. [Google Scholar] [CrossRef] [Scilit] [PubMed]
- Lai, Y.-L.; Chou, Y.-H.; Chang, L.-C. An intelligent IoT emergency vehicle warning system using RFID and Wi-Fi technologies for emergency medical services. Technol. Health Care 2018, 26, 43–55. [Google Scholar] [CrossRef] [Scilit]
- Studnek, J.R.; Fernandez, A.R. Characteristics of Emergency Medical Technicians Involved in Ambulance Crashes. Prehosp. Disaster Med. 2008, 23, 432–437. [Google Scholar] [CrossRef] [Scilit] [PubMed]
- Larmon, B.; LeGassick, T.L.; Schriger, D.L. Differential front and back seat safety belt use by Prehosp. care providers. Am. J. Emerg. Med. 1993, 11, 595–599. [Google Scholar] [CrossRef] [Scilit] [PubMed]
- Tennyson, J.; Maranda, L.; Darnobid, A. Knowledge and Beliefs of EMS Providers toward Lights and Siren Transportation. WestJEM 2015, 16, 465–471. [Google Scholar] [CrossRef] [Scilit] [PubMed]
- Ersoy, G.; Ersoy, O.; Yuksekbas, O.; Kurnaz, G.; Akyildiz, E.U.; Ekemen, S. Why did the patient die? The relationship between ambulance accidents and death of patients: Forensic medical issues. J. Forensic Leg. Med. 2012, 19, 474–479. [Google Scholar] [CrossRef] [Scilit] [PubMed]
- Maguire, B.J.; Hunting, K.L.; Smith, G.S.; Levick, N.R. Occupational fatalities in emergency medical services: A hidden crisis. Ann. Emerg. Med. 2002, 40, 625–632. [Google Scholar] [CrossRef] [Scilit] [PubMed]
- Sterud, T.; Ekeberg, Ø.; Hem, E. Health status in the ambulance services: A systematic review. BMC Health Serv. Res. 2006, 6, 82. [Google Scholar] [CrossRef] [Scilit]
- Wiwekananda, K.S.S.; Hamukti, R.P.; Yogananda, K.S.S.; Calisto, K.E.; Utomo, P.S. Understanding factors of ambulance delay and crash to enhance ambulance efficiency: An integrative literature review. J. Community Empower. Health 2020, 3, 213. [Google Scholar] [CrossRef] [Scilit]






Disclaimer/Publisher’s Note: The statements, opinions and data contained in all publications are solely those of the individual author(s) and contributor(s) and not of MDPI and/or the editor(s). MDPI and/or the editor(s) disclaim responsibility for any injury to people or property resulting from any ideas, methods, instructions or products referred to in the content. |
© 2023 by the authors. Licensee MDPI, Basel, Switzerland. This article is an open access article distributed under the terms and conditions of the Creative Commons Attribution (CC BY) license (https://creativecommons.org/licenses/by/4.0/).