


Abstract
Grassland highways present a distinctive application context for human–machine co-driving (HMCODR), yet the evidence on takeover behavior in such environments remains limited. This study employed a driving simulator experiment to investigate how takeover scenarios, weather conditions, and driver gender influence eye-movement behavior during automated-driving takeovers on a representative Inner Mongolia grassland highway. 36 student participants completed a 2 (gender) × 3 (scenario: stationary vehicle ahead, ramp vehicle merging, and livestock intruding into lane) × 3 (weather: clear, rain–snow, and sandstorm) mixed experimental design. The mean fixation duration (MFD), fixation rate (FR), mean saccade duration (MSD), saccade amplitude (SA), and relative change in pupil area (RCPA) were recorded using a wearable eye tracker, and a mixed-design ANOVA was conducted based on these five metrics. The scenario and weather had significant effects on all eye-movement measurements (p < 0.05), with interactions observed for some indices. The ramp vehicle merging scenario elicited denser visual scanning, as reflected by a shorter MFD and a higher FR. In the livestock intruding into lane scenario, drivers exhibited a broader visual search, characterized by a longer MSD and a larger SA, along with greater pupil-area fluctuations (a higher RCPA); these effects tended to be more pronounced under rain–snow and sandstorm conditions. Across most of the condition combinations, the female drivers tended to show a higher FR, a shorter MFD, and a higher RCPA, whereas male drivers tended to show a slightly larger MSD and SA. Among all the eye-movement indices, RCPA showed a relatively more pronounced gender difference, with female drivers exhibiting values approximately 16–32% higher than male drivers. These findings extend the takeover research to grassland highway contexts and suggest that takeover assistance should place greater emphasis on hazard-relevant cues and timely gaze guidance under complex scenarios and adverse weather conditions, while the observed differences in the visual-response patterns may also inform more personalized prompting strategies to better support safety in high-risk takeover situations.
1. Introduction
With the rapid development of artificial intelligence and intelligent sensing technologies, automated driving systems are gradually progressing from the stage of driver assistance toward a high level of automation, showing broad potential for improving road traffic safety, alleviating urban congestion, and enhancing travel efficiency [1,2]. At present, SAE level two–level three automated vehicles have already been tested or partially deployed in various road environments, and their operating mode is generally built upon HMCODR [3]. In this mode, the automated driving system undertakes longitudinal and lateral control tasks and continuously monitors the road conditions and the driver’s behavior in real time, assisting in the identification of potential risks, thereby effectively reducing traffic accidents caused by fatigue, distraction, or misjudgment [4]. The driver, in turn, mainly assumes the role of environmental supervisor and backup controller and is allowed to engage in non-driving-related tasks within a certain scope [5,6]. However, due to the current capability limitations of automated driving systems, when they approach their performance boundaries in complex or abnormal traffic situations, a takeover request must be issued so that the vehicle control can be rapidly transferred back to the driver. This process is essentially a multi-stage cognitive processing task under high time pressure, accompanied by significant workload and stress responses [7]. Its safety largely depends on whether the driver can, within a limited time, rebuild situation awareness, evaluate risks, and execute control actions [8,9]. Consequently, the takeover phase is generally regarded as one of the highest-risk segments in the operation of automated driving systems, and it has become a key bottleneck that is constraining their large-scale deployment.
From the perspective of existing studies, a substantial body of empirical evidence on takeover behavior in automated driving has been accumulated in structured environments such as urban roads and highways. The related research mainly characterizes the takeover process using three categories of indicators. The first comprises the takeover quality and safety metrics, such as longitudinal and lateral control stability, minimum gap, and collision risk [10,11,12]. The second concerns itself with the takeover reaction time and the duration of its constituent sub-phases [13,14]. The third focuses on driver state recognition indicators, including alertness level, workload, and attention allocation [15,16]. Overall, these studies commonly conceptualize the takeover response as a multi-stage information-processing and situation-awareness-reconstruction process that encompasses environmental perception, situation comprehension, and control execution. Within this process, the driver’s rapid perception and understanding of the surrounding environment is regarded as the primary critical stage of the takeover, in which the visual channel plays a central role [17]. The existing research has shown that drivers’ eye-movement behavior before and after the takeover can sensitively reflect their cognitive state, alertness level, and risk perception capability [18]. At the same time, different gaze strategies and patterns of attention distribution can significantly affect the takeover reaction time, the accuracy of the risk assessment, and the stability of the vehicle control after the takeover [19]. Therefore, visual behavior metrics not only provide an intuitive reflection of the quality of the driver’s takeover performance but also offer key evidence for elucidating how external environmental complexity influences the takeover outcomes.
In the HMCODR mode, the success of takeover behavior is largely constrained by the time pressure and the cognitive demands that are imposed by the complexity of the traffic environment. When confronted with high-complexity takeover situations, drivers must rapidly integrate environmental information and accomplish a smooth transfer of control authority within a very short time window. If the situation awareness is not sufficiently rebuilt or the risk assessment is delayed, high-risk takeover behaviors such as sluggish responses and operational errors are likely to occur. In terms of the takeover situation design, existing studies have examined differences in the takeover performance starting from traffic conflicts with different risk levels. Wu found that the road environment has a significant impact on the drivers’ takeover performance and safety [20], and in certain extreme situations, braking alone is no longer sufficient to ensure safety; timely steering inputs and other combined control strategies are also required. Lin compared the takeover performance across different collision-risk scenarios under conditionally automated driving [21]. Their results showed that drivers exhibited shorter brake reaction times in low collision-risk situations, whereas in high collision-risk scenarios, their perceived hazard level was paradoxically lower than it was in low-risk scenarios, suggesting that a highly risky environment does not necessarily elicit sufficient subjective alertness. In addition, weather conditions, as a higher-level environmental factor that affects both information availability and vehicle controllability, remain somewhat controversial in terms of their mechanisms of influence in existing research. On the one hand, some studies have indicated that adverse weather degrades the drivers’ multimodal perceptual capabilities and reduces the quality of the external information [22,23], thereby impairing the lane-keeping performance and the decision stability, and significantly increasing the takeover workload and operational difficulty [24]. On the other hand, the other studies have observed faster driver reactions under rainy conditions [25], which may be associated with compensatory strategies whereby drivers proactively increase their level of alertness and intensify their monitoring of the road environment. Overall, environmental complexity, risk level, and weather conditions may systematically affect drivers’ visual behavior and takeover performance during the takeover process by altering their risk perception, experience of time pressure, and patterns of attention allocation. The underlying mechanisms of these effects still need to be further elucidated in more complex and dynamically changing naturalistic driving environments.
Compared with urban roads and expressways, grassland highways, which serve as important transport corridors in Western China, present a distinctive traffic environment. They are typically characterized by monotonous alignment, sparse roadside facilities, and prolonged low-stimulation driving conditions, which may induce highway hypnosis and visual fatigue, thereby interfering with the extraction of critical traffic cues, attentional regulation, and risk judgment [26,27,28]. Against this backdrop, the operational stability and environmental adaptability of automated driving systems are subject to severe challenges in the grassland highway environments. For the HMCODR systems, a driver takeover constitutes the last line of defense for ensuring the safety of automated driving, and the quality of the response depends heavily on the efficiency of information extraction and the level of risk identification during the visual perception stage within the takeover window [29]. However, limited research has examined how drivers regulate visual perception and respond to takeover demands on grassland highways, particularly under different traffic scenarios and weather conditions. Addressing this issue is important not only for improving the safety and adaptability of human–machine cooperative systems on grassland highways but also for providing theoretical support and practical insights for promoting high-quality development of traffic safety in grassland regions.
Beyond the external environmental factors, gender differences, as a classic individual-difference variable in psychology, have been widely used to explain the variations in driving behavior and traffic safety outcomes [12,30]. Some studies have reported significant gender differences in the overall takeover performance as well as in the indicators associated with several sub-phases of the takeover process [31,32]. From the perspective of behavioral risk research, it has been suggested that, under conditions of uncertainty, women tend to exhibit a higher risk sensitivity and a more cautious operational tendency, whereas men are more inclined toward efficiency-oriented and relatively more aggressive decision styles [33]. At the same time, cognitive style theories indicate that gender may be related to the scope of visual search and the degree of dependence on background information, implying that there may be differences in the information-extraction processes, such as being “more focused on local targets” versus being “more reliant on global contextual cues” [34]. In the takeover situations characterized by a high perceptual load and a high uncertainty, such differences in visual and cognitive style are likely to influence the takeover performance by shaping the efficiency of information extraction, the speed of risk identification, and the selection of response strategies. However, the current research on automated driving takeover has paid limited attention to how gender specifically affects the visual resource allocation and risk-information recognition mechanisms during the takeover process, particularly under complex naturalistic road environments and adverse weather conditions, and systematic empirical evidence in this regard remains scarce.
Building on the above research status and identified gaps, this study focuses on the automated driving takeover process under the HMCODR conditions on grassland highways, using drivers’ eye-movement behavior within the takeover window as the core analytical entry point. To enhance the ecological validity of the study, we first conducted field investigations and video recordings and then selected typical grassland highway segments as templates to construct grassland-highway risk takeover scenarios that combine geometrical road monotony with complex traffic operations. On this basis, we further configured three types of adverse weather conditions that are common on grassland highways—clear, rain–snow, and sandstorm conditions. Relying on a driving simulator platform and wearable eye-tracking technology, we finely characterize the drivers’ visual attention allocation and visual workload characteristics, thereby analyzing how scenario complexity, weather conditions, and gender differences influence the visual perception regulation mechanisms during the takeover process. On this basis, this paper aims to address the following specific questions:
(1) How do fixation rhythm, gaze search range, and visual workload within the takeover window vary systematically under different combinations of takeover scenarios and weather conditions on grassland highways?
(2) What joint patterns of change emerge among the different eye-movement indices, and to what extent do these patterns reflect the drivers’ adaptive adjustments to environmental complexity and perceptual difficulty?
(3) Are there gender-related differences in visual resource allocation and workload responses, and if so, do these differences present relatively stable patterns across different combinations of scenarios and visibility levels?
By addressing the above questions, this study seeks, from the perspective of traffic psychology and human engineering factors, to uncover the visual perception regulation mechanisms underlying the automated driving takeover process in the complex naturalistic road environment of grassland highways. In doing so, it aims to fill the evidential gap regarding the interaction effects of non-conventional road structures, adverse weather conditions, and gender differences, and provide an empirical foundation at the level of visual behavior for the design of takeover strategies and the safety evaluation of the HMCODR systems in grassland highway environments.
The remainder of this paper is organized as follows. Section 2 presents experimental design, apparatus, scenario construction, and data-processing procedures. Section 3 reports the statistical results for the five eye-movement metrics. Section 4 discusses the findings from the perspectives of risk takeover situations and visual strategies, gender differences in visual resource allocation and workload responses, and implications for the design of HMCODR systems on grassland highways; this section also addresses the study limitations and future research directions. Finally, Section 5 summarizes the main conclusions of the study.
2. Method
This study adopted a 2 (gender: male, female) × 3 (risk takeover scenarios: stationary vehicle ahead, ramp vehicle merging, livestock intruding into lane) × 3 (weather conditions: clear, rain–snow, and sandstorm) mixed design, in which gender was treated as a between-subject factor, and risk takeover scenarios and weather conditions were treated as within-subject factors. The specific settings of the risk takeover scenarios and weather conditions are described in Section 2.3.
2.1. Participants
Considering that the order of condition administration might influence participants’ behavior, the experiment adopted a partially counterbalanced arrangement for the within-subjects tasks to reduce order effects and fatigue-related bias. As there were nine combinations of within-subject conditions in total, the number of participants was set as an integer multiple of nine to achieve a balanced and controlled distribution of condition sequences. To ensure sufficient statistical power, the required sample size was estimated using G*Power (version 3.1.9.7) based on F tests—specifically, repeated-measures ANOVA with a within–between interaction design—with gender treated as the between-subject factor and scenario and weather conditions treated as within-subject factors. With the significance level set at α = 0.05 and the effect size set at a medium level (f = 0.25), the minimum required sample size was 26. Taking into account both sequence balancing and statistical power requirements, the final sample size was determined to be 36 participants in order to enhance the test power and improve the robustness of the results. Among the participants, 18 were male, and 18 were female; their ages ranged from 20 to 26 years (M = 22.61, SD = 2.03). All participants held a valid driver’s license and had at least two years of driving experience, with an average driving experience of 4.19 years (SD = 3.83). They also had normal or corrected-to-normal vision. None of the participants reported color-vision deficiency, and a brief color-vision screening was conducted prior to the experiment.
The university students were chosen as the sample primarily for two reasons. First, as a group, university students generally have relatively limited driving experience, which is more conducive to examining how differences in attention allocation and response performance manifest during the takeover process when driving skills and capability boundaries have not yet fully stabilized [35,36]. Second, this group is considered a potential major user base and an early adopter of automated driving assistance systems [37]. Therefore, taking university students as research participants ensures, to some extent, both the practical relevance of the study and the forward-looking applicability of its conclusions. At the same time, because the sample was restricted to young university students, caution is needed when generalizing the findings to other age groups and more experienced drivers.
The study was conducted in accordance with the Declaration of Helsinki, and approved by the Scientific Research and Academic Ethics Committee of Inner Mongolia Agricultural University (protocol code NNDKY2024007; all participants signed a written informed consent form after being fully informed of the purpose, procedures, and potential risks of the experiment, and they were explicitly informed of the voluntary nature of their participation and their right to withdraw from the study at any time). Upon completion of the experiment, each participant received 200 RMB (approximately 30 USD) as compensation and appreciation for their participation.
2.2. Apparatus
This study employed an ErgoSIM driving simulator platform (Kingfar International Inc., Beijing, China) as the main experimental apparatus. The platform consists of a Conspit GT Lite driving cockpit, a 180° surround driving-scene display, an auditory warning system, a Brook Ras1ution GT1 steering wheel, and a SIMX pedal set, providing near-realistic control feedback and an immersive visual environment. During the experiment, the instrument panel and rear-view mirrors displayed the virtual road scenes and vehicle operating states that were generated in SCANeR Studio (version 2023) in real time, and participants could switch between the automated driving mode and the manual driving mode using the left paddle shifter on the steering wheel. The driving simulator platform and the ErgoLab human-factors data acquisition system were used to record the scenario information and event markers throughout the experiment and to provide a timing reference for synchronizing the eye-tracking data (internal sampling frequency: 50 Hz). A wearable eye tracker, Tobii Pro Glasses 3 (Tobii Pro AB, Stockholm, Sweden; sampling frequency: 50 Hz), was used to collect the participants’ eye-movement data during the takeover process. Before formal recording, the Tobii Pro Glasses 3 was calibrated using the standard one-point calibration procedure provided by the device. The main equipment and software used in the experiment are shown in Figure 1.
Figure 1.
The equipment and software used in the experimental procedure.
2.3. Design of Takeover Situations on Grassland Highways
2.3.1. Design of the Grassland-Highway Simulation Scenario
Drawing on the research team’s earlier field investigations on grassland highways in Inner Mongolia, this study selected the S101 Saihantala–Mandula section in the Inner Mongolia Autonomous Region, which exhibits typical grassland-highway characteristics, as the road template. This section is representative in that it combines relatively simple alignment, monotonous roadside landscapes, and comparatively weak traffic facilities. The actual location and alignment of the road are shown in Figure 2a.
Figure 2.
The design of road alignment and cross-section for experimental segments, (a) Real Line Chart, (b) Simulation Line Chart, (c) Road Cross-Section.
Based on the above field data, a 50 km two-way, two-lane simulated highway was constructed in SCANeR Studio to reproduce the operating environment of grassland highways that are characterized by continuous visual monotony and to provide spatial flexibility for placing multiple takeover-event segments under different experimental conditions. The simulated road consisted of long tangents and large-radius circular curves, with straight segments accounting for approximately 87% of the total length, as shown in Figure 2b. The width of a single lane is 3.5 m, with a 1.5 m paved shoulder and a 1.0 m earthen shoulder on each side. No central median was installed, and the cross-section of the road is shown in Figure 2c. The design speed was set to 100 km/h in accordance with the actual speed limit.
2.3.2. Design of Risk Takeover Scenarios
To improve the ecological validity, we first conducted preliminary on-road observations on grassland highways and interviewed residents in local roadside townships as well as professional drivers. The video records and incident narratives of the typical hazard events were also collected. Based on these materials, three recurrent takeover triggers in grassland-highway operations were identified and selected as the scenario basis for the present study.
First, a stationary vehicle was included ahead because roadside breakdowns and temporary stops are relatively common in grassland regions where rescue services and traffic management may be limited; stationary vehicles were also widely used as representative takeover triggers in prior automated-driving studies. Second, a low-speed ramp vehicle merged lanes during the study to reflect ramp–mainline junctions in which short acceleration lanes and insufficient guidance/markings can lead to low-speed entries and pronounced speed differentials, thereby increasing the difficulty of intent and trajectory recognition. Third, livestock was introduced into the lane because continuous fencing or livestock-separation facilities are not always available, making animal encroachment into the carriageway and shoulders a plausible hazard source. The detailed descriptions and simulation snapshots are provided in Table 1 and Figure 3. The initial distances listed in Table 1 were the ego vehicle–conflict object distances that were specified according to the trigger logic of each scenario, with the purpose of ensuring a consistent time budget at TOR onset across scenarios, rather than representing a single uniform TTC-equivalent distance. The specific definition of the nominal TTC in each scenario is further described in Section 2.3.4.
Table 1.
The definitions and state descriptions of the three risk takeover scenarios.
Figure 3.
The illustrations of risk-related takeover scenarios, (a) Disable Vehicle Ahead, (b) Ramp Vehicles Merging, (c) Livestock on Roadway.
The three scenarios were designed to span increasing levels of operational and perceptual demands during the takeover tasks. To clarify the rationale underlying this design, Table 2 summarizes the key characteristics of the scenarios in terms of target dynamics, conflict-agent configuration, spatial dispersion, primary control requirements, trajectory predictability, and hazard-anticipation cues. Scenario A represents a static, spatially fixed obstacle with relatively predictable conflict evolution; Scenario B introduces a single dynamic agent with lateral motion into the ego lane; and Scenario C involves multiple animals distributed across the lane and shoulders with slow, irregular movements, imposing higher demands on hazard detection, anticipation, and control actions.
Table 2.
Comparative characteristics of the three risk takeover scenarios across key dimensions.
No separate baseline scenario was included in this study. This was mainly because the present experiment focused more on examining how the different types of risk takeover scenarios influenced drivers’ eye-movement behavior, rather than on comparing the takeover events with a neutral or no-event driving condition. Accordingly, all three takeover scenarios were included as task-relevant experimental conditions, and the analysis focused on the relative differences among them.
2.3.3. Design of Weather Conditions
As an indispensable external environmental variable in the grassland-highway takeover contexts, weather conditions not only alter the quality of sensory inputs but also impose additional interference on the visual channel, thereby affecting drivers’ visual behavior and cognitive workload. Based on the systematic records of adverse weather types in the Inner Mongolia Autonomous Region documented in the China Meteorological Disaster Yearbook and the China Climate Bulletin [38,39], the relevant reports indicate that the spring sandstorm events occur frequently in this region, and that sandstorms are classified as an independent disaster type for Inner Mongolia in the China Meteorological Disaster Yearbook. At the same time, different precipitation phases, including rain, snow, and rain–snow events, are also explicitly identified as important weather types affecting traffic operation and road visibility in Inner Mongolia. These adverse weather phenomena have had significant impacts on the local infrastructure and regional transportation systems, not only disrupting vehicle movement and the normal operation of infrastructure but also producing clear adverse effects on the road traffic conditions and residents’ daily travel activities. This study selected rain–snow and sandstorm conditions as representative adverse weather, together with clear weather, to form three experimental weather conditions. The specific design is presented in Table 3 and Figure 4.
Table 3.
The descriptions of the weather conditions.
Figure 4.
The illustrations of the weather conditions (a) Clear, (b) Rain-snow, (c) Sandstorm.
The visibility was operationalized in the simulator by parameterizing the effective sight distance to approximately ≥1000 m (clear), ~500 m (rain–snow), and ~200 m (sandstorm), forming a three-level gradient of perceptual difficulty. The sandstorm setting was intended to represent the very-low-visibility sand–dust conditions that were reported in the severe events (often <200 m), while the 500 m rain–snow setting reflects a low-visibility precipitation condition used to increase the visual workload.
2.3.4. Design and Timing of Takeover Requests
In this study, takeover requests were triggered via scripts implemented in SCANeR Studio, and a takeover time budget was introduced as a key control variable to determine the timing of the takeover request. The takeover time budget was calculated based on the time to collision between the ego vehicle and the obstacle ahead. The previous studies have shown that a takeover time budget of approximately 7 s can satisfy the safety requirements for takeover in most situations [40,41]. At the same time, research has also indicated that delivering takeover requests in the form of voice prompts is widely adopted in HMCODR and exhibits good reliability in terms of operational responses and takeover performance [42,43]. In line with these findings, the present study set the takeover time budget to 7 s and delivered the takeover request to the driver via a voice prompt instructing, “Please take over the vehicle.”
However, in the present study, the 7 s TTC should be understood as a nominal time budget at the TOR onset, rather than as a single fixed distance uniformly applied across all the takeover scenarios. For the stationary-vehicle scenario, the classical one-dimensional TTC definition applied directly; when the ego vehicle speed was 100 km/h, a TTC of 7 s corresponded to a longitudinal distance of 194.4 m. For the ramp-merging scenario, the nominal TTC was defined based on the longitudinal relative closing speed between the ego vehicle and the merging vehicle. Specifically, with the ego vehicle traveling at 100 km/h and the ramp-merging vehicle traveling at 20 km/h, the relative speed was 80 km/h (approximately 22.22 m/s), thus the corresponding initial distance under a 7 s time budget was 156.6 m. For the livestock-intrusion scenario, because livestock were dynamic targets, defining TTC directly on the basis of the instantaneous state of an individual animal would have introduced substantial variation in the distance settings across trials due to fluctuations in animal movement, which would have been unfavorable for using 7 s as a unified experimental control variable. For this reason, a livestock activity zone was predefined in SCANeR, and the 7 s nominal time budget in this scenario was defined as the ego vehicle’s time to reach the near boundary of that activity zone; under this scenario configuration, the corresponding distance was 194.4 m. In addition, to avoid instability in the target position at the TOR onset caused by the livestock turning around near the zone boundary, an extra group of stationary livestock with different orientations and postures was placed near the boundary as placeholder targets to improve the scenario consistency.
2.4. Experimental Procedure
To avoid learning effects and order effects, the combinations of risk takeover scenarios and weather conditions were presented in a randomized order within subjects. Prior to the formal experiment, four participants were recruited for a pilot study to test the feasibility of the experimental procedure and the appropriateness of the scenario design. Based on their feedback, minor adjustments were made to the voice prompts, scenario details, and experimental instructions.
Before starting the formal experiment, each participant was asked to complete a driving behavior questionnaire covering demographic information, driving experience, and experience with and attitudes toward automated driving. The experimenter demonstrated the basic operation of the driving simulator in a practice scenario that did not contain any risk events, while also playing the takeover prompt as part of the procedure demonstration. The participants subsequently completed at least 10 min of adaptation driving in the same scenario to familiarize themselves with the use of the steering wheel, pedals, and mode-switch paddle and to ensure that they could switch proficiently between the automated driving mode and the manual driving mode. After the adaptation period, the eye tracker was fitted to the participant, and the calibration was performed using a handheld calibration card via the Tobii mobile control interface, following the standard one-point calibration procedure provided for the Tobii Pro Glasses 3, with a calibration accuracy of 0.6° of the visual angle. The calibration was considered acceptable when the interface indicated that the device was ready for recording and no obvious instability in the gaze mapping was observed. If the device failed to reach a recording-ready status, if the gaze mapping appeared unstable or showed an obvious mismatch with the participant’s point of regard, or if the glasses’ position had visibly shifted and required refitting, the eye tracker was refitted, and the calibration procedure was repeated until a satisfactory calibration was achieved. Once the proper device connection and data recording were confirmed, the formal experiment began.
According to the takeover-event settings, the simulated road used in the experiment was divided into nine segments, each 4.2 km long and containing one takeover event. To ensure consistency across trials, the takeover request was triggered at the same relative position within each segment. Figure 5 illustrates one representative regional segment used in the takeover trials. The procedure for each trial was as follows: at the beginning of each trial, the participants activated the automated driving mode and performed a standardized video-viewing secondary task. The video materials were controlled for content and luminance to ensure consistent visual engagement during automated driving. This secondary task was used to maintain the participants’ visual occupation during automation and to reduce the proactive monitoring of the forward roadway before the takeover request was issued. The vehicle then traveled in automated mode for 3 km, maintaining a position in the center of the lane. When the ego vehicle reached the predefined trigger position for the current takeover scenario, the system issued a takeover request via a voice prompt, saying “Please take over the vehicle.” At this moment, the participant was required to operate the mode-switch paddle to change from automated driving to manual driving and then perform appropriate steering and acceleration or deceleration maneuvers to avoid the upcoming risk event and pass safely through the takeover area.
Figure 5.
The layout of a representative segment in the takeover trial.
After the vehicle passed the takeover event and approached a roadside sign reading “Please switch to automated driving,” the participant operated the mode-switch paddle again to return to the automated driving mode and continued driving until the end of the current road segment. The experiment then proceeded to the next takeover situation, that is, another trial with a different combination of risk takeover scenarios and weather conditions. After the final takeover event, the participants continued driving in automated mode through an additional event-free segment of approximately 10 km. This event-free segment was included because, if the simulated route had been limited to only the length required for the experimental events, the drivers might have more readily perceived the approaching boundary of the simulation scene while performing the final takeover task, which could have led to relaxation or strategic adjustment. To minimize such end-of-session expectancy effects and to maintain more natural and consistent driving behavior, this segment was arranged as a route buffer. After the experimenter confirmed that the eye-tracking data had been successfully saved and the recording had been stopped, the participant was informed that the experiment had ended, and the simulation scenario was terminated. The entire experimental session for each participant lasted approximately 40 min. After each trial, the participants were asked whether they wished to take a short 1–2 min break to reduce the temporary strain and to minimize the potential influence of fatigue on the subsequent trials. If a participant chose to rest, the eye tracker was recalibrated after the break to ensure the accuracy of the subsequent data collection.
2.5. Experimental Variables
In this study, the independent variables were defined as gender and different takeover situations on grassland highways, with takeover situations comprising risk takeover scenarios and weather conditions. The dependent variables focused on the drivers’ eye-movement characteristics within the takeover window. The takeover window was defined from the onset of the auditory takeover request to the moment when the hazardous event had been safely passed [44,45]. This definition was adopted to capture the complete task period during which the driver was formally required to transition from automated driving supervision to active hazard management. The onset of the auditory prompt provided a clearly identifiable and consistent temporal anchor across trials, whereas the moment at which the hazard was passed marked the functional completion of the takeover episode. These metrics have been widely adopted in previous studies of driving visual behavior, hazard perception, and automated-driving takeover, both as representative standalone indicators and as complementary components within multidimensional eye-movement assessment frameworks [46,47,48]. Together, they provide complementary information for describing the drivers’ visual responses during the takeover. Therefore, their selection was considered appropriate for the objectives of the present study.
In the present study, fixation- and saccade-based metrics were derived from the eye-movement events identified using a velocity-threshold identification (I-VT) algorithm, whereas pupil-based metrics were calculated directly from the preprocessed pupil-area time series. The specific eye-movement metrics and their definitions are as follows:
(1) Mean fixation duration (MFD): The MFD, measured in milliseconds (ms), refers to the length of time for which a single fixation is maintained. The MFD is defined as the arithmetic mean of all valid fixation durations within the takeover window and is used to characterize the temporal rhythm of the drivers’ dwelling on and processing the visual information during the takeover phase.
(2) Fixation rate (FR): The FR, measured in hertz (Hz), is defined as the number of fixations per unit of time. It is calculated by dividing the total number of valid fixations within the takeover window by the length of that window. This metric reflects the overall intensity of the drivers’ monitoring of the external environment and their visual sampling frequency and is typically associated with their level of attention to environmental changes and their scanning rhythm.
(3) Mean saccade duration (MSD): The MSD, measured in milliseconds (ms), represents the time taken by a rapid eye movement between two successive fixation points during the takeover process. The MSD is defined as the average of all the saccade durations within the takeover window and is used to describe the temporal characteristics of the gaze shifts in the course of the visual search.
(4) Saccade amplitude (SA): The SA, measured in degrees of visual angle (°), represents the spatial displacement between two successive fixation points. The mean saccade amplitude within the takeover window is used to characterize the spatial extent and strategy of the drivers’ visual search, indicating whether the drivers focus more on local details or tend to scan the broader environment.
(5) Relative change intensity of pupil area (RCPA): Given that the absolute pupil area levels are easily influenced by individual differences and ambient illumination [49], this study adopted the RCPA following Wang [50] to capture the variation in the pupil area during the takeover task relative to a non-task baseline state. The instantaneous value is defined as follows (see Equation (1)):
In Equation (1), denotes the RCPA value at time . and represent the pupil area at time and , respectively, under the takeover-task state, whereas and represent the pupil area at time and under the non-task state. The non-task state is obtained from a 15 s baseline window during stable automated-driving cruising, and n denotes the number of samples within this baseline window. Importantly, for each trial, the baseline window was extracted from the stable automated-driving phase under the same weather conditions as that trial. Therefore, the RCPA was defined relative to a within-trial baseline matched to the current weather condition, rather than to a fixed baseline shared across different weather conditions, which helped improve the validity of the pupil-based comparisons across the conditions. For each trial, the series within the takeover window was first computed, and its mean value was then taken as the RCPA metric for that trial. A larger RCPA value indicates that dynamic fluctuations in the pupil area during the takeover task are more pronounced relative to the baseline state, which typically corresponds to a higher level of visual workload and potential tension or stress responses.
2.6. Data Preprocessing
To ensure the quality of the eye-tracking data, the raw eye-movement signals were preprocessed before extracting the above metrics. First, the first-person view recorded by the scene camera embedded in the wearable eye tracker was temporally aligned with the laboratory behavior video capturing the overall experimental environment using the ErgoLAB human-factors platform. Specifically, a common flash signal was introduced into both video streams as a synchronization event, and the first occurrence of this event in each video was marked to establish a unified temporal reference frame. On this basis, the eye-tracking data and driving-behavior data were projected onto a common time axis. After synchronization, the eye-movement data series that were referenced to the unified timestamps were exported for subsequent metric computation. Across all the valid trials, the average data-loss rate, calculated as the percentage of missing gaze samples, was 4.19%.
On the basis of temporal synchronization, the raw eye-movement signals were then subjected to filtering and event detection. A sliding median filter was first applied to the gaze-position and the pupil-area time series to attenuate instantaneous spikes and local abnormal fluctuations. Subsequently, fixation and saccade events were identified using a velocity-threshold identification (I-VT) algorithm. Specifically, gaze samples with an angular velocity below 30°/s were classified as fixations, whereas those exceeding this threshold were classified as saccades [51]. The I-VT method was selected because the takeover task involved rapid gaze reorientation and dynamic visual search, for which velocity-based event detection is generally considered appropriate [52,53]. For neighboring fixations, and with reference to commonly used fixation post-processing parameter settings reported in previous studies, events separated by less than 75 ms and with a visual-angle difference of less than 0.5° were merged into a single fixation; in addition, the fixation events shorter than 60 ms were removed to reduce the pseudo-fixations caused by noise or micro-movements [54].
After event detection and artifact removal, the linear interpolation was applied to short missing segments of no more than 200 ms in the cleaned data; longer gaps (>200 ms) were not interpolated so as to reduce the risk of introducing distortion into the original temporal dynamics of the pupil variation [55,56]. Across individual analysis segments, the proportion of interpolated samples ranged from 1.81% to 6.35%. Subsequently, additional smoothing was applied to the interpolated series while preserving the overall trend and key signal features, resulting in quality-controlled sequences of fixations, saccades, and the pupil area. Based on the above preprocessing, all the eye-movement metrics were calculated on a trial-by-trial basis within the takeover window and then organized by gender, risk takeover scenario, and weather conditions for subsequent statistical analyses.
3. Results
3.1. ANOVA Results
Based on the 2 (gender) × 3 (risk takeover scenario) × 3 (weather condition) mixed design described in Section 2, this study conducted mixed-design analyses of variance (ANOVAs) on the eye-movement metrics using IBM SPSS Statistics 26.0. Prior to the main analysis, the assumptions of normality and homogeneity of variance were examined. The normality of the data was assessed using the Kolmogorov–Smirnov test, and the homogeneity of variance was evaluated using Levene’s test. The results indicated that all variables satisfied these assumptions (p > 0.05). In addition, the outliers were identified and removed according to the Pauta criterion to ensure the reliability of the analysis. Sphericity for the within-subject factors was tested using Mauchly’s test of sphericity. When the sphericity assumption was violated, the Greenhouse–Geisser correction was applied to the degrees of freedom. The significance level was set at α = 0.05, and partial η2 was reported as the effect-size measure. When the significant main effects or interaction effects were detected, Bonferroni-adjusted pairwise comparisons were further conducted for post hoc analyses among the within-subject conditions in order to prevent a Type I error due to multiple comparisons.
Table 4 summarizes the mixed-design ANOVA results for the main and interaction effects of gender, the risk takeover scenario, and the weather conditions on the five eye-movement metrics. The risk takeover scenario and weather conditions both showed significant main effects on all five metrics, while the main effect of gender was also significant across all metrics. The interaction effects showed different patterns across the five eye-movement metrics. Based on the above ANOVA results, Section 3.2, Section 3.3, Section 3.4, Section 3.5 and Section 3.6 further analyzed the five eye-movement metrics in conjunction with the descriptive statistics for each metric (Table 5, Table 6, Table 7, Table 8 and Table 9).
Table 4.
The results of the mixed-design ANOVA for the five eye-movement metrics.
Table 5.
The MFD of drivers across various experimental conditions (mean ± SD, ms).
Table 6.
The FR of drivers across various experimental conditions (mean ± SD, Hz).
Table 7.
The MSD of drivers across various experimental conditions (mean ± SD, ms).
Table 8.
The SA of drivers across various experimental conditions (mean ± SD, °).
Table 9.
The RCPA of drivers across various experimental conditions (mean ± SD).
3.2. MFD
Figure 6a,b present the comparison of the MFD between male and female drivers. In combination with Table 5 and the ANOVA results reported in Section 3.1, these results provide an overall view of how the MFD varied across the different takeover scenarios and weather conditions. The results showed that the three-way interaction of gender × scenario × weather on the MFD was significant (F(4, 136) = 4.12, p = 0.003, partial η2 = 0.11), indicating that the joint effects of scenario and weather on the MFD differed between the male and female drivers.
Figure 6.
MFD for (a) male drivers and (b) female drivers under different conditions. The dashed lines indicate the group mean values (M), and the black dots represent individual observations. (ms).
Among the two-way interactions, the gender × scenario interaction was significant (F(2, 68) = 49.94, p < 0.001, partial η2 = 0.59), suggesting that the magnitude of the gender differences in the MFD varied across the takeover scenarios. The scenario × weather interaction was also significant (F(4, 136) = 4.09, p = 0.004, partial η2 = 0.11), indicating that the effect of the weather on the MFD differed across the scenarios. In contrast, the gender × weather interaction was not significant (F(2, 68) = 2.65, p = 0.078, partial η2 = 0.07), suggesting that the overall pattern of the MFD variation across the weather conditions was broadly similar for the male and female drivers.
Regarding the main effects, the scenario had a significant effect on the MFD (F(2, 68) = 1010.03, p < 0.001, partial η2 = 0.97). The MFD did not increase monotonically with increasing situational complexity. More specifically, the lowest mean MFD was observed in Scenario B (296.77–392.34 ms), whereas in Scenario A (320.30–413.11 ms) and Scenario C (366.16–503.98 ms), the drivers’ mean MFD increased by 20.77–26.17 ms (5.29–8.19%) and 63.82–111.64 ms (18.55–28.45%), respectively, relative to Scenario B.
The weather also showed a significant main effect on the MFD (F(2, 68) = 296.61, p < 0.001, partial η2 = 0.90). Within the same takeover scenario, the longest MFD was generally observed under the sandstorm conditions (344.12–503.98 ms), followed by the rain–snow conditions, under which the MFD was lower by 21.75–46.16 ms (5.27–9.16%) relative to the sandstorm conditions. The shortest MFD was observed under clear weather, with reductions of 41.78–74.62 ms (10.25–14.81%) compared with the sandstorm conditions.
The main effect of gender on the MFD was significant (F(1, 34) = 1905.16, p < 0.001, partial η2 = 0.98). Across the three risk takeover scenarios, the female drivers showed a consistently shorter MFD than the male drivers, with reductions of approximately 47.78 ms (12.21%), 47.60 ms (12.96%), and 78.02 ms (16.80%) in Scenarios A, B, and C. Overall, the male and female drivers exhibited broadly similar directional trends in the MFD across the takeover scenarios and the weather conditions, but the significant gender × scenario × weather interaction indicates that the magnitude of these combined effects differed between the two groups.
3.3. FR
Table 6 reports the means and standard deviations of the FR under different takeover conditions, and Figure 7a,b visually compare the FR between the male and female drivers. In combination with Table 6, Figure 7, and the ANOVA results reported in Section 3.1, these results provide an overall view of how the FR varied across the different takeover scenarios and weather conditions. The results showed that the three-way interaction of gender × scenario × weather on the FR was not significant (F(4, 136) = 1.65, p = 0.166, partial η2 = 0.05), indicating that the combined effects of scenario and weather on the FR did not differ significantly between the male and female drivers.
Figure 7.
FR for (a) male drivers and (b) female drivers under different conditions. The dashed lines indicate the group mean values (M), and the black dots represent individual observations. (Hz).
Among the two-way interactions, the gender × scenario interaction was significant (F(2, 68) = 20.83, p < 0.001, partial η2 = 0.38), suggesting that the magnitude of gender differences in the FR varied across takeover scenarios. The gender × weather interaction was also significant (F(2, 68) = 8.35, p = 0.001, partial η2 = 0.20), indicating that the magnitude of the gender differences in the FR varied across weather conditions. In contrast, the scenario × weather interaction was not significant (F(4, 136) = 1.23, p = 0.299, partial η2 = 0.04), suggesting that the overall pattern of the FR variation across the weather conditions was broadly similar among the three takeover scenarios.
Regarding the main effects, the scenario had a significant effect on the FR (F(2, 68) = 310.82, p < 0.001, partial η2 = 0.90). Similar to the MFD, the FR did not show a monotonic increase with increasing scenario complexity. In terms of conditional means, the highest FR values were observed in Scenario B (1.49–2.34 Hz), followed by Scenario C (1.26–2.03 Hz), with Scenario A showing the lowest FR (1.15–1.78 Hz). Compared with Scenario B, the FR in Scenarios A and C decreased across all combinations of weather and gender by 0.34–0.59 Hz (21.84–28.95%) and 0.23–0.36 Hz (13.25–18.95%), respectively.
The weather also showed a significant main effect on the FR (F(2, 68) = 573.21, p < 0.001, partial η2 = 0.94). Within the same takeover scenario, the FR was highest under the sandstorm conditions (1.50–2.34 Hz), moderate under the rain–snow conditions (1.36–2.05 Hz), and lowest under the clear weather (1.15–1.90 Hz). Using the sandstorm conditions as the reference, the mean FR under the rain–snow and clear conditions decreased by 0.14–0.32 Hz (9.26–17.98%) and 0.35–0.49 Hz (18.80–24.16%), respectively.
The main effect of gender on the FR was significant (F(1, 34) = 522.71, p < 0.001, partial η2 = 0.94). Across the three risk takeover scenarios, the female drivers consistently exhibited a higher FR than the male drivers. Averaged across weather conditions, the FR for female drivers exceeded that for male drivers by approximately 0.19 Hz (14.46%), 0.37 Hz (21.66%), and 0.32 Hz (22.30%) in Scenarios A, B, and C, respectively. Overall, the female and male drivers showed a broadly similar pattern of FR variation across the takeover scenarios and the weather conditions, although the significant gender × scenario and gender × weather interactions indicate that the magnitude of gender differences varied somewhat across the scenarios and weather conditions.
3.4. MSD
Figure 8 shows the distributions of the MSD for the male and female drivers across the different risk takeover scenarios and weather conditions, and the corresponding means and standard deviations are reported in Table 7. In combination with Figure 8, Table 6, and the ANOVA results reported in Section 3.1, these results provide an overall view of how the MSD varied across the different takeover scenarios and weather conditions. The results showed that the three-way interaction of gender × scenario × weather on the MSD was not significant (F(4, 136) = 0.77, p = 0.546, partial η2 = 0.02), indicating that the combined effects of the scenario and weather on the MSD did not differ significantly between the male and female drivers.
Figure 8.
MSD for (a) male drivers and (b) female drivers under different conditions. The dashed lines indicate the group mean values (M), and the black dots represent individual observations. (ms).
Among the two-way interactions, the gender × weather interaction was significant (F(2, 68) = 3.88, p = 0.025, partial η2 = 0.10), indicating that the magnitude of the gender differences in the MSD varied across the weather conditions. In contrast, neither the gender × scenario interaction (F(2, 68) = 2.14, p = 0.126, partial η2 = 0.06) nor the scenario × weather interaction (F(4, 136) = 1.14, p = 0.341, partial η2 = 0.03) reached significance, suggesting that the overall pattern of the MSD variation across the scenarios and weather conditions was broadly consistent.
Regarding the main effects, the main effect of risk takeover scenario on MSD was significant (F(2, 68) = 91.41, p < 0.001, partial η2 = 0.73). MSD increased with scenario complexity: in Scenario A, MSD ranged from 38.22 to 49.04 ms; in Scenario B, from 45.36 to 57.33 ms; and in Scenario C, from 52.56 to 65.37 ms. Using the overall mean of Scenario A as the reference, MSD in Scenarios B and C increased by approximately 7.74 ms (18%) and 14.97 ms (35%), respectively.
The main effect of the weather conditions on the MSD was also significant (F(2, 68) = 1077.53, p < 0.001, partial η2 = 0.97). Within the same risk takeover scenario, the highest MSD values were observed under the sandstorm conditions (43.26–65.37 ms), followed by the rain–snow conditions (40.57–58.89 ms), with the lowest MSD under clear weather (38.22–56.20 ms). Relative to the sandstorm conditions, the MSD under the rain–snow conditions was shortened by approximately 2.01–6.48 ms (3.43–9.91%), whereas under clear weather it was shortened by about 5.04–9.17 ms (10.20–14.03%).
The main effect of gender on the MSD was significant (F(1, 34) = 230.86, p < 0.001, partial η2 = 0.87). Across the three risk takeover scenarios, the female drivers consistently exhibited a longer MSD than the male drivers. Based on the means averaged across the weather conditions, the MSD for female drivers exceeded that for the male drivers by approximately 4.7 ms (11.58%), 5.6 ms (11.58%), and 4.3 ms (7.67%) in Scenarios A, B, and C, respectively. Overall, the male and female drivers showed a broadly similar pattern of MSD variation across the takeover scenarios and weather conditions, although the significant gender × weather interaction indicates that the magnitude of the gender differences varied somewhat across the weather conditions.
3.5. SA
Table 8 reports the means and standard deviations of the SA under different takeover conditions, and Figure 9 compares the SA between the male and female drivers. In combination with Table 8, Figure 9, and the ANOVA results reported in Section 3.1, these results provide an overall view of how the SA varied across the different takeover scenarios and weather conditions. The results showed that the three-way interaction of gender × scenario × weather on the SA was significant (F(4, 136) = 2.74, p = 0.031, partial η2 = 0.08), indicating that the combined effects of the scenario and weather on the SA differed between the male and female drivers.
Figure 9.
SA for (a) male drivers and (b) female drivers under different conditions. The dashed lines indicate the group mean values (M), and the black dots represent individual observations. (°).
Among the two-way interactions, the gender × scenario interaction was significant (F(1.71, 58.11) = 3.32, p = 0.048, partial η2 = 0.09; Greenhouse–Geisser correction), suggesting that the magnitude of gender differences in the SA varied across the takeover scenarios. The gender × weather interaction was also significant (F(2, 68) = 3.15, p = 0.049, partial η2 = 0.09), indicating that the magnitude of the gender differences in the SA varied across the weather conditions. In contrast, the scenario × weather interaction was not significant (F(4, 136) = 1.63, p = 0.170, partial η2 = 0.05), suggesting that the overall pattern of the SA variation across the weather conditions was broadly similar among the three takeover scenarios.
Regarding the main effects, the main effect of the risk takeover scenario on the SA was significant (F(2, 68) = 160.87, p < 0.001, partial η2 = 0.83). The mean SA increased with the complexity of the risk takeover scenario. In Scenario A, the SA ranged from 6.57° to 8.90°; in Scenario B, from 7.56° to 10.53°; and in Scenario C, from 9.29° to 11.43°. Using the overall mean of Scenario B as the reference, the SA in Scenario A was lower by about 1.35° (14.93%), whereas the SA in Scenario C was higher than in Scenario B by approximately 1.21° (13.32%).
The main effect of the weather conditions on the SA was also significant (F(1.71, 58.11) = 514.46, p < 0.001, partial η2 = 0.94; Greenhouse–Geisser correction). Within the same risk takeover scenario, the largest SA values were observed under the sandstorm conditions (8.61–11.43°), followed by the rain–snow conditions (7.18–10.57°), with the smallest SA under clear weather (6.57–9.51°). Taking the sandstorm conditions as the reference, the SA under the rain–snow conditions decreased by 0.70–1.43° (7.52–16.61%), and clear weather further reduced the SA by 1.66–2.36° (15.16–23.79%).
The main effect of gender on the SA was significant (F(1, 34) = 62.43, p < 0.001, partial η2 = 0.65). Across the three risk takeover scenarios, the female drivers consistently showed a smaller SA than the male drivers. Averaged across weather conditions, the SA for female drivers was lower than that for the male drivers by approximately 0.53° (6.64%), 0.81° (8.58%), and 0.44° (4.22%) in Scenarios A, B, and C, respectively. Overall, the male and female drivers exhibited broadly similar directional trends in SA across the takeover scenarios and weather conditions, but the significant gender × scenario × weather interaction indicates that the magnitude of these combined effects differed between the two groups.
3.6. RCPA
Table 9 reports the means and standard deviations of the RCPA under different takeover conditions, and Figure 10 illustrates the corresponding distributions for the male and female drivers. In combination with Table 9, Figure 10, and the ANOVA results reported in Section 3.1, these results provide an overall view of how the RCPA varied across the different takeover scenarios and weather conditions. The results showed that the three-way interaction of gender × scenario × weather on the RCPA was not significant (F(4, 136) = 0.73, p = 0.576, partial η2 = 0.02), indicating that the combined effects of the scenario and the weather on the RCPA did not differ significantly between the male and female drivers.
Figure 10.
RCPA for (a) male drivers and (b) female drivers under different conditions. The dashed lines indicate the group mean values (M), and the black dots represent individual observations.
Among the two-way interactions, the scenario × weather interaction was significant (F(4, 136) = 12.63, p < 0.001, partial η2 = 0.27), indicating that the relative magnitude of the RCPA varied across the different combinations of takeover scenarios and the weather conditions. In contrast, neither the gender × scenario interaction (F(2, 68) = 0.63, p = 0.536, partial η2 = 0.02) nor the gender × weather interaction (F(2, 68) = 0.41, p = 0.665, partial η2 = 0.01) reached significance, suggesting that the overall pattern of gender differences in the RCPA was broadly consistent across the scenarios and weather conditions.
Regarding the main effects, the main effect of the risk takeover scenario on the RCPA was significant (F(2, 68) = 277.41, p < 0.001, partial η2 = 0.89). In Scenario A, the RCPA ranged from 0.56 to 1.46; in Scenario B, from 0.87 to 2.13; and in Scenario C, from 1.42 to 2.75. At the level of overall means, the RCPA was higher in Scenarios B and C than in Scenario A, and higher in Scenario C than in Scenario B, exhibiting a clear increasing pattern with the complexity of the risk takeover scenario.
The main effect of weather condition on the RCPA was also significant (F(2, 68) = 368.21, p < 0.001, partial η2 = 0.92). Within the same takeover scenario, the highest RCPA values were observed under the sandstorm conditions (1.22–2.75), followed by the rain–snow conditions (0.89–2.22), with the lowest values under clear weather (0.56–1.76). Relative to the sandstorm conditions, the mean RCPA under the rain–snow conditions decreased by approximately 0.30–0.75, and under clear weather decreased by about 0.57–1.15.
The main effect of gender on the RCPA was significant (F(1, 34) = 71.67, p < 0.001, partial η2 = 0.68). Across all three risk takeover scenarios, the female drivers consistently showed higher RCPA values than the male drivers. Averaged across the weather conditions, the RCPA for the female drivers exceeded that for the male drivers by approximately 0.29, 0.33, and 0.31 in Scenarios A, B, and C, respectively (corresponding roughly to increases of 16–32% in each scenario). Overall, the male and female drivers showed a broadly similar pattern of RCPA variation across the takeover scenarios and weather conditions, while the takeover scenario and weather condition jointly influenced the overall magnitude of the RCPA.
4. Discussion
4.1. Risk Takeover Situations and Visual Strategies
From the eye-movement results, a relatively consistent pattern of visual adaptation during the takeover phase can be identified: both the risk takeover scenarios and weather conditions exerted significant main effects on the visual strategies and, through their interaction with the situational context and visibility, systematically altered the drivers’ fixation rhythm, spatial search range, and workload level within the takeover window. Overall, the drivers do not simply respond to an increased risk by uniformly speeding up visual scanning or globally raising arousal. Instead, under different combinations of risk types and visibility levels, they adaptively adjust the combination of fixation rhythm, gaze search range, and workload level to cope with the changes in information uncertainty and time pressure.
This overall pattern is broadly consistent with the previous findings on the relationship between situational complexity, time margin, and visual adaptation, while also highlighting several specific features of the grassland highway context. The prior studies in urban roads and freeways have shown that when the driving situation is more threatening or the available time margin is shorter, drivers tend to increase fixation frequency and make more frequent gaze shifts to accelerate the environmental information that is updating and shorten the time that is required to reconstruct the situation awareness [57,58]. In contrast, under conditions with lower threat levels or more predictable risk structures, visual behavior tends to be characterized by longer fixations and relatively stable saccade rates, forming a more rhythmic scanning pattern [59,60]. In the present study, Scenario B, representing the low-speed vehicle merging from an on-ramp, is closer to the former type of situation: the direction of the threat is relatively clear and is mainly associated with the merging vehicle on the right, whereas the available time margin after the takeover and the potential evolution of the TTC are unstable. The results indicate that in this unidirectional dynamic interference scenario, the drivers tend to adopt a combination of higher FR and shorter MFD, rapidly and densely sampling the area ahead and the front-right region to continuously track the merging vehicle’s speed and position. This visual strategy is consistent with the patterns observed in previous research under high-threat takeover situations with relatively well-structured environments and pronounced time pressure [48,61,62], and it reflects the adaptive response of drivers to takeover-related time pressure and attentional allocation.
In contrast, Scenario C more closely resembles an unstructured, multi-source risk situation. The large number of animals, their wide spatial distribution, and their irregular movement trajectories expand the potential threat region of the takeover scenario to encompass the entire traffic lane and roadside area, making the spatial boundaries of risk more diffuse. In such scenarios, the drivers’ visual behavior no longer primarily relies on high-frequency fixations and localized intensified monitoring. Instead, it is characterized by a longer MSD, a larger SA, and a pronounced increase in the RCPA. This indicates that drivers need to shift their gaze frequently across a wider spatial range and invest more processing time after each saccade to integrate dynamic information from multiple directions, while maintaining an overall grasp of the situation under a heightened visual workload. This shift from “high threat but relatively well-structured” to “high threat and structurally ambiguous” is consistent with the perspectives of the visual search theory and the mental workload theory, namely that when a task expands from locally predictable threats to broad, unstructured threats, the visual system transitions from local monitoring to wide-area search and integration, accompanied by a higher cognitive load and a physiological arousal [46].
From the perspective of the attention resource theory and the multiple resource theory [63], the present findings provide clues about the mechanism of the resource redistribution during the takeover tasks. Scenario A, which represents a predictable static obstacle, is relatively stable in its temporal and spatial structure. Although a collision risk is present, the threat is primarily concentrated in the longitudinal dimension. In this case, the drivers can rely on a longer MFD and a moderate FR to continuously monitor the object ahead within a limited field of view, with attentional resources mainly devoted to maintaining headway and controlling the longitudinal risk along a single channel. By contrast, Scenario B and Scenario C introduce lateral motion interference and multi-source, unstructured disturbances, forcing the drivers to expand their limited perceptual and cognitive resources from a purely longitudinal dimension to multiple dimensions: on the one hand, monitoring the TTC, and on the other, continuously estimating the lateral relative speed, the potential lateral deviation paths, and the roadway boundaries as well as the roadside environmental conditions. This redistribution of resources is externally manifested at the eye-movement level as systematic changes in fixation and saccade parameters, together with a sustained elevation in pupillary workload, which is reflected in the RCPA.The role of weather conditions can be understood as a superimposed modulation of the above visual strategies. Under clear weather, the scene information quality is high, and the boundaries are clearly defined, so the drivers can effectively scan the key regions by relying on a smaller SA and relatively shorter MSD, while maintaining situation awareness at a moderate workload level. In contrast, under the rain–snow and sandstorm conditions, the visibility decreases, the contrast is reduced, and the edges become blurred. Therefore, the same visual search task requires saccades with larger spatial extent, longer saccade durations, and stronger demands for information integration, which jointly elevate the MSD, the SA, and the RCPA. Previous studies have interpreted behavioral changes under adverse weather from a risk compensation perspective, suggesting that drivers may increase their monitoring intensity and attend earlier to potential risk targets to actively counteract the increased risk associated with the degraded perceptual capability [64,65]. The eye-movement results of this study provide partial support for this view: under the rain–snow conditions, the increases in the FR and the RCPA, although evident, can still be interpreted as an active compensatory strategy, whereas under the sandstorm conditions, the substantially larger increase in the RCPA indicates that the visual channel may be approaching its capacity limit. This is consistent with Pouliou’s finding that an excessively high workload may, in fact, impair decision quality [66].
It is also noteworthy that the scenario × weather interaction is significant for the RCPA and related indices, indicating that the combination of the risk takeover scenario type and the weather conditions does not simply add linearly in terms of visual load, but jointly determines the boundary and upper limit of the visual resource allocation. Under Scenario A, which is structurally clear and has predictable threats, the increases in the RCPA under the rain–snow and sandstorm conditions are relatively modest, primarily reflecting the additional perceptual costs associated with a static, predictable risk. In contrast, under the multi-source, unstructured Scenario C, the same loss of visibility and additional visual interference, when superimposed on a complex risk structure, lead to a pronounced enhancement of pupillary responses. This suggests that the drivers are not only forced to expand their spatial search range but are also pushed into a higher band of global arousal and tension. Such a “situation structure × visibility condition” coupling effect has received relatively limited systematic discussion in the existing takeover research focused on urban roads and freeways, and thus represents an important contribution to the grassland highway as a special traffic ecosystem to the broader understanding of automated driving takeover issues.
4.2. Gender Differences in Visual Resource Allocation and Workload Responses
Before presenting the gender-related results, it should be noted that the present sample consisted only of university students aged 20–26 years with a relatively narrow range of driving experience. The findings in this section, therefore, reflect the patterns observed within this specific sample.
In the sample and scenario conditions of this study, gender-related differences are mainly reflected at two levels. First, at the overall level, across most combinations of risk takeover scenarios and weather conditions, the female drivers exhibit a higher FR, a shorter MFD, a slightly higher MSD and RCPA, and a slightly lower SA than the male drivers. In other words, within the same takeover window, the female drivers tend to adopt a fixation pattern characterized by a higher frequency and a shorter single-fixation duration, accompanied by denser gaze shifts and a slightly higher level of physiological workload. Male drivers, in contrast, show longer single fixations, slightly larger saccade amplitudes, and relatively lower FRs and RCPAs, which corresponds more closely to a sampling mode with somewhat larger “steps” and a slightly slower updating rhythm. It should be emphasized that these differences are statistical tendencies observed under the specific scenarios, sample composition, and data-processing methods of this study, and do not imply strict one-to-one correspondences at the individual level. Second, these differences appeared as directionally similar patterns for most indices, although their magnitude varied across the risk takeover scenarios and weather conditions. Under complex situations and low-visibility conditions, the FR and the RCPA increase for both genders, yet the increase is often more pronounced among the female drivers, suggesting a possible tendency toward a more tense or vigilant state under high-load conditions within the present sample; under relatively simple situations with good visibility, gender differences tend to converge. This indicates that gender-related differences do not remain constant in strength but instead exhibit a certain degree of context dependence.
This pattern is broadly consistent with the observations reported in some studies on hazard perception and risk behavior, although such comparisons should be made cautiously. A number of studies have shown that, under uncertain conditions, women often display a higher risk sensitivity and a more cautious operational tendency [67], whereas men are more efficiency-oriented and more willing to tolerate higher levels of time pressure and environmental uncertainty [68]. At the level of visual behavior, this difference is typically manifested in the earlier and more frequent initiation of environmental monitoring for the former and a greater reliance on broader spatial-range search and integration for the latter [69]. In the student sample of the present study, the higher FR, shorter MFD, and higher RCPA observed among the female drivers are consistent with a strategy characterized as “more sensitive and more defensive, at the cost of higher physiological expenditure”, whereas the male drivers’ slightly larger SA and relatively lower RCPA in most conditions are more in line with a strategy of “maintaining a wider field of view and lower instantaneous workload while ensuring safety”.
When considered from the perspective of visual and cognitive style, these results may be interpreted as reflecting two relatively different tendencies in resource allocation within this specific sample, one closer to intensive monitoring focused on the near-front and local regions, emphasizing high-frequency updating to capture environmental changes and the other more reliant on integrating information over a larger spatial range, using larger saccadic steps to maintain a grasp of the overall layout and distal risks. The existing research in cognitive psychology has pointed out that individuals differ systematically in their tendency toward local versus global processing and in their dependence on background information, and that these differences influence their search strategies and decision-making styles under high-uncertainty conditions [70,71]. The eye-movement findings of this study provide a preliminary set of empirical observations on how such differences are manifested in the automated driving takeover tasks.
Taken together, the findings presented in this section do not aim to offer a simple comparison of “which gender performs better” but rather indicate that, within the narrow young-student sample examined in this study, there were two relatively stable patterns of visual resource utilization, and gender was statistically associated with these patterns. A more cautious implication is that these findings provide a preliminary behavioral basis for considering individual strategic differences in future takeover models, rather than relying solely on an “average driver” assumption.
4.3. Implications for the Design of the HMCODR Systems on Grassland Highways
This study examines how risk takeover scenarios, weather conditions, and gender differences influence visual behavior during the takeover phase, and provides several pieces of evidence that can be translated into engineering design principles. Overall, in the special takeover environment of grassland highways, the system design should be jointly optimized from three perspectives: the takeover management, the HMI, and the modeling of individual differences.
First, the takeover management needs to be adaptive to both situation and weather, rather than relying on a single fixed threshold. The results presented above show that the drivers’ visual workload and search demands differ across risk types and visibility conditions, with highly complex scenarios and low-visibility conditions more likely to push visual resources into a high-load state. Therefore, for structurally clear and highly predictable static risks such as a stationary vehicle ahead, it is reasonable to adopt a relatively simplified takeover process and a moderate takeover time budget. In contrast, in scenarios involving the merging of ramp vehicles, livestock occupying the lane, and adverse weather such as rain–snow or sandstorms, it is necessary to advance the timing of takeover requests based on the scenario complexity and the visibility level, and to combine this with strategies such as automatic speed reduction and gradual longitudinal control, so as to reserve more time for the drivers to rebuild their situation awareness.
Second, the HMI should highlight key cues directly related to the current risk, while keeping the overall information load under control. The coupled changes observed across multiple eye-movement metrics indicate that, under conditions of high uncertainty and great perceptual difficulty, drivers often need to expand their search range and tolerate a higher visual workload. If the interface overlays a large amount of secondary information at this moment, it is likely to further consume the limited pool of attentional resources. For the takeover scenarios on grassland highways, the HMI design should therefore compress irrelevant or low-value prompts as far as possible and focus on a small set of key pieces of information that are directly related to the current target risk. The spatially directed cues and progressive warning levels can be used to guide the driver’s gaze rapidly toward the risk area, reduce inefficient scanning time, and thereby maintain the necessary monitoring capability while avoiding an unnecessary additional load.
Third, individual differences need to be explicitly considered at the system level, rather than relying solely on the assumption of an “average driver.” The study found stable main effects of gender on multiple eye-movement metrics, and some indicators showed interactions with the scenario and weather. This suggests that there are consistent individual-difference patterns in visual search rhythm and workload responses. This does not imply that gender itself should be directly used as an input variable in the algorithm; instead, it indicates that HMCODR systems should establish individualized baselines and adaptive strategies based on the gaze and pupil data. During operation, the system can gradually learn each driver’s typical eye-movement levels and dynamically adjust the prompt intensity and information density accordingly. For drivers who are more prone to entering high-workload or high-tension states, the interface and prompts can be appropriately simplified; for drivers with a relatively narrow search range or slower responses, spatial guidance and redundant reminders can be strengthened at critical moments.
Taken together, in the context of grassland highways—characterized by non-conventional road structures, a high propensity for road hypnosis, and highly uncertain environmental conditions—relying solely on a uniform takeover threshold and a fixed interface is no longer sufficient to ensure takeover safety. Introducing situation and weather-based takeover management, HMIs that actively regulate the visual workload and adaptive mechanisms tailored to individual differences constitute a key direction for enhancing the safety and adaptability of the HMCODR systems on grassland highways.
4.4. Limitations and Future Directions
Although this study provides preliminary evidence on visual behavior characteristics during the takeover in HMCODR on grassland highways, several limitations should be acknowledged. First, the experiment was conducted on a driving simulator. Despite efforts to approximate the real grassland-highway environment in terms of road geometry, traffic composition, and typical risk sources, it remains difficult to fully reproduce the multi-source sensory inputs and the cumulative fatigue and time pressure associated with long-duration real-world driving. Accordingly, the present findings are better understood as patterns of visual strategies that are observed under controlled, high-fidelity conditions, and their generalizability to open-road and long-term driving conditions still requires further validation. Second, no separate baseline scenario was included in the present study. Given that the experiment focused on comparing different types of risk takeover scenarios, a neutral or no-event driving condition was not further introduced as an independent baseline. Nevertheless, the absence of an explicit baseline scenario still limited the direct comparison between the takeover and the non-takeover states. Future studies may address this issue by incorporating a dedicated baseline scenario. Third, the dependent variables in this study were mainly eye-movement metrics; takeover reaction time, longitudinal and lateral control quality, and other behavioral outcome indicators were not yet systematically incorporated, nor were the subjective measures such as perceived workload and risk perception. As a result, the present research primarily reveals the process characteristics of visual attention allocation and workload regulation, rather than directly assessing the “quality” of these strategies in terms of safety outcomes. Fourth, the takeover requests in the present study were delivered only through a voice prompt. In real-world human–machine co-driving systems, takeover alerts may also include visual and haptic components, and such multi-modal alerts could alter the drivers’ eye-movement behavior by increasing alert salience, guiding the gaze more rapidly toward hazard-relevant regions, and reducing the inefficient visual search [40,41]. Fifth, the sample consisted of 36 university student drivers. Although the gender balance was maintained and all participants had basic driving experience, their age and driving-experience distributions were relatively narrow, making it difficult to represent older drivers or highly experienced professional drivers. Therefore, the conclusions related to gender should be interpreted as findings within a specific group of “young drivers with low-to-moderate driving experience who are potential early adopters of automated driving,” and the applicability to broader populations remains to be examined.
In light of these limitations, future research can proceed in several directions. First, building on the present work, future studies may integrate takeover performance indicators and collision-risk metrics to examine the concrete impact of different visual strategies on safety outcomes and to evaluate their potential applications in online monitoring and the early warning of takeover quality. Second, the current findings should be replicated and extended in larger and more diverse driver samples to further explore the interaction between gender and other individual-difference variables such as age, driving experience, and risk preference. Third, future studies should compare voice-only and multi-modal takeover alerts to clarify how different alert modalities influence visual behavior, gaze guidance, and takeover performance under complex scenarios and adverse weather conditions. Fourth, the conclusions derived from simulation-based experiments should be validated in scenarios that more closely approximate real operating environments; on this basis, more operational design recommendations can be developed for HMI designs, takeover-request strategies, and personalized assistance systems tailored to grassland-highway conditions.
5. Conclusions
Drawing on a grassland highway HMCODR takeover experiment, this study systematically examined how visual behavior within the takeover window varied across risk takeover scenarios, weather conditions, and gender groups, using five eye-movement indices covering fixation, saccade and pupil responses. The results show that visual behavior can finely characterize how drivers adjust attention allocation and workload under multiple forms of pressure and provide new evidence for understanding takeover mechanisms in the special context of grassland highways.
Across the combinations of risk takeover scenarios and weather conditions on grassland highways, the scene structure and visibility jointly shaped the takeover visual strategies. In structurally clear and predictable situations, such as a stationary vehicle ahead, the drivers mainly relied on moderate fixation frequency and relatively focused gaze allocation to monitor the longitudinal risk. The low-speed merging of a vehicle from an on-ramp elicited higher-frequency, shorter fixations and denser scanning to cope with the unstable time margins. In contrast, the unstructured risk situations, such as the multi-source livestock intrusion, markedly increased the saccade duration, saccade amplitude and pupil fluctuation, reflecting a wider-range search and a higher-load state. The rain–snow and sandstorm conditions further amplified these differences, with the interaction between the scene structure and visibility jointly determining the upper bound to which the visual resources can be pushed.
The eye-movement indices exhibited clear joint patterns of change, revealing adaptive regulation mechanisms in response to environmental complexity and perceptual difficulty. Overall, higher situational complexity and poorer visibility were often accompanied by a coordinated pattern of a faster fixation rhythm, a wider search range and a higher workload. However, the specific combination of indices differed by the risk structure: unidirectional dynamic interference primarily strengthened the frequency dimension, whereas multi-source unstructured risk exerted more pronounced effects on the spatial range and workload. This indicates that the takeover visual behavior is not a simple matter of “the more dangerous, the more anxious” but instead reflects targeted strategy combinations shaped by the degree of risk structuring, the number of interfering sources, and the quality of perceptual signals.
Within the narrow young-student sample examined in this study, gender was statistically associated with differences in visual resource use. Overall, the female drivers showed higher fixation frequency, shorter single fixations, and slightly higher saccade duration and pupil fluctuation, whereas male drivers tended to adopt slightly larger saccade amplitudes and relatively lower instantaneous workloads. The direction of these differences remained fairly stable across the scenarios and weather conditions, but their magnitude was further amplified under complex situations and low visibility. Rather than being interpreted as broad gender-based conclusions, these findings are better understood as preliminary patterns observed within a specific sample; in this sense, gender may be more cautiously viewed as a label variable that is associated with different tendencies in visual–cognitive processing, with one pattern leaning toward high-frequency, locally focused monitoring and the other leaning toward broader spatial integration with larger saccadic steps.
Taken together, this study provides grassland-highway-based support for theoretical discussions on the relationships among situational complexity, time pressure and attention resource allocation, and offers a quantifiable behavioral basis for designing takeover management, HMI and individual-difference modeling tailored to grassland HMCODR.
Author Contributions
Conceptualization, T.J. and H.W.; methodology, H.L.; formal analysis, T.J.; data curation, T.J. and H.L.; writing—original draft preparation, T.J. and M.G.; writing—review and editing, T.J., M.G., H.W. and H.L.; visualization, T.J.; supervision, H.W.; project administration, M.G.; funding acquisition, M.G. All authors have read and agreed to the published version of the manuscript.
Funding
This research was supported by the Inner Mongolia Autonomous Region Higher Educational Institutions Young Scientific and Technological Talents Development Project (Innovation Team) (Grant No. NMGIRT2304), the Science and Technology Program of Inner Mongolia Autonomous Region (Grant No. 2025YFH0207), and the Natural Science Foundation of Inner Mongolia Autonomous Region (Grant No. 2024QN07001).
Institutional Review Board Statement
The study was conducted in accordance with the Declaration of Helsinki and approved by the Scientific Research and Academic Ethics Committee of the Inner Mongolia Agricultural University (protocol code NNDKY2024007; date of approval: [8 October 2024]).
Informed Consent Statement
Written informed consent has been obtained from the participants to publish this paper.
Data Availability Statement
The data presented in this study are available on request from the corresponding author due to their ongoing use in follow-up studies and extended analyses.
Acknowledgments
We are grateful to Mingxing Gao for his selfless guidance in providing experimental materials and writing ideas during the experiment and paper-writing process. At the same time, we would also like to thank the School of Energy and Transportation Engineering of Inner Mongolia Agricultural University for setting up the experimental environment and providing experimental sites.
Conflicts of Interest
The authors declare no conflicts of interest.
Abbreviations
The following abbreviations are used in this manuscript:
| FR | Fixation rate |
| HMCODR | Human–machine co-driving |
| HMI | Human–machine interface |
| MFD | Mean fixation duration |
| MSD | Mean saccade duration |
| RCPA | Relative change intensity of pupil area |
| SA | Saccade amplitude |
References
- Gherardini, L.; Cabri, G. The impact of autonomous vehicles on safety, economy, society, and environment. World Electr. Veh. J. 2024, 15, 579. [Google Scholar] [CrossRef] [Scilit]
- Olayode, I.O.; Du, B.; Severino, A.; Campisi, T.; Alex, F.J. Systematic literature review on the applications, impacts, and public perceptions of autonomous vehicles in road transportation system. J. Traffic Transp. Eng. (Engl. Ed.) 2023, 10, 1037–1060. [Google Scholar] [CrossRef] [Scilit]
- Zhu, Y.; Li, C.; Qiao, Z.; Qu, R.; Wang, Y.; Xiong, J.; Liu, W. From distraction to action: Elevating situation awareness with visual assistance in level 3 autonomous driving. Int. J. Hum.–Comput. Interact. 2025, 41, 4271–4283. [Google Scholar] [CrossRef] [Scilit]
- Perrotte, G.; Bougard, C.; Portron, A.; Vercher, J.-L. Monitoring driver drowsiness in partially automated vehicles: Added value from combining postural and physiological indicators. Transp. Res. Part F Traffic Psychol. Behav. 2024, 100, 458–474. [Google Scholar] [CrossRef] [Scilit]
- Figalová, N.; Bieg, H.-J.; Schulz, M.; Pichen, J.; Baumann, M.; Chuang, L.L.; Pollatos, O. Fatigue and mental underload further pronounced in L3 conditionally automated driving: Results from an EEG experiment on a test track. In Companion Proceedings of the 28th International Conference on Intelligent User Interfaces; Association for Computing Machinery: New York, NY, USA, 2023. [Google Scholar]
- Gonçalves, R.C.; Goodridge, C.M.; Kuo, J.; Lenné, M.G.; Merat, N. Using driver monitoring to estimate readiness in automation: A conceptual model based on simulator experimental data. Cogn. Technol. Work. 2024, 26, 569–584. [Google Scholar] [CrossRef] [Scilit]
- Liang, K.; Kästle, J.L.; Anvari, B.; Calvert, S.C.; van Lint, J. Multidimensional Assessment of Takeover Performance in Conditionally Automated Driving. arXiv 2025, arXiv:2507.22252. [Google Scholar] [CrossRef] [Scilit]
- DeGuzman, C.A.; Hopkins, S.A.; Donmez, B. Driver takeover performance and monitoring behavior with driving automation at system-limit versus system-malfunction failures. Transp. Res. Rec. 2020, 2674, 140–151. [Google Scholar] [CrossRef] [Scilit]
- Yang, W.; Wu, Z.; Tang, J.; Liang, Y. Assessing the effects of modalities of takeover request, lead time of takeover request, and traffic conditions on takeover performance in conditionally automated driving. Sustainability 2023, 15, 7270. [Google Scholar] [CrossRef] [Scilit]
- Nagy, V.; da Luz, D.M.; Sándor, Á.P.; Borsos, A. Evaluation of Autonomous Vehicle Takeover Performance in Work-Zone Environment. Eng. Proc. 2024, 79, 59. [Google Scholar]
- Sekadakis, M.; Yannis, G. Systematic review and meta-analysis of take-over time from automated driving at SAE levels 2 and 3 to manual control. Transp. Res. Part F Traffic Psychol. Behav. 2025, 113, 263–306. [Google Scholar] [CrossRef] [Scilit]
- Soares, S.; Lobo, A.; Ferreira, S.; Cunha, L.; Couto, A. Takeover performance evaluation using driving simulation: A systematic review and meta-analysis. Eur. Transp. Res. Rev. 2021, 13, 47. [Google Scholar] [CrossRef] [Scilit]
- Hu, W.; Zhang, T.; Zhang, Y.; Chan, A.H.S. Non-driving-related tasks and drivers’ takeover time: A meta-analysis. Transp. Res. Part F Traffic Psychol. Behav. 2024, 103, 623–637. [Google Scholar]
- Pakdamanian, E.; Sheng, S.; Baee, S.; Heo, S.; Kraus, S.; Feng, L. Deeptake: Prediction of driver takeover behavior using multimodal data. In Proceedings of the 2021 CHI Conference on Human Factors in Computing Systems, Online, 8–13 May 2021. [Google Scholar]
- Du, N.; Yang, X.J.; Zhou, F. Psychophysiological responses to takeover requests in conditionally automated driving. Accid. Anal. Prev. 2020, 148, 105804. [Google Scholar] [CrossRef] [Scilit]
- Weaver, B.W.; DeLucia, P.R. A systematic review and meta-analysis of takeover performance during conditionally automated driving. Hum. Factors 2022, 64, 1227–1260. [Google Scholar] [CrossRef] [Scilit] [PubMed]
- Gold, C.; Damböck, D.; Lorenz, L.; Bengler, K. “Take over!” How long does it take to get the driver back into the loop? In Proceedings of the Human Factors and Ergonomics Society Annual Meeting; Sage Publications: Los Angeles, CA, USA, 2013. [Google Scholar]
- Pipkorn, L.; Dozza, M.; Tivesten, E. Driver visual attention before and after take-over requests during automated driving on public roads. Hum. Factors 2024, 66, 336–347. [Google Scholar] [CrossRef] [Scilit] [PubMed]
- Jia, L.; Huang, C.; Du, N. Drivers’ situational awareness of surrounding vehicles during takeovers: Evidence from a driving simulator study. Transp. Res. Part F Traffic Psychol. Behav. 2024, 106, 340–355. [Google Scholar] [CrossRef] [Scilit]
- Wu, C.; Wu, H.; Lyu, N.; Zheng, M. Take-over performance and safety analysis under different scenarios and secondary tasks in conditionally automated driving. IEEE Access 2019, 7, 136924–136933. [Google Scholar] [CrossRef] [Scilit]
- Lin, Q.; Li, S.; Ma, X.; Lu, G. Understanding take-over performance of high crash risk drivers during conditionally automated driving. Accid. Anal. Prev. 2020, 143, 105543. [Google Scholar] [CrossRef] [Scilit]
- Yurtsever, E.; Lambert, J.; Carballo, A.; Takeda, K. A survey of autonomous driving: Common practices and emerging technologies. IEEE Access 2020, 8, 58443–58469. [Google Scholar] [CrossRef] [Scilit]
- Zhang, Y.; Carballo, A.; Yang, H.; Takeda, K. Perception and sensing for autonomous vehicles under adverse weather conditions: A survey. ISPRS J. Photogramm. Remote Sens. 2023, 196, 146–177. [Google Scholar]
- Louw, T.; Markkula, G.; Boer, E.; Madigan, R.; Carsten, O.; Merat, N. Coming back into the loop: Drivers’ perceptual-motor performance in critical events after automated driving. Accid. Anal. Prev. 2017, 108, 9–18. [Google Scholar] [CrossRef] [Scilit]
- Vogelpohl, T.; Kühn, M.; Hummel, T.; Gehlert, T.; Vollrath, M. Transitioning to manual driving requires additional time after automation deactivation. Transp. Res. Part F Traffic Psychol. Behav. 2018, 55, 464–482. [Google Scholar] [CrossRef] [Scilit]
- Ding, X.; Du, Z.; Gao, M.; Wang, H. Assessment of takeover safety in human–machine co-driving on grassland highways: Coupling effects of non-driving-related tasks and takeover scenarios. Transp. Res. Part F Traffic Psychol. Behav. 2025, 114, 376–408. [Google Scholar] [CrossRef] [Scilit]
- Lyu, Z.; Qi, C.; Zhu, S.; Wang, H. The visual scanning behavior and mental workload of drivers at prairie highway intersections with different characteristics. IEEE Access 2022, 10, 123043–123056. [Google Scholar] [CrossRef] [Scilit]
- Zhang, Y.; Zhu, S. Study on the effect of driving time on fatigue of grassland road based on EEG. J. Healthc. Eng. 2021, 2021, 9957828. [Google Scholar] [PubMed]
- Radlmayr, J.; Gold, C.; Lorenz, L.; Farid, M.; Bengler, K. How traffic situations and non-driving related tasks affect the take-over quality in highly automated driving. In Proceedings of the Human Factors and Ergonomics Society Annual Meeting, Chicago, IL, USA, 27–31 October 2014. [Google Scholar]
- Granié, M.-A.; Devif, J.; Moreau, N.; Delannoy, S. Gender differences in drivers’ road risks and gender equality policies: A gender paradox? Comparative analysis of 39 countries. IATSS Res. 2025, 49, 291–304. [Google Scholar]
- Li, S.; Blythe, P.; Zhang, Y.; Edwards, S.; Guo, W.; Ji, Y.; Goodman, P.; Hill, G.; Namdeo, A. Analysing the effect of gender on the human–machine interaction in level 3 automated vehicles. Sci. Rep. 2022, 12, 11645. [Google Scholar] [CrossRef] [Scilit]
- Teshima, T.; Niitsuma, M.; Nishimura, H. Gender affects perception and movement times during non-critical takeovers in conditionally automated driving. Transp. Res. Part F Traffic Psychol. Behav. 2024, 106, 400–417. [Google Scholar]
- Slovic, P. Perception of risk. In The Perception of Risk; Routledge: Abingdon, UK, 2016; pp. 220–231. [Google Scholar]
- Witkin, H.A.; Moore, C.A.; Goodenough, D.R.; Cox, P.W. Field-dependent and field-independent cognitive styles and their educational implications. Rev. Educ. Res. 1977, 47, 1–64. [Google Scholar]
- Evans, T.; Stuckey, R.; Macdonald, W. Young drivers’ perception of hazards: Variation with experience and day versus night. Transp. Res. Part F Traffic Psychol. Behav. 2022, 88, 258–280. [Google Scholar]
- Zhang, X.; Chang, R.; Wang, M.; Sui, X. The influence of driver’s risk perception ability on driving decision-making: An ERP study. Curr. Psychol. 2024, 43, 21995–22005. [Google Scholar] [CrossRef] [Scilit]
- Hőgye-Nagy, Á.; Kovács, G.; Kurucz, G. Acceptance of self-driving cars among the university community: Effects of gender, previous experience, technology adoption propensity, and attitudes toward autonomous vehicles. Transp. Res. Part F Traffic Psychol. Behav. 2023, 94, 353–361. [Google Scholar] [CrossRef] [Scilit]
- China Meteorological Administration. China Meteorological Disasters Yearbook; China Meteorological Administration: Beijing, China, 2022. [Google Scholar]
- China Meteorological Administration. China Climate Bulletin; China Meteorological Administration: Beijing, China, 2022. [Google Scholar]
- Huang, G.; Pitts, B.J. Takeover requests for automated driving: The effects of signal direction, lead time, and modality on takeover performance. Accid. Anal. Prev. 2022, 165, 106534. [Google Scholar] [CrossRef] [Scilit] [PubMed]
- Yoon, S.H.; Kim, Y.W.; Ji, Y.G. The effects of takeover request modalities on highly automated car control transitions. Accid. Anal. Prev. 2019, 123, 150–158. [Google Scholar] [CrossRef] [Scilit]
- Roche, F.; Somieski, A.; Brandenburg, S. Behavioral changes to repeated takeovers in highly automated driving: Effects of the takeover-request design and the nondriving-related task modality. Hum. Factors 2019, 61, 839–849. [Google Scholar] [CrossRef] [Scilit]
- Wang, Y.; Zhang, W.; Zhou, R. Speech-based takeover requests in conditionally automated driving: Effects of different voices on the driver takeover performance. Appl. Ergon. 2022, 101, 103695. [Google Scholar] [CrossRef] [Scilit]
- Deniel, J.; Schnebelen, D.; Reynaud, E.; Ouimet, M.; Navarro, J. Driver’s gaze behaviour before, during and after take-over manoeuvres: Influence of agentivity associated with different automation solutions. Transp. Res. Part F Traffic Psychol. Behav. 2024, 100, 181–196. [Google Scholar] [CrossRef] [Scilit]
- Happee, R.; Gold, C.; Radlmayr, J.; Hergeth, S.; Bengler, K. Take-over performance in evasive manoeuvres. Accid. Anal. Prev. 2017, 106, 211–222. [Google Scholar] [CrossRef] [Scilit]
- Chapman, P.R.; Underwood, G. Visual search of driving situations: Danger and experience. Perception 1998, 27, 951–964. [Google Scholar] [CrossRef] [Scilit]
- Han, L.; Du, Z.; Wang, S.; He, S. The effects of tunnel radius, turn direction, and zone characteristics on drivers’ visual performance. Tunn. Undergr. Space Technol. 2024, 152, 105912. [Google Scholar] [CrossRef] [Scilit]
- Wu, Y.; Kihara, K.; Takeda, Y.; Sato, T.; Akamatsu, M.; Kitazaki, S.; Nakagawa, K.; Yamada, K.; Oka, H.; Kameyama, S. Eye movements predict driver reaction time to takeover request in automated driving: A real-vehicle study. Transp. Res. Part F Traffic Psychol. Behav. 2021, 81, 355–363. [Google Scholar] [CrossRef] [Scilit]
- Guillon, M.; Dumbleton, K.; Theodoratos, P.; Gobbe, M.; Wooley, C.B.; Moody, K. The effects of age, refractive status, and luminance on pupil size. Optom. Vis. Sci. 2016, 93, 1093–1100. [Google Scholar] [CrossRef] [Scilit]
- Ding, X.; Wang, H.; Wang, C.; Guo, M. Analyzing driving safety on prairie highways: A study of drivers’ visual search behavior in varying traffic environments. Sustainability 2023, 15, 12146. [Google Scholar] [CrossRef] [Scilit]
- Kleberg, J.L.; Hallman, A.E.; Astenvald, R.; Nordgren, A.; Falck-Ytter, T.; Van Den Berg, R. Introducing the kollaR package: A user-friendly open-access solution for eye-tracking analysis and visualization. Behav. Res. Methods 2025, 58, 20. [Google Scholar]
- Salvucci, D.D.; Goldberg, J.H. Identifying fixations and saccades in eye-tracking protocols. In Proceedings of the 2000 Symposium on Eye Tracking Research & Applications, Palm Beach Gardens, FL, USA, 6–8 November 2000. [Google Scholar]
- Startsev, M.; Zemblys, R. Evaluating eye movement event detection: A review of the state of the art. Behav. Res. Methods 2023, 55, 1653–1714. [Google Scholar] [PubMed]
- Trabulsi, J.; Norouzi, K.; Suurmets, S.; Storm, M.; Ramsøy, T.Z. Optimizing fixation filters for eye-tracking on small screens. Front. Neurosci. 2021, 15, 578439. [Google Scholar] [CrossRef] [Scilit] [PubMed]
- Fink, L.; Simola, J.; Tavano, A.; Lange, E.; Wallot, S.; Laeng, B. From pre-processing to advanced dynamic modeling of pupil data. Behav. Res. Methods 2024, 56, 1376–1412. [Google Scholar] [CrossRef] [Scilit]
- Geller, J.; Winn, M.B.; Mahr, T.; Mirman, D. GazeR: A package for processing gaze position and pupil size data. Behav. Res. Methods 2020, 52, 2232–2255. [Google Scholar] [CrossRef] [Scilit]
- Marti, P.; Jallais, C.; Koustanaï, A.; Guillaume, A.; Mars, F. Impact of the driver’s visual engagement on situation awareness and takeover quality. Transp. Res. Part F Traffic Psychol. Behav. 2022, 87, 391–402. [Google Scholar] [CrossRef] [Scilit]
- Zhou, F.; Yang, X.J.; De Winter, J.C. Using eye-tracking data to predict situation awareness in real time during takeover transitions in conditionally automated driving. IEEE Trans. Intell. Transp. Syst. 2021, 23, 2284–2295. [Google Scholar] [CrossRef] [Scilit]
- Mackenzie, A.K.; Harris, J.M. Eye movements and hazard perception in active and passive driving. Vis. Cogn. 2015, 23, 736–757. [Google Scholar] [CrossRef] [Scilit]
- Watling, C.N.; Home, M. Hazard perception performance and visual scanning behaviours: The effect of sleepiness. Transp. Res. Part F Traffic Psychol. Behav. 2022, 90, 243–251. [Google Scholar] [CrossRef] [Scilit]
- Huang, C.; Yang, B.; Nakano, K. Impact of duration of monitoring before takeover request on takeover time with insights into eye tracking data. Accid. Anal. Prev. 2023, 185, 107018. [Google Scholar] [CrossRef] [Scilit] [PubMed]
- Ma, J.; Guo, Y.; Xu, W.; Li, J. Effect of directional auditory takeover request on takeover behavior and eye movement in conditionally automated driving. World Electr. Veh. J. 2023, 14, 70. [Google Scholar] [CrossRef] [Scilit]
- Wickens, C.D. Multiple resources and performance prediction. Theor. Issues Ergon. Sci. 2002, 3, 159–177. [Google Scholar] [CrossRef] [Scilit]
- Jägerbrand, A.K.; Sjöbergh, J. Effects of weather conditions, light conditions, and road lighting on vehicle speed. SpringerPlus 2016, 5, 505. [Google Scholar] [CrossRef] [Scilit]
- Melman, T.; Abbink, D.A.; van Paassen, M.M.; Boer, E.R.; de Winter, J.C. What determines drivers’ speed? A replication of three behavioural adaptation experiments in a single driving simulator study. Ergonomics 2018, 61, 966–987. [Google Scholar] [CrossRef] [Scilit]
- Pouliou, A.; Kehagia, F.; Bekiaris, E.; Pitsiava-Latinopoulou, M.; Poulios, G. Mental workload influence of drivers reaction time on unexpected events: A driving simulation study. In Proceedings of the Road Safety and Simulation Conference, Athens, Greece, 8–10 June 2022. [Google Scholar]
- Croson, R.; Gneezy, U. Gender differences in preferences. J. Econ. Lit. 2009, 47, 448–474. [Google Scholar] [CrossRef] [Scilit]
- Harris, C.R.; Jenkins, M. Gender differences in risk assessment: Why do women take fewer risksthan men? Judgm. Decis. Mak. 2006, 1, 48–63. [Google Scholar] [CrossRef] [Scilit]
- Roalf, D.; Lowery, N.; Turetsky, B.I. Behavioral and physiological findings of gender differences in global-local visual processing. Brain Cogn. 2006, 60, 32–42. [Google Scholar] [CrossRef] [Scilit]
- Clément, R.; Jonah, B.A. Field dependence, sensation seeking and driving behaviour. Personal. Individ. Differ. 1984, 5, 87–93. [Google Scholar] [CrossRef] [Scilit]
- Gerlach, C.; Poirel, N. Navon’s classical paradigm concerning local and global processing relates systematically to visual object classification performance. Sci. Rep. 2018, 8, 324. [Google Scholar] [CrossRef] [Scilit]
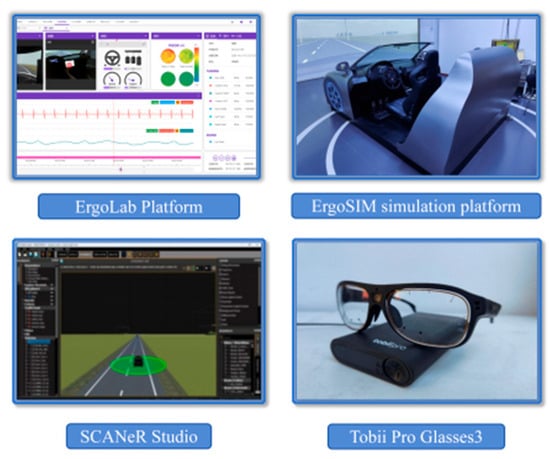
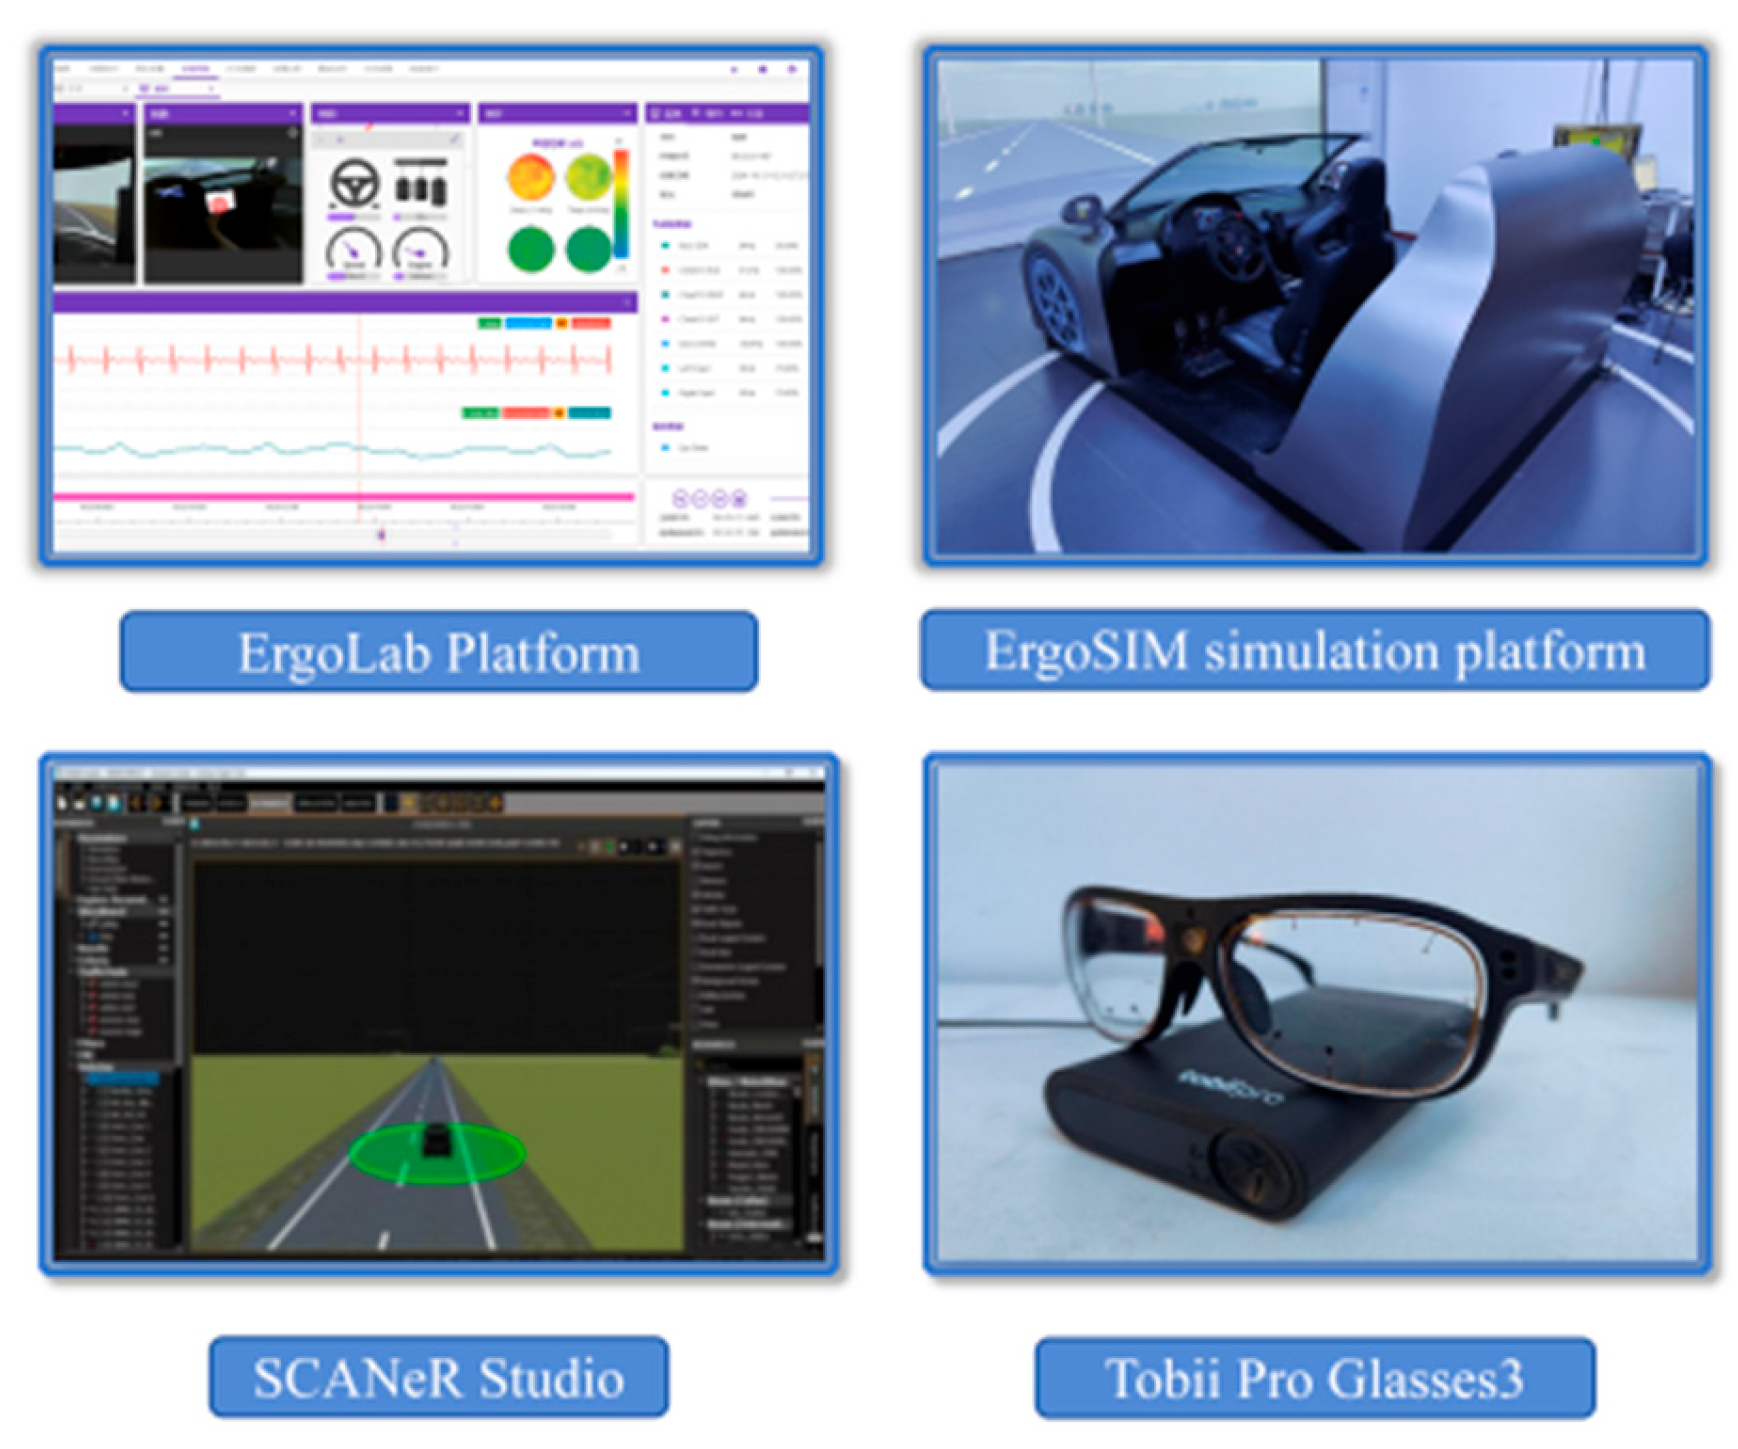
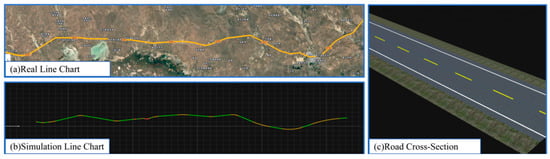
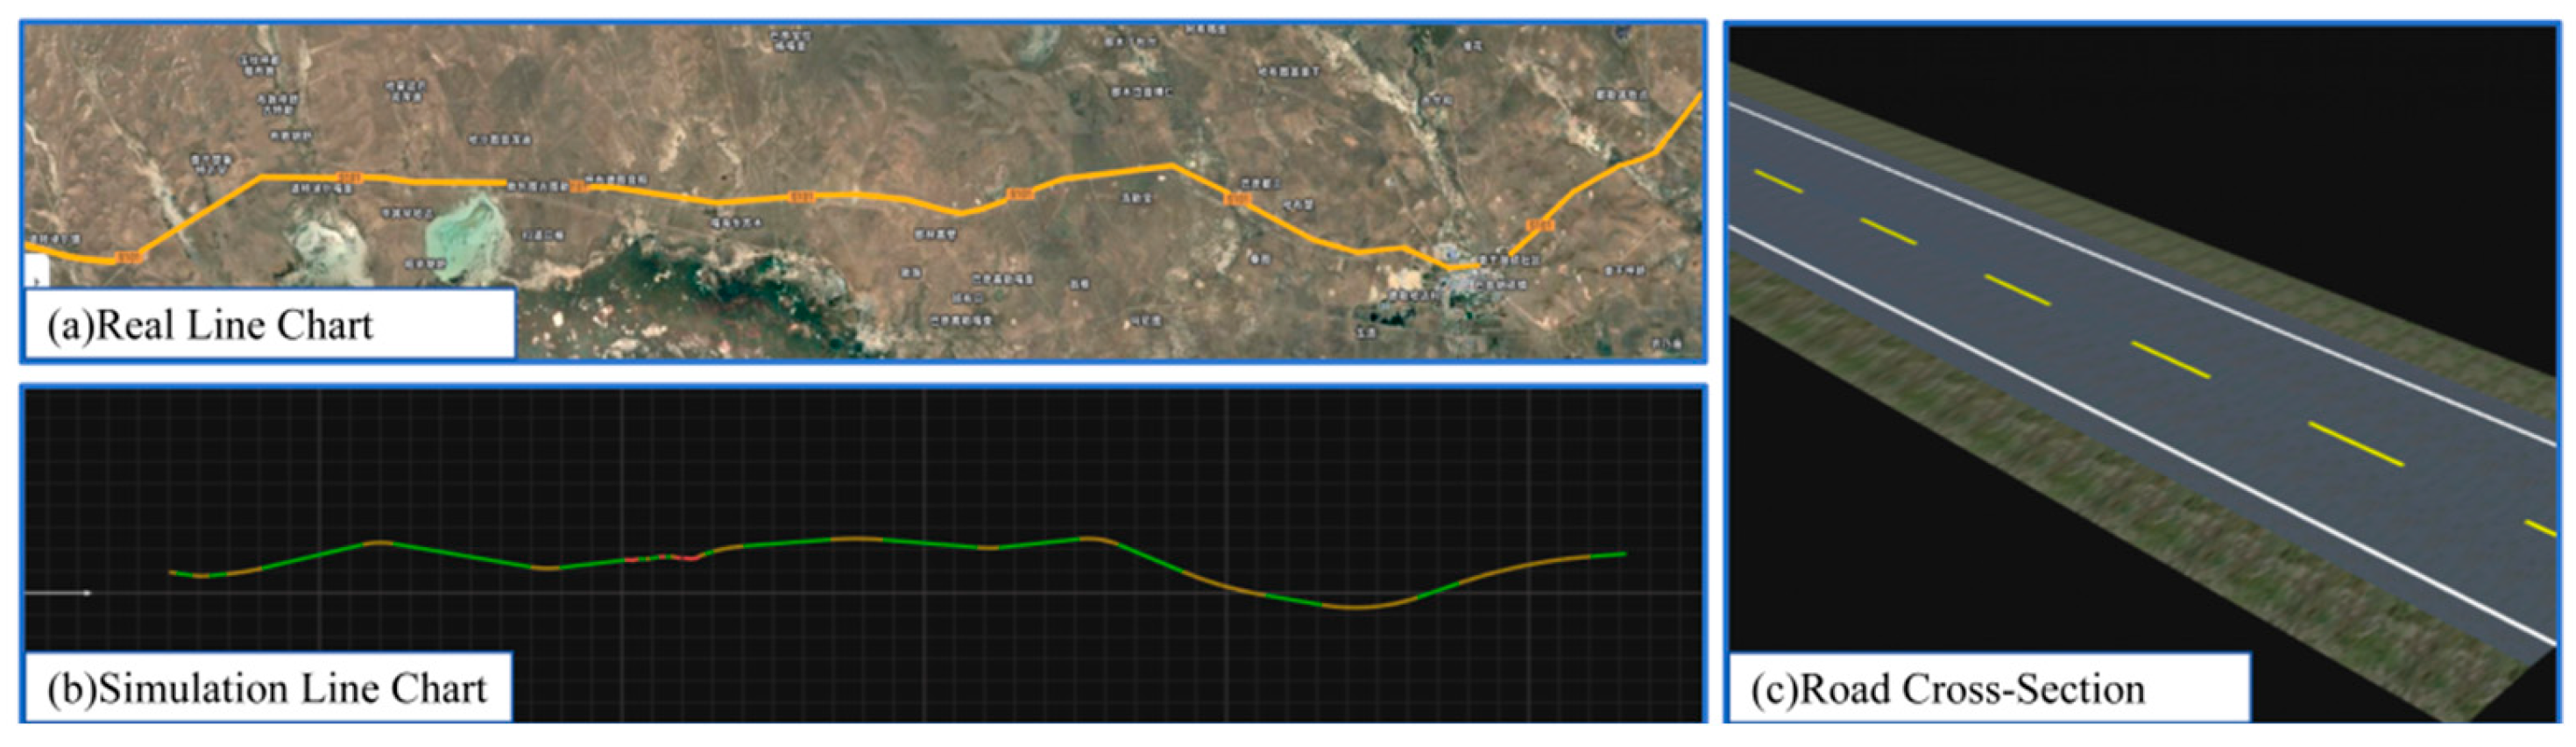




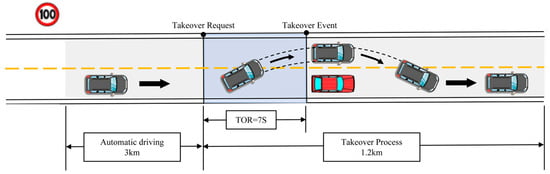
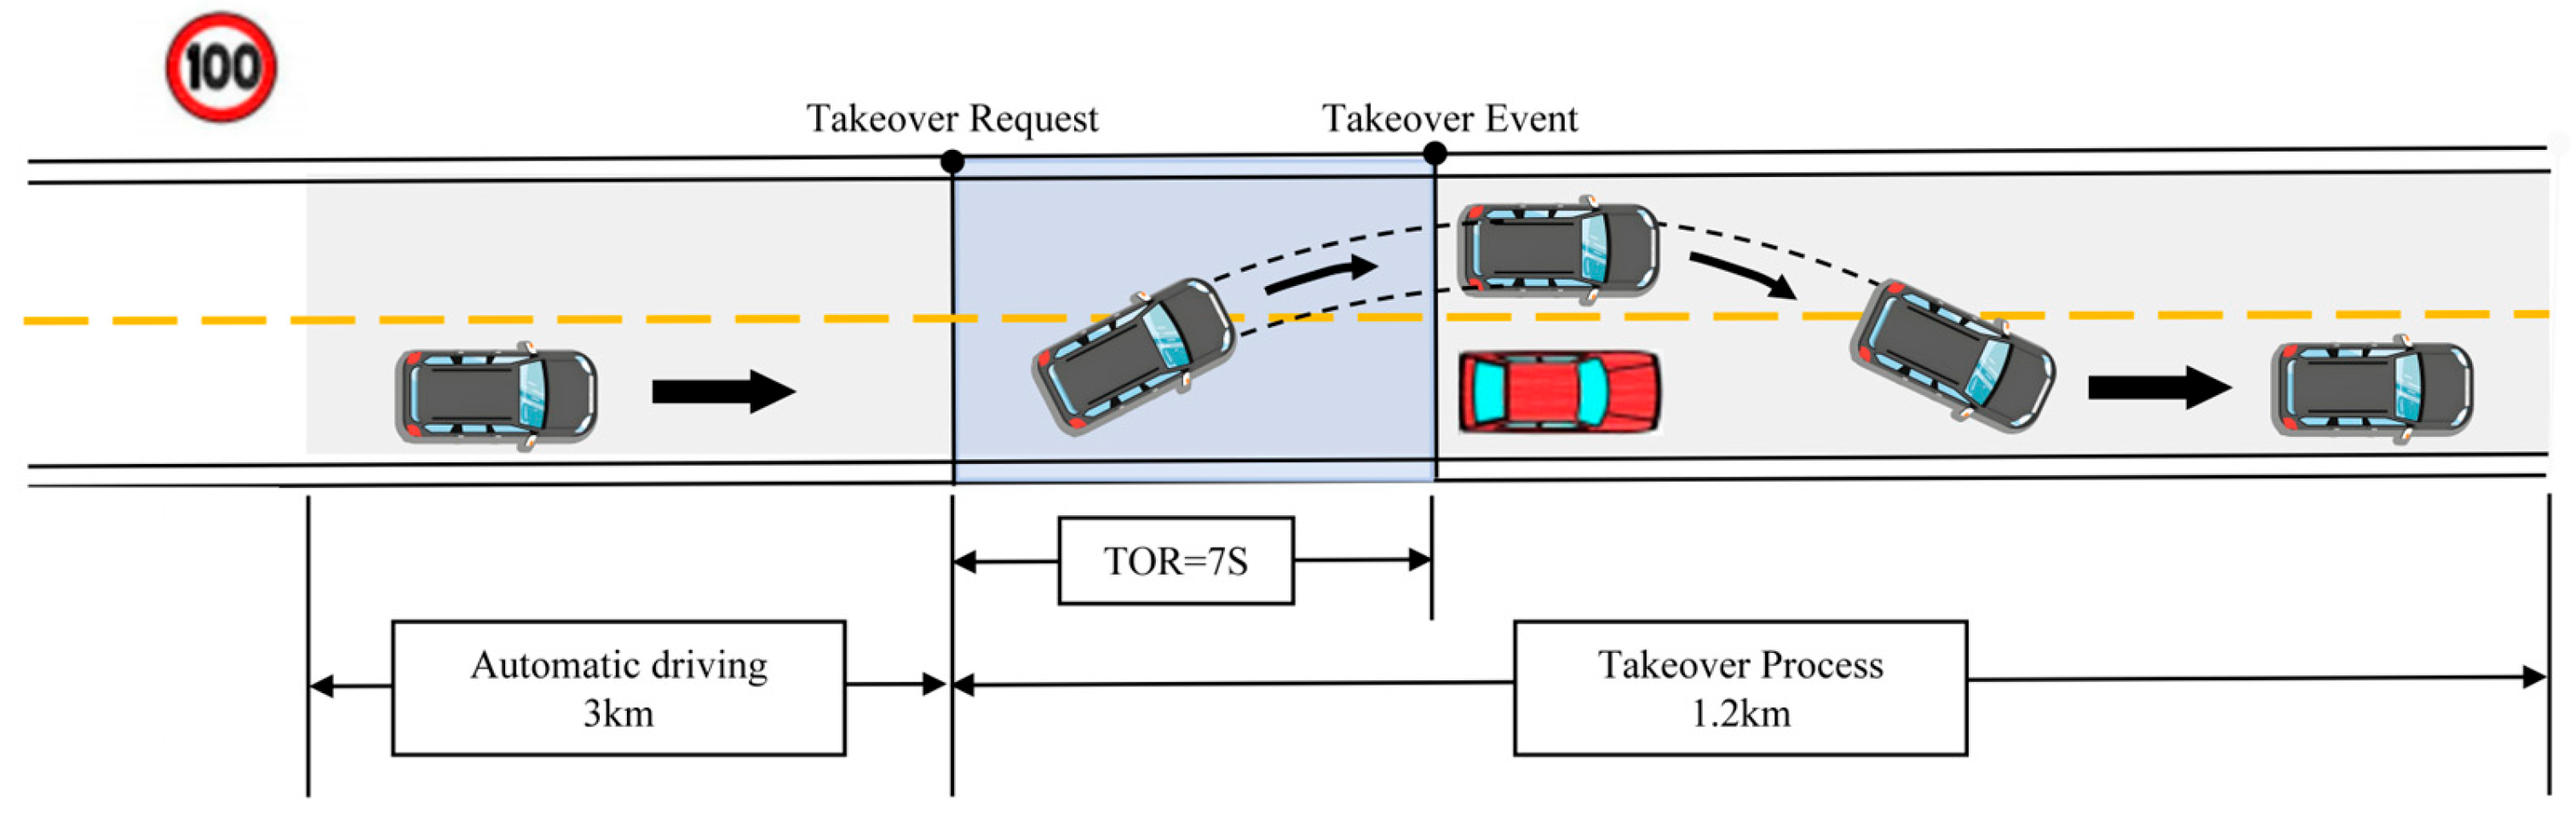
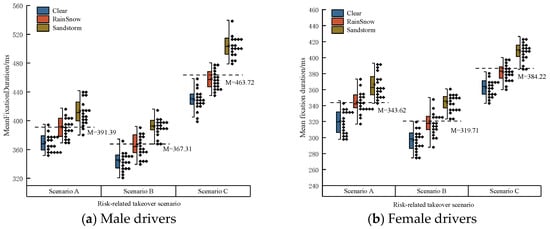
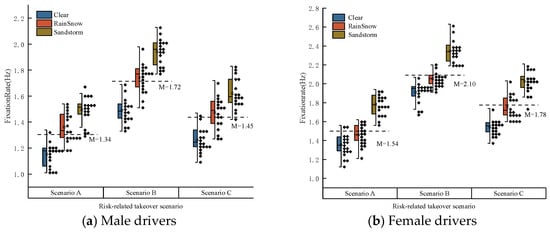
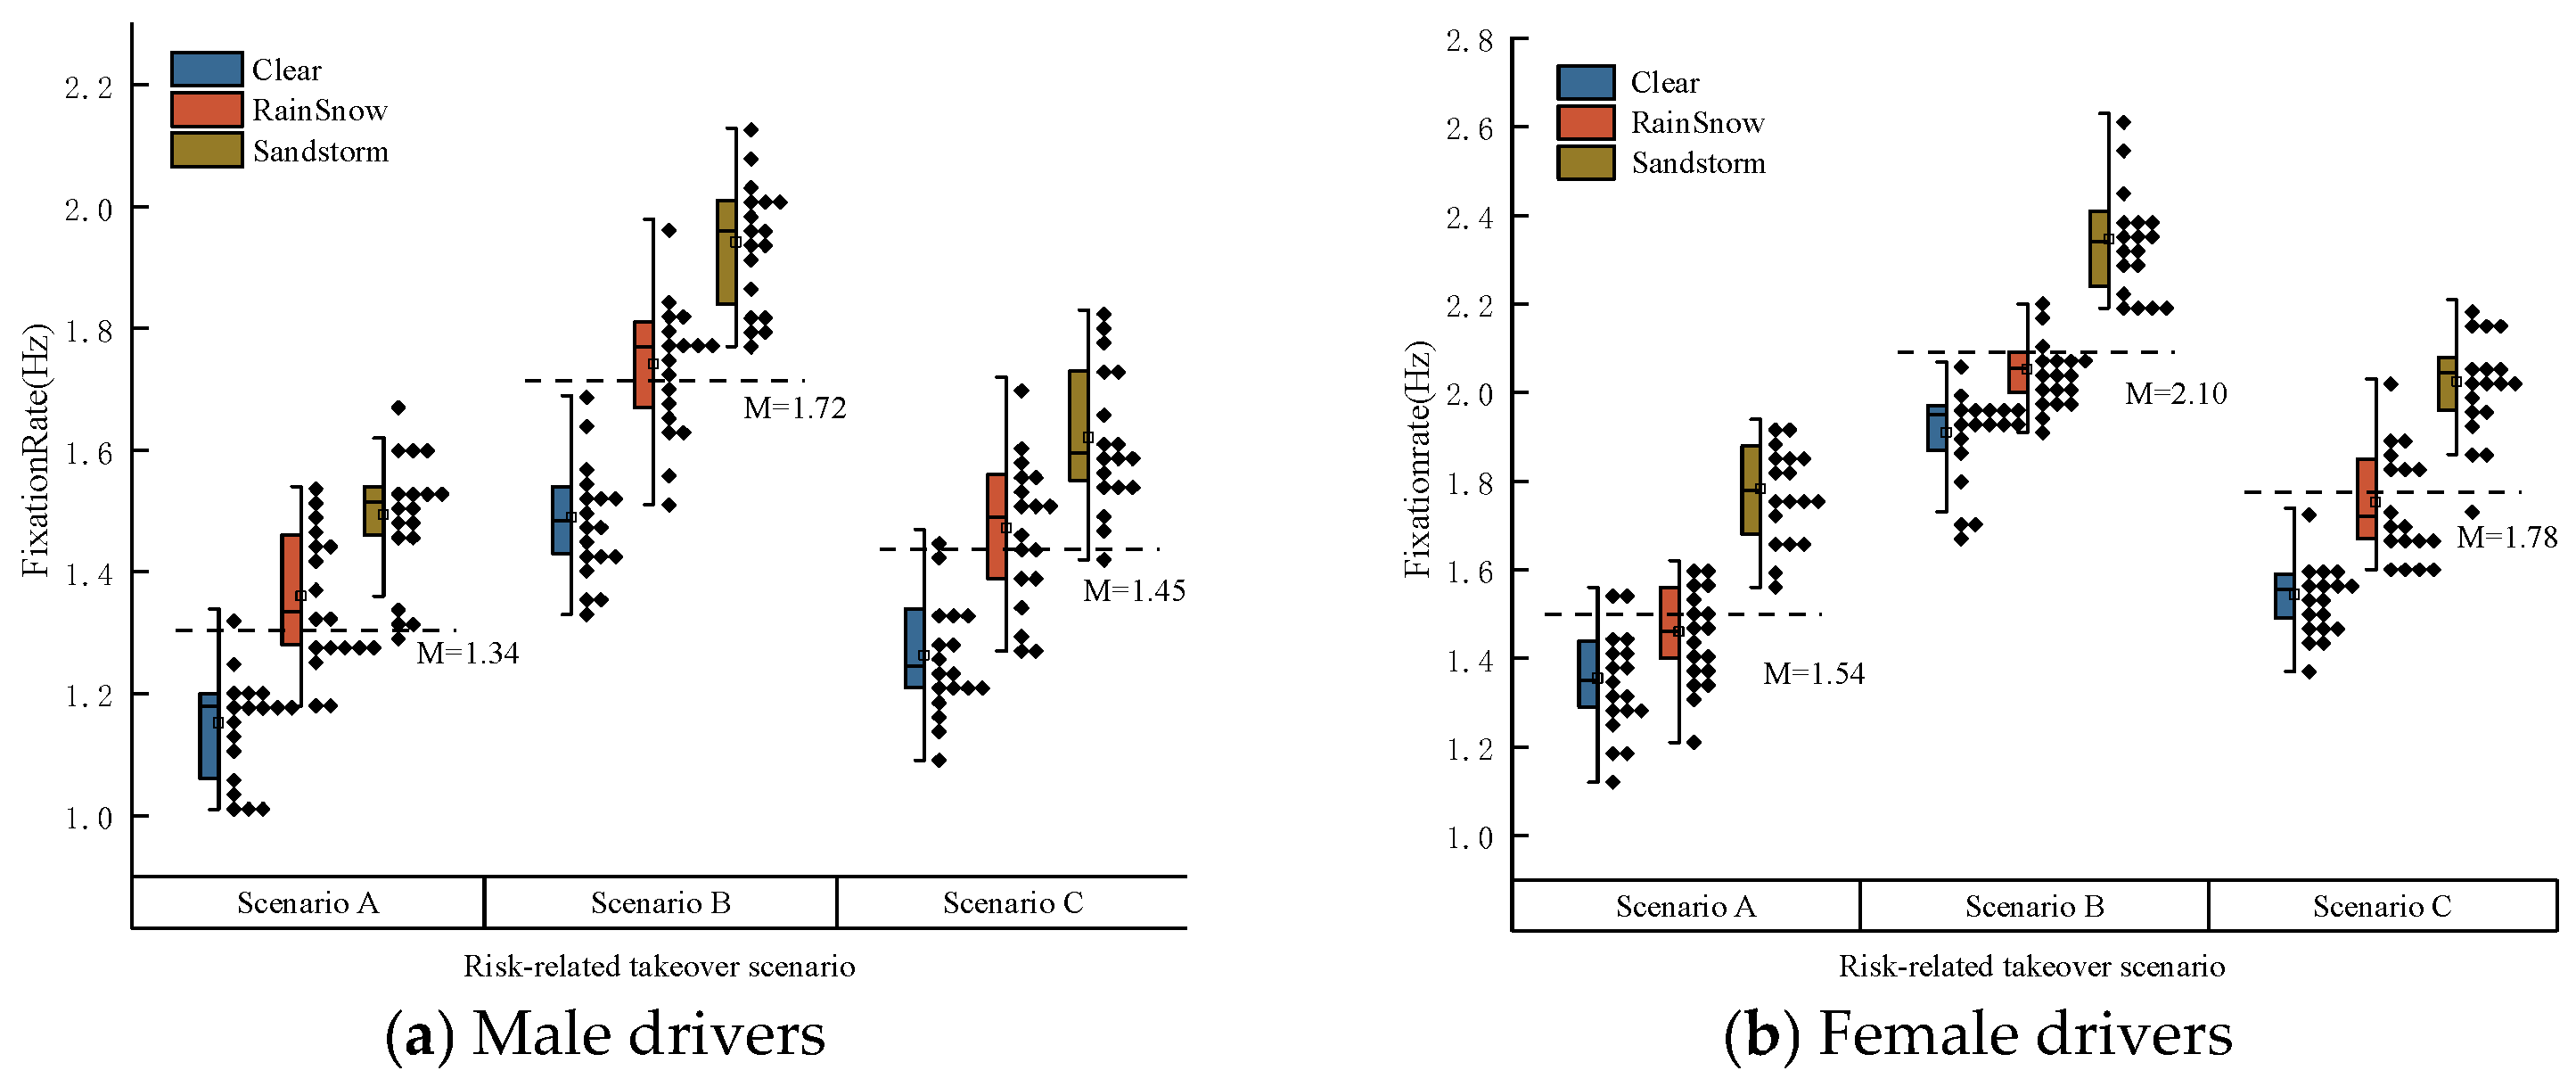
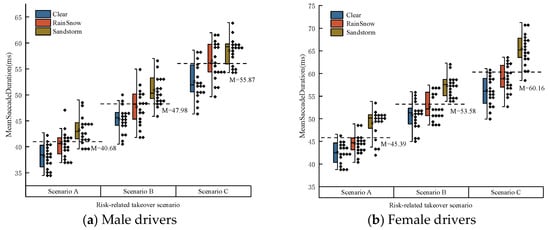
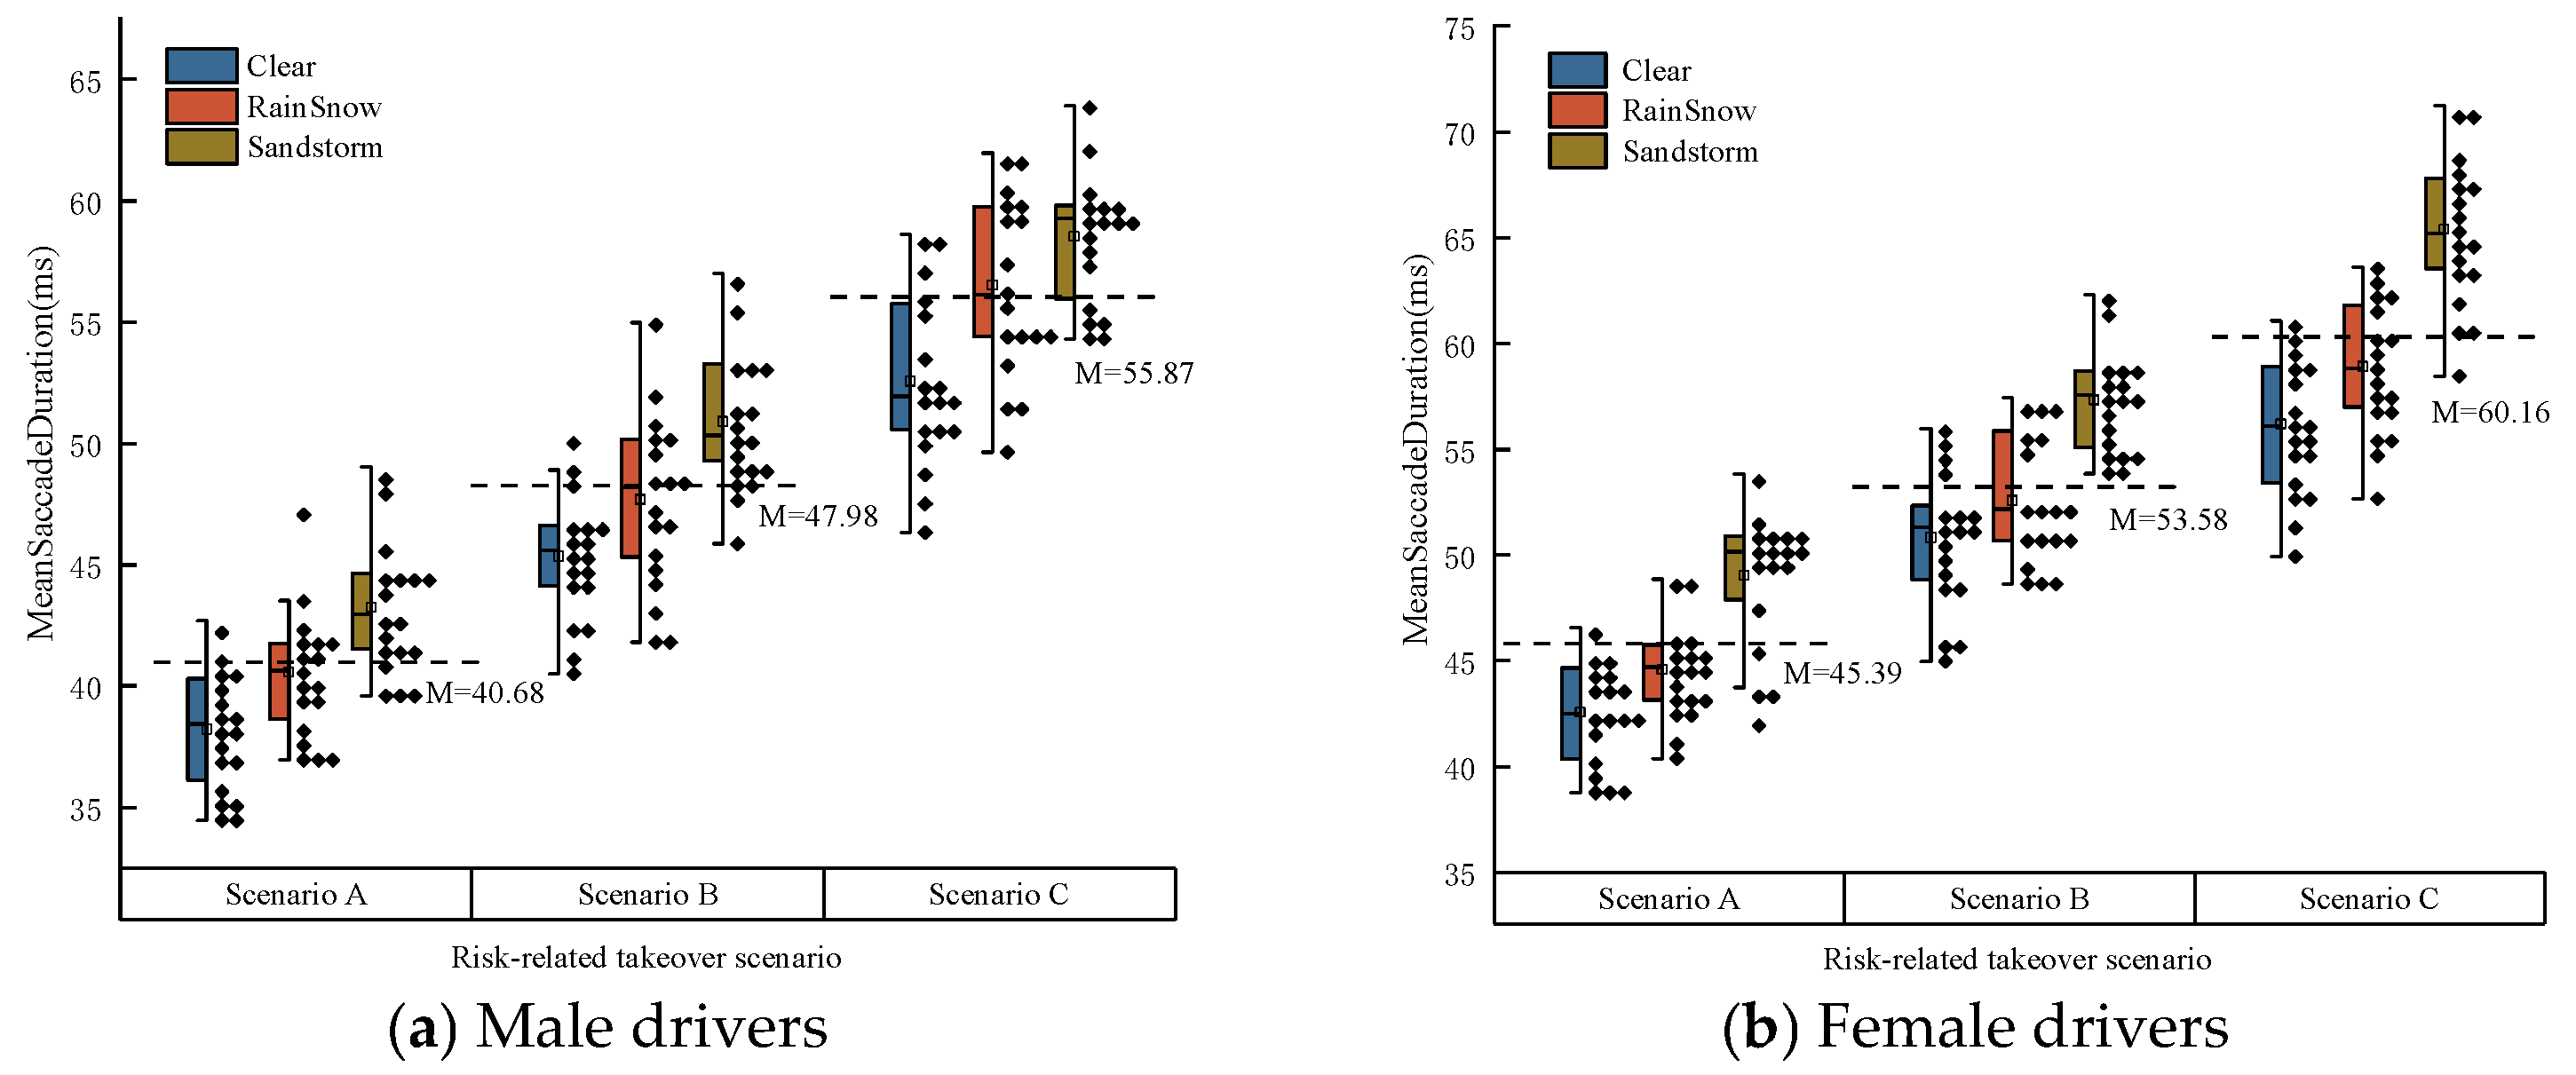
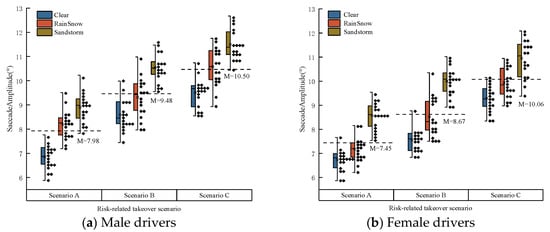
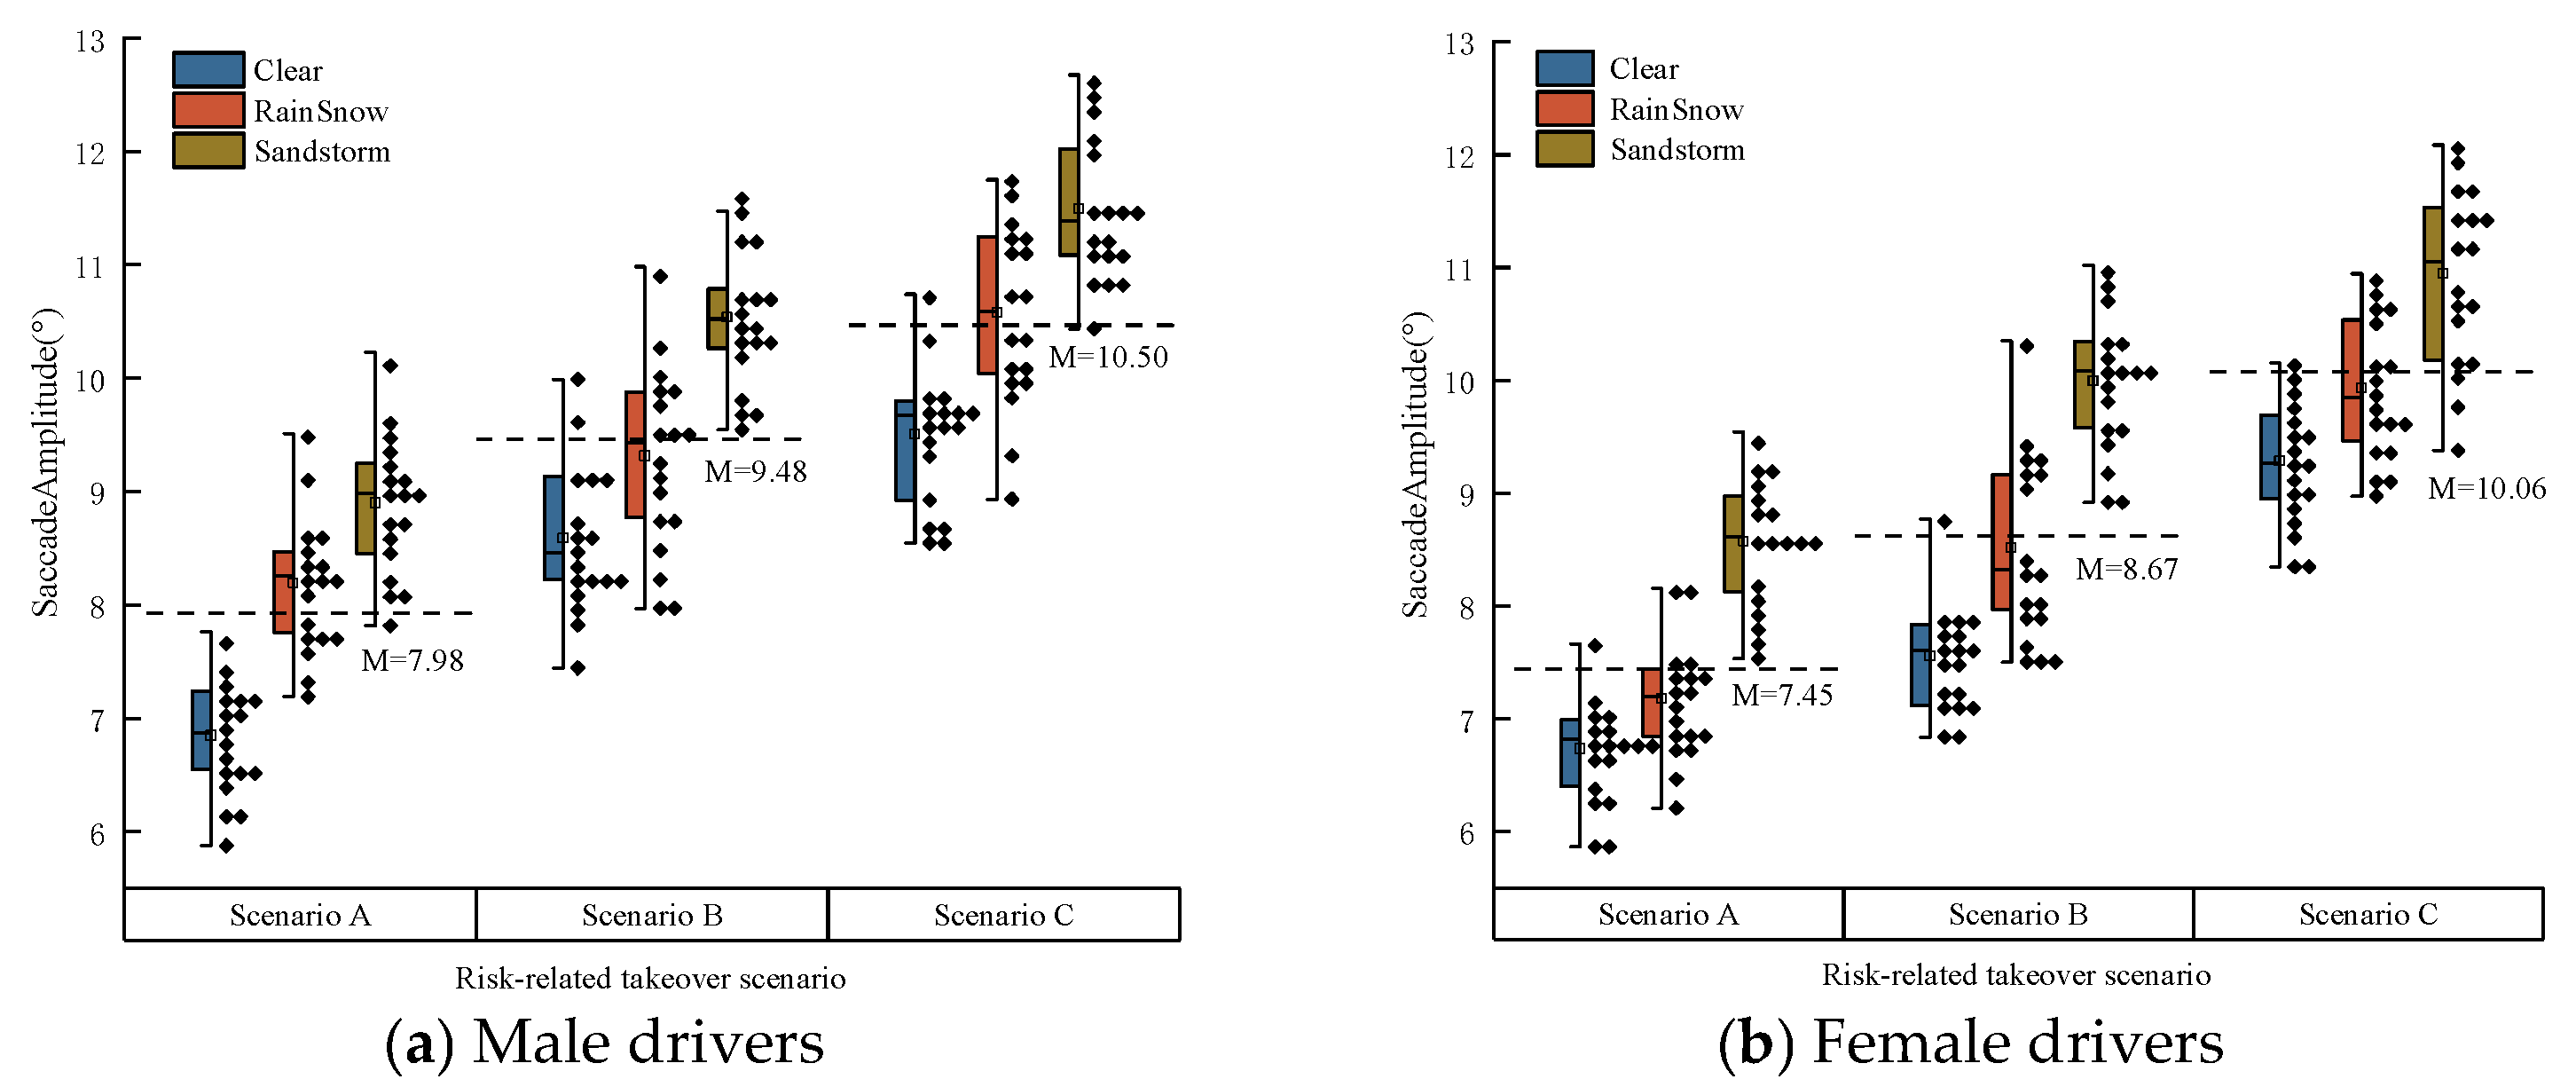
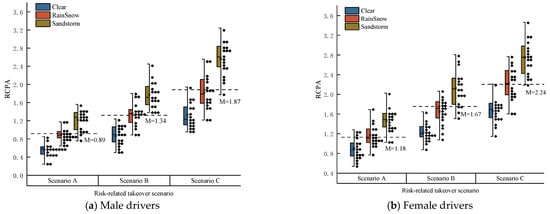
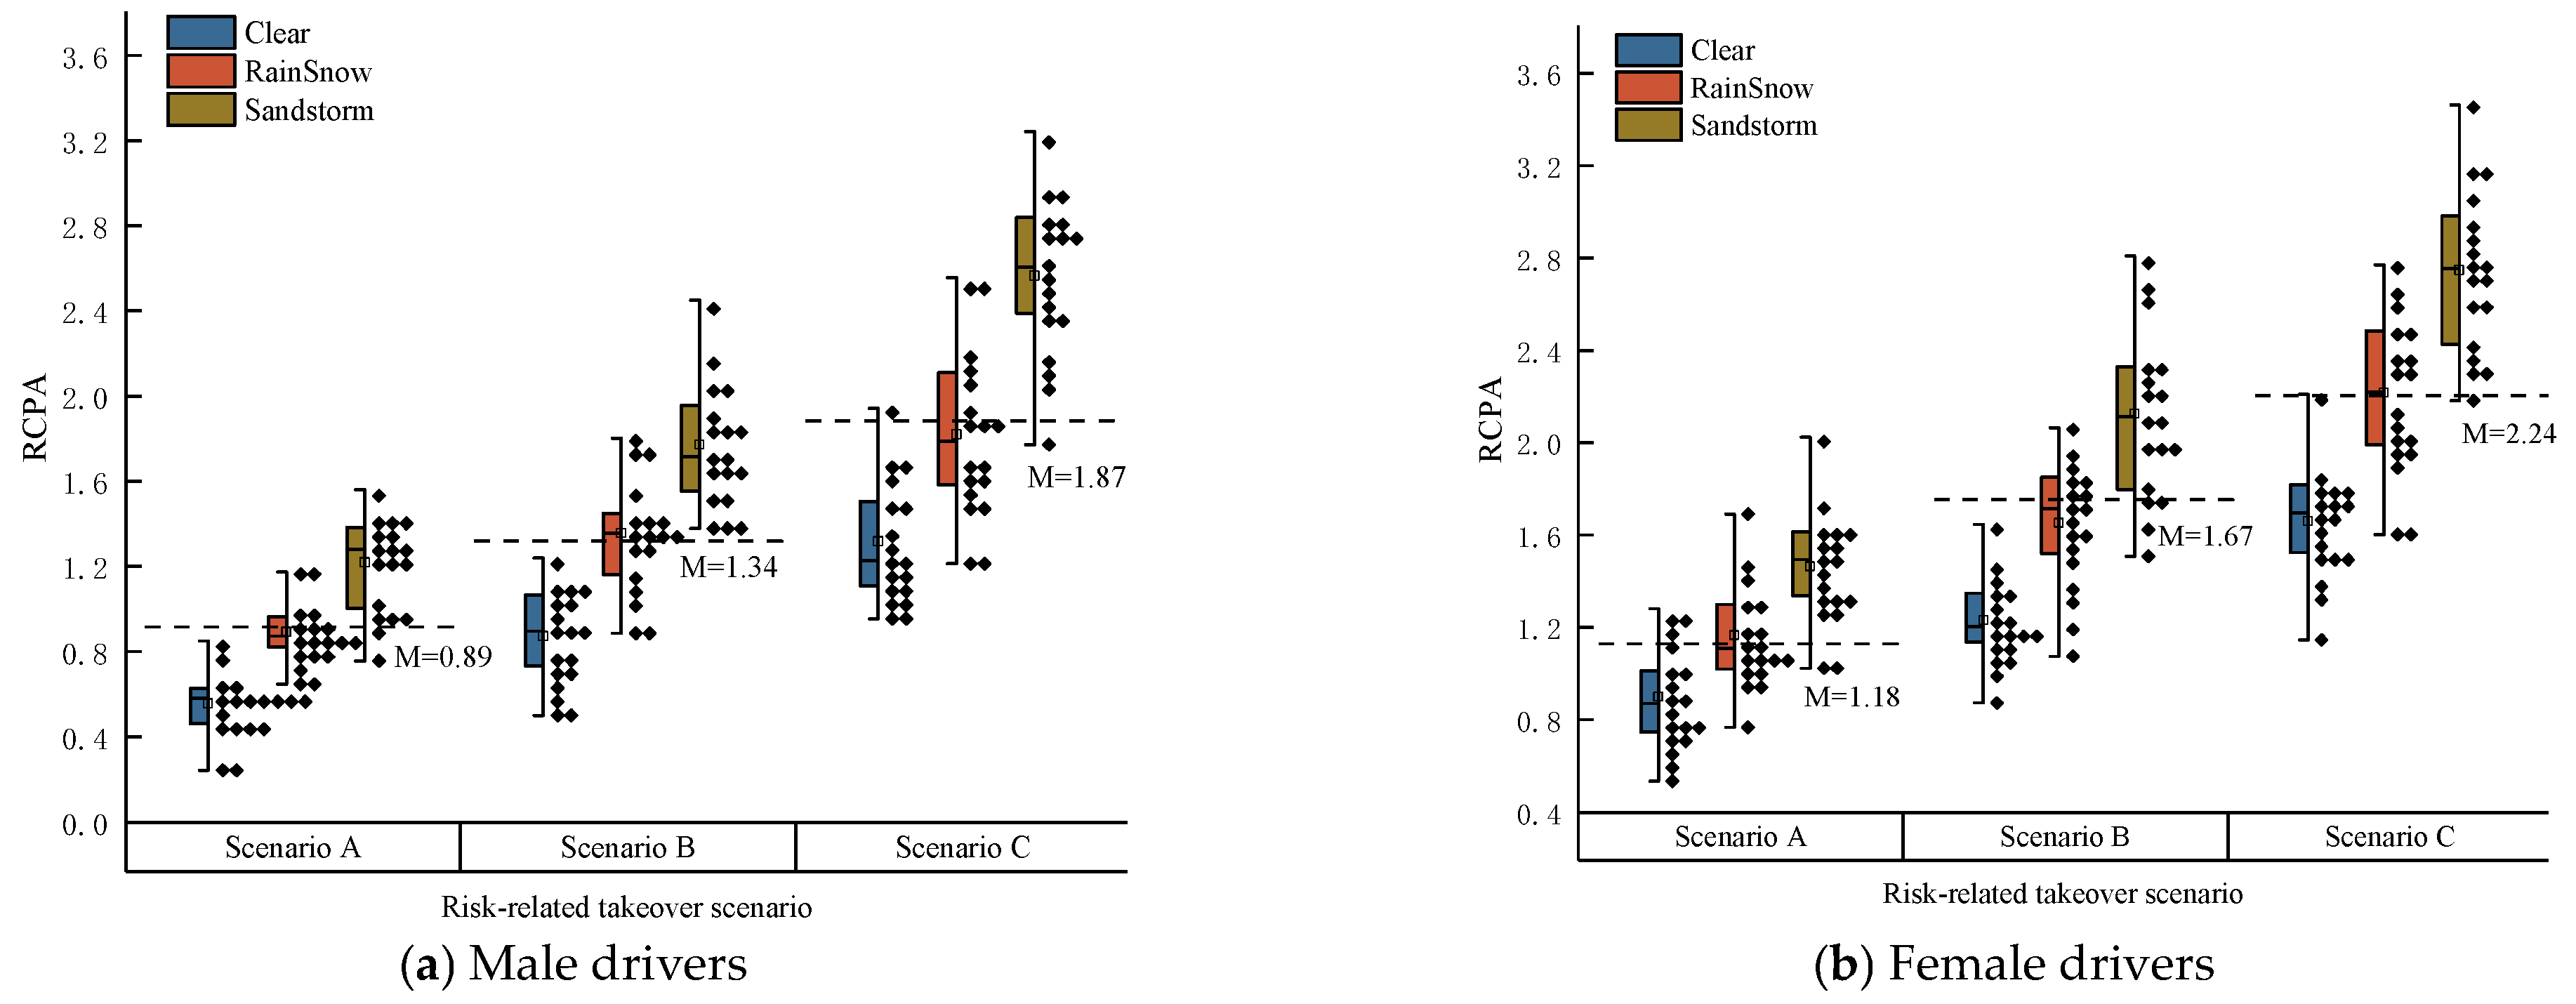

Disclaimer/Publisher’s Note: The statements, opinions and data contained in all publications are solely those of the individual author(s) and contributor(s) and not of MDPI and/or the editor(s). MDPI and/or the editor(s) disclaim responsibility for any injury to people or property resulting from any ideas, methods, instructions or products referred to in the content. |
© 2026 by the authors. Licensee MDPI, Basel, Switzerland. This article is an open access article distributed under the terms and conditions of the Creative Commons Attribution (CC BY) license.