


Abstract
To detect the fatigue status of air traffic controllers before duty and better manage on-the-job fatigue risk, this study proposes a convenient and effective pre-shift fatigue assessment method. A cohort of controller cadets was examined, using average reaction time, the standard deviation of reaction time, and the fastest 10% reaction time from a psychomotor vigilance test (PVT) as indicators of fatigue. These indicators were combined with self-reported MFI-16 fatigue scale scores to establish a quantitative relationship between fatigue level and each metric, allowing calculation of a comprehensive fatigue index for each cadet. This quantified fatigue index was then fitted against control-aptitude test scores to develop a regression model. An experimental condition involving 24 h of sleep deprivation was used to generate data for model development and validation. Results showed strong correlations between PVT metrics (average reaction time, reaction time variability, and fastest 10% reaction time) and fatigue scale scores. The resulting fatigue index model demonstrated good agreement between predicted and measured control-aptitude test scores. This study provides a theoretical foundation for a practical fatigue detection and early-warning method for air traffic controllers, offering significant value for reducing safety risks and enhancing civil aviation safety.
1. Introduction
On 27 August 2006, Comair Flight 5191 crashed during takeoff at Blue Grass Airport. The National Transportation Safety Board cited the pilots’ failure to verify the correct runway, with controller fatigue and inadequate monitoring as contributing factors. More recently, Air Canada Express Flight 8646 collided with an airport fire truck at LaGuardia Airport, with preliminary reports indicating that controller workload may have contributed. As a critical component of the air transportation system, air traffic control plays an essential role in maintaining aviation safety. However, factors such as rotating day–night shifts, sustained high-pressure cognitive demands, and long working hours have made controller fatigue increasingly prominent. Fatigue among air traffic controllers has emerged as a major constraint on the growth and efficiency of civil aviation operations. It diminishes attention, memory, and alertness, leading to impaired judgment and weakened decision-making abilities—conditions that can manifest as precursors to incidents and, in severe cases, accidents. According to the International Civil Aviation Association (ICAO) [1], approximately 21% of aviation accidents each year are associated with fatigue in air traffic controllers. Controllers may begin a shift with varying levels of fatigue due to inadequate rest or other factors, and this pre-duty fatigue can negatively influence their performance in addition to the fatigue accumulated from workload during duty. To investigate the impact of pre-duty fatigue on control performance—and to enable prediction of control ability based on pre-duty fatigue assessment—this study conducts an experimental analysis with student controller trainees. A pre-duty fatigue detection method is proposed, and the trainees’ control performance is evaluated under different fatigue conditions. Subsequently, a regression model is developed to describe the relationship between the quantified pre-duty fatigue index and control-ability test scores. This approach can be extended to operational controllers, providing a basis for managing fatigue-related safety risks and enhancing the safety of air traffic operations.
Current research on fatigue assessment methods for air traffic controllers can be broadly divided into subjective and objective approaches. Subjective methods rely on controllers reporting their perceived level of fatigue, typically through standardized questionnaires that yield quantitative scores. An example is the Multidimensional Fatigue Inventory (MFI), developed by Professor Smets of the University of Amsterdam [2] in 1995 and the NASA-TLX scale developed by the National Aeronautics and Space Administration (NASA) [3]. The subjective fatigue scale can reflect the subjective feeling of fatigue when controllers complete the questionnaire; however, due to individual differences, the actual degree of fatigue may differ significantly from the scale score, and the accuracy of the detection results is not high.
The objective evaluation method involves using various instruments to obtain fatigue-related physiological, biochemical, behavioral, or human factors engineering index values, thereby establishing a fatigue evaluation system, such as electroencephalography (EEG), electrocardiography (ECG), and eye movement characteristics. In 2012, Wang and his research associates [4] extracted controller fatigue features based on facial recognition to realize real-time fatigue evaluation of controllers. In 2015, Chen Jian et al. [5] proposed a method for monitoring the fatigue state of controllers based on eye movement data. By collecting eye movement data of controllers during work, analyzing fixation states, pupil changes, eye blink times, and other indicators in combination with PERCLOS, the fatigue state of controllers was evaluated. In 2017, Chen and Wang [6] collected EEG data from controllers and compared the fatigue differences among controllers under different shift systems using EEG indicators. Although the above methods can accurately reflect the degree of fatigue in controllers, the measurement process is complex and the test time is too long, so they cannot facilitate rapid pre-service fatigue assessment.
When people are tired, the most direct manifestation is a decrease in alertness, which is the human body’s reduced ability to maintain attention and remain alert to stimuli over a prolonged period (Shaw, Matthews, & Warm, 2010) [7]. Therefore, some studies measure the risk of fatigue by alertness. In 2019, Hui Jinyou [8] established a controller fatigue risk prediction model based on the principle of alertness energy for the first time, providing a theoretical basis for fatigue prediction through the alertness model. In 1985, Dinges et al. [9] first developed a universal 10 min version of the psychomotor vigilance test (PVT) as a test of alertness. Later, NASA adopted the PVT as the primary measurement tool for crew members to monitor the daily impact of fatigue on performance on the International Space Station. In 2021, Wang et al. [10] demonstrated through experiments that the test results of the psychomotor alertness task were consistent with the subjective fatigue scale values and heart rate variability indicators completed by subjects, which could better represent the degree of real-time fatigue. Among the existing biophysical models of fatigue, the CAS (Circadian Alertness Simulator), TPMA (three-process model of alertness), and the three-process model of alertness are also used to predict the degree of fatigue based on output alertness [11]. It is feasible to measure human fatigue risk through alertness, and this paper will also use alertness to represent fatigue risk, thereby studying the relationship between fatigue and control ability.
For the study on the influence of controller fatigue on control ability, Wang et al. [12] combined alertness data of controllers and used the clustering method to classify the wakefulness and fatigue states of controllers and used the KW test method to study the differences in cognitive ability of controllers in different positions under fatigue states. Jin et al. [13], through the analysis of the controllers’ eye movement data combined with the fatigue degree value, found that the changes in the controller’s saccade speed and attention point were significantly related to fatigue. Wang et al. [14] used the EEG signals of controllers as an indicator of fatigue and reaction time in special situations as an indicator of cognitive ability to conduct a correlation analysis of the data and explain the linear correlation between the two. The above studies have analyzed the relationship between the degree of fatigue in controllers and control ability indicators; however, the selected control ability indicators are relatively limited, reflecting only one aspect of the ability. There is a lack of studies on the functional prediction of regulatory ability through fatigue.
This paper takes control trainees as an example to study and makes the following improvements and supplements:
(1) It is proposed that vigilance indicators obtained from a pre-duty PVT be collected and analyzed in relation to subjective fatigue scale scores, allowing identification of the PVT metrics that exhibit the strongest correlation with self-reported fatigue [15].
(2) With the control trainees as the subjects, the sleep deprivation experiment was designed to stimulate the fatigue state of the subjects. The subjects conducted various tests under different fatigue levels, collected various index data, determined the weight of each index using the entropy-weight method, and established a fatigue assessment model.
(3) Curve fitting between the calculated fatigue value F and the control ability test scores of the participants was carried out to establish a control ability performance prediction model.
The results demonstrate that both the fatigue value F model and the control-ability prediction model achieve high accuracy in estimating the fatigue level and performance of controller trainees. The proposed method is practical and easy to implement, and it can be extended to operational air traffic controllers. By assessing the alignment between their current physical and cognitive state and the demands of the job before assuming duty, controllers and managers can make more informed scheduling decisions and effectively reduce fatigue-related safety risks in air traffic operations.
2. Materials and Methods
The fatigue scale used in the experiment is the MFI-16 scale, which was revised by the Institute of Safety Science of Civil Aviation University of China (Tianjin, China) according to the multidimensional Fatigue Scale (MFI-20) developed by the University of Amsterdam in the Netherlands (Amsterdam, Netherlands). Compared with the MFI-20 fatigue scale, the MFI-16 scale is more consistent with the occupational characteristics of controllers [16]. The scale contains 16 items, with a total score ranging from 16 to 80 points.
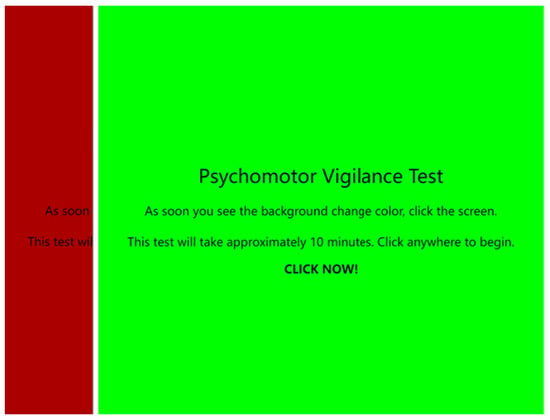
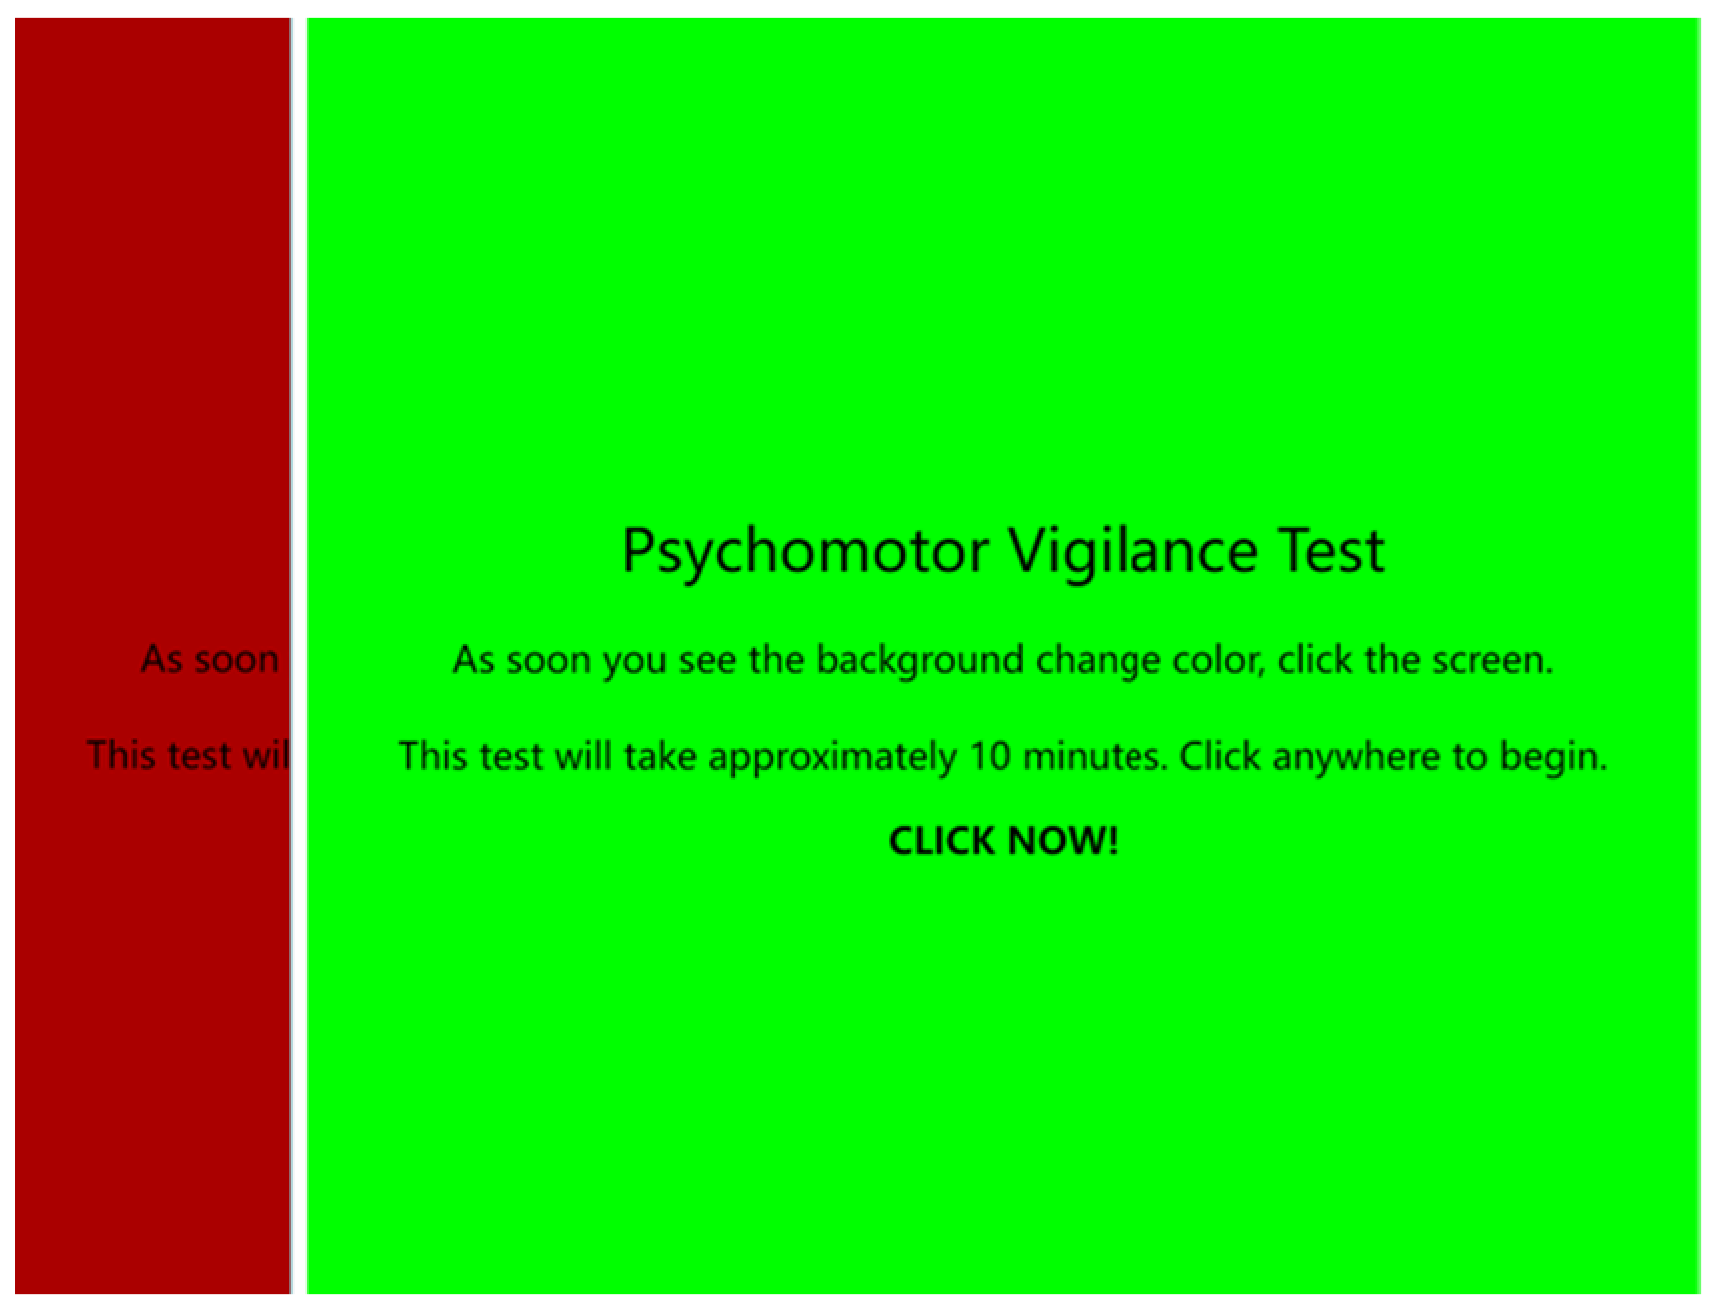
The PVT was used as a tool to collect data on subjects’ alertness. PVT, the Psychomotor Vigilance Task Test [17,18], is a test that measures mental reaction speed and is widely used in studies related to sleep and fatigue. The PVT is based on the principle that visual stimuli are repeated in an irregular manner for a test period of time (5–10 min), and subjects are required to respond as soon as possible after the stimulus. Finally, the alertness of the subjects is determined by calculating parameters related to their attention. The PVT used in this paper is the color change test. The subject needs to click the mouse as soon as possible when the color of the PVT interface changes. The system automatically records the reaction time of this section, and the test lasts for 5 min. After each test, four performance indicators were calculated from participants’ screen-click responses: mean reaction time, reaction time SD, fastest 10% reaction time, and number of lapses [7]. The mean reaction time is the average of the time it takes a subject to respond to a stimulus in a single test, reflecting the average level of a subject’s response rate. The standard deviation of reaction time reflects the level of attention stability of the participants. The fastest 10% reaction time is the best response reaction time in the test. The number of lapses includes the number of times that the subjects click the screen when the color of the test interface does not change and the number of missed clicks. The above indicators all reflect the alertness of the subjects in the current state to a certain extent [17]. Figure 1 shows the interface of the PVT testing system.
Figure 1.
The PVT interface.
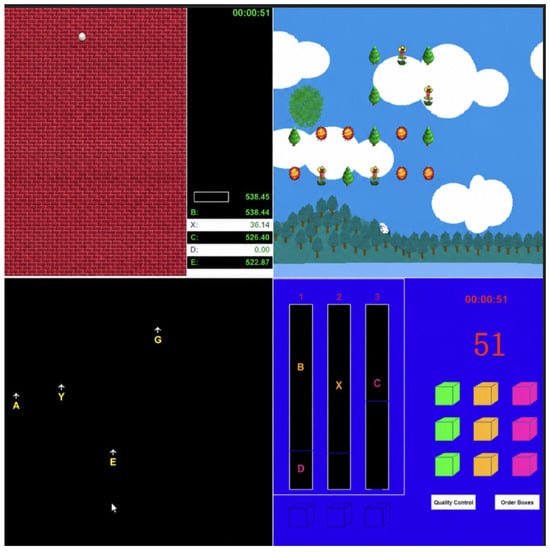
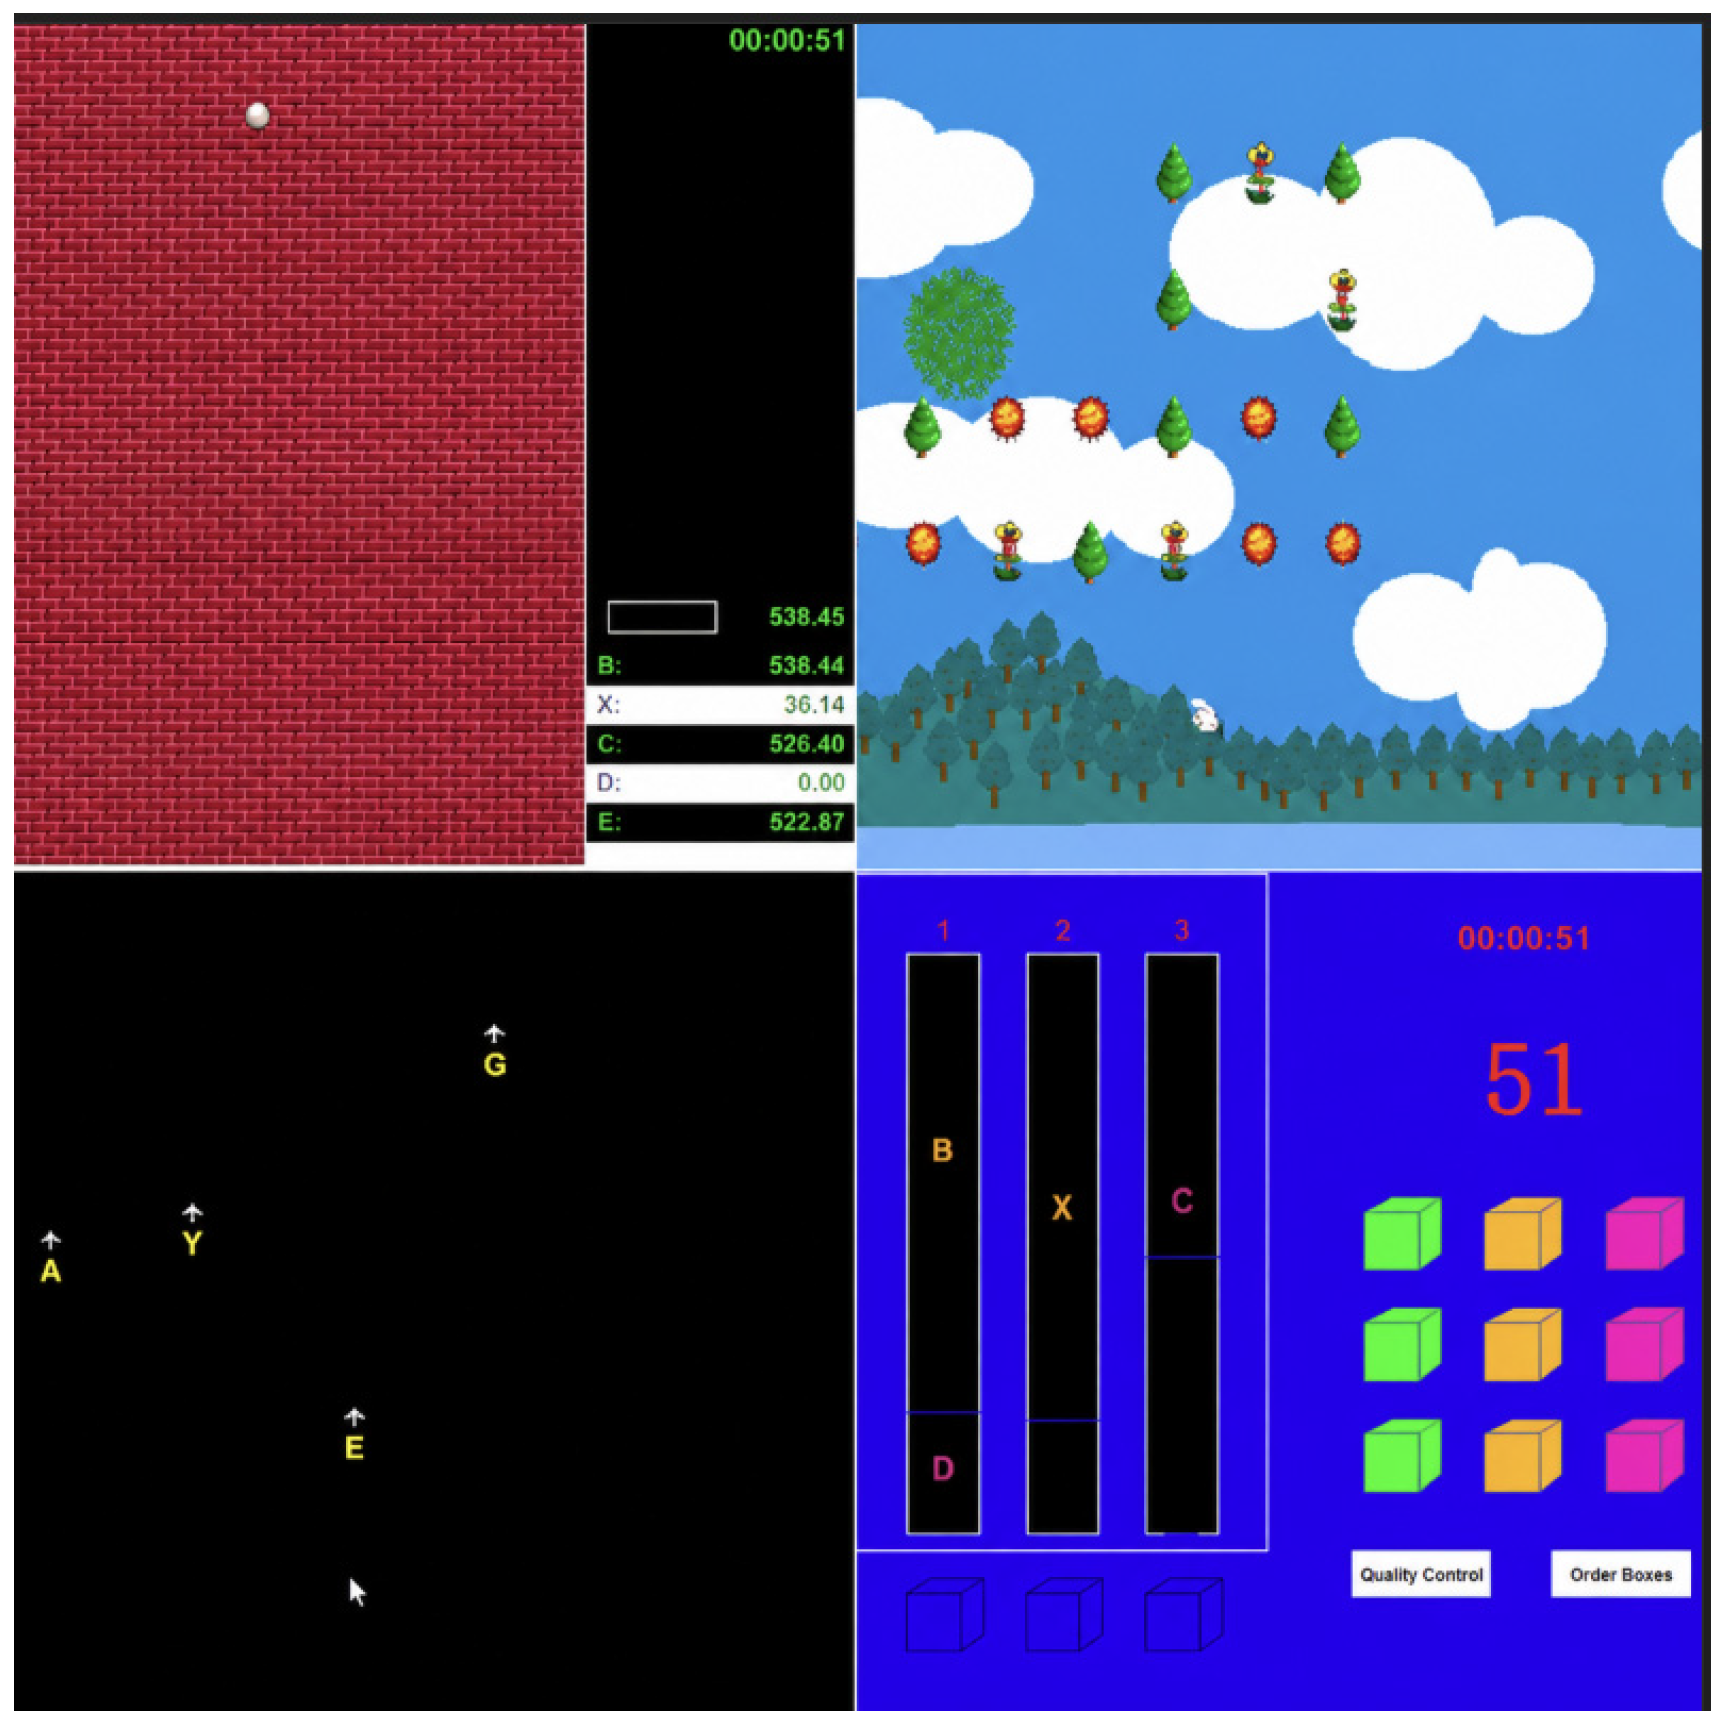
The control ability of the subjects was tested using the air traffic controllers ability test system. The test system is often used in the selection and examination of controllers. The test content includes cognitive tests, digital applications, dynamic visual tests, and scene tests. The test can evaluate the control ability of controllers and control trainees from different dimensions. It encompasses a range of abilities, including number discrimination, spatial ability, attention distribution, decision-making, adaptability, coordination, and memory skills, all of which are crucial in control and command work. The system automatically records the result of each test and the final total score. Figure 2 shows each test interface in the test system.
Figure 2.
Control capacity test interface.
2.1. Experiment Procedure
Eight male control trainees from the Civil Aviation University of China were selected, with an average age of 21 years old (SD = 1.73). They had normal uncorrected vision or corrected vision, no color blindness, no internal and external eye diseases, no smoking, drinking, or other hobbies, no sleep disorders, and no history of neurological and psychiatric medication. All subjects were informed in advance of the content, modalities, and purpose of this experiment and participated voluntarily.
The Institutional Review Board (IRB) approved the proposal alongside the consent forms reviewed and signed by research participants. Subjects participated in the experiment under 24 h sleep deprivation, during which no sleep was allowed, and were tested at intervals. The first test was conducted at 9 a.m., followed by tests every four hours before 9 p.m., and then every three hours from 9 p.m. to 9 a.m. of the next day, for a total of eight tests. The test times are shown in Table 1.
Table 1.
Test Schedule.
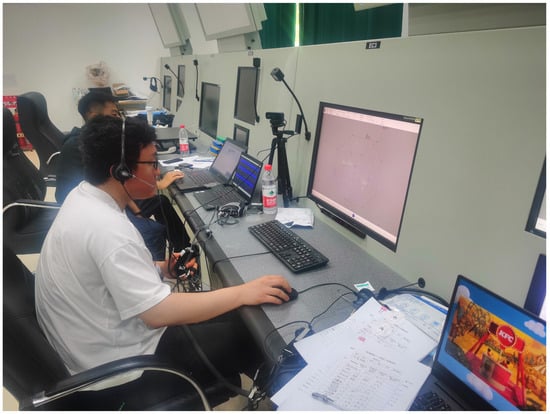
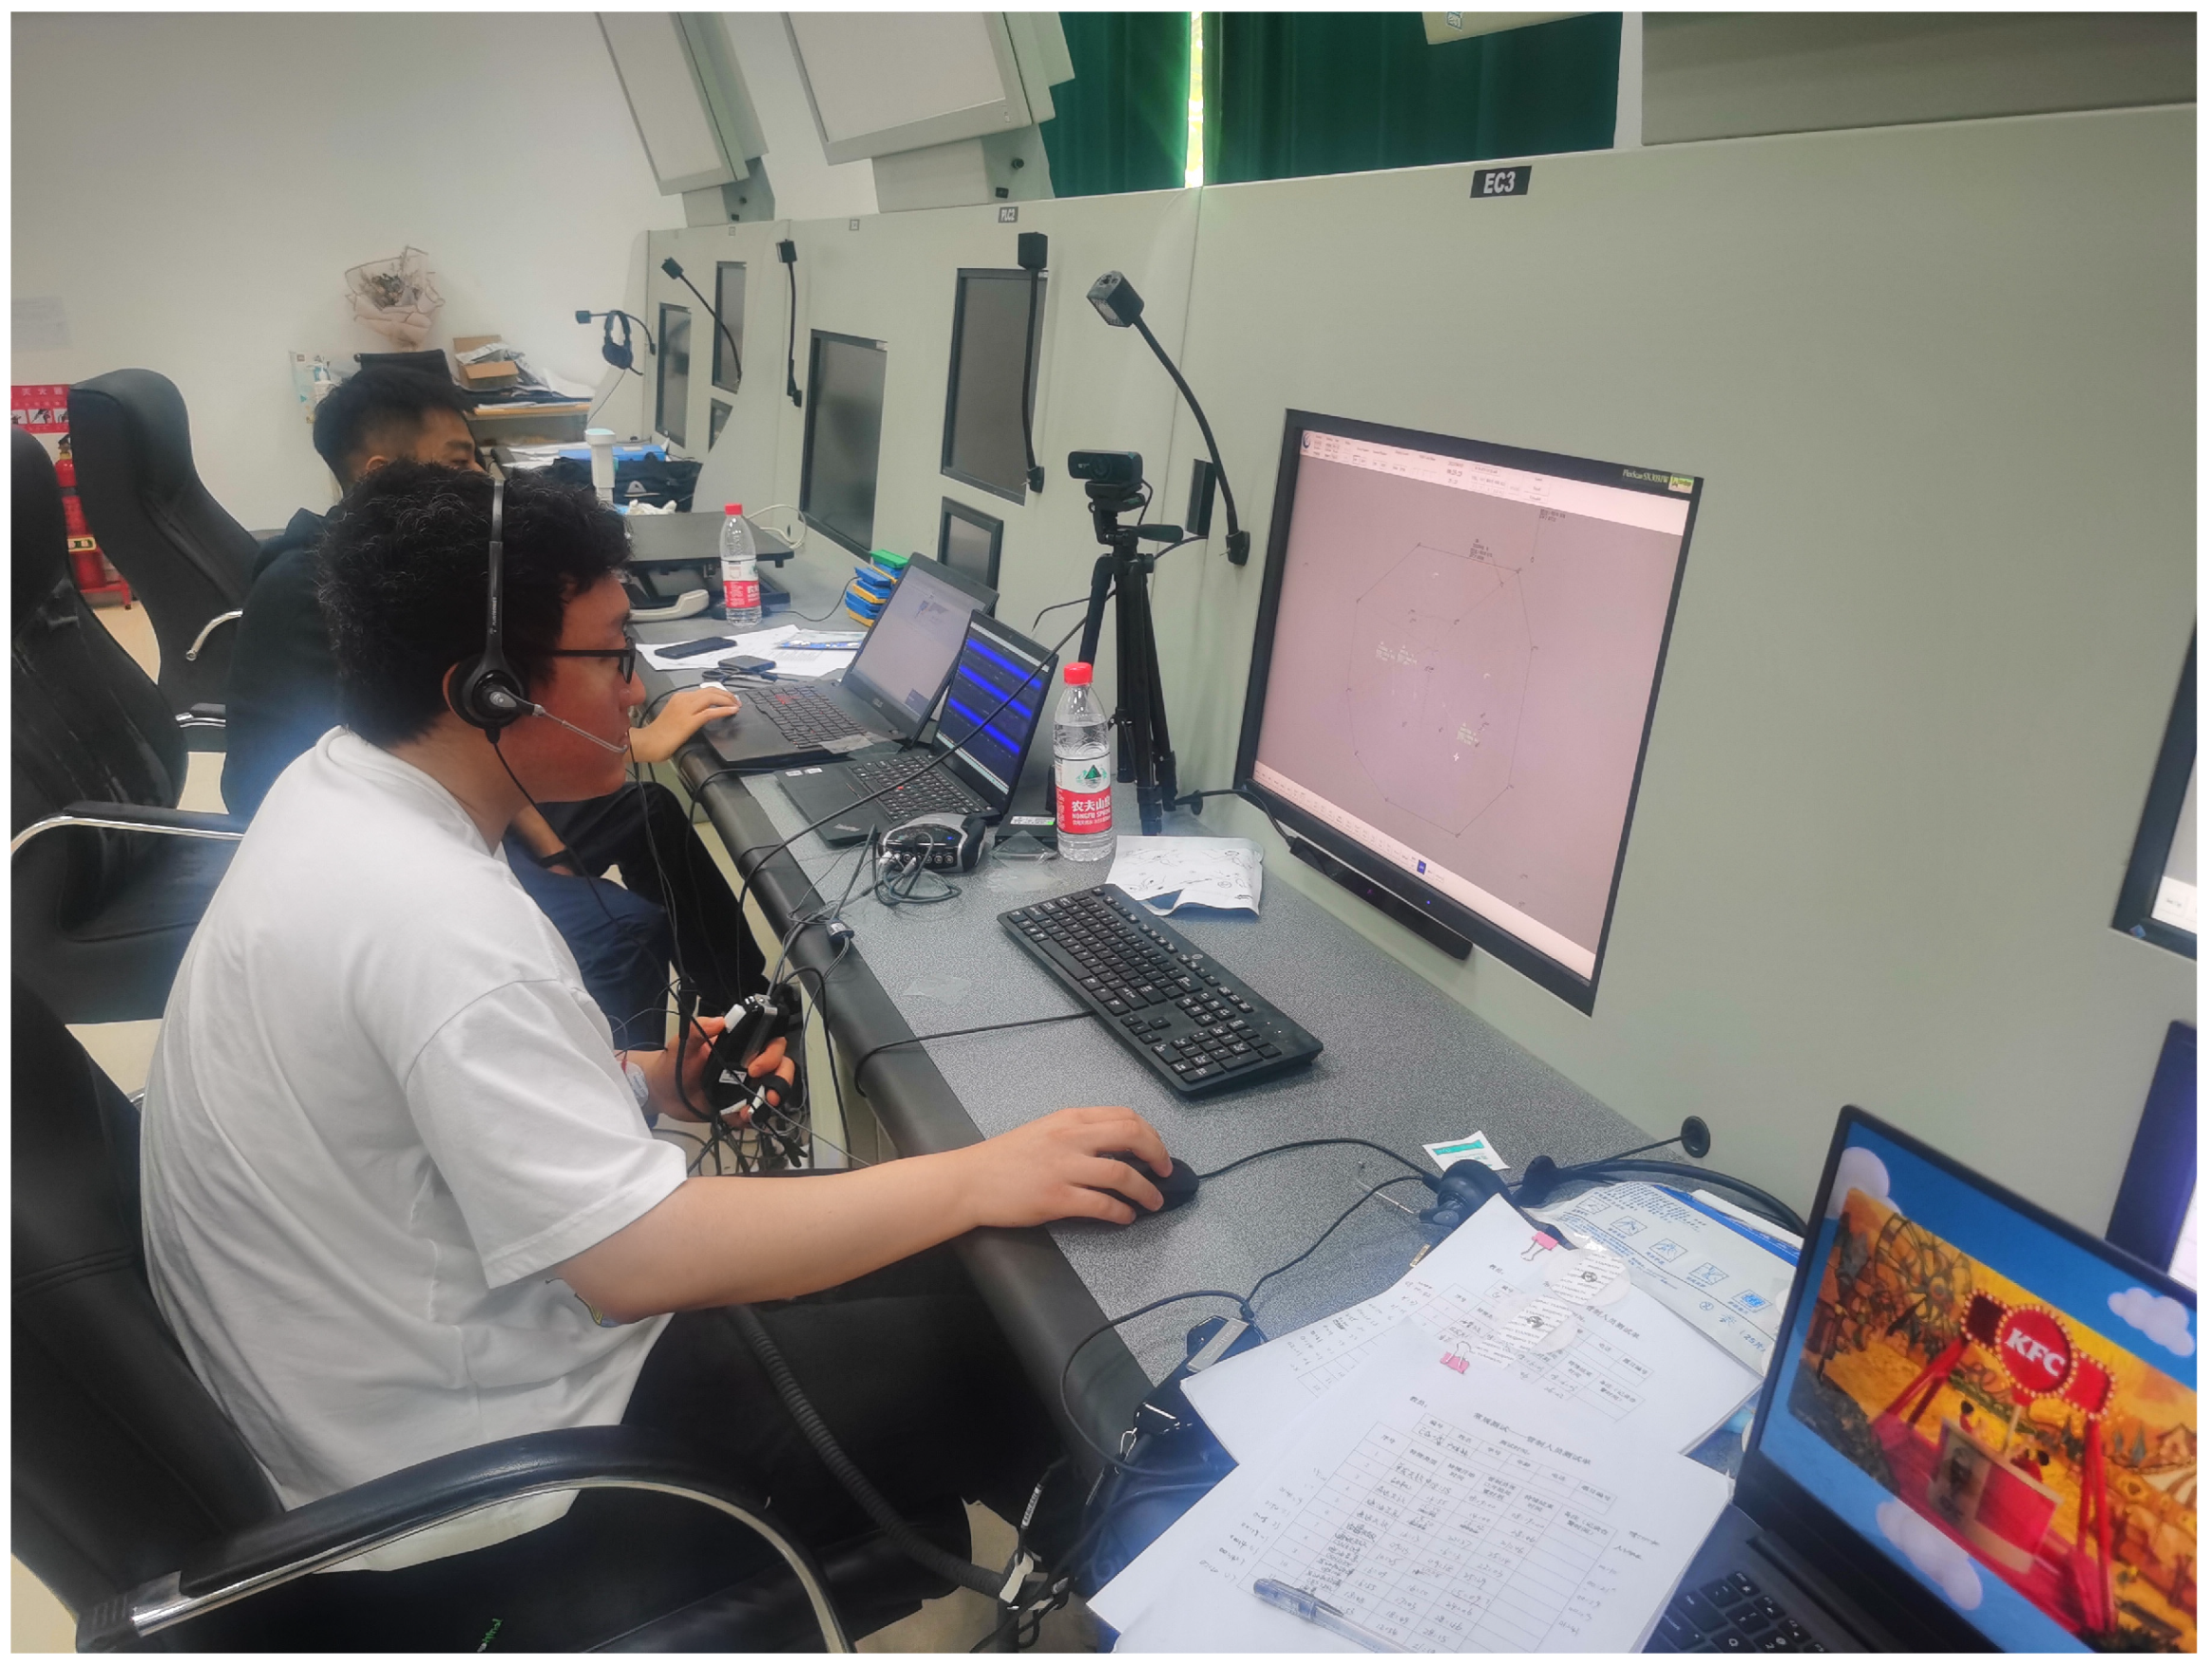
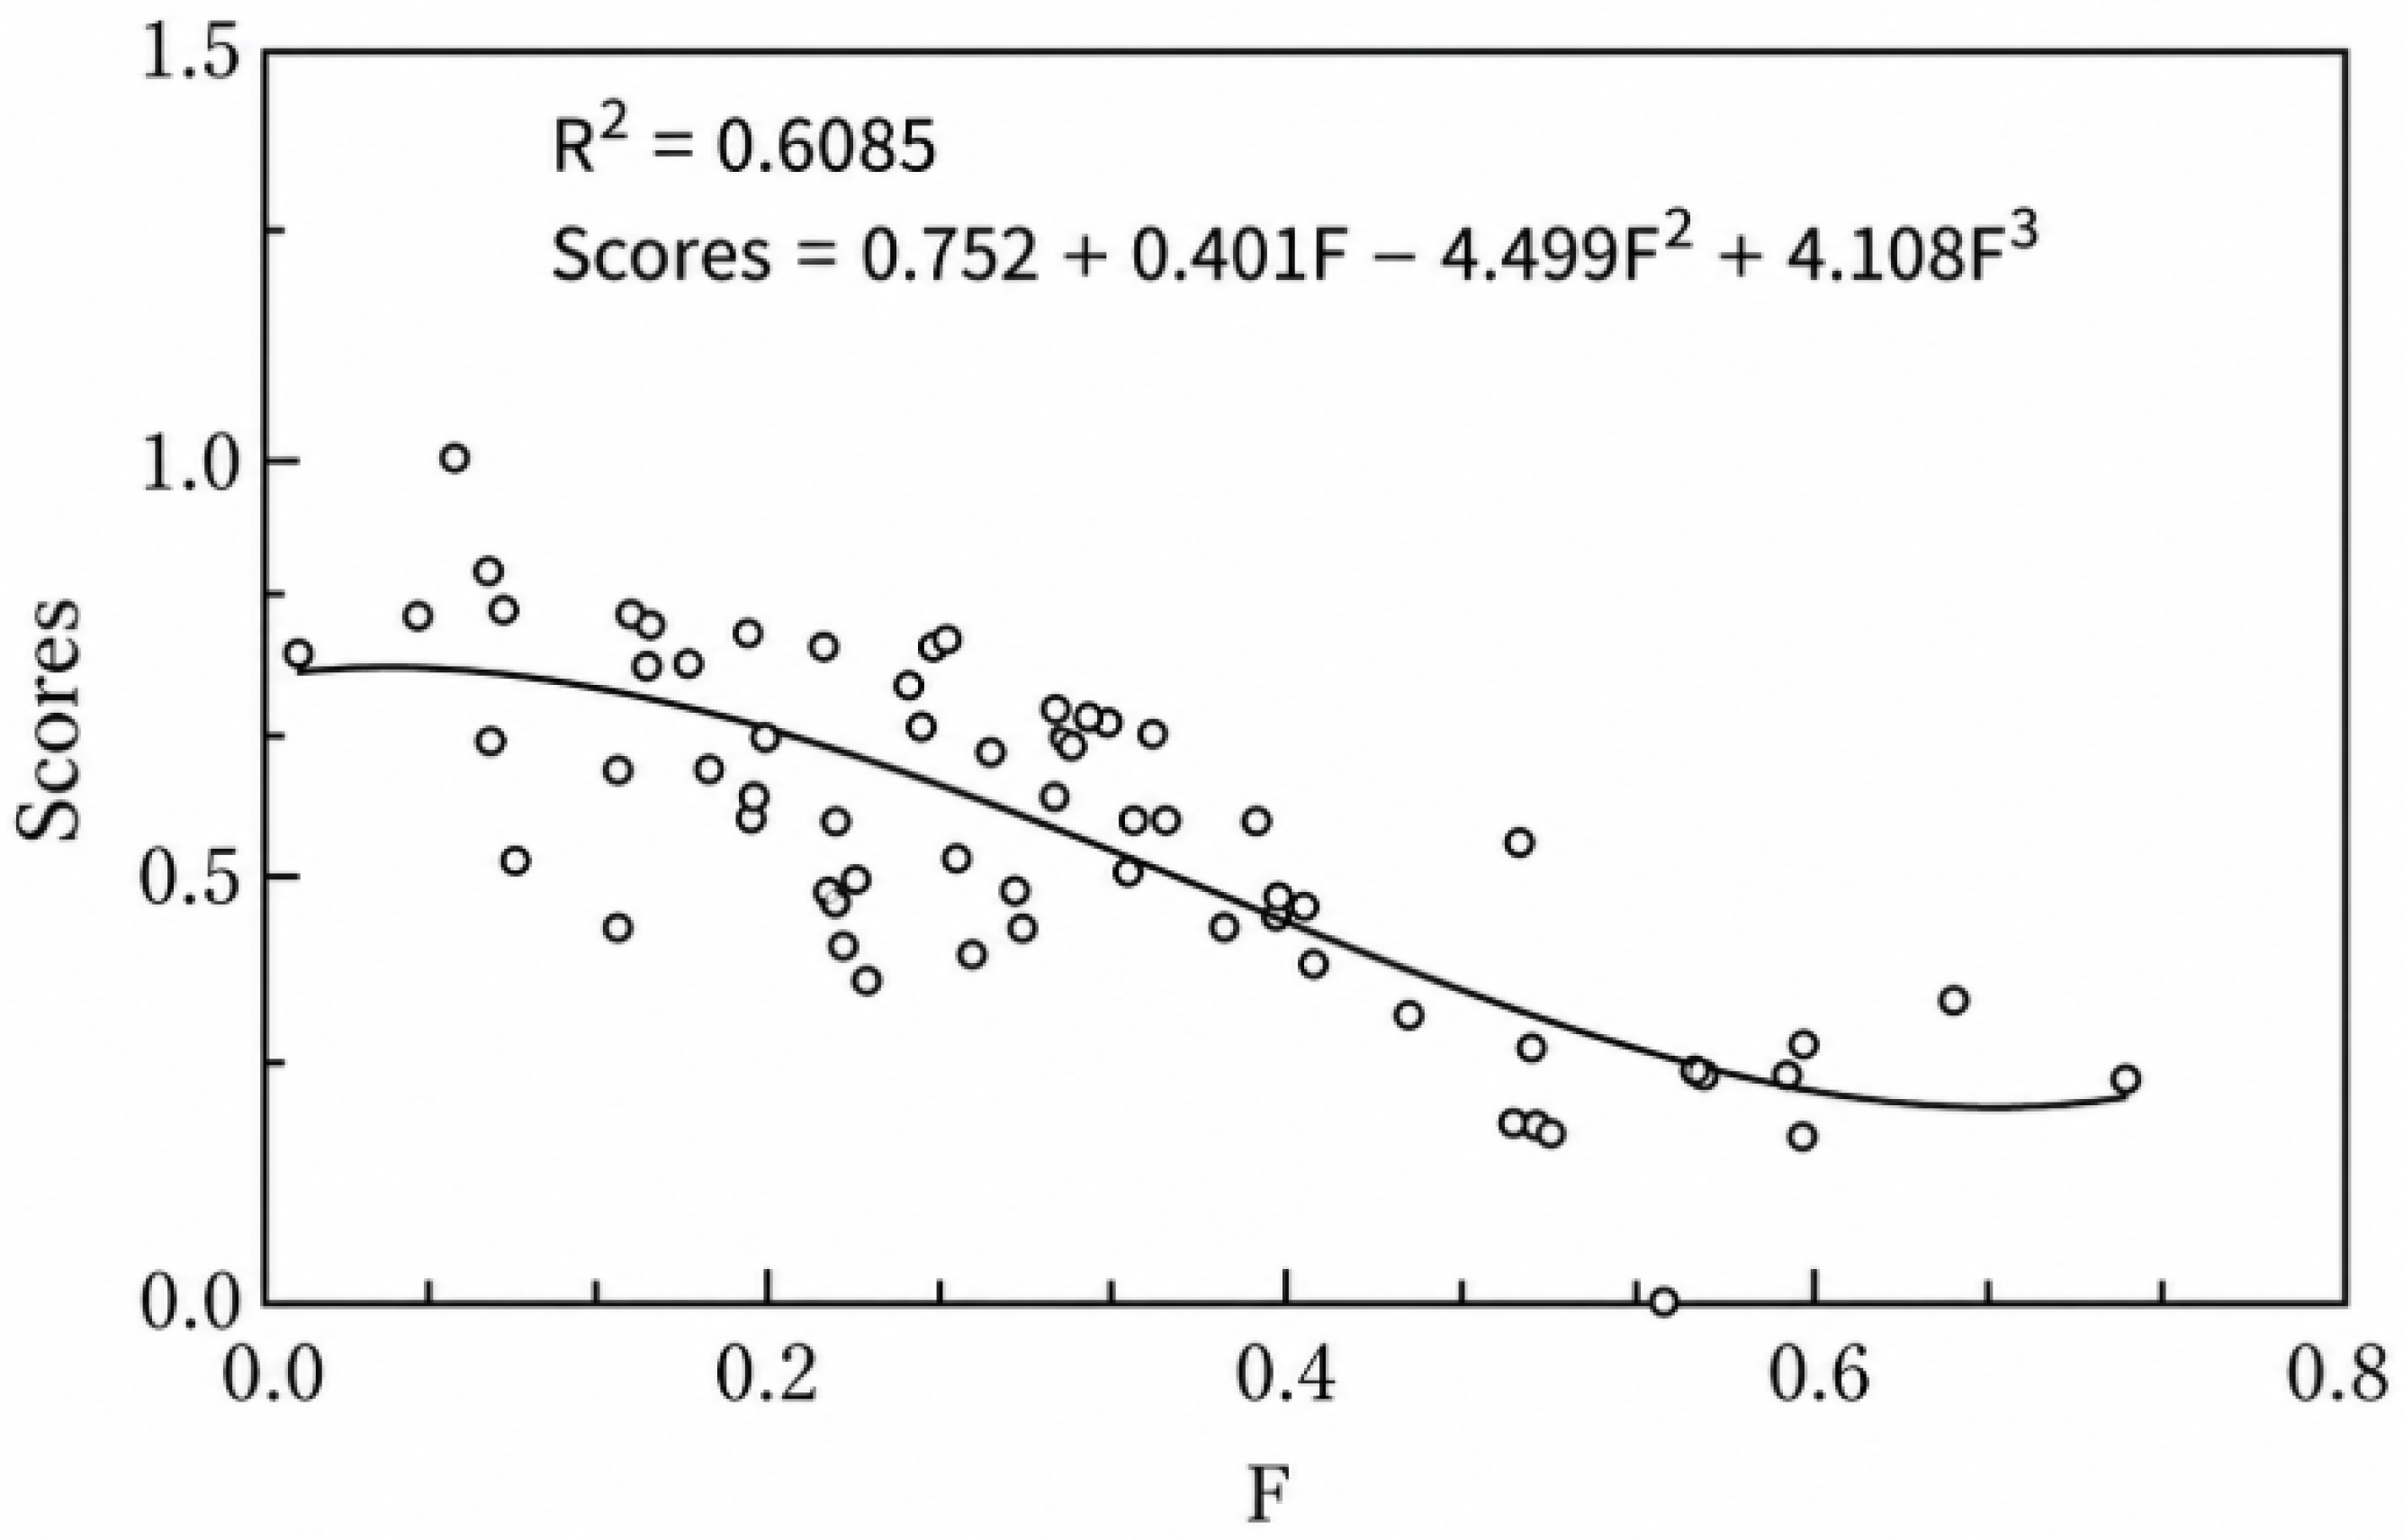
To ensure the instrument reliability and result validity, before the experiment, the subjects were trained to operate the situational test so that they could reach the level of proficiency (stable performance for five consecutive trials). In each subsequent test, the subjects successively filled in the MFI-16 scale, conducted the PVT, and performed the regulatory ability test. Figure 3 shows the scenario during which the test is carried out.
Figure 3.
Experimental scenario.
2.2. Data Analysis and Index Selection
Data were collected from eight subjects over eight tests, and the PVT alertness index of each test was recorded: average reaction time T, standard deviation of reaction time D, fastest 10% reaction time, number of errors, and fatigue scale score. There are 64 datasets in total. Fifty-eight groups of data were selected for analysis and model establishment, and the remaining six groups of data were used to test the reliability of the model.
The authors chose Spearman’s correlation instead of Pearson’s because the relationship is monotonic but not linear. The alertness index data obtained from PVT and the fatigue scale scores were analyzed using Spearman correlation analysis in SPSS26 software. The indexes with high correlation with fatigue are used as parameters to establish the fatigue model [19]. The Spearman correlation between each index and the self-assessed fatigue scale scores is presented in Table 2. According to the results, the mean reaction time T, the standard deviation of reaction time D, and the fastest 10% reaction time were strongly correlated with the fatigue scale scores.
Table 2.
Index correlation analysis.
Since subjects’ reaction time may be affected by individual differences in ability, subject alertness evaluated solely using average reaction time cannot represent the subjects’ true alertness at the current time. For each test, the subject’s responsiveness should be combined with the average reaction time on that test as an indicator of the subject’s alertness judgment at the current moment. The average of the mean reaction time of the subjects in all tests, denoted as RT, is taken as the value of the subject’s responsiveness. The average reaction time of each test is used to calculate the difference value of RT, denoted as DRT, which can represent the level of alertness of the subjects in this test. As shown in Equation (1), higher values of DRT are associated with lower vigilance and vice versa.
where RT is the average reaction time of the participants, and DRT is the difference between the reaction time of each test and the average reaction time of all tests. Spearman correlation analysis was conducted between DRT and the self-test of the fatigue scale after standardization, and the results are shown in Table 3. Comparing the average reaction time T and the standardized DRT value, namely the correlation coefficient between SDRT and the fatigue scale, it was found that the SDRT index value had a higher correlation with the fatigue scale score, so SDRT was selected to replace the average reaction time T as the index of the fatigue calculation equation. In conclusion, when establishing the fatigue value evaluation model, SDRT, the standard deviation of reaction time D, and the fastest 10% reaction time were selected as the evaluation indices of fatigue of control trainees.
Table 3.
New index correlation analysis.
3. Model Building
To establish the fatigue value F calculation equation, the entropy weight–CRITIC combination method is used to determine the weight of each parameter. Among them, the entropy-weight method and the CRITIC method are both objective weighting methods, which minimize the errors in evaluation results caused by subjective human factors and ensure that the outcomes better reflect objective reality [20].
The entropy-weight method calculates the weight of each indicator based on its degree of data dispersion, using information entropy, which results in a more objective indicator weight. However, the drawback of this method is that when the entropy weights of all indicators are close to one, even small gaps will affect the weight values to change exponentially, which will lead to some unimportant indicators being given mismatched weights.
The CRITIC weighting method is an objective weighting approach that determines indicator weights based on the contrast intensity of evaluation indicators and the conflict between indicators. It conducts evaluation by completely utilizing the variation in the data and the correlation between the indicators for scientific evaluation. However, its limitation is that it cannot measure the degree of dispersion between the indicators.
To balance the calculation results of the entropy-weight method and the CRITIC weight method, the game theory aggregation model is used to solve the optimal weight of the two methods. The calculation process is as follows [21]:
(1) Firstly, the evaluation index system is established, and the level matrix R(i*j) is constructed, where i represents the number of samples (i = 1, 2, …, m) and j represents the evaluation index (j = 1, 2, …, n). The horizontal matrix R is normalized to obtain the matrix R’. Where if j is a positive indicator, the standardized calculation formula is shown in Equation (2); if j is a negative indicator, the standardized calculation formula is shown in Equation (3), and the indicators used in the research are all positive.
The findings and their implications should be discussed in the broadest context possible. Future research directions may also be highlighted.
(2) Calculate the entropy value of each index. First calculate the weights of the index values of the ith sample under the jth indicator, see Equation (4).
(3) Then calculate the entropy value of each index, as shown in Equation (5). Where k = ln(m).
(4) Define the entropy weight of the evaluation index . The entropy weight of each index is calculated, and the entropy weight of the jth index is shown in Equation (6).
where represents the entropy weight of the jth index and 0 ≤ ≤ 1 satisfies
(5) Define index variability, expressed by standard deviation, as shown in Equation (7).
In the equation
(6) Define index conflict and express it by correlation coefficient, as shown in Equation (8).
(7) The amount of defined information is defined in Equation (9). A larger information value indicates a greater contribution of the index to the overall evaluation system, and thus it is assigned a higher weight.
(8) Define the objective weight determined by the CRITIC method, see Equation (10).
(9) The weight vector calculated by the entropy weighting method is denoted as , the weight vector calculated by the CRITIC weighting method is denoted as , and is defined as the linear combination of and .
where p = 1, 2, is the weight coefficient of the combination, is the weight coefficient of the entropy-weight method, and is the weight coefficient of the CRITIC weight method.
(10) Determine the weight coefficients of the two methods based on the aggregation model principle of game theory. Firstly, the objective function is defined as shown in Equation (12).
where i = 1, 2. According to the matrix differentiation property, the optimized first-order derivative obtained by taking the derivative of the above equation is shown in Equation (13):
(11) The linear equation system after the optimization of the objective function is defined in Equation (14), and is solved:
(12) is obtained by normalizing , and the weight of the final combination method is obtained, as shown in Equation (15).
The collected data of each indicator of the subjects are standardized into the above steps, and the resultant weight coefficients of each indicator combination are shown in Table 4.
Table 4.
Index weight coefficient.
From Table 4, the expression of fatigue value F can be obtained as Formula (16).
where F is the calculated fatigue degree value, and Xi (i = 1~3) are X1: SDRT, the standard deviation of reaction time; X2 is MRT; and X3 is the fastest 10% reaction time, respectively.
F = 0.240X1 + 0.351X2 + 0.426X3
3.1. Establish a Predictive Model of Control Ability
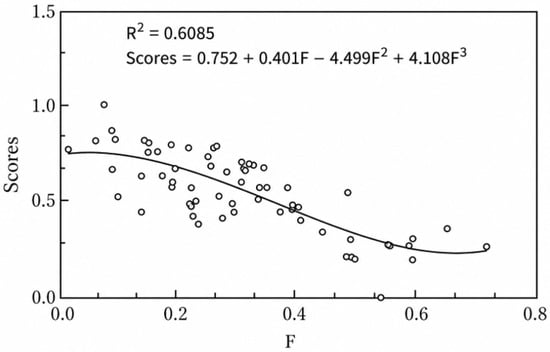
In this part, 58 groups of data are selected for polynomial regression analysis, and the remaining six groups of data are used to test the accuracy of the established model. The F values of the selected 58 groups of data were calculated and curve-fitted with the standardized values of the regulatory ability test scores of the subjects [22,23]. According to the distribution of the scatter plot, the model curve is determined to be cubic, and the curve fitting is shown in Figure 4.
Figure 4.
Fitted curve.
To determine the appropriate functional form, linear and quadratic models were also examined. However, these models showed lower goodness-of-fit compared to the cubic model. Therefore, the cubic function was selected to better represent the nonlinear relationship between fatigue and control performance observed in the data. The model equation is a cubic function with F as the independent variable and the measured control-ability score as the dependent variable. The R2 value of the fit of the curve to the actual data is about 0.61, indicating a large degree of proximity between the data and the fitted formula. This result is reasonable given that control performance is influenced by multiple factors. In addition to fatigue, factors such as individual cognitive ability, training level, and variability across experimental conditions may contribute to performance outcomes. Therefore, fatigue alone cannot fully explain the variation in control ability scores. The fitting formula is shown in Equation (17).
where score represents the predicted control ability test score and F denotes the fatigue level.
3.2. Data Testing and Results
The authors chose to use the 64 sets of experimental data, which were substituted into the fatigue formula to obtain the output value F. SPSS26 was used to conduct Spearman correlation analysis between the fatigue value F of the subjects and each fatigue index, and the results are shown in Table 5.
Table 5.
Correlation test. ** indicates statistical significance at the 0.01 level (p < 0.01, two-tailed).
The results showed that the computed fatigue value F was strongly correlated with both the PVT metrics and the fatigue scale scores, with all correlation coefficients exceeding 0.6. Notably, the correlation between the fatigue value F and the fatigue scale score reached 0.781, indicating that the fatigue model derived from PVT alertness data can effectively assess an individual’s fatigue level.
The remaining six groups of data were substituted into the control ability prediction model to validate its effectiveness. The predicted scores of these six datasets were output, and the interclass correlation coefficient (ICC) was analyzed with the measured scores. ICC is a way to check the consistency of data, and in general, the ICC value is between 0 and 1. An ICC value below 0.40 indicates poor agreement between the two datasets, whereas an ICC value above 0.75 is generally considered to reflect high consistency. The results are presented in Table 6.
Table 6.
Intraclass correlation coefficient (ICC).
The ICC of the two groups of data reached 0.864, and the significance was less than 0.05, indicating a strong consistency between the measured value and the predicted value. The validity of the established regression equation is proven, and the pre-job fatigue state of the controller can predict the controller’s work performance.
4. Conclusions
In the study of Fan, Ma, and Lu (2024) [24], they revealed the dynamic fatigue risk assessment during various work periods. This paper further proposes a specific approach to assessing the level of fatigue in controllers before they begin work by examining their alertness and develops a model to predict their performance under different fatigue levels. The research conclusions are as follows:
(1) The output fatigue value F produced by the proposed model shows a strong and statistically significant correlation with the subjective fatigue scale scores, demonstrating satisfactory consistency. Developed using the entropy-weight method, the F model provides an effective assessment of controller fatigue by integrating three key PVT-based indicators: mean reaction time (DRT), the standard deviation of reaction time (D), and the fastest 10% reaction time. Moreover, the selection of these indicators accounts for individual differences in response ability, allowing the model to more accurately reflect actual fatigue levels.
(2) The 58 sets of F-values generated by the fatigue prediction model were fitted to the actual control ability test scores to develop a predictive model for control performance. The remaining six datasets were then used for validation. The predicted scores for these six sets closely matched the measured scores, demonstrating strong consistency and indicating that pre-job fatigue affects the control ability of trainees. This predictive model can reliably estimate control performance under varying levels of fatigue.
(3) The proposed quantitative method for assessing personnel fatigue is both convenient and effective, providing a rapid tool for evaluating controllers’ pre-duty condition. The control ability prediction model can assess the alignment between a controller’s working state and job requirements, laying the groundwork for optimized rest scheduling and personnel management, thereby helping to reduce safety risks in air traffic control operations.
(4) In this experiment, control trainees served as the subjects, providing both feasibility and a theoretical foundation for future research on the fatigue and control ability of in-service controllers. Future studies will involve in-service controllers of varying ages, increase the number of trials, and expand the experimental scope to develop a more accurate and reliable fatigue detection model.
Limitation and Future Study
This is a pilot study and explicitly discusses the implications from a small sample. To follow up, forming a larger sample size would allow a better scientific result. In addition, the proposed index is a more realistic tool than the self-report MFI-16 to detect fatigue. In the same vein, the weighted approach can be applied to improve the FAA’s Fatigue Risk Management Systems for flight safety.
Author Contributions
Conceptualization, X.F.; methodology, X.F. and C.-T.L.; data extraction, X.F. and C.-T.L.; formal analysis, X.F., C.-T.L. and M.W.; original draft preparation, X.F.; review and editing, C.-T.L. and M.W. All authors have read and agreed to the published version of the manuscript.
Funding
This research received no external funding.
Institutional Review Board Statement
The study was approved by the Institutional Review Board (or Ethics Committee) of Civil Aviation University of China (2 April 2026).
Informed Consent Statement
Not applicable.
Data Availability Statement
The data supporting the findings of this study are available from the corresponding author upon reasonable request. Due to confidentiality agreements and data protection, the data are not publicly available. Requests for access will be evaluated on a case-by-case basis to ensure compliance with institutional policies and applicable regulations. All analyses were conducted using the data described above, and sufficient methodological details are provided in the manuscript to allow replication of the study’s findings.
Conflicts of Interest
The authors declare no conflicts of interest.
Abbreviations
The following abbreviations are used in this manuscript:
| CAS | Circadian Alertness Simulator |
| EEG | Electroencephalography |
| ECG | Electrocardiography |
| ERCLOS | Eye Closure Percentage over Time |
| MFI-20 | multidimensional Fatigue Scale |
| PVT | Psychomotor vigilance test |
| TPMA | Three-process model of Alertness |
References
- International Civil Aviation Organization (ICAO). Fatigue Risk Management Systems Manual for Regulators; International Civil Aviation Organization (ICAO): Montreal, QC, Canada, 2016. [Google Scholar]
- Smets, E.M.A.; Garssen, B.; Bonke, B.; De Haes, J.C.J.M. The Multidimensional Fatigue Inventory (MFI): Psychometric qualities of an instrument to assess fatigue. J. Psychosom. Res. 1995, 39, 315–325. [Google Scholar] [CrossRef] [Scilit] [PubMed]
- Donmez, K.; Demirel, S.; Ozdemir, M. Handling the pseudo pilot assignment problem in air traffic control training by using NASA TLX. J. Air Transp. Manag. 2020, 89, 101934. [Google Scholar] [CrossRef] [Scilit]
- Wang, L. Research on controller fatigue monitoring method based on facial feature recognition. China J. Saf. Sci. 2012, 22, 66–71. [Google Scholar]
- Chen, J. A study of controller fatigue status based on eye movement data and PERCLOS. Wirel. Internet Technol. 2015, 10, 130–131. [Google Scholar]
- Chen, F.L.; Wang, L.L. EEG signal-based fatigue assessment of controllers under different shift systems. China Sci. Pap. 2017, 12, 2198–2203. [Google Scholar]
- Shaw, T.H.; Matthews, G.; Warm, J.S. Individual differences in vigilance: Personality, ability and states of stress. J. Res. Personal. 2010, 44, 297–308. [Google Scholar] [CrossRef] [Scilit]
- Hui, J.Y. Study on the Air Traffic Controller’s Fatigue Risk Prediction Based on the Analysis of Alert Performance. Civ. Aviat. Manag. 2019, 55–58. [Google Scholar]
- Dinges, D.F.; Powell, J.W. Microcomputer analysis of performance on a portable, simple visual RT task during sustained operations. Behav. Res. Methods Instrum. Comput. 1985, 17, 652–655. [Google Scholar] [CrossRef] [Scilit]
- Wang, L.; Zheng, Z.H.; Zhang, Z.Y. Research on Self-test System of Fatigue Degree Based on Vigilance. Space Med. Med. Eng. 2012, 34, 361–366. [Google Scholar] [CrossRef]
- Li, Y.; Zheng, M.Y.; Liu, Z.R. Application of mathematical model in circadian clock. J. Dyn. Control. 2015, 13, 56–61. [Google Scholar]
- Wang, J.; Hou, X.; Jia, Q. Controllers fatigue state of cognitive differences analysis. J. Saf. Environ. 2021, 21, 2652–2659. [Google Scholar] [CrossRef]
- Jin, H.; Liu, Y. Eye movement index testing control fatigue performance study. J. Saf. Environ. 2018, 19, 1004–1007. [Google Scholar] [CrossRef]
- Wang, L.; Chen, F. Based on electrical controllers cognitive behavior and the relationship between fatigue study. Chin. J. Saf. Sci. 2018, 28, 1–6. [Google Scholar] [CrossRef]
- Sun, R.S.; Liu, X.H.; Wu, D. Research on mental fatigue risk model based on alertness energy. China Saf. Sci. J. 2019, 29, 1–5. [Google Scholar] [CrossRef]
- Sun, R.S.; Ma, G.F.; Yuan, L.P. Revision on multidimensional fatigue inventory for controllers and analysis on reliability and validity analysis. Occup. Health 2016, 32, 3053–3056. [Google Scholar]
- Basner, M.; Dinges, D.F. Maximizing sensitivity of the psychomotor vigilance test (PVT) to sleep loss. Sleep 2011, 34, 581–591. [Google Scholar] [CrossRef] [Scilit] [PubMed]
- Mkrtchyan, L.; Podofillini, L.; Dang, V.N. Bayesian belief networks for human reliability analysis: A review of applications and gaps. Reliab. Eng. Syst. Saf. 2015, 139, 1–16. [Google Scholar] [CrossRef] [Scilit]
- Wang, L.L.; Wang, K.R. Analysis on mark index of controller fatigue based on grey relational theory. J. Saf. Environ. 2022, 22, 810–818. [Google Scholar]
- Diakoulaki, D.; Mavrotas, G.; Papayannakis, L. Determining objective weights in multiple criteria problems: The CRITIC method. Comput. Oper. Res. 1995, 22, 763–770. [Google Scholar] [CrossRef] [Scilit]
- Wang, K. Approach Controllers Control Capability Assessment. Doctoral Dissertation, Civil Aviation University of China, Tianjin, China, 2022. [Google Scholar] [CrossRef]
- Wang, K.R. The Evaluation of Approach Controller’s Control Ability. Doctoral Dissertation, Civil Aviation University of China, Tianjin, China, 2022. [Google Scholar] [CrossRef]
- Qi, Y.J. Correlation Analysis between the Psychological Empowerment of Initial Controllers and Nervous System Characteristics. J. Chang. Aeronaut. Vocat. Tech. Coll. 2022, 22, 20–23+27. [Google Scholar] [CrossRef]
- Fan, X.; Ma, Y.; Lu, C.-t. Enhancing insight into air traffic controller fatigue: A dynamic quantitative examination through biological rhythms. Coll. Aviat. Rev. Int. 2024, 42, 1–16. Available online: https://ojs.library.okstate.edu/osu/index.php/CARI/article/view/9767/8796 (accessed on 27 March 2026). [CrossRef] [Scilit]

Disclaimer/Publisher’s Note: The statements, opinions and data contained in all publications are solely those of the individual author(s) and contributor(s) and not of MDPI and/or the editor(s). MDPI and/or the editor(s) disclaim responsibility for any injury to people or property resulting from any ideas, methods, instructions or products referred to in the content. |
© 2026 by the authors. Licensee MDPI, Basel, Switzerland. This article is an open access article distributed under the terms and conditions of the Creative Commons Attribution (CC BY) license.