Article

Assessing the Safety Impacts of School Zone Speed Management: Developing Crash Modification Factors Using Before-and-After Evaluation Methods


Department of Civil & Environmental Engineering, Southern Polytechnic College of Engineering & Engineering Technology, Kennesaw State University, Marietta, GA 30060, USA
*
Author to whom correspondence should be addressed.
Safety 2026, 12(4), 92; https://doi.org/10.3390/safety12040092
Submission received: 18 May 2026 / Revised: 28 June 2026 / Accepted: 6 July 2026 / Published: 8 July 2026

Abstract

Automated Speed Enforcement (ASE) has emerged as a prominent speed enforcement practice, attracting policy attention as its adoption has increased. Although ASE has been widely studied on residential streets and urban corridors, empirical evidence regarding its effectiveness in school zones is limited, where vulnerable road users and time-specific exposure create distinct safety challenges. This study developed Crash Modification Factors (CMFs) for ASE in school zones that quantify the expected change in crash frequency associated with a safety treatment, using before-and-after studies with Empirical Bayes (EB) and comparison group methods. The before-and-after crash studies yielded CMFs below 1.0 in all scenarios considered in this study, indicating the safety benefits of ASE across multiple crash and school categories. The comparison group before-and-after study indicated that, following ASE implementation, total crashes decreased by 10 percent (CMF = 0.90) and 9 percent (CMF = 0.91), while speeding-induced crashes decreased by 35 percent (CMF = 0.65) and 54 percent (CMF = 0.46) for school zones on state-maintained and locally maintained roads, respectively. Thus, estimated CMFs provide quantitative inputs that agencies may consider, indicating that ASE is an effective speed management strategy for improving safety in school zones and justifying investment.

1. Introduction

Reducing crash risk has been explored by identifying and managing drivers’ behaviors, particularly driving speed, which is recognized as a major risk factor, contributing to 50% of crashes worldwide [1,2]. Speeding, defined as exceeding the posted speed limit, driving at an unsafe speed for prevailing conditions, or engaging in high-risk driving behavior, remains a major traffic safety concern. Excessive speed contributes substantially to both the frequency and severity of crashes [3,4]. Certain road users, particularly those with limited physical or cognitive capabilities, are disproportionately affected by excessive speeds, making the consequences of speeding more severe. Children are one of the most critical groups because of their small physical stature, reduced conspicuity, unpredictable behavior, and limitations in judging vehicle speeds or distances [5]. Effective speed management strategies have been shown to reduce traffic crashes and their severity [6], with even a 5 mph speed reduction associated with a lower risk of severe and fatal injuries among kids [7]. A variety of measures are employed in school zones to manage vehicle speeds, including traffic-calming measures, flashing beacons, speed limit signs, manual speed enforcement, and Automated Speed Enforcement (ASE) [8].
Among these speed management strategies, ASE has experienced increasing adoption in recent years [9]. The goal of ASE is to complement traditional law enforcement by elevating the objective and perceived risk of being cited, thereby deterring speeding behavior and ultimately reducing crash occurrence [10]. ASE systems typically use two main types of speed cameras: fixed and mobile cameras [11]. Fixed cameras are installed at predetermined critical locations to provide continuous speed monitoring, including school and work zones. Mobile cameras are portable speed cameras that can be deployed at different locations as needed, providing flexibility to address speeding problems at temporary or emerging high-risk sites. These automated systems are configured and operated differently depending on the installation location, incorporating diverse traffic policies, operational thresholds, or technology.
This study was conducted to assess the safety impacts of ASE in school zones and to identify policy-related insights to guide decisions on implementation, continuation, and long-term use. In the United States (US), implementing ASE has become more challenging than in other countries and has become a politically sensitive topic, with frequent policy changes and public opposition [12]. Only a few studies have been performed in the US to assess ASE programs in school zones, and there is a lack of data-driven evidence of their effectiveness [8,13]. School zones are highly significant for traffic safety due to the presence of children, traffic surges during drop-off and pick-up hours, and high levels of interaction between motorized and non-motorized road users. In this context, it is important to address the existing knowledge and implementation gap by providing empirical evidence to inform decision-makers and agencies in improving school zone safety. Therefore, the first objective of this study was to quantitatively evaluate the impact of ASE by estimating Crash Modification Factors (CMFs) for school zones using before-and-after studies. These CMFs quantify the expected change in crash frequency resulting from a specific safety intervention relative to the condition without the intervention. The second objective was to provide insights and recommendations to inform traffic safety policy and investment decisions. The data for this study were collected from the school zone ASE program in Georgia (GA), US, and this is the first comprehensive evaluation of this program. This manuscript constitutes a component of a broader research project conducted for the Georgia Department of Transportation (GDOT) [14,15].

2. Literature Review

School zones are typically considered critical locations because they involve child pedestrians and time-specific traffic patterns. Over the past decade in the US, school zones have experienced a concerning number of child pedestrian injuries and fatalities, with approximately 25,000 injuries and 100 fatalities [16]. A study conducted in school zones in Mississippi, US, revealed that mean speed exceeded the posted school zone speed limit [17] and selected school zones in GA, US, had more than 54 percent of drivers who traveled at 15 mph or more above the posted speed limit, and 14.2 percent drivers exceeded the school zone speed limit by 20–24 mph [18]. Another study observed speeding behavior over a 5-week period from 147 drivers in a selected group of school zones in Sydney, Australia, using GPS data [19]. The study focused on how long and how much drivers exceeded the posted speed limits, and it was found that 23 percent of the distance traveled surpassed the posted school zone speed limits, a significant percentage compared to other street categories examined in the study. Selected school zones in Calgary, Canada, also exhibited higher mean and 85th-percentile speeds [5]. Additionally, in selected school zones in Toronto, Canada, the area density of fatal collisions was significantly high, and collision density decreased with increasing distance from the school [20].
Within this context, enhancing driver compliance in school zones and thereby reducing the crashes is the ultimate justification for ASE policy. ASE is increasingly adopted to enforce speeds due to its advantages in resource optimization, coverage, and consistency [13]. The ASE program in both school zones and residential streets in Maryland, US, showed a direct reduction in vehicle speeds and crashes, reducing severe injury and fatal crashes by 19.54 percent [21]. The school zone ASE camera program in Seattle, Washington, US, was found to reduce speed limit violation rates over time [8]. Additionally, ASE cameras in school zones in New York City reported that the program has been largely successful in reducing speed violations in both the short and long term, and provided statistically significant evidence of a 14 percent reduction in crashes after implementing speed cameras [13]. In Korea, a study using Bayesian structural time-series models to evaluate the effectiveness of tougher school zone laws, which included automated traffic safety devices, found that those laws did not significantly reduce crash rates, either per million vehicles or per million children [22]. Given the limited number of school zone-specific studies, researchers have frequently examined ASE effectiveness in other roadway contexts, as presented in Table 1, where speed management is critical.
In addition, several challenges exist when implementing and operating ASE programs. Public opposition remains a primary hurdle to implementing ASE, specifically in the US, and many individuals and entities question the significance of these programs [23]. In the US, speeding is consistently seen as far less dangerous than other behaviors, such as drunk driving or distracted driving [24]. Several concerns exist regarding ASE, including its limited impact on driver behavior, crash prevention, and overall reductions in traffic violations [25,26]. Concerns have also been raised regarding equipment reliability, delayed violation notices, and limited public awareness. Some critics further question whether ASE is motivated more by revenue collection than by safety improvements [27]. Additionally, there are claims that implementation locations are deliberately selected to maximize violation detection and may be associated with racial bias, leading to concerns about fairness [28].
Overall, prior studies have reported effects ranging from no statistically significant change to reductions of up to 73 percent in crashes following the implementation of ASE, depending on location and methodology. While the safety effectiveness of ASE has been widely evaluated across different contexts, such as residential streets and urban corridors, its effectiveness in school zones remains underexplored. As a result, a knowledge and implementation gap exists, including guidance on implementation, continuation, and the long-term use of ASE programs in school zones. Also, most ASE guidelines are too qualitative to interpret, and the potential benefits of using the guidelines are not realized [29]. To address this gap, this study provides empirical evidence on the safety effectiveness of ASE in school zones by developing CMFs across multiple crash categories and school types.
Table 1. Studies conducted on ASE in other roadway contexts.
StudyCountryFindings
[30]The United States (US)A 5 percent and 2.5 percent reduction in collisions and injuries per month on average, respectively (based on a quasi-experimental evaluation).
[31]The USA 33% reduction in reported collisions and a 3% reduction in traffic fatalities at camera sites (based on raw crash counts).
After camera installation, crashes and injuries decreased by 50% relative to the most similar arterials, all arterials, and local roads in Philadelphia (obtained from an Negative Binomial and Poisson regression approach).
[32]The USA 12% reduction in fatal and injury crashes across treated locations (overall safety impact from the Empirical Bayes (EB) method).
A 15% reduction in fatal and severe injury crashes (overall safety impact from the EB method).
Some treated sites did not demonstrate expected safety benefits.
[33]The USA 9.35% reduction in all crashes, a 13.16% reduction in Property Damage Only (PDO) crashes, and a 30.3% reduction in injury crashes (based on raw crash counts).
[13]The USA 14% reduction in collisions after implementing cameras (based on raw crash counts).
[34]CanadaA 14% ± 11% reduction in expected collisions at treated locations (from the EB method).
[35]The United Kingdom (UK)A reduction in crashes over a distance of up to 1 km upstream and downstream of the camera, averaging 20% or 1 PIA/km/year, attributable to a reduction in speed (from the EB method).
[36]The NetherlandsThe odds ratio was 0.79 for injury crashes (49% reduction in raw crash numbers during the after period at treated sites and 35% reduction in raw crash numbers during the after period at control sites).
The same odds ratio of 0.79 was obtained for serious casualties (57% reduction in raw crash numbers in the after period at treated sites and 45% reduction in raw crash numbers in the after period at control sites).
[37]The UKWithin a 100 m radius, injuries were 73% lower (rate ratio 0.27, 95% Confidence Interval, 0.19 to 0.39).
Within 100–300 m radius, the reduction was 24% (0.76, 0.66 to 0.88).
Reductions within 300–500 and 500–1000 m radius bands were not statistically significant.
Using the routes method, a significant reduction in injuries was found within 100 m of sites (0.30, 0.20 to 0.42), and minor reductions at distances of 100–300 m (0.55, 0.43 to 0.68) and 300–500 m (0.59, 0.46 to 0.76) (based on a comparison group before-and-after study that used a standard ratio approach)

3. Methodology

3.1. Data Description

This study collected data from the ASE program in school zones in GA, US, which was enabled by Georgia House Bill 978 in 2018, authorizing the installation of ASE cameras in school zones [38]. These fixed cameras are operated only during active school days and specified school hours, including one hour before classes begin and one hour after dismissal. A violation is typically defined as exceeding the posted school zone speed limit by more than 10 mph. During the initial 30-day period after installation, drivers receive warning notices without penalties; thereafter, violations result in civil fines of $75 for the first offense and $125 for subsequent offenses. Non-compliance may lead to additional notices and administrative actions, including restrictions on vehicle registration renewal and title transfer.
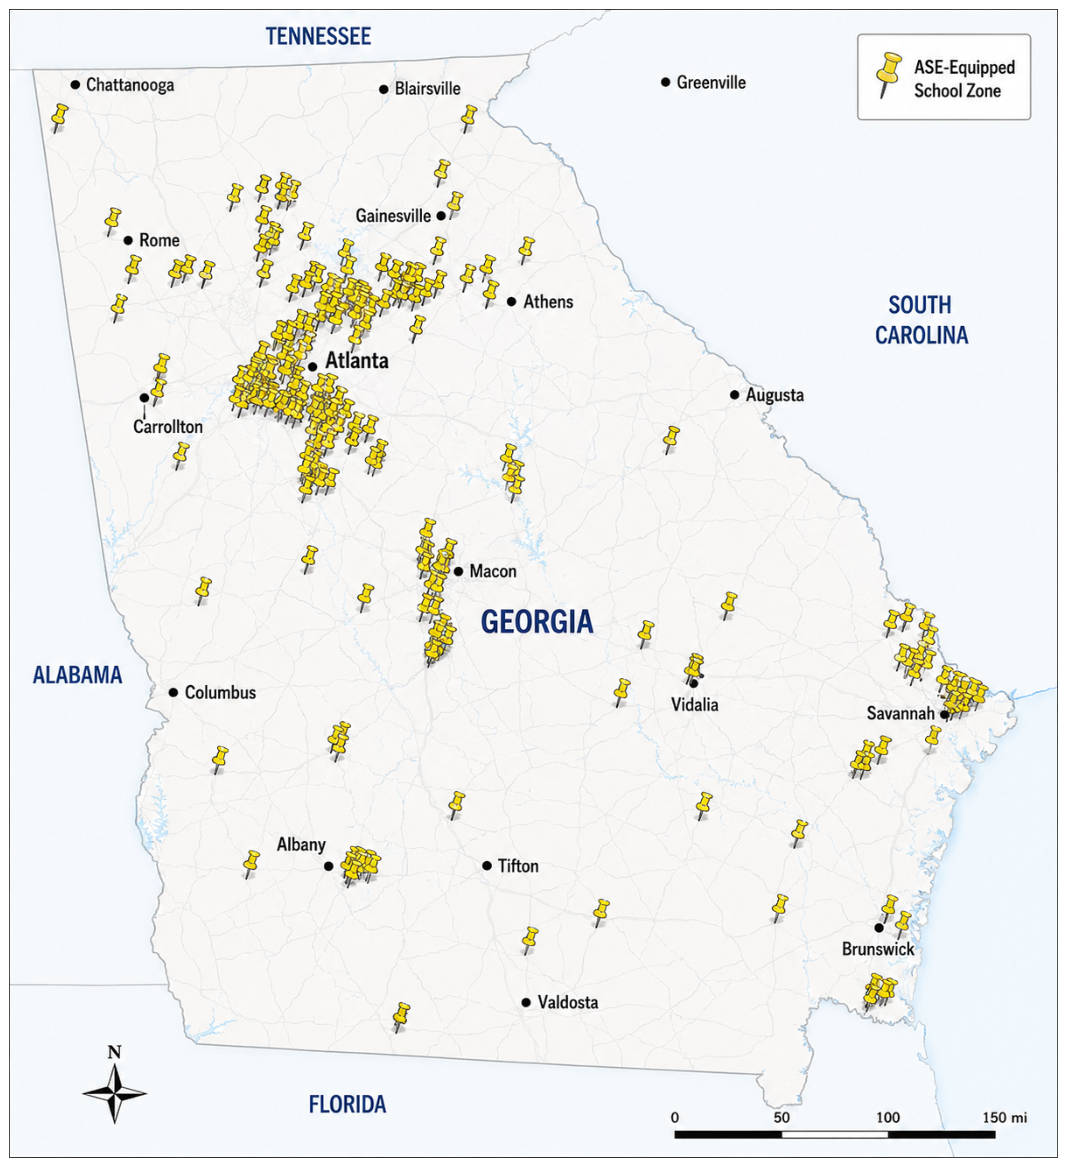
Currently, ASE is in effect in approximately 286 school zones across GA. Of these, at certain schools, two pairs of cameras were deployed on separate road segments, resulting in a total of 295 camera sites. Figure 1 shows all schools in GA equipped with ASE. Schools with limited information or combined school zones were excluded, leaving 187 ASE-equipped school zones. The sample was divided into two groups: on-system schools, where schools were located on state-maintained roads, and off-system schools, where schools were located on locally maintained roads. On-system roads are part of the Georgia State Highway System and are maintained by the GDOT, whereas off-system roads are maintained by local governments such as counties or municipalities. This distinction is important because the two roadway systems often differ in traffic volumes, speeds, roadway characteristics, and traffic management practices. Therefore, analyzing on-system and off-system school zones separately provides a more accurate assessment of the safety impacts of ASE. The minimum required sample size for each category was calculated using Cochran’s formula, yielding 55 on-system and 99 off-system schools.
A comparable group of control schools where ASE has not been implemented was selected. This control group was identified by first prioritizing schools located within the same county as the treated school to better approximate comparable geometric and traffic conditions. When no suitable matches were available, schools from adjacent counties were used instead. Factors such as school zone speed limit, school type, roadway classification, upstream speed limits, availability of traffic control mechanisms, traffic volumes, school enrolment, and geometric features of the school zone were prioritized when selecting control schools. Because school zones throughout the state vary considerably, the selection process was carried out manually and systematically using engineering judgment. This approach allowed qualitative and contextual characteristics to be considered. Consistent with the sample sizes of the treated school groups, 55 on-system control schools and 99 off-system control schools were included in the study.
The before-and-after periods at each selected school were determined depending on the implementation date of the particular ASE program, and the periods were equal in length to accommodate temporal variations, ensure data consistency, and facilitate accurate approximation of effects, as suggested in the Highway Safety Manual (HSM) [39]. In addition, the COVID-19 pandemic period from March 2020 to July 2021 was excluded from the analysis as schools were fully or partially closed, and ASE was not operational. Table 2 summarizes the before-and-after durations considered in the study. Total crashes and speed-induced crashes, along with their severity levels, traffic volumes, and roadway geometry-related data, were extracted from the Georgia Electronic Accident Reporting System (GEARS), the Traffic Analysis and Data Application (TADA), and Google Earth, respectively. Table 3 and Table 4 show the observed crash counts at selected treated and control sites during the before-and-after periods.
Crash, traffic, and geometric data were collected within selected school zones. In GA, school zones are defined as the area within 1000 ft of the boundary of any public or private elementary or secondary school [40], where reduced speed limits are in effect during specified periods, such as student arrival and dismissal times. However, the spatial extent of the school zone may vary across locations depending on roadway classification and geometry, access points, and local engineering judgment. School zones are delineated in the field through regulatory school zone signage, pavement markings, reduced speed limit signs, and active traffic control devices, such as flashing beacons, as needed. In the study, data collection was conducted within the posted school zone segments at each selected location, with boundaries defined based on the signed limits of the active school zone.

3.2. Before-and-After Study with Emprical Bayes (EB) Method

The primary objective of the data analysis was to estimate CMFs for ASE in school zones using two established methodologies recommended by the HSM: the EB before-and-after method and the comparison group method.
Based on the roadway classification at each selected school zone and crash type, applicable crash prediction models were selected from the HSM Volume 02, and each model was calibrated to actual site conditions. In this model calibration process, the model equations or the Safety Performance Functions were adjusted using CMFs provided in Table 5, depending on the facility type.
Using the calibrated models, the predicted average crash frequency was calculated for the selected sites as follows:
N p r e d i c t e d = N s p f × ( C M F 1 x × C M F 2 x × . × C M F n x ) × C x
Nspf refers to the predicted average crash frequency derived from the applicable model with base conditions, CMF1x to CMFnx refer to the CMFs used to calibrate the models for the actual site conditions as described in Table 5, and Cx is the calibration factor, which is specific to road conditions in GA. Currently, no well-established calibration factors have been derived for GA for the considered road categories; hence, Cx = 1 was considered.

EB Method

The EB method combines predicted crash frequency from models with observed crash frequency at a particular site, yielding more accurate estimates. Expected crash frequency was estimated as follows:
N e x p e c t e d , B = w i , B × N p r e d i c t e d + ( 1 w i , B ) × N o b s e r v e d ,   B
wi,B is the weighted adjustment factor determined for the before period at each school location, and it was derived as follows:
w i , B = 1 1 + k B e f o r e   y e a r s N p r e d i c t e d
k is the overdispersion parameter of the applied model. This weighted adjustment factor determines how much weight is given to the observed crash count versus the predicted crash count from the corresponding model at each location, reducing the effects of random fluctuations in crash counts, correcting for regression to the mean, and producing more reliable and unbiased estimates.
After calculating expected crash frequencies for both before-and-after periods, the adjusted odds ratio (OR), which is equivalent to the CMF, was calculated as follows:
O R = O R 1 + V a r A l l s i t e s N e x p e c t e d , A A l l s i t e s N e x p e c t e d , A 2
where
V a r A l l s i t e s N e x p e c t e d , A = A l l s i t e s r i 2 × N e x p e c t e d , B × ( 1 w i , B )

3.3. Before-and-After Study with Comparison Group Method

The comparison group method estimated adjustment factors for each treated school i and control site j as follows:
A d j i , j , B = N p r e d i c t e d , T , B N p r e d i c t e d , C , B × Y B T Y B C
A d j i , j , A = N p r e d i c t e d , T , A N p r e d i c t e d , C , A × Y A T Y A C
where YBT, YBC, YAT, and YAC refer to the number of years in the before-and-after durations of the corresponding treated and control school. In the study, similar before-and-after periods were used at a particular treated location and the corresponding control location; hence, YBT/YBC and YAT/YAC were equal to 1.
The expected average crash frequencies for the before-and-after periods were estimated as follows:
N e x p e c t e d , C , B = N o b s e r v e d , C , B × A d j i , j , B
N e x p e c t e d , C , A = N o b s e r v e d , C , A × A d j i , j , A
After calculating the expected average crash frequency at each control school for both before-and-after periods using the adjustment factors, the total control group expected average crash frequency in the before period, and the expected average crash frequency if the treatment was not in place were calculated as follows:
N e x p e c t e d , C , B , t o t a l = A l l   c o n t r o l   s i t e s N e x p e c t e d , C , B
N e x p e c t e d , T , A = N o b s e r v e d , T , B × r i c
where ric is the ratio of the total expected crash frequencies at the control schools in the after period to those in the before period. The site-level OR was estimated as follows:
O R i = N o b s e r v e d , T , A N e x p e c t e d , T , A
The overall OR or the CMF was calculated as follows, where R is the weighted average log OR for all treated sites n:
O R = e x p R
Statistical significance (SS) of the estimated CMFs was evaluated using the z-score as suggested by the HSM as follows:
If ,   S a f e t y   E f f e c t i v e n e s s S E ( S a f e t y   E f f e c t i v e n e s s ) 1.7   ( significant   90 %   CI ) ,   or   2.0   ( significant   95 %   CI )
In the study, the EB method provides the advantage of improving the reliability of estimates by combining observed crash counts with predictions from calibrated models, thereby reducing the influence of random crash variability and regression-to-the-mean bias. However, in this study, the EB method was applied only to treated locations, thereby limiting its ability to explicitly account for concurrent changes at control sites over time. In contrast, the comparison group method incorporates both treated and control locations, enabling explicit control for external factors such as traffic trends, policy changes, and temporal variability that may influence crash outcomes. Therefore, the comparison group method helps to isolate the ASE treatment effect more effectively. Nevertheless, the comparison group method is sensitive to the quality of the selected control sites and assumes that they adequately represent the underlying trend in the absence of treatment at treated locations. Accordingly, the study uses both methods to provide complementary insights: the EB method improves the stability of estimates at individual sites, while the comparison group method better accounts for overall time-related and contextual changes.

4. Results and Discussion

4.1. CMFs: Before-and-After Study with EB Method

Table 6 reports CMFs calculated for all crashes and for speed-induced crashes, along with their severity levels. In the study, speed-induced crashes were defined as crashes in which speeding was a contributing factor in the police crash report, including exceeding the posted speed limit, driving too fast for existing conditions, or speeding identified as a contributory cause by the investigating officer. At on-system treated and control locations, speed-induced crashes accounted for 2.8 percent and 1.5 percent of total crashes during the before period, and 3 percent and 1.7 percent during the after period, respectively. At off-system treated and control locations, speed-induced crashes were 3.7 percent and 2.5 percent of total crashes during the before period, and 3.3 percent and 2 percent during the after period, respectively.
There was no clear pattern observed in the estimates across different schools or crash types. Except for the CMF estimated for fatal and injury crashes at off-system schools, other CMF estimates were statistically significant at the 90 or 95 percent confidence level. In general, all estimated CMFs implied a decline in total and speed-induced crashes following the implementation of ASE.

4.2. CMFs: Before-and-After Study with Comparison Group Method

Table 7 reports CMFs estimated for all crashes and speed-induced crashes, and their severity levels, using the comparison group method. All CMFs were below 1.0, indicating a decline in crashes following the implementation of ASE. Except for fatal and injury crashes, the calculated CMFs for all crashes were statistically significant at the 95 percent or 90 percent confidence levels. The CMFs related to speed-induced crashes were comparatively low, indicating the safety benefits of ASE. However, speed-induced crash frequency was somewhat lower than the overall observed crash frequency. Thus, the calculated CMFs may be less dependable than the CMFs estimated for all crashes.
CMFs estimated using the comparison group method were comparatively reliable because this method isolated the effects of ASE by controlling for potential external factors, if any. In summary, the CMFs presented in Table 8, derived from the comparison group method, are suggested to use in future applications. Although studies used different measures to assess the effectiveness of ASE programs, the findings of this study generally align with those from similar studies presented in Section 2 of this manuscript, which indicate a range from no impact to a 73 percent reduction in crashes attributable to ASE. Additionally, the HSM suggests a 5 percent reduction in total crashes due to ASE [39].
The estimated CMFs demonstrate the safety effectiveness of ASE in reducing crashes in school zones, and these findings provide evidence-based policy and operational implications for its deployment. From an implementation perspective, these findings support continued and context-sensitive use of ASE, particularly in locations with documented speeding issues and vulnerable road users. This crash-based evaluation is further strengthened by the previously published driver perception study conducted as part of the same broader research program [15], which indicated generally favorable public attitudes towards ASE. When considered together, the safety performance results and behavioral insights provide a more comprehensive evidence base for decision-makers, supporting both the effectiveness and public acceptability of ASE as a speed management strategy in school environments.
Additionally, a few limitations exist in the methodology of this study that should be recognized to properly interpret the conclusions and inform future research. The HSM recommends using at least 3 years of data to obtain more reliable estimates of changes in safety performance. However, most camera programs were implemented during the 2018–2023 period, including the pandemic, resulting in before-and-after durations of less than 3 years at some selected schools. It was intended to analyze pedestrian-involved crashes separately; however, developing CMFs was not feasible due to the limited number of such crashes. Only five pedestrian-involved crashes were recorded across all on-system schools, three before and two after, while off-system schools experienced 10 and 9 pedestrian-involved crashes during the before-and-after periods. These samples were insufficient to support statistically reliable CMF estimation, partly because of the relatively short observation periods. As longer before-and-after periods become available over time, future research may be able to evaluate pedestrian-involved crashes more robustly. Additionally, the model calibration process requires a calibration factor to account for local conditions, and GA currently lacks an established calibration factor for the relevant facility types. Although these limitations do not undermine the validity of the study, they are important for contextualizing the results and identifying directions for future research.

5. Conclusions

The study quantitatively evaluated the impact of ASE in school zones by empirically estimating CMFs using established EB and comparison group methodologies. School zones are considered critical locations because they carry child pedestrians, bikers, and school bus passengers, elevating safety concerns, where even a minor safety improvement can yield substantial public health benefits. The findings indicate that ASE is associated with measurable reductions in crash occurrence, although the magnitude varies across schools and crash types, reflecting differences in site characteristics, exposure, and implementation conditions. These findings provide robust empirical evidence supporting ASE as an effective speed management and safety countermeasure in school environments.
Beyond statistical significance, the estimated CMFs provide a transferable, policy-relevant measure of safety performance that can support evidence-based decision-making for enforcement prioritization and resource allocation. However, the transferability of these findings to other jurisdictions may be influenced by local implementation, operational practices, and roadway context; hence, adaptation should be undertaken carefully. From a policy and implementation perspective, targeted deployment strategies are recommended over uniform application, particularly prioritizing locations with documented speed non-compliance or higher crash risk, while ensuring efficient allocation of limited safety resources.
Furthermore, the results highlight the importance of clearly communicating quantified safety benefits to stakeholders to improve transparency and support for ASE programs. The CMFs developed in this study provide an objective basis for such communication, enabling agencies to justify enforcement strategies using measurable safety outcomes. Finally, continuous monitoring and periodic reevaluation of ASE performance are essential, as changes in traffic conditions, compliance behavior, and school activity patterns may influence long-term effectiveness. Ongoing CMF-based evaluation can therefore support adaptive safety management and ensure sustained improvements in school zone safety over time.

Author Contributions

Conceptualization, S.D. and S.G.; methodology, S.D. and S.G.; software, S.G.; validation, S.G.; formal analysis, S.G.; investigation, S.D.; resources, S.D. and P.B.; data curation, S.G.; writing—original draft preparation, S.G.; writing—review and editing, S.D.; visualization, S.G.; supervision, S.D. and P.B.; project administration, S.D.; funding acquisition, S.D. All authors have read and agreed to the published version of the manuscript.

Funding

This research was funded by the Georgia Department of Transportation (GDOT), project number RP 23-15.

Institutional Review Board Statement

Not applicable.

Informed Consent Statement

Not applicable.

Data Availability Statement

The preliminary raw data supporting the conclusions of this article are available at “https://kennesawedu-my.sharepoint.com/:w:/g/personal/sudahawa_students_kennesaw_edu/IQCDk_8nK2vHSLPP18nH8_oNATPi41azIUB9NpcqKaGRowo?rtime=eryZbFDc3kg (accessed on 4 July 2026)” and the GDOT Crash Data Dashboard at “https://www.dot.ga.gov/GDOT/pages/CrashReporting.aspx (accessed on 4 July 2026)”.

Conflicts of Interest

The authors declare no conflicts of interest.

Abbreviations

The following abbreviations are used in this manuscript:
ASEAutomated Speed Enforcement
CMFCrash Modification Factor
EBEmpirical Bayes
GAGeorgia
GDOTGeorgia Department of Transportation
HSMHighway Safety Manual
OROdds Ratio
SSStatistical Significance
USUnited States

References

  1. Global Status Report on Road Safety 2023. Available online: https://www.who.int/publications/i/item/9789240086517 (accessed on 6 February 2026).
  2. Jabeur, N.; Haddad, H.; Bouyahia, Z.; Outay, F.; Mastouri, M. The intersection of driving and health: Toward a framework for healthy driving. J. Transp. Health 2026, 48, 102260. [Google Scholar] [CrossRef] [Scilit]
  3. National Highway Traffic Safety Administration (NHTSA). Speeding-Risky Driving. Available online: https://www.nhtsa.gov/risky-driving/speeding (accessed on 27 August 2025).
  4. Jurewicz, C.; Sobhani, A.; Woolley, J.; Dutschke, J.; Corben, B. Exploration of Vehicle Impact Speed—Injury Severity Relationships for Application in Safer Road Design. Transp. Res. Procedia 2016, 14, 4247–4256. [Google Scholar] [CrossRef] [Scilit]
  5. Kattan, L.; Tay, R.; Acharjee, S. Managing Speed at School and Playground Zones. Accid. Anal. Prev. 2011, 43, 1887–1891. [Google Scholar] [CrossRef] [Scilit] [PubMed]
  6. Federal Highway Administration (FHWA). Speed Safety Camera Program and Planning Operations Guide: An Overview; U.S. Department of Transportation: Washington, DC, USA, 2023. Available online: https://ops.fhwa.dot.gov/publications/fhwahop24063/fhwahop24063.pdf (accessed on 4 July 2026).
  7. Tefft, B. Impact Speed and a Pedestrian’s Risk of Severe Injury or Death. Accid. Anal. Prev. 2013, 50, 871–878. [Google Scholar] [CrossRef] [Scilit] [PubMed]
  8. Quistberg, D.A.; Thompson, L.L.; Curtin, J.; Rivara, F.P.; Ebel, B.E. Impact of Automated Photo Enforcement of Vehicle Speed in Schol Zones: Interrupted Time Series Analysis. Inj. Prev. 2019, 25, 400–406. [Google Scholar] [CrossRef] [Scilit] [PubMed]
  9. Governors Highway Safety Association. Speed & Red Light Cameras. Available online: https://www.ghsa.org/state-laws-issues/speed-red-light-cameras (accessed on 5 September 2025).
  10. Thomas, L.J.; Srinivasan, R.; Decina, L.E.; Staplin, L. Safety Effects of Automated Speed Enforcement Programs: Critical Review of International Literature. Transp. Res. Rec. 2008, 2078, 117–126. [Google Scholar] [CrossRef] [Scilit]
  11. Audit Office of New South Wales. Improving Road Safety: Speed Cameras. Performance Audit, Roads and Traffic Authority. 2011. Available online: https://www.parliament.nsw.gov.au/tp/files/59778/speed_cameras.pdf (accessed on 27 October 2025).
  12. National Highway Traffic Safety Administration (NHTSA). Speed Safety Camera Enforcement. Available online: https://www.nhtsa.gov/book/countermeasures-that-work/speeding-and-speed-management/countermeasures/enforcement/speed (accessed on 26 June 2026).
  13. Gao, J.; Yang, D.; Xu, C.; Ozbay, K.; Sharma, S. Assessing the impact of fixed speed cameras on speeding behavior and crashes: A longitudinal study in New York City. Transp. Res. Interdiscip. Perspect. 2025, 30, 101373. [Google Scholar] [CrossRef] [Scilit]
  14. Dissanayake, S.; Bhavsar, P.; Gunathilaka, S. Effectiveness of Automated Speed Enforcement in School Zones and Guidance for Continuous Usage in Georgia. 2026. Available online: https://rosap.ntl.bts.gov (accessed on 4 July 2026).
  15. Gunathilaka, S.; Dissanayake, S.; Bhavsar, P. Survey-Based Evaluation of Public Perceptions of Automated Speed Enforcement. Sustainability 2026, 18, 4821. [Google Scholar] [CrossRef] [Scilit]
  16. Colorado Department of Transportation. Safe Routes to School Program. Available online: https://www.codot.gov/programs/bikeped/saferoutes (accessed on 5 September 2025).
  17. Rahman, M.M.; Strawderman, L. The Effect of Sign Saturation on Driver Speed Limit Compliance in School Zones. Proc. Hum. Factors Ergon. Soc. Annu. Meet. 2016, 59, 1612–1615. [Google Scholar] [CrossRef] [Scilit]
  18. City of Alpharetta GA. Speed Zone Cam Violations. Available online: https://www.alpharetta.ga.us/393/Speed-Zone-Cam-Violations (accessed on 5 September 2025).
  19. Ellison, A.B.; Greaves, S.; Daniels, R. Capturing Speeding Behaviour in School Zones Using GPS Technology. Road Transp. Res. 2013, 22, 30–42. [Google Scholar]
  20. Warsh, J.; Rothman, L.; Slater, M.; Steverango, C.; Howard, A. Are School Zones Effective? An Examination of Motor Vehicle versus Child Pedestrian Crashes near Schools. Inj. Prev. 2009, 15, 226–229. [Google Scholar] [CrossRef] [Scilit] [PubMed]
  21. Hu, W.; McCartt, A.T. Effects of Automated Speed Enforcement in Montgomery County, Maryland, on Vehicle Speeds, Public Opinion, and Crashes. Traffic Inj. Prev. 2016, 17, 53–58. [Google Scholar] [CrossRef] [Scilit] [PubMed]
  22. Eun, S.J. Effects of tougher school zone laws on road traffic safety in school zones for children in South Korea. J. Transp. Health 2023, 32, 101687. [Google Scholar] [CrossRef] [Scilit]
  23. Shaheen, S.; Rodier, C.J.; Cavanagh, E. Automated Speed Enforcement in the U.S.: A Review of the Literature on Benefits and Barriers to Implementation. Inst. Transp. Stud. Univ. Calif. Davis. 2007. Available online: https://escholarship.org/uc/item/41k1k365 (accessed on 4 July 2026).
  24. Delbosc, A.; Muir, C.; Ralph, K.; Barajas, J.M.; Johnson-Rodriguez, A. Do perceptions of speeding act as a barrier to automated speed enforcement in the United States? Transp. Res. Part F Traffic Psychol. Behav. 2025, 114, 1042–1052. [Google Scholar] [CrossRef] [Scilit]
  25. Farmer, C.M. Automated Traffic Enforcement: Responding to the Critics. J. Traffic Transp. Eng. 2017, 5, 1–7. [Google Scholar] [CrossRef] [Scilit]
  26. Graham, D.J.; Naik, C.; McCoy, E.J.; Li, H. Do speed cameras reduce road traffic collisions? PLoS ONE 2019, 14, e0221267. [Google Scholar] [CrossRef] [Scilit] [PubMed]
  27. Peterson, C.; Douma, F.; Morris, N. Addressing Key Concerns Regarding Automated Speed Enforcement via Interactive Survey. Transp. Res. Rec. 2017, 2660, 66–73. [Google Scholar] [CrossRef] [Scilit]
  28. Ralph, K.; Barajas, J.M.; Johnson-Rodriguez, A.; Delbosc, A.; Muir, C. Can a Racial Justice Frame Help Overcome Opposition to Automated Traffic Enforcement? Transp. Res. Interdiscip. Perspect. 2022, 14, 100594. [Google Scholar] [CrossRef] [Scilit]
  29. Li, Y.; Kim, A.M.; El-Basyouny, K.; Li, R. Using GIS to interpret automated speed enforcement guidelines and guide deployment decisions in mobile photo enforcement programs. Transp. Res. Part A Policy Pract. 2016, 86, 141–158. [Google Scholar] [CrossRef] [Scilit]
  30. Stagoff-Belfort, A.; Ben-Menachem, J.; Beck, B. Can speed cameras make streets safer? Quasi-experimental evidence from New York City. Proc. Natl. Acad. Sci. USA 2025, 122, e2520328122. [Google Scholar] [CrossRef] [Scilit] [PubMed]
  31. Guerra, E.; Puchalsky, C.; Kovalova, N.; Hu, Y.; Si, Q.; Tan, J.; Zhao, G. Evaluating the Effectiveness of Speed Cameras on Philadelphia’s Roosevelt Boulevard. Transp. Res. Rec. 2024, 2678, 452–461. [Google Scholar] [CrossRef] [Scilit]
  32. Tilahun, N. Safety Impact of Automated Speed Camera Enforcement: Empirical Findings Based on Chicago’s Speed Cameras. Transp. Res. Rec. 2023, 2, 667. [Google Scholar] [CrossRef] [Scilit]
  33. Abdelhalim, A.; Bailey, L.; Dalphy, E.; Raboy, K. Data Enforced: An Exploratory Impact Analysis of Automated Speed Enforcement in the District of Columbia. In 2021 IEEE International Intelligent Transportation Systems Conference (ITSC); IEEE: Indianapolis, IN, USA, 2021; pp. 2478–2483. [Google Scholar] [CrossRef] [Scilit]
  34. Chen, G.; Meckle, W.; Wilson, J. Speed and safety effect of photo radar enforcement on a highway corridor in British Columbia. Accid. Anal. Prev. 2002, 34, 129–138. [Google Scholar] [CrossRef] [Scilit] [PubMed]
  35. Mountain, L.J.; Hirst, W.M.; Maher, M.J. Costing lives or saving lives: A detailed evaluation of the impact of speed cameras. Traffic Eng. Control 2004, 45, 280–287. [Google Scholar]
  36. Goldenbeld, C.; Schagen, I.V. The effects of speed enforcement with mobile radar on speed and accidents. An evaluation study on rural roads in the Dutch province Friesland. Accid. Anal. Prev. 2005, 37, 1135–1144. [Google Scholar] [CrossRef] [Scilit] [PubMed]
  37. Christie, S.M.; Lyons, R.A.; Dunstan, F.D.; Jones, S.J. Are mobile speed cameras effective? A controlled before and after study. Inj. Prev. J. Int. Soc. Child Adolesc. Inj. Prev. 2003, 9, 302–306. [Google Scholar] [CrossRef] [Scilit] [PubMed]
  38. Georgia General Assembly. HB 978, 2017–2018 Regular Session, 2018. Available online: https://www.legis.ga.gov/legislation/53114 (accessed on 29 August 2025).
  39. Federal Highway Administration (FHWA). Highway Safety Manual. Available online: https://highways.dot.gov/safety/data-analysis-tools/highway-safety-manual (accessed on 5 September 2025).
  40. Georgia Department of Transportation. Chapter 672-20. Permitting Automated Enforcement Safety Devices in School Zones. Available online: https://www.dot.ga.gov/PartnerSmart/Documents/GDOT%20RULES%20FOR%20THE%20PERMITTING%20AUTOMATED%20TRAFFIC%20ENFORCEMENT.pdf (accessed on 26 June 2026).
Figure 1. All schools in Georgia equipped with ASE as of January 2024.
Safety 12 00092 g001
Table 2. Before-and-after durations considered in the study.
Duration in YearsNumber
On-System Off-System
1 < duration ≤ 23332
2 < duration ≤ 42267
Total schools5599
Table 3. Observed crashes during before-and-after periods at treated sites.
ParameterTotalPDOFatal & Injury
On-System Treated Schools—All Crashes
Crashes (B/A)945/624638/371307/253
Average crash reduction per site5.84.91.0
On-System Treated Schools—Speed-Induced Crashes
Crashes (B/A)26/1916/1010/9
Average crash reduction per site0.10.10.02
Off-System Treated Schools—All Crashes
Crashes (B/A)1037/577772/387265/190
Average crash reduction per site4.63.80.8
Off-System Treated Schools—Speed-Induced Crashes
Crashes (B/A)38/1926/1212/7
Average crash reduction per site0.20.140.05
Table 4. Observed crashes during before-and-after periods at control sites.
ParameterTotalPDOFatal & Injury
On-System Control Schools—All Crashes
Crashes (B/A)1323/1232951/896372/336
Average crash reduction per site1.71.00.7
On-System Control Schools—Speed-Induced Crashes
Crashes (B/A)20/2112/108/11
Average crash reduction per site−0.020.04−0.05
Off-System Control Schools—All Crashes
Crashes (B/A)1303/859965/615338/244
Average crash reduction per site4.53.50.9
Off-System Control Schools—Speed-Induced Crashes
Crashes (B/A)32/1721/1011/7
Average crash reduction per site0.20.10.04
Table 5. Factors considered in the HSM model calibration.
Road ClassificationAdjustment Factors
Rural two-way two-lane roadsLane width, shoulder type and width, horizontal curves, Horizontal curves—superelevation, grades, driveway density, centerline rumble strips, passing lanes, two-way left-turning lanes, roadside design, lighting, ASE
Rural divided multilane highwaysLane width, shoulder type and width, median width, lighting, ASE
Rural undivided multilane highwaysLane width, shoulder type and width, side slope, lighting, ASE
Urban and suburban arterialsOn-street parking, roadside fixed objects, median width, lighting, ASE
Table 6. CMFs estimated with the EB method.
School CategoryEstimateTotal Crashes PDO Fatal & Injury
All Crashes
On-SystemCrash Modification Factor (CMF)0.95 0.96 0.98
Variance0.0020.0040.009
Statistical Significance (SS)>2.0>2.0>2.0
Off-System CMF0.900.900.93
Variance0.0020.0030.009
SS>2.0>1.7<1.7
Speed-Induced Crashes
On-SystemCMF0.34 0.26 0.29
Variance0.0070.0070.01
SS>2.0>2.0>2.0
Off-System CMF0.270.23 0.17
Variance0.0040.0050.004
SS>2.0>2.0>2.0
Table 7. CMFs estimated with the comparison group method.
School CategoryEstimateTotal Crashes PDO Fatal & Injury
All Crashes
On-SystemCMF0.900.900.97
SS>2.0>1.7<1.7
Off-SystemCMF0.910.900.99
SS>2.0>2.0<1.7
Speed-Induced Crashes
On-SystemCMF0.650.670.18
SS<1.7<1.7>2.0
Off-SystemCMF0.460.730.62
SS>2.0<1.7<1.7
Table 8. Recommended CMFs for future applications.
CategoryOn-SystemOff-System
CMFs for all crashes0.900.91
CMFs for speed-induced total crashes0.650.46
Disclaimer/Publisher’s Note: The statements, opinions and data contained in all publications are solely those of the individual author(s) and contributor(s) and not of MDPI and/or the editor(s). MDPI and/or the editor(s) disclaim responsibility for any injury to people or property resulting from any ideas, methods, instructions or products referred to in the content.