


Abstract
Yeast infections are a major concern in clinical settings, and several known species are recognized for their antifungal drug resistance, especially the multidrug-resistant pathogen Candidozyma auris. It is of increasing importance to identify pathogenic yeasts to improve treatment outcomes. We present a technique to identify these yeast pathogens using machine learning with a neural network (DenseNet-201) on images obtained from laser light scattering and conventional microscopy. We performed the binary classification of seven species of pathogenic yeast based on their light scattering patterns and their microscopy images. We achieved an average classification accuracy of 95.3% for light scattering patterns and 96.6% for microscopy images of the yeast cells. We also demonstrate high classification accuracy when isolating Candidozyma auris images from all other species combined, at an average of 95.1% for light scattering patterns and 96.7% for microscopy images. The high average classification accuracies suggest that both light scattering and microscopy image data can be combined with machine learning models to classify pathogenic yeasts.
1. Introduction
Pathogenic yeasts are important contributors to invasive clinical infections and can be difficult to identify and treat. Invasive fungal infections affect over 2 million individuals worldwide, killing about 1.5 million people each year [1]. Unlike infectious bacteria and viruses, many pathogenic yeasts are part of the human microbiota and do not endanger human health until the individual becomes ill through other means, such as severe or chronic disease, injury or surgery, or while receiving immune-suppressing treatment [2]. Furthermore, many yeasts can survive in harsh environments and can easily spread from one location to another, leading to challenges in eliminating them in clinical settings. The use and misuse of antimicrobial drugs globally have raised concerns about pathogens developing drug, multidrug, or pandrug resistance [3], making it even more challenging to treat invasive fungal infections.
Candida species are the most common genus causing superficial and invasive fungal infections. The most common five Candida species that account for 90% of Candida infections worldwide are: Candida albicans, Nakaseomyces glabrata (previously Candida glabrata), Pichia kudriavzevii (previously Candida krusei), Candida parapsilosis, and Candida tropicalis [4]. Recently, Candidozyma auris (previously Candida auris), a multidrug resistant yeast, has emerged as an important pathogen with an alarming mortality rate up to 72% among candidemia patients [5,6]. Identifying this species is critical to deliver accurate and timely treatment to patients, as it has often been misidentified as Candidozyma haemuli (previously Candida haemulonii) and has the potential to cause hospital outbreaks [7,8]. However, current diagnostic methods to identify these yeast pathogens have long turnaround times.
Identifying fungal pathogens relies on conventional culture-based methods, matrix assisted laser desorption and ionization—time-of-flight mass spectrometry (MALDI TOF MS) and/or DNA sequencing [5,9]. However, most of these methods require sophisticated instrumentation and are lengthy processes that require days to complete. Furthermore, the lack of dedicated analysis/diagnostic laboratories within the hospital or clinical settings can cause patients to miss optimal treatment windows. Therefore, it is crucial to identify yeasts accurately within short periods of time using robust and accessible tools.
Many strategies are under development to investigate and identify pathogenic yeasts. Non-culture-based methods exist to identify systemic yeast infections, which cannot identify the infecting species. Furthermore, due to the low sensitivity and specificity of these tests they cannot be incorporated into routine diagnostics. Few studies have improved the molecular-based detection methods using variations of polymerase-chain reaction, but the false negative results, expensive nature, and multiple steps required restrict their use in diagnostics [10,11]. Genome sequencing methods exist to identify these fungi and investigate their virulence factors, but they are expensive and time-consuming [12,13]. Selective enrichment broths or agar media have also been investigated for the targeted screening of yeast species prior to other analyses [14,15].
Advancements in computing capabilities have enabled the development of machine learning (ML) techniques to conduct research in biological and medical fields [16,17,18]. Machine learning techniques have also applied to study pathogenic yeast species based on emerging diagnostic methods including microscopy images [19] and Raman spectroscopy [20]. Many of these diagnostic methods generate small-batch datasets which can be analyzed effectively through transfer learning [21]. In transfer learning, existing convolutional neural networks (CNNs) are trained on a dataset, typically a very large dataset for better generic learning, and then these trained networks are applied to another dataset for a related task.
Angular laser light scattering (ALLS) is a label-free method for studying cells. The method is rapid and requires only relatively simple sample preparation procedures. This method can be implemented in several different ways, such as using a sample cuvette [22,23] or microfluidics [24], and may be integrated in flow cytometer systems to take advantage of their existing complex functionality. While conventional microscopy typically observes cellular information on a single focal plane, light scattering-based approaches provide three-dimensional cellular information, such as the organelle distribution and membrane surface roughness [25,26]. This information is based on the differences in refractive index between different cellular components, which produce irregular interference patterns from the resulting scattered light. As such, irregular ALLS patterns, such as those deviating from alternating bands that are characteristic of homogeneous spheres, can indicate structural complexity of the cell. Previous studies [22,23,24,25,26,27,28] have used ALLS patterns to analyze and identify various cells (hematopoietic stem cells, Jurkat cells, THP-1 cells, SH-SY5Y cells, ovarian cancer cells, and cervical cancer cells). Machine learning techniques were also applied in several of these studies [22,28]. Compared to conventional microscopy, ALLS data is obtained without the need for optical focusing, resulting in fewer opto-mechanical components and less maneuvering of samples and their preparation, leading to low-cost robust equipment that has the potential for point-of-care implementation.
This paper presents a first study of using ALLS to investigate pathogenic yeasts, and the first systematic comparison of ALLS classification to conventional microscopy. Due to the alarming mortality rate of the multidrug-resistant C. auris, it is important to develop rapid detection tools for its presence in a sample. One key objective of our study is the detection of C. auris from other pathogenic yeasts in a shuffled image dataset. We propose a novel ML-based technique for the binary classification of pathogenic yeast species based on their light scattering patterns and microscopy images. Machine learning methods for machine vision typically require training a CNN to translate image data into a specific class. This training requires large datasets, possibly in the scale of millions of images; classification tasks with small datasets (<2000 images) may lead to inaccurate results. Therefore, in this study we employed transfer learning methods. Furthermore, we employed binary classification, which is also capable of achieving good performance on small datasets and is suitable for our goal of isolating C. auris from the other yeast species. We challenged our method by applying it to light scattering patterns of pathogenic yeast species that are morphologically similar to each other. We achieved a high binary classification performance of cell species at high cell concentrations for improved data throughput, and successfully classified C. auris from other species. In general, we find that ML models trained in light scattering or microscopy image data can be used to quickly and accurately identify pathogenic yeasts.
2. Materials and Methods
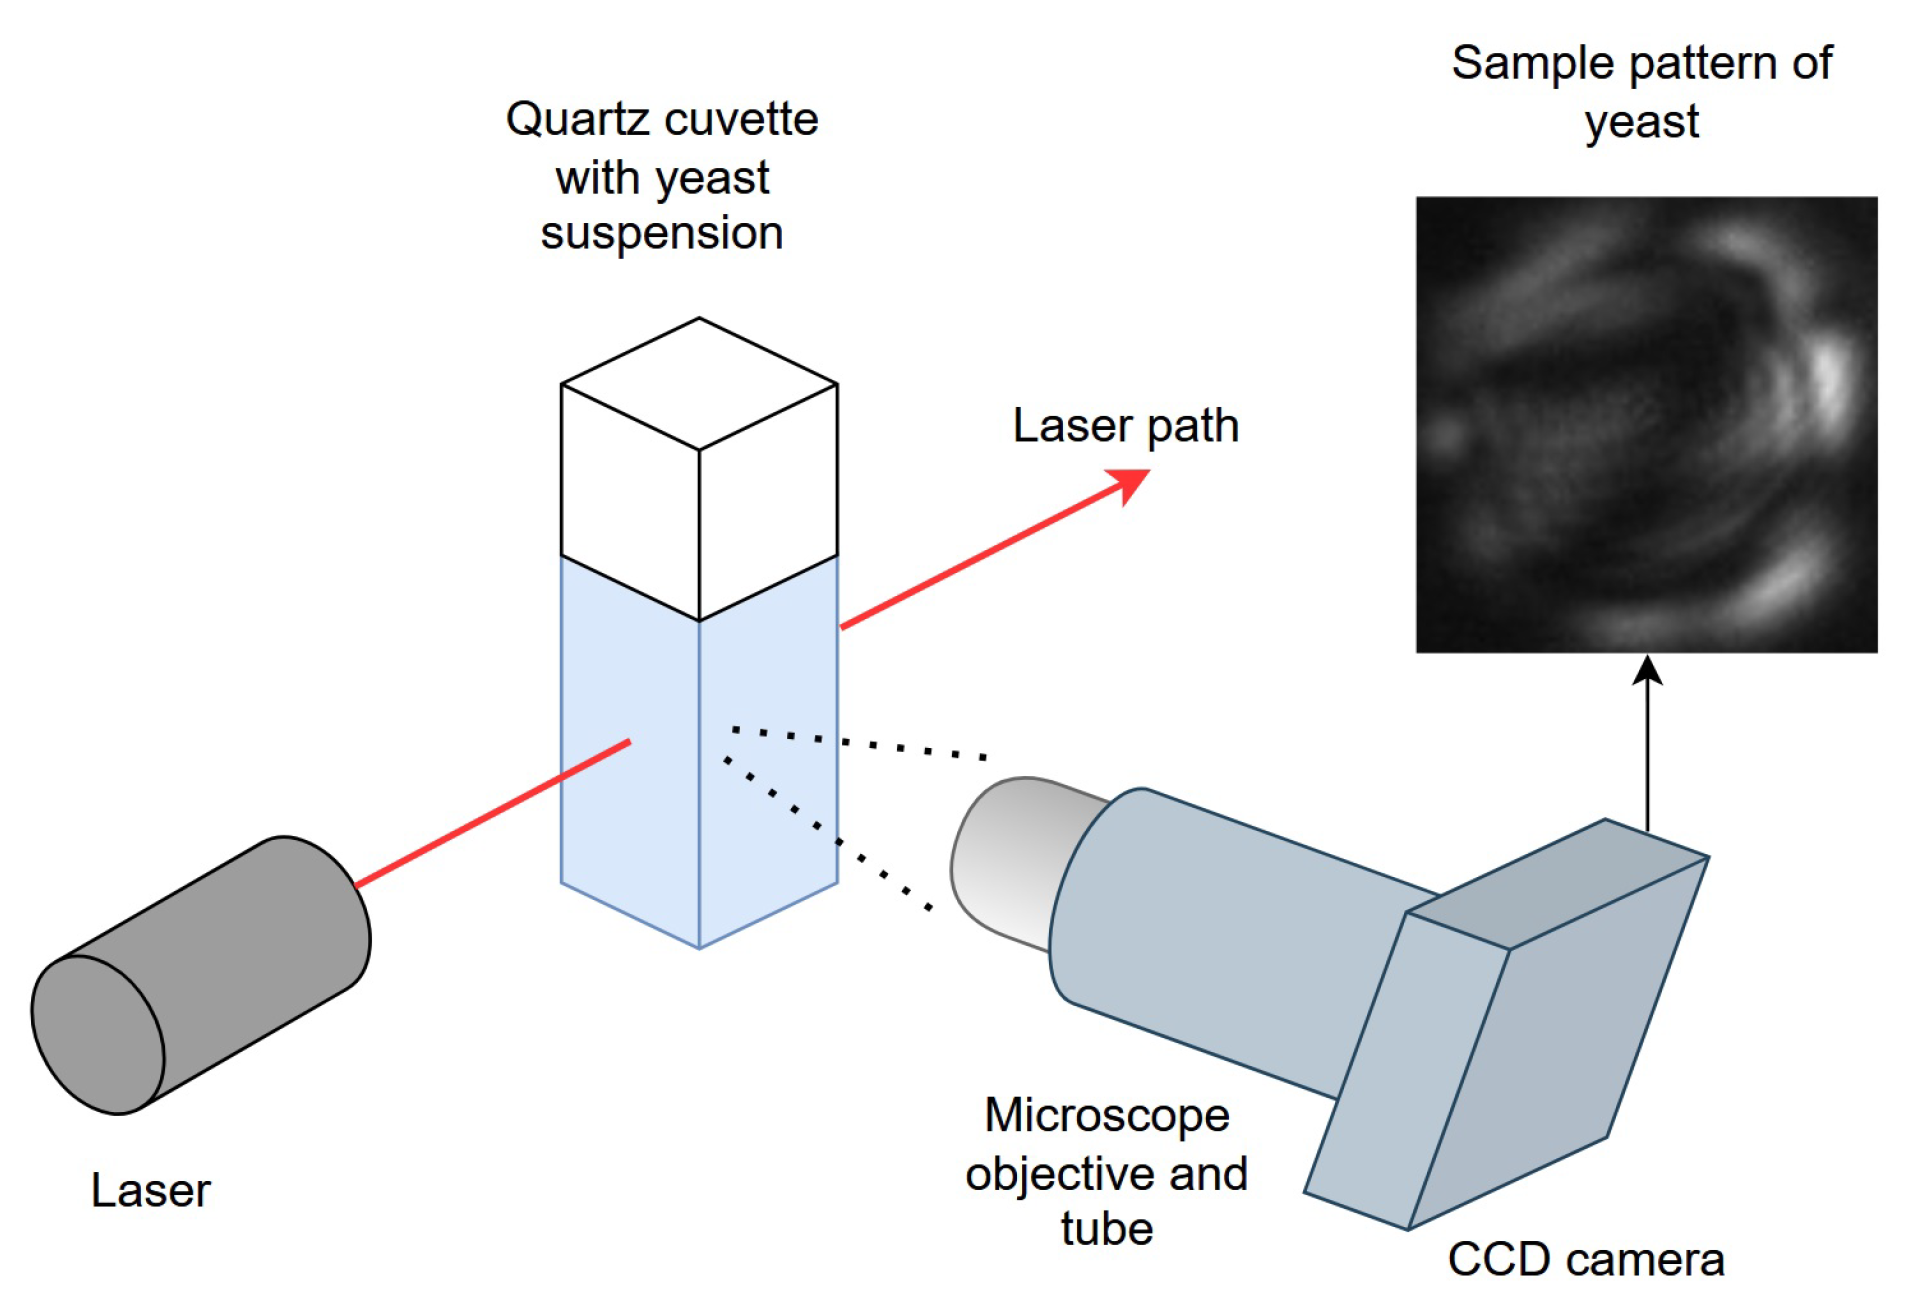
The light scattering setup consists of a helium-neon laser (1 mW nominal power, Melles Griot), which was focused to 0.6 mm diameter to visualize light scattering events. A quartz macro-cuvette with 3 mL capacity was used to hold the yeast suspension. A charge-coupled device (CCD) monochrome camera (CMLN-13S2M-CS, Point Grey Research, Richmond Canada) equipped with a microscope objective (10× magnification, 0.25 NA) and 20 cm lens tube was placed at 90° with respect to the laser path to collect light scattering events. All data collection was carried out in the dark. The working distance of the objective was adjusted until light scattering events are defocused to fill the height of the detector (Figure 1). The half-cone angle of the microscope objective centered at 90° from the laser direction was approximately 11°, corresponding to an angular range of 79°–101°.
Figure 1.
Schematic diagram of the benchtop experimental setup for light scattering pattern collection.
A procedure reported previously [23] was followed to confirm the experimental setup was working properly. Briefly, polystyrene microbeads with 6 μm mean diameter (Polysciences, Cat. No. 07312, Warrington, PA, USA) diluted to 3000 beads/mL were placed in the macro-cuvette to visualize their light scattering pattern as single events. The light scattering pattern image, which consists of light and dark fringes, was observed from the experimental setup. It was compared to an image from Mie scattering simulation of a spherical particle with 6 μm diameter for an angular range of 79°–101° and with refractive index = 1.5875. The simulated image consists of 5 light fringes agreeing well with the experimental observation indicating the setup is working properly.
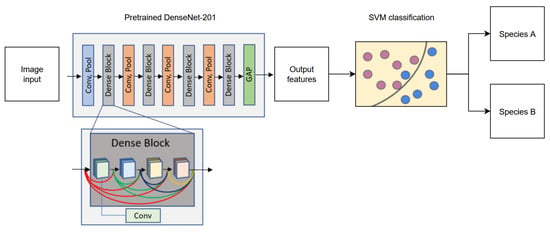
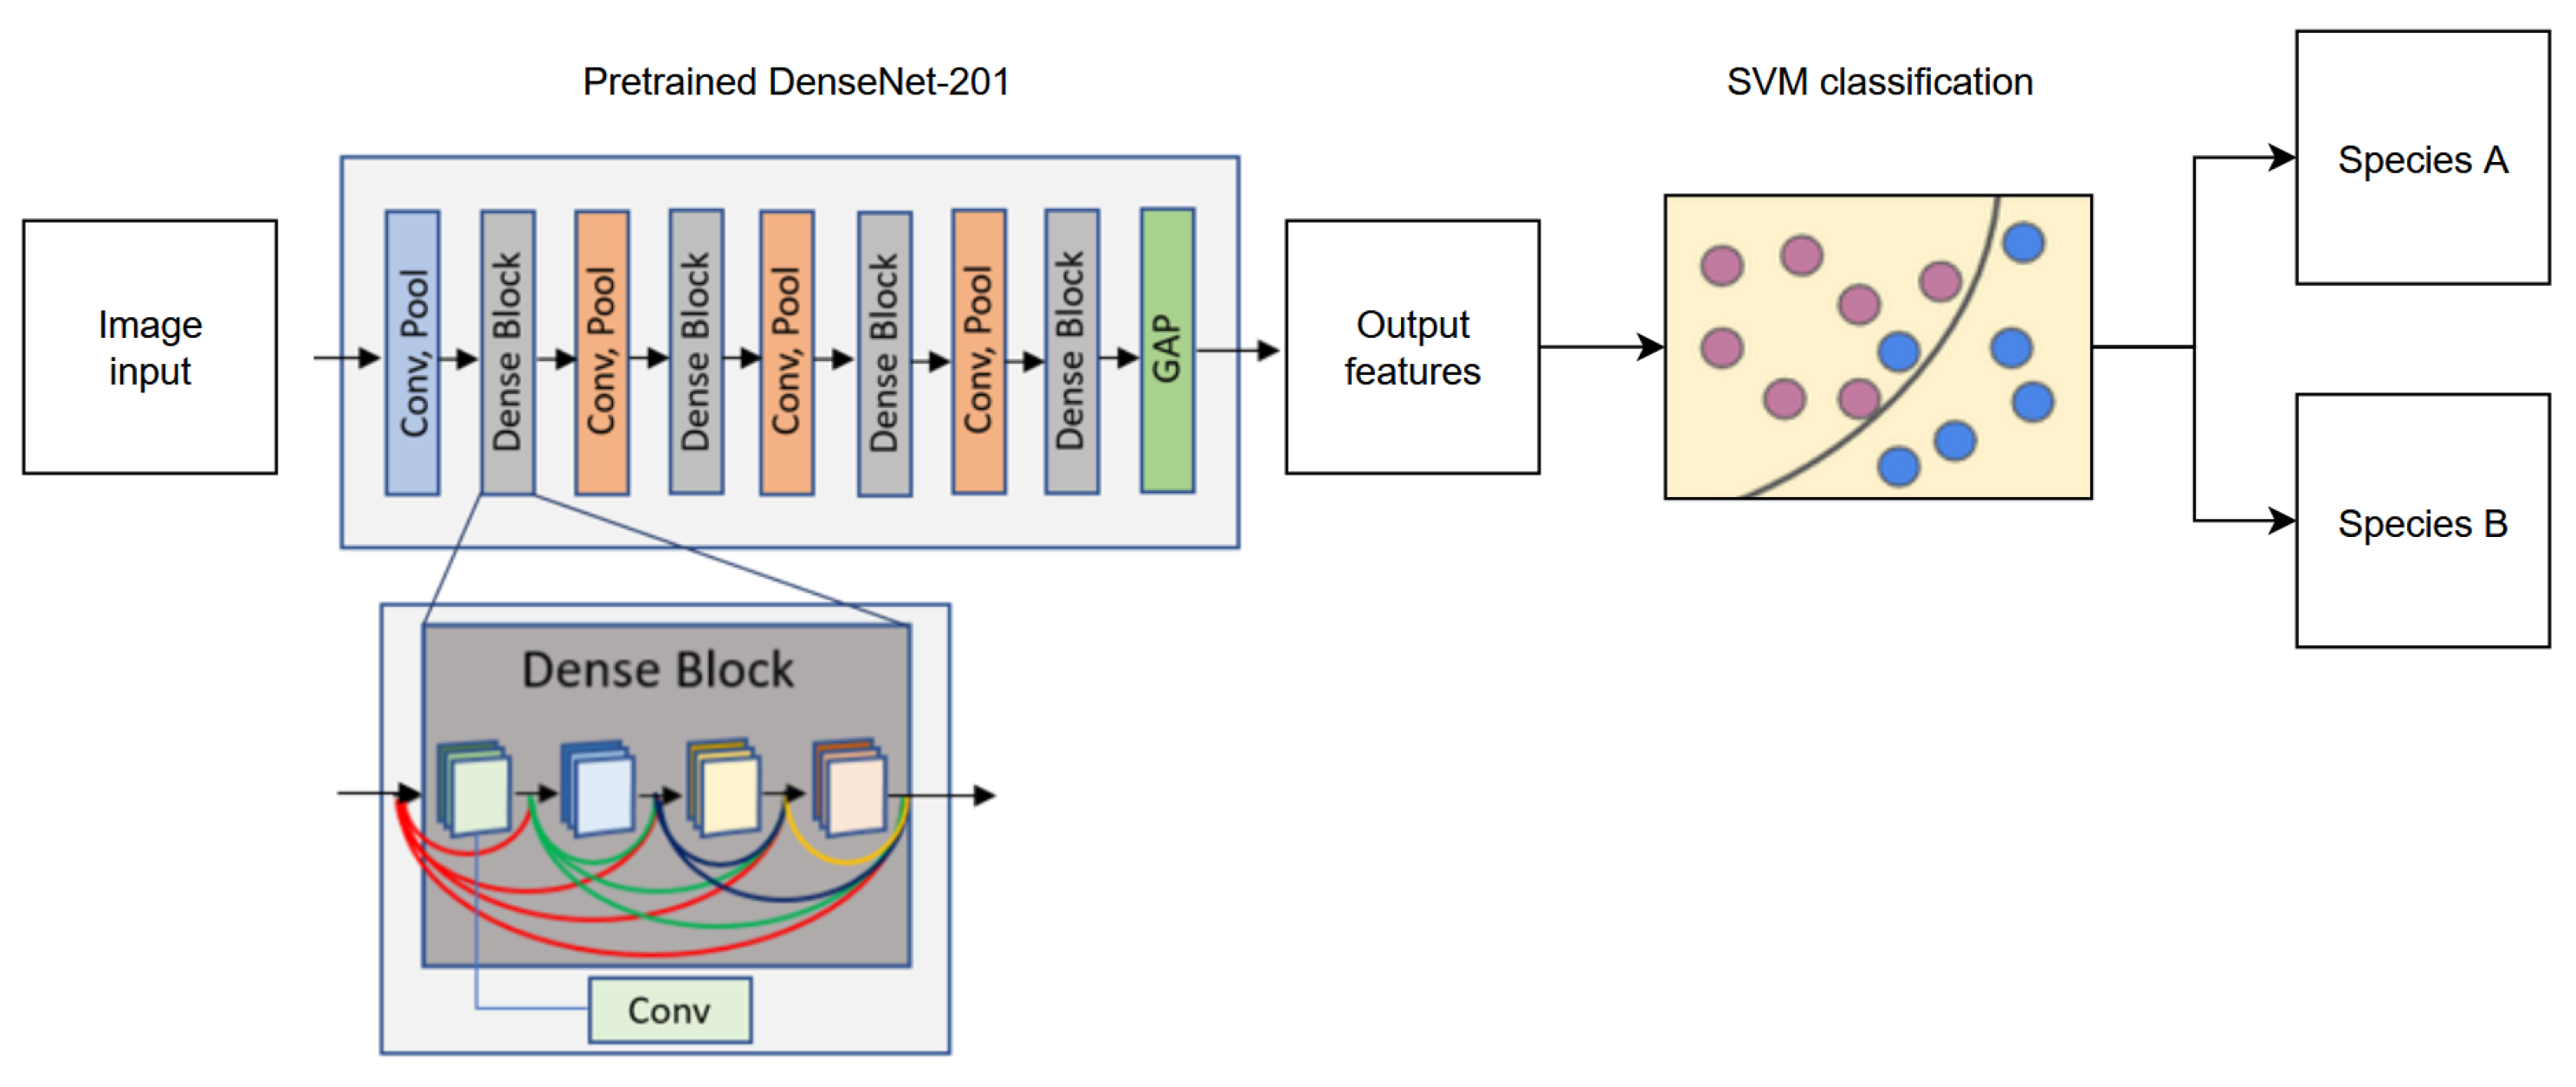
Schematic representation of our proposed transfer learning method is provided in Figure 2. From each image, 1920 features were extracted using a pre-trained DenseNet-201 [29] model implemented in PyTorch 1.3.1. In DenseNet-201, each Dense Block consists of multiple layers where the inputs are outputs from every preceding layer in that block, thus improving feature reuse and mitigating the vanishing gradient problem, the latter of which is particularly important, as the images of the yeast cells can appear very similar. Each Dense Block is preceded by a convolution and a pooling layer. It is worthwhile to mention that fine-tuning the fully connected layer in this model did not achieve satisfactory performance after training for 20 epochs on a preliminary task with the same dataset. After global average pooling (GAP), the fully connected layer is removed to record the resulting 1920 features from each image for a species. DenseNet-201 is frequently used for classification tasks in biology and medicine [30,31,32,33]. This model had already been trained on ImageNet-1K data for general purpose usage, and no further modifications were made to the neural network. For binary classification, features from any two species were then passed to a radial-basis function (RBF) kernel support vector machine (SVM) with 5-fold cross-validation and parameter C = 1 [34]. This parameter modulates between decision plane margin size and training error, where a small C allows for large margins and a large C limits the SVM to fewer misclassifications. C was selected based on good performance when employed in our previous work [22]. Compared to a linear-kernel SVM [35], the RBF SVM maps features into high-dimensional space and is particularly useful when the relationship between the label and features is nonlinear or unknown as was the case for our study. The SVM was trained to find a hyperplane that best separates the features from the two classes. Features from images in the testing group for the two species were then passed to the SVM to separate them using the hyperplane.
Figure 2.
Schematic diagram of the transfer learning algorithm using a pre-trained CNN (DenseNet-201) and an SVM to perform the binary classification of pathogenic yeast species. Within a dense block, each Conv layer receives features from all preceding layers in the same block, from left to right. Feature propagation is arbitrarily colored to represent origin from a different layer in the same block. Pink and blue circles represent arbitrary features of species A and species B mapped in feature space by the SVM.
All images (light scattering or microscopic) were resized to 224 × 224 pixels and normalized to [0, 1] to ensure consistent quality before the ML method was applied. To preserve directional information of the light scattering patterns and for equality, data augmentation was not used in all experiments. The algorithm was evaluated on a machine with Ryzen 5 7600X 6-Core Processor, 4.70 GHz CPU (Advanced Micro Devices, Santa Clara, CA, USA), GeForce RTX 4060 GPU (Nvidia, Santa Clara, CA, USA), and 32 GB RAM.
The protocols for culture of pathogenic yeast were described previously [19]. Briefly, four species of yeast (C. albicans, C. auris, N. glabrata, and C. haemuli) from clinical samples were obtained from the Alberta Precision Laboratories—Public Health Laboratory and three yeast species [C. parapsilosis (ATCC 22019), P. kudriavzevii (ATCC 6258), and C. tropicalis (ATCC 750)] were obtained from American Type Culture Collection (ATCC). All yeast isolates were stored in 25% glycerol at −80 °C. Before each experiment, yeast cells were cultured from frozen stock onto Sabouraud Dextrose Agar (SDA) plates (Merck KGaA, Darmstadt, Germany) and incubated at 35 °C for 48 h and further sub-cultured onto new SDA plates at 35 °C for 24 h before light scattering and microscopy image data collection. The cells were then harvested into normal saline (0.9%) from the culture dishes, and the optical density (0.09–0.13) was measured at 530 nm in a spectrophotometer (Voriskan Lux, Thermofisher Scientific, Singapore VL0000D0). This corresponds to approximately 1–5 × 10⁶ cells/mL. Furthermore, cell samples were diluted in phosphate buffered saline until 3000 cells/mL were obtained. During light scattering pattern collection, samples were mixed with a micropipette at 10 min intervals to avoid cells settling.
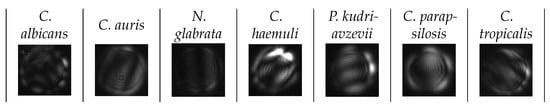
A total of 1532 light scattering patterns across 7 species of pathogenic yeasts were obtained from the light scattering classification experiment (Table 1). Light scattering patterns were obtained from captured video frames above the background intensity threshold (typical value at 18 on a scale of 0–255) and cropped manually to remove as much background as possible around the circular pattern boundary to remove background artifacts (Figure 3). Patterns that were too small (<60 × 60 pixels) or too large (>600 × 600 pixels) were removed, as they were too near or too far from the detector to show a discernible pattern.
Table 1.
Number of images of light scattering patterns collected from each species of pathogenic yeast.
Figure 3.
Light scattering patterns collected from the 7 species of pathogenic yeast. Typical image size is 250 × 250–500 × 600 pixels.
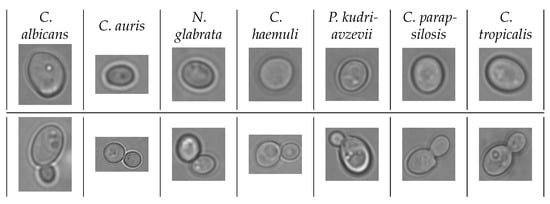
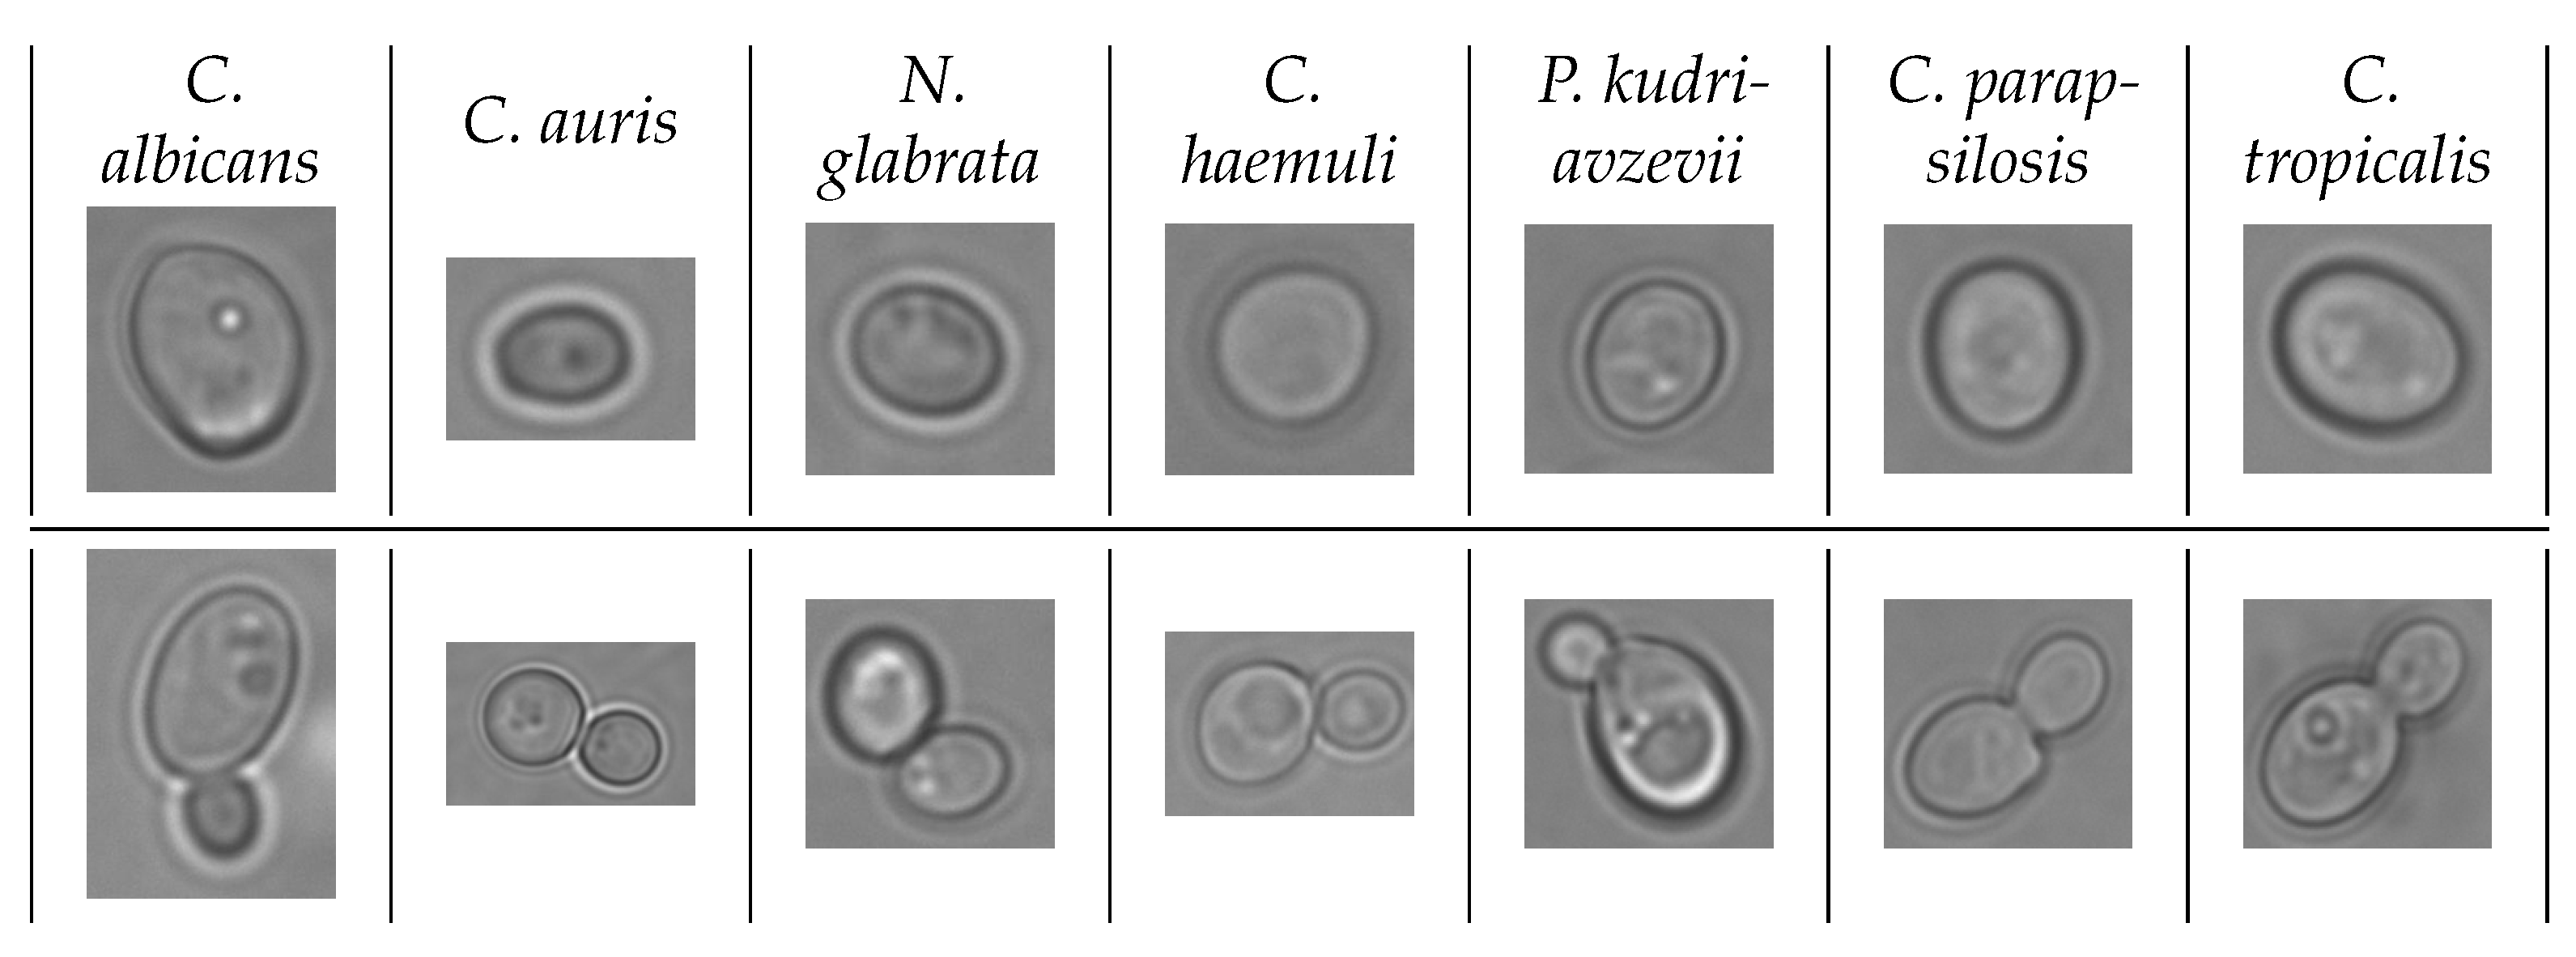
The yeast cell suspension to obtain microscopy images was prepared similarly to that of the light scattering experiments. After measuring the cells in the spectrophotometer, 40 μL of the suspension was placed on a glass slide (Fisher Brand, Cat. No. 22034486, Pittsburg, PA, USA) and covered with a coverslip (Fisher Brand, Cat. No. S17525C, Pittsburg, PA, USA). Then, the microscopy images were collected in brightfield mode using EVOS M7000 (Invitrogen, Thermo Fisher Scientific, Waltham, MA, USA) at 100× (oil immersion). A total of 100 whole images were obtained for each of the 7 yeast species. Then, a total of 1400 (200 for each species) microscopy images of single cells and 1400 microscopy images of budding cells across 7 species of pathogenic yeasts were cropped out from the whole images for the microscopy classification experiment (Table 2). Cropping was done around the boundary of the cells, reserving approximately 20 pixels on each side to avoid over-cropping due to defocusing of the lens. Representative microscopy images of single cells and budding cells from each of the seven yeast species are provided in Figure 4.
Table 2.
Number of single-cell microscopy images from each species of pathogenic yeast. Data obtained from [19,40].
Figure 4.
Microscopy images from 7 species of pathogenic yeast. Top row: single cells; bottom row: budding cells. Data obtained from [19,40]. Typical image size is 250 × 250–500 × 600 pixels.
3. Performance Evaluation
Prior to applying the proposed model, the light scattering and microscopy image datasets were verified by Gradient-weighted Class Activation Map (Grad-CAM) to generate heatmaps showing regions of interest for the ML model (Supplemental Materials Figures S1–S21) [41]. Visual inspection was used to ensure the regions of interest were located on light scattering patterns or microscopy images of yeast cells. For heatmaps of ALLS patterns, regions of high interest tended to be brighter than surrounding areas or had very distinct contrast, indicating significant structures in or on the cell, such as budding growth or large organelles like the nucleus. For microscopy images, heatmaps showed interest where clusters of organelles were distinctly visible. Furthermore, the heatmaps of microscopy images of budding yeast tended to highlight the budding site where the cells are attached, indicating the model’s recognition of the growth.
The proposed model was evaluated in three different ways. First, we evaluated the binary classification of all the laser scattered images. Then, we performed the binary classification on the microscopy images. Finally, we performed the binary classifications of C. auris versus all the non-C. auris light scattered images and conventional microscopy images. Here, C. auris was used as the focal species, as this pathogenic yeast species is of high interest due to its recent spread across the globe and multidrug-resistant nature. We report the performance of our ML models as classification accuracy (ACC), which is the ratio of total correct predictions (including true positives (TP) and true negatives (TN)) to total classification predictions.
3.1. Binary Classification–Laser Scattered Images
Binary classifications with 5-fold cross-validation were performed with 150 randomly selected images from each class. Every classification was performed between two classes, where images from the two classes were separated by the SVM decision hyperplane and the number of testing images correctly and incorrectly classified were recorded for performance evaluation. Each class was classified against every other class in iterative fashion (e.g., C. albicans versus C. auris, then C. albicans versus N. glabrata, and so on) resulting in six classifications for each class. However, classifications such as C. albicans vs. C. auris are the same as C. auris vs. C. albicans, so the total number of unique classifications was the number of combinations of two classes selected from seven classes, or .
For 5-fold cross-validation, the 150 images from each of the seven classes were divided into five non-overlapping subsets of 30 images each. For each fold, four out of five subsets were used for training the SVM decision plane, and the remaining subset was used for testing. The testing subset was changed for each of the five folds. The testing classification ACC of each classification was averaged after 5-fold cross-validation.
3.2. Binary Classification—Microscopy Images
For each species in the microscopy images, the images were also separated by type: single cell (SC), budding cell (BC), and combined. In the combined case, all SC and BC images of a single species were grouped together. Binary classification of seven species of yeast with 5-fold cross-validation was performed as described in Section 4.1 for all SC, BC, and combined cases.
3.3. Binary Classification—C. auris Versus Non-C. auris Species (Laser Scattered and Microscopy Images)
To perform the binary classification of a one-versus-all scenario for C. auris, the images of the other species (C. albicans, N. glabrata, C. haemuli, P. kudriavzevii, C. parapsilosis, and C. tropicalis) were assembled into one class and dubbed “Others”. Features for each image belonging to either class of C. auris or Others were extracted and classified as described in Section 3 and Section 4.1.
3.4. Evaluation Indicators
For light scattering and microscopy classification of each yeast species, only the accuracy is reported for brevity. For the C. auris versus non-C. auris case, we evaluated the performance based on the accuracy (ACC), sensitivity (SEN, also called the true-positive rate TPR), precision (PRE), specificity (SPE), area under the receiver operating characteristic (ROC) curve (AUC), and F1 score. These metrics are defined, using true positive (TP), true negative (TN), false positive (FP), and false negative (FN):
Here, x denotes the value of the false positive rate, defined as .
4. Results and Discussion
4.1. Light Scattering Images
We employed ML methods to classify images obtained from two different methods to differentiate clinically important yeast species. The binary classification accuracies of the seven pathogenic yeast species are shown in Table 3, and the calculated average ACC is 95.31%. ACC over 95% were found in 12 out of 21 unique binary classification cases and included all seven species tested, indicating that all species possess distinguishing light scattering features that can highly separate them from at least one other species. ACC over 90% were found in 18 out of 21 unique cases, suggesting the presence of distinct optical features that could exist for all species investigated.
Table 3.
ACC of binary classification of light scattering patterns of 7 pathogenic yeast species. Classifications between C. auris and other species are highlighted in green. Classifications between C. haemuli and other species are highlighted in blue. Classification between C. auris and C. haemuli is highlighted in darker green. Classifications between two identical species are highlighted in black.
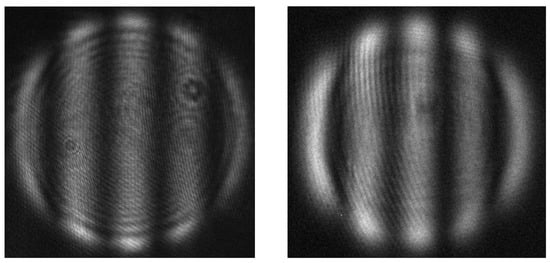
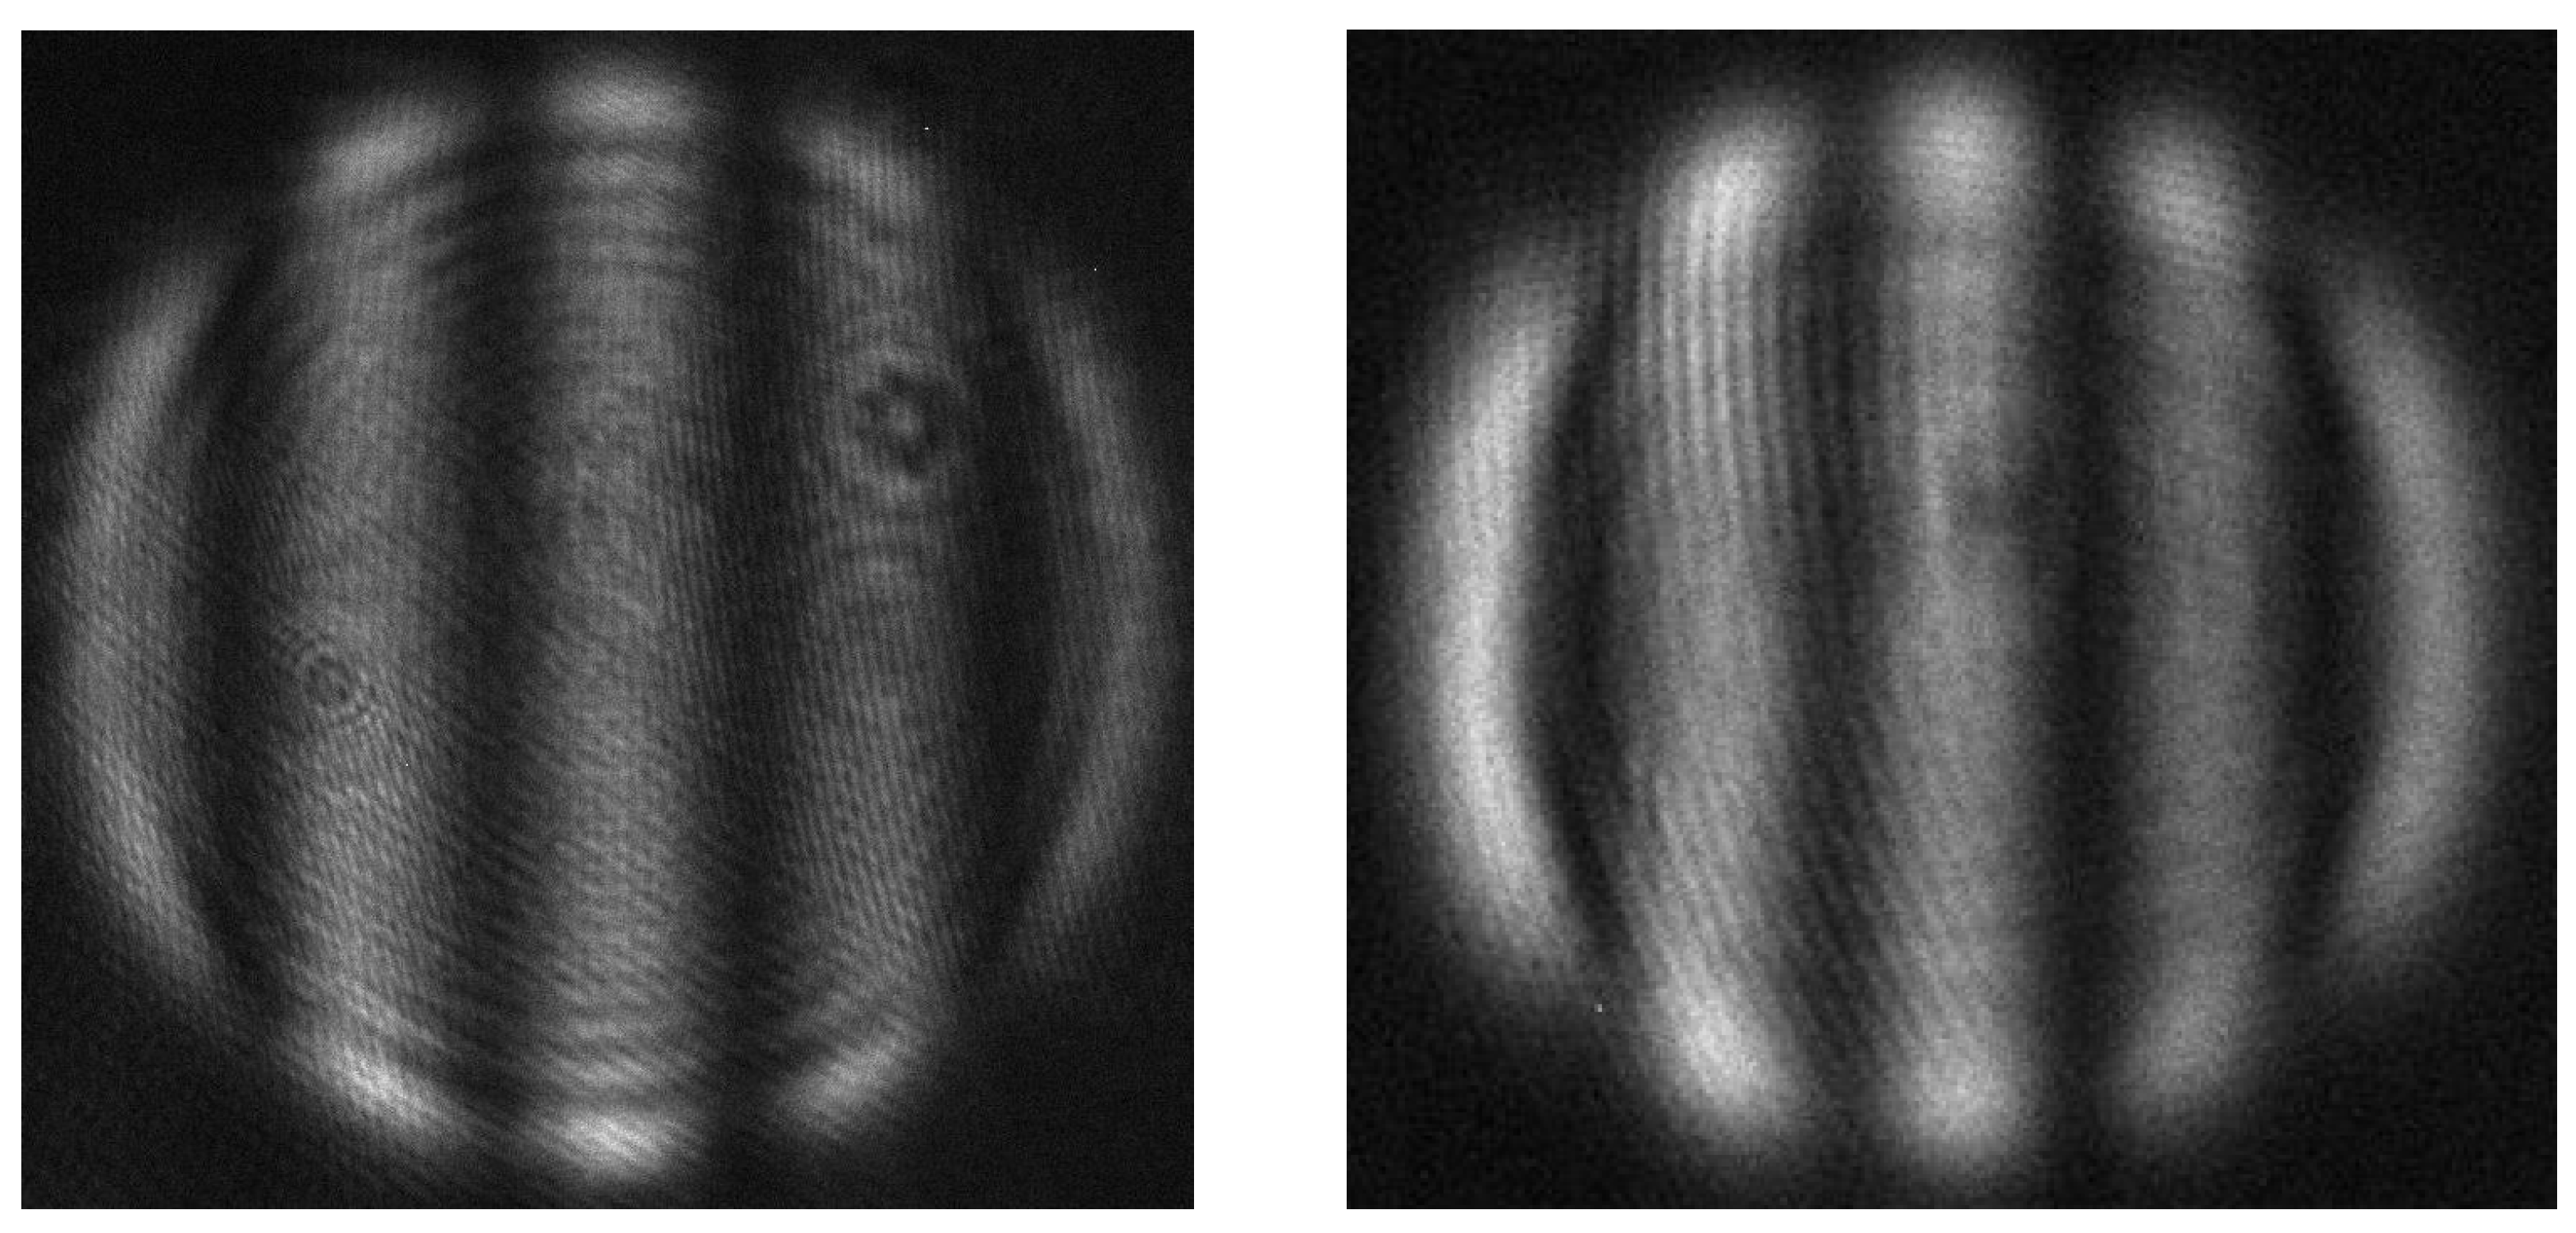
N. glabrata had the most cases of ACC greater than 95% at 5 out of 6, and 94.33% when classified against P. kudriavzevii. This shows that the light scattering patterns of N. glabrata were the most distinct out of all 7 species tested. C. auris had four out of six cases where ACC was higher than 95%, also suggesting that its light scattering patterns were highly distinguishable from most other species. The structural and optical properties of the yeast cells impact the resulting light scattering images. These properties include the cell size, cell shape, organelle distribution, and cell surface and cell wall structure, as well as the refractive index differences between the cellular components. N. glabrata was the only species that had straight, fringe patterns, which is indicative of a smooth, homogeneous sphere (Figure 5). Similar straight fringes were observed in a previous batch of data collected from N. glabrata as well, though the number of fringes were different, indicative of a different cell size (see Supplemental Materials Figure S22). In the current study, 54% of the N. glabrata images consisted of fringe patterns, which explain its high distinction from other species. This also suggests that N. glabrata had much higher tendency to grow into a morphology that optically resembled a homogeneous sphere, though further analysis of specific optical features is required to investigate this. The drastic difference in cell size of C. auris likely contributes to its high ACC when classified against C. albicans, N. glabrata (in addition to its spheroidicity), C. parapsilosis, and C. tropicalis. Cell size and shape differences may be more obvious when using light scattering, as C. auris also had ACC near 94% when classified against C. haemuli, in contrast to their phylogenetic similarity [7]. The same ACC was found when classifying C. auris vs. P. kudriavzevii, indicating the presence of optical features that may be useful for isolating this species from others.
Figure 5.
Comparison of an experimental light scattering pattern of polystyrene sphere (left) to a representative light scattering pattern of N. glabrata (right).
For all binary classifications, the lowest ACC was found when classifying C. parapsilosis from C. tropicalis (82.67%), indicating the highest degree of confusion between them among all species tested. This suggests similarity between the two species in terms of optical properties at the single-cell level that could lead to the overlap in the feature space, such as similar shape and internal structure. ACC of C. albicans versus C. haemuli and versus C. parapsilosis were also relatively low, at around 86% and 88%, respectively, which indicates a degree of confusion among these three species as well.
4.2. Microscopy Images
The ML-based binary classification technique was also applied to microscopy images for budding cells, single cells, and both combined (Table 4). The calculated average accuracies are 96.66%, 97.15% and 96.55% for single cells (SC), budding cells (BC), and combined, respectively. The results were significant, with p-values of the average accuracies all below 0.01 under the null hypothesis of an ACC of 50%. For the combined case, images of single and budding cells from each species were pooled together before feature extraction and classification for better comparability to the light scattering image performance. In 3 out of 21 unique classification cases, the difference between SC ACC and BC ACC was 5% or higher, suggesting that there is a benefit of investigating SC and BC of these cases separately. Out of 21 unique cases, 17 cases had SC ACC above 95%, 16 cases had BC ACC above 95%, and 16 had combined ACC 95% or above. Like the light scattering results, ACC at 95% or above included all species, indicating that they all possess visually distinct features for classification.
Table 4.
Accuracy of binary classification of microscopy images of 7 pathogenic yeast species. The cell entries are in X/Y/Z format to denote the accuracies for single cells/budding cells/single and budding combined, respectively. Classifications between C. auris and other species are highlighted in green. Classifications between C. haemuli and other species are highlighted in blue. Classification between C. auris and C. haemuli is highlighted in darker green. Classifications between two identical species are highlighted in black.
The lowest ACC from these classification pairs is between SC of C. parapsilosis and C. tropicalis, at 62.67%, indicating high confusion between these two species when observing only SC. This classification outcome is also the only one for microscopy images where the ACC is low, 12% above 50%, which is the threshold for ML random guessing, and further alludes to the similarity between the SC of these two species. Interestingly, when classifying only the BC case for C. parapsilosis and C. tropicalis, the ACC is 97.67%. This suggests that while the individual SCs may show similarities, once they begin to reproduce the two species are immediately discernible. This may be due to different growth characteristics such as the relative size, shape, and visibility of organelles in the daughter cell. Visual inspection of the SC and BC images revealed that C. parapsilosis mother cells tended to grow into elongated shape when budding (16% of budding images had mother cell length over twice its width), while C. tropicalis mother cells were generally rounder (1% of budding images were elongated). SC of both species were inspected for shape as well: 5% of C. parapsilosis and 2% of C. tropicalis were elongated cells. The combined case ACC of C. parapsilosis vs. C. tropicalis was 79.67%, and the calculated average of the SC and BC ACC to 80.17%, with 0.5% difference. However, the combined case did not always yield better performance, as the combined cases’ ACC for C. albicans vs. N. glabrata (92.67%), P. kudriavzvii vs. C. parapsilosis (92%), and P. kudriavzevii vs. C. tropicalis (93.67%) were all lower than or equal to their respective SC (93.33%, 97%, and 98%) and BC (97%, 92.33%, and 93.67%) cases, respectively. Additionally, the averaged ACC of these combined cases were also lower than both their SC and BC cases, albeit only by 0.11%. This implies that classification of SC and BC separately provides benefit for these species pairs, while for most of classification cases using the combined case was sufficient to achieve high ACC. Subtle differences in performance between single-cell and budding-cell classifications may reveal shifts in overall population uniformity when yeast cells are growing. This can be seen in the cases of C. auris vs. C. haemuli and of N. glabrata vs. C. haemuli, where the ACC of classifying budding cells (92.16% and 90.33%, respectively) is lower than the ACC of single cells (98.67% for both species pairs), indicating potential similarities in growth behavior between these species pairs. The opposite was observed for C. albicans vs. C. auris and C. albicans vs. N. glabrata, suggesting that classifying them based on their budding yields better results. The ACC of all other species pairs were higher than or equal to 90.33%, suggesting visual differences between them, such as in their shape and organelle visibility and distribution.
4.3. Comparing Light Scattering Image and Microscopy Image Performance
A single-sample t-test was performed for the light scattering classifications and all the microscopy image classifications, namely SC, BC, and combined. The null hypothesis stated that the proposed ML was unable to classify any species in this study, with an average ACC of 50% across 21 unique binary classification cases that corresponded to a random-guess classifier. The p-values of average ACC for light scattering and for all microscopy image cases were all found to be <0.0001. The results were found to be significant at p < 0.05.
Since the light scattering setup does not distinguish SC and BC, the ACC of classification of light scattering images was viewed together with only the combined case from microscopy images (Table 5). For 8 out of 21 species pairs, the ACC difference between light scattering images and microscopy images were higher than 5%, with the greatest ACC difference at 11% for the C. albicans vs. C. haemuli classification. The comparative results remain inconclusive as to which method demonstrates superior performance; the calculated average ACC for all species pairs for light scattering and microscopy were 95.31% and 96.55%, respectively. Furthermore, no single method outperforms the other across all species pairs, indicating that the optical properties from light scattering and the visual properties from microscopy of these yeasts are not directly associated. Agreement between both methods on overall classification ability for the seven yeast species is also shown in the unique case of C. parapsilosis vs. C. tropicalis, where both image types had the lowest ACC among all species pairs and their ACC matched closely with only 3% difference (79.67% to 82.67%). Obtaining lower classification ACC in the light scattering results for C. albicans vs. C. haemuli agrees with previous findings using an InceptionV3 model, where the precision for these two classes was also found to be the lowest when trained on a larger set of yeast image data [19]. This further suggests that while the two methods searched for different characteristics of the yeasts, they arrived at similar conclusions about the segregation of these species, which could be beneficial for cross-validation purposes.
Table 5.
ACC of light scattering image classification (X) and ACC of microscopy image classification with combined case only (Y) in X/Y format. Classifications between C. auris and other species are highlighted in green. Classifications between C. haemuli and other species are highlighted in blue. Classification between C. auris and C. haemuli is highlighted in darker green. Classifications between two identical species are highlighted in black.
4.4. Classification of C. auris Versus All Other Species
To test the transfer learning method’s ability to discriminate C. auris from the other six species of yeast, a one-versus-all binary case was implemented using 150 light scattering patterns from C. auris and Others and the results are shown in Table 6 for the average of 5-fold cross-validation.
Table 6.
Performance metrics of the classification of C. auris versus Others for 5 runs using light scattering images.
The average classification ACC was over 95%, suggesting that the method was adequate when the other classes are combined. The computation time taken for the one-versus-all case is provided in Table 7. Using the proposed method, the computation time scales linearly with the amount of data provided to the feature extractor and only needs to be performed once. Meanwhile, each run of the SVM binary classification can be kept to approximately 2 min when selecting 150 images from each class. Thus, high performance can be achieved using relatively short time and with small datasets.
Table 7.
Time taken to perform feature extraction of two classes of light scattering data (C. auris and Others) and classification tasks using the computation resources reported.
A similar evaluation was performed on all microscopy images of seven yeast species, and the performance is provided in Table 8. The performance of the transfer learning method was higher by 1.6% in average ACC and F1 score of microscopy images than light scattering images, which may be attributed to the larger dataset size. Overall, the analysis performance agrees between the two datasets and shows that this analysis method might be applicable to other population studies where the isolation of one species is of high priority.
Table 8.
Performance metrics of the classification of C. auris versus Others for 5 runs using microscopy images.
A single-sample t-test was also performed for the one-versus-all cases of both the light scattering classification and microscopy image classification. The null hypothesis stated that the classifier was unable to classify C. auris and the Others groups, with an average ACC of 50% in five runs, corresponding to each of the five folds. The p-values for both light scattering and microscopy image classifications were <0.0001, and the results were found to be significant at p < 0.05.
In this study, we classified seven species of pathogenic yeast using a combination of binary classification and transfer learning on their light scattering patterns and microscopy images. The high binary classification ACC of C. auris versus each other six species resulted in high binary classification of C. auris versus all six species together. Since the seven species studied presently account for more than 90% of Candida infections, we expect high binary classification ACC of C. auris versus all other yeast species that cause Candida infections. In conventional statistics, when two independent detection methods are used, such as light scattering and microscopy, the overall probability of both methods incorrectly classifying the sample is smaller than that of each method alone. In general, classification accuracy and classification probability have a positive linear relationship [42]. Thus, it is reasonable to expect that the confidence for detection of C. auris can be improved by using both light scattering and microscopy methods compared to using either method alone. Furthermore, the combination of the two methods can also improve prospects of applying the classification to real clinical samples, where pathogenic yeast cells may be lower in number and where other cells, such as blood cells, or other microbes may be present. Nevertheless, as we have demonstrated that pathogenic yeasts can be classified on a species-level with high accuracy, we may anticipate that the classification of these yeasts versus other cells that are significantly different from them can be promising.
5. Conclusions
Our study highlights the potential of using both light scattering and conventional microscopy methods to classify pathogenic yeasts in label-free conditions. For the first time, pathogenic yeasts were studied based on their light scattering patterns. We classified seven species of pathogenic yeasts using a combination of binary classification and transfer learning on their light scattering patterns and microscopy images. We have also demonstrated for the first time a systematic comparison of light scattering classification with microscopy image classification. We found that while C. auris and C. haemuli are frequently misidentified due to their phylogenic similarity [7], our method can discern them with ACC above 92% using either light scattering or conventional microscopy data. Meanwhile, the spread of light scattering pattern classification ACC for other species pairs was found to be uneven. Specifically, C. albicans and C. haemuli were found to be most likely to be misclassified as other species, whereas C. tropicalis was found to be most likely misclassified as C. parapsilosis. We also show for the first time the identification of C. auris from other species through our binary classification approach, resulting in an average ACC of 95.1% and 96.7% for light scattering patterns and conventional microscopy images, respectively. The similarity in performance of light scattering images and microscopy images demonstrates that the transfer learning approach is adequate for classifying image types, and that comparing the results of both methods in parallel can improve diagnostic confidence. The classification accuracies of microscopy images of single cells, budding cells, and combination of both image types were nearly identical. This suggests that the features of the species themselves are sufficient for classification, which agrees with a recent study that used explainable AI to determine the image features (organelle, cell interior, cell wall, budding patterns/scars, and optical patterns) that advanced computer vision models use to classify fungal pathogens [40]. Interestingly, each of these methods reveal different characteristics about the cell. From light scattering images we found that N. glabrata was unique among the seven species to produce patterns that resemble homogeneous spheres, and this characteristic may be useful to rapidly screen N. glabrata and research its internal structure. Light scattering patterns are also sensitive to the cell size, a feature which may be lost during pre-processing of conventional microscopy images, such as through cropping and resizing target cells. On the other hand, microscopy images could be further categorized as single cells or budding cells, which light scattering is incapable of, and this had a great impact on the classification of microscopy images, such as in the case of C. parapsilosis versus C. tropicalis. This further illustrates the potential benefits of identifying pathogenic yeasts using a combination of features from light scattering and microscopy images. Future research involves the development of a dual-modality model for integrating light scattering and microscopy data, such as using light scattering for initial screening and microscopy for in-depth cell visualization and characterization. Our proposed transfer learning classification of yeast species is applicable to the fast classification of other cell types or image types with low computation costs, opening the possibility for clinical diagnostic use.
Supplementary Materials
The following supporting information can be downloaded at: https://www.mdpi.com/article/10.3390/jimaging12030136/s1, Figures S1–S7: Representative light scattering patterns of 7 yeast species (left) with their respective heatmaps (right); Figures S8–S14: Representative single cell microscopy images of 7 yeast species (left) with their respective heatmaps (right); Figure S15–S21: Representative budding cell microscopy images of 7 yeast species (left) with their respective heatmaps (right); Figure S22: Representative fringe light scattering pattern of N. glabrata from a duplicated experiment.
Author Contributions
Conceptualization, W.R., D.A.C., M.M. and Y.Y.T.; methodology, X.L., M.M. and Y.Y.T.; software, X.L. and Z.C.; validation, X.L. and Z.C.; formal analysis, X.L. and Z.C.; investigation, X.L. and S.S.; resources, D.A.C. and Y.Y.T.; data curation, X.L. and S.S.; writing—original draft preparation, X.L.; writing—review and editing, X.L., S.S., D.A.C., W.R., M.M., M.G. and Y.Y.T.; visualization, X.L.; supervision, M.G., D.A.C., W.R., M.M. and Y.Y.T.; project administration, X.L., S.S., D.A.C. and Y.Y.T.; funding acquisition, D.A.C. and Y.Y.T. All authors have read and agreed to the published version of the manuscript.
Funding
This research was partially funded by a grant to D.A.C. by the Alberta Innovates Accelerating Innovations into Care—Concepts program (AICE-Concepts 597389) and by the Natural Sciences and Engineering Research Council of Canada (RGPIN-2025-05253).
Institutional Review Board Statement
Not applicable.
Informed Consent Statement
Not applicable.
Data Availability Statement
Data underlying the results presented in this paper are not publicly available at this time due to privacy but may be obtained from the authors upon reasonable request. The code used for this study can be found at: https://github.com/xxliu-ua/Yeast_2026/tree/main, accessed on 18 February 2026.
Acknowledgments
The authors thank Samira Rasouli Koohi for assisting with sample preparations.
Conflicts of Interest
The authors declare no conflicts of interest. The funders had no role in the design of the study; in the collection, analyses, or interpretation of data; in the writing of the manuscript; or in the decision to publish the results.
Abbreviations
The following abbreviations are used in this manuscript:
| MALDI TOF MS | Matrix-assisted laser desorption and ionization—time-of-flight mass spectrometry |
| DNA | Deoxyribonucleic acid |
| ML | Machine learning |
| CNN | Convolutional neural network |
| ALLS | Angular laser light scattering |
| CCD | Charge-coupled device |
| RBF | Radial-basis function |
| SVM | Support vector machine |
| ATCC | American Type Culture Collection |
| SDA | Sabouraud dextrose agar |
| GRAD-CAM | Gradient-weighted class activation map |
| ACC | Accuracy |
| TP | True positive |
| SC | Single cell |
| BC | Budding cell |
| SEN | Sensitivity |
| TPR | True positive rate |
| SPE | Specificity |
| AUC | Area under the curve |
| ROC | Receiver operating characteristic |
| TN | True negative |
| FP | False positive |
| FN | False negative |
References
- Brown, G.D.; Denning, D.W.; Gow, N.A.R.; Levitz, S.M.; Netea, M.G.; White, T.C. Hidden Killers: Human Fungal Infections. Sci. Transl. Med. 2012, 4, 165rv13. [Google Scholar] [CrossRef] [Scilit]
- Jenks, J.; Tobin, E.H. Candidiasis. In StatPearls; StatPearls Publishing: Treasure Island, FL, USA, 2025. [Google Scholar]
- Hokken, M.W.J.; Zwaan, B.J.; Melchers, W.J.G.; Verweij, P.E. Facilitators of adaptation and antifungal resistance mechanisms in clinically relevant fungi. Fungal Genet. Biol. 2019, 132, 103254. [Google Scholar] [CrossRef] [Scilit] [PubMed]
- Turner, S.A.; Butler, G. The Candida pathogenic species complex. Cold Spring Harb. Perspect. Med. 2014, 4, a019778. [Google Scholar] [CrossRef] [Scilit] [PubMed]
- Ahmad, S.; Alfouzan, W. Candida auris: Epidemiology, Diagnosis, Pathogenesis, Antifungal Susceptibility, and Infection Control Measures to Combat the Spread of Infections in Healthcare Facilities. Microorganisms 2021, 9, 807. [Google Scholar] [CrossRef] [Scilit] [PubMed]
- Satoh, K.; Makimura, K.; Hasumi, Y.; Nishiyama, Y.; Uchida, K.; Yamaguchi, H. Candida auris sp. nov., a novel ascomycetous yeast isolated from the external ear canal of an inpatient in a Japanese hospital. Microbiol. Immunol. 2009, 53, 41–44. [Google Scholar]
- Gómez-Gaviria, M.; Martínez-Álvarez, J.A.; Chávez-Santiago, J.O.; Mora-Montes, H.M. Candida haemulonii Complex and Candida auris: Biology, Virulence Factors, Immune Response, and Multidrug Resistance. Infect. Drug Resist. 2023, 16, 1455–1470. [Google Scholar] [CrossRef] [Scilit]
- Biswal, M.; Rudramurthy, S.M.; Jain, N.; Shamanth, A.S.; Sharma, D.; Jain, K.; Yaddanapudi, L.N.; Chakrabarti, A. Controlling a possible outbreak of Candida auris infection: Lessons learnt from multiple interventions. J. Hosp. Infect. 2017, 97, 363–370. [Google Scholar] [CrossRef] [Scilit]
- Yaman, G.; Akyar, I.; Can, S. Evaluation of the MALDI TOF-MS method for identification of Candida strains isolated from blood cultures. Diagn. Microbiol. Infect. Dis. 2012, 73, 65–67. [Google Scholar] [CrossRef] [Scilit] [PubMed]
- Lõoke, M.; Kristjuhan, K.; Kristjuhan, A. Extraction of genomic DNA from yeasts for PCR-based applications. Biotechniques 2011, 50, 325–328. [Google Scholar] [CrossRef] [Scilit]
- Hierro, N.; González, Á.; Mas, A.; Guillamón, J.M. New PCR-based methods for yeast identification. J. Appl. Microbiol. 2004, 97, 792–801. [Google Scholar] [CrossRef] [Scilit]
- Hwang, I.J.; Kwon, Y.J.; Lim, H.J.; Hong, K.H.; Lee, H.; Yong, D.; Won, E.J.; Byun, S.A.; Lee, G.Y.; Kim, S.H.; et al. Nosocomial transmission of fluconazole-resistant Candida glabrata bloodstream isolates revealed by whole-genome sequencing. Microbiol. Spectr. 2024, 12, e00883-24. [Google Scholar]
- Huang, X.; Dong, Q.; Zhou, Q.; Fang, S.; Xu, Y.; Long, H.; Chen, J.; Li, X.; Qin, H.; Mu, D.; et al. Genomics insights of candidiasis: Mechanisms of pathogenicity and drug resistance. Front. Microbiol. 2025, 16, 1531543. [Google Scholar] [CrossRef] [Scilit]
- Khodadadi, H.; Eghtedarnejad, E.; Ahmadi, A.; Khodadadi, A.; Shamsdin, N. Evaluation of usage of readily accessible Enterobacteriaceae differential and selective media for identifying Candida auris. Diagn. Microbiol. Infect. Dis. 2025, 111, 116589. [Google Scholar]
- Das, S.; Singh, S.; Tawde, Y.; Chakrabarti, A.; Rudramurthy, S.M.; Kaur, H.; Shankarnarayan, S.A.; Ghosh, A. A Selective Medium for Isolation and Detection of Candida auris, an Emerging Pathogen. J. Clin. Microbiol. 2021, 59, e00326-20. [Google Scholar] [CrossRef] [Scilit]
- Shen, L.; Margolies, L.R.; Rothstein, J.H.; Fluder, E.; McBride, R.; Sieh, W. Deep learning to improve breast cancer detection on screening mammography. Sci. Rep. 2019, 9, 12495. [Google Scholar] [CrossRef] [Scilit]
- Arunachalam, H.B.; Mishra, R.; Daescu, O.; Cederberg, K.; Rakheja, D.; Sengupta, A.; Leonard, D.; Hallac, R.; Leavey, P. Viable and necrotic tumor assessment from whole slide images of osteosarcoma using machine-learning and deep-learning models. PLoS ONE 2019, 14, e0210706. [Google Scholar]
- Ching, T.; Himmelstein, D.S.; Beaulieu-Jones, B.K.; Kalinin, A.A.; Do, B.T.; Way, G.P.; Ferrero, E.; Agapow, P.; Zietz, M.; Hoffman, M.M.; et al. Opportunities and obstacles for deep learning in biology and medicine. J. R. Soc. Interface 2018, 15, 20170387. [Google Scholar] [CrossRef] [Scilit]
- Shankarnarayan, S.A.; Charlebois, D.A. Machine learning to identify clinically relevant Candida yeast species. Med. Mycol. 2024, 62, myad134. [Google Scholar]
- Koya, S.K.; Brusatori, M.A.; Yurgelevic, S.; Huang, C.; Demeulemeester, J.; Percefull, D.; Salimnia, H.; Auner, G.W. Rapid Identification of Candida auris by Raman Spectroscopy Combined With Deep Learning. J. Raman Spectrosc. 2025, 56, 218–227. [Google Scholar]
- Zhuang, F.; Qi, Z.; Duan, K.; Xi, D.; Zhu, Y.; Zhu, H.; Xiong, H.; He, Q. A Comprehensive Survey on Transfer Learning. Proc. IEEE 2021, 109, 43–76. [Google Scholar]
- Wan, Y.W.; Liu, L.; Liu, X.; Wang, W.; Islam, M.Z.; Dong, C.; Garen, C.R.; Woodside, M.T.; Gupta, M.; Mandal, M.; et al. Integration of light scattering with machine learning for label free cell detection. Biomed. Opt. Express 2021, 12, 3512–3529. [Google Scholar] [CrossRef] [Scilit]
- Shahin, H.; Gupta, M.; Janowska-Wieczorek, A.; Rozmus, W.; Tsui, Y.Y. Physical characterization of hematopoietic stem cells using multidirectional label-free light scatterings. Opt. Express 2016, 24, 28877–28888. [Google Scholar] [CrossRef] [Scilit]
- Su, X.; Kirkwood, S.E.; Gupta, M.; Marquez-Curtis, L.; Qiu, Y.; Janowska-Wieczorek, A.; Rozmus, W.; Tsui, Y.Y. Microscope-based label-free microfluidic cytometry. Opt. Express 2011, 19, 387–398. [Google Scholar]
- Su, X.; Qiu, Y.; Marquez-Curtis, L.; Gupta, M.; Capjack, C.E.; Rozmus, W.; Janowska-Wieczorek, A.; Rozmus, W. Label-free and noninvasive optical detection of the distribution of nanometer-size mitochondria in single cells. J. Biomed. Opt. 2011, 16, 067003. [Google Scholar] [CrossRef] [Scilit]
- Liu, L.; Islam, M.Z.; Liu, X.; Gupta, M.; Rozmus, W.; Mandal, M.; Tsui, Y.Y. Multi-wavelength multi-direction laser light scattering for cell characterization using machine learning-based methods. Cytometry Part A 2023, 103, 796–806. [Google Scholar]
- Su, X.; Yuan, T.; Wang, Z.; Song, K.; Li, R.; Yuan, C.; Kong, B. Two-Dimensional Light Scattering Anisotropy Cytometry for Label-Free Classification of Ovarian Cancer Cells via Machine Learning. Cytometry Part A 2020, 97, 24–30. [Google Scholar]
- Liu, C.; Yuan, Z.; Liu, Q.; Song, K.; Kong, B.; Su, X. Siamese deep learning video flow cytometry for automatic and label-free clinical cervical cancer cell analysis. Biomed. Opt. Express 2024, 15, 2063–2077. [Google Scholar] [CrossRef] [Scilit] [PubMed]
- Huang, G.; Liu, Z.; van der Maaten, L.; Weinberger, K.Q. Densely connected convolutional networks. arXiv 2017, arXiv:1608.06993. [Google Scholar] [PubMed]
- Zia-Ur-Rehman, M.K.; Awang, M.K.; Rashid, J.; Ali, G.; Hamid, M.; Mahmoud, S.F.; Saleh, D.I.; Ahmad, H.I. Classification of Alzheimer disease using DenseNet-201 based on deep transfer learning technique. PLoS ONE 2024, 19, e0304995. [Google Scholar]
- Taher, O.; Özacar, K. MedCapsNet: A modified Densenet201 model integrated with capsule network for heel disease detection and classification. Heliyon 2024, 10, e34420. [Google Scholar] [PubMed]
- Sanghvi, H.A.; Patel, R.H.; Agarwal, A.; Gupta, S.; Sawhney, V.; Pandya, A.S. A deep learning approach for classification of COVID and pneumonia using DenseNet-201. Int. J. Imaging Syst. Technol. 2023, 33, 18–38. [Google Scholar] [CrossRef] [Scilit] [PubMed]
- Gill, K.S.; Anand, V.; Gupta, S.; Figat, P. Stratification of White Blood Cells Using Optimized DenseNet201 Model. In Communications in Computer and Information Science; Springer: Berlin/Heidelberg, Germany, 2023; Volume 1749. [Google Scholar]
- Chang, C.-C.; Lin, C.-J. LIBSVM: A library for support vector machines. ACM Trans. Intell. Syst. Technol. 2011, 2, 27:1–27:27. [Google Scholar]
- Fan, R.-E.; Chang, K.-W.; Hsieh, C.-J.; Wang, X.-R.; Lin, C.-J. LIBLINEAR: A Library for Large Linear Classification. J. Mach. Learn. Res. 2008, 9, 1871–1874. [Google Scholar]
- Silva, S.; Negri, M.; Henriques, M.; Oliveira, R.; Williams, D.W.; Azeredo, J. Candida glabrata, Candida parapsilosis and Candida tropicalis: Biology, epidemiology, pathogenicity and antifungal resistance. FEMS Microbiol. Rev. 2012, 36, 288–305. [Google Scholar] [CrossRef] [Scilit]
- Yue, H.; Bing, J.; Zheng, Q.; Zhang, Y.; Hu, T.; Du, H.; Wang, H.; Huang, G. Filamentation in Candida auris, an emerging fungal pathogen of humans: Passage through the mammalian body induces a heritable phenotypic switch. Emerg. Microbes Infect. 2018, 7, 188. [Google Scholar] [CrossRef] [Scilit] [PubMed]
- Deng, Y.; Li, S.; Bing, J.; Liao, W.; Tao, L. Phenotypic Switching and Filamentation in Candida haemulonii, an Emerging Opportunistic Pathogen of Humans. Microbiol. Spectr. 2021, 9, e00779-21. [Google Scholar] [CrossRef] [Scilit]
- Samaranayake, Y.H.; Samaranayake, L.P. Candida krusei: Biology, epidemiology, pathogenicity and clinical manifestations of an emerging pathogen. J. Med. Microbiol. 1994, 41, 295–310. [Google Scholar]
- Guthrie, J.D.; Shankarnarayan, S.A.; Charlebois, D.A. Peering inside the black box: Explainable AI to interpret advanced computer vision fungal pathogen prediction. bioRxiv 2025. [Google Scholar] [CrossRef] [Scilit]
- Selvaraju, R.R.; Cogswell, M.; Das, A.; Vedantam, R.; Parikh, D.; Batra, D. Grad-cam: Visual explanations from deep networks via gradient-based localization. arXiv 2016, arXiv:1610.02391. [Google Scholar]
- Hanafy, M.; Khalil, M.; Abbas, H. Combining Classical and Deep Learning Methods for Twitter Sentiment Analysis. In Proceedings of the ANNPR 2018, Siena, Italy, 19–21 September 2018; Volume 11081. pp. 281–292. [Google Scholar]


Disclaimer/Publisher’s Note: The statements, opinions and data contained in all publications are solely those of the individual author(s) and contributor(s) and not of MDPI and/or the editor(s). MDPI and/or the editor(s) disclaim responsibility for any injury to people or property resulting from any ideas, methods, instructions or products referred to in the content. |
© 2026 by the authors. Licensee MDPI, Basel, Switzerland. This article is an open access article distributed under the terms and conditions of the Creative Commons Attribution (CC BY) license.