


Abstract
Mechanical treatment recovers combustible and recyclable fractions from mixed municipal solid waste (MSW), but full-scale performance is sensitive to front-end operation, line loading, and feedstock heterogeneity. This study examined material recovery trade-offs at a municipal mechanical treatment facility in Satun, Thailand. Four inverter-controlled regimes were assessed by adjusting the bag opener and trommel motor frequencies, giving measured line throughputs of 14.75, 13.45, 8.03, and 6.54 t·h−1. Output was classified as refuse-derived fuel (RDF), residual waste, recyclables, and bulky/loss material, with composition-based indicators of stream cleanliness and leakage. Each regime was a single short trial on waste from a different collection vehicle, without replication or input homogenization; no statistical comparison is possible, and results are reported as preliminary observations rather than isolated effects of inverter frequency. RDF yield fell from 42.06% of input at the highest throughput to 18.12% at the lowest, whereas recyclable recovery peaked at 4.95% under an intermediate regime that also returned the highest gross revenue. Residual-disposal methane generation potential was 7.78% higher under the lowest-throughput regime than under business-as-usual. Three trade-offs emerged: throughput against selectivity, RDF quantity against cleanliness, and recovery against leakage. The findings help operators select front-end settings on multi-criteria indicators rather than throughput alone.
1. Introduction
Municipal solid waste (MSW) treatment facilities in many local authorities still receive a mixed residual stream rather than a pre-sorted feedstock. Under these conditions, the mechanical line must process material with variable moisture content, bagging intensity, organic loading, plastics, glass, metals, textiles, bulky items, and inert contamination. This variability is operationally significant. It influences how waste is opened, screened, conveyed, manually sorted, and finally routed into refuse-derived fuel (RDF), recyclable material, residual waste, or oversize/loss streams [1,2,3]. For municipalities where source separation remains inconsistent, the performance of the mechanical treatment stage can determine whether mixed MSW is diverted to fuel production and material recovery or remains largely a disposal burden [4,5].
Mechanical–biological treatment (MBT) and related mechanical separation systems occupy an intermediate position between disposal-dominant waste management and circular systems based on high-quality source separation [6,7]. Their relevance persists because many municipalities continue to manage large quantities of mixed waste, even in areas with recycling programs [8]. Gadaleta et al. (2022) [6] described MBT as a treatment route that combines mechanical pre-processing with downstream biological, material, or fuel-oriented pathways. In such systems, the mechanical section is not merely a volume-reduction stage; it actively restructures heterogeneous input waste into fractions that differ in particle size, combustible content, biological activity, market value, and suitability for disposal or downstream utilization.
The quality and quantity of MBT outputs depend on both plant configuration and operating conditions [9,10,11,12]. Montejo et al. (2013) [13] showed that MBT performance varies substantially among plants and is strongly affected by the composition of incoming waste. Velis et al. (2013) [14] similarly emphasized that solid recovered fuel (SRF) and RDF production from mixed waste depend on the capacity of processing technologies to extract relatively clean combustible fractions from an inherently heterogeneous matrix. At the front end of the line, units such as hoppers, bag openers, trommels, conveyors, air separators, and manual sorting stations determine material exposure and routing. Small operational changes may therefore alter not only throughput, but also the allocation of combustible material, recyclable material, organics, inert contaminants, and residual rejects.
Previous studies have provided important evidence on MBT and RDF systems through material flow analysis, life cycle assessment (LCA), techno-economic assessment, and fuel characterization. For example, Velis et al. (2013) [14] used material flow analysis to examine how mechanical processing shaped SRF composition and fuel-property development. Gadaleta et al. (2022) [6] combined material flow analysis and LCA to compare MBT configurations, while Ng et al. (2021) [15] evaluated the techno-economic potential of integrating MBT with hydrogen production from residual MSW. These studies support the interpretation that mechanical treatment is an active resource-partitioning stage rather than a neutral intermediary process.
A remaining gap concerns the short-term operational behavior of individual full-scale municipal facilities. Many assessments treat operating conditions as fixed, focus on plant-level averages, or compare scenarios using assumed material flows. In routine municipal operation, however, operators make short-term decisions about front-end loading, machine settings, and line speed under variable feedstock conditions. These decisions can influence RDF production, residual generation, recyclable capture, contamination in output streams, revenue, and landfill-related emissions. Evidence from full-scale municipal facilities remains limited, especially for facilities processing mixed MSW without controlled or homogenized input [16].
This gap is methodologically important. Field-based studies cannot always isolate the causal effect of front-end machine-speed setting or measured line throughput because different truckloads may differ in composition, moisture, bagging, and recoverable material content. This limitation, however, reflects the operating reality of municipal plants. A laboratory- or pilot-scale test with homogenized waste can provide stronger causal control, but it may not capture the practical instability operators face. The present study, therefore, treats the inverter-controlled regimes as operating conditions observed under real municipal waste variability. The analysis does not claim that machine settings or measured throughput alone caused all observed differences. Instead, it evaluates how the full-scale line behaved when different bag opener and trommel frequencies were applied to actual mixed MSW delivered to the facility.
The study was conducted at the mechanical waste treatment facility of Kumpang Subdistrict Municipality in Satun Province, Thailand. During the field trials, the bag opener and trommel were adjusted through inverter control. The remaining conveyors and downstream units were kept at fixed settings. The analysis links these inverter-controlled front-end regimes to the measured line throughput and the resulting output partitioning. Four major output streams were evaluated: RDF, residual waste, recyclables, and bulky/loss material. Composition-based indicators were also used to assess the apparent cleanliness of the RDF stream and the leakage of recyclables into the residual stream. RDF “cleanliness” is used here strictly in a compositional sense. The study did not measure net calorific value, moisture, ash, chlorine, sulfur, or trace metals; therefore, it does not claim to evaluate RDF quality in a physicochemical or standards-based sense.
The objectives were threefold:
- To quantify how output partitioning differed across four inverter-controlled front-end operating regimes in a full-scale municipal mechanical treatment line;
- To examine trade-offs among RDF yield, residual generation, recyclable recovery, RDF stream contamination, gross direct revenue, and residual-disposal-related methane (CH4) generation potential;
- To discuss how truck-to-truck heterogeneity constrains the interpretation of field-based plant performance.
The study is positioned as exploratory full-scale operational evidence rather than a replicated causal experiment.
2. Results
Before the results are presented, the basis on which they should be read is stated explicitly. Each of the four inverter-controlled regimes was applied to waste delivered by different collection vehicles on different operating occasions, and no regime was replicated. The incoming waste was neither homogenized nor characterized before it entered the hopper. The front-end machine setting and the composition of the processed feedstock therefore varied together, and their separate contributions cannot be resolved within this dataset. The measured line throughputs and normalized output fractions are summarized in Table 1. The table provides the mass-partitioning basis for interpreting the subsequent RDF, recyclable, residual, and bulky/loss responses.
Table 1.
Measured output partitioning across the mechanical treatment line, expressed as a percentage of processed input (wet mass basis).
Table 2 indicates the scale of that co-variation: across the four regimes the food-waste content of the residual stream ranged from 65.84% to 80.26% and the plastic content from 3.99% to 12.07%. This is an output measurement and must not be read as the composition of the incoming waste. The residual stream is what remained after the line had already removed RDF, recyclables, and bulky material, so its composition reflects the combined effect of the delivered load and of the separation performed under that regime, and the two cannot be disentangled. It is used here only as an indirect indication that the four regimes did not process comparable material; the magnitude of the variation is difficult to attribute to separation alone, but no inference about input composition is drawn from it. This caveat applies wherever residual composition is cited in the sections that follow. All values reported in Section 2.1, Section 2.2, Section 2.3, Section 2.4 and Section 2.5 are accordingly preliminary regime-level observations obtained from single trials under co-varying machine setting and feedstock. Where the text describes material being routed, retained, or recovered under a given regime, the wording refers to what was measured at the outlet of the line during that trial, and no isolated causal effect of the front-end setting is claimed.
Table 2.
Composition of the residual stream under each inverter-controlled operating regime (% by wet mass).
2.1. Inverter-Controlled Operation, Measured Throughput, and Output Partitioning
The mechanical separation line showed a clear redistribution of material across output streams under the four inverter-controlled front-end settings. At the highest measured throughput, 14.75 t·h−1 under the 50 Hz setting, 42.06% of incoming waste was routed to the RDF stream. At the lowest measured throughput, 6.54 t·h−1 under the 25 Hz setting, the RDF fraction declined to 18.12%. The residual fraction moved in the opposite direction, increasing from 53.65% at 14.75 t·h−1 to 65.22% at 6.54 t·h−1. Recyclable recovery increased from 1.80% at 14.75 t·h−1 to 4.95% at 8.03 t·h−1, before declining to 4.07% at 6.54 t·h−1. The bulky/loss fraction also increased under reduced front-end frequency settings, reaching 14.48% at 8.03 t·h−1 and 12.60% at 6.54 t·h−1. All values in this section are percentages of the total processed input on a wet mass basis.
The dominant pattern was a shift from RDF-oriented partitioning under the highest measured throughput to residual and bulky/loss routing under lower measured throughputs. The four regimes therefore differed in the internal allocation of material and not only in the amount processed per hour. Such an interpretation is consistent with material-flow approaches used in MBT assessment, where plant performance is evaluated by the distribution of input waste across recovered, fuel-oriented, stabilized, and rejected streams [17,18,19].
The decline in RDF recovery as measured throughput decreased was the most pronounced system response. If RDF quantity were used as the only performance indicator, the 50 Hz condition would appear favorable. That interpretation would be incomplete. The same condition produced the lowest recyclable recovery and the highest RDF contamination, as discussed below. Conversely, the 25 Hz condition produced the lowest RDF yield and the highest residual fraction. The result, therefore, does not support a simple assumption that slower front-end machine operation always improves separation performance.
The recyclable stream behaved differently from the RDF and residual streams. Its highest value occurred at the intermediate 30 Hz condition, corresponding to a measured throughput of 8.03 t·h−1, not at either operating extreme. One possible explanation is that recyclable capture depends on material presentation and on the opportunity available for sorting. This is a candidate mechanism only. Neither the density of the waste bed nor the recoverable content of the delivered load was measured, so the non-linear response is equally consistent with differences between the truckloads processed. Comparable sensitivity of manual sorting performance to the presentation of the waste stream has been reported for pre-treated MSW [20].
The bulky/loss fraction also differed markedly across the regimes. The fraction was low at 14.75 t·h−1 but increased substantially at 8.03 and 6.54 t·h−1. This may reflect a greater opportunity to remove oversized or non-processable material at slower front-end settings. It may also reflect truckload composition, particularly if lower-throughput trials received more bulky material. Without replicate trials and input characterization, these explanations cannot be separated. The finding is nevertheless operationally relevant because bulky/loss routing affects equipment protection, manual sorting burden, and the amount of material available for RDF or residual pathways.
The composition of the residual stream under each regime is given in Table 2. These data are the basis for the CH4 generation estimate in Section 2.5 and, as noted at the start of this section, also indicate the degree to which the material processed under each regime differed.
Components were determined by manual sorting following the waste characterization procedure of the Pollution Control Department of Thailand and grouped according to IPCC waste composition categories. Values describe the residual stream leaving the line; they are not a characterization of the incoming waste and cannot be interpreted as input composition, because the residual stream is what remained after RDF, recyclables, and bulky material had already been removed.
To visualize the overall material-flow response, Figure 1 presents the normalized distribution of processed waste across the four output streams under each inverter-controlled regime.
Figure 1.
Output partitioning of processed waste under different inverter-controlled operating regimes. Bars show the percentage of processed input allocated to each stream under a single trial per regime; no replicate data are available and no error bars can be shown.
2.2. RDF Fraction and Composition-Based Contamination of the RDF Stream
RDF output declined progressively under lower bag opener and trommel frequency settings, from 42.06% of input at 14.75 t·h−1 to 18.12% at 6.54 t·h−1. In contrast, composition-based contamination within the RDF stream, expressed as a percentage of the RDF stream mass, decreased from 31.38% at 14.75 t·h−1 to 18.84% at 13.45 t·h−1, 16.13% at 8.03 t·h−1, and 10.39% at 6.54 t·h−1. This inverse pattern indicates a trade-off between RDF quantity and the compositional cleanliness of the RDF stream. Under the higher-frequency regimes a larger share of the input was routed into the RDF pathway, but a larger share of that stream also consisted of non-target material. Under the lower-frequency regimes less RDF was produced, and the RDF stream contained a smaller fraction of non-target material.
The relationship between RDF yield and RDF stream contamination is shown in Figure 2. This comparison is used to assess whether higher RDF recovery was accompanied by lower or higher compositional selectivity.
Figure 2.
RDF output and composition-based contamination across different inverter-controlled operating regimes. RDF yield is expressed as a percentage of processed input; contamination is expressed as a percentage of the RDF stream. The two series have different denominators and are plotted as separate bars rather than as a connected series.
The reduction in contamination should be interpreted carefully. It indicates improved compositional selectivity, not confirmed fuel-quality improvement. RDF and SRF quality are normally assessed using parameters such as net calorific value, moisture, ash, chlorine, sulfur, and selected metals, often in relation to downstream acceptance requirements or classification systems [21,22]. None of these parameters was measured in this study. These measurements were outside the present study boundary. The evidence, therefore, supports only the narrower conclusion that the RDF stream contained a smaller proportion of non-target components under the lower front-end frequency regimes. It does not support any statement that the fuel produced was of better quality, was cleaner as a fuel, or would perform better in a kiln.
A mechanism that would account for this pattern is that lower line loading improves the effectiveness of bag opening, trommel screening, and downstream visual sorting, so that combustible items are separated more completely from organic-rich, inert, or wet material, whereas at higher throughput a thicker and faster-moving bed allows partly opened bags and mixed material to enter the RDF pathway. Such an effect is consistent with studies showing that screening and mechanical pre-treatment alter the composition and particle-size distribution of fuel-oriented fractions [14,23]. It is nevertheless a hypothesis and not a finding of this study. Bed thickness, bag-opening efficiency, and the composition of material entering the wind shifter were not measured, and the residual composition in Table 2 shows that the loads processed under the lower-frequency regimes also differed in plastic and inert content. Verifying the mechanism would require replicated trials with characterized feedstock and sampling at intermediate points along the line.
The practical implication is that RDF output should not be assessed by mass fraction alone. A higher RDF yield may be attractive where the plant is under pressure to divert waste from landfill or supply an RDF off-taker. Yet if the larger RDF stream carries higher contamination, the downstream user may face handling problems, reduced fuel consistency, or a higher risk of rejection. In this facility, the highest RDF fraction coincided with the highest contamination fraction. Operators, therefore, need to decide whether the immediate benefit of higher RDF mass outweighs the compositional penalty.
2.3. Recyclable Recovery and Recyclable Leakage
Recyclable recovery showed a non-linear response across the inverter-controlled operating regimes. It increased from 1.80% at 14.75 t·h−1 to 3.15% at 13.45 t·h−1 and reached 4.95% at 8.03 t·h−1. At 6.54 t·h−1, it decreased to 4.07%. These values are percentages of processed input. Recyclable leakage, by contrast, is expressed as a percentage of the residual stream, and moved in a different direction, increasing from 6.40% at 14.75 t·h−1 to 6.86% at 13.45 t·h−1, 10.80% at 8.03 t·h−1, and 13.55% at 6.54 t·h−1. The combination of higher recovered recyclables at intermediate loading and higher recyclable leakage under lower measured-throughput conditions indicates that recyclable performance cannot be inferred from the recovered stream alone.
Because recovered recyclables alone do not represent the full sorting performance, Figure 3 compares the recyclable fraction captured by the process with the recyclable material that remained in the residual stream.
Figure 3.
Recyclable recovery and recyclable leakage in the residual stream across different inverter-controlled operating regimes. Recovery is a percentage of processed input; leakage is a percentage of the residual stream. The denominators differ, so the two series are not additive.
The intermediate peak might reflect a more favorable balance between line loading and the opportunity for manual picking, with the bed too dense for reliable visual identification at the highest throughput and no further gain available below the intermediate setting. This is again a candidate mechanism rather than a result. Recovery at the lowest throughput fell rather than rose, which is equally consistent with a load containing fewer recoverable items, with saturation of the sorting capacity, or with the increased routing of material to the residual and bulky/loss streams observed under that regime. The six operators and their positions were unchanged across regimes, so staffing does not account for the difference, but nothing in the dataset distinguishes among the remaining explanations.
The composition of the recovered recyclable stream also changed across regimes. Plastic dominated the recyclable stream under the highest measured-throughput condition, whereas glass accounted for a larger share in the lower- and intermediate-throughput regimes. Bag opener and trommel settings may have influenced the liberation, preservation, and routing of specific recyclable fractions, although differences in the delivered loads may equally account for the shift. Glass recovery, in particular, may be sensitive to screening, breakage, and particle-size distribution. Mechanical pre-treatment studies have shown that processing conditions can affect the physical form and downstream distribution of MSW fractions [23,24].
The composition of the recovered recyclable stream is presented in Figure 4 to show whether the operating regimes differed only in the total recyclable fraction or also in the relative contribution of plastics, metals, and glass.
Figure 4.
Composition of the recovered recyclable fraction across different inverter-controlled operating regimes. Values are percentages of the recovered recyclable stream and sum to 100% within each regime.
Recyclable leakage is particularly important because the residual stream was not an exhausted reject. It still contained recoverable materials. The leakage fraction increased as measured line throughput decreased, despite improved recyclables recovery at intermediate loading. Figure 5 indicates that plastic bags, glass, metals, and other recoverable components remained in the residual stream. Some of these materials may have been physically difficult to recover because of contamination, small size, breakage, or attachment to organic-rich material. Others may simply have escaped visual sorting.
Figure 5.
Composition of recyclable leakage in the residual stream across different inverter-controlled operating regimes. Values are percentages of the residual stream mass; the stacked total is the recyclable leakage indicator plotted in Figure 3.
To further examine unrecovered material losses, Figure 5 presents the composition of recyclable leakage within the residual stream. This helps identify which recyclable components continue to be routed towards disposal.
This pattern has two implications. First, an operating regime that increases the amount of recovered recyclables may still leave a larger recyclable burden in residual waste. Second, residual composition should be monitored if the plant aims to improve landfill diversion or recycling performance. The residual fraction represents not only the disposal mass but also a pathway for the loss of materials that may have economic or environmental value. This is consistent with Bernat et al. (2021) [24], who reported that stabilized residual outputs from MBT systems may still contain recoverable or contaminant fractions, depending on the characteristics of the input waste and treatment performance.
The observed increase in recyclable leakage should not be attributed solely to reduced front-end frequency or lower measured throughput. Incoming truckloads were different, and the recyclable content of each load was not measured before processing. Nevertheless, the leakage results are operationally meaningful because they show what happened under realistic municipal conditions. In such settings, operators experience machine-setting changes together with feedstock variability, not in isolation.
2.4. Gross Direct Revenue Relative to Business-as-Usual Operation
Daily gross direct revenue was estimated from RDF and recyclable sales under a fixed incoming waste quantity of 50 t·day−1. The BAU condition was 13.45 t·h−1. Compared with BAU, the 14.75 t·h−1 condition increased RDF revenue by approximately 21%, reflecting the larger RDF fraction. However, sales revenue from recyclables decreased by approximately 12%. The gain from RDF was therefore partly offset by the weaker recovery of recyclables. The resulting RDF, recyclable, and total gross direct revenues are presented in Figure 6.
Figure 6.
Daily gross direct revenue from RDF and recyclable sales under different inverter-controlled operating regimes, estimated on a fixed input basis of 50 t·day−1 and the local unit prices given in Section 4.8. No cost term is included.
The 8.03 t·h−1 condition produced the highest total gross direct revenue among the tested regimes. RDF revenue decreased by approximately 23% relative to BAU, but recyclable revenue increased by approximately 41%. Under the price assumptions used in the assessment, the additional recyclable revenue more than compensated for the lower RDF revenue. The lowest measured-throughput condition, 6.54 t·h−1, did not improve total revenue to the same extent because RDF revenue declined by nearly 48%, while recyclable revenue increased by only approximately 16% relative to BAU.
These results suggest that the gross revenue outcome was governed by the relative value of recovered streams, not by RDF mass alone [2,20,25,26]. At this facility, recyclable recovery contributed more strongly to total gross direct revenue than RDF sales under the tested assumptions. This conclusion remains conditional on local prices, off-take arrangements, labor availability, and the composition of incoming waste. A change in the RDF price, the recyclable market price, or the rejection cost could shift the preferred operating regime. Because no cost term is included, and because several cost items differ systematically between regimes, the ordering of the regimes by gross direct revenue should not be read as an ordering by economic benefit, and no such ordering is claimed anywhere in this study. The calculation boundary and price-related reporting items are summarized in Tables S3–S5 of the Supplementary Materials to support transparent interpretation of the economic comparison.
2.5. Residual-Disposal-Related CH4 Generation Potential Relative to Business-as-Usual Operation
Residual-disposal-related CH4 generation potential was estimated from the residual output sent to landfill. The comparison was limited to the residual stream and did not include avoided RDF substitution, avoided recycling burdens, electricity consumption, transport, or RDF end use. The results should therefore be interpreted as a partial indicator of the landfill-related burden rather than as a full life-cycle assessment. As set out in Section 4.8, the quantity reported is Lo, the ultimate methane generation potential of the residual deposited from one operating day, expressed in tonnes of CH4 per day. It is not an emission, and it is not a CO2-equivalent value.
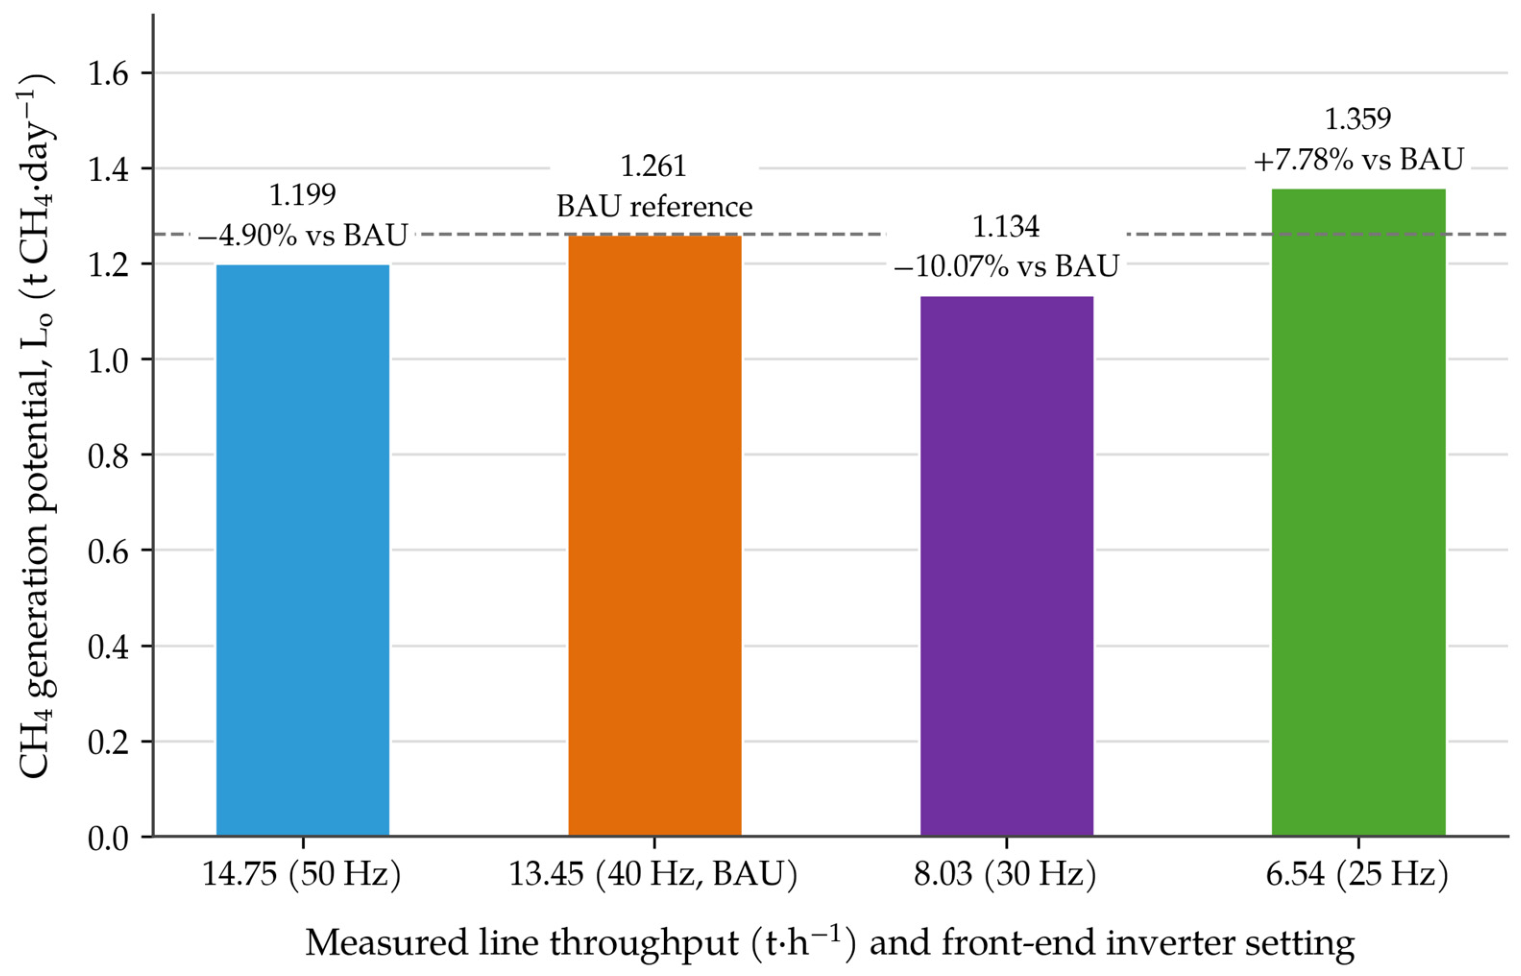
The residual-disposal-related CH4 generation response is summarized in Figure 7. The figure is used to compare the relative landfill-related burden associated with the residual stream under each operating regime.
Relative to the BAU condition, the 14.75 t·h−1 regime reduced residual-disposal-related generation potential by 4.90%. The 8.03 t·h−1 regime showed the largest reduction of the four regimes, at 10.07%. By contrast, the 6.54 t·h−1 regime increased it by 7.78% relative to BAU. This increase was consistent with the higher residual fraction observed at the lowest measured-throughput condition, which reached 65.22% of the input.
The result challenges the assumption that slower front-end operation necessarily lowers the residual-disposal methane burden. Although the composition-based cleanliness of the RDF stream was highest under the lowest-frequency regime, that regime also shifted more material to the residual stream. For an organic-rich residual fraction, this routing can increase the landfill-related methane burden. The residual-disposal methane-generation indicator in this plant therefore tracked the size and composition of the residual stream rather than the front-end setting or the measured throughput. No broader claim is made, because the study evaluated only this single disposal-related indicator.
Figure 7.
Residual-disposal-related CH4 generation potential under different inverter-controlled operating regimes. Values are the CH4 generation potential, Lo, of the residual output from one operating day at a fixed input of 50 t·day−1, calculated with the IPCC default parameters in Table S7. They are ultimate generation potentials, not annual emissions and not CO2-equivalent values. The dashed line marks the business-as-usual regime. Percentage changes were computed from unrounded composition data and may differ in the second decimal place from a recalculation based on the rounded values in Table 3.
Table 3.
Operating conditions and trial record for the four inverter-controlled regimes.
Because the CH4 generation comparison was limited to residual disposal, the interpretation should focus on relative differences among operating regimes rather than on a complete life-cycle burden. The assessment used a fixed daily input assumption and excluded avoided RDF substitution, avoided recycling burdens, electricity use, transport, and downstream RDF combustion. These exclusions are appropriate for a residual-disposal indicator, but they should not be interpreted as a full GHG balance of the mechanical treatment system.
3. Discussion
3.1. Apparent Operational Trade-Offs Across Inverter-Controlled Regimes
The results indicate three interacting trade-offs. The first is a throughput-selectivity trade-off. Higher measured throughput was associated with a higher RDF yield but also with higher RDF contamination and lower recyclable recovery. The second is an RDF quantity-cleanliness trade-off. The lower-frequency regimes were associated with less contamination in the RDF stream, but also with less RDF mass. The third is a recyclable recovery-leakage trade-off. Recyclable recovery was highest at the intermediate regime, yet the amount of recyclable material remaining in the residual stream increased under lower measured-throughput conditions.
A mechanism that would produce these trade-offs is readily stated: inverter-based adjustment of the bag opener and trommel changes how material is opened, screened, and presented to the conveyor and the manual sorting section, so that a dense and fast-moving bed raises throughput while reducing exposure and sorting time, whereas a slower and thinner bed improves visual access and compositional selectivity provided the incoming material contains recoverable fractions and the sorting section has capacity to capture them. Mechanical pre-treatment is known to change the physical distribution of waste fractions and the form in which materials enter downstream recovery stages [27]. This account is presented as a hypothesis for future testing. The present study measured neither bed thickness nor material presentation, did not characterize the incoming loads, and did not replicate any regime, so it cannot distinguish this mechanism from feedstock variation. The trade-offs themselves are observed; the mechanism proposed to explain them is not.
Gross direct revenue and CH4 generation results add another layer. The condition with the highest RDF yield was not the condition with the highest total gross direct revenue. The condition with the cleanest RDF stream was not the condition with the lowest residual-disposal methane generation potential. The 30 Hz regime, corresponding to 8.03 t·h−1, was the best observed case among the four single trials in terms of recyclable recovery and gross direct revenue. It is a candidate for further testing and not an identified optimum; with one observation per regime, no statistical basis exists for preferring it, and the same ordering could arise from the composition of the load that happened to be processed that day.
3.2. Comparison with Previously Reported Mechanical Treatment Performance
The RDF yields observed here, between 18.12% and 42.06% of processed input, fall within the wide range reported for mechanical and mechanical–biological treatment of mixed municipal waste, in which output partitioning differs substantially between plants. Montejo et al. (2013) [13], in an assessment of eight MBT plants that included waste characterization, attributed a large part of the between-plant variation to differences in incoming waste rather than to plant configuration alone. The present dataset is consistent with that conclusion at the level of a single plant: the four regimes differed in residual composition (Table 2) as well as in machine setting, and the two influences act together. Table 2 records an output and not an input, so it supports the weaker statement that the material processed differed between regimes rather than any quantitative claim about the delivered loads.
Two further points of comparison concern the streams rather than the yields. First, Velis et al. (2013) [14] showed, using material flow analysis, that successive mechanical processing steps progressively shape the composition and fuel properties of the combustible fraction rather than simply concentrating it. The inverse relation between RDF mass and RDF stream contamination observed here (Figure 2) is a plant-scale expression of the same principle, although the present study measured composition only and did not extend to fuel-property development. Second, Bernat et al. (2021) [24] reported that stabilized residual outputs from a full-scale MBT plant still contained recoverable and contaminant fractions. The recyclable leakage measured here, rising from 6.40% to 13.55% of the residual stream, supports treating the residual output as an incompletely exhausted stream rather than as a final reject, and indicates that residual composition deserves routine monitoring in plants of this type.
The gross-revenue result is more specific to context. Ngamket et al. (2021) [20] and Zahir et al. (2024) [2] assessed the economics of residual-waste valorization and of RDF production for cement kilns, respectively, in both cases under conditions in which the fuel product carries the economic case. At the study facility the opposite applied. The local RDF price of 80 THB·t−1 is low relative to the prices obtainable for sorted recyclables, so recyclable sales dominated total gross direct revenue under every regime and the intermediate regime returned the highest total. This is a price-structure effect rather than a technical one, and it is the principal reason why a preferred operating regime cannot be transferred between markets without recalculating the revenue basis.
Comparison with previous work is also limited by an asymmetry of design. Most published assessments of MBT and RDF plants report plant-level averages, campaign means, or modeled flows derived from repeated sampling, whereas the present data consist of four single short-duration trials recorded on separate operating occasions. The present results are therefore better read as a within-plant operating record that complements those studies than as a directly comparable performance benchmark.
3.3. Practical Implications for Municipal Operation
The first operational implication is that throughput should not be the sole performance metric. In this study, the highest measured-throughput condition yielded the largest RDF fraction but also the highest RDF contamination and the lowest recyclable recovery. A comprehensive performance monitoring framework should therefore include at least RDF yield, RDF contamination, recovered recyclables, recyclable leakage, residual fraction, bulky/loss fraction, gross direct revenue, and the residual-disposal methane-generation indicator.
The second implication concerns RDF off-take. If the downstream RDF user applies acceptance criteria related to inert contamination, moisture, or fuel consistency, then a higher RDF mass may not be operationally preferable. The results indicate that the lower front-end frequency regimes coincided with a lower non-target content in the RDF stream. However, this trend may not be caused only by machine-speed changes, because variation in feedstock composition may also have influenced the result. For municipal operators, this distinction is important: a compositionally cleaner RDF stream is not necessarily a better fuel unless physicochemical properties are confirmed.
The third implication is that the additional operating time required at reduced throughput must be weighed against any gain in selectivity. At a fixed daily input of 50 t, the line would need approximately 3.4 h under the 50 Hz regime, 3.7 h under BAU, 6.2 h under the 30 Hz regime, and 7.6 h under the 25 Hz regime. Moving from BAU to the 30 Hz regime therefore adds roughly two and a half hours of operation each day, with the associated labor, electricity, and maintenance exposure, and may exceed the working day at a plant of this size. None of this is captured in the gross revenue comparison of Section 2.4. Any operating decision that follows from the present results must therefore treat the intermediate regime as a candidate whose additional operating cost has not yet been quantified.
The fourth implication is that intermediate operations may be more useful than operations at either extreme. Under the observed operating conditions and price assumptions, the 30 Hz regime showed the highest recyclable recovery and the highest estimated total gross direct revenue, while maintaining a moderate RDF fraction. However, this result should be considered indicative, as further replicated trials with well-characterized input waste are needed to confirm the finding. This should be treated as a candidate operating window for further testing, not as a definitive optimum.
The fifth implication is the need to monitor input waste. Basic truck-level observations, including visible organic content, moisture condition, bagging, bulky material, glass content, and plastic-rich fractions, would help distinguish operational effects from feedstock effects. Without input characterization, a plant may incorrectly attribute output changes to machine settings when they are partly caused by truckload composition. A minimal recording sheet for this purpose is proposed in Table S8 of the Supplementary Materials.
3.4. Transferability of the Findings and Directions for Further Work
The facility studied here is a single plant, and the numerical values reported are specific to it and to four short trials. What can reasonably be transferred is not the values but the structure of the result. The plant belongs to a recognizable class: a full-scale municipal line receiving unsorted mixed MSW, relying on a trommel and manual picking rather than on automated optical or density separation, operating without gate-level input characterization, and selling both RDF and sorted recyclables into local markets. Plants of this type are common in Thailand and in comparable middle-income settings, and for them the operational question addressed here, namely what a change in front-end machine speed does to the whole output portfolio rather than to throughput alone, is the same question.
Three elements of the result are expected to hold more widely than the numbers. First, RDF mass and RDF stream cleanliness were inversely related, so a single RDF-yield target is an insufficient control variable. Second, the recovered recyclable stream and the recyclable content of the residual stream moved independently, so recovery statistics alone overstate sorting performance. Third, the residual-disposal methane-generation indicator followed the residual stream and not the machine setting, so an operating change that improves one output can worsen the disposal burden. Each of these is a structural relation between streams and would be expected in any line where a single front-end adjustment alters both the loading and the presentation of material to a manual sorting section. Each nevertheless requires confirmation by replicated trials before it can be relied upon.
What the study does not establish is a universal inverter-frequency or throughput setting. The preferred regime will depend on the plant’s operating objective. A facility prioritizing RDF supply may tolerate a higher risk of contamination. A facility facing strict RDF acceptance criteria may prefer lower front-end frequency. A municipality prioritizing recyclable revenue or landfill diversion may prefer an intermediate regime, provided residual leakage is monitored.
For future work, replicated trials should be conducted across multiple operating days and seasons. Each regime should be repeated on several occasions and each trial extended well beyond the roughly ten minutes achievable here, so that within-regime variance can be estimated and the regimes compared statistically. Each truckload should be characterized before processing, and RDF samples should be analyzed for net calorific value, moisture, ash, chlorine, sulfur, and selected metals. A full LCA should then include upstream collection, electricity use, RDF substitution, recycling credits, residual landfill emissions over the relevant time horizon, and downstream transport. A full cost accounting covering labor, energy, maintenance, transport, and disposal should accompany it. These additions would allow the present exploratory evidence to be extended into a more rigorous optimization framework for inverter-controlled front-end operation.
4. Materials and Methods
4.1. Study Site and Operating Context
The study was conducted at a municipal mechanical waste treatment facility operated by the Kumpang Subdistrict Municipality in Satun Province, Thailand. The facility receives mixed MSW from regular municipal collection services. It was selected because it represents a full-scale operating plant rather than a pilot or laboratory system. This distinction matters for mixed-waste treatment because recovery performance is influenced by collection-route variability, the physical condition of waste at delivery, operator practice, equipment constraints, and the limited ability to standardize incoming loads [6,13,28,29,30,31].
The plant context is relevant to local decision-making. Municipal managers often need evidence from routine operation rather than from controlled experimental settings. The facility processes mixed residual waste and aims to recover RDF and recyclables, reducing the material sent to final disposal. The assessment, therefore, focused on system behavior under actual line operation, with the practical constraints that accompany municipal mixed-waste processing.
4.2. Mechanical Treatment Line and System Boundary
The treatment line considered in this study included the hopper (feeding point), bag opener, trommel, conveyors, manual sorting section, and wind-shifting section. All process equipment was designed and manufactured in-house by CRYPTON (1888) Co., Ltd., Mueang Nakhon Si Thammarat, Nakhon Si Thammarat Province, Thailand. Incoming waste was loaded into the hopper and transferred to the bag opener, where bagged material was mechanically opened to increase material exposure. The opened waste then passed through the trommel, which acted as the main screening unit. Conveyors transported the screened material through the downstream sorting area, where selected recyclables and bulky items were removed. A wind-shifting section directed lighter combustible material towards the RDF stream.
The trommel screen aperture, drum inclination, wind-shifter setting, magnetic separator setting, and conveyor operating settings were held constant throughout the experimental campaign at the values given below. The trommel screen had an aperture size of 100 mm and was installed at an inclination angle of 3°. The wind-shifter fan and magnetic separator were operated at 38 Hz and 10 Hz, respectively, while all transfer and sorting conveyors were operated at 14 Hz. The bag opener and trommel drive frequencies were the controlled variables of the campaign. The hopper frequency was also reduced at the two lower settings, as recorded in Table 3, in order to keep the feed to the line stable; all other units were unchanged.
The system boundary was defined as a gate-to-output boundary covering the mechanical separation line from mixed MSW entering the hopper to the four major output streams leaving the line. These streams were RDF, residual waste, recyclables, and bulky/loss material. The boundary was selected to evaluate the mechanical line’s operational performance. It did not include upstream collection, transport to the facility, downstream RDF utilization, recyclable reprocessing, electricity use, avoided fuel substitution, or avoided burdens from recycling.
The configuration of the mechanical treatment line and the main material-routing points are shown in Figure 8. The diagram is provided to clarify where the hopper, bag opener, trommel, wind-shifting section, and downstream output streams are located within the study boundary.
Figure 8.
Schematic representation of the municipal mechanical waste separation line. Source: prepared by the authors from the plant process layout and on-site observation.
The hopper belt speed setting is described in Section 4.3 and was not used as the main experimental control. The operating regimes were generated by adjusting the inverter frequencies of the motors driving the bag opener and trommel. These adjustments altered the front-end machine-speed conditions and resulted in different measured line throughputs. Other conveyors, belts, and downstream units were operated at fixed settings. Accordingly, nominal frequency was treated as the controlled front-end setting, while measured line throughput, expressed as metric tons per hour, was used as the operational descriptor linking machine-speed setting to material partitioning.
4.3. Field Trial Design and Inverter-Controlled Operating Regimes
Four inverter-controlled operating regimes were evaluated. The bag opener and trommel were operated at 50, 40, 30, and 25 Hz, respectively, while the feeding hopper belt speed was maintained within a narrow practical operating range. The hopper conveyor belt speed was estimated from the inverter frequency, assuming a rated motor speed of 1440 rpm at 50 Hz, a gearbox reduction ratio of 1:30, and a drive roller diameter of 0.25 m. The calculated hopper belt speeds were 0.154, 0.154, 0.115, and 0.101 m·s−1 at inverter frequencies of 12.26, 12.26, 9.14, and 8.06 Hz, respectively. For both the 50 Hz and 40 Hz operating conditions, the hopper frequency was kept constant in this study. These values were used only to describe the hopper-feeding condition; measured line throughput was determined from the processed mass and processing time.
Under these front-end settings, the measured line throughputs were 14.75, 13.45, 8.03, and 6.54 t·h−1, respectively. The 40 Hz condition, corresponding to 13.45 t·h−1, represented the business-as-usual (BAU) operation used by the facility during the assessment period. This setting was designated as BAU because it is the frequency at which the plant routinely operates the bag opener and trommel outside test conditions; it was not selected on the basis of the results reported here. The reported t·h−1 values should therefore be interpreted as measured line throughputs resulting from inverter-based bag opener and trommel adjustment, rather than as independently imposed hopper feeding rates.
Each regime consisted of a single continuous trial performed on a separate operating occasion. The processed mass ranged from 1.38 to 2.33 t and the corresponding trial duration from 0.158 to 0.211 h, that is, between approximately 9.5 and 12.7 min of continuous line operation per regime (Table 3). The trials were short because changing the inverter frequency requires the line to be stopped, and because each of the four output streams had to be diverted, collected, and weighed separately while the plant remained in service. The duration of each trial was therefore set by the practical constraints of operating a working municipal facility rather than by an experimental design. This is a material limitation on the weight that can be placed on the results, and it is the reason the findings are presented throughout as preliminary observations from four single trials.
The wind-shifting section was kept at fixed operating settings during all trials. Therefore, its role in directing the combustible fraction was considered constant from a design perspective. However, changes in the front-end inverter frequency are expected to alter the characteristics of the material entering the wind-shifter, particularly its composition and particle-size distribution. These changes may have influenced RDF yield and contamination under different operating regimes. Since this effect could not be isolated within the scope of this study, future studies should include mid-line sampling points to better evaluate this interaction.
The trials were conducted under routine municipal operating conditions. Incoming loads were not homogenized before feeding, and each operating regime was tested using waste from different collection vehicles. The design, therefore, reflects a practical full-scale operational assessment rather than a controlled experiment with standardized input composition. This constraint was deliberately retained in the interpretation because it mirrors the conditions under which municipal plants normally make operating decisions.
The recorded operating conditions for each regime, including the machine settings, the processed mass, the trial duration, the resulting measured throughput, and the manual sorting staffing, are summarized in Table 3.
4.4. Measurement Procedure, Weighing, and Sampling
For each regime the four output streams were diverted at their discharge points and collected separately for the whole duration of the trial. Each collected stream was then weighed, and a sub-sample of each stream was taken for manual composition sorting.
Weighing procedure. Incoming waste was quantified using the facility weighbridge, equipped with a Commandor HP-06 weighing indicator (Advance Solution International Co., Ltd., Mueang Samut Sakhon, Thailand). The weighbridge had a maximum capacity of 50,000 kg and a reported minimum load of 1 kg. Calibration checks showed no observable difference between the applied reference loads and the corresponding indicated values. Each loaded waste-collection vehicle was weighed on arrival to determine its gross mass. After unloading, the empty vehicle was weighed again to obtain the tare mass. The net mass of incoming waste was calculated as the difference between the gross and tare masses.
The masses of the output streams and of the manually sorted fractions were measured using a portable electronic hanging scale (SY-8088, SIYOL Scale India/Ramsnahey Enterprises (Jodhpur, India)) with a maximum capacity of 200 kg, a minimum load of 0.5 kg, and a readability of 0.05 kg. Before each measurement the tare function was applied to exclude the mass of the weighing container or collection bag, and the net mass displayed was recorded for each output stream and for each fraction obtained during the composition analysis.
Line clearing and retained material. The sorting line was cleared between operating regimes to prevent carryover of material from one regime to the next. Material remaining along the line after each cleaning period, including spilled material and oversized items retained within the equipment, was collected and weighed, and was assigned to the bulky/loss stream. The four output streams therefore sum to 100% of the processed input under every regime because this material was recovered and allocated rather than because it was assumed to be zero.
Composition sampling. For each operating regime, one representative composite sample was taken from each output stream after the total mass of that stream had been recorded. For the RDF and residual streams, the material was reduced by coning and quartering until a composite sample of at least 100 kg was obtained, in accordance with the waste-composition sampling guidelines issued by the Pollution Control Department of Thailand. For the RDF stream, increments were taken from five locations within the quartered pile, four around the perimeter and one at the top center, and combined into the composite sample. The recyclable and bulky/loss streams were sorted in their entirety rather than sub-sampled, because the total mass of each of these streams was below the 100 kg sub-sampling threshold in most regimes. The mass of each stream under each regime is given in Table S2 of the Supplementary Materials.
Manual sorting was carried out by researchers and graduate students experienced in the characterization of municipal solid waste and refuse-derived fuel. Duplicate sorting was not performed. Quality control comprised the consistent application of the same sorting categories and procedure across all regimes, verification of the scale readings, and mass reconciliation in which the summed mass of the sorted fractions was compared with the initial mass of the composite sample. Any discrepancy was investigated by inspecting the sorting area for uncollected material and by rechecking the recorded masses.
Basis of reporting. All composition and yield values are reported on a wet, as-received mass basis. Moisture content was not measured for any output stream, so the results cannot be converted to a dry-mass basis.
Staffing and interruptions. Six manual sorting operators were present during every operating regime, positioned along the sorting conveyor for recyclable recovery. Their number and positions were unchanged across all four regimes, so staffing is not a source of variation between the regimes and does not confound the recyclable results. No interruption, material blockage, or equipment downtime was recorded during any of the trials.
4.5. Material Flow Measurement and Output Classification
Measured line throughput was defined as the actual mass of MSW processed by the line per unit time under each inverter-controlled front-end setting. The four output streams were measured and expressed as proportions of total input. The RDF stream represented the combustible fraction directed to fuel recovery. The residual stream represented material remaining for disposal after mechanical separation. The recyclable stream consisted of recovered, saleable materials, including plastics, metals, and glass. The bulky/loss stream represented oversized, non-processable, or otherwise removed material that was not routed to the other three streams. In this facility the bulky/loss stream consists mainly of items removed by hand at the hopper before the bag opener, such as furniture, mattresses, tyres, construction debris, and long textile or rope material capable of wrapping the trommel drive. It is a physically removed stream, not a residual calculated by difference, and it is not sent to the RDF or recyclable pathways.
Composition analysis followed the waste component sorting procedure used for disposal-site waste characterization by the Pollution Control Department of Thailand. Sorted materials were grouped according to the categories of the Intergovernmental Panel on Climate Change (IPCC) for waste composition, including food waste, garden waste, paper and cardboard, wood, textiles, nappies, rubber and leather, plastics, metals, glass, and other inert materials. This grouping was appropriate for the study objective because the analysis focused on material partitioning, residual burden, and composition-based indicators rather than detailed fuel chemistry.
4.6. Composition-Related Performance Indicators
Two composition-related indicators were derived from field sorting data. First, contamination in the RDF stream was used as an indicator of the stream’s apparent cleanliness. Contamination included unwanted non-combustible or wet material that may reduce the suitability of the RDF stream for downstream handling or use, such as organic-rich material, soil, glass, metals, inert fractions, and other impurities [32]. Second, recyclable material remaining in the residual stream was used as an indicator of recyclable leakage. This indicator represents recoverable material that was not captured by the line and was instead routed towards disposal.
Both indicators are ratios of sorted masses and are defined explicitly as follows. Composition-based RDF contamination is the mass of non-target components identified by sorting within the RDF stream, divided by the total mass of the RDF stream sampled under the same regime, expressed as a percentage. Its denominator is therefore the RDF stream itself and not the plant input. Recyclable leakage is the mass of plastic, metal, and glass identified by sorting within the residual stream, divided by the total mass of the residual stream sampled under the same regime, expressed as a percentage. Its denominator is the residual stream and not the plant input. By contrast, the yields in Section 2.1, including recyclable recovery, are expressed as percentages of the total processed input. The two families of indicator therefore have different denominators and must not be added or directly compared.
These indicators should be interpreted within their measurement boundary. RDF suitability is usually determined by fuel properties such as net calorific value, moisture, ash, chlorine, sulfur, and selected metals, as well as composition [33,34,35,36,37,38]. Because these properties were not measured, the RDF contamination indicator does not represent formal RDF quality classification. It indicates only the observable compositional cleanliness of the RDF stream. For this reason, the term composition-based contamination is used throughout, and the terms RDF quality, fuel quality, and cleaner fuel are avoided when describing the present results.
4.7. Data Normalization
To compare operating conditions with different measured line throughputs, output yields were normalized to the total waste input processed under each regime. The normalized yield of output stream i was calculated as:
where Yi is the normalized yield of output stream i (% of input), Mi is the measured mass flow of output stream i (t·h−1), and Min is the measured incoming mass flow processed by the line under each operating regime (t·h−1). Normalized yields are reported as percentages of total waste input on a wet, as-received mass basis.
Yi = (Mi/Min) × 100
4.8. Economic and Residual-Disposal-Related CH4 Generation Assessment
The gross-revenue and residual-disposal methane assessments were both conducted on a one-day operating basis, using a fixed incoming waste quantity of 50 t·day−1, which represents the plant’s operating condition during the assessment period. The one-day basis is a normalization device that places the four regimes on a common footing; the results are not scaled to a month or a year, and no annualization of any kind is applied. Because each regime was observed for approximately ten minutes, extrapolating even to one full operating day already assumes that the observed partitioning would persist, and that assumption should be treated as provisional. The daily quantity of each output stream was estimated from the normalized yield:
where Qi is the daily quantity of output stream i (t·day−1), and 50 is the fixed daily incoming MSW amount (t·day−1).
Qi = 50 × (Yi/100)
Daily gross direct revenue was estimated from RDF sales and recyclable sales. Compost revenue was excluded because the available composting capacity was insufficient in practice, and the organic-rich residual fraction was managed as residual material rather than as a marketable compost product. The revenue estimate was calculated as:
where R is total daily gross direct revenue (THB·day−1; THB, Thai baht), QRDF is the daily RDF quantity (t·day−1), PRDF is the local RDF selling price (THB·t−1), Qrec,j is the daily quantity of recyclable material j (kg·day−1), and Prec,j is the local selling price of recyclable material j (THB·kg−1).
R = (QRDF × PRDF) + Σ(Qrec,j × Prec,j)
The unit prices applied were those obtainable locally at the time of the assessment: RDF 80 THB·t−1; polyethylene terephthalate (PET) 8 THB·kg−1; mixed plastic 5 THB·kg−1; milk can 4 THB·kg−1; steel 9 THB·kg−1; aluminum can 40 THB·kg−1; thin aluminum 40 THB·kg−1; and glass 1.2 THB·kg−1. The same price basis was applied to every regime so that the comparison reflects differences in recovered material and not differences in price. These prices are also listed, with the derived quantities, in Tables S4 and S5 of the Supplementary Materials.
Equation (3) yields gross direct revenue from material sales only. It is not a measure of the economic performance of the facility, and it must not be read as a margin, a profit, or a net benefit. No cost term of any kind is included. In particular, the estimate excludes the labor cost of the manual sorting section, electricity consumption by the line, fuel and transport cost for delivering RDF and recyclables to buyers, equipment maintenance and spare parts, the gate fee or haulage cost of sending the residual fraction to disposal, and the cost of the additional operating hours required at reduced throughput. Several of these terms vary systematically between the regimes rather than being constant, so a full economic comparison could order the regimes differently from the gross direct revenue reported here. In particular, because the measured throughput differs by more than a factor of two across the regimes, labor hours, electricity consumption, equipment utilization, maintenance requirement, and total operating hours would all differ substantially, and all of them fall outside the present calculation. Every comparison of the regimes reported in this study is therefore a comparison of gross direct revenue and not of economic performance. The comparison is presented because it is the part of the economic picture that the field measurements support, not because it is sufficient.
The organic-rich residual fraction disposed of in landfill may generate CH4 emissions through anaerobic degradation. Accordingly, CH4 associated with residual disposal was estimated following the 2019 Refinement to the 2006 IPCC Guidelines for National Greenhouse Gas (GHG) Inventories (Vol. 5, Chapter 3) [39]. In this study, CH4 generation potential was estimated using the quantity and composition of residual waste generated from one day of facility operation.
Three quantities must be distinguished. The CH4 generation potential, Lo, is the mass of methane that the deposited degradable organic carbon could ultimately generate; it is the quantity reported in this study, in tonnes of CH4 per operating day. Actual methane emission is smaller and is distributed over decades; it depends on the first-order decay rate, on the fraction captured by any gas collection system, and on oxidation in the landfill cover, none of which were applied here. Carbon dioxide equivalent values require multiplication by a global warming potential and are not reported at all in this study. The values in Section 2.5 are therefore generation potentials, not emissions, and not CO2-equivalent figures; they support relative comparison between regimes and nothing further.
The assessment included only CH4 generation potential (Lo) associated with residual waste disposal, excluding avoided emissions from RDF substitution, avoided recycling burdens, transport emissions, electricity consumption, and downstream RDF combustion. The CH4 generation results, therefore, represent a partial residual-disposal indicator rather than a full life cycle GHG balance. The residual composition used in the calculation is given in Table 2, and the complete set of IPCC default parameters applied, namely the component-specific degradable organic carbon values, DOCf, MCF, and F, together with the disposal-site assumption, is given in Table S7 of the Supplementary Materials.
where DDOCm is the mass of decomposable degradable organic carbon (DOC) deposited, W is the mass of waste deposited, DOC is the degradable organic carbon in the year of deposition (fraction), DOCf is the fraction of DOC that can decompose (fraction), and MCF is the CH4 correction factor for decomposition in the year of deposition (fraction).
where Lo is the CH4 generation potential, F is the fraction of CH4 in generated landfill gas, and 16/12 is the molecular weight ratio of CH4 to C.
DDOCm = W × DOC × DOCf × MCF
Lo = DDOCm × F × 16/12
Each operating condition was compared with the BAU condition as follows:
where ΔXk is the percentage change in indicator X for operating condition k relative to BAU, Xk is the value under condition k, and XBAU is the value under the 13.45 t·h−1 BAU condition.
ΔXk = [(Xk − XBAU)/XBAU] × 100
4.9. Analytical Approach and Interpretation Boundary for the Results
The analytical approach was descriptive and comparative. It examined trends across inverter-controlled operating regimes, partitioning among output streams, and apparent trade-offs among material recovery, stream cleanliness, gross direct revenue, and the residual-disposal methane-generation indicator. No statistical analysis was performed and none is possible with these data. Each regime was observed once, so there is no within-regime variance, no standard deviation, no confidence interval, and no basis for a significance test between regimes. Differences between regimes are therefore reported as observed differences and are never described as significant. Any apparent ordering of the regimes could be reproduced by feedstock variation alone, and the study cannot exclude that possibility. Where the text offers a physical explanation for an observed difference, for example in terms of bed thickness, material presentation, or sorting opportunity, that explanation is a candidate mechanism proposed for future testing. Such explanations are consistent with the observations but are not supported by them, because the study included no feedstock characterization, no replication, and no measurement at intermediate points along the line.
Several features of the field campaign define how the results in Section 2 and Section 3 should be read. First, each operating regime was evaluated using waste from different collection vehicles, and incoming waste was not homogenized or characterized before processing. The design, therefore, does not isolate inverter frequency, front-end machine speed, or measured throughput as a single causal variable. Second, the regimes were not replicated, which prevents statistical assessment of repeatability and uncertainty. Third, RDF properties, including calorific value, moisture, ash, chlorine, sulfur, and metals, were not measured. Fourth, the trials covered a short operational window, approximately ten minutes of line operation per regime, and cannot represent seasonal variation or day-to-day variability. Fifth, the assessment of returns was limited to gross direct revenue from RDF and recyclables, and the GHG assessment was limited to methane generation potential associated with residual waste disposal.
These constraints do not remove the operational value of the results, but they narrow the claims that can be made. The study documents how a full-scale municipal line behaved under realistic mixed-waste conditions. It should not be read as a controlled optimization experiment or as a basis for universal inverter-frequency or throughput prescriptions.
5. Conclusions
This study assessed material partitioning under inverter-controlled front-end operation at a full-scale municipal mechanical waste treatment facility processing mixed MSW in Satun Province, Thailand. Four operating regimes were generated by adjusting the inverter frequencies of the bag opener and trommel, giving measured line throughputs of 14.75, 13.45, 8.03, and 6.54 t·h−1. Each regime was a single trial of roughly ten minutes applied to a different delivered load. Output partitioning among RDF, residual waste, recyclables, and bulky/loss material differed markedly across the four regimes, and the differences were not monotonic.
RDF yield was highest under the 50 Hz regime, at 42.06% of input, although the same regime showed the highest composition-based contamination of the RDF stream, at 31.38%. Under the 25 Hz regime, contamination fell to 10.39%, while RDF yield declined to 18.12% and the residual fraction rose to 65.22%. Recyclable recovery was highest under the 30 Hz regime, at 4.95% of input, and that regime also returned the highest estimated gross direct revenue under the observed price assumptions, mainly through recyclable sales, although no cost term was included and the comparison is therefore one of gross direct revenue rather than of economic performance. The residual-disposal methane-generation indicator followed a different pattern: relative to the 13.45 t·h−1 business-as-usual regime, the methane generation potential of the residual stream was 7.78% higher under the lowest-throughput regime.
No single regime performed best on every criterion. RDF mass alone is therefore an inadequate basis for selecting a front-end setting, and operators are better served by an integrated indicator set covering RDF yield, RDF contamination, recovered recyclables, recyclable leakage, residual fraction, gross direct revenue, and residual-disposal-related methane generation potential.
These conclusions are preliminary. Each regime was a single unreplicated trial of approximately ten minutes applied to waste from a different set of collection vehicles; incoming loads were neither homogenized nor characterized; RDF properties were not measured; and no cost term was included in the revenue estimate. No statistical comparison between regimes is possible from these data. The differences reported here reflect the combined influence of front-end setting and feedstock composition and cannot be attributed to the machine setting alone, which also limits transferability to other plants. The study nevertheless provides a field record of how a municipal mechanical separation line behaved under realistic mixed-MSW operating conditions, and identifies the intermediate regime as a candidate for the replicated testing that would be needed to establish an operating recommendation.
Supplementary Materials
The following supporting information can be downloaded at: https://www.mdpi.com/article/10.3390/recycling11080150/s1, Text S1: Field-trial control and interpretation boundary; Text S2: Measurement, weighing, and sampling procedure; Text S3: Material-flow normalization and daily output estimation; Text S4: Economic and residual-disposal-related GHG assessment boundary; Text S5: Equations for CH4 generation estimation; Table S1: Operating conditions and trial record; Table S2: Normalized output partitioning and estimated daily output quantities; Table S3: Composition-based indicators, definitions, and interpretation limits; Table S4: Economic parameters and unit prices used in the gross direct revenue assessment; Table S5: Estimated daily recyclables output quantities; Table S6: Methane generation assessment scope and parameter reference; Table S7: IPCC default values used in the CH4 generation estimate; Table S8: Recommended truck-level input monitoring sheet for future replicated trials.
Author Contributions
Conceptualization, S.S.R. and K.W.; methodology, S.S.R., N.S. and K.W.; investigation, S.S.R., S.S. and A.B.; formal analysis, S.S.R.; data curation, S.S.R.; writing—original draft preparation, S.S.R.; writing—review and editing, N.S., S.T., S.P., T.S., S.S., A.B. and K.W.; visualization, S.S.R.; supervision, K.W.; funding acquisition, K.W. All authors have read and agreed to the published version of the manuscript.
Funding
This research was funded by the Petchra Pra Jom Klao Master’s Degree Scholarship from King Mongkut’s University of Technology Thonburi (KMUTT); the Joint Graduate School of Energy and Environment (JGSEE); the Center of Excellence on Energy Technology and Environment (CEE), PERDO; the Program Management Unit for Area-Based Development (PMU-A); the Ministry of Higher Education, Science, Research and Innovation (MHESI); and Thailand Science Research and Innovation (TSRI) through the National Science, Research and Innovation Fund (NSRF), fiscal year 2024, grant number FRB670016/0164.
Data Availability Statement
The original contributions presented in this study are included in the article and Supplementary Materials. Further inquiries can be directed to the corresponding author, subject to municipal data-sharing approval.
Acknowledgments
The authors thank Kumpang Subdistrict Municipality and the facility management team for site access, operational support, and collaboration during the fieldwork. During the preparation of this manuscript, the authors used ChatGPT 5.6 (OpenAI) for language editing to improve the clarity and readability of the text. The tool was not used to generate, collect, analyze, or interpret any data, to produce any figure or table, or to design the study. All output was reviewed and edited by the authors. The authors reviewed and edited all output and take full responsibility for the content of this article.
Conflicts of Interest
The authors declare that they have no known competing financial interests or personal relationships that could have appeared to influence the work reported in this paper.
References
- Eid, M.; Albizzati, P.F.; Dolci, G.; Rigamonti, L.; Tonini, D.; Grosso, M. Unlocking value from residual municipal waste: A primary data analysis of recovery rates and costs. Waste Manag. 2026, 216, 115472. [Google Scholar] [CrossRef] [Scilit]
- Zahir, B.H.M.; Nurcahyo, R.; Farizal; Wibowo, A.D. Economic assessment of refuse-derived fuel (RDF) production as a waste management strategy and alternative fuel in cement kilns. J. Law Sustain. Dev. 2024, 12, e3220. [Google Scholar] [CrossRef] [Scilit]
- Grzesik, K.; Malinowski, M. Life cycle assessment of mechanical–biological treatment of mixed municipal waste. Environ. Eng. Sci. 2017, 34, 207–220. [Google Scholar] [CrossRef] [Scilit]
- Nanda, S.; Berruti, F. Municipal solid waste management and landfilling technologies: A review. Environ. Chem. Lett. 2021, 19, 1433–1456. [Google Scholar] [CrossRef] [Scilit]
- Zhang, Z.; Chen, Z.; Zhang, J.; Liu, Y.; Chen, L.; Yang, M.; Osman, A.I.; Farghali, M.; Liu, E.; Hassan, D.; et al. Municipal solid waste management challenges in developing regions: A comprehensive review and future perspectives for Asia and Africa. Sci. Total Environ. 2024, 930, 172794. [Google Scholar] [CrossRef] [Scilit] [PubMed]
- Gadaleta, G.; De Gisi, S.; Todaro, F.; Notarnicola, M. Environmental comparison of different mechanical–biological treatment plants by combining life cycle assessment and material flow analysis. Clean Technol. 2022, 4, 380–394. [Google Scholar] [CrossRef] [Scilit]
- Bień, J. Production and use of waste-derived fuels in Poland: Current status and perspectives. Prod. Eng. Arch. 2021, 27, 36–41. [Google Scholar] [CrossRef] [Scilit]
- Ferronato, N.; Calle Mendoza, I.J.; Marconi Siñani, N.G.; Gorritty Portillo, M.A.; Torretta, V. Perspectives in solid recovered fuel production in Bolivia: Analysis of characteristics and potential benefits. Waste Manag. 2022, 144, 324–335. [Google Scholar] [CrossRef] [Scilit] [PubMed]
- Lombardi, F.; Zingaretti, D.; Verginelli, I.; Costa, G. Optimization of the biostabilization process of an Italian mechanical–biological treatment plant to account for changes in waste composition. Waste Biomass Valorization 2022, 13, 3787–3800. [Google Scholar] [CrossRef] [Scilit]
- Velis, C.A.; Longhurst, P.J.; Drew, G.H.; Smith, R.; Pollard, S.J.T. Production and quality assurance of solid recovered fuels using mechanical–biological treatment (MBT) of waste: A comprehensive assessment. Crit. Rev. Environ. Sci. Technol. 2010, 40, 979–1105. [Google Scholar] [CrossRef] [Scilit]
- Cimpan, C.; Maul, A.; Jansen, M.; Pretz, T.; Wenzel, H. Central sorting and recovery of MSW recyclable materials: A review of technological state-of-the-art, cases, practice and implications for materials recycling. J. Environ. Manag. 2015, 156, 181–199. [Google Scholar] [CrossRef] [Scilit] [PubMed]
- Rotter, V.S.; Kost, T.; Winkler, J.; Bilitewski, B. Material flow analysis of RDF-production processes. Waste Manag. 2004, 24, 1005–1021. [Google Scholar] [CrossRef] [Scilit] [PubMed]
- Montejo, C.; Tonini, D.; Márquez, M.C.; Astrup, T.F. Mechanical–biological treatment: Performance and potentials. An LCA of eight MBT plants including waste characterization. J. Environ. Manag. 2013, 128, 661–673. [Google Scholar] [CrossRef] [Scilit] [PubMed]
- Velis, C.A.; Wagland, S.; Longhurst, P.; Robson, B.; Sinfield, K.; Wise, S.; Pollard, S. Solid recovered fuel: Materials flow analysis and fuel property development during the mechanical processing of biodried waste. Environ. Sci. Technol. 2013, 47, 2957–2965. [Google Scholar] [CrossRef] [Scilit] [PubMed]
- Ng, K.S.; Phan, A.N.; Iacovidou, E.; Wan Ab Karim Ghani, W.A. Techno-economic assessment of a novel integrated system of mechanical–biological treatment and valorisation of residual municipal solid waste into hydrogen: A case study in the UK. J. Clean. Prod. 2021, 298, 126706. [Google Scholar] [CrossRef] [Scilit]
- Chavando, J.A.M.; Silva, V.B.; Tarelho, L.A.C.; Cardoso, J.S.; Eusébio, D. Snapshot review of refuse-derived fuels. Util. Policy 2022, 74, 101316. [Google Scholar] [CrossRef] [Scilit]
- Muttaraid, A.; Towprayoon, S.; Chiemchaisri, C.; Silalertruksa, T.; Wangyao, K. Optimizing landfill mining operations: A comparative analysis of material flow and cost–benefit assessment for medium- and large-scale sites. J. Mater. Cycles Waste Manag. 2024, 26, 830–844. [Google Scholar] [CrossRef] [Scilit]
- Makovetska, Y.; Omelianenko, T.; Omelchenko, A. Prospects for environmentally safe mechanical–biological treatment of municipal solid waste in Ukraine. E3S Web Conf. 2021, 255, 01002. [Google Scholar] [CrossRef] [Scilit]
- Phyu, Z.Y.; Phongphiphat, A.; Muttaraid, A.; Wangyao, K.; Towprayoon, S. Flows of plastic, energy and carbon in a mechanical treatment plant for refuse-derived fuel production from landfill-mined waste. J. Clean. Prod. 2024, 452, 142065. [Google Scholar] [CrossRef] [Scilit]
- Ngamket, K.; Wangyao, K.; Patumsawad, S.; Chaiwiwatworakul, P.; Towprayoon, S. Quality improvement of mixed MSW drying using a pilot-scale solar greenhouse biodrying system. J. Mater. Cycles Waste Manag. 2021, 23, 436–448. [Google Scholar] [CrossRef] [Scilit]
- Gerassimidou, S.; Velis, C.A.; Williams, P.T.; Castaldi, M.J.; Black, L.; Komilis, D. Chlorine in waste-derived solid recovered fuel (SRF), co-combusted in cement kilns: A systematic review of sources, reactions, fate and implications. Crit. Rev. Environ. Sci. Technol. 2021, 51, 140–186. [Google Scholar] [CrossRef] [Scilit]
- Sharma, P.; Sheth, P.N.; Mohapatra, B.N. Recent progress in refuse-derived fuel (RDF) co-processing in cement production: Direct firing in kiln/calciner versus process integration of RDF gasification. Waste Biomass Valorization 2022, 13, 4347–4374. [Google Scholar] [CrossRef] [Scilit]
- Zhang, X.; Liu, C.; Chen, Y.; Zheng, G.; Chen, Y. Source separation, transportation, pretreatment and valorization of municipal solid waste: A critical review. Environ. Dev. Sustain. 2022, 24, 11471–11513. [Google Scholar] [CrossRef] [Scilit] [PubMed]
- Bernat, K.; Wojnowska-Baryła, I.; Zaborowska, M.; Samul, I. Insight into the composition of the stabilized residual from a full-scale mechanical–biological treatment (MBT) plant in terms of the potential recycling and recovery of its contaminants. Sustainability 2021, 13, 5432. [Google Scholar] [CrossRef] [Scilit]
- Iacovidou, E.; Hahladakis, J.N.; Purnell, P. A systems thinking approach to understanding the challenges of achieving the circular economy. Environ. Sci. Pollut. Res. 2021, 28, 24785–24806. [Google Scholar] [CrossRef] [Scilit] [PubMed]
- Cheela, V.R.S.; John, M.; Dubey, B. Quantitative determination of energy potential of refuse-derived fuel from waste recovered from an Indian landfill. Sustain. Environ. Res. 2021, 31, 24. [Google Scholar] [CrossRef] [Scilit]
- Zhang, Y.; Kusch-Brandt, S.; Gu, S.; Heaven, S. Particle size distribution in municipal solid waste pre-treated for bioprocessing. Resources 2019, 8, 166. [Google Scholar] [CrossRef] [Scilit]
- Tanguay-Rioux, F.; Provost-Savard, A.; Spreutels, L.; Héroux, M.; Legros, R. A method for assessing the performance of sorting unit operations in a material recovery facility based on waste characterizations. Can. J. Chem. Eng. 2022, 100, 2572–2586. [Google Scholar] [CrossRef] [Scilit]
- Perera, J.S.; Baduge, S.K.; Chandrathilaka, E.R.K.; Thilakarathna, S.; Palle, T.S.; Amado, A.M.; Mendis, P. Enhancing the efficiency of plastic recovery facilities: Systematically integrating seasonal and regional variations of municipal solid recyclable waste through infeed management. Waste Manag. 2025, 193, 261–272. [Google Scholar] [CrossRef] [Scilit] [PubMed]
- Farooq, A.; Haputta, P.; Gheewala, S.H. Economic feasibility assessment of waste-to-energy technologies for the development of a sustainable municipal solid waste management system in Thailand. Renew. Energy 2024, 233, 121155. [Google Scholar] [CrossRef] [Scilit]
- Mor, S.; Ravindra, K. Municipal solid waste landfills in lower- and middle-income countries: Environmental impacts, challenges and sustainable management practices. Process Saf. Environ. Prot. 2023, 174, 510–530. [Google Scholar] [CrossRef] [Scilit]
- Bhatsada, A.; Patumsawad, S.; Itsarathorn, T.; Towprayoon, S.; Chiemchaisri, C.; Phongphiphat, A.; Wangyao, K. Improvement of energy recovery potential of wet-refuse-derived fuel through bio-drying process. J. Mater. Cycles Waste Manag. 2023, 25, 637–649. [Google Scholar] [CrossRef] [Scilit] [PubMed]
- Ranieri, E.; Ionescu, G.; Fedele, A.; Palmieri, E.; Ranieri, A.C.; Campanaro, V. Sampling, characterisation and processing of solid recovered fuel production from municipal solid waste: An Italian plant case study. Waste Manag. Res. 2017, 35, 890–898. [Google Scholar] [CrossRef] [Scilit] [PubMed]
- Āriņa, D.; Bendere, R.; Denafas, G.; Kalnačs, J.; Kriipsalu, M. Characterization of refuse-derived fuel production from municipal solid waste: The case studies in Latvia and Lithuania. Environ. Clim. Technol. 2020, 24, 112–118. [Google Scholar] [CrossRef] [Scilit]
- Santos, S.M.; Nobre, C.; Brito, P.; Gonçalves, M. Brief overview of refuse-derived fuel production and energetic valorization: Applied technology and main challenges. Sustainability 2023, 15, 10342. [Google Scholar] [CrossRef] [Scilit]
- Domingo, N.; Luo, H. Canterbury earthquake construction and demolition waste management: Issues and improvement suggestions. Int. J. Disaster Risk Reduct. 2017, 22, 130–138. [Google Scholar] [CrossRef] [Scilit]
- Sarc, R.; Lorber, K.E. Production, quality and quality assurance of refuse-derived fuels (RDFs). Waste Manag. 2013, 33, 1825–1834. [Google Scholar] [CrossRef] [Scilit] [PubMed]
- Di Lonardo, M.C.; Franzese, M.; Costa, G.; Gavasci, R.; Lombardi, F. The application of SRF versus RDF classification and specifications to the material flows of two mechanical–biological treatment plants of Rome: Comparison and implications. Waste Manag. 2016, 47, 195–205. [Google Scholar] [CrossRef] [Scilit] [PubMed]
- Towprayoon, S.; Ishigaki, T.; Chiemchaisri, C.; Abdel-Aziz, A.O.; Hunstone, M.E.; Jarusutthirak, C.; Ritzkowski, M.; Thomsen, M. Solid waste disposal. In 2019 Refinement to the 2006 IPCC Guidelines for National Greenhouse Gas Inventories; IPCC: Geneva, Switzerland, 2019; Volume 5. [Google Scholar]
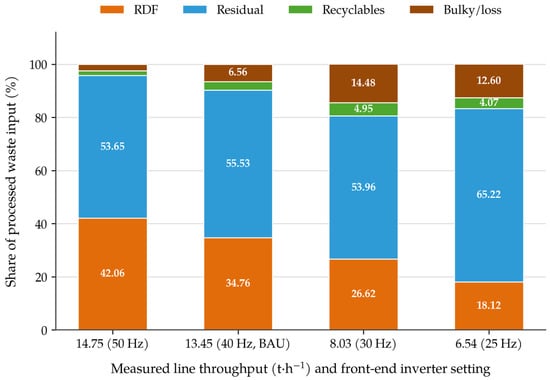
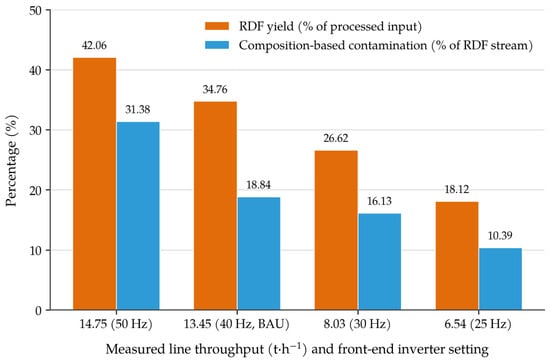
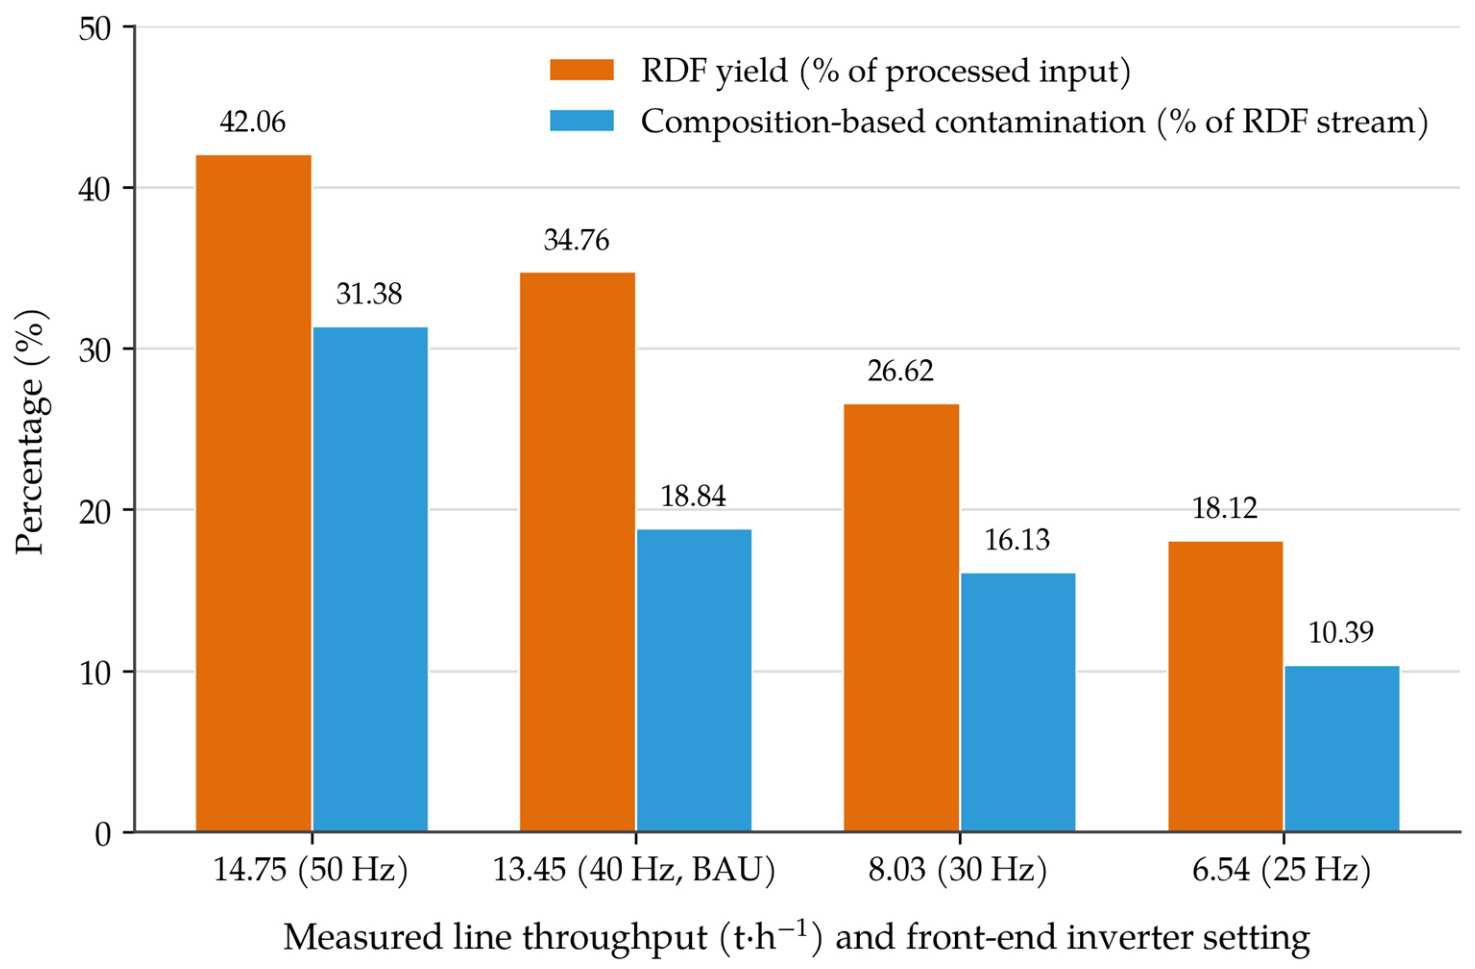
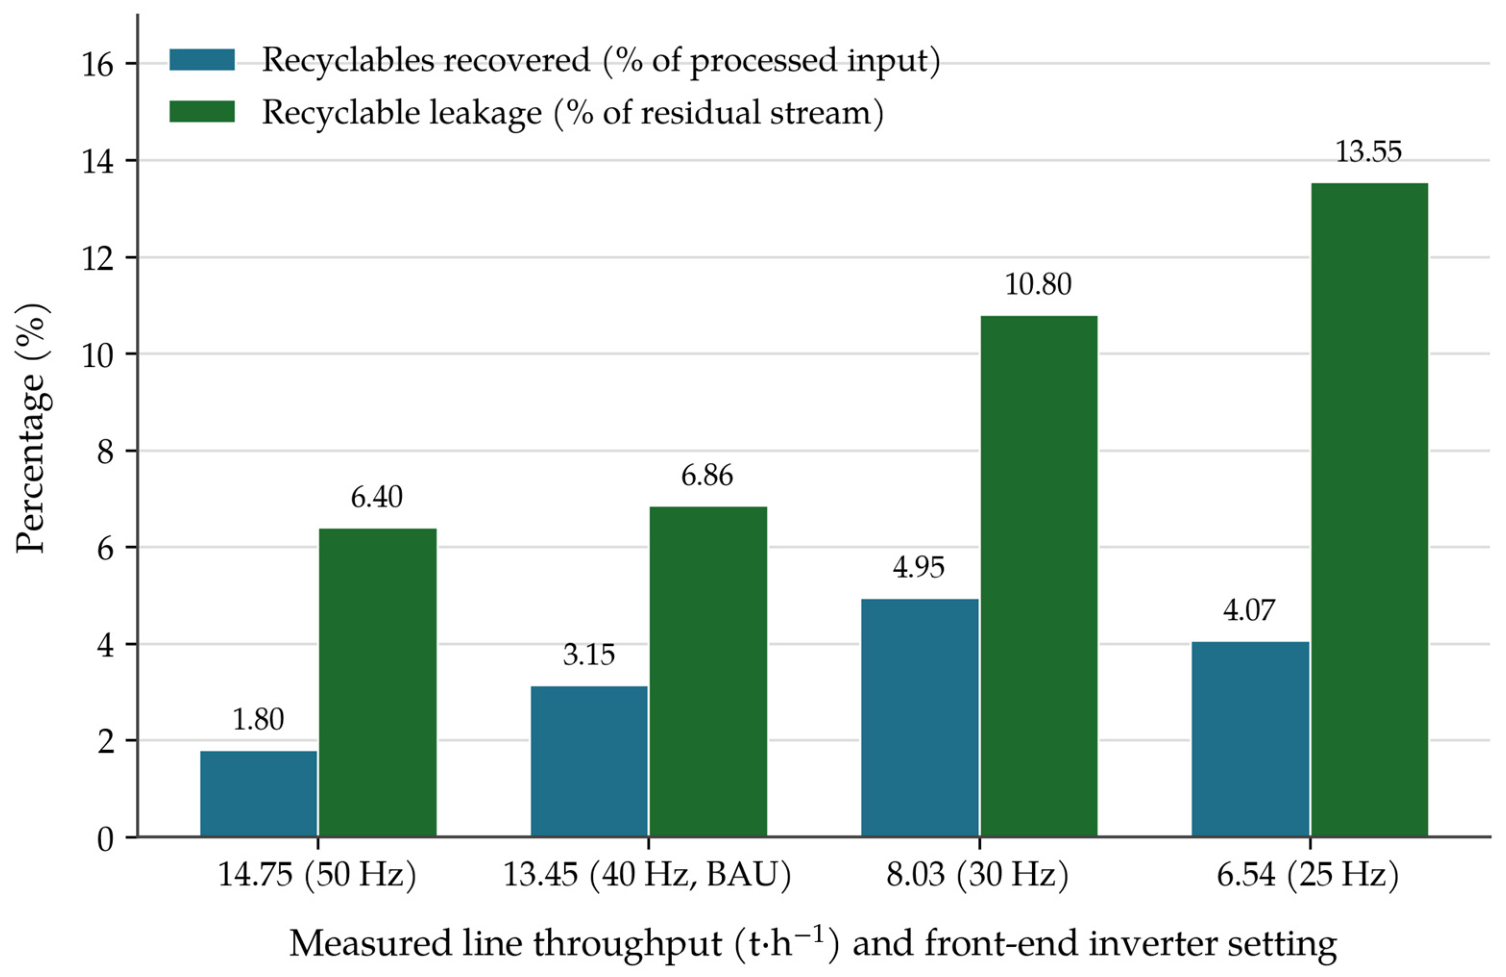
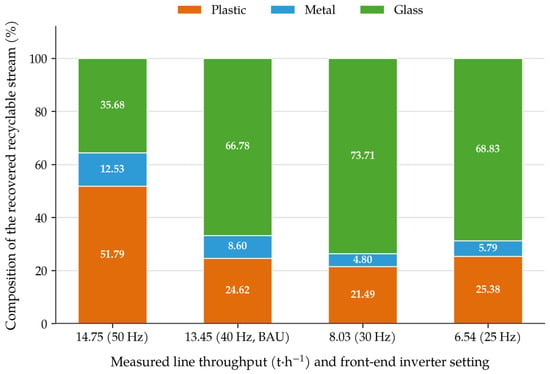
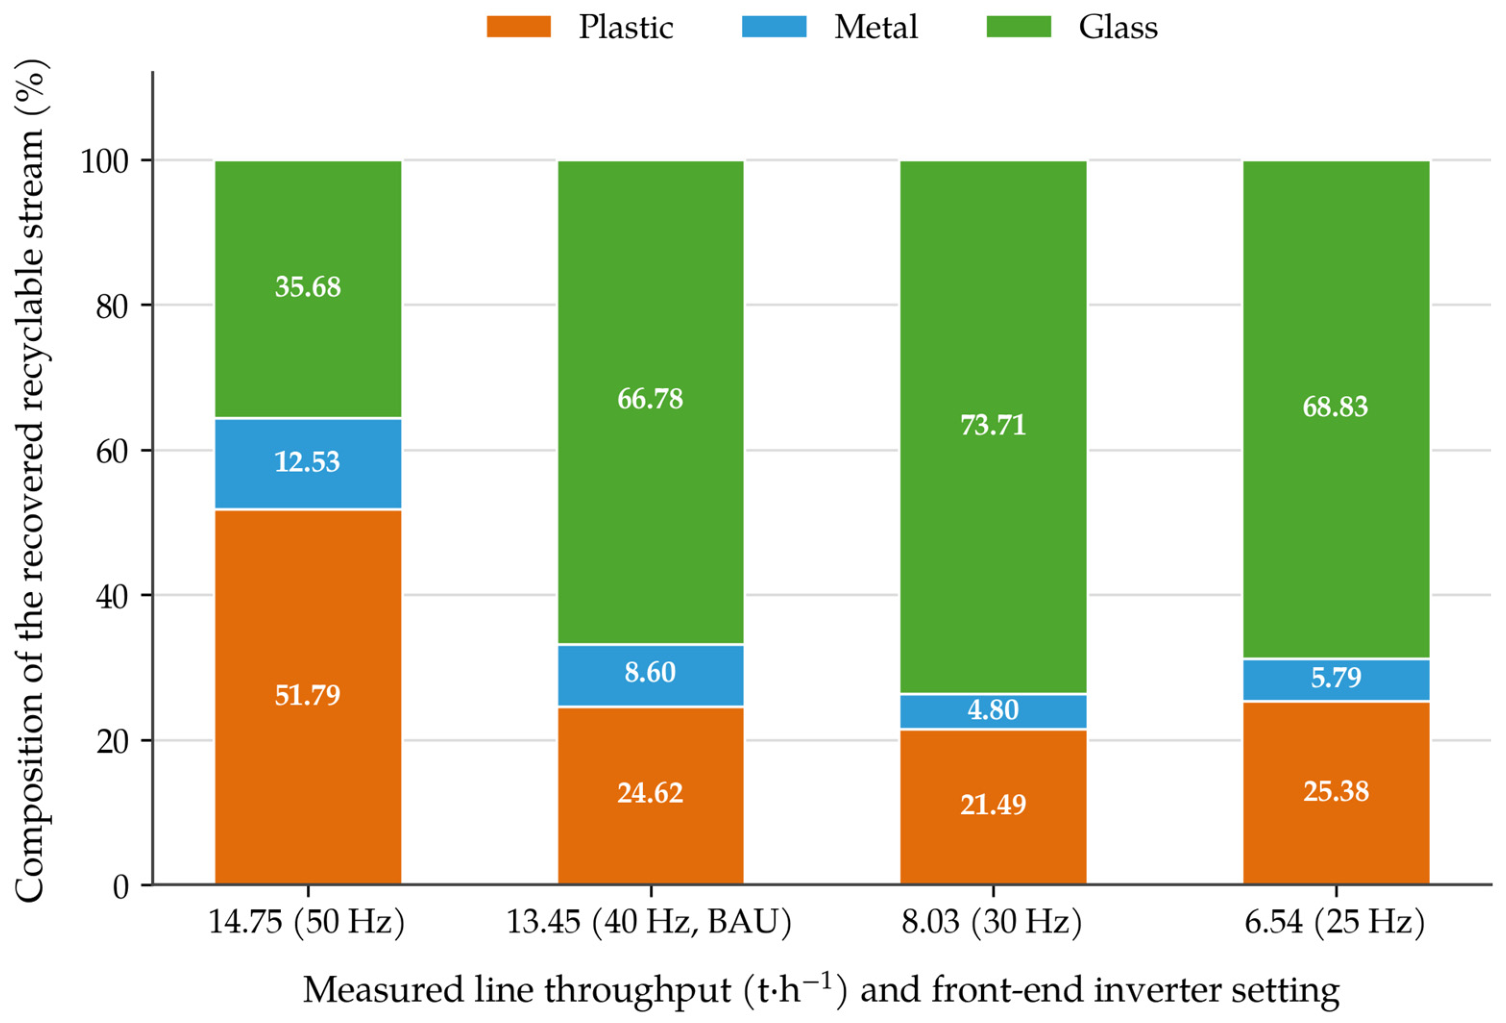
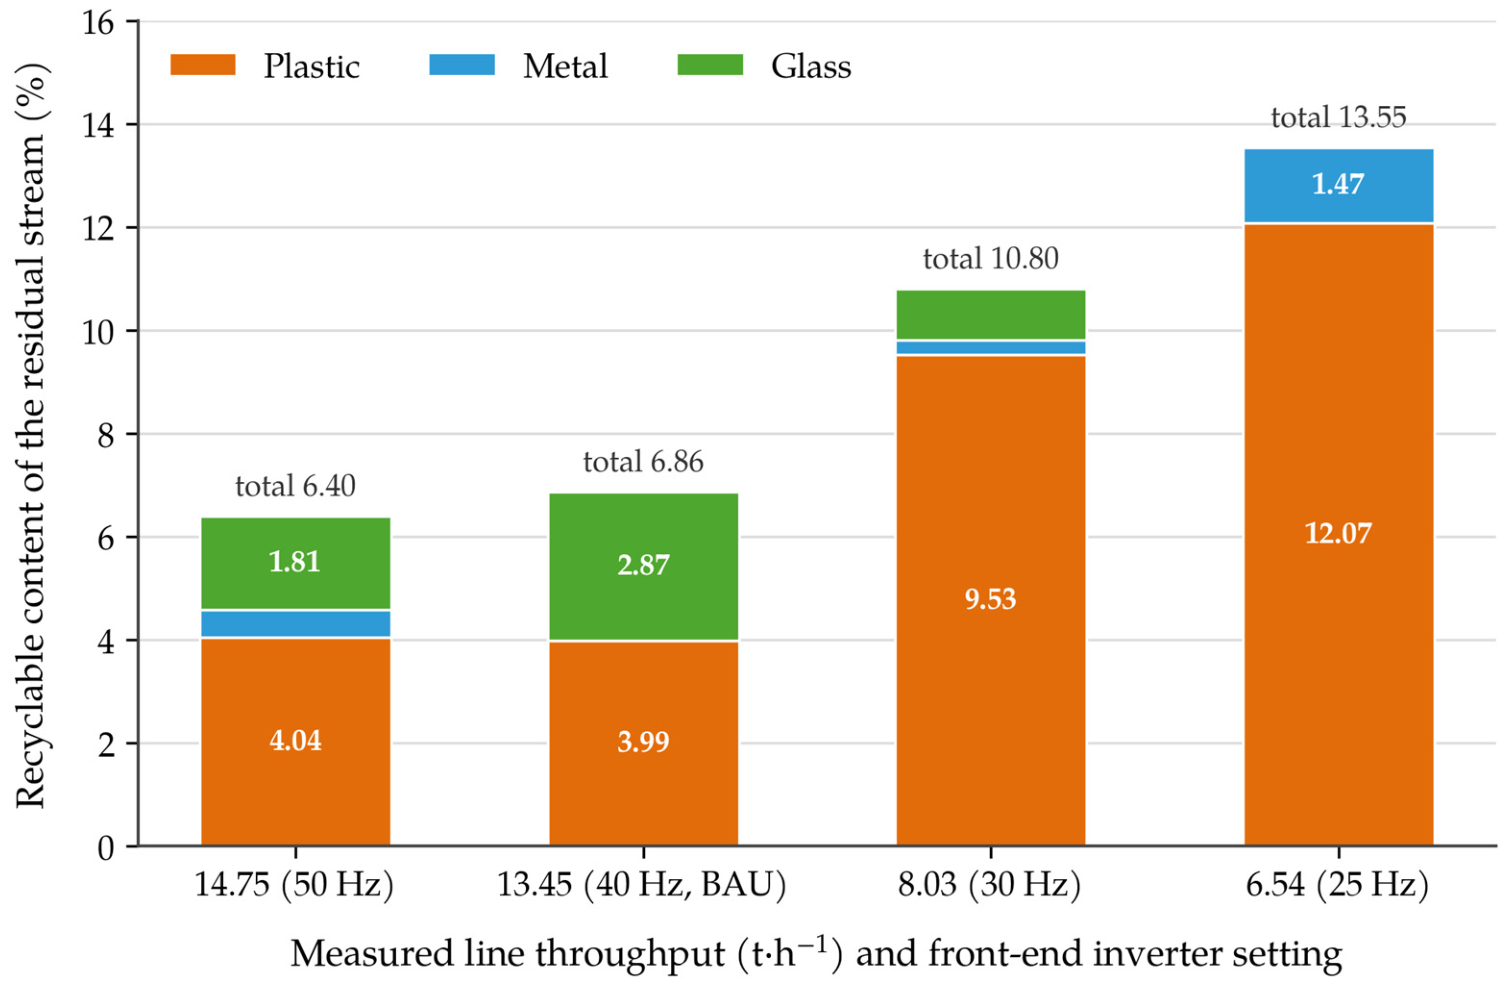
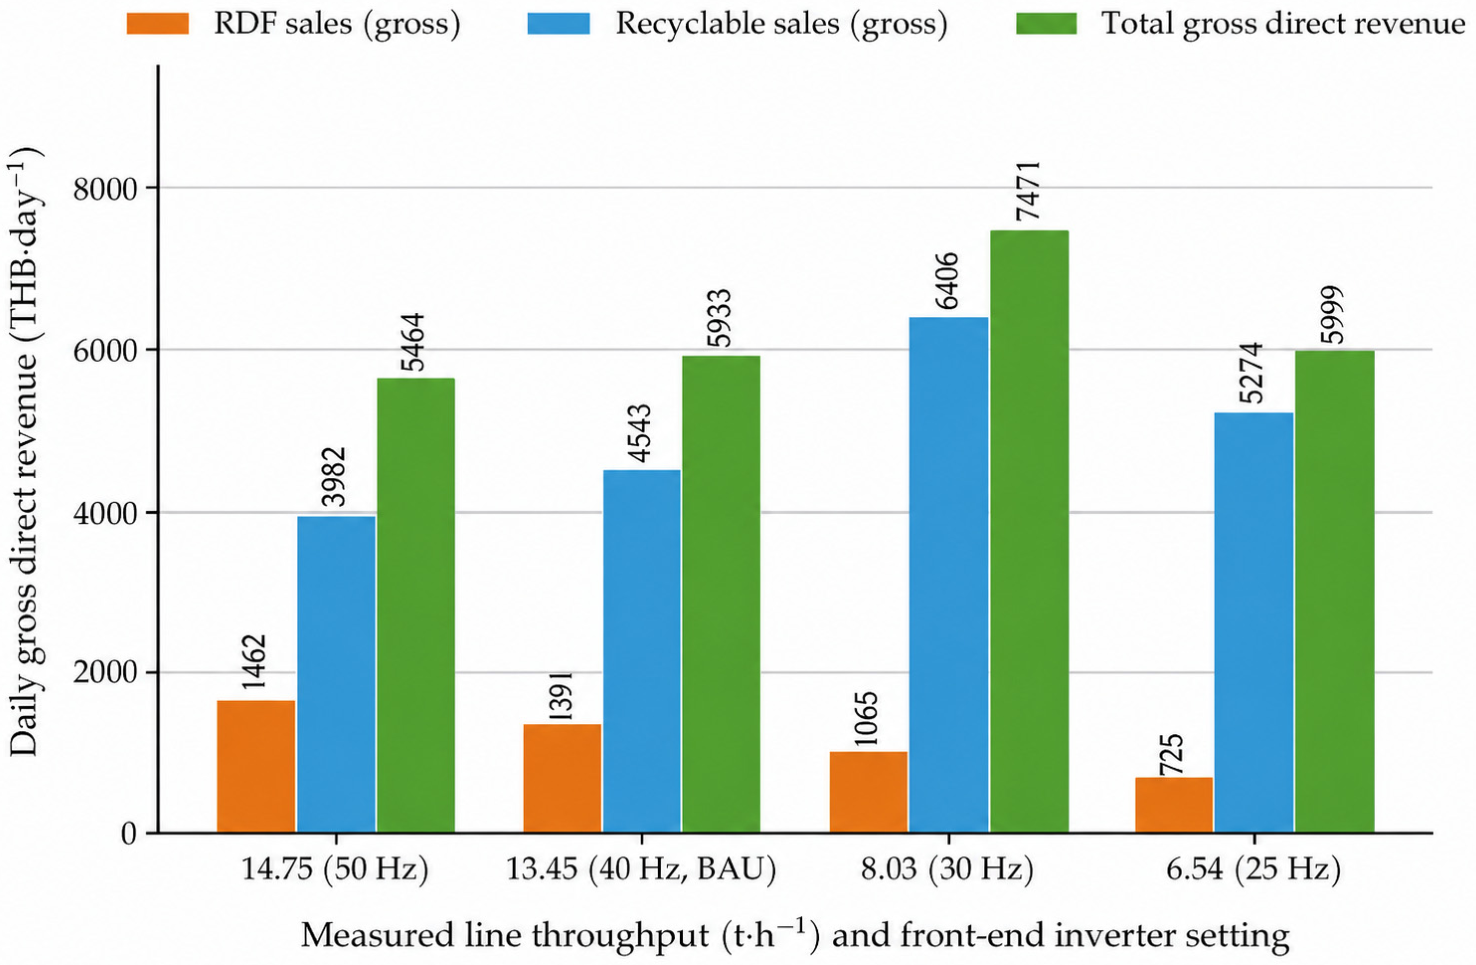
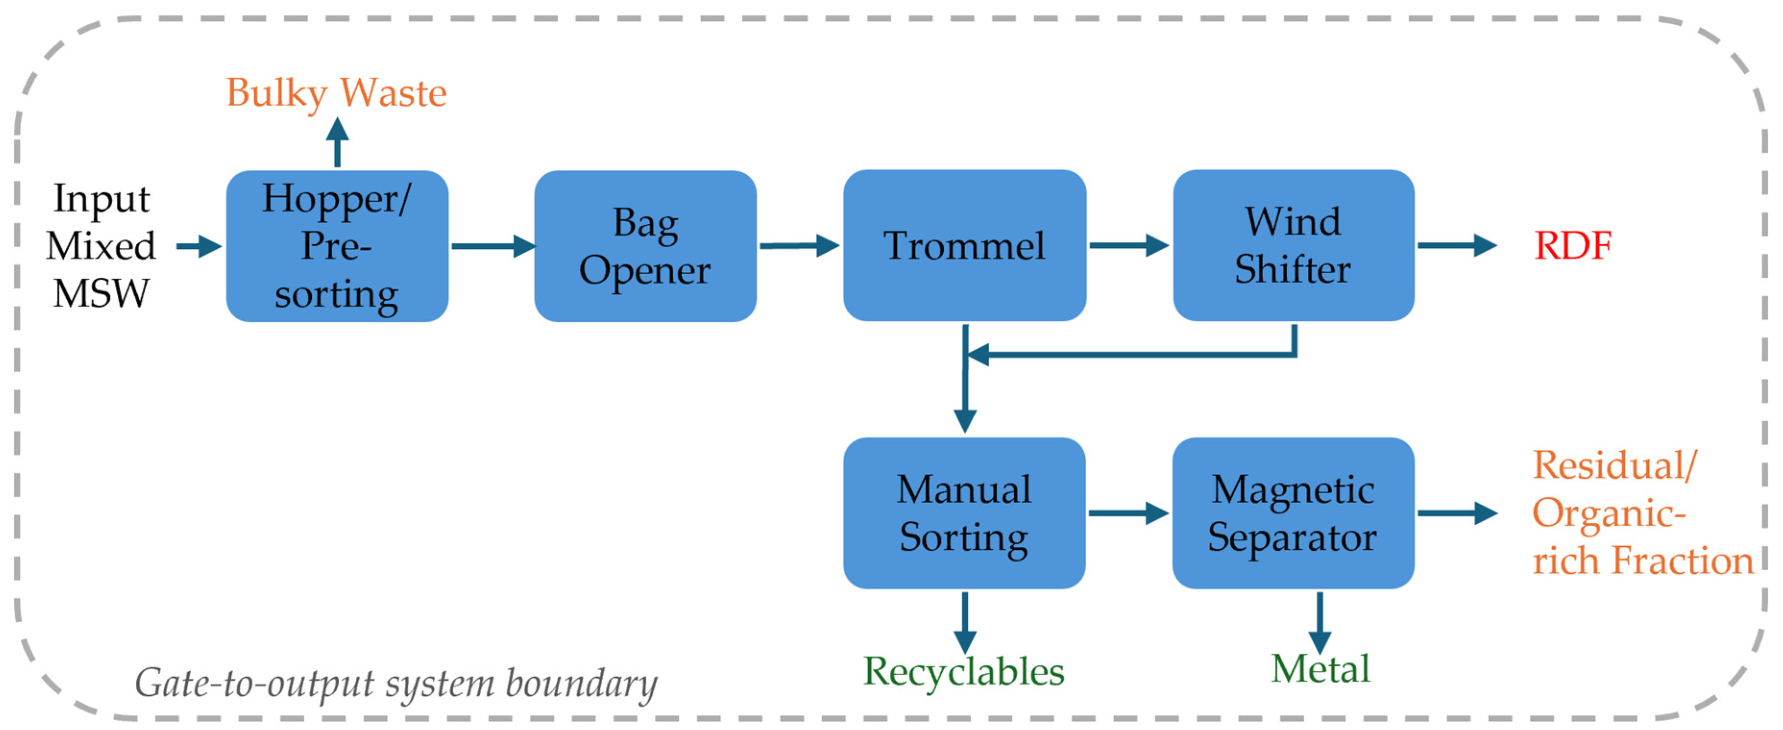

Disclaimer/Publisher’s Note: The statements, opinions and data contained in all publications are solely those of the individual author(s) and contributor(s) and not of MDPI and/or the editor(s). MDPI and/or the editor(s) disclaim responsibility for any injury to people or property resulting from any ideas, methods, instructions or products referred to in the content. |
© 2026 by the authors. Licensee MDPI, Basel, Switzerland. This article is an open access article distributed under the terms and conditions of the Creative Commons Attribution (CC BY) license.