


Abstract
In most developing countries, the composition of municipal solid waste (MSW) arriving at final disposal sites (FDSs) differs from that at the source due to informal segregation of potentially recyclable waste (PRW) during its management, as well as because FDSs typically receive MSW from multiple municipalities. After exhaustively reviewing methods and studies of MSW characterization at their source, in collection trucks, and at FDSs, a lack of standardized methods for in situ characterization was identified, so this work proposes an innovative methodology to characterize MSW in situ at FDSs through the integration of geographic information systems to delimit the FDS or the selected cell(s) and the application of systematic sampling based on the NMX-AA-132-SCFI-2016 standard. To validate its applicability, MSW was sampled and characterized during the 2023 and 2024 dry (DS) and rainy seasons (RS) at a waste integral center in Tenango del Valle, Estado de México. The average compositions of organic waste were 15.3 ± 0.8% and 10.6 ± 0.1%; for PRW, they were 59.3 ± 5.4% and 50.5 ± 4.0%; and for the residual fraction, they were 25.4 ± 4.6% and 39.0 ± 4.1% in DS and RS, respectively; however, significant differences between seasonal or annual means could not be determined due to the limited sample size. The high percentages of PRW determined in situ are attributed to mixed household collection and show the potential to be recovered. The use of the proposed methodology enables representative in situ characterization of MSW after disposal with a lower level of significance, and it can be useful for decision-making regarding sustainable waste management projects.
1. Introduction
Human activities generate solid waste, which is discarded as “garbage” and disposed of at final disposal sites (FDSs). In 2020, 2.1 billion tons of municipal solid waste (MSW) were generated worldwide, with their final treatment as follows: 30% in sanitary landfills, 38% in open dumps, 19% recovered for recycling (plastic, metal, glass, paper, and cardboard), and 13% incinerated [1]. In Mexico, MSW generation was estimated at 139,902.6 t/d, and 70% of this amount is sent to FDSs due to the economic feasibility and simplicity of their operations [2]. This treatment is a biodegradation process that generates significant amounts of leachate and biogas, which contain methane (CH4) and carbon dioxide (CO2), both of which are greenhouse gases (GHGs) that contribute to climate change [3,4]. The 2030 Agenda underscored the urgency of GHG emissions by establishing 17 Sustainable Development Goals (SDGs), with Goal 11 focusing on sustainable cities and communities. Target SDG 11.6 aims to reduce the adverse environmental impact of cities, including through MSW management [5]. This underlines the need to develop strategies, programs, and technologies that improve MSW management from cradle to grave [6].
In this context, MSW characterization studies are fundamental as they provide essential data for designing and implementing evidence-based improvements to MSW management systems [7,8,9]. At the final management stage, accurate knowledge of the composition of MSW arriving at the FDS is essential to support safe facility planning, design, and operation while protecting worker health and the environment [1,10,11].
Regarding the stabilization of work areas and slopes, the composition enables the determination of the required compaction to prevent collapse [12]. For leachate management, its quantity and physicochemical characteristics (pH, humidity, and organic matter) depend on the MSW disposed of at an FDS [13,14]. To estimate biogas emissions, composition, and energy potential, as well as the duration of environmental liability until waste stabilization, the mass fraction of each MSW component is required. Total volatile solids (TVS) content is a necessary parameter for estimating the energy potential of MSW in treatment and resource recovery applications [3,15,16,17,18].
Several studies have been conducted to characterize MSW across the collection, transfer, and disposal stages, during which differences in quantities and proportions of materials are observed. These variations occur between the MSW generated at the source by citizens (household), that collected in trucks, and that which finally reaches the FDSs. As shown by the characterization studies carried out for the municipality of Zinacantepec, Estado de México, in 2015, sampling in households showed that the fraction of potentially recyclable waste (PRW) was 35.0 ± 2.8% and that of organic waste (OW) was 50.0 ± 4.0% [19,20]. Similarly, the work of Sankar Cheela et al. (2021) in Visakhapatnam, India, found that 26.1% and 53.7% of PRW and OW, respectively, were sampled from households, and 27.1% of PRW and 43.6% of OW were sampled from collection trucks [17]. In addition, informal segregation of PRW by public and private collection workers, as well as primary segregators, also known as “scavengers”, occurs at almost all stages of MSW management. A portion of PRW is not recovered due to contamination with other waste fractions. In countries such as China, Brazil, Mexico, Indonesia, and India, primary segregators are estimated to contribute 92%, 89%, 72%, 30%, and 17%, respectively, to the commercialized PRW [21,22,23,24]. By contrast, established waste management systems in countries such as Germany, Austria, Belgium, Italy, Switzerland, Sweden, and the Netherlands achieve PRW recovery rates exceeding 50% [25,26]. In many developing countries, such as those in Latin America, the recovery rate of recyclable materials still does not exceed 10% [27].
Numerous countries have developed regulations, manuals, and standardized procedures for MSW characterization. However, most of these frameworks are designed for data collection at the point of generation [28,29,30,31]. Additionally, methodologies exist for characterization at transfer stations, schools, commercial facilities, and FDSs, where sampling is conducted when waste collection vehicles discharge MSW into the operative landfill cell or working face. Sample sizes are determined using standardized protocols to ensure representativeness across distinct waste generator sectors [5,9,32,33,34]. This implies complex logistics that complicate fieldwork and increase costs. In Mexico, the NMX-AA-061-1985 standard establishes the method for determining MSW at the point of generation (domestic and non-domestic) using random statistical sampling [29], and for characterization of subproducts, standards NMX-AA-015-1985 and NMX-AA-022-1985 are applied [35,36]; however, despite the existence of consolidated methodologies, they do not capture the reality of the MSW that is collected and is finally confined, due to informal segregation, which generates a technical discrepancy between the source data and those of the FDSs.
Given this context, conducting characterization studies across the waste management chain—at the point of generation, during collection, and at FDSs [5]—is critical for tracking progress toward SDG indicator 11.6.1. This indicator encompasses metrics on total and per capita MSW generation, collection coverage, management in landfills, waste composition, and uncollected waste rates. With this information, it is possible to propose projects to the municipality or the FDS for the recovery of MSW, including technologies targeting recyclable materials, organic waste, and energy use, ultimately supporting waste reduction targets and increasing the PRW by substituting virgin raw materials in manufacturing [37]. To reduce data uncertainty and the lack of standardized techniques for MSW characterization at FDSs, the objective of this study is to propose an innovative methodology to characterize MSW in situ through the integration of geographic information systems to delimit the FDS or the selected cell(s) and the application of systematic sampling based on the NMX-AA-132-SCFI-2016 standard [38]. To validate its applicability, MSW was sampled and characterized during the 2023 and 2024 dry (DS) and rainy seasons (RS) at the waste integral center (WIC) in Tenango del Valle, Estado de México.
2. Background
Various methods have been employed to characterize the physical and chemical composition of MSW. These are chosen depending on the objective of the study; for example, for sustainable project design before final disposal, with the approach of PRW for recycling and OW for composting, studies have been conducted in municipalities or cities, taking the sample directly from households [7,8,33,39,40]; or in containers and transfer stations [25,41,42]; or, in collection vehicles when the MSW is disposed of at FDSs [9,34,43,44,45].
When the main objective is the implementation of sustainable projects at operating FDSs (such as material recovery facilities or PRW sorting plants, and composting facilities) [20,46,47] or assessing CH4 generation potential [19,48,49], or closured FDSs to evaluate the feasibility for landfill mining as a strategy to recover confined PRW and to quantify its calorific potential [50,51,52], waste composition studies were conducted through in situ sampling from extraction wells or leachate at different depths [53,54], or via surface random sampling at FDSs [46,48,55].
Among the methodologies proposed for MSW characterization is ASTM D5231-92(2024), first published in 1992 and endorsed in 2003, 2016, and 2024. This methodology establishes the procedure for determining the average composition of MSW in households and in trucks entering FDSs, transfer stations, processing, and waste conversion plants. The sample (91 to 136 kg) is taken from MSW collected by the trucks and vehicles; the selected vehicles and the number of samples are subject to statistical control [32].
MSW characterization studies at the point of generation (households) and during the collection stage, the “Waste Wise Cities Tool” (WaCT) is employed. This instrument, developed in 2021, was specifically designed to track progress toward Indicator SDG 11.6.1. Its procedure establishes the selection of at least three trucks for household waste collection at each socioeconomic income level.
Each waste collection vehicle deposits a 200–300 kg sample in a designated area, where a quartering method is applied to obtain a representative subsample of 50–70 kg for subsequent sorting into 12 waste fractions [5]. The WaCT methodology aligns closely with the “Waste Characterization Handbook; Understanding Municipal Waste Streams to Develop Data-Driven Methane Mitigation Strategies” published in 2024 by the U.S. Environmental Protection Agency (USEPA), which provides standardized protocols for waste characterization at both the point of generation (household) and the collection stage [33].
The Spain Federation guide “Methodological Guide for the Preparation of Waste Composition Studies” proposes a sampling system directly at the treatment site. The deposited and homogenized waste is collected from different points and depths until reaching 1.0 t, and then quartered to obtain a 250 kg sample; from this, 23 subproducts were selected [56].
Among the methodologies described above, only the Spain Federation guide specifies in situ sampling of MSW before FDS disposal; however, it does not define the required number of sampling points or the vertical stratification levels for sample collection.
Table 1 presents MSW characterization studies conducted at the point of generation (communities and cities or households), whereas studies based on samples from collection vehicles and in situ studies are shown in Table 2 and Table 3, respectively. For each study included in these tables, the sampling methodology is briefly described, and the results are presented following analytical processing and aggregation into three standardized waste fractions: OW, PRW, and residual fraction or rejection fraction (RF) for comparative analysis.
Table 1.
MSW characterization studies conducted at the point of generation.
Table 2.
MSW characterization studies based on samples from collection vehicles.
Table 3.
MSW characterization studies “in situ”.
Regarding household characterization (Table 1), most reviewed methodologies adhere to national standards; only studies from Pakistan and India applied the ASTM D5231-92 standard, while the remaining studies employed study-specific methodologies. Table 2 shows four studies conducted on collection vehicles that utilized ASTM D5231-92 (2024). In Naucalpan, Mexico, the USEPA methodology was applied, whereas the remaining eight studies used methodologies specific to their respective research groups [20,32,33,42,45].
The post-disposed in situ characterization studies presented in Table 3 utilize methodologies that lack homogeneity and standardization. Only the study conducted in Korea employed in situ characterization [48]. Five additional studies leveraged existing mechanical equipment from vent wells, drilling operations, or leachate pit excavations to minimize costs. The remaining seven studies implemented procedures proposed by the researchers, including excavation at varying depths (1 m to 15 m) and random surface sampling of the MSW displaced by the mechanical equipment. When waste samples are extracted from a venting well or from nearby locations, the degree of degradation varies with compaction density and moisture content (M%). This degradation is difficult to identify, and its components are difficult to separate; in most cases, the bottom sample will be mud [18,49,50,52]; therefore, the fractions will not be representative of landfilled MSW.
It should be noted that during the MSW disposal process at FDSs of Latin America, the PS “scavengers” extract PRW from collection vehicles that dispose of waste, and directly in the operating cell; hence, their compositions differ [17,21]. In many characterization studies, physical, physicochemical, and thermal analyses were conducted to inform planning, design, and optimization of MSW management. Such as determining biological utilization, energy recovery potential, or indicating the level of stability of the environmental liability. Table 4 summarizes the findings of physicochemical laboratory analyses of MSW samples.
Table 4.
Physicochemical analyses of MSW samples.
Table 4 shows global data on the variability of physicochemical and thermal properties, highlighting that moisture content can range from 2.5% in Mexico to 68.0% in Finland, a key factor for leachate and biogas management. pH has been reported to range from 6.3 to 8.9, indicating a trend toward neutrality or slight alkalinity. Regarding the TVS and organic matter, a high percentage, 85.1%, is observed, indicating a remarkable potential for generating CH4. On the other hand, ash percentages are different among countries, such as the U.S. (4.9%), Greece (7.3%), and India (20.0–26.0%), indicating the presence of inorganics. It has been confirmed that MSW is a considerable energy source, with an energetic potential ranging from 16.1 to 25.0 MJ/kg. Also, heavy metal concentrations such as Pb, Cd, Hg, Cr, and Zn have been identified, which can help infer toxicity and stability of the environmental liability [34,50,67].
To strengthen and optimize the aforementioned studies, geographic information systems (GIS) have been incorporated into MSW management research. Its main applications include the evaluation of conditions for the selection of suitable sites for facilities or environmental impact assessment [53,68,69], the geographical delimitation of sampling sites in a lagoon system in Veracruz [70], the projection of waste collection points in a community in Cuba [60], the analysis of energy recovery potential [71] among other approaches aimed at optimizing management.
3. Materials and Methods
Given the lack of a standardized methodology for the in situ characterization of MSW after final disposal at FDSs and drawing on the background described and the authors’ experience, an innovative methodology is proposed. In this approach, the precise geographic locations of the sampling points are determined using GIS, and the sampling protocol is based on a standard for systematic sampling. The study area may include the entire FDS, one or more operational or closed cells. In this work, the methodology proposed for the dry and rainy seasons of 2023 and 2024 was applied.
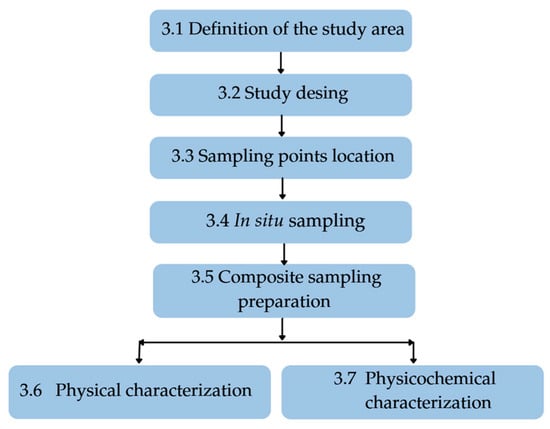
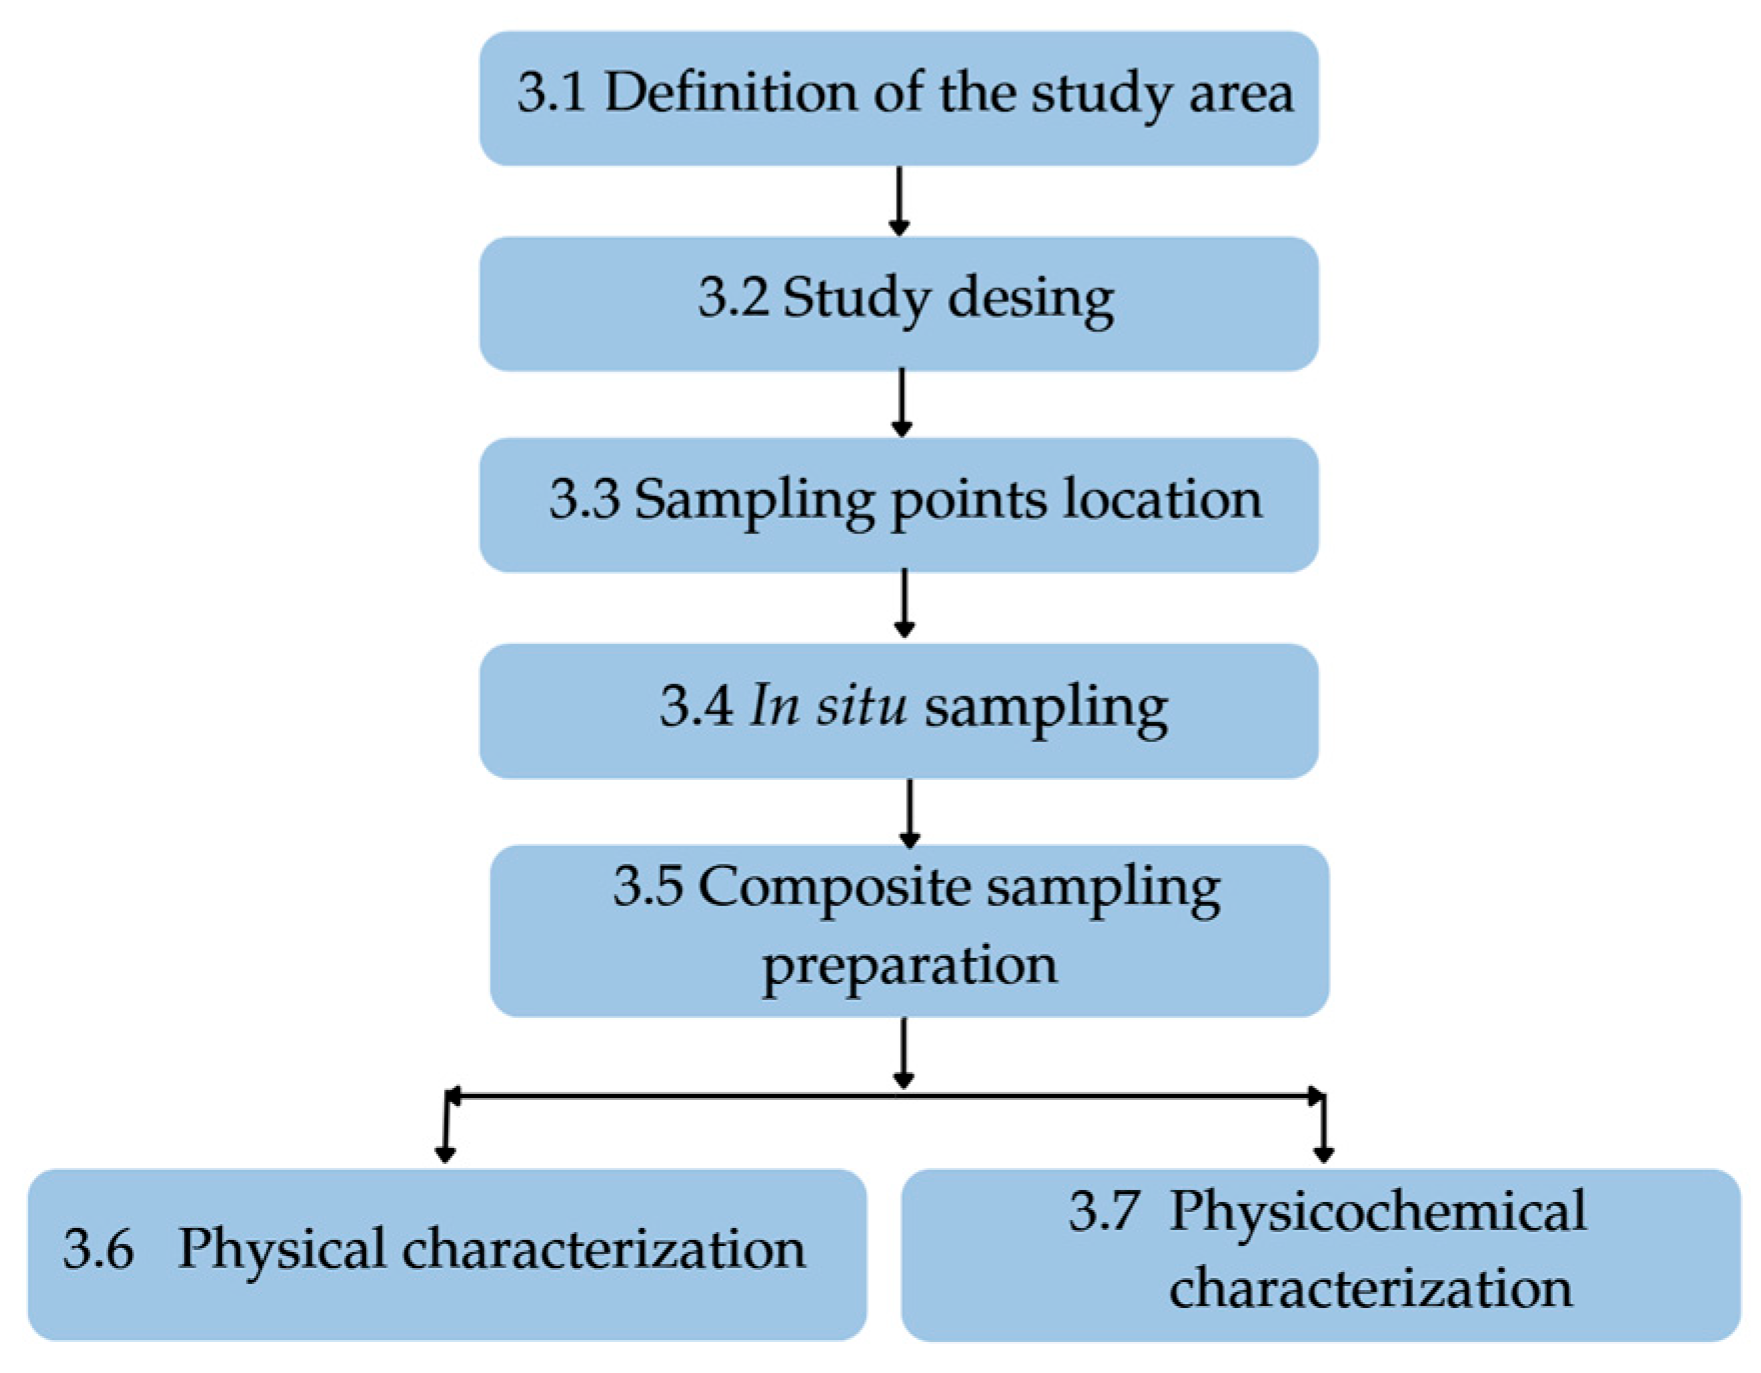
Figure 1 presents the proposed methodology, the activities of which are described in the following subsections:
Figure 1.
Diagram of the methodological proposal.
3.1. Definition of Study Area
This stage involves two primary activities, which were essential for planning the subsequent sampling at FDS:
- (a)
- Historical documentary information, geographical location, socio-environmental aspects such as the beneficiary population, and data on the collection systems of the municipalities that have them were compiled.
- (b)
- Field data were collected, including operating schedules, amounts of MSW received, types of collection vehicles of the municipalities, the presence of primary segregators (scavengers), operating conditions at the working face, types of specialized machinery, and the dispersion and compaction of MSW within the cell, among others.
3.2. Study Design
The objectives and scope of the study were defined. After permits were obtained from the municipality and the company that operates the FDS, the following actions were carried out:
- (a)
- The working group was formed to assign specific functions. Fieldwork decreases as the number of people available on-site increases.
- (b)
- Staff were instructed on safety protocols and the mandatory use of personal protective equipment according to UN-Habitat’s WaCT methodology (2021), as well as masks (KN95, R95, or three-layer), Tyvek suits, helmets, and rubber boots for protection against metal and glass sharps. Participants must have completed the tetanus vaccination schedule.
- (c)
- The working group was trained on the standards NMX-AA-015-1985, NMX-AA-019-1985, and NMX-AA-022-1985 [35,36,72].
- (d)
- The availability and functionality of the sampling equipment and tools required for the fieldwork listed in Table 5 were verified.Table 5. Sampling equipment and tools.
3.3. Sampling Point Location
To obtain a representative in situ MSW sample with the lowest level of significance, the following activities were carried out:
- (a)
- The dimensions of the polygon of the FDS study area were identified and delimited using Google Earth Pro (v2026) [73].
- (b)
- The polygon was exported in KML format to QGIS(v3.10), specifying the Universal Transverse Mercator coordinate system, to the FDS geographic location [74].
- (c)
- The number of sampling points was determined based on the study area dimensions, as indicated in Table 2 of the NMX-AA-132-SCFI-2016 standard. This protocol provides standardized tables for the minimum number of sampling points depending on the size of the study area, derived from previous statistical analysis; likewise, it proposes the application of systematic sampling based on a geometric pattern with regular and equidistant intervals (Figure 2) to form a representative composite sample [38].Figure 2. Triangular pattern.
- (d)
- The geometric pattern of regular and equidistant intervals was generated with the “Grid” tool of QGIS software to identify the geopositioned sampling points in the polygon.
3.4. In Situ Sampling
During this stage, MSW samples were extracted from the operative cell, where the waste had been previously deposited, spread, and mechanically compacted. The following actions were performed:
- (a)
- An area adjacent to the operative cell was selected. This area was cleaned with metal rakes (it can also be conditioned by placing a high-strength tarp or a concrete surface) to minimize the risk of cross-contamination.
- (b)
- A sample of MSW was extracted from each identified point and geopositioned on the surface of the cell at a depth of 30–60 cm, using a backhoe-type machine with a bucket of average capacity 0.76 m3 (equivalent to approximately 100 kg of MSW, given an average density of 300 kg/m3). For a large bucket backhoe loader (1.0 or 1.2 m3), use only half its capacity [75].
- (c)
- The sample extracted from each point was transferred to the conditioned area for the preparation of the composite sample.
3.5. Composite Sampling Preparation
For the formation of the composite sample, the following activities were carried out:
- (a)
- MSW from each sampled point in the conditioned area was gathered and scrambled with the help of the backhoe and shovels.
- (b)
- MSW was quartered using machines and shovels, as indicated in NMX-AA-015-1985. Care was taken to ensure that the four quarters of MSW were proportional, and each was designated A, B, C, and D clockwise in NMX-AA-015-1985. Two of the quarters (either A and C or B and D) were eliminated, reducing the composite sample to approximately 200 kg [35].
3.6. Physical Characterization
Physical characterization included determining volumetric weight and in situ quantification of by-products. The required actions were as follows:
- (a)
- Of the four quadrants obtained from the last quarter (NMX-AA-015-1985), approximately 100 kg of the composite sample formed by A and C or B and D was used to determine the volumetric weight in accordance with NMX-AA-019-1985.
- (b)
- In the remaining two quadrants (which should be a sample of approximately 100 kg of MSW), manual selection of the 27 by-products listed in NMX-AA-022-1985 was carried out. Each of the separate by-products was placed in bags pre-labeled with its name. In cases where materials were not listed in the standard, the list was expanded to include the corresponding denominations. Each bag was weighed and recorded to later estimate its percentage by weight.The by-products were grouped, as shown in Table 6, into the categories OW, PRW, and RF. If any other by-products on the lists were identified, they were included in one of the three categories according to the criteria of the person responsible for the study. The grouping into these three categories was performed to compare the percentages for each category with the values reported in previous studies (Table 1, Table 2 and Table 3) [17,25,64].Table 6. Grouping of MSW characterization.Diaper waste was considered to consist of 50% OW and 50% inorganic waste, which were added to the remainder fraction (Table 6), because diapers contain various organic and inorganic materials and once used, contain human urine and excrement. The PRW detected as dirty was included in the Miscellaneous by-products and added to the remaining fraction because separating it for recycling is not operationally or economically feasible [76].
- (c)
- A descriptive statistical analysis was conducted on the results of the physical characterization of the MSW under dry and rainfall conditions in 2023 and 2024 to determine the seasonal influence on MSW volumetric weight and group composition. With StatGraphics Centurion XV (v15.2.11), the following statistics were estimated: mean, standard deviation, coefficient of variation, range, and type A uncertainty [77,78].
3.7. Physicochemical Characterization
For the physicochemical analysis stage, the following activities were carried out:
- (a)
- The by-products were fragmented to approximately 1 cm in size.
- (b)
- A 100 g sample was reconstructed, respecting the physical composition of the MSW, as determined by the physical characterization (NMX-AA-022-1985).
- (c)
- The determinations of pH (NMX-AA-025-1984), moisture content (NMX-AA-016-1984), and ash content (NMX-AA-018-1984) were performed in triplicate. Total volatile solids (TVS) were estimated as the difference between the ash content and 100% of the sample [79,80,81].
- (d)
- A descriptive statistical analysis was conducted on data obtained during the dry and rainy seasons in 2023 and 2024 to assess the seasonal influence on the physicochemical parameters of the MSW [77,78].
4. Results and Discussion
The proposed methodology was applied in situ at the WIC of Tenango del Valle, Estado de México, over two years during the DS and RS. To verify this methodology, a single FDS was chosen to eliminate noise factors such as operating conditions, users, climate, among others.
4.1. Definition of Study Area
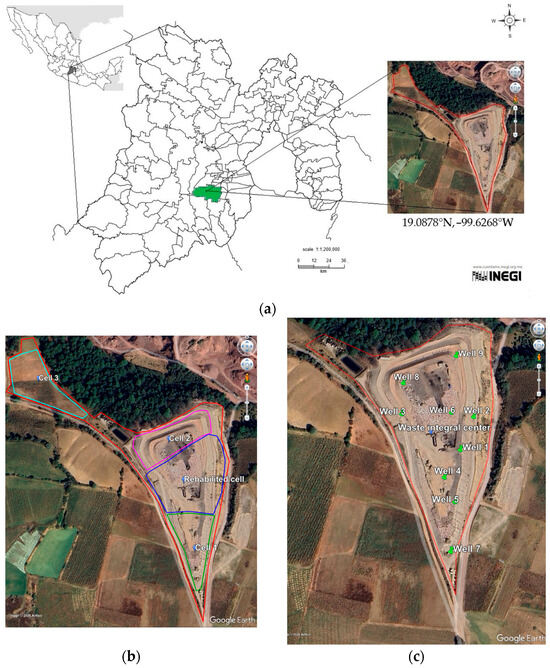
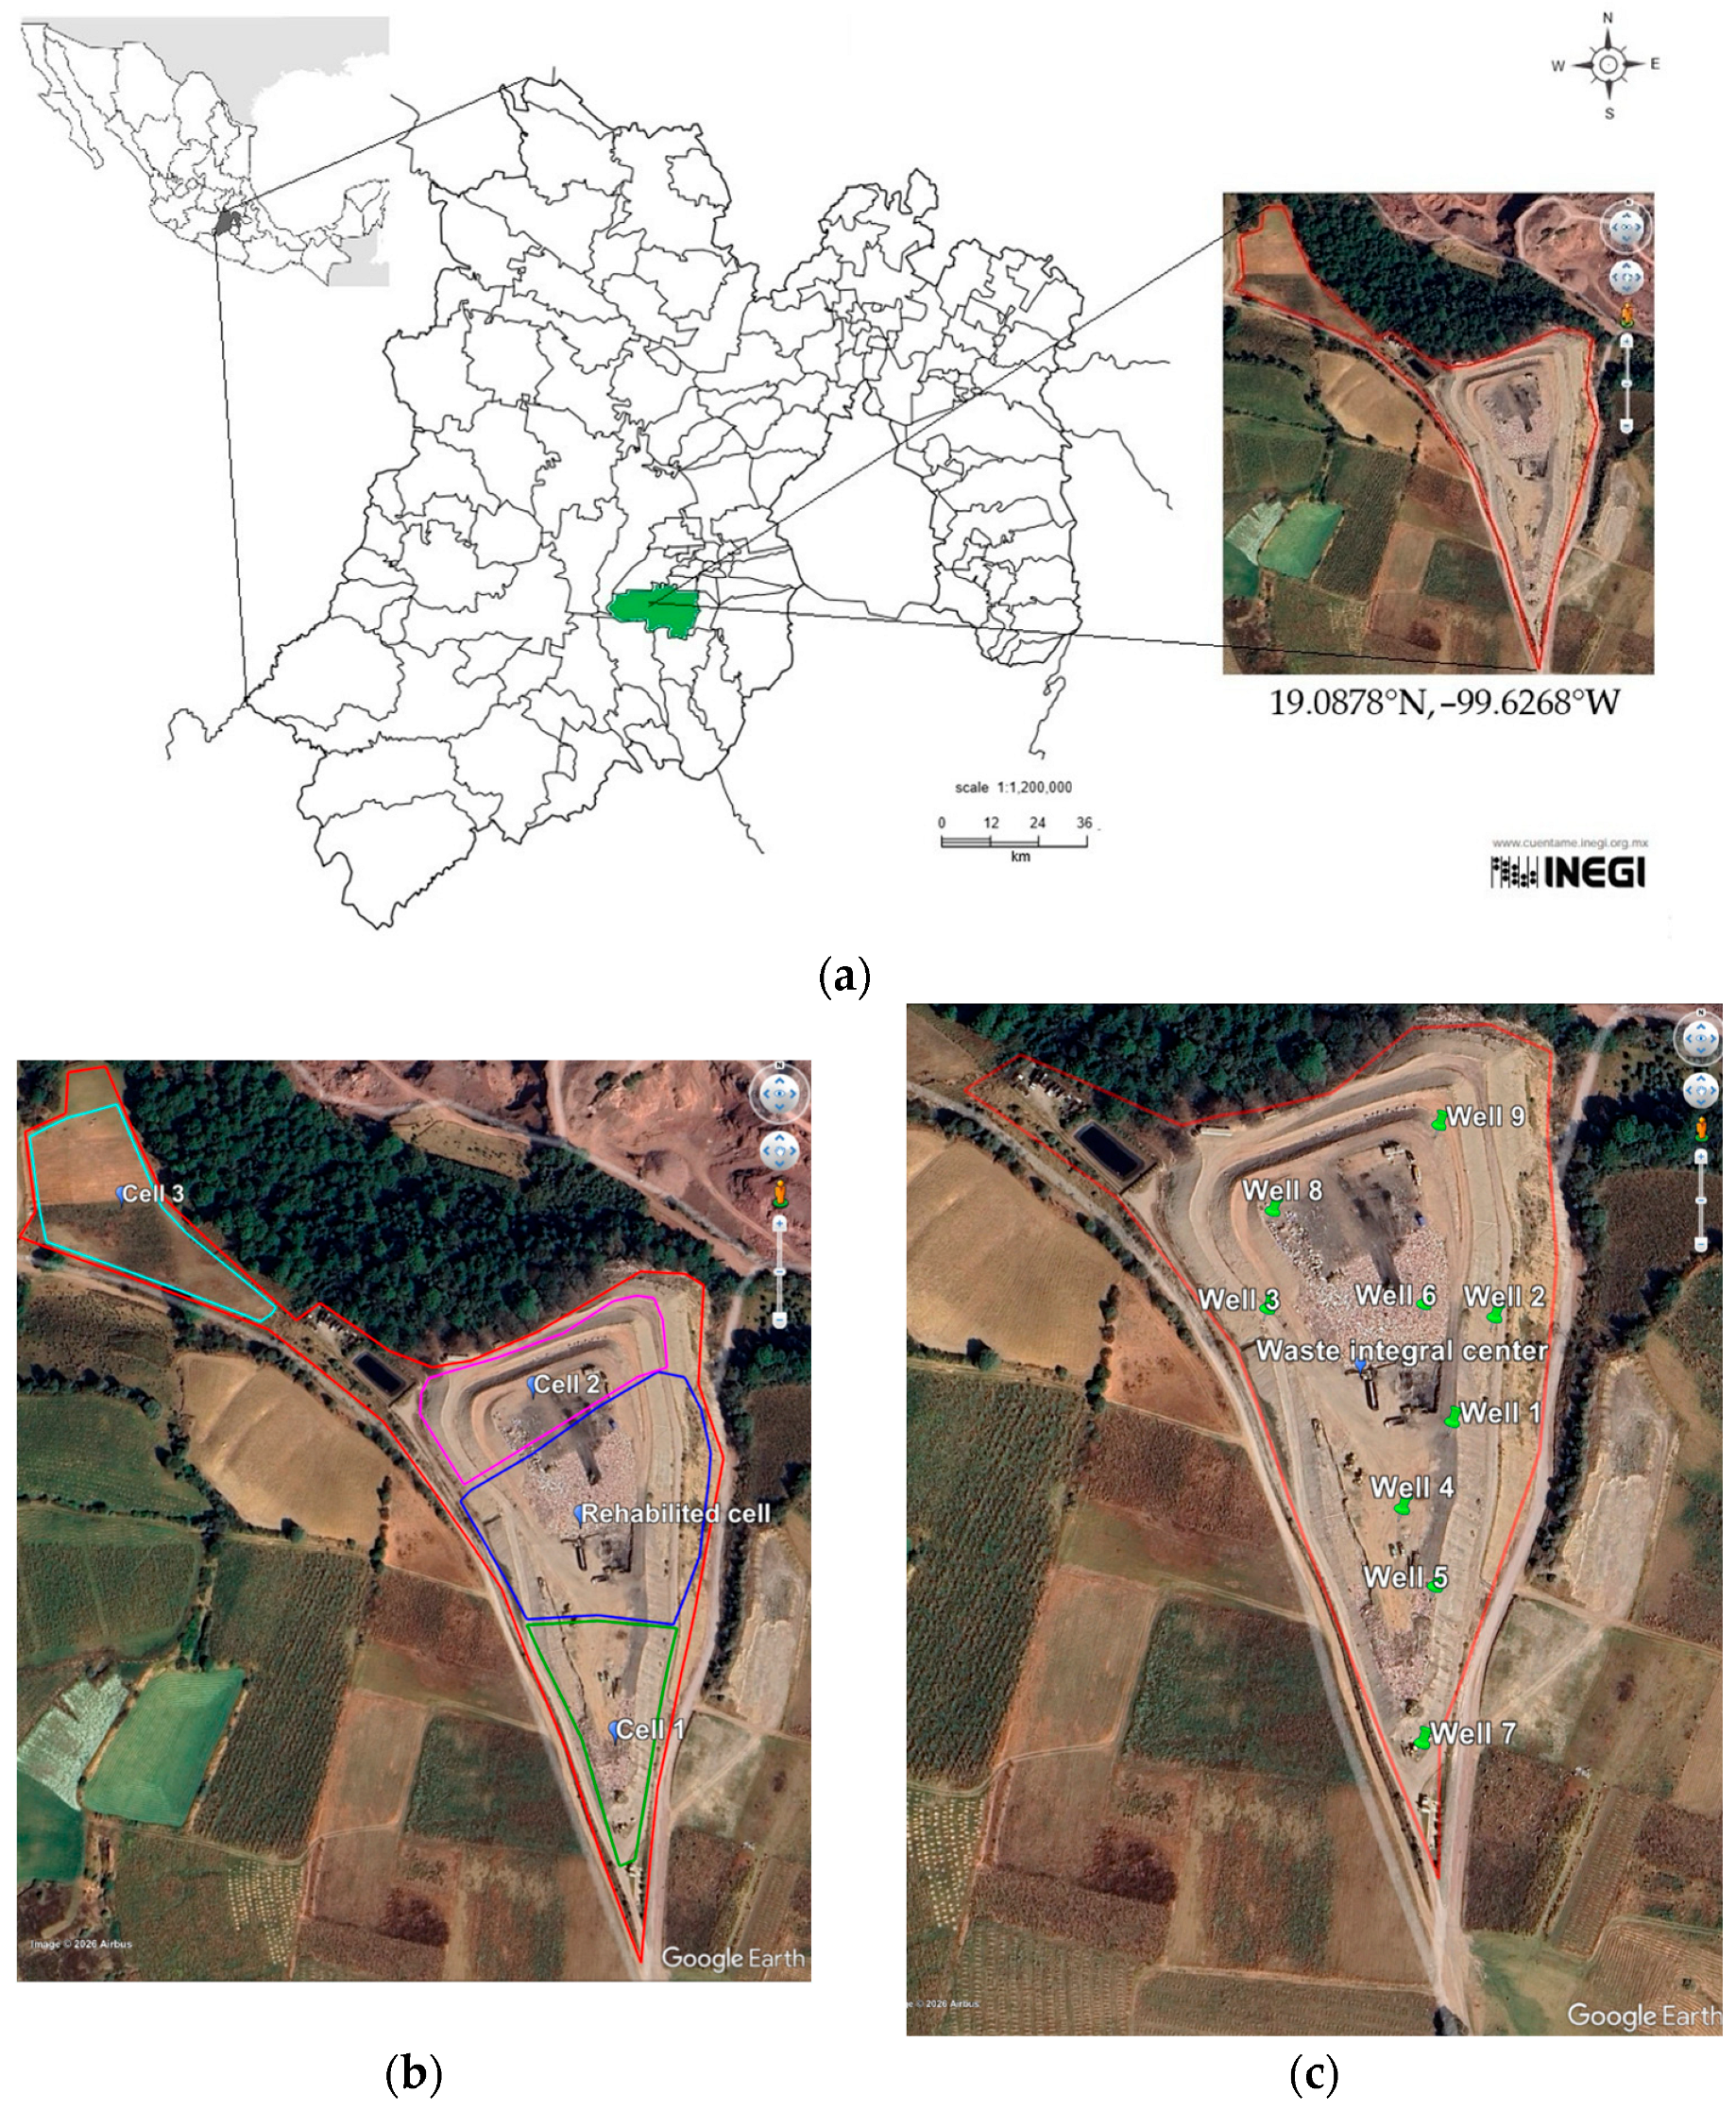
The FDS is in the southwestern Estado de México, under the administrative jurisdiction of the municipality of Tenango del Valle (Figure 3a), at the Acatzingo and El Guajolotal sites, Ejido of San Bartolomé Atlatlahucán. This FDS is registered as the WIC; the total area is 39,266.36 m2 and is located at the geographic coordinates 19.0878° N, −99.6268° W, at an elevation of 2852 masl [82]. It consists of a stabilized cell, cell 1, and cell 2 (Figure 3b), which were constructed and operated in accordance with NOM-083-SEMARNAT-2003 and currently form a macrocell (Figure 3c) [83]. Operations run from Monday to Saturday, 9:00 to 18:00 h. It receives 400–500 t/d of MSW from 11 municipalities in the Estado de México: Tenango, Santiago Tianguistenco, Ixtapan de la Sal, Villa Guerrero, Ocuilan, Joquicingo, Almoloya del Río, Zumpanguacán, Malinalco, and Tonatico, serving 520,758 inhabitants [84].
Figure 3.
Location of the study area in Tenango del Valle, Estado de México, Mexico: (a) Location in the Estado de México; (b) cells of WIC; (c) macrocell.
Household MSW collection is conducted in each municipality, follows established routes, and is managed by local municipal authorities. Transport is conducted using loading trucks (with or without compaction) and gondola-style or trailer-based loading units. These vehicles deliver MSW directly to the WIC of Tenango del Valle or, depending on municipal infrastructure and haul distance, to local transfer stations [82,83,84,85].
The 11 municipalities that dispose of their MSW in the WIC do not have source-separation systems and collect it in a mixed manner. However, waste collection workers perform informal sorting of PRW during collection and transit to the WIC. Similar on-site sorting is carried out by informal waste workers. Recovered PRW are sold to recycling collection centers, which subsequently supply them to commercial recycling facilities. The amount of PRW recovered does not exceed 0.5% of the total of MSW entering the WIC [86]. Field observations confirmed that the WIC is equipped with specialized machinery, including Caterpillar 826C landfill compactors and Case 580 backhoe loaders.
4.2. Study Design
The objective and scope of this study were to characterize MSW in the operative landfill cell of the WIC during both dry and rainy seasons over two years (2023–2024). Hence, all necessary administrative and logistical arrangements were completed to secure authorized access to the WIC facilities of Tenango del Valle, Estado de Mexico. The research team comprised twenty undergraduate students in Chemical Engineering and graduate students in Environmental Science from the Instituto Tecnológico de Toluca.
Each member was equipped with personal protective equipment, and the facility operator additionally supplied high-visibility vests and safety helmets. Before fieldwork, all participants received training on the technical standards outlined in Section 3.2 and site-specific health and safety protocols. All required field equipment and sampling tools were provided and are listed in Table 6.
4.3. Sampling Points Location
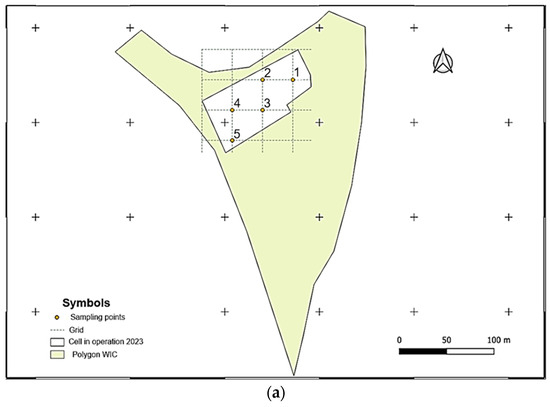
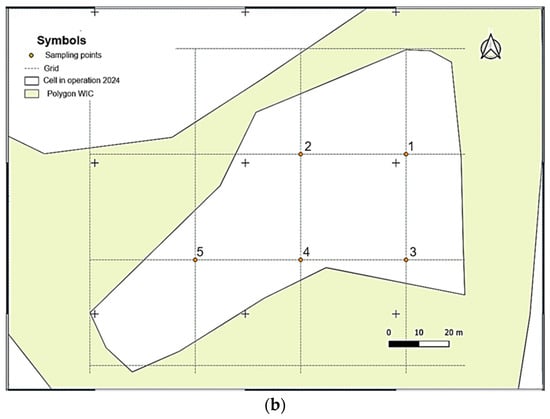
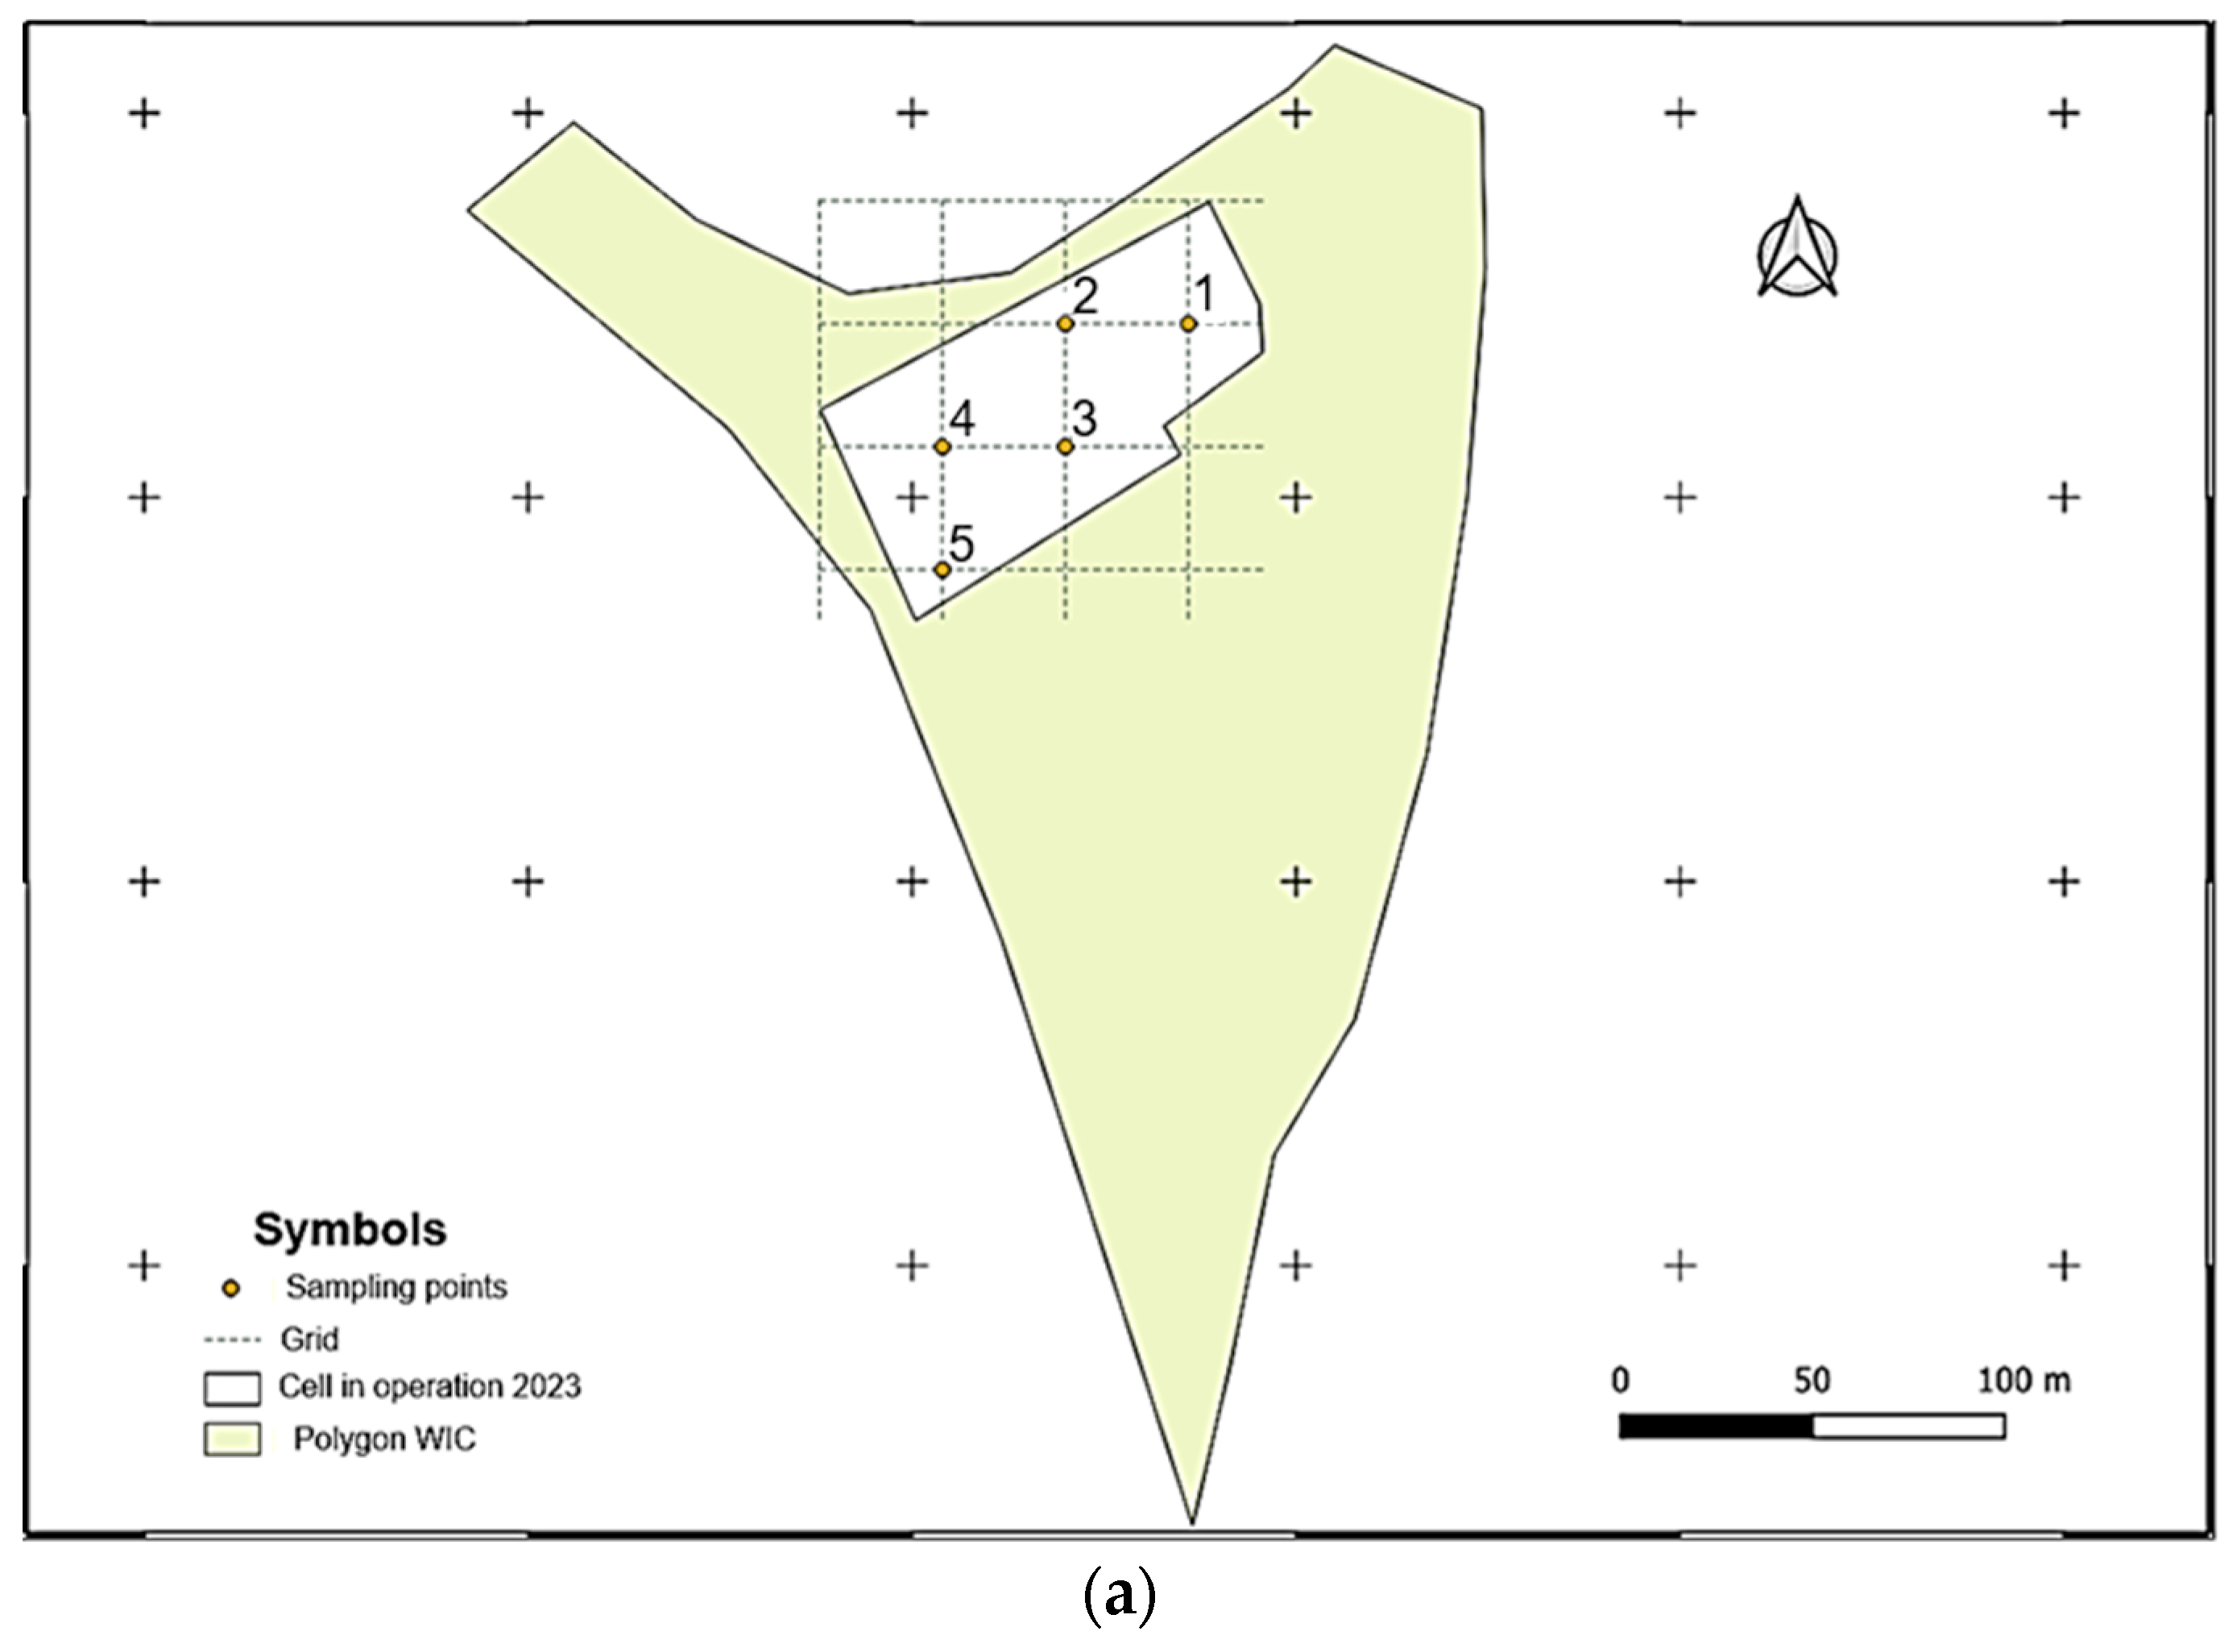
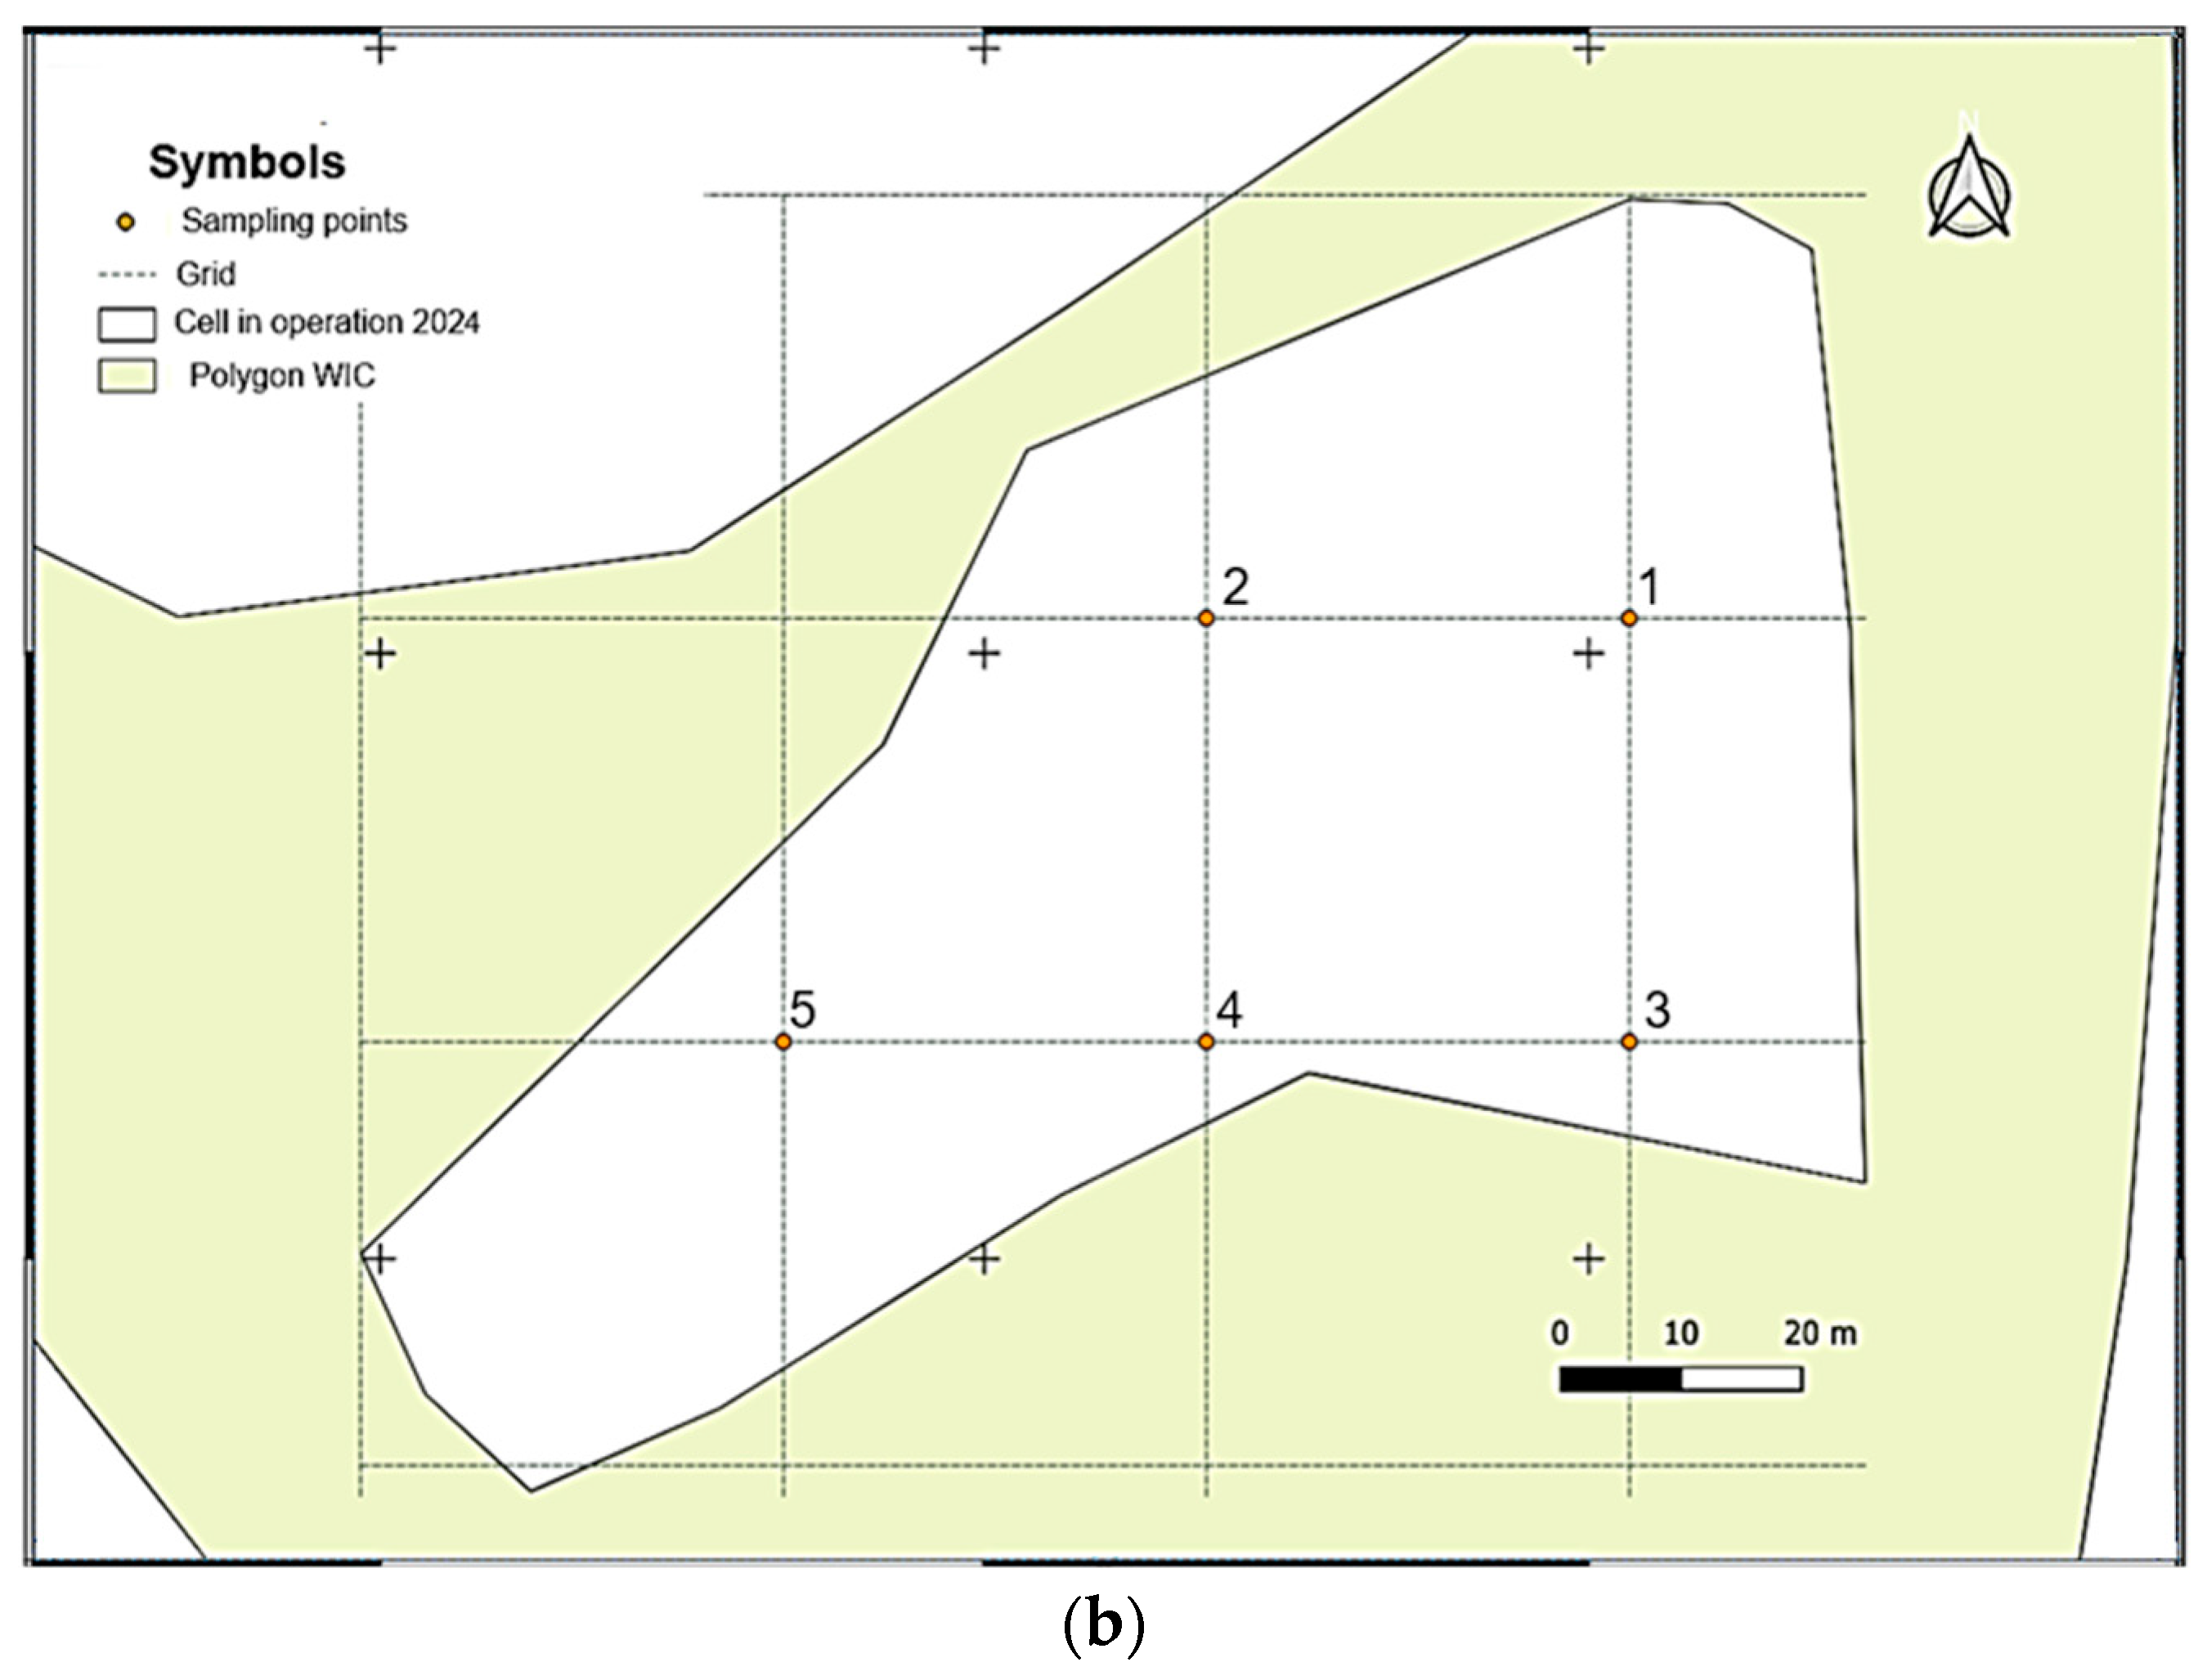
The QGIS software was used to delimit the polygons of the WIC and the operational cell where the MSW was deposited in each sampling period. Given that the operative cell area did not exceed 0.7 ha during the two sampling campaigns conducted in 2023 and the two campaigns in 2024 (actual measured areas: 0.61 ha and 0.68 ha, respectively), and considering that sampling was performed at depths greater than 30 cm, five sampling points were required per campaign in accordance with Table 2 (Detailed Sampling) of the NMX-AA-132-SCFI-2016 [38].
In QGIS, the geometric mesh-type pattern was generated using five equidistant points, where systematic sampling was to be carried out. Figure 4 shows the geopositioned sampling points for each year. It is worth noting that the polygons differ due to the dynamic nature of MSW disposal in the WIC.
Figure 4.
Sampling points of the cell in operation: (a) Sampling points in 2023 with a view of the WIC polygon; (b) sampling points in 2024 with a view of the cell in operation.
The representativeness of the composite sample is attributable to the placement of the five equidistant sampling points of the GIS, which ensures uniform spatial coverage of the entire operational cell.
4.4. In Situ Sampling
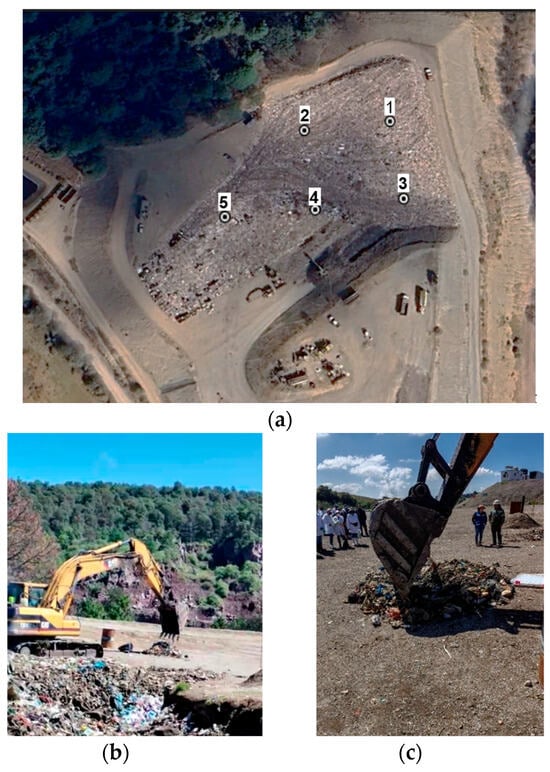
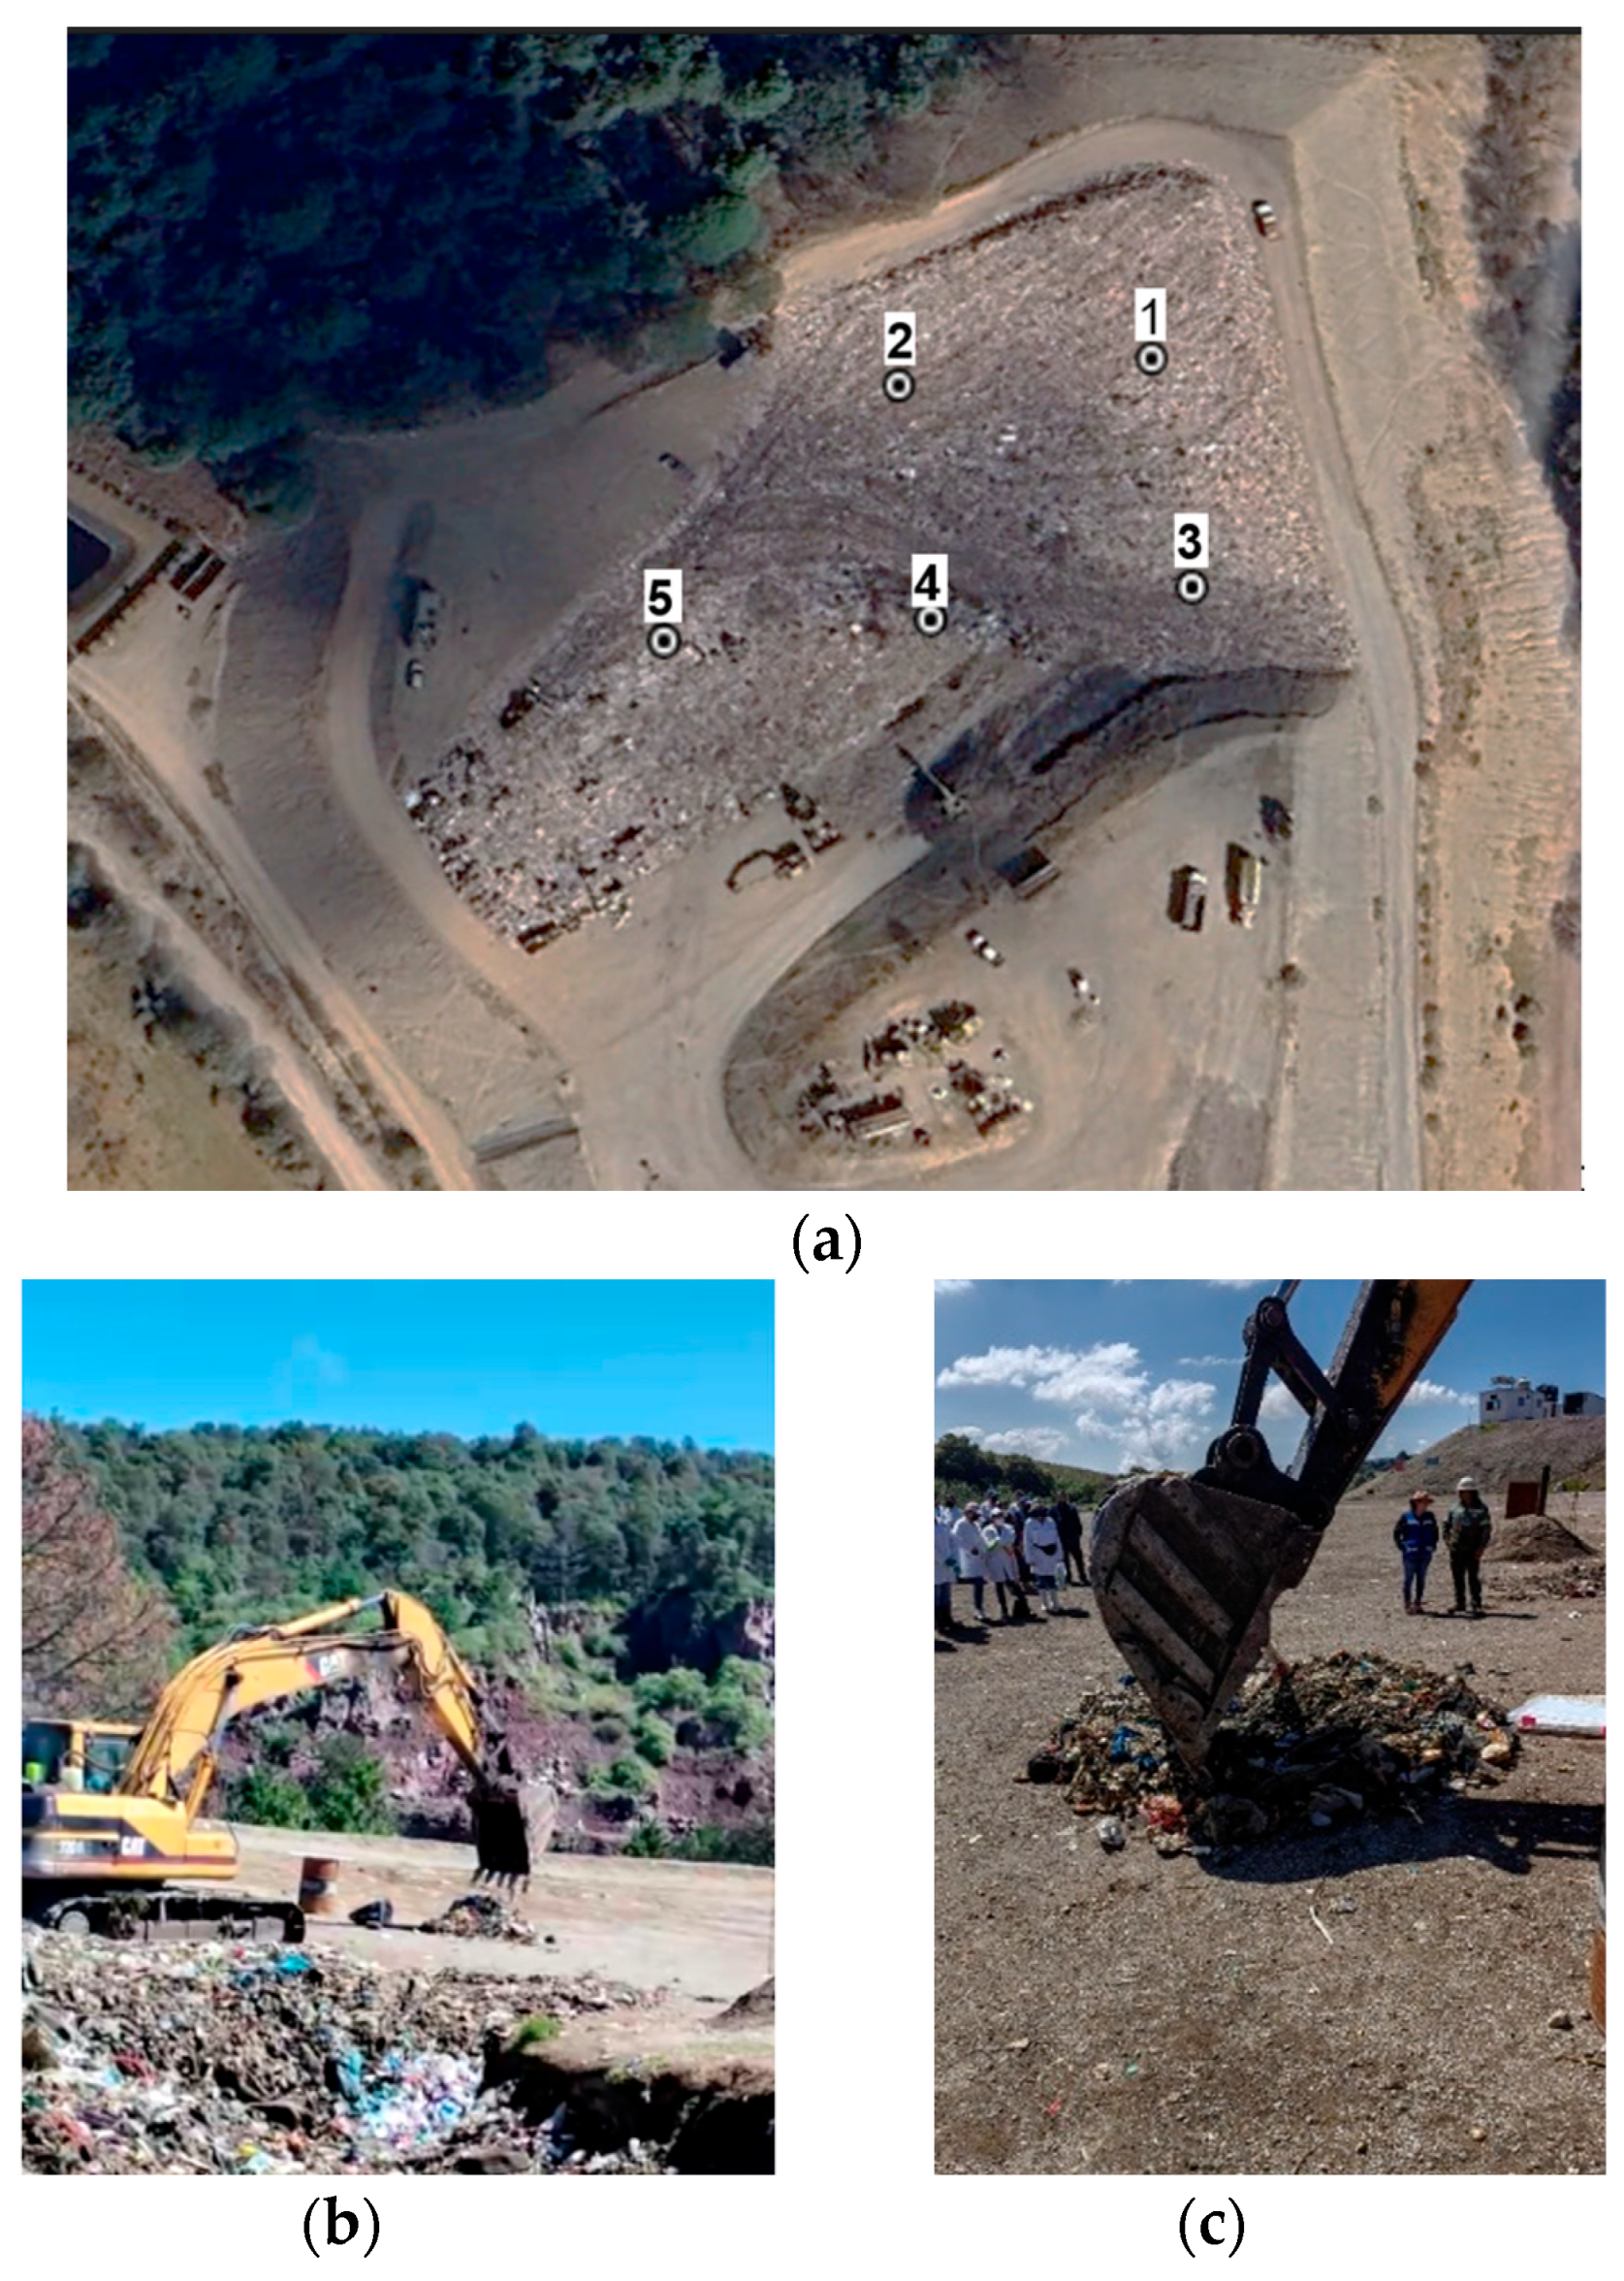
The sampling points in the operation cell were physically identified for each of the four planned sampling campaigns. It should be noted that the MSW in the cell had already been spread (Figure 5a) and compacted by Caterpillar 826C landfill machinery before sampling. Using a Caterpillar 416E backhoe loader, an approximately 100 kg composite sample of MSW was excavated from each of the five predetermined points and transported to a designated characterization area, which had previously been cleaned with a metal rake, for the start of the method quarter.
Figure 5.
MSW sampling in the cell in operation 2024: (a) Sampling points on the cell in operation 2024; (b) complete sample; (c) sample quartering with machinery.
As mentioned in Section 3.4, it is also possible to take samples with the help of a 200 L drum and shovels at the five points indicated in Table 2 of NMX-AA-132-SCFI-2016, according to the size of the study area; however, as it is a practically manual sampling, a greater number of participants or more work time will be required.
The WaCT methodology mentions manual bag sampling because it is applied to trucks arriving at a transfer station or an FDS; however, recyclers informally segregate MSW, so that MSW after final disposal will have different physical and physicochemical characteristics [5,21].
4.5. Composite Sampling Preparation
A heap of approximately 500 kg was formed from the MSW sampled at each of the five sampling points and then scrambled with a backhoe to generate the composite sample (Figure 5b). With the help of machinery, the quartering method described in NMX-AA-015-1985 (Figure 5c) was applied twice to obtain a sample of approximately 110–130 kg.
It is worth mentioning that the approximately 100 kg of MSW used for the physical characterization of by-products is close to the amounts reported in the ASTM D5231-92 (2016) (91–136 kg) and the WaCT (50–70 kg) methodologies [5,32].
4.6. Physical Characterization
The volumetric weights obtained in 2023 were 275.6 kg/m3 in DS and 329.9 kg/m3 in RS, while in 2024 they were 331.8 kg/m3 and 362.2 kg/m3 in DS and RS, respectively, with average seasonal values of 303.7 ± 39.7 kg/m3 in DS and 346.1 ± 22.8 kg/m3 in RS, and the two-year average was 324.86 ± 36.0 kg/m3. The volumetric weight determined in situ was higher in RS than in DS because MSW absorbs water during rainfall. The values obtained for this parameter are higher than those reported by [7,47] for samples collected at home (151.6 to 261.0 kg/m3). This difference is attributed to in situ sampling in the operative landfill cell, which occurs after mechanical compaction and partial biodegradation [2,7].
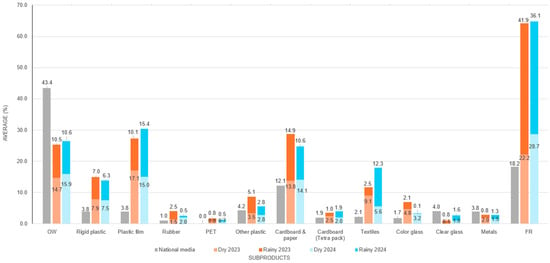
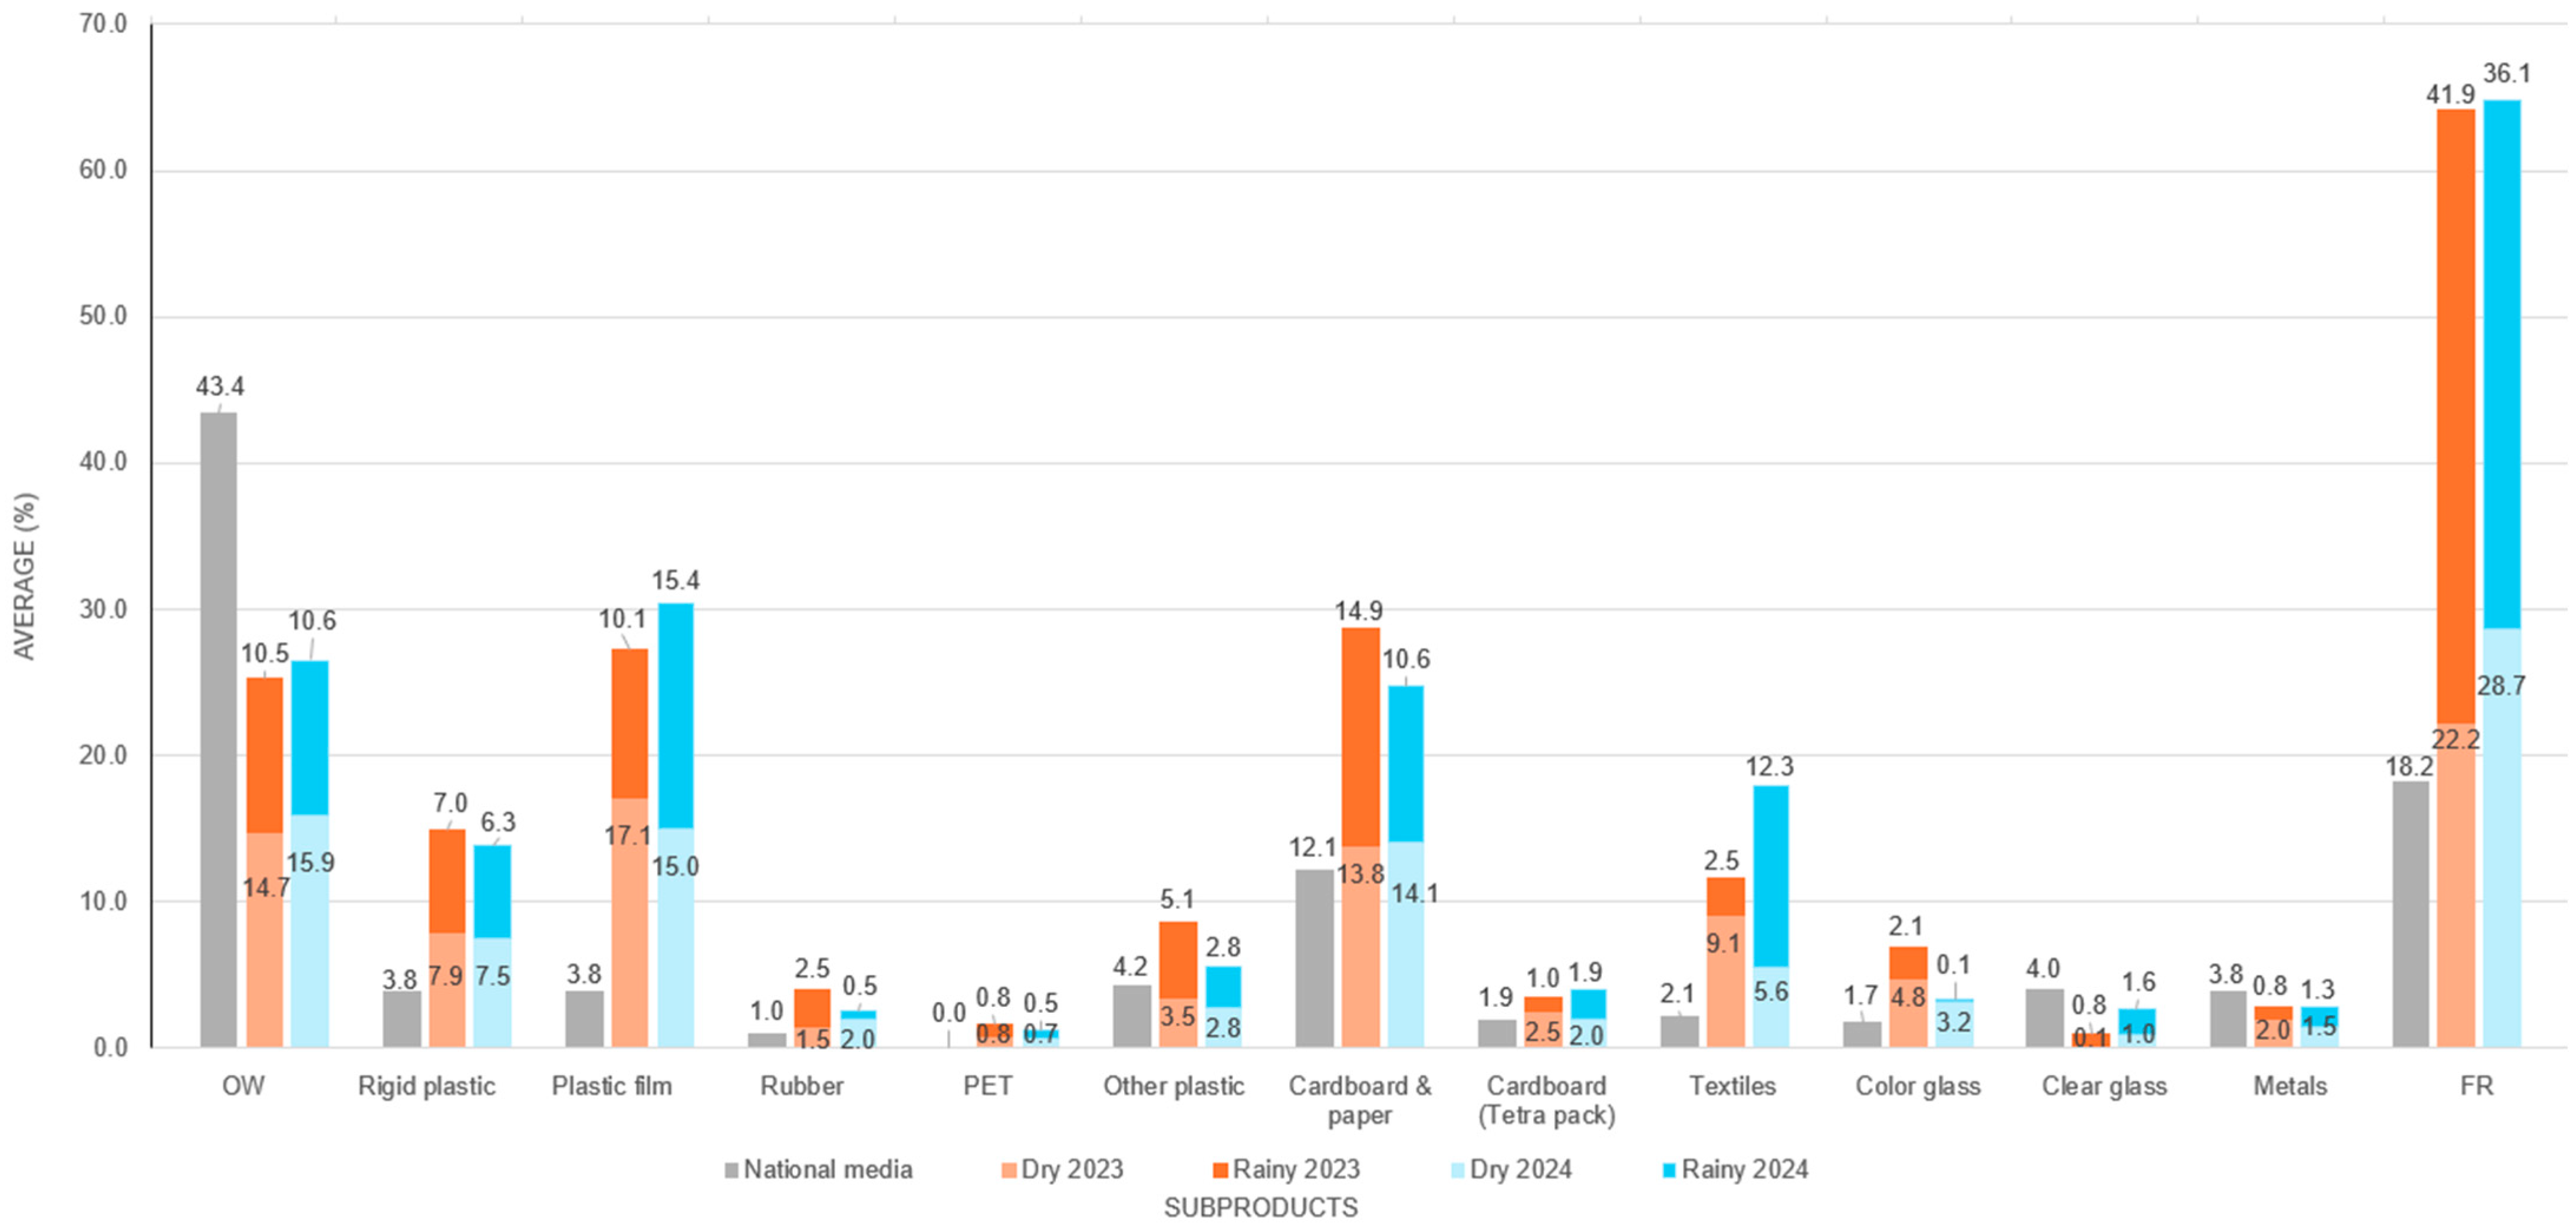
Figure 6 illustrates the average waste composition by season (DS and RS) for the two monitoring years (2023–2024), alongside the national average composition in 2022, for comparison [2]. Notably, the PRW may be further subdivided to prioritize high-value recovery streams or to enable material-specific characterization. To subcategorize the most recoverable PRW, the following by-products were grouped into metals—can, ferrous material, and non-ferrous material—and into other plastics—synthetic fibers, expanded polystyrene, and polyurethane.
Figure 6.
Physical characterization of MSW in the case study.
As can be seen in Figure 6, the by-products with the highest percentage in the four periods were RF of 22.2–41.9%, plastic films of 10.1–17.1%, OW of 10.5–15.9%, and cardboard and paper of 10.6–14.9%, where the last three are suitable for recovery.
Regarding the composition of OW (10.5–15.9%), its values are lower than the national average (49.8%) of 2022, lower than the results of the home studies in Table 1 (27.2–73.7%), and lower than many of the studies carried out in collection trucks in Table 2 (15.4–70.4%). For the in situ studies in Table 3, the range was 6.0–68.8%, indicating that this fraction decreases due to degradation and is ultimately deposited in the FDS [2,17,25,45,46,54,66]. The low OW content in the WIC can be attributed to the fact that the waste sampled in the cell has already gone through biodegradation processes (transport from the house to the FDS) and compaction (machinery operation) after its deposit, so that, as it is adhered to inorganic waste, it is difficult to separate and adds to the RF.
The PRW characterized in situ that exceeded the reported national average were, in descending order: plastic film, cardboard and paper, rigid plastic, and textiles. The PRW with values lower than the national average are transparent glass and metals, rigid plastic, colored glass, Tetra Pak and metals, which present higher values in the DS than in the RS, while the other by-products show variations both seasonally and annually. As can be seen in Figure 6, the PRW detected in situ with the greatest recycling potential are plastic film, paper and cardboard, textiles, other plastics and colored glass, while the fractions of PET and metals were less than 1.0 and 2.0% respectively, since they are separated during their transport from homes to the FDS, due to their commercial value in recyclable collection centers [2,85].
Comparisons of MSW characterization results between developed and developing countries are strongly associated with socioeconomic status, consumption patterns, and the efficiency of waste management systems. For example, in developing countries, the organic fraction constitutes the predominant component of MSW (40–85%), and this proportion contributes significantly to greenhouse gas (GHG) emissions, primarily as CH4 [16,44,46,67]. In developed countries, however, this share tends to be lower (25–45%), largely due to mandatory source-separation policies and differing consumption patterns [34,43,48].
Furthermore, PRW consistently comprises paper and cardboard as the dominant fraction across both high- and low-income countries, followed by plastics. In the European Union, mandatory source separation is enforced, as waste management programs are specifically designed to maximize material recovery and reintegrate these fractions into the circular economy. For instance, Italy has demonstrated that separate collection of specific waste streams (e.g., glass, green waste, and wood) has achieved recovery efficiencies exceeding 90% [25]. In developing countries, PRW also represents significant recovery potential; for example, in Mexico and Peru, materials such as PET, metals, paper, and glass are frequently recovered informally by waste pickers before reaching final disposal facilities or within them. This informal recovery systematically reduces the quantities of these materials reported in waste characterization studies conducted at FDSs [19,44,62].
Table 7 presents the values of the physical characterizations carried out in both stations in 2023 and 2024, as well as their averages by seasonality and on an annual basis; Table 8 shows the statistics calculated for the descriptive analysis, observing marked variations in the behavior of the four variables analyzed according to the time of year.
Table 7.
Physical characterizations in 2023 and 2024.
Table 8.
Statistics for descriptive analysis.
The 1.0% decrease in the average PRW between 2023 and 2024 is attributed to increased social interest in materials with economic potential—such as rigid plastic, polyethylene terephthalate (PET), metals, and cardboard—as well as to the expansion of registered recycling collection centers nationwide, which increased from 173 facilities in 2020 to 874 in 2025 [84]. Although informal segregation exists in the WIC of Tenango del Valle, in situ physical characterization studies showed high percentages of PRW (Table 7), which can be attributed to the mixed collection of MSW across the 11 municipalities that enter this FDS. The high PRW values determined in this study provide important information to support the development of projects for their use. The PRW results in this FDS are consistent with those performed in other FDS in Mexico, such as Morelia (65.7–68.3%) and Zinacantepec (46.9–57.0%), and notably higher than those reported from studies in Texas (35.0–48.2%) or Bhandwari, India (17.0%) [9,33,53,86].
The mean volumetric weight increased during the RS compared to the DS, presenting greater stability in the RS according to the coefficient of variation and range. With respect to the 2024 annual averages, the volumetric weight showed less variability and uncertainty. A similar trend from DS to RS was observed for the RF variable, which also showed remarkable stability across both periods (Table 8). The increase in RF in RS can be attributed to the fact that humidity accelerates biodegradation and generates more miscellaneous by-products, which are difficult to separate due to mixing.
On the contrary, the OW and PRW variables exhibited their highest means in DS, decreased in RS, and at this time presented the lowest values for both the coefficient of variation and uncertainty. As for the years, there is no clear pattern: in 2024, the mean, coefficient of variation, and uncertainty were higher for the OW, whereas in 2023, these statistics were higher for the PRW.
The seasonal differences shown in the characterizations of this work are consistent with the study by [17,39,46,65], where variations between seasons were also observed; however, it was not possible to determine the existence of significant differences between the means of the seasons or the annual means due to the limited number of samples.
4.7. Physicochemical Characterization
Table 9 shows the results for the four sampled periods, with seasonal variations between DS and RS observed in 2023. The pH range in the samples was 6.60–8.30, similar to that reported as 6.77–8.94 for the MSW characterized in Zinacantepec in 2017 [19], with seasonal and annual average values close to neutrality, although slightly acidic in the DS. The moisture range was 9.6–15.40%; values within the range (2.53 to 40.99%) were also reported for Zinacantepec in 2017 and were lower compared to what was reported for Istanbul and Crete (62.41% and 36.72%, respectively), since the FDS of these cities are located in coastal areas, while Zinacantepec is in the central area of Mexico [9,19,34,82]. The average moisture content (M%) was 15.2% higher in RS and only 4.3% annually; the observed seasonal difference is due to MSW absorbing water from RS.
Table 9.
Physicochemical parameters.
For ash content, its range was 26.2–43.6%, a percentage significantly higher than the values reported in MSW studies in Crete (7.3%) or Texas (4.9−7.1%) [9,34], which suggests a greater presence of inert materials. The average values of this parameter were higher in RS and in 2023. The TVS ranged from 54.4 to 73.8%, with greater seasonal than annual variability, and showed the highest average in DS. High TVS contents indicate a large amount of available organic matter, an important potential factor in the generation of methane (CH4) via anaerobic degradation. These results are of the highest importance for planning energy-use projects in the FDS [1,16,52].
The proposed methodology can be applied by public or private companies that operate FDS or provide professional services, to carry out specific studies in an FDS, whether it is WIC type, sanitary landfill, controlled site or open-air dump, either in operating or closed cells; since the integration of open-source GIS and the systematic sampling protocol of NMX-AA-132-SCFI-2016, allows the location of the polygon to be generated in any geographical location and the geopositioning of equidistant sampling points reduces the bias associated with their selection arbitrarily [38,73,74]. In addition, its application in two seasons (DS and RS) demonstrates its reproducibility in different climatic conditions. The results obtained using the proposed methodology will provide the FDS with physical and physicochemical characteristics representative of the MSW under its conditions.
This methodology constitutes a feasible alternative for determining the physical composition and physicochemical characteristics of MSW ultimately disposed of in an FDS, following informal segregation across the different stages of its management [21,86]. In addition, when performing surface sampling (30–60 cm of depth), the incorporation of anaerobically degraded or muddy materials, typical of deep borehole sampling, is reduced [18].
Methodologies such as ASTM D5231-92 (2024), WaCT, USEPA, and those specific to each country focus on studies at the sources of generation (Table 1) and in collection of vehicles (Table 2). The methodologies reported in previous studies to characterize MSW in SDS (Table 3) use random surface sampling and deep drilling but do not specify how many samples should be collected or how and lack a technical framework for spatial representativeness.
The proposed methodology explains how to conduct MSW sampling after its final disposal in an FDS that receives waste from one or more municipalities and how to determine the volumetric weight and composition of its by-products. In addition, the proposed methodology would help reduce the expenses required to conduct characterization studies at the point of generation and in collection trucks, including the costs of trained personnel, materials, equipment, and transportation [29,30,31].
It is important to mention that the data obtained correspond to the relative SDG 11.6.1 indicators: the proportion of MSW managed in controlled facilities, and the composition of waste, which also helps estimate the amount of MSW recovered [86]. In addition, the characterization of the MSW in situ allow to identifying areas of opportunity in the waste collection and transport, since in both periods more than 50% of PRW was detected (Table 7), to the point of evidencing improvements in the operation of the site, either to evaluate the design or implementation of sustainable projects for the use of PRW, such as separation plants or composting plants for OW, which would support the extension of the useful life of the FDS [7,8,9,37].
Knowing the composition of the by-products that make up MSW is necessary as an input element for mathematical models of biogas emission projection studies, such as the Mexican Biogas Model, Meruelo, IPCC, among others [4,48,49,77,86]. This information can support operational and planning decision-making, both to optimize the management of the SDG and to evaluate the technical and economic feasibility of the energy use of biogas for electricity generation, which favors a more sustainable operation and the mitigation of GHG emissions [3,16,17,71]. The results of the physicochemical parameters also indicate the energy potential of MSW for use in technologies such as incineration and landfill mining decisions in the cells of the FDS, as well as to know the level of degradation of MSW and estimate with less uncertainty its life as an environmental liability to propose accelerated stabilization strategies [50,51,52].
A limitation of the proposed methodology is that, due to the small sample size (two per seasonality for two years = 4), it was not possible to perform a statistical analysis for the comparison of the difference between the means (two-factor ANOVA) to determine the effect of seasonality and the year, so for subsequent studies it is recommended to carry out at least three samplings per season for a two-year study, or two samplings per season for three years to have six samples per station. If only one sample can be taken per station, the study must be extended to five years to obtain at least five samples per season. Another limitation is that in an FDS, the MSW is disposed of in a sectional manner; that is, in one section of the cell, the OW is preferably disposed of, and in another section, non-hazardous waste from commerce and/or industry is disposed of, and the responsible person for the characterization is not informed, so that the composite sample would not be representative. In this case, the proposed methodology must be applied independently in each section to ensure the representativeness of the samples and to avoid bias in the characterization; however, this would increase time, operating costs, human resources, and machinery requirements.
5. Conclusions
In the absence of a standardized methodology to characterize MSW in situ after its disposal at FDSs, this work proposes an innovative methodology that implements the use of GIS as a cutting-edge technique and the NMX-AA-132-SCFI-2016 to obtain a representative composite sample, and demonstrates its applicability with studies carried out in a WIC in Tenango del Valle, Estado de México, during the dry (DS) and rainy seasons (RS) of 2023 and 2024.
Studies published between 2005 and 2025 show that the most common type of study was MSW characterization studies at the point of generation, followed in number by studies in FDS and in collection trucks.
Although there are standardized methods for characterization studies at the point of generation at the national and international levels, heterogeneity was observed in the procedures and types of by-products, with physical classifications ranging from 3 to 37 by-products and study durations of 7–13 days.
For characterization studies in trucks, USEPA and ASTM standardized methods are commonly used, along with national methodologies and proposals from individual research groups. Their characterizations are random, with a range of 6-27 waste by-products, and study durations of 5–10 days.
The reviewed characterization studies show a decreasing trend in the proportion of OW, with reported ranges of 27.2–73.7% at the household level, 15.4–70.4% in collection trucks, and 6.0–68.8% at FDS. This decline is attributable to the progressive degradation of OW during its transport from the point of generation to final disposal.
The seasonal characterizations carried out in 2023 and 2024 showed the highest values of Volumetric weight, Residual fraction, and moisture content in the RS, while the OW and PRW had the highest values in the DS; however, it was not possible to determine the existence of significant differences between the means of the seasons or the annual means due to the limited number of samples.
The high percentages of PRW determined in situ can be attributed to mixed household collection and show the opportunity to recover them, especially in the DS.
The use of the proposed methodology enables representative in situ characterization of MSW after disposal with a lower level of significance, and it can be useful for decision-making regarding sustainable waste management projects.
Author Contributions
Author Contributions: Conceptualization, G.I.H.-C., L.V.D.-A. and M.d.C.H.-B.; Methodology, G.I.H.-C., M.S.N., M.d.C.M.-S. and M.d.C.H.-B.; software, G.I.H.-C. and M.d.C.M.-S.; Validation, M.d.C.H.-B. and M.d.C.M.-S.; Formal analysis, L.V.D.-A., M.S.N. and F.C.-R.; Investigation, G.I.H.-C., M.S.N. and M.d.C.H.-B.; Writing—original draft preparation, G.I.H.-C., M.S.N. and M.d.C.H.-B.; Review and editing: M.d.C.H.-B., L.V.D.-A. and F.C.-R.; Supervision, L.V.D.-A. and F.C.-R.; Project administration, M.d.C.H.-B.; funding acquisition, M.d.C.H.-B. All authors have read and agreed to the published version of the manuscript.
Funding
This research was funded by the Tecnológico Nacional de México through the research project “Proposal for the operation of a sanitary landfill from a sustainability perspective” with code 18196.23-P.
Data Availability Statement
The original contributions presented in this study are included in the article. Further inquiries can be directed to the corresponding authors.
Acknowledgments
The authors thank the company “Constructora y Operadora de Rellenos Sanitarios, S.A. de C.V.” for the facilities provided for the in situ characterization of the disposed MSW. They also thank the Secretariat of Science, Humanities, Technology and Innovation (SECIHTI) for the maintenance scholarships awarded to one student in Environmental Sciences at the Tecnológico Nacional de México/Instituto Tecnológico de Toluca.
Conflicts of Interest
The authors declare no conflicts of interest.
Abbreviations
The following abbreviations are used in this manuscript:
| CO2 | Carbon dioxide |
| CH4 | Methane |
| DS | Dry season |
| GHG | Greenhouse gases |
| GIS | Geographic information systems |
| FDS | Final disposal site |
| M | Moisture content |
| MSW | Municipal solid waste |
| OW | Organic waste |
| pH | Potential of hydrogen |
| PRW | Potentially recyclable waste |
| RS | Rainy season |
| SDG | Sustainable Development Goals |
| TS | Total solids |
| TVS | Total volatile solids |
| USEPA | United States Environmental Protection Agency |
| WaCT | Waste Wise Cities Tool |
| WIC | Waste integral center |
References
- UNEP, United Nations Environment Programme; ISWA, International Solid Waste Association. Global Waste Management Outlook 2024: Beyond an Age of Waste—Turning Rubbish into a Resource. 2024. Available online: https://wedocs.unep.org/handle/20.500.11822/44939 (accessed on 26 January 2025).
- SEMARNAT, Secretaría del Medio Ambiente y Recursos Naturales. Basic Diagnosis for Integrated Waste Management. 2026. Available online: https://www.gob.mx/cms/uploads/attachment/file/1078946/Diagn_stico_B_sico_Gesti_n_Integral_Residuos.pdf (accessed on 21 May 2026).
- Manheim, D.; Yesiller, N.; Hanson, J. Gas Emissions from Municipal Solid Waste Landfills: A Comprehensive Review and Analysis of Global Data. J. Indian Inst. Sci. 2021, 101, 625–657. [Google Scholar] [CrossRef] [Scilit]
- IPCC. 2019 Refinement to the 2006 IPCC, Guidelines for National Greenhouse Gas Inventories; Waste; IPCC: Geneva, Switzerland, 2019; Volume 5, Available online: https://www.ipcc-nggip.iges.or.jp/public/2019rf/pdf/5_Volume5/19R_V5_3_Ch03_SWDS.pdf (accessed on 26 January 2025).
- UN-Habitat. Waste Wise Cities Tool: Step-by-Step Guide to Assess a City’s Municipal Solid Waste Management Performance Through SDG Indicator 11.6.1 Monitoring; United Nations Human Settlements Programme. 2021. Available online: https://unhabitat.org/sites/default/files/2021/02/Waste%20wise%20cities%20tool%20-%20EN%203.pdf (accessed on 26 January 2025).
- Castaño Martínez, C. Los Pilares Del Desarrollo Sostenible: Sofisma o Realidad; Universidad Santo Tomás: Bogotá, Colombia, 2013; Available online: https://repository.usta.edu.co/bitstreams/43cf8f5f-b13e-4e65-a68a-6f0167fdd260/download (accessed on 6 February 2025).
- Fetenea, Y.; Gobena, B.; Birhan, M. Quantification and Characterization of Municipal Solid Waste as a Measure Towards Effective Waste Management in Metu Town, South-West Ethiopia. Adv. Recycl. Waste Manag. 2022, 7, 6. [Google Scholar]
- Rada, E.; Cioca, L. Optimizing the Methodology of Characterization of Municipal Solid Waste in EU Under a Circular Economy Perspective. Energy Procedia 2017, 119, 72–85. [Google Scholar] [CrossRef] [Scilit]
- Yildiz, S.; Yaman, C.; Demir, G.; Coban, A.; Sezer, K. Characterization of Municipal Solid Waste in Istanbul, Turkey. Environ. Prog. Sustain. Energy 2012, 32, 3. [Google Scholar] [CrossRef] [Scilit]
- Norma Técnica Estatal NTEA-020-SeMAGEM-RS-2019; Que Establece las Condiciones Para la Instalación y Operación de Los Centros Integrales de Residuos en el Estado de México. Periódico Oficial del Gobierno del Estado Libre y Soberano de México (POGELSEM). Gaceta del Gobierno (G.G.): Toluca, Mexico, 2019. Available online: http://legislacion.edomex.gob.mx/sites/legislacion.edomex.gob.mx/files/files/pdf/gct/2019/nov121.pdf (accessed on 20 February 2026).
- Norma Técnica Estatal NTEA-006-SMA-RS-2006; Que Establece Los Requisitos y Especificaciones Para la Instalación, Operación y Mantenimiento de la Infraestructura Para el Acopio, Transferencia, Separación y Tratamiento de Residuos Sólidos Urbanos y de Manejo Especial, Para el Estado de México. Periódico Oficial del Gobierno del Estado Libre y Soberano de México. Gaceta del Gobierno (G.G.). Toluca, Mexico, 2006. Available online: http://legislacion.edomex.gob.mx/sites/legislacion.edomex.gob.mx/files/files/pdf/gct/2006/oct091.pdf (accessed on 20 February 2026).
- Song, S.; Zheng, C.; Xiong, K. Research Progress on Stability of Garbage Dump in Large-scale Landfill. Highlights Sci. Eng. Technol. 2022, 11, 177–185. [Google Scholar] [CrossRef] [Scilit]
- Colomer-Mendoza, J.F.; Esteban-Altabella, J.; García-Darás, F.; Gallardo-Izquierdo, A. Influence of the Design on Slope Stability in Solid Waste Landfills. Earth Sci. 2013, 2, 31–39. [Google Scholar] [CrossRef] [Scilit]
- Irto, A.; Crea, F.; Alessandrelio, C.; De Stefano, C.; Somma, R.; Zaffino, G.; Zaccaro, S.; Papamikolau, G.; Cigala, R.M. Landfill leachate from Municipal Solid Waste: Multi-technique approach for its fine characterization and determination of the thermodynamic and sequestering properties towards some toxic metals. Sci. Total Environ. 2024, 917, 170311. [Google Scholar] [CrossRef] [Scilit] [PubMed]
- Abilmagzhanov, A.; Ivanov, N.; Kholkin, O.; Adelbaev, I. Assessment of the Energetical and Biological Characteristics of Municipal Solid Waste from One of the Largest Landfills in Kazakhstan. Recycling 2022, 7, 80. [Google Scholar] [CrossRef] [Scilit]
- Jabeen, F.; Adrees, M.; Ibrahim, M.; Waqas, M.; Mahmood, A.; Noreen, U.; Aslam, A. Characterization for optimizing the integrated management of solid waste for energy recovery and circular economy. Environ. Sci. Pollut. Res. 2023, 32, 12236–12247. [Google Scholar] [CrossRef] [Scilit] [PubMed]
- Cheela, V.; Sudha, G.; John, M.; Dubey, B. Characterization of municipal solid waste based on seasonal variations, source and socio-economic aspects. Waste Dispos. Sustain. Energy 2021, 3, 275–288. [Google Scholar] [CrossRef] [Scilit]
- Shcherbinina, I.; Polygalov, S.; Ilinykh, G.; Sliusar, N.; Stanisavljevic, N. Energy Potential Assessment of Excavated Landfill Material: A Case Study of the Perm Region, Russia. Recycling 2022, 7, 7. [Google Scholar] [CrossRef] [Scilit]
- Díaz-Archundia, L.V.; Buenrostro-Delgado, O.; Mañón-Salas, M.C.; Hernández-Berriel, M.C. Greenhouse gas emissions at two municipal solid waste disposal sites in Mexico. Ing. Investig. Y Tecnol. 2017, 18, 149–159. [Google Scholar]
- Martínez-Morales, I.; Hernández-Berriel, M.; Ojeda Benítez, S.; Mañón Salas, M.; Flores Álamo, N. Proposal for a segregation plant in a landfill, case study. In Proceedings of the Libro de Actas. VII Simposio Iberoamericano En Ingeniería de Residuos; Universidad de Cantabria: Santander, Spain, 2017; pp. 86–90. [Google Scholar]
- Botello-Álvarez, J.E.; Rivas-García, P.; Fausto-Castro, L.; Estrada-Baltazar, A.; Gomez-Gonzalez, R. Informal collection, recycling and export of valuable waste as transcendent factor in the municipal solid waste management: A Latin-American reality. J. Clean. Prod. 2018, 182, 485–495. [Google Scholar] [CrossRef] [Scilit]
- Favela Ávila, H.; Ojeda Benítez, S.; Cruz-Sotelo, S.E.; Taboada González, P.; Aguilar Virgen, Q. Pickers in the recovery of recyclables at final disposal sites in Baja California, Mexico. Rev. Int. De Contam. Ambient. 2013, 29, 59–65. [Google Scholar] [CrossRef] [Scilit]
- Fidelis, R.; Marco-Ferreira, A.; Antunes, L.C.; Komatsu, A.K. Socio-productive inclusion of scavengers in municipal solid waste management in Brazil: Practices, paradigms and future prospects. Resour. Conserv. Recycl. 2020, 154, 104594. [Google Scholar] [CrossRef] [Scilit]
- Wei, F.; Zhu, Q.; Pourhejazy, P.; Liu, C. Contract vs recruitment: Integrating an informal waste merchant to a formal collector for collection of municipal solid waste. J. Clean. Prod. 2021, 287, 125004. [Google Scholar] [CrossRef] [Scilit]
- Lubello, C.; Fiaschi, S.; Notari, G. Municipal solid waste composition and efficiency of separate collection: A case study in Italy. Clean. Waste Syst. 2025, 11, 100272. [Google Scholar] [CrossRef] [Scilit]
- Montes, S. Six Countries Around the World Recycle More than 50% of Their Waste During the Year, Diario La República. 2019. Available online: https://www.larepublica.co/responsabilidad-social/seis-paises-alrededor-del-mundo-reciclan-mas-de-50-de-su-basura-durante-el-ano-2813051 (accessed on 6 March 2025).
- UNEP, United Nations Environment Programme. Waste Management Perspective in Latin America and the Caribbean. 2018. Available online: https://wedocs.unep.org/bitstreams/6e343983-deb6-4640-9c19-31193319cc3e/download (accessed on 6 March 2025).
- FEDOMU, Federación Dominicana de Municipios. Guide for Conducting Characterization Studies of Municipal Solid Waste. 2022. Available online: https://biblioteca.fedomu.org/wp-content/uploads/2023/10/Guia-para-realizacion-de-Estudios-de-Caracterizacion-de-Residuos-Solidos-Municipales.pdf (accessed on 9 March 2025).
- NMX-AA-061-1985; Environmental Protection Soil Contamination -Municipal Solid Residues-Determination of Generation. SCFI, Secretaría de Comercio y Fomento Industrial: Mexico City, Mexico, 1985. Available online: https://platiica.economia.gob.mx/normalizacion/wp-content/uploads/sites/2/PDF_Normas_Publicas/nmx-aa-061-1985.pdf (accessed on 12 March 2024).
- MADES, Ministerio del Ambiente y Desarrollo Sostenible; PNUD, Programa de las Naciones Unidas para el Desarrollo; FMAM, Fondo para el Medio Ambiente Mundial. Methodological Guide for the Characterization of Urban Solid Waste. Project Asunción Green City of the Americas—Pathways to Sustainability. 2019. Available online: https://estadisticasambientales.ine.gov.py/documentos_single.php?id=59 (accessed on 12 March 2025).
- MINAM, Ministerio del Ambiente. Guide for the Characterization of Municipal Solid Waste. Perú. 2019. Available online: https://cdn.www.gob.pe/uploads/document/file/523785/Gu%C3%ADa_para_la_caracterizaci%C3%B3n_rsm-29012020__1_.pdf?v=1581976231 (accessed on 13 March 2025).
- ASTM D5231-92; Standard Test Method for Determination of the Composition of Unprocessed Municipal Solid Waste. ASTM, Advancing Standards Transforming Market: West Conshohocken, PA, USA, 2024. Available online: http://www.astm.org/Standards/D5231.htm (accessed on 23 July 2025).
- USEPA, United States Environmental Protection Agency. Waste Characterization Handbook. Understanding Municipal Waste Streams to Develop Data-Driven Methane Mitigation Strategies. 2024. Available online: https://www.globalmethane.org/documents/WasteCharacterizationHandbook.pdf (accessed on 23 July 2025).
- Gidarakos, E.; Havas, G.; Ntzamilis, P. Municipal solid waste composition determination supporting the integrated solid waste management system in the island of Crete. Waste Manag. 2006, 6, 668–679. [Google Scholar] [CrossRef] [Scilit] [PubMed]
- NMX-AA-015-1985; Environmental Protection—Soil Pollution—Municipal Solid Residues—Sampling—Quarter Method. SCFI, Secretaría de Comercio y Fomento Industrial: Mexico City, Mexico, 1985. Available online: https://platiica.economia.gob.mx/normalizacion/wp-content/uploads/sites/2/PDF_Normas_Publicas/nmx-aa-015-1985.pdf (accessed on 20 February 2023).
- NMX-AA-022-1985; Environmental Protection-Soil Pollution-Municipal Solid Residues-by-Products Selection and Quantification. SCFI, Secretaría de Comercio y Fomento Industrial: Mexico City, Mexico, 1985. Available online: https://biblioteca.semarnat.gob.mx/janium/Documentos/Ciga/agenda/DOFsr/NMX-AA-022-1985.pdf (accessed on 20 February 2023).
- De Miguel, C.; Martinez, K.; Pereira, M.; Kohout, M. Circular Economy in Latin America and the Caribbean: An Opportunity for a Transformative Recovery. 2021. Available online: https://repositorio.cepal.org/server/api/core/bitstreams/5fceda72-3fed-4ace-bb87-5688547cf2f5/content (accessed on 15 August 2025).
- NMX-AA-132-SCFI-2016; Soil Sampling for Metals and Metalloids Identification and Quantification, and Sample Handling. SCFI, Secretaría de Comercio y Fomento Industrial: Mexico City, Mexico, 2016. Available online: http://www.economia-nmx.gob.mx/normas/nmx/2010/nmx-aa-132-scfi-2016.pdf (accessed on 20 February 2023).
- Gómez, G.; Meneses, M.; Ballinas, L.; Castells, F. Seasonal characterization of municipal solid waste (MSW) in the city of Chihuahua, Mexico. Waste Manag. 2009, 29, 2018–2024. [Google Scholar] [CrossRef] [Scilit] [PubMed]
- Thaiyalnayaki, D.; Jayanthi, R. Characterization and Composition of Municipal Solid Waste—A Case Study. Int. J. Civ. Eng. Technol. 2016, 7, 6. [Google Scholar]
- Abdulredha, M.; Khaddar, R.; Jordan, D.; Hashim, K. The Development of a Waste Management System in Kerbala during Major Pilgrimage Events: Determination of Solid Waste Composition. Procedia Eng. 2017, 196, 779–784. [Google Scholar] [CrossRef] [Scilit]
- Garduño-Palomino, K.; Ojeda-Benitez, S.; Armijo de Vega, C. Characterization of solid waste generated by the commercial sector of Mexicali, B. C. Rev. Int. DE Contam. Ambient. 2012, 28, 19–25. [Google Scholar] [CrossRef] [Scilit]
- Chang, N.; Davila, E. Municipal solid waste characterizations and management strategies for the Lower Rio Grande Valley, Texas. Waste Manag. 2008, 28, 776–794. [Google Scholar] [CrossRef] [Scilit] [PubMed]
- Ojeda-Benítez, S.; Armijo-de Vega, C.; Marquez-Montenegro, M.I. Household solid waste characterization by family socioeconomic profile as unit of analysis. Resour. Conserv. Recycl. 2008, 52, 992–999. [Google Scholar] [CrossRef] [Scilit]
- Taboada-González, P.A.; Aguilar-Virgen, Q.; Ojeda-Benitez, S. Statistical Analysis of Domestic Solid Waste in a Border Municipality of Mexico. Av. En. Cienc. E Ing. 2011, 2, 9–20. [Google Scholar] [CrossRef] [Scilit]
- Meetei, W.C.; Suma, S.; Singh, L.S. Physical Compositions and Characteristics of Municipal Solid Waste: A Case Study of Imphal City, Manipur. Holist. Approach Environ. 2025, 15, 78–84. [Google Scholar] [CrossRef] [Scilit]
- Saldaña Durán, C.E.; Hernández Rosales, I.P.; Messina Fernández, S.; Pérez Pimienta, J.A. Physical Characterization of Municipal Solid Waste and the Added Value of Recoverable Materials at the El Iztete Landfill, in Tepic-Nayarit, Mexico. Rev. Int. De Contam. Ambient. 2013, 29, 25–32. [Google Scholar] [CrossRef] [Scilit]
- Sang Cho, H.; Sun Moon, H.; Young Kim, J. Effect of quantity and composition of waste on the prediction of annual methane potential from landfills. Bioresour. Technol. 2012, 109, 86–92. [Google Scholar] [CrossRef] [Scilit] [PubMed]
- Sel, I.; Çakmakcı, K.; Özkaya, B.; Altan, H.S. Case study on prediction of remaining methane potential of landfilled municipal solid waste by statistical analysis of waste composition data. Waste Manag. 2016, 56, 310–317. [Google Scholar] [CrossRef] [Scilit] [PubMed]
- Quaghebeur, M.; Laenen, B.; Geysen, D.; Pontikes, Y.; Spooren, J. Characterization of landfilled materials: Screening of the enhanced landfill mining potential. J. Clean. Prod. 2013, 55, 72–83. [Google Scholar] [CrossRef] [Scilit]
- Sormunen, K.; Ettala, M.; Rintala, J. Detailed internal characterization of two Finnish landfills by waste sampling. Waste Manag. 2008, 28, 151–163. [Google Scholar] [CrossRef] [Scilit] [PubMed]
- Kaartinen, T.; Sormunen, K.; Rintala, J. Case study on sampling, processing and characterization of landfilled municipal solid waste in the view of landfill mining. J. Clean. Prod. 2013, 55, 56–66. [Google Scholar] [CrossRef] [Scilit]
- Gonzalez Razo, C.A.; Buenrostro Delgado, O. Composition of Municipal Solid Waste in Two Final Disposal Sites. Rev. Int. De Contam. Ambient. 2012, 28, 13–18. [Google Scholar] [CrossRef] [Scilit]
- Kebede, G.; Mekonnen, E.; Manikandan, A. Composition and Characterization of Municipal Solid Waste in Landfill Site: In case of Dilla city, Ethiopia. Environ. Sci. An. Indian J. 2018, 14, 170. [Google Scholar]
- Santana-Rodríguez, D.; De la Rosa-Gómez, I.; Mañón-Salas, C.; Carreño de León, M.C.; Hernández-Berriel, M.C. Physical characterization of urban solid waste at disposal sites, southern zone of the State of Mexico. In Proceedings of the Libro de Actas. VII Simposio Iberoamericano En Ingeniería de Residuos; Universidad de Cantabria: Santander, Spain, 2017; pp. 438–443. Available online: https://sites.google.com/uji.es/web-redisa/simposios-anteriores/vii-siir (accessed on 26 January 2025).
- GTEA, Grupo de Transparencia y Escucha Activa. Methodological Guide for the Preparation of Waste Composition Studies; ANEPMA, Asociación Nacional de Empresas Públicas de Medio Ambiente: Sevilla, Spain, 2020; Available online: https://anepma.es/boletin/wp-content/uploads/2020/12/Gu%C3%ADa-composici%C3%B3n-de-residuos_v01.pdf (accessed on 16 June 2025).
- Rosales-Flores, M.; Saldaña-Durán, C.; Toledo-Ramírez, V.; Maldonado, L. Characterization and recycling potential of urban solid waste generated at the Technological Institute of Tepic, a higher education institution. Rev. Bio Cienc. 2013, 2, 3. [Google Scholar] [CrossRef]
- Sarmiento Sarmiento, A.W. Characterization of solid waste management in the Desaguadero district—Puro-Peru. Rev. Investig. Altojardín 2015, 17, 65–72. [Google Scholar] [CrossRef] [Scilit]
- Pamani, A. Management of Municipal Solid Waste: A Study of Small Scale Municipality. Int. J. Eng. Sci. Res. Technol. 2015, 4, 1. [Google Scholar]
- Fazenda, A.J.; Tavares-Russo, M.A. Characterization of urban solid waste in Sumbe: A tool for waste management. Cienc. Holguín 2016, 22, 1–15. [Google Scholar]
- Ezeudu, O.B.; Ozoegwu, C.; Madu, C.N. A Statistical Regression Method for Characterization of Household Solid Waste: A Case Study of Awka Municipality in Nigeria. Recycling 2019, 4, 1. [Google Scholar] [CrossRef] [Scilit]
- Castro Velásquez, M.F.; Sandoval Ríos, J.E.; Mendoza Galicia, L. Characterization of Urban Solid Waste, Moche District—Trujillo—Peru. Cienc. Lat. Rev. Científica Multidiscip. 2022, 6, 11819–11833. [Google Scholar] [CrossRef] [Scilit]
- Awasthi, P.; Chataut, G.; Khatri, R. Solid waste composition and its management: A case study of Kirtipur Municipality-10. Heliyon 2023, 9, 11. [Google Scholar] [CrossRef] [Scilit] [PubMed]
- Yin, J.; Wang, M.; Yu, X.; Zhang, Y.; Chen, T.; Jianguo, L. Carbon footprint impact of waste sorting on the municipal household waste treatment system: A community case study of Hangzhou. Circ. Econ. 2024, 3, 100114. [Google Scholar] [CrossRef] [Scilit]
- Aguilar-Virgen, Q.; Taboada-González, P.; Ojeda-Benítez, S. Seasonal analysis of the generation and composition of solid waste: Potential use—A case study. Env. Monit. Assess. 2013, 185, 4633–4645. [Google Scholar] [CrossRef] [Scilit] [PubMed]
- Hemali, N.A.; De Alwis, A.P.; Wijesundara, M.; Y Edirisinghe, L.G.L.M. A method for determining the recycling value of unprocessed municipal solid waste in one cubic meter waste composition analysis technique. MethodsX 2024, 12, 102626. [Google Scholar] [CrossRef] [Scilit] [PubMed]
- Espinosa Lloréns, M.C.; López Torres, M.; Álvarez, H.; García, J.A.; Fernández, A. Characterization of municipal solid waste from the main landfills of Havana city. Waste Manag. 2008, 28, 2013–2021. [Google Scholar] [CrossRef] [Scilit] [PubMed]
- Frimpong Adu, T.; Dzifa Mensah, L.; Dziedzorm Rockson, M.A.; Kemausuor, F. Forecasting municipal solid waste generation and composition using machine learning and GIS techniques: A case study of Cape Coast, Ghana. Clean. Waste Syst. 2025, 10, 100218. [Google Scholar] [CrossRef] [Scilit]
- Sánchez Gil, S.; Jato-Espino, D.; Lobo, A. Multi-criteria Spatial Analysis Tool for Optimizing Landfill Localizations. In Proceedings of the Libro de Actas. VII Simposio Iberoamericano En Ingeniería de Residuos; Universidad de Cantabria: Santander, Spain, 2017; pp. 495–500. Available online: https://sites.google.com/uji.es/web-redisa/simposios-anteriores/vii-siir (accessed on 26 January 2025).
- Reyna-González, P.C.; Paredes-Lizama, D.E.; Lango-Reynoso, F.; Montoya-Mendoza, J. Incorporation of spatial analysis for the characterization of waste and its impact on the system of interdunal lagoons in the city of Veracruz, México. Rev. Int. De Contam. Ambient. 2022, 38, 501–513. [Google Scholar] [CrossRef] [Scilit]
- Rueda-Avellaneda, J.F.; Rivas-García, P.; Rivas-García, R.; Benitez-Bravo, R.; Botello-Álvarez, J.E.; Tututi-Avila, S. Current and prospective situation of municipal solid waste final disposal in Mexico: A spatio-temporal evaluation. Renew. Sustain. Energy Transit. 2021, 1, 100007. [Google Scholar] [CrossRef] [Scilit]
- NMX-AA-019-1985; Environmental Protection-soil Pollution-Municipal Solid Residues-“In Situ” Volumetric Weight. SCFI, Secretaría de Comercio y Fomento Industrial: Mexico City, Mexico, 1985. Available online: https://platiica.economia.gob.mx/normalizacion/wp-content/uploads/sites/2/PDF_Normas_Publicas/nmx-aa-019-1985.pdf (accessed on 20 February 2023).
- Jones, M.T. Google Earth Pro Microsoft Windows (6.2.9200.0). 2026. Available online: https://earth.google.com/web/ (accessed on 20 January 2026).
- QGIS Geographic Information System, Spatial without Compromise QGIS (v3.10). 2020. Available online: https://qgis.org/ (accessed on 20 May 2023).
- Caterpillar Inc. Servicio General. Cucharones Excavadores. 2026. Available online: https://www.cat.com/es_US/products/new/attachments/buckets-excavator/general-duty/1000015520.html (accessed on 18 January 2024).
- Stege, G.; Davila, L.; Engineers, S.C.S. Manual Del Usuario Modelo Mexicano de Biogás; Agencia para la Protección del Ambiente (U.S. EPA): Washington, DC, USA, 2009. Available online: https://www.globalmethane.org/documents/models/pdfs/manual_del_usuario_modelo_mexicano_de_biogas_v2_2009.pdf (accessed on 2 July 2026).
- Illowsky, B.; Dean, S. Introductory Statistics 2e, 2nd ed.; OpenStax Rice University: Houston, TX, USA, 2023; Available online: https://assets.openstax.org/oscms-prodcms/media/documents/introductory-statistics-2e_-_WEB.pdf (accessed on 3 July 2026).
- StarPoni Inc. STATGRAPHICS Centurion XV (v15.2.11). 1982. Available online: https://www.statgraphics.com/ (accessed on 3 July 2026).
- NMX-AA-025-1984; Environmental Protection-Soil Contamination—Solid Residues-Ph Determination-Potentiometric Method. SCFI, Secretaría de Comercio y Fomento Industrial: Mexico City, Mexico, 1984. Available online: https://platiica.economia.gob.mx/normalizacion/wp-content/uploads/sites/2/PDF_Normas_Publicas/nmx-aa-025-1984.pdf (accessed on 15 June 2023).
- NMX-AA-016-1984; Environmental Protection-soil Pollution-Municipal Solid Residues-Humidity Determination. SCFI, Secretaría de Comercio y Fomento Industrial: Mexico City, Mexico, 1984. Available online: https://platiica.economia.gob.mx/normalizacion/wp-content/uploads/sites/2/PDF_Normas_Publicas/nmx-aa-016-1984.pdf (accessed on 15 June 2023).
- NMX-AA-018-1984; Environmental Protection-soil Pollution-Municipal Solid Residues-Ashes Determination. SCFI, Secretaría de Comercio y Fomento Industrial: Mexico City, Mexico, 1984. Available online: https://platiica.economia.gob.mx/normalizacion/wp-content/uploads/sites/2/PDF_Normas_Publicas/nmx-aa-018-1984.pdf (accessed on 15 June 2023).
- GEM, Gobierno del Estado de México. Portal de Consulta del Sistema Integral de Residuos del Estado de México; Secretaría del Medio Ambiente y Desarrollo Sostenible: Mexico City, Mexico, 2024; Available online: http://187.188.85.202:8095/consulta-sirem/ (accessed on 9 March 2024).
- NOM-083-SEMARNAT-2003; Especificaciones de protección ambiental para la selección del sitio, diseño, construcción, operación, monitoreo, clausura y obras complementarias de un sitio de disposición final de residuos sólidos urbanos y de manejo especial. DOF, Diario Oficial de la Federación: Mexico City, Mexico, 2004. Available online: https://biblioteca.semarnat.gob.mx/janium/Documentos/Ciga/agenda/PPD02/nom-083.pdf (accessed on 1 June 2023).
- INEGI, Instituto Nacional de Estadística, Geografía e Informática. México en Cifras: Área Geográfica. 2020. Available online: https://www.inegi.org.mx/app/areasgeograficas/#collapse-Resumen (accessed on 26 December 2025).
- CORESA, Constructora y Operadora de Rellenos Sanitarios. Manual de Operación, Rehabilitación Y Clausura de Tiradero Municipal de Tenango Del Valle Y Construcción de Dos Nuevas Celdas En Apego a La NOM-083-SEMARNAT-2003, 1st ed.; CORESA: Toluca, Mexico, 2020. [Google Scholar]
- Hernández Contreras, G.I.; Hernández Berriel, M.C.; Díaz Archundia, L.V.; Mañon Salas, M.C.; Carreño de León, M.C. “In situ segregation of potentially recyclable waste, a case study”. Centro de Investigaciones y Estudios Superiores en Antropología Social, Sede Golfo. La Escoba. 2024. Available online: https://golfo.ciesas.edu.mx/wp-content/uploads/2024/11/Boletin-25-La-Escoba-Octubre-2024.pdf (accessed on 6 November 2024).



Disclaimer/Publisher’s Note: The statements, opinions and data contained in all publications are solely those of the individual author(s) and contributor(s) and not of MDPI and/or the editor(s). MDPI and/or the editor(s) disclaim responsibility for any injury to people or property resulting from any ideas, methods, instructions or products referred to in the content. |
© 2026 by the authors. Licensee MDPI, Basel, Switzerland. This article is an open access article distributed under the terms and conditions of the Creative Commons Attribution (CC BY) license.