


Abstract
Anaerobic digesters (ADs) are widely used for the recovery of energy from biomass waste, while performance deterioration of ADs sometimes occurs under high organic loads. Microbial electrolysis cells (MECs) have been examined for incorporation into ADs to improve methane production, while responses of MEC-assisted ADs (MEC-ADs) to changes in operational conditions have yet to be sufficiently examined. Here we operated laboratory ADs and MEC-ADs with food waste as a feed, and organic loading rates (OLRs) were varied by changing hydraulic residence times (HRTs). Analyses of AD performances, including methane production and chemical oxygen demand (COD) removal, show that MEC-ADs exhibit higher performances than ADs at OLRs of 7 g COD L−1 D−1 or higher (HRT of 10 days or less). In addition, pH was stably maintained in MEC-ADs at high OLRs. Metabarcoding of rRNA gene amplicons showed that Desulfuromonadaceae bacteria were enriched at the anodes in MEC-ADs, while Methanobacteriaceae archaea were increased at the cathodes. It is suggested that the MEC system is useful for stably operating ADs at high OLRs and/or short HRTs.
1. Introduction
Effective recycling of biomass waste, in particular food waste, is a critical issue in modern society. Due to its high moisture content, however, food waste cannot be combusted efficiently, resulting in difficulty in recovering heat energy. A possible solution is anaerobic digestion (AD), in which anaerobic microbes decompose food waste and produce biogas containing methane and carbon dioxide [1]. Methane thus produced can be used as a fuel gas after purification, while it may also be used for generating electric power [2].
Extensive work has been done to understand the microbiology of AD [1] and to develop technologies for operating AD processes efficiently and stably [3]. Microbiological studies have identified microbes involved in AD [1], and based on their metabolic activities, these microbes are typically classified into several niches, including fermentative bacteria, syntrophic bacteria, homoacetogenic bacteria, and methanogenic archaea [1]. These microbes establish metabolic networks, in which upstream fermentative bacteria convert complex organic matter into volatile fatty acids (VFAs), alcohols and hydrogen, and downstream methanogens convert these intermediate metabolites into methane and carbon dioxide with the aid of homoacetogens and syntrophs [1]. It is known that, since metabolic speeds of fermentative bacteria are generally higher than those of methanogens, intermediate metabolites, such as VFAs, tend to accumulate in ADs under high organic loads, resulting in a drop in pH, followed by the inactivation of acid-labile methanogens and the cessation of methane production [4]. It would therefore be a challenge for AD engineers to stably operate AD at high organic loading rates (OLRs). In addition, it would also be a challenge to operate AD at short hydraulic residence times (HRTs), since the growth of some microbes involved in AD, including methanogens and syntrophs, is rather slow [5]. Other challenges in AD processes are associated with substrate heterogeneity, high water contents in substrates, ammonia accumulation with nitrogen-rich substrates and scum formation with lipid-rich substrates [6].
Studies have also been conducted to develop technologies for facilitating AD. For instance, in order to sustain slow-growing microbes, e.g., methanogens, in AD reactors, packed beds were installed, resulting in efficient AD at short HRTs and high OLRs [7]. Metagenomic analyses have shown that several species of methanogens are highly enriched in biofilms on the packed beds, accelerating the bottleneck step in AD, namely methanogenesis from VFAs [8]. In other studies, methanogenesis is facilitated by introducing conductive materials [9], such as iron oxide nanoparticles [10], graphene nanoparticles [11] and carbon nanotubes [12]. These conductive nano-materials are considered to facilitate electron transfer from syntrophs to methanogens, thereby accelerating the bottleneck step in the methanogenic pathway [13]. Acceleration of acetoclastic methanogenesis with magnetite nanoparticles has also been reported [14].
In addition to the above-mentioned technologies, a substantial number of studies have also examined the integration of AD reactors with microbial electrolysis cells (MECs) for facilitating methane production [15,16]. MECs are a bioelectrochemical system, in which microbes generate electric current by decomposing organic matter at the anode and, with a small external voltage input, hydrogen and/or methane are produced at the cathode [17]. It has been shown that MEC-assisted AD (MEC-AD) successfully treats synthetic wastewater at a short HRT (6 h) for methane production [18]. In another study, the integration of AD with MECs was found to reduce the start-up period for methane production from highly concentrated food waste [19]. In addition, Park et al. comparatively examined AD and MEC-AD for methane production from food waste at different OLRs (HRT was constant at 20 days), showing that MEC-AD achieved methane production at substantially higher OLRs (up to 10 kg m−3 D−1) than those of AD (up to 4 kg m−3 D−1) [20]. Although these studies have demonstrated the utility of MEC-AD for methane production from organic waste at short HRTs or high OLRs, further studies are necessary to precisely evaluate the utility of MEC-AD for the following reasons. First, since these studies used AD without electrode materials (e.g., graphite sheets) as controls, it remains unclear whether the performance improvement is due to microbial enrichment on the electrode materials or to electrochemical stimulation. In addition, although it is common in commercial AD plants for the OLR to be increased in association with the increases in the volume of organic waste injected into AD plants (i.e., the decreases in HRT), previous studies used concentrated food waste to increase OLRs [19,20].
The present work was conducted to evaluate the hypothesis that MEC-AD is useful for methane production from food waste at high OLRs by simultaneously operating AD and MEC-AD reactors at different HRTs and OLRs. In the examination, control AD reactors were installed with non-connected electrode materials (graphite felts, serving as support beds for microbes), and electrochemical stimulation of methanogenesis was precisely evaluated at high OLRs and short HRTs.
2. Results and Discussion
2.1. Current Generation in MEC-AD
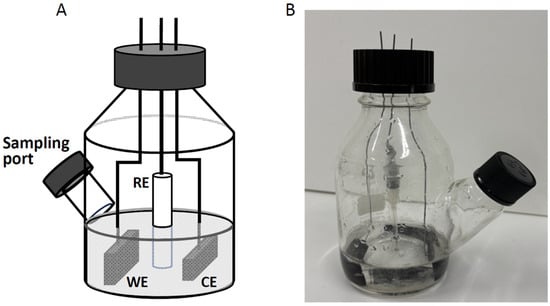
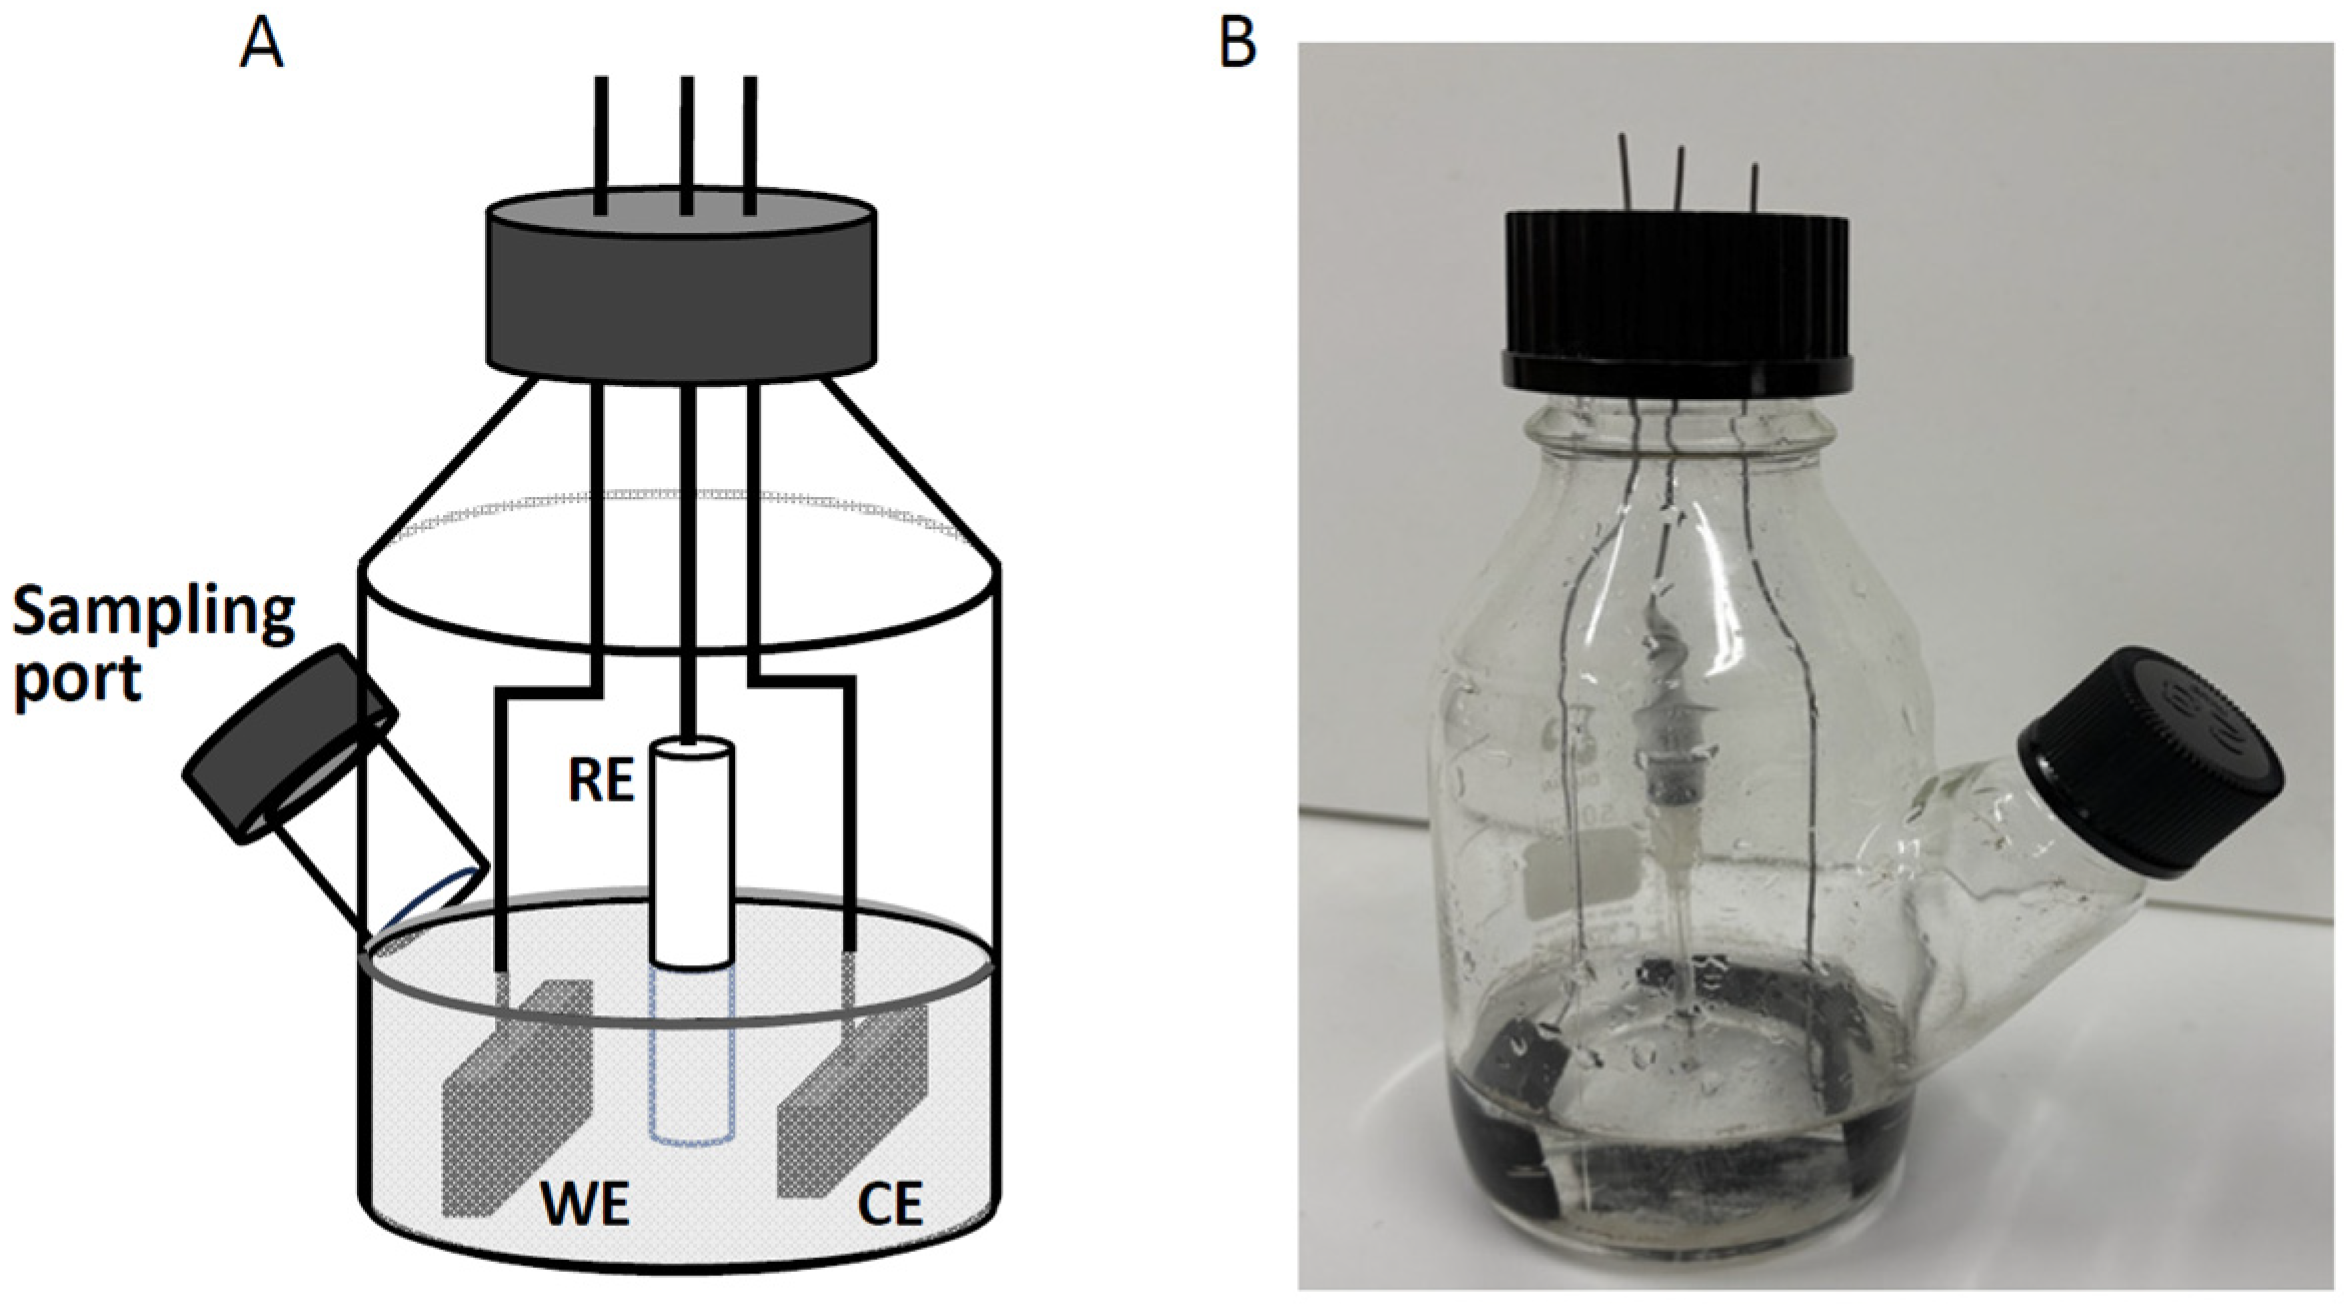
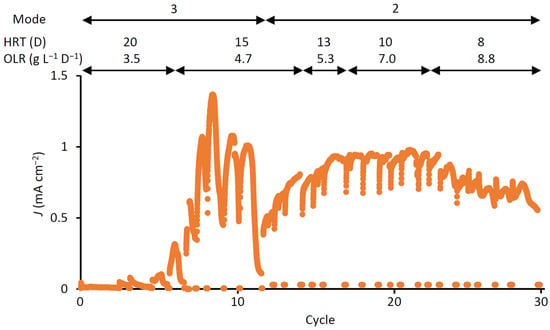
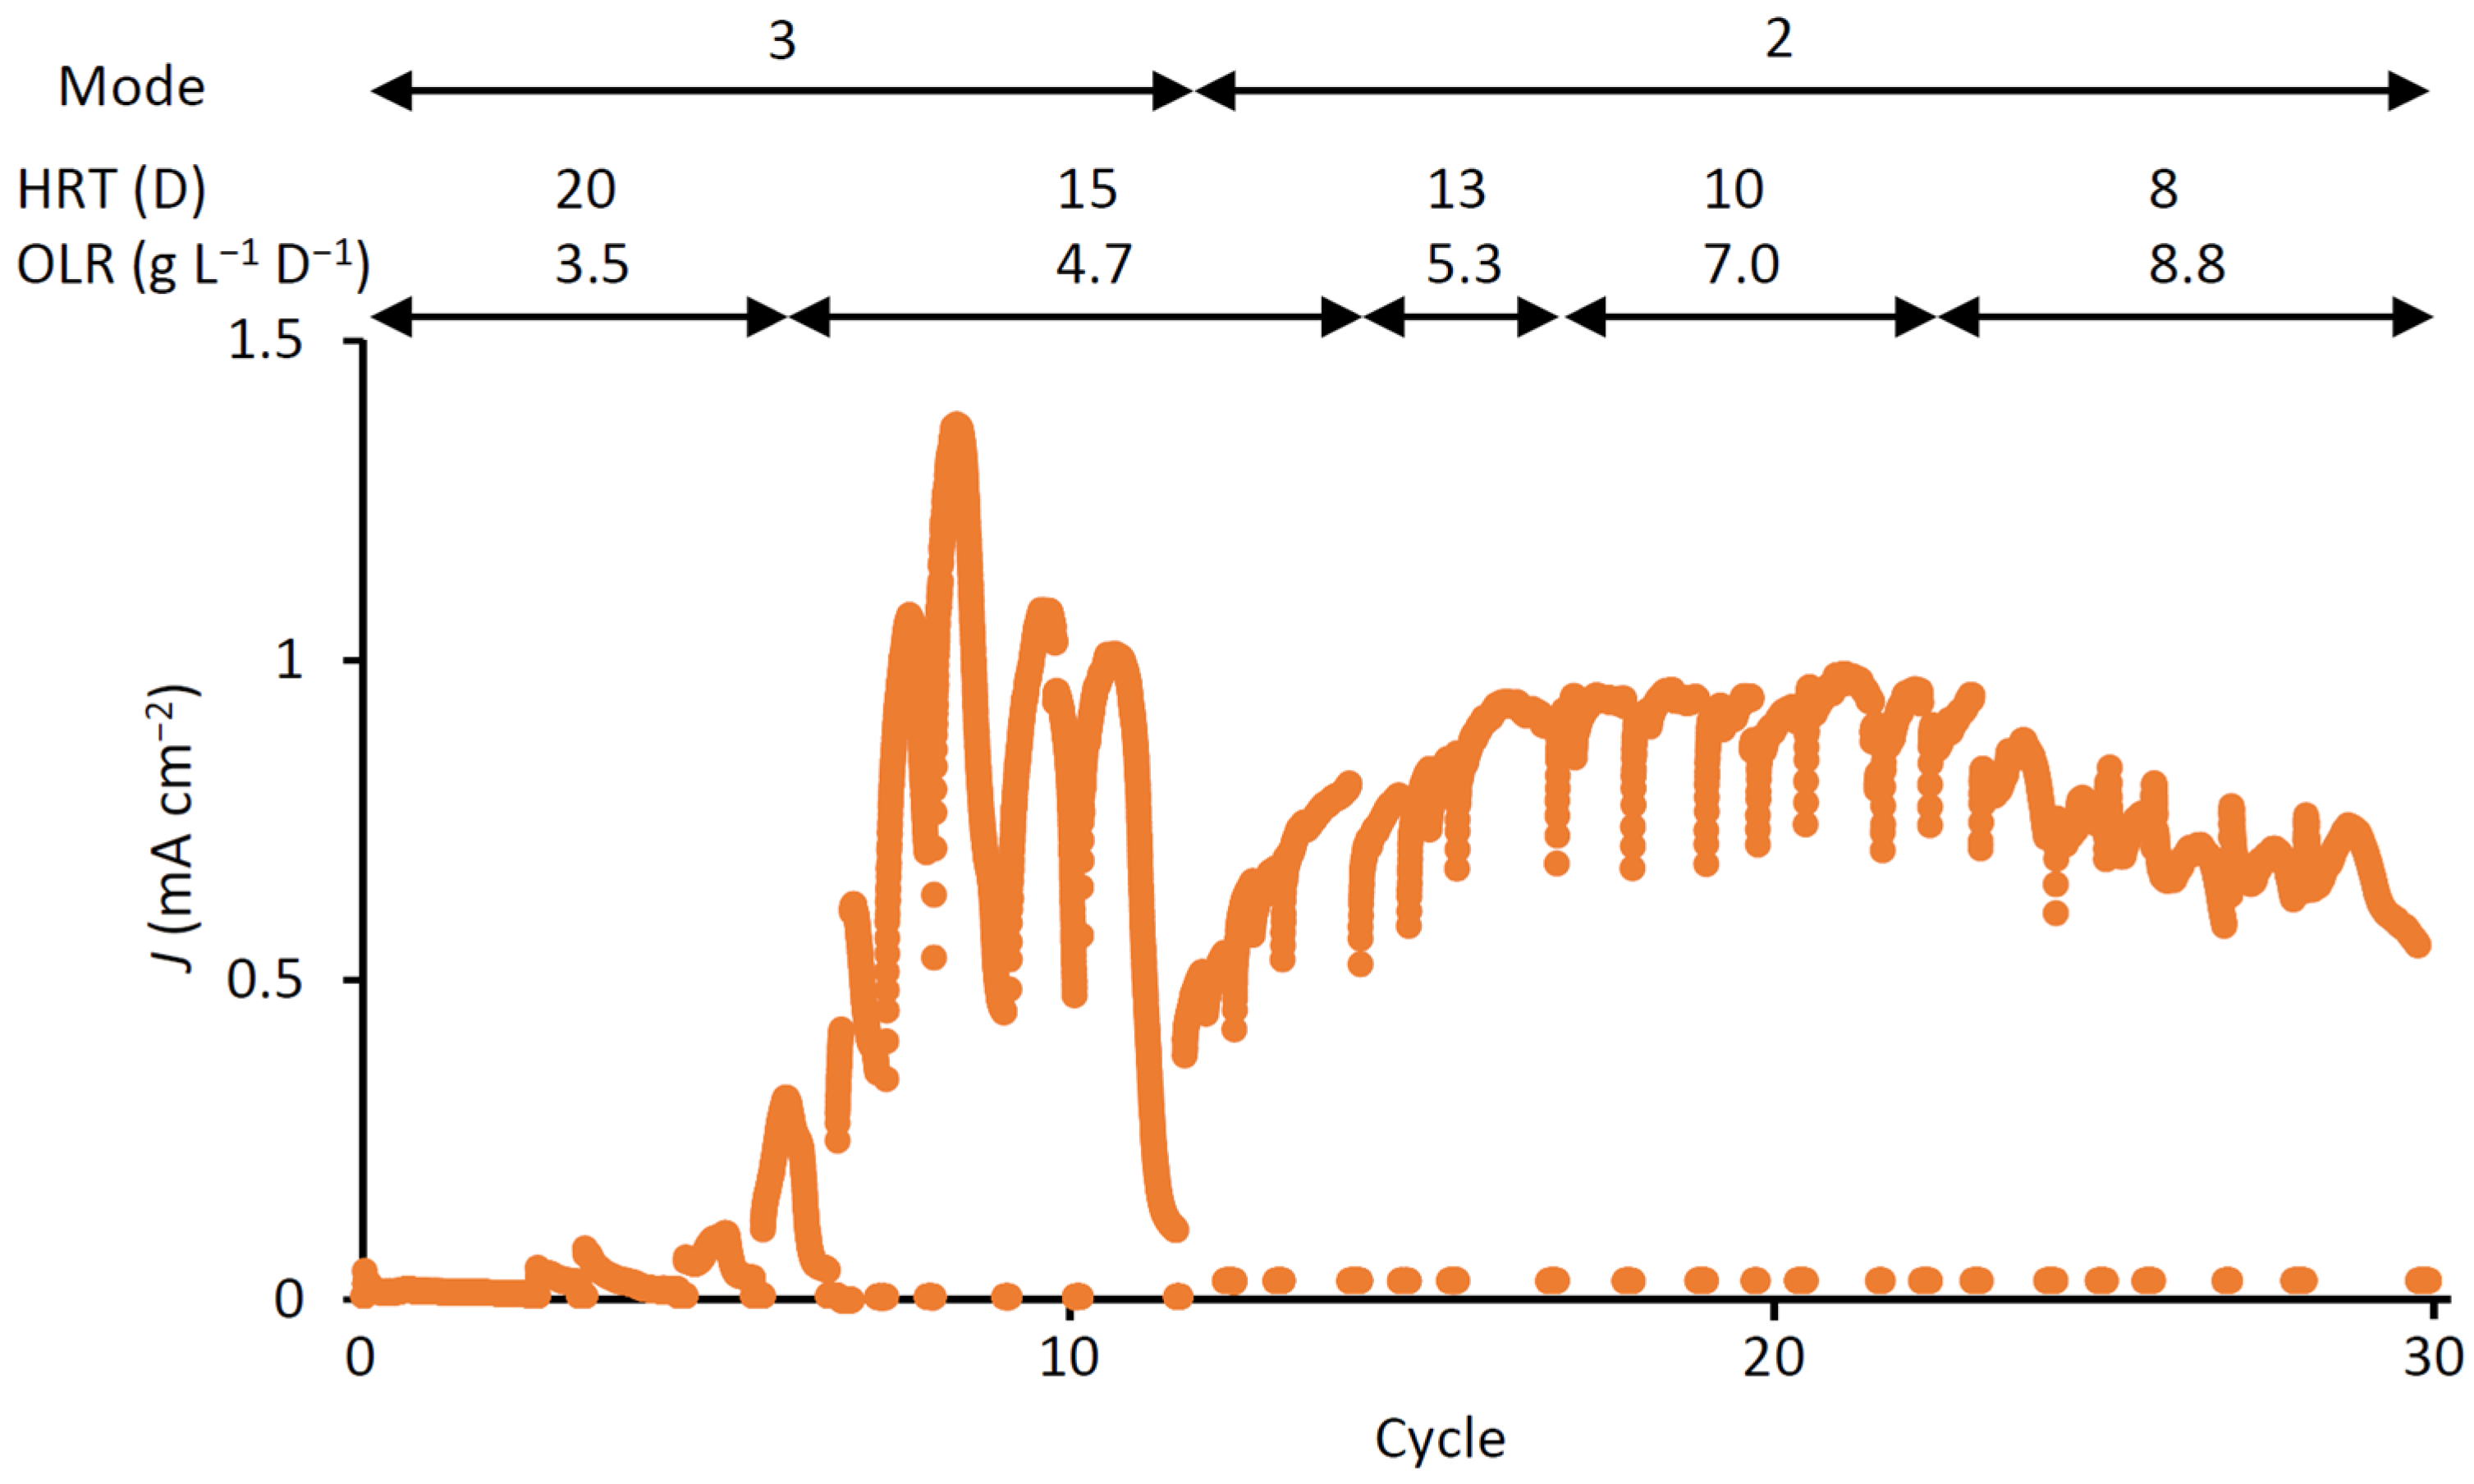
To initiate the operation of MEC-AD reactors (Figure 1), food waste supernatant (FWS) was added as the substrate, while AD effluent (ADE) was added as the source of microbes and internal solution of the reactors. Characteristics of FWS are summarized in Table 1. It is shown that FWS did not contain notable amounts of nitrate, sulfate and sulfide (Table 1). Subsequently, FWS was added to the reactors every 2 or 3 days to initiate the next cycle of operation (Figure 2). The HRT and OLR were determined by changing the volume of FWS added to the reactors at one time. During the operation, the HRT was gradually decreased as shown in Figure 2, and the OLR was thereby gradually increased. Initially, the reactors were operated in the three-electrode mode using Ag/AgCl reference electrodes (REs), while after the HRT was changed from 20 days to 15 days, the operation mode was changed to the two-electrode mode (Figure 2). At an HRT of 20 days, current density (J) did not substantially increase (always below 0.2 mA cm−2), while after the HRT was changed to 15 days, it increased markedly, and the maximum J in one cycle (Jmax) reached at 1.4 mA cm−1 in cycle 9. After the mode was changed to the two-electrode mode, the current became relatively stable, and Jmax was consistent between 0.7 mA cm−2 and 1.0 mA cm−2 between cycles 12 and 30. Since the data show that Jmax was not affected by HRT and OLR (Figure 2), it is likely that current was mainly generated by biofilm microbes that attached onto the anodes.
Figure 1.
A schematic diagram (A) and photo (B) of reactors used for the AD and MEC-AD experiments. The capacity of the reactor was 650 mL, while the volume of the internal liquid was 100 mL.
Table 1.
Characteristics of FWS.
Figure 2.
Current generation in MEC-AD. Datum points are means of current densities measured in three independent reactors. Mode: 3, 3-electrode mode; 2, 2-electrode mode.
Previous studies have examined current generation in MEC-AD with food waste as substrates [21]. For instance, Harb et al. investigated the effects of increased applied voltages (up to 2.75 V) and granular activated carbon on current generation in MEC-AD, reporting J values of ∼7.5 A m−2 [22]. In another study, inoculation of MEC-AD (applied voltage of 0.9 V) with electroactive biofilm formed in an anaerobic reactor was reported to result in relatively quick startup of current generation at J values of ∼0.1 mA cm−2 [23]. Molognoni et al. constructed a prototype MEC-AD reactor and operated it under different operational conditions [24]. It was reported that the reactor attained a J of 0.3 to 0.6 A m−2 [24]. Compared to J values reported previously for MEC-AD, the J values reported in the present work are equivalent or higher (Figure 2 and Table 2). This would be related to the fact that the ADE used in the present work harbors active electroactive bacteria [25].
Table 2.
Summary of data for evaluating process performances of AD and MEC-AD at high OLRs.
2.2. Methane Production in AD and MEC-AD
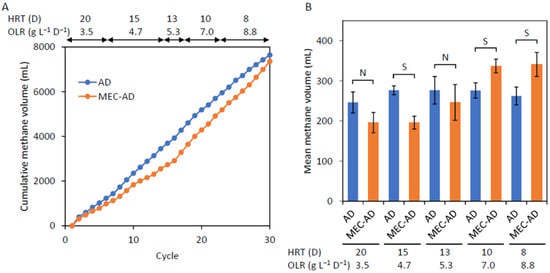
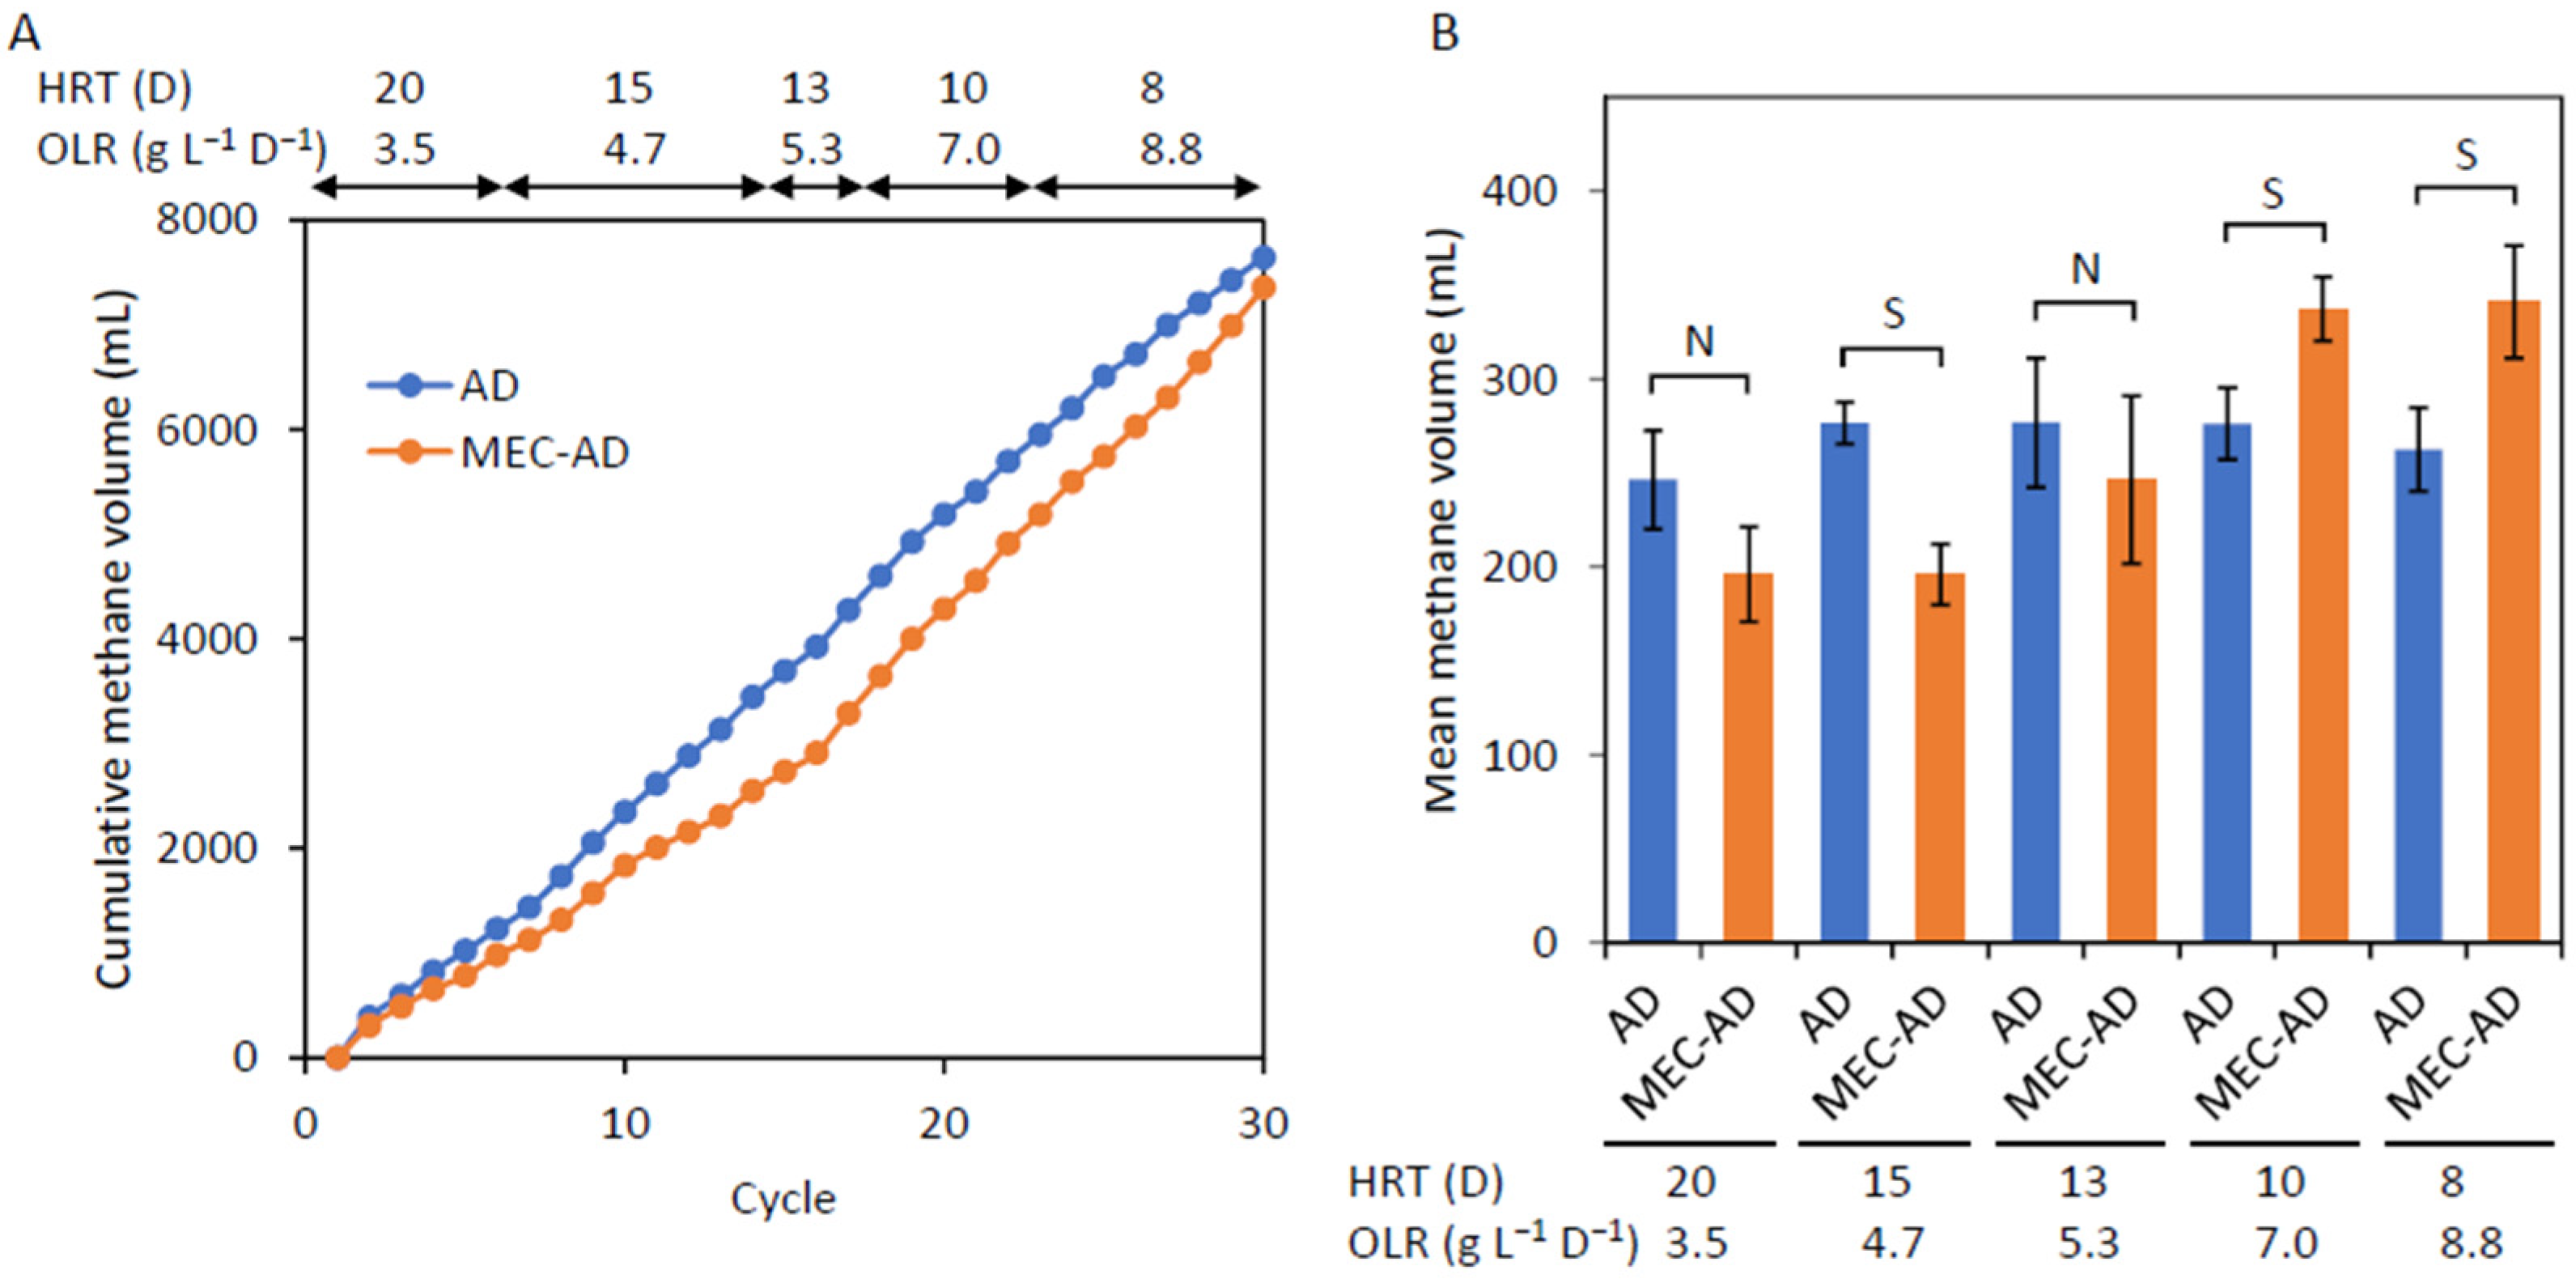
AD reactors were also operated in the same operational scheme as those of MEC-AC. Sampling of headspace gas in AD and MEC-AD reactors was initiated in cycle 2 and routinely conducted thereafter. Cumulative methane curves show that methane was stably produced in every cycle in the AD and MEC-AD reactors (Figure 3A). Methane was constantly produced in the AD reactors independently of HRT and OLR (Figure 3A). In contrast, the cumulative methane curve for MEC-AD became steep after the HRT was changed to 13 days (Figure 3A), indicating that methane production was accelerated at a short HRT and a high OLR in MEC-AD.
Figure 3.
Methane production in AD and MEC-AD. (A) Cumulative methane curves during the 30 cycles of operation. Datum points are means of data from three independent reactors. (B) Mean methane volumes produced in one cycle at different HRTs and OLRs. Error bars represent SEs. N, not significantly different between AD and MEC-AD. S, significantly different.
Mean volumes of methane evolved in one cycle at different HRTs and OLRs are compared between AD and MEC-AD (Figure 3B). It is shown that AD produced more methane than MEC-AD under the low OLR conditions, while MEC-AD produced more methane than AD under the high OLR conditions. The volumes of methane produced in the AD reactors were almost unchanged throughout the 30-cycle operation, while the volumes of methane produced in the MEC-AD reactors increased according to the increase in OLR (Figure 3B). It is not clear why the volumes of methane evolved in the AD reactors did not increase in association with the increase in OLR, which will be discussed later by referring to data on COD removal. Since hydrogen was also detected in MEC-AD at high OLRs (Table 3), it is likely that the increased fraction of methane in MEC-AD (vs. AD) was produced from hydrogen by hydrogenotrophic methanogenesis.
Table 3.
Typical compositions of headspace gas in AD and MEC-AD at high OLRs.
Based on the data for the volumes of methane evolved, methane production rates (MPRs) at high OLRs were calculated for AD and MEC-AD (Table 2). It is shown that MPRs exceeded 1000 mL L−1 D−1 at OLRs of 7.0 and 8.8 g L−1 D−1, and these values are rather high compared with those reported previously [26]. For instance, MPR values of 100 to 150 L m−3 D−1 have been reported for a prototype MEC-AD reactor operated under various conditions [24], values of 20 to 50 mL L−1 D−1 have been reported for MEC-AD reactors inoculated with a direct-electron-transfer-dominant methanogenic microbial community [23], and values of ∼1 L L−1 D−1 have been reported for multiple-electrode MEC-AD treating food waste [19]. It is also noteworthy that AD used in the present work was able to produce methane at OLRs of 7.0 and 8.8 g L−1 D−1, relatively high OLRs compared to those reported in a previous study [20]. We consider that this would be attributable to the presence of the support beds (the anode and cathode materials) in AD that would have sustained slow-growing microbes, such as methanogens. We conclude that the differences in methane production between AD and MEC-AD at high OLRs detected in the present work are due to electrochemical stimulation of microbes in MEC-AD.
2.3. COD Removal in AD and MEC-AD
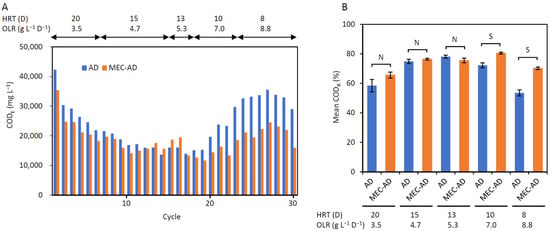
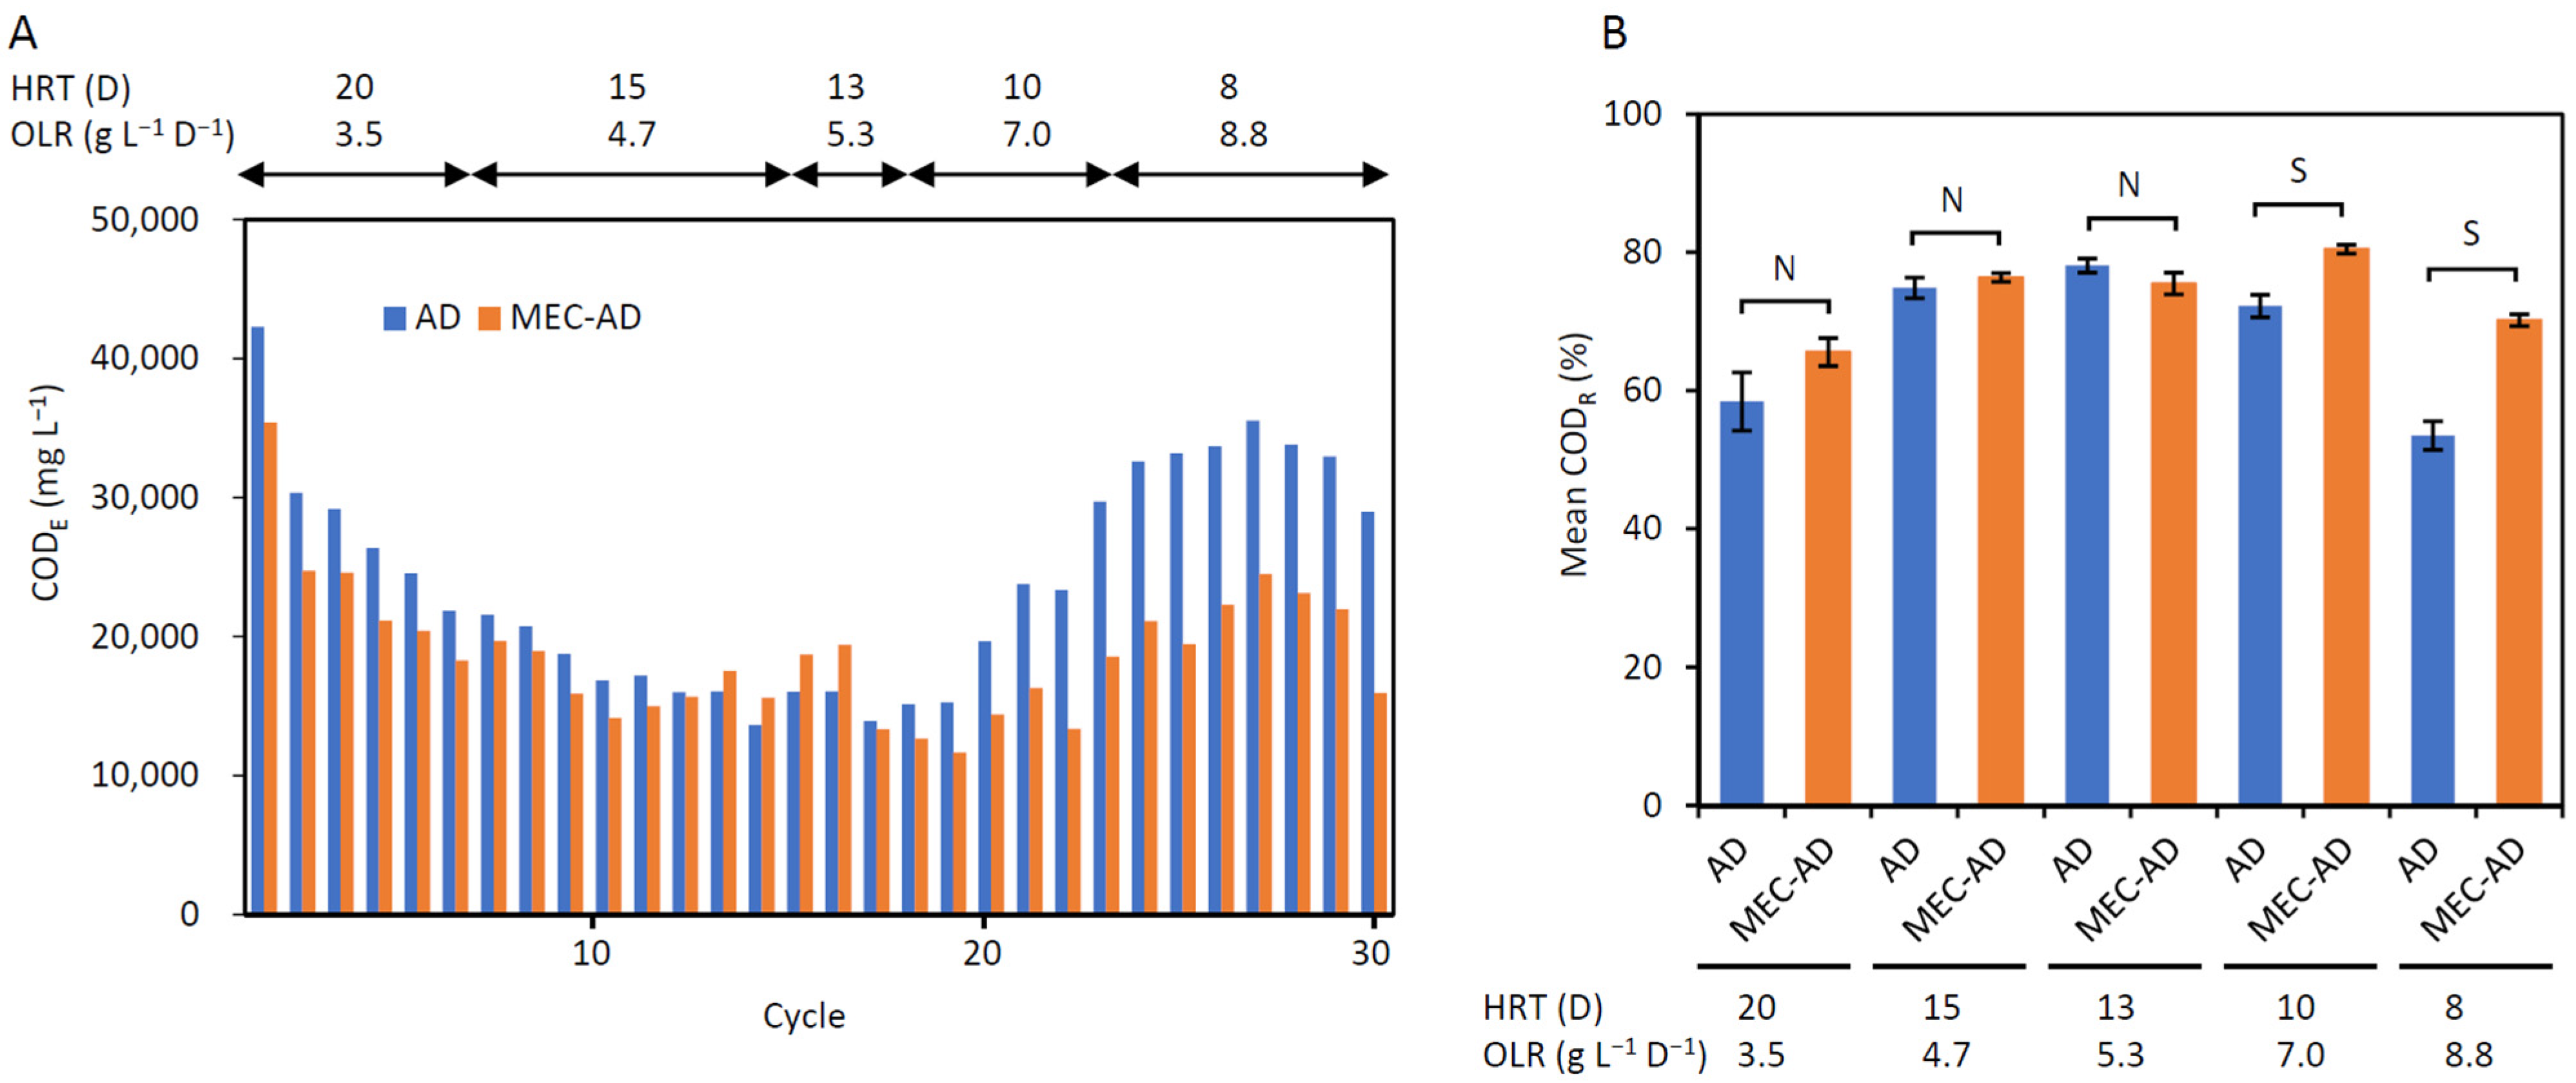
COD concentrations in effluents (CODE) were measured after cycles of operation as indices for organics degradation [27], and the values for AD and MEC-AD are compared in Figure 4A. In the initial 10 cycles, the CODE values gradually decreased, reaching approx. 15,000 mg L−1 in AD and MEC-AD at an OLR of 4.7 g L−1 D−1. Afterward, in accordance with the increases in OLR, the CODE in AD substantially increased, reaching more than 30,000 mg L−1 at an OLR of 8.8 g L−1 D−1 (Figure 4A). On the other hand, the CODE in MEC-AD did not increase greatly, and the values were 20,000 mg L−1 or less even at an OLR of 8.8 g L−1 D−1 (Figure 4A).
Figure 4.
COD removal in AD and MEC-AD. (A) CODE at each cycle during the 30-cycle operation. Bars are means of data from three independent reactors. (B) Mean CODR at different HRTs and OLRs. Error bars represent SEs. N, not significantly different between AD and MEC-AD. S, significantly different.
COD removal (CODR, %) was calculated for each cycle, and mean CODR values at different OLRs for AD and MEC-AD are compared in Figure 4B. It is shown in this figure that CODR values are generally between 60 and 80% except for that of AD at an OLR of 8.8 g L−1 D−1 (approx. 53%, Table 2). CODR values for AD and MEC-AD are significantly different at OLRs of 7.0 and 8.8 g L−1 D−1, indicating that MEC-AD is superior to AD in terms of COD removal at high OLRs. It is likely that this is related to the improved methane production at high OLRs in MEC-AD; for instance, the MPR for MEC-AD at an OLR of 8.8 g L−1 D−1 was approx. 25% higher than that for AD, while the CODR for MEC-AD at an OLR of 8.8 g L−1 D−1 was approx. 30% higher than that for AD (Table 2).
Based on MPR, HRT and CODR, methane yield (MY) values were calculated for AD and MEC-AD at a high OLR (Table 2). These values are equivalent to those reported in previous studies [28,29]. For instance, high MY values (352 to 450 mL g−1) were reported for AD supplemented with trace metals [30], an MY of approx. 300 mL g−1 was reported for AD co-digesting catering food waste and plant waste [31], and 145 mL g−1 was reported for stacked-cathode MEC-AD treating beer-brewery wastewater [32]. The MY values for AD and MEC-AD were not significantly different, even though the MPR values for MEC-AD were larger than those for AD (Table 2). This can be attributed to the fact that both the MPR and CODR for MEC-AD were higher than those for AD. In addition, as described above, the volume of methane did not increase in AD even after the increases in OLR (Figure 3). This is considered to be related to the fact that the CODR for AD decreased at a high OLR (Figure 4). From these results, it is concluded that the integration of AD with MECs facilitates COD removal at high OLRs, resulting in the acceleration of methanogenesis.
2.4. Changes in pH in AD and MEC-AD
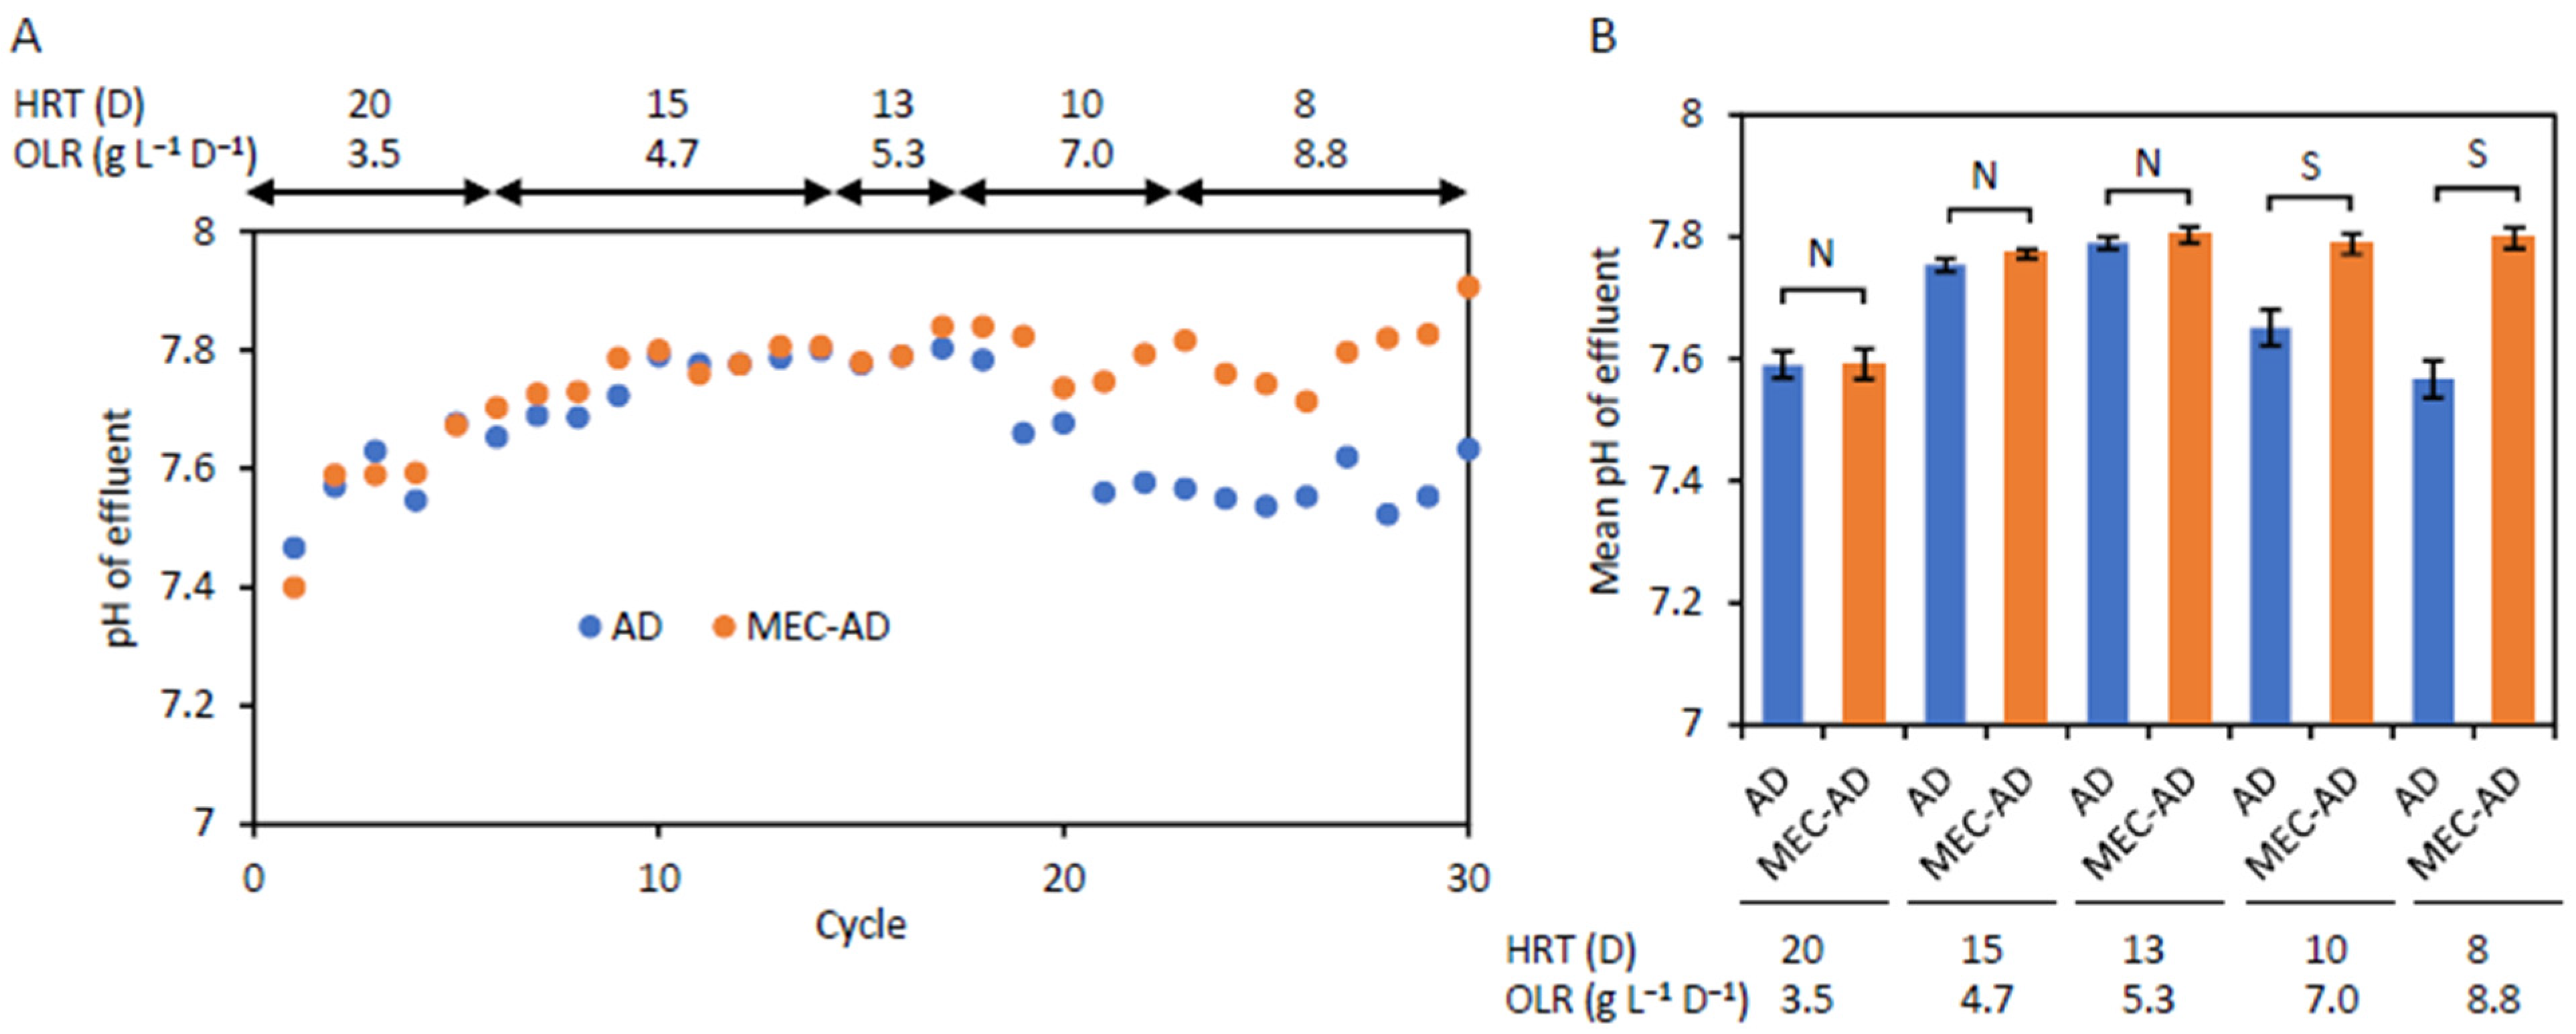
During the 30-cycle operation, the pH of the effluents was measured (Figure 5A), and mean pH values at different OLRs were calculated for AD and MEC-AD (Figure 5B). It is shown that pH values in the effluents are not significantly different between AD and MEC-AD at low OLRs (below 5.3 g L−1 D−1), while those for AD at high OLRs (above 7.0 g L−1 D−1) are significantly lower than those for MEC-AD. It is likely that the decrease in pH in AD at high OLRs (Figure 5) is related to the increase in COD (Figure 4); specifically, organic acids (VFAs) were considered to be accumulated in AD, resulting in the increase in COD and the decrease in pH. Previous studies have reported that the integration of AD with MECs facilitates the degradation of VFAs at anodes and the stabilization of pH [33,34]. One study has examined the introduction of MECs into AD to improve the resistance to acidification, showing that the average concentration of VFAs in MEC-AD was 32.9% lower than that in AD [33]. In addition, it has been reported that the integration of AD with MECs alleviates the accumulation of VFAs, in particular propionate and butyrate, by accelerating their conversion, resulting in the stabilization of pH [34]. Although the present work did not measure concentrations of VFAs, it is conceivable that concentrations of VFAs were lower in MEC-AD than those in AD, resulting in the stabilization of pH and acceleration of COD removal and methane production. In addition, it should be noted that pH was measured at the end of a cycle of operation, and there would have been a possibility that the pH temporally dropped during the cycle.
Figure 5.
Changes in pH in AD and MEC-AD. (A) Changes in pH in the effluent of AD and MEC-AD. Datum points are means of data from three independent reactors. (B) Mean pH values in the effluent of AD and MEC-AD at different HRTs and OLRs. Error bars represent SEs. N, not significantly different between AD and MEC-AD. S, significantly different.
2.5. Microbes Occurring in AD and MEC-AD
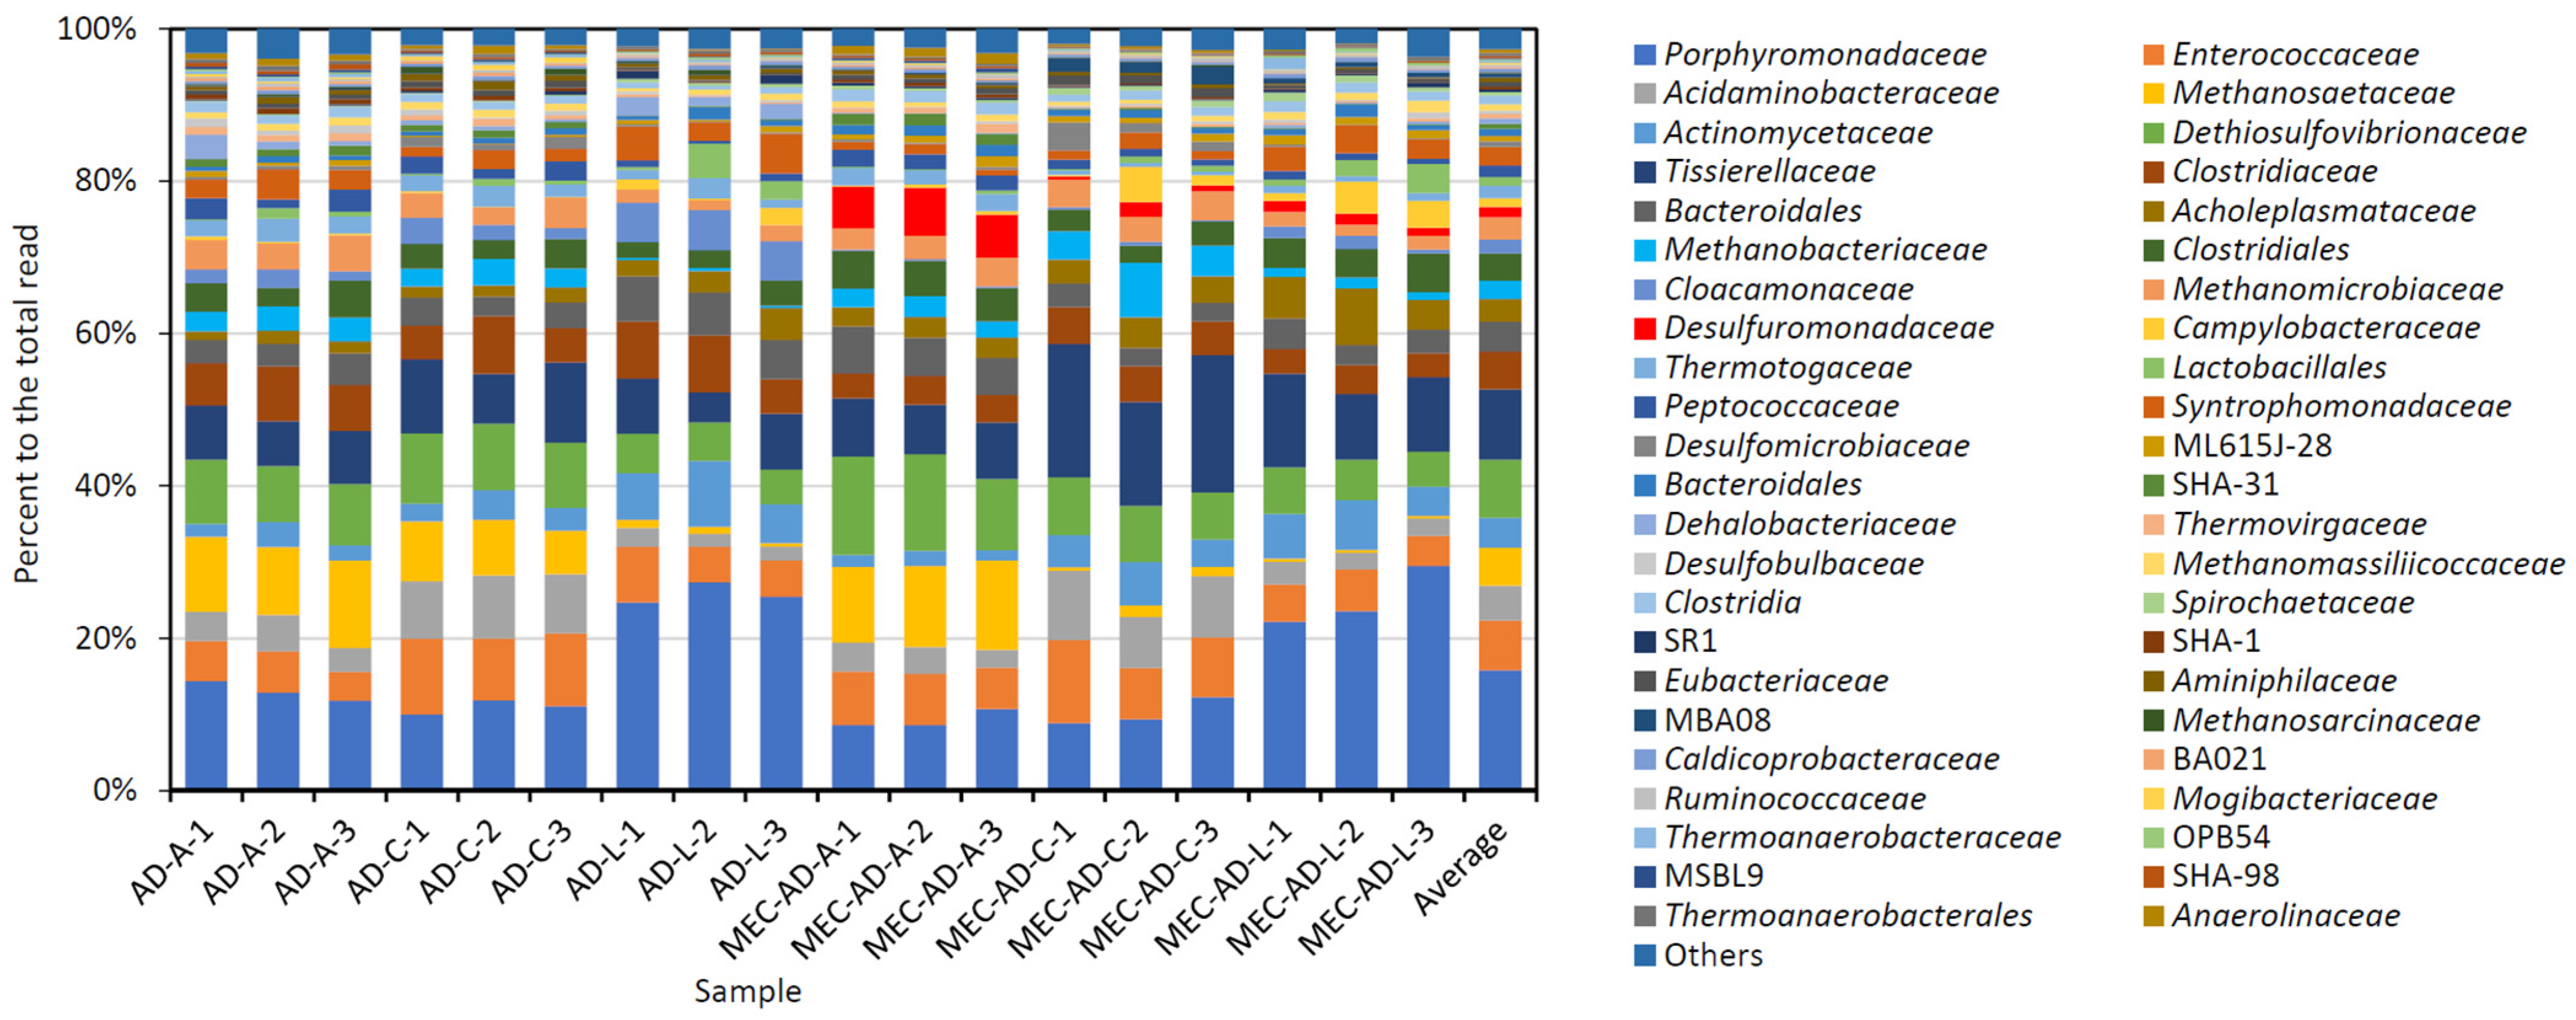
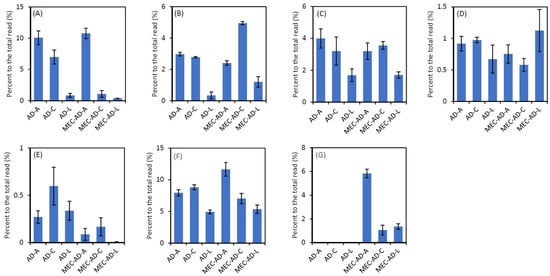
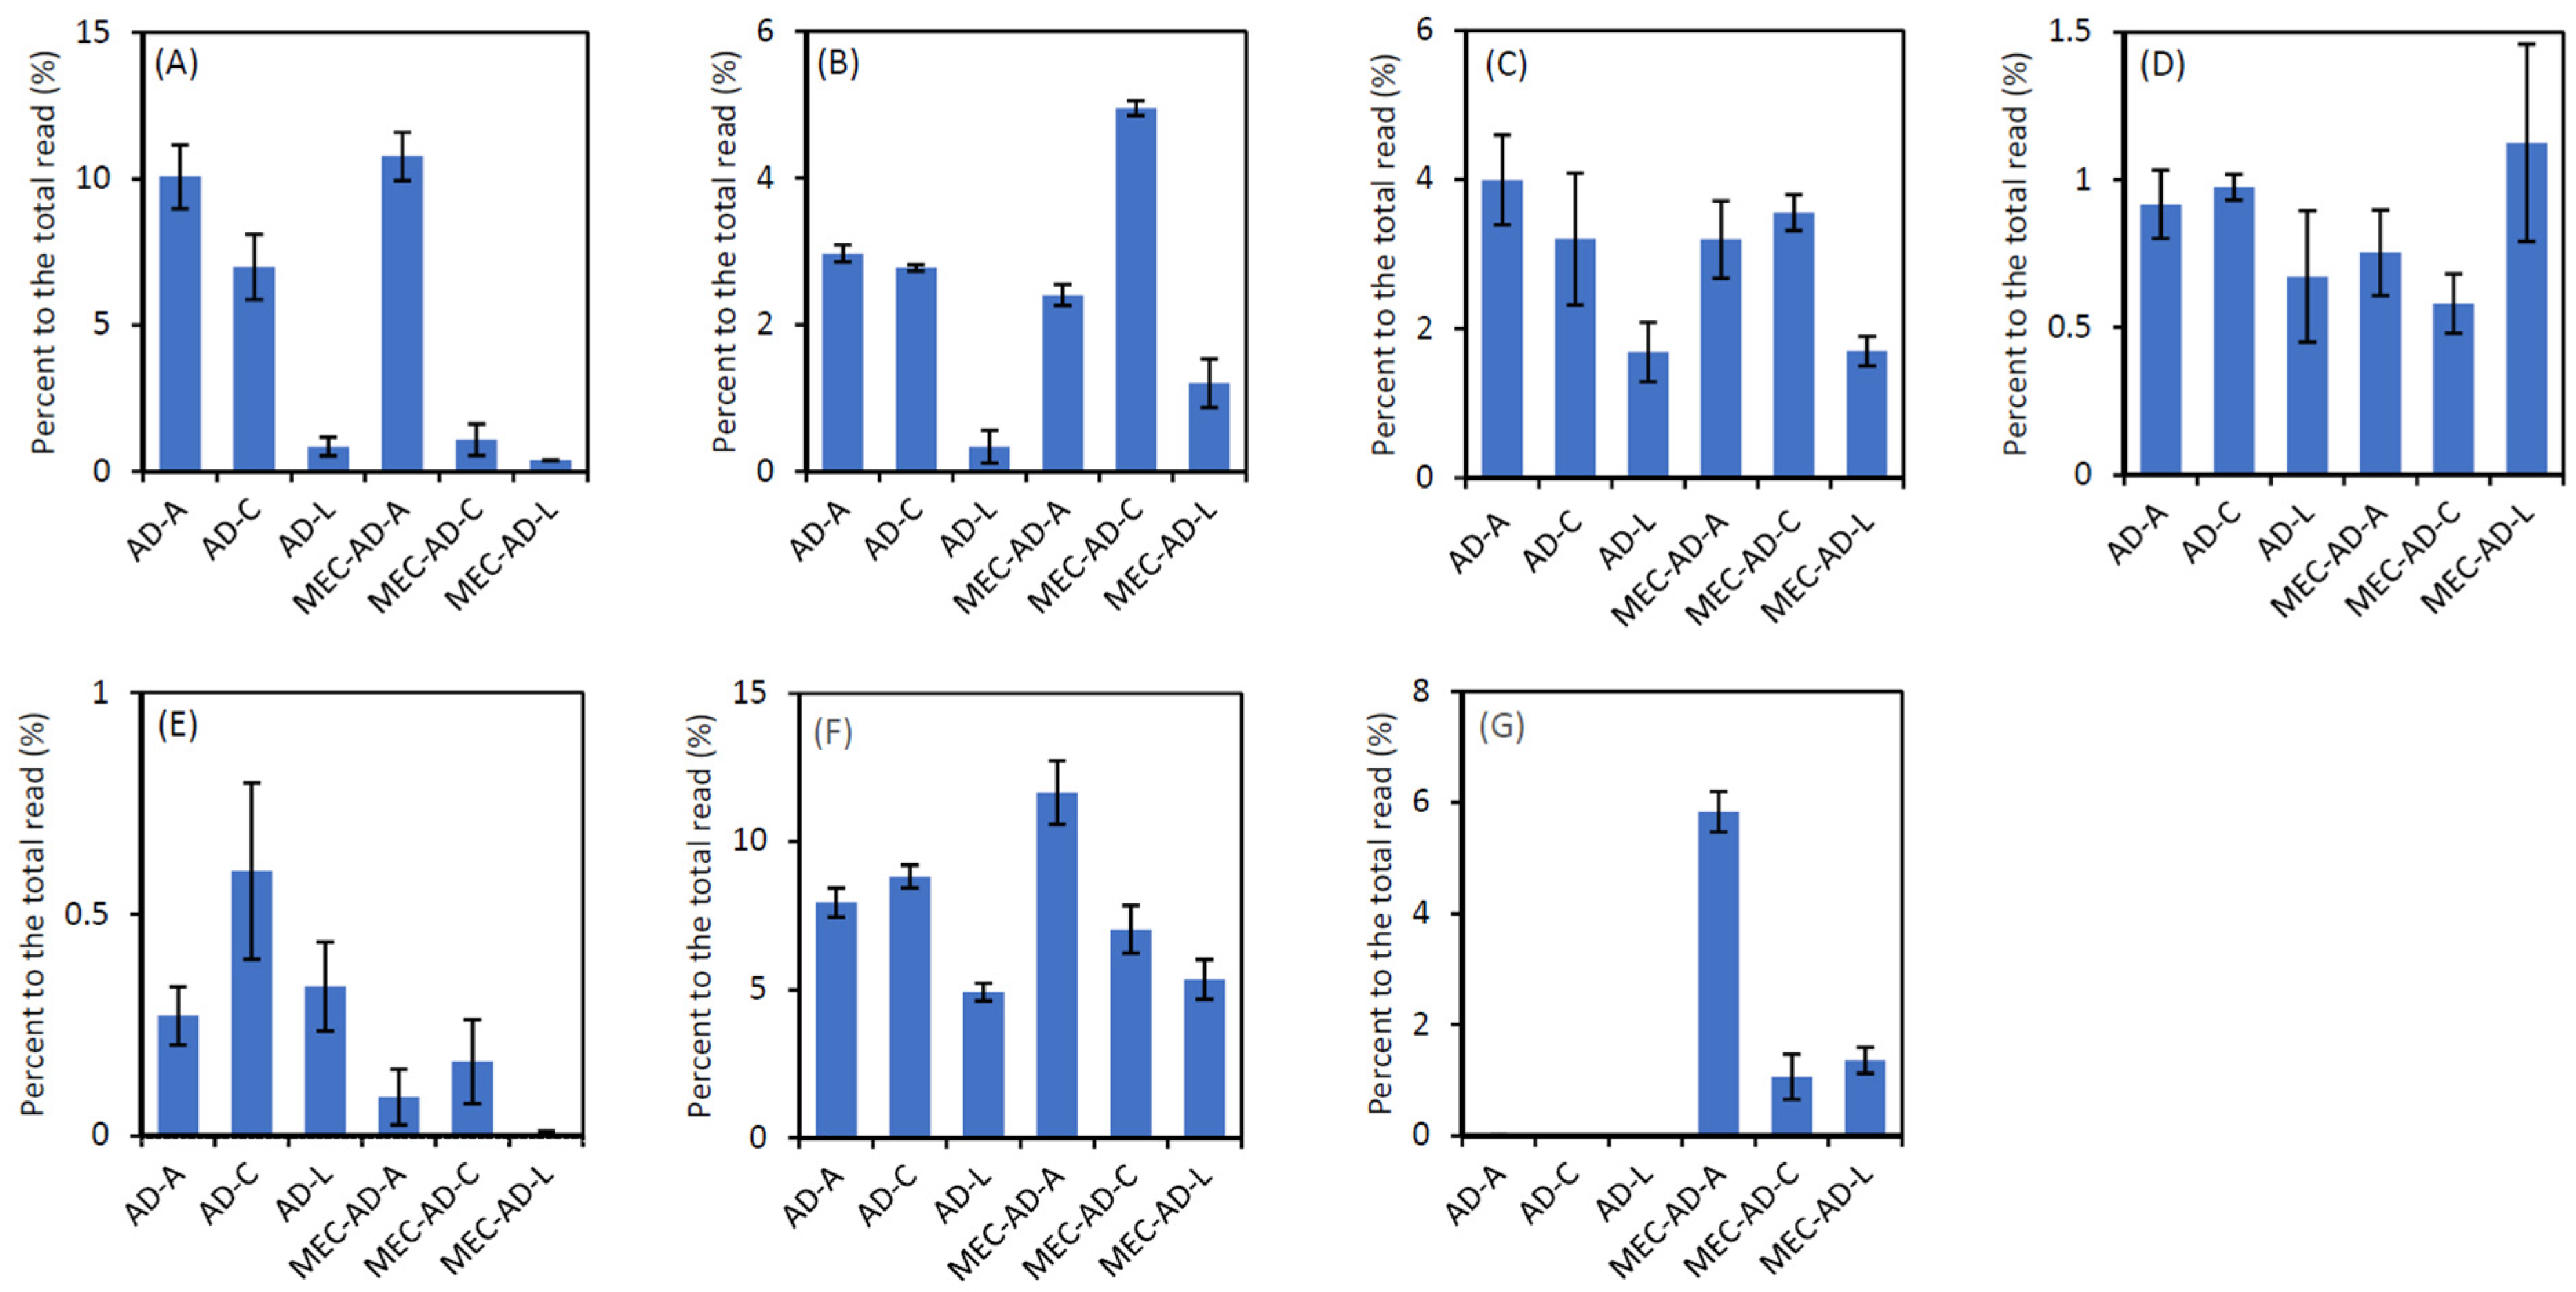
After the 30-cycle operation of AD and MEC-AD (three reactors each), metabarcoding analyses of microbes associated with anodes (or anode materials), those associated with cathodes (or cathode materials) and those in internal liquids were conducted. Figure 6 shows relative abundances of major family-level taxa. The major taxa detected in these reactors are mostly affiliated with the domain Bacteria, while several archaeal taxa are also detected, such as Methanosaetaceae, Methanobacteriaceae, Methanomicrobiaceae, Methanomassiliicoccaceae and Methanosarcinaceae. These archaeal families are of interest, since these are known to comprise methanogens. We therefore compared relative abundances of these archaea in different fractions in AD and MEC-AD (Figure 7), showing that Methanosaetaceae, Methanobacteriaceae and Methanomicrobiaceae are relatively abundant in AD and MEC-AD. In addition, it is noteworthy that the relative abundance of Methanosaetaceae in the anode biofilm in MEC-AD was significantly higher than that in the cathode biofilm (Figure 7A), while the relative abundance of Methanobacteriaceae significantly increased in the cathode biofilm in MEC-AD (Figure 7B). Among bacterial taxa, we are interested in Desulfuromonadaceae and Dethiosulfovibrionaceae, since the relative abundances of these families increased in the anode biofilms in MEC-AD (Figure 6 and Figure 7).
Figure 6.
Metabarcoding of bacteria and archaea in AD and AD-MEC after the 30-cycle operation. In sample names, A represents the anode (or anode material), C represents the cathode (or cathode material), and L represents the interior liquid. Three reactors (1, 2 and 3) were operated for AD and MEC-AD.
Figure 7.
Relative abundances of some taxa of interest. (A) Methanosaetaceae, (B) Methanobacteriaceae, (C) Methanomicrobiaceae, (D) Methanomassiliicoccaceae, (E) Methanosarcinaceae, (F) Dethiosulfovibrionaceae and (G) Desulfuromonadaceae. Refer to Figure 6 for sample names.
The family Desulfuromonadaceae is represented by the type genus Desulfuromonas, a strictly anaerobic chemo-organotroph that grows on acetate, ethanol and propanol as electron donors, and malate, fumarate and sulfur as electron acceptors [35]. This bacterium is unable to ferment organic substances and requires NaCl (1 to 2%) for growth [35]. In addition, studies have shown that members of the genus Desulfuromonas are electrochemically active and are able to generate anodic current with acetate as an electron donor [36,37]. Desulfuromonas bacteria have been detected as major populations in anode biofilms of mixed-culture bioelectrochemical systems (BESs) [38,39]. For instance, BESs equipped with hydrophilic electrodes and inoculated with digester effluent are dominated by the Gram-negative sulfur-reducing bacterium Desulfuromonas acetexigens [38]. In another study, microbial community analysis of microbial fuel cells treating production water from petroleum industries detected Desulfuromonas as the dominant bacteria [39]. The present study found that Desulfuromonadaceae bacteria were detected only in MEC-AD and were particularly abundant in anode biofilms (Figure 7G). In light of prior knowledge and the results of the present study, it can be concluded that Desulfuromonadaceae bacteria are responsible for current generation at the anode in MEC-AD, probably by oxidizing VFAs, such as acetate.
The family Dethiosulfovibrionaceae comprises strictly anaerobic Gram-negative bacteria that are chemoheterotrophic, saccharolytic, mesophilic, neutrophilic and moderately halophilic [40]. They ferment amino acids and carboxylic acids and produce acetate as the fermentation product. External electron acceptors are not required for growth, but sulfur and thiosulfate stimulate the growth in some strains [40]. Based on the known physiological characteristics [40] and the abundant occurrence in anode biofilms in the present work (Figure 7F), it is assumed that Dethiosulfovibrionaceae bacteria may have syntrophic interactions with Desulfuromonadaceae bacteria and contribute to current generation at the anodes by supplying acetate to Desulfuromonadaceae bacteria.
Among the five families of methanogenic archaea detected in the present work (Figure 6 and Figure 7), we are interested in Methanobacteriaceae and Methanosaetaceae. The family Methanobacteriaceae consists of four genera, Methanobacterium, Methanobrevibacter, Methanosphaera and Methanothermobacter. They are known to be strict anaerobes, and most members of the family are hydrogenotrophic methanogens, obtaining energy for growth from the reduction of CO2 with H2 [41]. Methanobacteriaceae archaea, represented by mesophilic Methanobacterium, have frequently been detected in cathode fractions in MEC-AD [42,43]. For instance, fluorescence in situ hybridization of cathode biofilms in two-chamber MECs revealed that Methanobacterium was the predominant methanogen [42], and the authors consider this methanogen to conduct direct electron transfer between cells and electrodes [42]. In addition, analyses of cathode biofilms in acetate-fed MEC-AD abundantly detected Methanobacteriaceae in association with hydrogen and methane production [43]. It has also been reported that Methanobacterium spp. made up more than 80% of biocathode populations converting carbon dioxide into methane using hydrogen generated at the surface of carbon cathodes [44]. In the present work, the abundant presence of Methanobacteriaceae in the cathode biofilm in MEC-AD (Figure 7B) suggests that this group of methanogens is directly involved in the improved methane production in MEC-AD at high OLRs (Figure 3). It would be of interest to examine if this group of methanogens receives reducing equivalents from the cathode via direct electron transfer or hydrogen-mediated electron transfer.
The family Methanosaetaceae (current name: Methanotrichaceae) was abundantly present on the anode and cathode materials in AD, while in MEC-AD, the relative abundance of this group of methanogens in the anode fraction was much higher than that in the cathode fraction (Figure 7A). Methanogens belonging to this family are known to be acetoclastic methanogens that produce methane from acetate [45]. In previous studies, Methanotrichaceae relatives were detected in anode fractions. For instance, in an up-flow dual-chamber electrocatalytic anaerobic bioreactor for propionate degradation, they were detected along with syntrophic propionate-oxidizing bacteria (Syntrophobacterales) in anode fractions [46]. We therefore consider Methanotrichaceae (Methanosaetaceae) methanogens to contribute to current generation at the anode in MEC-AD.
3. Materials and Methods
3.1. Substrate and Inoculum
FWS was prepared from food waste (FW). FW and ADE were obtained from a commercial AD plant [27], in which FW was collected from restaurants, food markets and food factories. Before FW was put into an AD tank, it was anaerobically incubated for several days in a pre-treatment tank for solubilization. For the laboratory experiments, the pre-treated FW was obtained in September 2024. It was centrifuged at 7000× g for 5 min, and the FW supernatant (FWS) was used as the substrate after adjusting the pH to 7.0. The characteristics of the FWS are summarized in Table 1. The COD and pH of ADE were approximately 40,000 mg L−1 and 7.0, respectively. The FWS was stored at −20 °C and used as the substrate immediately after thawing.
COD was measured using a TNT823 ultra-high-range (250–15,000 mg L−1) system (Hach Co., Loveland, CO, USA), while pH was measured using a pH meter (pH-11B, Horiba, Kyoto, Japan). Electric conductivity was measured using a Water Quality Tester JQ-006 (True Sense Technologies, New Delhi, India). Total solids were the weight of residue after the FWS was dried at 105 °C for one day. Lipids, total nitrogen, ammonium ion, nitrate ion, sulfate ion and sulfide ion were measured using Pack Tests according to the manufacturer’s instructions (Kyoritsu Chemical-Check Lab. Corp, Kanagawa, Japan). Carbohydrates were measured by the phenol–sulfuric acid method [47]. Protein concentrations were measured by the BCA assay (BCA-RAC Assay, Thermo Fisher Scientific, Waltham, MA, USA). VFAs (acetate, propionate, butyrate and lactate) were measured by high-performance liquid chromatography using an Agilent 1260 Infinity II system (Agilent Technologies, Santa Clara, CA, USA) equipped with a refractive index detector and an Aminex HPX-87H column (7.8 × 300 mm; Bio-rad laboratories, Hercules, CA, USA). Samples were eluted at 30 °C with 10 mM H2SO4 at a flow rate of 0.6 mL min−1.
3.2. Setups of Reactors
A laboratory single-chamber reactor used in the present work for AD and MEC-AD is shown in Figure 1. The reactor configuration of AD and MEC-AD was the same, and the difference was whether or not the anode and cathode were electrically connected (MEC-AD) or not (AD). The volumetric capacity of the reactor was 650 mL. Top and side ports were equipped with rubber stoppers and plastic caps. An anode (serving as a working electrode [WE] in a three-electrode mode) was made of graphite felt (16 cm2 in area, 5 mm in thickness, KURECA felt, Kureha corporation, Tokyo, Japan). A cathode (serving as a counter electrode [CE] in a three-electrode mode) was also made of graphite felt (8 cm2 in area, 5 mm in thickness, KURECA felt) that was doped with platinum catalysts (6 mg cm−2, TEC10V70E, Tanaka Kikinzoku Kogyo, Tokyo, Japan). The distance between the anode and cathode was approx. 3 cm. The reactor was also equipped with an Ag/AgCl RE (+0.2 V vs. standard hydrogen electrode; RE-T7A, EC Frontier, Kyoto, Japan). These electrode materials were secured to the rubber stopper at the top cap of the reactor using titanium wires (1 mm in thickness, Nilaco, Tokyo, Japan). In MEC-AD, these wires were connected to a potentiostat (HA151-B, Meiden-Hokuto, Tokyo, Japan). Three reactors were prepared for each condition (AD and MEC-AD) to examine the reproducibility.
3.3. Operation of Reactors
To initiate the operation, 95 mL of ADE and 5 mL of FWS were added to a reactor, and the head space was filled with high-purity nitrogen gas (99.999%). The reactors were put in an incubator (37 °C), and internal liquid was gently agitated using a magnetic stirrer at 180 rpm. MEC-AD reactors were connected to the potentiostats and initially operated in the three-electrode mode at a constant WE potential of +0.2 V vs. the Ag/AgCl RE. Later, MEC-AD was also operated in the two-electrode mode at a constant cell voltage of 1.0 V. Current was measured using the potentiostat and recorded every 10 min in a data logger (GL840, Graphtec, Yokohama, Japan).
Every several days, a certain volume of fresh FWS was injected into a reactor using a syringe from the side port, after the same volume of internal liquid was removed. The volume of FWS to be injected into the reactor was determined based on the COD in the FWS (CODFWS), the volume of the internal liquid of the reactor (100 mL) and the OLR. Before removing the internal liquid, headspace gas was removed from the reactor using a syringe until the internal gas reached atmospheric pressure, and the volume of gas removed from the reactor was recorded. This procedure was conducted at 37 °C.
3.4. Analyses of Reactor Performances
During the operation, the COD and pH of the internal liquid removed from the reactor after a cycle of operation (effluent) were measured. CODR (%) was calculated from CODFWS and CODE according to the following equation: CODR (%) = (CODFWS − CODE)/CODFWS × 100.
The headspace gas was analyzed using a gas chromatograph (GC-14A, Shimadzu, Kyoto, Japan) equipped with a thermal conductivity detector and a molecular sieve 5A 60–80/Porapack Q 80–100 column (Shimadzu) as described elsewhere [48], and the percentage of CH4, CO2, H2, O2 and N2 were determined. From the percentage of methane gas, the headspace volume (550 mL) and the volume of gas removed from the reactor after a cycle, the volume of methane evolved during a cycle of operation (mL, at 37 °C) was calculated. Methane dissolved in the liquid was not included in the calculation. The MPR (mL L−1 D−1) was calculated using the volume of methane gas evolved in a cycle (mL), the liquid volume (100 mL) and the time of the cycle (D). MY (mL g−1 of COD) was calculated using the volume of methane gas evolved in a cycle (mL), CODFWS, CODE and the volume of effluent in a cycle.
The J value (mA cm−2) was calculated from currents recorded by the data logger and anode projection area (16 cm2). Jmax (mA cm−2) is the highest J in a cycle.
The data were statistically analyzed by the t test using the Welch’s method. A pair of data is determined to be significantly different when the p value is less than 0.05.
3.5. Metabarcoding of Microbes
At the end of the operation, DNA was extracted from biofilm microbes on anodes and cathodes (A and C, respectively) and planktonic microbes in interior liquid (L) using the FastDNA SPIN kit for soil (MP Biomedicals, Irvine, CA, USA). The V4 region in 16S rRNA genes was amplified from extracted DNA using primers described elsewhere [8]. PCR products were purified using a QIAquick PCR purification kit (Qiagen, Venlo, Netherlands), and after DNA concentrations were determined by measuring absorption spectra using a spectrophotometer (Nano-drop, Thermo Fisher Scientific), amplicon samples were mixed at the same concentration and subjected to pair-end sequencing using a Next Seq 1000 sequencer (Illumina, San Diego, CA, USA) according to a protocol recommended by the manufacturer. Extraction of reads matching the primer sequences and the removal of primer sequences were performed using FASTX-Toolkit (ver. 0.0.14; http://hannonlab.cshl.edu/fastx_toolkit/ (accessed on 7 February 2025)). Quality filtering was then performed using Sickle (v1.33; https://github.com/najoshi/sickle (accessed on7 February 2025)), whereby reads with a quality score below 20 were discarded. Reads shorter than 130 bp were also removed. Paired-end reads were merged using FLASH (v1.2.11; https://github.com/ebiggers/flash (accessed on 7 February 2025)) with a read length of 230 bp. Sequences were clustered into operational taxonomic units (OTUs) with 97% similarity using QIIME 2 (ver. 2024.10; https://www.qiime2.org (accessed on7 February 2025)) and taxonomically classified by aligning them with sequences in the Greengene database (ver.13_8) [49]. The sequences generated in the metabarcoding analysis have been deposited in the DDBJ Sequence Read Archive database under accession numbers DRR932626 to DRR932643.
4. Conclusions
The present work demonstrates that the integration of AD with MECs electrochemically facilitates methane production and COD removal at short HRTs (e.g., 8 D) and high OLRs (e.g., 8.8 g L−1 D−1), suggesting that MECs can be used for stabilizing the performance of AD under stringent operational conditions. Microbiological analyses suggest that VFA degradation at the anode is accelerated by the MEC system in association with the acceleration of hydrogenotrophic methanogenesis at the cathode, resulting in the facilitation of AD at high OLRs. It is also suggested that the integration of AD with MECs should be considered after gaining a clear understanding of the situations in which MECs are beneficial for AD. These ideas would be useful in the practical application of MEC-AD, while more diverse knowledge must be gained to bring MEC-AD closer to practical application. For instance, studies should be conducted to understand the range of biomass waste that can efficiently be treated in MEC-AD. The development of pre-treatment processes for efficient treatment of biomass waste by MEC-AD would also be required. In addition, it would be of interest to examine the use of MECs for the recovery of malfunctioning AD.
Author Contributions
Conceptualization, K.W.; methodology, S.S., T.K., and M.T.; validation, K.T. and K.W.; formal analysis, K.W.; investigation, S.S., T.K., and M.T.; resources, S.S.; data curation, S.S., T.K., and M.T.; writing—original draft preparation, K.W.; writing—review and editing, K.T.; supervision, K.T. and K.W.; project administration, K.W.; funding acquisition, K.W. All authors have read and agreed to the published version of the manuscript.
Funding
This research was funded by J & T Recycling Corporation.
Data Availability Statement
The original contributions presented in this study are included in the article. Further inquiries can be directed to the corresponding author.
Acknowledgments
We thank Miyu Tsuchiya, Hisae Mogi and Tsuyoshi Tsubone for continuous support and discussion.
Conflicts of Interest
The authors declare that this study received funding from J & T Recycling Corporation. The funder had the following involvement with the study: sample collection.
Abbreviations
The following abbreviations are used in this manuscript:
| AD | Anaerobic Digester/Anaerobic Digestion |
| MEC | Microbial Electrolysis Cell |
| MEC-AD | MEC-assisted AD |
| BES | Bioelectrochemical System |
| COD | Chemical Oxygen Demand (mg L−1) |
| HRT | Hydraulic Residence Time (D) |
| OLR | Organic Loading Rate (g L−1 D−1) |
| FW | Food Waste |
| FWS | Food Waste Supernatant |
| ADE | Anaerobic Digester Effluent |
| CODE | COD in the Effluent (mg L−1) |
| CODFWS | COD in FWS (mg L−1) |
| CODR | COD Removal (%) |
| VFA | Volatile Fatty Acid |
| MPR | Methane Production Rate (mL L−1 D−1) |
| MY | Methane Yield (mL g−1) |
| WE | Working Electrode |
| CE | Counter Electrode |
| RE | Reference Electrode |
| J | Current Density (mA cm−2) |
| Jmax | Maximum Current Density (mA cm−2) |
References
- Zhang, X.; Wang, Y.; Jiao, P.; Zhang, M.; Deng, Y.; Jiang, C.; Liu, X.W.; Lou, L.; Li, Y.; Zhang, X.X.; et al. Microbiome-functionality in anaerobic digesters: A critical review. Water Res. 2024, 249, 120891. [Google Scholar] [CrossRef] [Scilit]
- Svensson, L.M.; Christensson, K.; Björnsson, L. Biogas production from crop residues on a farm-scale level: Is it economically feasible under conditions in Sweden? Bioprocess Biosyst. Eng. 2005, 28, 139–148. [Google Scholar] [CrossRef] [Scilit]
- Yadav, M.; Joshi, C.; Paritosh, K.; Thakur, J.; Pareek, N.; Masakapalli, S.K.; Vivekanand, V. Organic waste conversion through anaerobic digestion: A critical insight into the metabolic pathways and microbial interactions. Metab. Eng. 2022, 69, 323–337. [Google Scholar] [CrossRef] [Scilit]
- Zhang, W.; Wang, X.; Xing, W.; Li, R.; Yang, T. Responses of anaerobic digestion of food waste to coupling effects of inoculum origins, organic loads and pH control under high load: Process performance and microbial characteristics. J. Environ. Manag. 2021, 279, 111772. [Google Scholar] [CrossRef] [Scilit]
- Dareioti, M.A.; Kornaros, M. Effect of hydraulic retention time (HRT) on the anaerobic co-digestion of agro-industrial wastes in a two-stage CSTR system. Bioresour. Technol. 2014, 167, 407–415. [Google Scholar] [CrossRef] [Scilit]
- Li, L.; Peng, X.; Wang, X.; Wu, D. Anaerobic digestion of food waste: A review focusing on process stability. Bioresour. Technol. 2018, 248, 20–28. [Google Scholar] [CrossRef] [Scilit] [PubMed]
- Tatara, M.; Makiuchi, T.; Ueno, Y.; Goto, M.; Sode, K. Methanogenesis from acetate and propionate by thermophilic down-flow anaerobic packed-bed reactor. Bioresour. Technol. 2008, 99, 4786–4795. [Google Scholar] [CrossRef] [Scilit] [PubMed]
- Kouzuma, A.; Tsutsumi, M.; Ishii, S.; Ueno, Y.; Abe, T.; Watanabe, K. Non-autotrophic methanogens dominate in anaerobic digesters. Sci. Rep. 2017, 7, 1510. [Google Scholar] [CrossRef] [Scilit]
- Wu, Y.; Wang, S.; Liang, D.; Li, N. Conductive materials in anaerobic digestion: From mechanism to application. Bioresour. Technol. 2020, 98, 122403. [Google Scholar] [CrossRef] [Scilit] [PubMed]
- Kato, S.; Hashimoto, K.; Watanabe, K. Methanogenesis facilitated by electric syntrophy via (semi)conductive iron-oxide minerals. Environ. Microbiol. 2012, 14, 1646–1654. [Google Scholar] [CrossRef] [Scilit]
- Tian, T.; Qiao, S.; Li, X.; Zhang, M.; Zhou, J. Nano-graphene induced positive effects on methanogenesis in anaerobic digestion. Bioresour. Technol. 2017, 224, 41–47. [Google Scholar] [CrossRef] [Scilit] [PubMed]
- Ambuchi, J.J.; Zhang, Z.; Shan, L.; Liang, D.; Zhang, P.; Feng, Y. Response of anaerobic granular sludge to iron oxide nanoparticles and multi-wall carbon nanotubes during beet sugar industrial wastewater treatment. Water Res. 2017, 117, 87–94. [Google Scholar] [CrossRef] [Scilit]
- Kumar, S.S.; Ghosh, P.; Kataria, N.; Kumar, D.; Thakur, S.; Pathania, D.; Kumar, V.; Nasrullah, M.; Singh, L. The role of conductive nanoparticles in anaerobic digestion: Mechanism, current status and future perspectives. Chemosphere 2021, 280, 130601. [Google Scholar] [CrossRef] [Scilit]
- Inaba, R.; Nagoya, M.; Kouzuma, A.; Watanabe, K. Metatranscriptomic evidence for magnetite nanoparticle-stimulated acetoclastic methanogenesis under continuous agitation. Appl. Environ. Microbiol. 2019, 85, e01733-19. [Google Scholar] [CrossRef] [Scilit] [PubMed]
- Wang, W.; Lee, D.J.; Lei, Z. Integrating anaerobic digestion with microbial electrolysis cell for performance enhancement: A review. Bioresour. Technol. 2022, 344, 126321. [Google Scholar] [CrossRef] [Scilit]
- Ao, T.J.; Liu, C.G.; Sun, Z.Y.; Zhao, X.Q.; Tang, Y.Q.; Bai, F.W. Anaerobic digestion integrated with microbial electrolysis cell to enhance biogas production and upgrading in situ. Biotechnol. Adv. 2024, 73, 108372. [Google Scholar] [CrossRef] [Scilit]
- Lu, L.; Ren, Z.J. Microbial electrolysis cells for waste biorefinery: A state of the art review. Bioresour. Technol. 2016, 215, 254–264. [Google Scholar] [CrossRef] [Scilit]
- Li, Y.; Zhang, Y.; Liu, Y.; Zhao, Z.; Zhao, Z.; Liu, S.; Zhao, H.; Quan, X. Enhancement of anaerobic methanogenesis at a short hydraulic retention time via bioelectrochemical enrichment of hydrogenotrophic methanogens. Bioresour. Technol. 2016, 218, 505–511. [Google Scholar] [CrossRef] [Scilit] [PubMed]
- Park, J.; Lee, B.; Tian, D.; Jun, H. Bioelectrochemical enhancement of methane production from highly concentrated food waste in a combined anaerobic digester and microbial electrolysis cell. Bioresour. Technol. 2018, 247, 226–233. [Google Scholar] [CrossRef] [Scilit]
- Park, J.G.; Lee, B.; Park, H.R.; Jun, H.B. Long-term evaluation of methane production in a bio-electrochemical anaerobic digestion reactor according to the organic loading rate. Bioresour. Technol. 2019, 273, 478–486. [Google Scholar] [CrossRef] [Scilit]
- Negi, S.; Chai, J.Y.; Tjhin, A.C.T.; Pan, S.Y. Electro-anaerobic digestion as carbon-neutral solutions. Chem. Biol. Technol. Agric. 2025, 12, 64. [Google Scholar] [CrossRef] [Scilit]
- Harb, M.; Ermer, N.; Sawaya, C.B.; Smith, A.L. Increased applied voltage in the presence of GAC enhances microbial activity and methane production during anaerobic digestion of food waste. Environ. Sci. Water Res. Technol. 2020, 6, 737–746. [Google Scholar] [CrossRef] [Scilit]
- Qi, X.; Jia, X.; Wang, Y.; Xu, P.; Li, M.; Xi, B.; Zhao, Y.; Zhu, Y.; Meng, F.; Ye, M. Development of a rapid startup method of direct electron transfer-dominant methanogenic microbial electrosynthesis. Bioresour. Technol. 2022, 358, 127385. [Google Scholar] [CrossRef] [Scilit]
- Molognoni, D.; Bosch-Jimenez, P.; Rodríguez-Alegre, R.; Marí-Espinosa, A.; Licon, E.; Gallego, J.; Lladò, S.; Borràs, E.; Della Pirriera, M. How operational parameters affect electromethanogenesis in a bioelectrochemical power-to-gas prototype. Front. Energy Res. 2020, 8, 174. [Google Scholar] [CrossRef] [Scilit]
- Yoshizu, D.; Shimizu, S.; Tsuchiya, M.; Tomita, K.; Kouzuma, A.; Watanabe, K. Isolation of electrochemically active bacteria from an anaerobic digester treating food wastes and their characterization. Microorganisms 2024, 12, 1645. [Google Scholar] [CrossRef] [Scilit]
- Gu, J.; Liu, R.; Cheng, Y.; Stanisavljevic, N.; Li, L.; Djatkov, D.; Peng, X.; Wang, X. Anaerobic co-digestion of food waste and sewage sludge under mesophilic and thermophilic conditions: Focusing on synergistic effects on methane production. Bioresour. Technol. 2020, 301, 122765. [Google Scholar] [CrossRef] [Scilit]
- Yoshizu, D.; Kouzuma, A.; Watanabe, K. Use of microbial fuel cells for the treatment of residue effluents discharged from an anaerobic digester treating food wastes. Microorganisms 2023, 11, 598. [Google Scholar] [CrossRef] [Scilit] [PubMed]
- Kumar, K.K.; Cema, G.; Ziembińska-Buczyńska, A.; Hassan, G.K.; Hellal, M.S.; Surmacz-Gòrska, J. Sustainable biomethane production from waste biomass: Challenges associated with process optimization in improving the yield. Environ. Sci. Pollut. Res. Int. 2025, 32, 28378–28410. [Google Scholar] [CrossRef] [Scilit]
- Ibrahim, N.A.; Majeed, H.H.; Jwaid, T.A.; Silas, K. Advancements in anaerobic digestion of organic waste for sustainable biogas production. Environ. Sci. Pollut. Res. Int. 2025, 32, 17916–17930. [Google Scholar] [CrossRef] [Scilit]
- Zhang, L.; Jahng, D. Long-term anaerobic digestion of food waste stabilized by trace elements. Waste Manag. 2012, 32, 1509–1515. [Google Scholar] [CrossRef] [Scilit] [PubMed]
- Tayyab, A.; Ahmad, Z.; Mahmood, T.; Khalid, A.; Qadeer, S.; Mahmood, S.; Andleeb, S.; Anjum, M. Anaerobic co-digestion of catering food waste utilizing Parthenium hysterophorus as co-substrate for biogas production. Biomass Bioenerg. 2019, 124, 74–82. [Google Scholar] [CrossRef] [Scilit]
- Guo, Z.; Thangavel, S.; Wang, L.; He, Z.; Cai, W.; Wang, A.; Liu, W. Efficient methane production from beer wastewater in a membraneless microbial electrolysis cell with a stacked cathode: The effect of the cathode/anode ratio on bioenergy recovery. Energy Fuels 2017, 31, 615–620. [Google Scholar] [CrossRef] [Scilit]
- Liu, H.Z.; Zhang, Y.; Yang, S.X.; Wang, N.; Liu, H.B.; Li, J.C. Introducing electrolysis to enhance anaerobic digestion resistance to acidification. Bioprocess Biosyst. Eng. 2022, 45, 515–525. [Google Scholar] [CrossRef] [Scilit]
- Xiao, B.; Wang, X.; He, E.; Zuo, Y.; Wan, L.; Li, L. Effects of microbial electrolysis cell on anaerobic digestion of food waste: Acidification and recovery. Fuel 2024, 369, 131756. [Google Scholar] [CrossRef] [Scilit]
- Pfennig, N.; Biebl, H. Desulfuromonas acetoxidans gen. nov. and sp. nov., a new anaerobic, sulfur-reducing, acetate-oxidizing bacterium. Arch. Microbiol. 1976, 110, 3–12. [Google Scholar] [CrossRef] [Scilit]
- Sapireddy, V.; Katuri, K.P.; Muhammad, A.; Saikaly, P.E. Competition of two highly specialized and efficient acetoclastic electroactive bacteria for acetate in biofilm anode of microbial electrolysis cell. npj Biofilms Microbiomes 2021, 7, 47. [Google Scholar] [CrossRef] [Scilit]
- Shaw, D.R.; Katuri, K.P.; Sapireddy, V.; Douvropoulou, O.; Gralnick, J.A.; Saikaly, P.E. Independently evolved extracellular electron transfer pathways in ecologically diverse Desulfobacterota. ISME J. 2025, 19, wraf097. [Google Scholar] [CrossRef] [Scilit] [PubMed]
- Katuri, K.P.; Kamireddy, S.; Kavanagh, P.; Muhammad, A.; Conghaile, P.Ó.; Kumar, A.; Saikaly, P.E.; Leech, D. Electroactive biofilms on surface functionalized anodes: The anode respiring behavior of a novel electroactive bacterium, Desulfuromonas acetexigens. Water Res. 2020, 185, 116284. [Google Scholar] [CrossRef] [Scilit]
- Cabrera, J.; Dai, Y.; Irfan, M.; Li, Y.; Gallo, F.; Zhang, P.; Zong, Y.; Liu, X. Novel continuous up-flow MFC for treatment of produced water: Flow rate effect, microbial community, and flow simulation. Chemosphere 2022, 289, 133186. [Google Scholar] [CrossRef] [Scilit] [PubMed]
- Pradel, N.; Fardeau, M.L.; Bunk, B.; Spröer, C.; Boedeker, C.; Wolf, J.; Neumann-Schaal, M.; Pester, M.; Spring, S. Aminithiophilus ramosus gen. nov., sp. nov., a sulphur-reducing bacterium isolated from a pyrite-forming enrichment culture, and taxonomic revision of the family Synergistaceae. Int. J. Syst. Evol. Microbiol. 2023, 73, 005691. [Google Scholar] [CrossRef] [Scilit]
- Oren, A. The family Methanobacteriaceae. In The Prokaryotes; Rosenberg, E., DeLong, E.F., Lory, S., Stackebrandt, E., Thompson, F., Eds.; Springer: Berlin/Heidelberg, Germany, 2014; pp. 165–193. [Google Scholar] [CrossRef] [Scilit]
- Zhen, G.; Kobayashi, T.; Lu, X.; Xu, K. Understanding methane bioelectrosynthesis from carbon dioxide in a two-chamber microbial electrolysis cells (MECs) containing a carbon biocathode. Bioresour. Technol. 2015, 186, 141–148. [Google Scholar] [CrossRef] [Scilit] [PubMed]
- Li, X.; Zeng, C.; Lu, Y.; Liu, G.; Luo, H.; Zhang, R. Development of methanogens within cathodic biofilm in the single-chamber microbial electrolysis cell. Bioresour. Technol. 2019, 274, 403–409. [Google Scholar] [CrossRef] [Scilit] [PubMed]
- Saheb-Alam, S.; Singh, A.; Hermansson, M.; Persson, F.; Schnürer, A.; Wilén, B.M.; Modin, O. Effect of start-up strategies and electrode materials on carbon dioxide reduction on biocathodes. Appl. Environ. Microbiol. 2018, 84, e02242-17. [Google Scholar] [CrossRef] [Scilit]
- Oren, A. The family Methanotrichaceae. In The Prokaryotes; Rosenberg, E., DeLong, E.F., Lory, S., Stackebrandt, E., Thompson, F., Eds.; Springer: Berlin/Heidelberg, Germany, 2014; pp. 297–306. [Google Scholar] [CrossRef] [Scilit]
- Wang, J.; Gao, Y.; Liu, Z.; Han, Y.; Li, W.; Lu, X.; Dong, K.; Zhen, G. Enhanced propionate degradation and CO2 electromethanogenesis in an up-flow dual-chamber electrocatalytic anaerobic bioreactor (UF-DC-EAB): Leveraging DIET-mediated syntrophy for microbial stability. Water Res. 2025, 272, 122927. [Google Scholar] [CrossRef] [Scilit]
- Dubois, M.; Gilles, K.; Hamilton, J.; Rebers, P.A.; Smith, F. Colorimetric method for determination of sugars and related substances. Anal. Chem. 1956, 28, 350–356. [Google Scholar] [CrossRef] [Scilit]
- Ishii, S.; Kosaka, T.; Hori, K.; Hotta, Y.; Watanabe, K. Coaggregation facilitates interspecies hydrogen transfer between Pelotomaculum thermopropionicum and Methanothermobacter thermautotrophicus. Appl. Environ. Microbiol. 2005, 71, 7838–7845. [Google Scholar] [CrossRef] [Scilit]
- McDonald, D.; Price, M.N.; Goodrich, J.; Nawrocki, E.P.; DeSantis, T.Z.; Probst, A.; Andersen, G.L.; Knight, R.; Hugenholtz, P. An improved Greengenes taxonomy with explicit ranks for ecological and evolutionary analyses of bacteria and archaea. ISME J. 2012, 6, 610–618. [Google Scholar] [CrossRef] [Scilit] [PubMed]

Disclaimer/Publisher’s Note: The statements, opinions and data contained in all publications are solely those of the individual author(s) and contributor(s) and not of MDPI and/or the editor(s). MDPI and/or the editor(s) disclaim responsibility for any injury to people or property resulting from any ideas, methods, instructions or products referred to in the content. |
© 2026 by the authors. Licensee MDPI, Basel, Switzerland. This article is an open access article distributed under the terms and conditions of the Creative Commons Attribution (CC BY) license.