


Abstract
This study addresses the lack of quantitative understanding regarding vent-gas combustion feedback in thermal runaway propagation of manganese-based prismatic battery modules. We develop a coupled multiphysics model integrating solid heat transfer, runaway kinetics, gas ejection, and turbulent combustion, informed by constant-volume reactor tests on a single cell that yield a total gas release of 10.6 mol per cell, with H2 and CO comprising about 49% of combustibles. Model predictions are validated against three-cell module propagation experiments, capturing sequential failure with simulated inter-cell intervals matching experimental repeats that range from 71 to 105 s. The combustion model assumes auto-ignition-based initiation and therefore does not address the stochastic ignition delays observed in the experiments. It is intended for quantifying propagation acceleration once combustion has commenced. Quantitative heat-flow analysis reveals that gas-phase convective and radiative heating contributes substantially to the total heat flux on adjacent cells during venting, and direct comparison between simulations with and without combustion shows that combustion reduces inter-cell propagation intervals by 8–11%, confirming that combustion actively accelerates propagation. Simulations further resolve the combustion zone extending up to 0.4 m laterally. This framework provides a predictive tool and mechanistic basis for vent-gas management and flame-mitigation strategies in battery energy storage systems.
1. Introduction
Lithium-ion batteries have become the dominant energy storage technology, driven by their high energy density and declining cost [1,2]. Among the various cathode chemistries, lithium-rich manganese-based oxides have attracted considerable attention for stationary energy storage owing to their high specific capacity [3], reduced cobalt content [4], and favorable cost structure [5] compared with conventional nickel-rich cathodes. However, the safe deployment of large-format manganese-based battery modules remains a critical challenge [6,7], as thermal runaway can propagate from a single cell to neighboring cells, leading to module-level fires or explosions [8]. Substantial research efforts have therefore been devoted to understanding thermal runaway behavior and propagation mechanisms at both the single-cell and module levels [9].
Extensive research has been conducted on the thermal runaway mechanisms of individual lithium-ion cells. The process is typically initiated by thermal [10], mechanical [11], or electrical abuse [12,13], triggering a cascade of exothermic reactions: decomposition of the solid electrolyte interphase, followed by anode and electrolyte reactions, separator meltdown, and cathode decomposition, ultimately leading to rapid self-heating and cell failure [1,14]. Manganese-based cathodes are generally considered more thermally stable than nickel-rich oxides [15], yet the elevated operating voltage of lithium-rich compositions still promotes significant heat and gas generation during thermal runaway. The self-heating kinetics and onset temperatures have been extensively characterized using accelerating rate calorimetry (ARC) and differential scanning calorimetry (DSC) [10], while gas yield and composition have been quantified using constant-volume reactor (CVR) and vent-sizing package experiments [6]. Despite this wealth of knowledge at the single-cell level, these studies do not address the propagation of thermal runaway across multiple cells, where the combustion of vented gases may impose additional thermal loads on neighboring cells and thereby alter the propagation dynamics.
At the module level, the focus shifts from single-cell failure to the propagation of thermal runaway across multiple cells [16,17,18,19]. Experimental studies on thermal runaway propagation have been conducted on various cell formats, with prismatic cells being particularly relevant to stationary energy storage applications. Inter-cell heat conduction has been identified as the primary propagation pathway when cells are in direct contact or separated by thin gaps [20], and the effects of cell spacing [21], thermal insulation [16], and boundary conditions [22] on propagation behavior have been systematically examined. However, most of these studies treat vented gas merely as a carrier of flammable species [20,23,24], with the combustion process either unmonitored or considered decoupled from the thermal analysis. In reality, the high-temperature vent gas ejected from a failing cell can ignite upon mixing with ambient air, generating a diffusion flame that imposes additional convective and radiative heat fluxes on adjacent cells [25]. This gas-phase heat-transfer pathway, particularly the feedback of combustion on propagation, remains poorly understood and has not been quantitatively incorporated into propagation models.
Parallel to experimental investigations, modeling studies have been undertaken to predict thermal runaway propagation. A common approach employs a lumped-parameter method in which thermal runaway is represented by empirically derived heat-generation-rate functions and propagation is predicted by solving the heat-conduction equation across neighboring cells [26]. Although these models have reproduced propagation timelines reasonably well under conduction-dominated conditions [27], they entirely omit gas-phase processes. More recently, three-dimensional computational fluid dynamics (CFD) models have been developed to resolve vent gas generation and dispersion [11,16]. These models capture the transient ejection of gases from a failing cell and their mixing with the surrounding atmosphere [28]. However, they treat the gas-phase flow and the solid-phase thermal response in a decoupled manner [29], typically treating gas dynamics as a one-way consequence of solid thermal runaway, without including a combustion model that accounts for ignition, flame propagation, or combustion heat release [30,31]. Consequently, while gas dispersion can be simulated, the feedback of combustion heat onto adjacent cells is not captured [32]. To date, only a limited number of modeling studies have addressed this two-way coupling between solid-phase propagation and gas-phase combustion, and a systematic quantitative assessment of the combustion feedback effect remains lacking [33,34,35].
To address this gap, the present study proposes a coupled thermal-gas-combustion modeling framework that explicitly resolves the two-way interaction between solid-phase thermal runaway and gas-phase combustion dynamics. The framework integrates solid heat conduction with empirically parameterized thermal runaway kinetics, a gas-generation and venting submodel informed by CVR experiments, and a large-eddy simulation (LES) with non-premixed combustion for the gas phase. The model is validated against three-cell module experiments in an open space, where temperature, voltage, and high-speed video data were collected. The validated model is then used for quantitative heat-flow analysis to elucidate the role of vent-gas combustion in accelerating propagation through gas-phase convective and radiative heating. The resulting framework captures the two-way feedback between propagation and combustion and provides quantitative evidence that gas-phase heat transfer actively accelerates propagation, identifying combustion as an integral component of propagation dynamics rather than a passive byproduct.
2. Materials and Methods
2.1. Cell Specifications
The test article was a large-format manganese-based prismatic lithium-ion cell, whose specifications are summarized in Table 1. The cathode active material is lithium-rich manganese-based oxide (Li1.2Mn0.54Ni0.13Co0.13O2), paired with a graphite anode. The electrolyte consists of 1 mol/L LiPF6 dissolved in a mixture of ethylene carbonate (EC) and ethyl methyl carbonate (EMC) with a volume ratio of 3:7 (the battery was supplied by Phylion Battery Co., Ltd., Suzhou, China). The cell has a nominal capacity of 130 Ah, an operating-voltage range of 2.7–4.3 V, a nominal voltage of approximately 3.7 V, and a gravimetric energy density of 215 Wh·kg−1.
Table 1.
Specifications of the manganese-based prismatic cell.
Before the experimental procedures described in Section 2.2 and Section 2.3, each cell was subjected to three standard formation cycles and subsequently charged to 100% state of charge (SOC) using a constant-current/constant-voltage (CC-CV) protocol, ensuring consistent initial conditions across all tests.
2.2. CVR Experiment
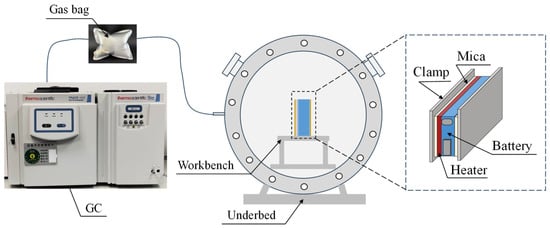
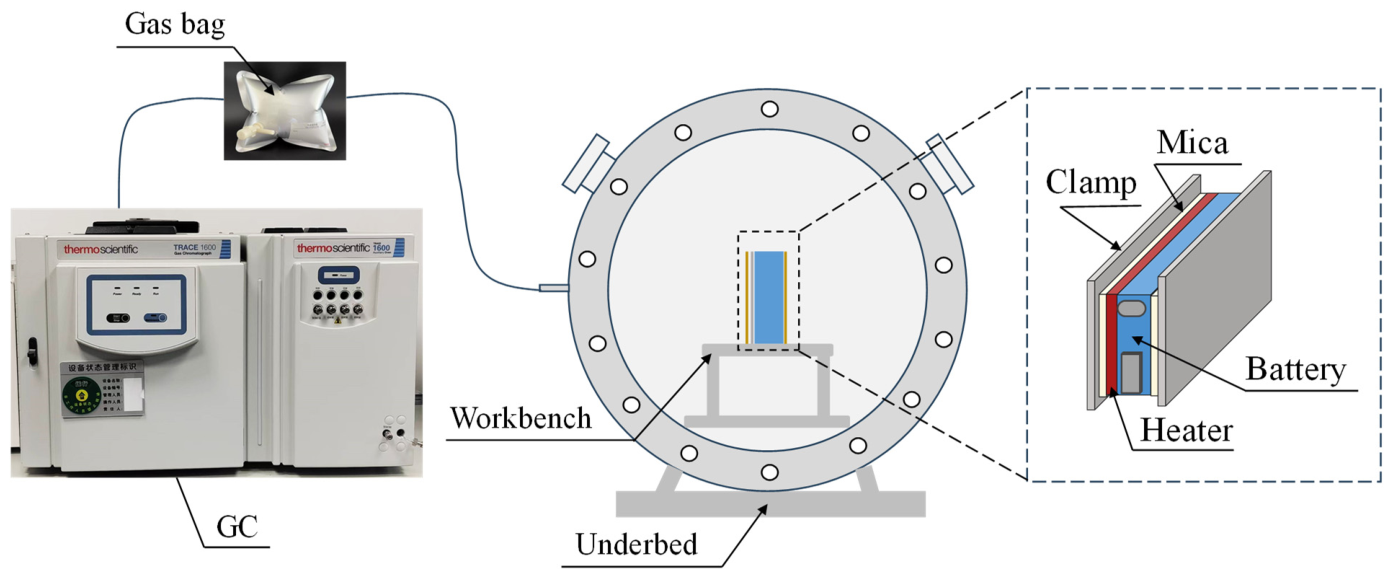
A CVR experiment was conducted to quantify the amount and composition of gas generated during thermal runaway and to provide essential inputs to the coupled thermal-gas-combustion model. The experimental setup, shown schematically in Figure 1, consisted of a custom-built stainless-steel cylindrical vessel with an internal volume of 20 L, designed to withstand a maximum pressure of 10 MPa. The vessel was fitted with a pressure transducer (WIKA, Klingenberg, Germany) for real-time monitoring of internal pressure, a type-K thermocouple (OMEGA, Norwalk, CT, USA) for gas temperature measurement, and a gas sampling port connected to a gas chromatography (GC) system (Thermo Fisher Scientific, Waltham, MA, USA).
Figure 1.
Schematic of the CVR experimental setup.
Inside the reactor, a rigid workbench was installed to support the test specimen. A single manganese-based lithium-ion prismatic cell, charged to 100% SOC, was placed on the workbench and fixed in position using a custom-designed clamping fixture. Thermal runaway was triggered by lateral heating. A custom-built 1000 W heating plate was attached to one of the large surfaces of the cell and energized until the onset of thermal runaway, as indicated by a sharp rise in internal pressure and audible venting. The heating plate was subsequently deactivated to avoid additional heat input during the gas ejection phase. The arrangement of the cell, heating plate, and fixture on the workbench is depicted in the detailed view of Figure 1.
During the experiment, the transient pressure inside the reactor and the internal gas temperature were continuously recorded at a sampling rate of 10 Hz. Assuming ideal gas behavior under the experimental temperature and pressure conditions, the total molar quantity of gas-phase species within the vessel was derived from the measured pressure and temperature according to the ideal gas law, n = pV/(RT), where V is the reactor volume, p the measured pressure, T the gas temperature, and R the universal gas constant.
After the thermal runaway event was complete and the vessel had cooled to near-ambient temperature, a gas sample was extracted from the sampling port using a gas-tight syringe and injected into the gas chromatograph for compositional analysis. The GC system enabled quantification of the major gas species, including H2, CO, CO2, and light hydrocarbons such as CH4, C2H4, and C2H6. The measured gas composition, together with the total molar yield, provides the necessary boundary conditions for the gas-generation submodel described in Section 3.3.
2.3. Thermal Runaway Propagation Experiment for Model Validation
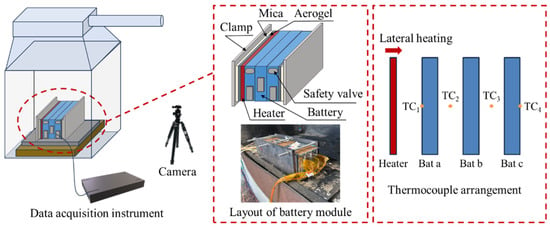
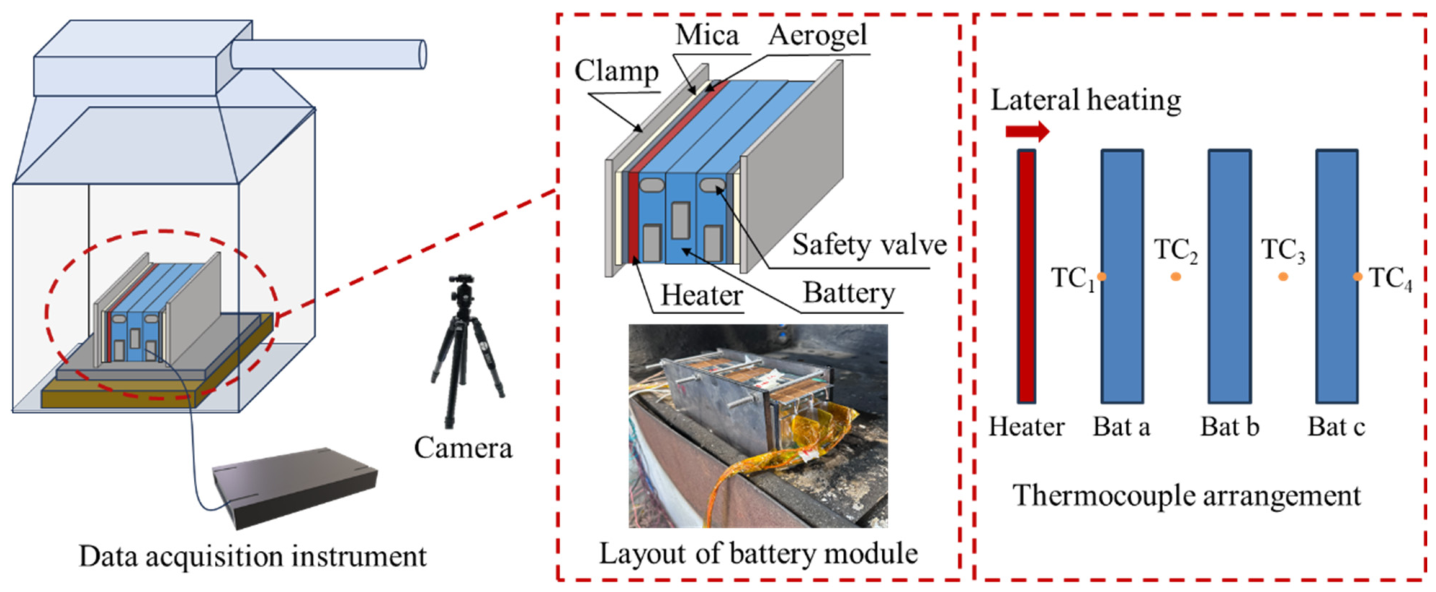
To validate the predictive capability of the coupled thermal-gas-combustion model, a thermal runaway propagation experiment was conducted using a three-cell module under open-space conditions within a ventilated enclosure. The experimental configuration is shown in Figure 2. The setup consisted of the instrumented battery module positioned inside a fume hood, with external data-acquisition systems (HIOKI LR8450, HIOKI E.E. Corp., Nagano, Japan) and a high-speed camera (Revealer, Hefei Fuhuang Junda Hi-Tech Co., Ltd., Hefei, China) used to record the progression of venting and combustion.
Figure 2.
Schematic of the thermal runaway propagation experiment.
The module was assembled using three identical manganese-based lithium-ion prismatic cells, designated sequentially as Bat a, Bat b, and Bat c in the expected direction of propagation. Each cell was charged to 100% SOC prior to assembly following the protocol described in Section 2.1. The cells were stacked face-to-face in a linear array and mechanically constrained between two stainless-steel clamps to simulate realistic pack boundary conditions. As shown in the enlarged detail of the module structure in Figure 2, the assembly incorporated several functional components: mica sheets (custom-built) were inserted between the heating element and Bat a to provide electrical isolation while maintaining thermal contact; aerogel thermal insulation (custom-built) was placed at designated interfaces to minimize heat losses and direct the propagation pathway; the heater was affixed to the outer surface of Bat a for thermal runaway initiation; and the safety valve of each cell was oriented upward to allow unrestricted venting of gases into the open environment. A physical photograph of the assembled module is presented directly beneath the schematic in Figure 2.
Thermal runaway was initiated in Bat a by lateral heating. The heater, with a power of 1000 W, was energized continuously until the onset of thermal runaway, identified by a sharp temperature rise and the initial rupture of the cell casing. Upon detection of thermal runaway in Bat a, the heater was deactivated to eliminate further external energy input. Subsequent propagation to Bat b and Bat c proceeded solely via internal heat generation and inter-cell heat transfer mechanisms, without additional stimulation.
The thermocouple arrangement is detailed in the rightmost panel of Figure 2. Four type-K thermocouples were employed to monitor the temperature evolution of the three cells. Specifically, thermocouples were affixed to the geometric center of each accessible large surface: the front face of Bat a, the shared interface between Bat a and Bat b, the shared interface between Bat b and Bat c, and the rear face of Bat c. Additionally, voltage taps were connected to the tabs of each cell to record real-time voltage dynamics during propagation.
A high-speed camera was positioned to capture the venting process, spatial dispersion of flammable gases, and intermittent flame development. The visual data provided qualitative and semi-quantitative benchmarks for evaluating the combustion-submodel predictions presented in Section 4.
The transient temperature profiles and propagation intervals measured with this configuration constituted the primary validation dataset for the coupled modeling framework described in Section 3. The combustion behavior recorded by the high-speed camera provided an additional qualitative benchmark for the combustion-submodel predictions.
3. Model Development
3.1. Overview of the Coupled Modeling Framework
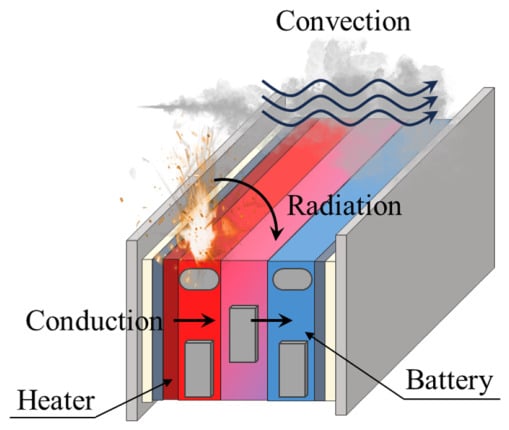
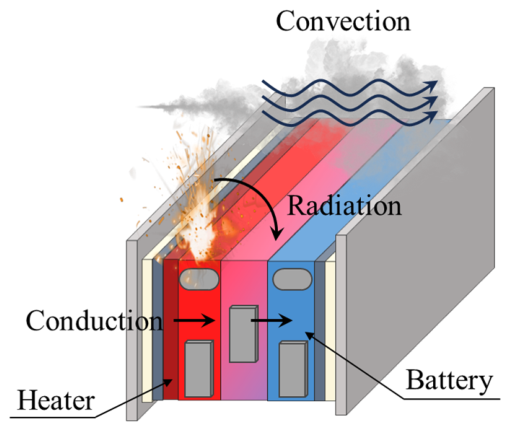
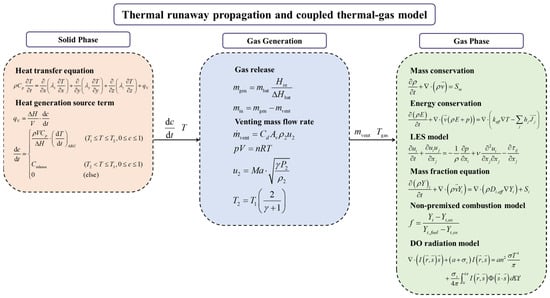
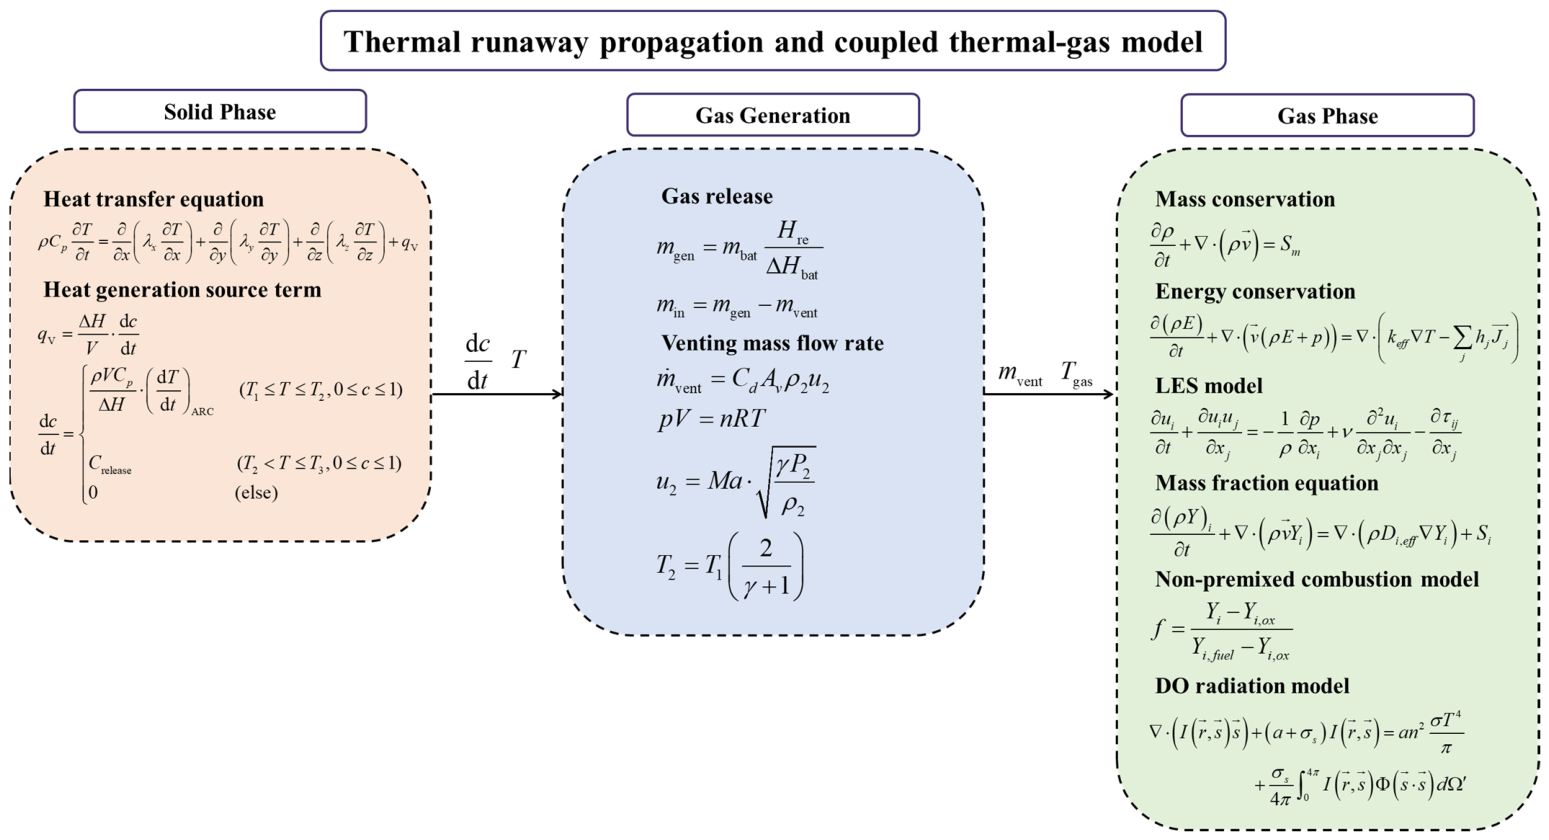
A comprehensive multiphysics modeling framework was developed to describe the thermal runaway propagation process and the associated combustion phenomena observed in the manganese-based battery module. The framework integrates three physical domains: solid-phase heat transfer and thermal runaway kinetics, gas generation and venting dynamics, and gas-phase turbulent reacting flow. Figure 3 provides a conceptual schematic of the coupled system, illustrating the principal interactions among the cell thermal state, vent gas ejection, and gas-phase combustion. Figure 4 shows the logical structure and data flow among the constituent submodels and provides a roadmap for the detailed mathematical formulations presented in the subsequent subsections.
Figure 3.
Schematic of the multiphysics coupled modeling framework.
Figure 4.
Model framework and data flow diagram.
The two-way coupling between the solid module and the surrounding gas environment is explicitly resolved in this framework. The thermal state of each cell governs the vent gas release rate and composition; the ejected gas mixes with ambient air and may undergo combustion; and the resulting heat release augments the convective and radiative heat fluxes incident upon adjacent cells. The governing equations for these three physical domains and their coupling strategy are presented in Section 3.3.
3.2. Computational Domain and Mesh
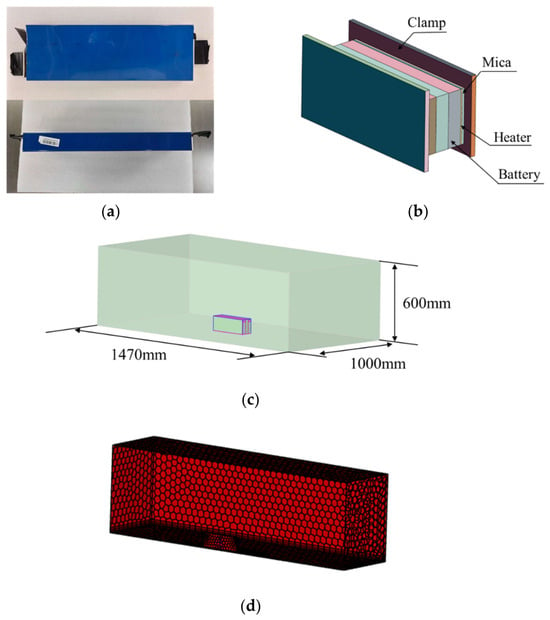
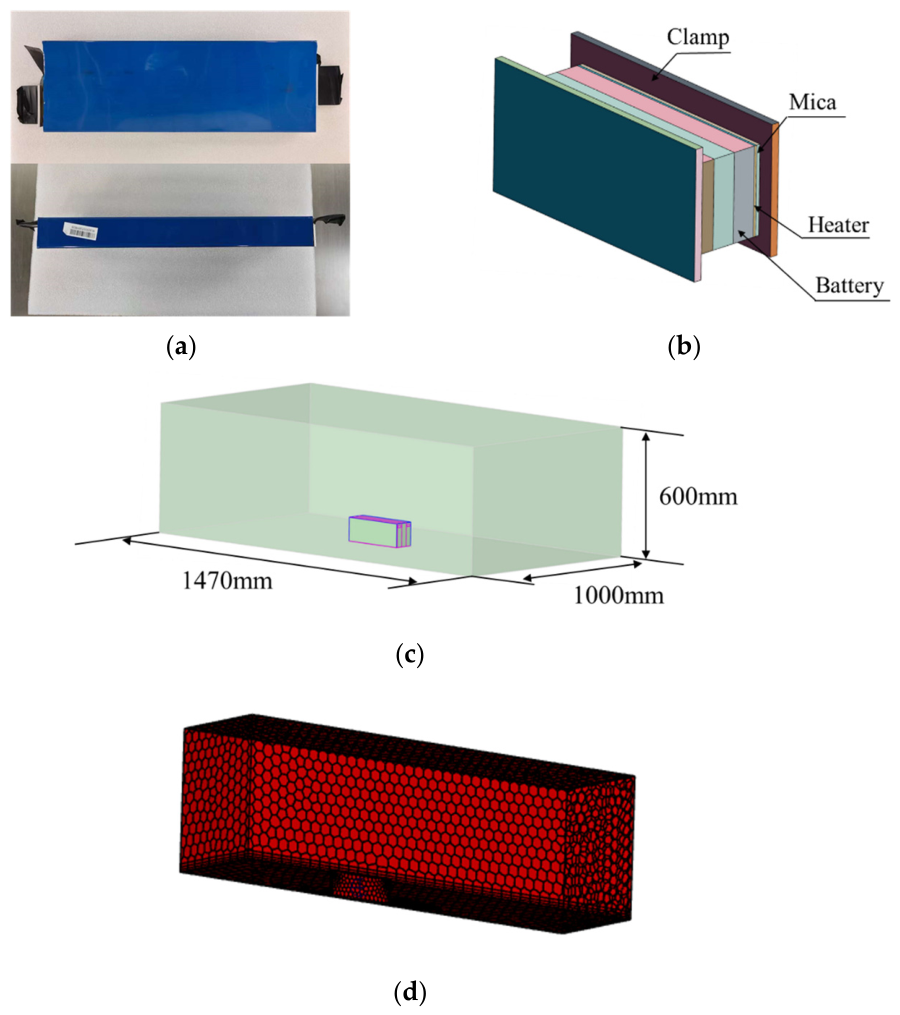
The computational domain was constructed to replicate the three-cell module geometry and the surrounding open environment described in the thermal runaway propagation experiment. Figure 5 illustrates the transition from the physical battery to the numerical model, encompassing three levels of abstraction: the actual cell photograph, the simplified geometric representation of a single cell, the full three-dimensional computational domain and the relative mesh used for the coupled simulation.
Figure 5.
Schematic of the computational model. (a) Photograph of the physical manganese-based prismatic battery. (b) Simplified geometric model of a single cell, showing external dimensions and the vent opening location. (c) Three-dimensional computational domain. (d) Three-dimensional cross-section mesh used for the coupled simulation.
The manganese-based prismatic cell, measuring 300 mm × 110 mm × 30 mm, is modeled as a homogeneous solid block with orthotropic thermal conductivity to account for the directional dependence of heat conduction within the layered electrode structure. The geometric model preserves the external dimensions and the location of the safety valve, through which the thermally generated gases are ejected into the fluid domain. Minor surface features such as terminal tabs are omitted to facilitate mesh generation without compromising the fidelity of inter-cell heat transfer predictions.
The three cells, designated Bat a, Bat b, and Bat c, are arranged face-to-face consistent with the experimental module configuration. The computational domain extends beyond the module to encompass a sufficient volume of the surrounding atmosphere, enabling the resolution of vent gas dispersion, mixing with ambient air, and potential combustion. The domain dimensions are 1470 mm in length, 1000 mm in width, and 600 mm in height. The domain boundaries are specified as pressure outlets at atmospheric conditions, with the exception of the floor plane, which is treated as a no-slip adiabatic wall representing the workbench surface.
The computational mesh is generated using a structured hexahedral-dominant scheme with local refinement in regions with steep gradients. Mesh refinement was applied to the inter-cell gaps to resolve the conductive heat flux across contact interfaces; the vicinity of the vent openings, where high-velocity gas ejection generates steep velocity and species gradients; and the flame-development region above the module, where combustion reactions and buoyancy-driven plume dynamics require adequate spatial resolution. The mesh resolution within the vent orifice and the flame zone is maintained at approximately 0.3 mm to capture the integral length scales of the turbulent flow field, consistent with the resolution requirements of the LES approach. A grid-independence study was conducted using 0.6 mm and 0.15 mm meshes to verify that the 0.3 mm resolution provides a grid-converged solution. The results, summarized in Table 2, show that reducing the mesh size from 0.3 mm to 0.15 mm changes the predicted propagation intervals by 3.5%, the peak temperatures by 1.3%, and the peak heat fluxes by 4–5%. The maximum change among all key metrics is less than 5%, confirming that the 0.3 mm resolution is sufficient for the key engineering metrics of interest.
Table 2.
Grid-independence study results for three mesh resolutions.
The solid cells and fluid domain were discretized as separate conformal mesh zones with a shared interface at the cell surfaces. This configuration enables the conjugate heat transfer coupling between the solid and gas phases. The detailed boundary conditions and initial conditions assigned to the computational domain are summarized in Table 3.
Table 3.
Boundary conditions for the coupled thermal-gas-combustion model.
3.3. Governing Equations
The coupled modeling framework is built upon the conservation laws governing the solid-phase thermal runaway propagation and the gas-phase turbulent reactive flow, along with the constitutive relations that close the interphase mass and energy exchange. This section presents the complete set of governing equations, organized according to the three physical domains identified in Figure 4.
- Solid-phase heat transfer and thermal runaway kinetics
The temperature field within each prismatic cell was governed by the transient heat conduction equation with an internal heat source representing the exothermic decomposition reactions during thermal runaway:
where ρ, Cp, and ki denote the density, specific heat capacity, and orthotropic thermal conductivities of the cell, respectively. The volumetric heat generation rate qV is parameterized from the self-heating rate measured in an ARC experiment [29]:
Here, ΔH is the total reaction enthalpy per cell, V is the cell volume, and c is a normalized conversion variable ranging from 0 to 1. The quantity represents the temperature rise rate of the cell under adiabatic conditions, obtained from independent single-cell ARC tests. The characteristic temperatures T1 and T2 are the onset temperature of self-heating and the onset temperature of thermal runaway, respectively, both obtained from the same ARC data. Once the local cell temperature reaches T2, the conversion variable c evolves at a constant rate, representing the accelerated reaction stage. The reaction terminates when c reaches unity or when the temperature drops below T1.
- Gas generation and venting
Thermal runaway in a lithium-ion cell is accompanied by the generation of large quantities of gas. The amount of gas generated is directly related to the energy released by the thermal runaway reactions. The total thermal runaway energy of the cell, ΔHbat, is determined from ARC measurements. During the thermal runaway process, the energy released at any given time, Hre, is obtained by integrating the volumetric heat generation rate qV over the cell volume:
where qV is given by Equation (2). The mass of gas generated by the jelly roll, mgen, is then expressed as:
where mbat is the total mass of the cell. This formulation assumes that gas production is proportional to the fraction of thermal runaway energy released, consistent with gas generation being driven by the exothermic reactions that produce heat. This proportionality is justified by the fact that both gas production and heat release originate from the same sequence of exothermic decomposition reactions. As these reactions proceed, they simultaneously release thermal energy and generate gaseous species; the cumulative gas yield therefore scales with the extent of reaction progress, which is represented by the integrated heat release. This treatment follows the widely adopted approach in lumped-parameter thermal runaway models, where gas generation is coupled to reaction kinetics through the conversion variable.
The simplified treatment also assumes a constant gas composition throughout the venting process, consistent with the bulk composition measured in the CVR experiment. This constant-composition assumption is justified by the following considerations. First, previous time-resolved gas sampling studies on large-format lithium-ion batteries have shown that the relative species fractions during the main venting phase, typically a short and intense ejection lasting 2–5 s, do not exhibit dramatic temporal variations [19,27]. Second, the bulk composition measured in the CVR experiment provides a practically adequate representation of the overall fuel stoichiometry, which primarily governs the combustion heat release and flame temperature in the non-premixed combustion model. Third, introducing a time-dependent composition would require transient species-resolved measurements that are not available for this specific cell chemistry, and would substantially increase the computational cost without necessarily improving the prediction of the key engineering metrics. Therefore, while we acknowledge that some compositional evolution may occur between the early and late stages of venting, the constant-composition assumption is considered a pragmatic and justifiable simplification for the present coupled modeling framework.
The gas generation rate is obtained by differentiating Equation (5) with respect to time:
The relative proportions of individual gas species are determined from GC analysis, and their mass fractions are specified as boundary conditions at the vent inlet.
The gas generated inside the battery accumulates in the free volume between the jelly roll and the cell casing. This free volume, located beneath the safety valve, is treated as a control volume. The mass conservation equation for this control volume is:
or in rate form:
where min is the instantaneous mass of gas inside the control volume, and is the mass flow rate of gas exiting through the safety valve.
The pressure inside the battery, P1, is related to the mass of gas in the control volume through the ideal gas law:
where R is the universal gas constant, T1 is the gas temperature inside the cell taken as the local cell temperature in the vicinity of the safety valve, Mmix is the average molar mass of the vent gas mixture, and Vh is the free volume inside the cell casing. The internal pressure evolves dynamically as gas is generated and vented:
When the internal pressure P1 reaches the safety-valve rupture threshold Pthreshold, the valve opens. The pressure at the valve exit, P2, is determined by the isentropic nozzle flow relation:
where Pa is the ambient pressure and γ is the specific heat ratio of the vent gas. The Mach number at the valve exit is:
The velocity and temperature at the valve exit are then:
where ρ2 is the gas density at the valve exit, calculated from P2 and T2 using the ideal gas law. The mass flow rate through the safety valve is:
where Cd is the discharge coefficient and Av is the effective vent area. The values of these parameters are listed in Table 4. The venting process continues until the internal pressure drops below the ambient pressure or the thermal runaway reaction subsides.
Table 4.
Model parameters used in the coupled thermal-gas-combustion framework.
- Gas-phase LES and non-premixed combustion
The gas-phase flow, mixing, and combustion are solved using the Favre-filtered conservation equations for mass, momentum, energy, and species transport within the LES framework. The model assumes that combustion initiates once the flammable gas mixture reaches the auto-ignition temperature within the turbulent mixing field, and therefore does not address the stochastic ignition delay observed in the experiments. The filtered continuity equation reads:
where the source term Sm accounts for the mass added by the venting gas. The filtered momentum equation is:
where ν is the viscosity and τij is the subgrid-scale stress tensor, closed using the Smagorinsky–Lilly model:
with Cs = 0.1 being the Smagorinsky constant and Δ the local filter width.
Turbulent combustion was modeled using a non-premixed formulation, appropriate when the fuel and oxidizer enter the domain as separate streams and mix by diffusion. The mixture fraction f is defined as a conserved scalar:
where Yi is the elemental mass fraction of element i. The transport equation for the Favre-filtered mixture fraction f is solved:
The turbulent diffusivity Di,eff is obtained from the LES subgrid viscosity via a constant turbulent Schmidt number Sct = 0.7. The thermochemical state is parameterized as a function of f using a steady laminar flamelet library generated from detailed chemical kinetics for the measured vent gas composition, incorporating the equilibrium assumption at high scalar dissipation rates. The mean density and temperature are then retrieved from the flamelet table during the CFD calculation.
Radiative heat transfer was included using the discrete ordinates (DO) model, solving the radiative transfer equation for the intensity field:
where α is the absorption coefficient, σs the scattering coefficient, and σ the Stefan-Boltzmann constant. The gas-phase absorption coefficient is computed using the weighted-sum-of-gray-gases model (WSGGM) based on the local concentrations of CO2 and H2O.
- Coupling strategy
The solid and gas phases are two-way coupled through conjugate heat transfer at the cell surfaces. The thermal state of each cell governs the gas generation rate via Equation (5), which in turn determines the internal pressure buildup and the subsequent venting mass flow rate through the safety valve. At each time step, the gas-side heat flux is passed to the solid solver as a boundary condition, while the updated surface temperature is returned to the gas phase. The venting mass flow rate and gas composition, determined from the solid-phase conversion state, are imposed as inlet boundary conditions in the gas domain. The solid and gas phases are solved sequentially within each time step, with the coupling iterations performed until convergence of the interface temperature and heat flux. This iterative scheme provides tight coupling between thermal runaway propagation and gas-phase combustion dynamics.
3.4. Numerical Solution Procedure
The governing equations are solved using the finite-volume method within ANSYS Fluent (2026 R1, ANSYS, Inc., Canonsburg, PA, USA). The solid and fluid domains are discretized with separate conformal meshes and coupled through conjugate heat transfer at the cell surfaces. A pressure-based solver with the pressure-implicit with splitting of operators (PISO) algorithm is used for pressure-velocity coupling. Spatial discretization uses bounded central differencing for momentum and a second-order upwind scheme for scalar transport, with second-order implicit temporal integration and an adaptive time step controlled by the Courant-Friedrichs-Lewy (CFL) condition. The thermal runaway kinetics and gas generation models are implemented via user-defined functions (UDFs) based on the governing equations presented in Section 3.3. At each time step, the UDFs compute the heat generation rate and venting mass flow rate, which are then applied as source terms and inlet boundary conditions, respectively. The conjugate heat transfer coupling between solid and gas phases is solved iteratively until convergence.
4. Results and Discussion
4.1. Venting Gas Characteristics from CVR Experiments
The CVR experiment described in Section 2.2 was performed to quantify the total amount and chemical composition of gas generated by a single manganese-based cell during thermal runaway. These data provide essential inputs to the gas-generation and combustion submodels presented in Section 3.3.
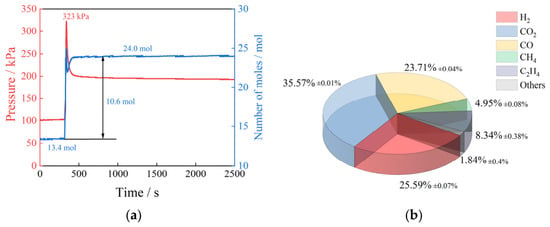
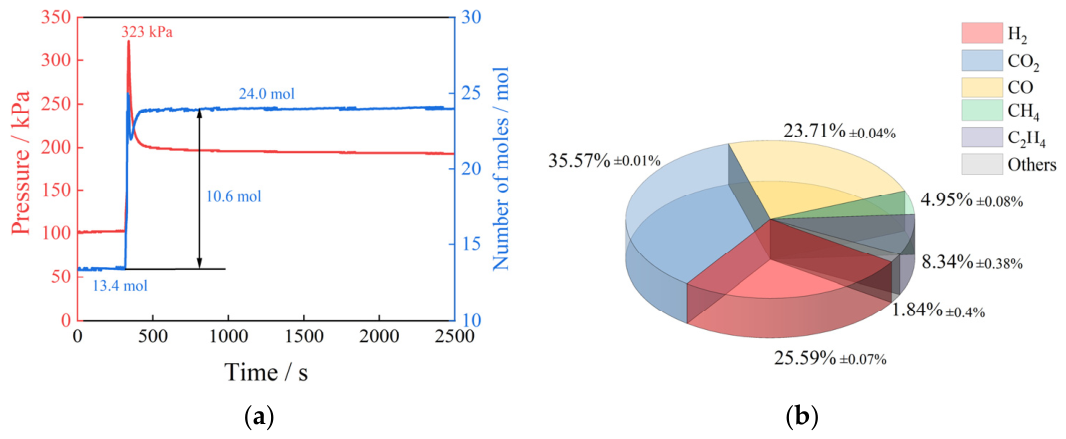
Figure 6a presents the transient pressure and the derived cumulative amount of gas inside the reactor during the thermal runaway event. Prior to the onset of venting, the internal pressure remained constant at the initial value, confirming the airtight integrity of the vessel. At the moment of cell casing rupture, a sharp pressure rise was recorded, reaching a peak gauge pressure of 323 kPa within approximately 2 s. The pressure subsequently decayed gradually as the vessel cooled toward ambient temperature. The cumulative amount of gas generated was calculated from the measured pressure and temperature transients using the ideal gas law as formulated in Section 2.2. The total gas yield per cell was determined to be 10.6 mol.
Figure 6.
Venting gas characterization from the CVR experiment. (a) Transient pressure and cumulative gas moles during thermal runaway. (b) Molar composition of the vent gas mixture analyzed by GC.
Figure 6b shows the molar composition of the vent gas analyzed by GC. The gas mixture is dominated by H2, CO2, CO, and light hydrocarbons. The high combined fraction of combustible species, primarily H2 (25.59%), CO (23.71%), and CH4 (4.85%), indicates a significant flammability hazard. The remaining fraction consists of CO2 (35.57%), C2H4 (8.34%), and trace amounts of C2H6 along with other minor species. The average molar mass of the vent gas mixture, calculated from the measured composition, is 25.93 g·mol−1.
The total gas yield is used to validate the gas generation model in Section 3.3, while the detailed composition provides the fuel stream specification for the non-premixed combustion model.
4.2. Model Validation Against the Thermal Runaway Propagation Experiment
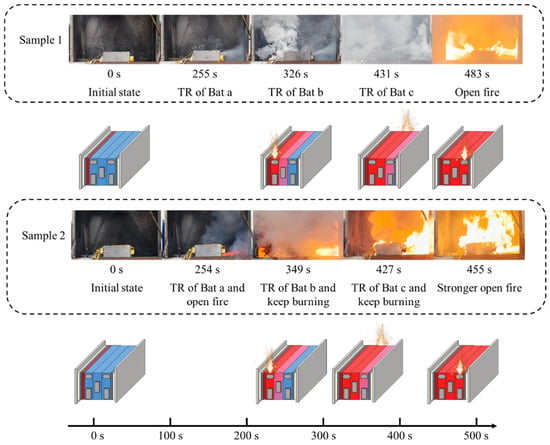
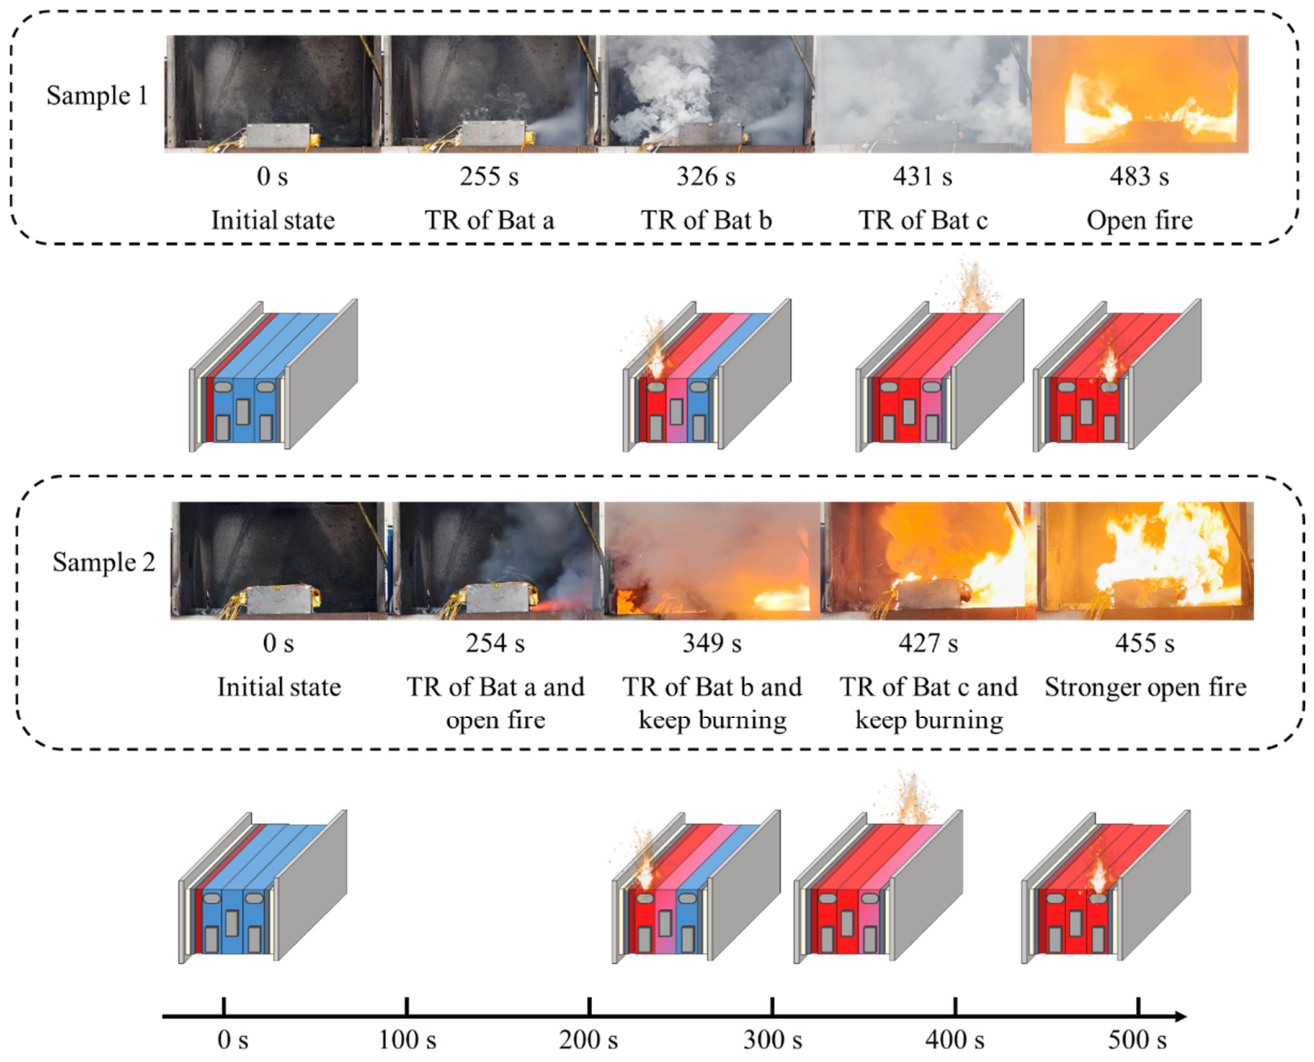
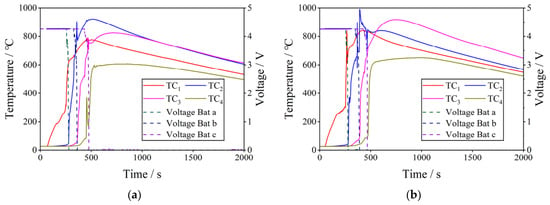
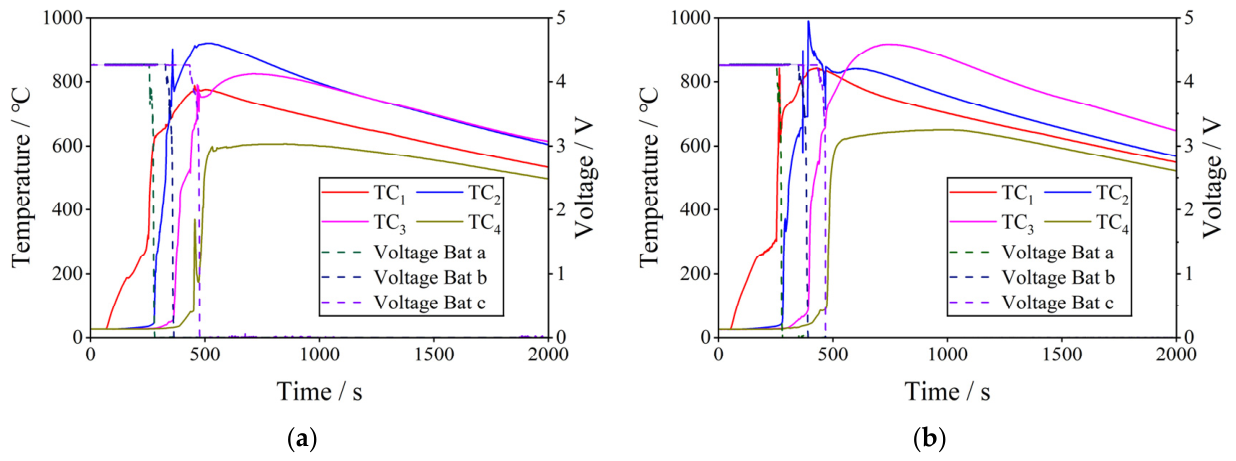
Figure 7 presents the high-speed video sequence capturing the key visual events during the thermal runaway propagation process in the three-cell module. Figure 8 shows the corresponding temperature and voltage evolution of Bat a, Bat b, and Bat c recorded throughout the experiment. Two repeated tests were conducted under identical conditions to assess the reproducibility of the propagation behavior.
Figure 7.
High-speed video sequence of thermal runaway propagation in the three-cell module, showing key visual events including venting, ignition, and flame development for the two repeat tests.
Figure 8.
Experimental temperature and voltage curves during the thermal runaway propagation process. (a) Repeat test 1. (b) Repeat test 2.
In both tests, thermal runaway was initiated in Bat a by lateral heating. The voltage of Bat a exhibited a sudden and irreversible drop at 255 s and 254 s in the two tests, respectively, which served as the primary indicator of thermal runaway onset. Upon detection of this voltage drop, the heater was deactivated immediately. The temperature at measurement point 1 rose rapidly thereafter, confirming the onset of exothermic decomposition. Thermal runaway then propagated spontaneously to the adjacent cells without further external stimulation. Bat b experienced voltage collapse at 326 s and 349 s, yielding propagation times from Bat a of 71 s and 95 s. Bat c subsequently underwent thermal runaway at 431 s and 427 s, corresponding to propagation times from Bat b of 105 s and 78 s. The total propagation sequence from the trigger of Bat a to the thermal runaway of Bat c spanned approximately 176 s and 173 s in the two tests, demonstrating reasonable consistency.
The temperature profiles in Figure 8 reveal the characteristic thermal signature of the propagation process. Each thermal runaway event was accompanied by a sharp temperature spike at the corresponding measurement point, followed by a gradual cooling phase. The peak surface temperatures recorded at measurement points 1 through 4 reached 774 °C, 932 °C, 829 °C, and 595 °C, respectively, in the first test. The highest temperature was consistently observed at point 2, suggesting that thermal accumulation between adjacent cells intensifies the severity of the thermal runaway reactions.
Regarding combustion behavior, the two tests exhibited markedly different ignition characteristics. In the first test, visible flaming was first observed at 483 s, well after all three cells had undergone thermal runaway. In the second test, however, ignition occurred almost immediately upon the thermal runaway of Bat a at 254 s. This variability in vent-gas combustion, with immediate ignition in one test but no flame during the early propagation phase of the other, highlights the stochastic nature of ignition under open-space conditions and the need to capture transient gas dispersion and mixing.
It should be noted that only two repeated propagation experiments were conducted. The primary purpose was to confirm the reproducibility of the thermal propagation sequence and timing rather than to establish statistical significance. In this regard, the two tests showed good consistency, with total propagation times of 176 s and 173 s and inter-cell intervals falling within the range of 71–105 s. The substantial difference in ignition timing, however, reflects the stochastic nature of gas-phase ignition under open-space conditions, which depends sensitively on local flow and mixing conditions that are inherently difficult to control. Importantly, the delayed-ignition case confirms that propagation from Bat a to Bat c can proceed even without active combustion feedback during the early phase; the propagation intervals in this case (95 s and 78 s) still fell within the range of the immediate-ignition case (71 s and 105 s). This suggests that while combustion accelerates propagation through additional gas-phase heating, the solid-phase conduction pathway alone is sufficient to drive the propagation sequence, a point that further supports the robustness of the model’s thermal propagation predictions. Given the limited number of repeated tests, the experimental data are treated as a reference range for validation rather than as a statistically averaged benchmark, and the model is validated against the propagation sequence and timing rather than against the stochastic ignition behavior.
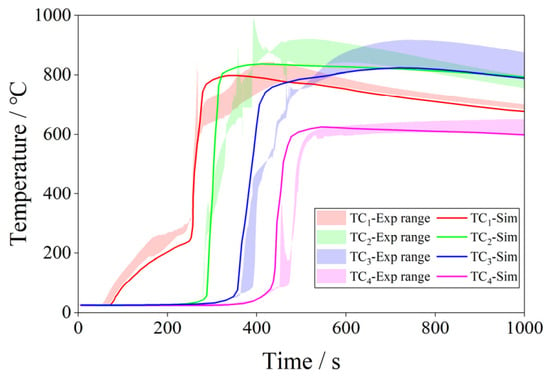
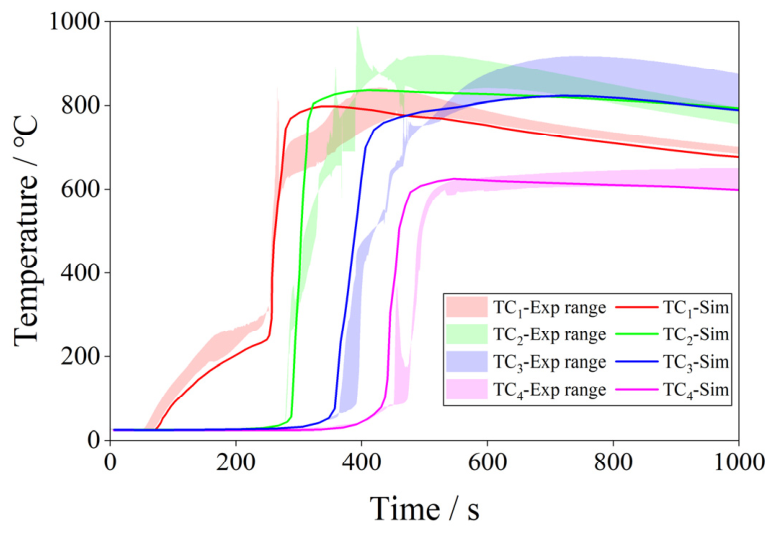
The coupled thermal-gas-combustion model was then applied to simulate the propagation process under conditions replicating the experiment. Figure 9 compares the simulated temperature curves, shown as solid lines, with the experimental measurements at the four surface thermocouple locations. The shaded bands indicate the temperature range obtained from the two repeated tests. The model reproduces the overall thermal response with good agreement, including the pre-heating phase, the abrupt temperature rise upon thermal runaway onset, and the subsequent cooling behavior. The simulated thermal runaway onset times, identified from the temperature inflection points, are 250 s, 336 s, and 413 s for Bat a, Bat b, and Bat c, respectively. These values agree closely with the experimental trigger times, with deviations of less than 5 s for Bat a and within 8% for the propagation intervals. The simulated inter-cell propagation times are 86 s for Bat a to Bat b and 77 s for Bat b to Bat c, falling well within the range of 71 s to 105 s observed in the two repeated experiments.
Figure 9.
Comparison of simulated and experimental temperature evolution at the four measurement points during thermal runaway propagation.
To quantitatively evaluate the predictive fidelity, the RMSE between the simulation and the averaged experimental data was calculated over the entire propagation period from the onset of heating to 600 s. The experimental data were averaged from the two repeated tests at each time point. Prior to calculation, both the simulated and experimental data were resampled onto a common temporal grid with a fixed interval of 1 s. The resulting root mean squared error (RMSE) values at measurement points 1 through 4 are 42.3 °C, 68.7 °C, 31.2 °C, and 28.6 °C, respectively. With only two repeated experiments, these RMSE values are compared against the observed range between the two tests rather than against a statistically quantified uncertainty band. The RMSE values are of the same order of magnitude as the run-to-run variation, indicating that the model error is comparable to the inherent variability between the two experiments and supporting the model’s use for mechanistic analysis. The validation is therefore based on the model’s ability to reproduce the propagation sequence and timing within the range observed experimentally, rather than on statistical comparison with a large dataset.
The simulated peak surface temperatures at measurement points 1 through 4 were 795 °C, 833 °C, 822 °C, and 621 °C, compared with experimental values of 774 °C, 932 °C, 829 °C, and 595 °C. The maximum deviation occurred at point 2, where the simulation underestimated the peak by approximately 99 °C. This discrepancy may be attributed to the simplified representation of inter-cell contact resistance and the assumption of homogeneous cell thermal properties, which may not fully capture the localized thermal accumulation at the interface.
To clarify the specific role of the inter-cell contact thermal resistance, we conducted a parametric sensitivity analysis by varying Rc,cell within ±50% of its nominal value (0.001, 0.002, and 0.003 m2·K·W−1). Increasing Rc,cell from 0.002 to 0.003 extends the Bat a to Bat b propagation interval by approximately 4 s and reduces the peak temperature at point 2 by approximately 11 °C, while decreasing it to 0.001 shortens the interval by approximately 5 s and elevates the peak temperature by approximately 15 °C. This relatively modest temperature variation indicates that the contact resistance primarily governs the propagation timing through its control of the pre-heating rate, whereas the peak interface temperature is dominated by the internal exothermic reactions once thermal runaway is triggered.
For the remaining estimated parameters, the discharge coefficient Cd and the specific heat ratio γ, their values are adopted from Ref. [39] and are therefore not treated as free parameters. Given that these parameters have established literature bases and are expected to have weaker influences on the overall thermal response, only a qualitative assessment is provided here. Variations in these parameters within their typical ranges are not expected to substantially affect the propagation timing or peak surface temperatures.
The 99 °C under-prediction at point 2 is therefore unlikely to be fully explained by uncertainty in the estimated contact resistance alone. Other contributing factors include the following: the homogeneous thermophysical property assumption, which cannot resolve localized hot spots or thermal gradients within the jelly roll; dynamic reduction in the effective contact resistance due to casing deformation and interfacial layer compaction under high-temperature and high-pressure conditions during thermal runaway, a transient effect not captured by our constant-resistance model; and possible spatial offsets between the simulated thermocouple location and the actual placement of the thermocouple in the experiment.
Nonetheless, the model correctly reproduces the trend that the highest temperature occurs at the inter-cell interface, followed by point 3, point 1, and point 4, consistent with the experimental observation. Overall, the coupled model shows adequate predictive performance for the key validation metrics, supporting the mechanistic analysis presented in Section 4.3.
4.3. Discussion of Propagation Mechanisms and Safety Implications
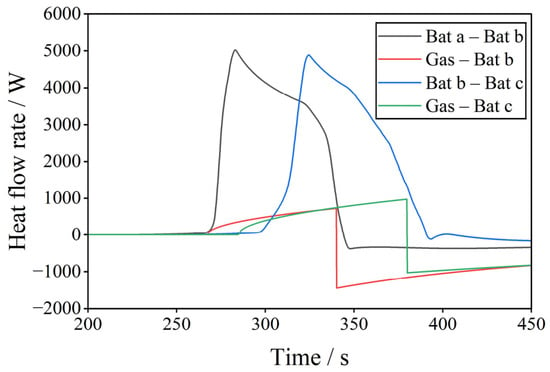
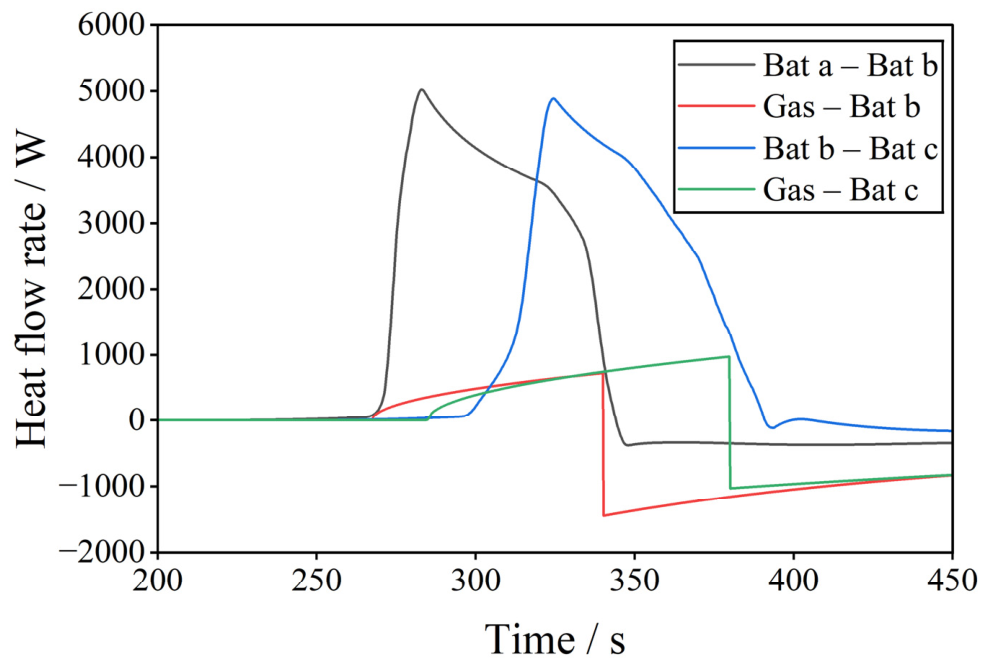
To elucidate the driving mechanisms underlying thermal runaway propagation, Figure 10 presents the transient heat flow curves between adjacent cells and from the gas phase to the cell surfaces, extracted from the validated simulation. Four heat flow components are shown: the solid-phase conductive heat transfer from Bat a to Bat b and from Bat b to Bat c, and the gas-phase convective and radiative heat fluxes incident on Bat b and Bat c. The thermal runaway onset times of each cell, identified from the simulation, are annotated on the figure.
Figure 10.
Transient heat flow curves extracted from the simulation: solid-phase conductive heat flux from Bat a to Bat b and from Bat b to Bat c, and gas-to-solid convective and radiative heat flux incident on Bat b and Bat c.
Prior to the thermal runaway of Bat a, the heat flow from Bat a to Bat b is dominated by the external heating input, which gradually raises the temperature of Bat b through inter-cell conduction. At the onset of thermal runaway in Bat a at 250 s, the solid heat flux from Bat a to Bat b rises sharply to a peak of approximately 5000 W, reflecting the intense exothermic energy released by the failing cell. This conductive pulse drives Bat b rapidly toward its own thermal runaway threshold. Concurrently, the gas-phase heat flux incident on Bat b exhibits a pronounced spike immediately following Bat a venting, as the high-temperature vent gas impinges on the cell surface. The peak gas-phase heat flux reaches approximately 1400 W. This convective and radiative heating supplements the solid conduction pathway, accelerating the temperature rise of Bat b. After Bat b undergoes thermal runaway at 336 s, the solid heat flux from Bat b to Bat c exhibits a similar sharp increase, driving the propagation further downstream. A notable feature in Figure 10 is the relative magnitude of gas-to-solid heat transfer during the venting events. The peak gas-phase heat flux to Bat b is approximately 28% of the peak solid conductive flux. Integration over the critical propagation window from venting of Bat a to thermal runaway of Bat b shows that gas-phase heating contributes approximately 30% of the total thermal energy received by Bat b during this period. This value was calculated by integrating the gas-phase heat flux curve, representing the combined convective and radiative components, and the solid-phase conductive heat flux curve from Bat a to Bat b, both shown in Figure 10, over the critical propagation window from the venting of Bat a to the thermal runaway onset of Bat b. The gas-phase contribution was obtained by dividing the integrated gas-phase energy by the total thermal energy delivered to Bat b via both pathways. The integration yields approximately 30% from gas-phase heating and approximately 70% from solid-phase conduction over this pre-heating period.
The gas-phase heat flux to Bat b reaches a substantial fraction of the peak solid conductive flux, indicating that gas-phase heating is not negligible in the propagation process. This finding supports the central premise of this study that combustion and gas-phase heat transfer actively contribute to, rather than merely accompany, thermal runaway propagation. The intermittent nature of the gas heating spikes, corresponding to the discrete venting and combustion events, further underscores the transient coupling between the solid thermal state and the gas-phase dynamics.
To further isolate and quantify the accelerating effect of combustion on propagation, an additional simulation was performed with combustion heat release deactivated, while keeping all other parameters unchanged. The comparison between the “with combustion” and “without combustion” cases is summarized in Table 5. The absence of combustion extends the Bat a to Bat b propagation interval by approximately 9 s and the Bat b to Bat c interval by approximately 6 s. The peak temperature at point 2 decreases by approximately 18 °C. These quantitative differences confirm that combustion actively accelerates propagation through additional gas-phase convective and radiative heating, consistent with the heat-flow analysis presented above.
Table 5.
Comparison of key propagation metrics with and without combustion.
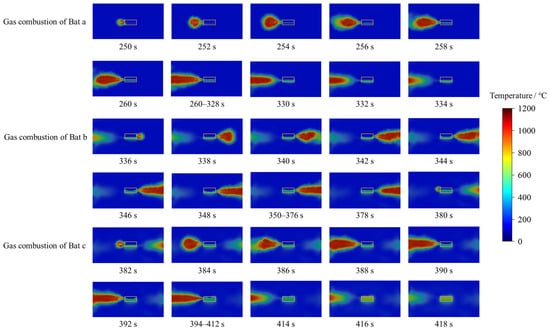
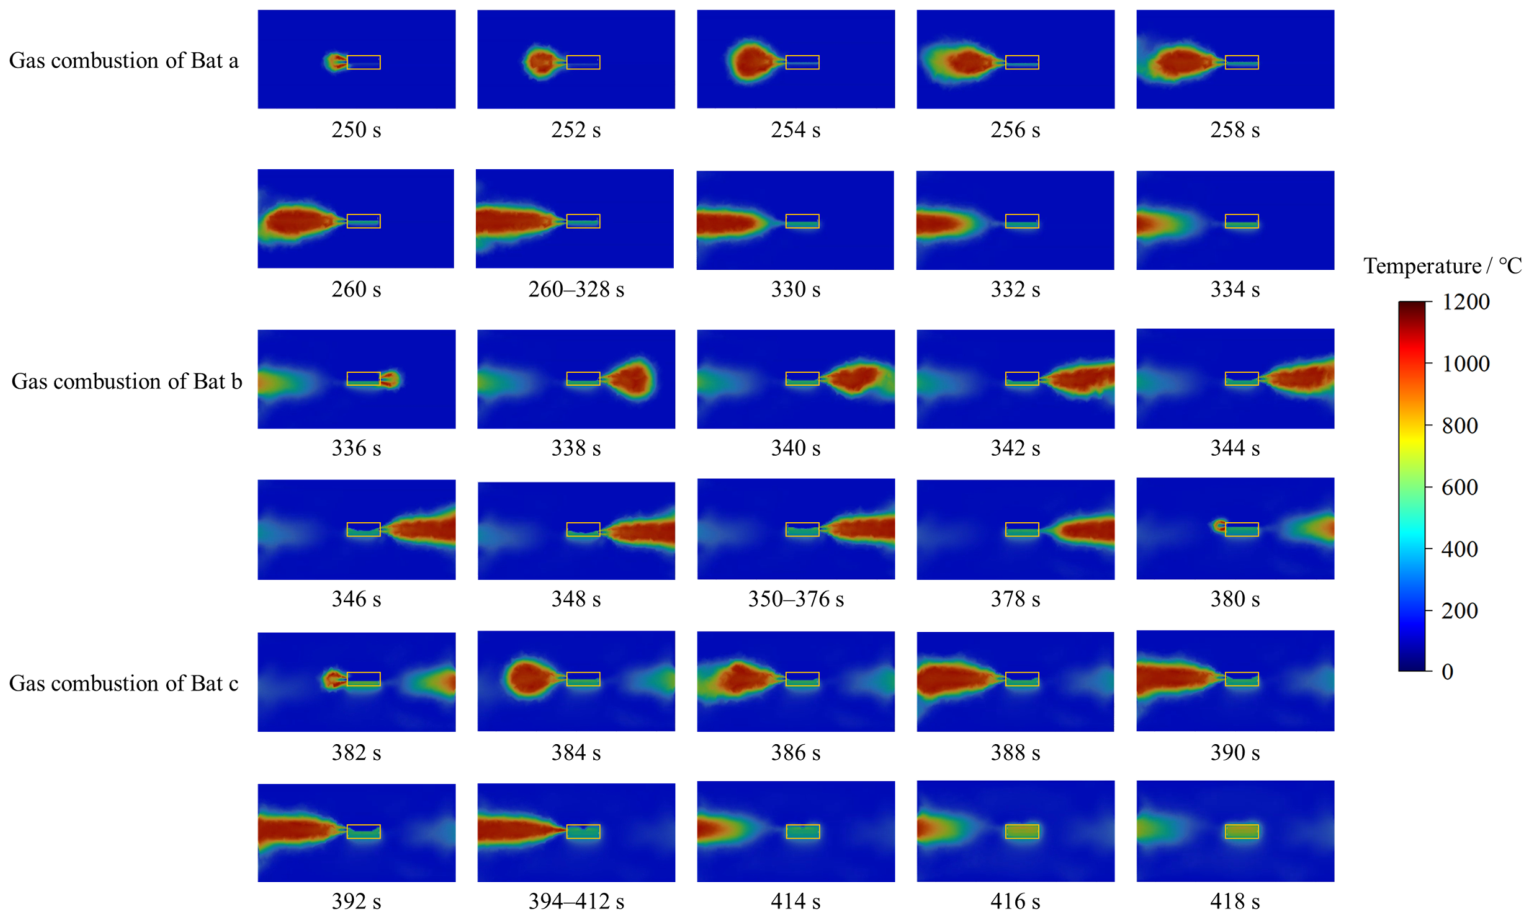
Figure 11 shows the simulated temperature contours of vent-gas combustion for each cell at selected representative instants, with the physical locations of the battery cells indicated by orange rectangular outlines. The images reveal the spatial structure and temporal evolution of the combustion plume above the module as viewed from the side opposite to the heating plate, looking toward the module from the outer face of Bat c. For Bat a, the vent gas jet ignites shortly after ejection, forming a buoyancy-driven diffusion flame that extends upward and laterally from the vent opening. The flame temperature exceeds 1000 °C in the reaction zone. For Bat b and Bat c, the combustion plumes exhibit similar morphology but are influenced by the pre-existing hot gas environment and the altered flow field induced by the preceding venting events. The lateral extent of the high-temperature flame region reaches approximately 0.35 m from the module sidewall.
Figure 11.
Simulated temperature contours of venting gas combustion at selected instants for Bat a, Bat b, and Bat c, showing the spatial structure and evolution of the buoyancy-driven diffusion flames, with the batteries outlined by orange boxes.
It should be noted that the simulation assumes a well-defined vent opening with a single directed gas jet, whereas in the actual experiments shown in Figure 7, the cell casing frequently ruptures at multiple locations under high-temperature conditions, resulting in undirected and spatially distributed gas release. Consequently, the instantaneous flame shapes observed in the video frames exhibit substantial variability and are not directly comparable on a frame-by-frame basis to the idealized simulation contours, particularly for Bat a and Bat c where multiple casing ruptures were visually identified. Nevertheless, the macroscopic spatial scale of the thermal impact, specifically the height and lateral extent of the heated region, remains a meaningful metric for engineering assessment. Using the known cell dimension of 300 mm as a reference, the experimental visible flame heights measured across the two repeated tests range from 0.32 m to 0.40 m, while the simulation predicts a comparable 1000 °C iso-surface height of 0.35 m. This consistency in the overall thermal footprint, despite the morphological differences in detailed flame structure, supports the model’s utility for evaluating the gas-phase heat flux feedback to adjacent cells, which is the primary objective of this study.
Several limitations of the present study should be acknowledged. The experiments and simulations were conducted under open-space conditions, whereas commercial energy storage systems typically employ enclosed or semi-enclosed module housings, in which gas accumulation and oxygen depletion may alter combustion behavior and heat transfer pathways. The three-cell module also represents a simplified configuration. In larger modules, propagation dynamics may be influenced by multidirectional paths and cumulative pre-heating effects. Additionally, the gas composition used in the model is treated as constant throughout the venting process, based on the bulk average composition measured from the CVR experiment. The GC measurement provides the overall stoichiometry of the fuel mixture, which primarily governs the combustion heat release in the non-premixed combustion model. This treatment is consistent with the short duration of the main venting event, during which the relative species fractions do not exhibit substantial temporal variation according to time-resolved gas sampling reported for comparable lithium-ion batteries. To the extent that transient compositional shifts occur, their effect on the time-integrated heat flux to adjacent cells is expected to be modest, as the overall fuel stoichiometry, rather than the transient species evolution, primarily governs the total combustion heat release. Moreover, the model does not predict the stochastic ignition delay observed in the repeated experiments, in which ignition occurred immediately in one test but was delayed until 483 s in the other. The non-premixed combustion model assumes an established flame once the flammable mixture reaches the auto-ignition temperature within the turbulent mixing field and does not resolve detailed ignition chemistry or hot-particle effects. The model is therefore applicable to quantifying the acceleration of propagation once combustion has begun, rather than to deterministically predicting ignition probability. Within these limitations, the validated model provides a mechanistic basis for safety design and highlights the need for vent gas management, such as directed venting channels and flame-arresting measures, to mitigate the accelerating effect of gas-phase heat transfer on propagation.
5. Conclusions
This study investigated thermal runaway propagation and combustion behavior in a manganese-based prismatic battery module through a combination of CVR experiments, propagation tests, and a coupled thermal-gas-combustion modeling framework. The vent gas produced during thermal runaway is rich in combustible species, primarily H2, CO, and CH4, indicating a substantial flammability hazard during cell failure. Propagation experiments on the three-cell module show that thermal runaway proceeds sequentially, with inter-cell propagation times ranging from 71 s to 105 s across repeated tests. Vent-gas combustion was intermittent: ignition was immediate in one test but delayed in the other, reflecting the stochastic nature of ignition under open-space conditions.
The coupled model, parameterized using independently measured gas yield and composition data, reproduces the experimental temperature evolution and propagation timing. The simulated inter-cell propagation times fall within the experimental range, and the predicted peak surface temperatures are consistent with measurements. Within the framework assumptions, including a constant vent-gas composition and an auto-ignition-based combustion initiation, the model is primarily suited for quantifying the acceleration of propagation once combustion has commenced, rather than for deterministically predicting ignition probability. Quantitative heat flow analysis reveals that gas-phase convective and radiative heating contributes a substantial fraction of the total heat flux incident on adjacent cells during venting events. This is further confirmed by a direct comparison between simulations with and without combustion, in which the presence of combustion reduces the Bat a to Bat b and Bat b to Bat c propagation intervals by 10.5% and 7.8%, respectively, and elevates the peak interface temperature by approximately 18 °C. These results confirm that combustion actively accelerates propagation rather than being a passive byproduct.
The validated modeling framework provides a tool for assessing propagation hazards and highlights the importance of integrating vent gas management strategies, such as directed venting channels and flame-mitigation measures, into the safety design of battery energy storage systems.
Author Contributions
Conceptualization, C.W.; methodology, J.H., C.Z. and U.G.; validation, C.W.; resources, J.W. and Z.W.; data curation, C.W.; writing—original draft preparation, C.W.; writing—review and editing, C.X.; supervision, X.F.; project administration, C.X. All authors have read and agreed to the published version of the manuscript.
Funding
The research was funded by the National Key R&D Program-Strategic Scientific and Technological Innovation Cooperation, grant number 2022YFB2404400.
Data Availability Statement
The data that support the findings of this study are available from the corresponding author upon reasonable request.
Conflicts of Interest
Authors Jian Wang and Zhengwei Wang were employed by the company Phylion Battery Co., Ltd. The remaining authors declare that the research was conducted in the absence of any commercial or financial relationships that could be construed as a potential conflict of interest.
Abbreviations
The following abbreviations are used in this manuscript:
| ARC | Accelerating rate calorimetry |
| DSC | Differential scanning calorimetry |
| CVR | Constant-volume reactor |
| CFD | Computational fluid dynamics |
| EC | Ethylene carbonate |
| EMC | Ethyl methyl carbonate |
| SOC | State of charge |
| CC-CV | Constant-current/Constant-voltage |
| GC | Gas chromatography |
| LES | Large eddy simulation |
| DO | Discrete ordinates |
| WSGGM | Weighted-sum-of-gray-gases model |
| PISO | Pressure-implicit with splitting of operators |
| CFL | Courant–Friedrichs–Lewy |
| UDFs | User-defined functions |
| RMSE | Root mean squared error |
References
- Liu, Y.; Tian, Y.; Fu, Z.; Du, H.; Li, B.; Kang, F.; Amine, K.; Chen, G. Thermite Reaction-Induced Thermal Runaway of Lithium-Ion Batteries. Adv. Mater. 2025, 37, e10486. [Google Scholar] [CrossRef] [Scilit] [PubMed]
- Lin, C.; Kong, W.; Tian, Y.; Wang, W.; Zhao, M. Heating Lithium-Ion Batteries at Low Temperatures for Onboard Applications: Recent Progress, Challenges and Prospects. Automot. Innov. 2022, 5, 3–7. [Google Scholar] [CrossRef] [Scilit]
- Li, H.; Zhang, W.; Sun, K.; Guo, J.; Yuan, K.; Fu, J.; Sun, H. Manganese-Based Materials for Rechargeable Batteries beyond Lithium-Ion. Adv. Energy Mater. 2021, 11, 2100867. [Google Scholar] [CrossRef] [Scilit]
- Dubaniewicz, T.H.; Barone, T.L.; Brown, C.B.; Thomas, R.A. Comparison of Thermal Runaway Pressures within Sealed Enclosures for Nickel Manganese Cobalt and Iron Phosphate Cathode Lithium-Ion Cells. J. Loss Prev. Process Ind. 2022, 76, 104739. [Google Scholar] [CrossRef] [Scilit]
- Rajagopalan, K.; Ramasubramanian, B.; Velusamy, S.; Ramakrishna, S.; Kannan, A.M.; Kaliyannan, M.; Kulandaivel, S. Examining the Economic and Energy Aspects of Manganese Oxide in Li-Ion Batteries. Mater. Circ. Econ. 2022, 4, 22. [Google Scholar] [CrossRef] [Scilit]
- Wei, G.; Huang, R.; Zhang, G.; Jiang, B.; Zhu, J.; Guo, Y.; Han, G.; Wei, X.; Dai, H. A comprehensive insight into the thermal runaway issues in the view of lithium-ion battery intrinsic safety performance and venting gas explosion hazards. Appl. Energy 2023, 349, 121651. [Google Scholar] [CrossRef] [Scilit]
- Amano, K.O.A.; Hahn, S.K.; Butt, N.; Vorwerk, P.; Gimadieva, E.; Tschirschwitz, R.; Rappsilber, T.; Krause, U. Composition and explosibility of gas emissions from lithium-ion batteries undergoing thermal runaway. Batteries 2023, 9, 300. [Google Scholar] [CrossRef] [Scilit]
- Lyu, P.; Liu, X.; Liu, C.; Rao, Z. The Influence of Tab Overheating on Thermal Runaway Propagation of Pouch-Type Lithium-Ion Battery Module with Different Tab Connections. Int. J. Heat Mass Transf. 2023, 211, 124279. [Google Scholar] [CrossRef] [Scilit]
- Shahid, S.; Agelin-Chaab, M. A Review of Thermal Runaway Prevention and Mitigation Strategies for Lithium-Ion Batteries. Energy Convers. Manag. X 2022, 16, 100310. [Google Scholar] [CrossRef] [Scilit]
- Liu, P.; Liu, C.; Yang, K.; Zhang, M.; Gao, F.; Mao, B.; Li, H.; Duan, Q.; Wang, Q. Thermal runaway and fire behaviors of lithium iron phosphate battery induced by over heating. J. Energy Storage 2020, 31, 101714. [Google Scholar] [CrossRef] [Scilit]
- Li, H.; Zhou, D.; Zhang, M.; Liu, B.; Zhang, C. Multi-field interpretation of internal short circuit and thermal runaway behavior for lithium-ion batteries under mechanical abuse. Energy 2023, 263, 126027. [Google Scholar] [CrossRef] [Scilit]
- Wang, Y.; Zhang, W.; Yang, M.; Zhuo, P. Study on the Ignition Characteristics and Mechanisms of Battery Thermal Runaway Gases under Hot Surface and Electric Spark Conditions. Process Saf. Environ. Prot. 2026, 214, 109128. [Google Scholar] [CrossRef] [Scilit]
- Hu, J.; Wei, Z.; He, H. An Online Adaptive Internal Short Circuit Detection Method of Lithium-Ion Battery. Automot. Innov. 2021, 4, 93–102. [Google Scholar] [CrossRef] [Scilit]
- Wen, J.; Zhu, Y.; Wang, S. Detection of the Chain Reaction Pathway and Early Warning Method of Thermal Runaway by Battery Management System for Lithium Nickel Manganese Cobalt Oxide Batteries. J. Electrochem. Soc. 2026, 173, 040509. [Google Scholar] [CrossRef] [Scilit]
- Ge, H.; Chen, K.; Wang, C.; Zhang, M.; Li, W.; Sun, Z.; Li, S. Advanced Design Strategies for Enhancing the Thermal Stability of Lithium-Rich Manganese-Based Cathodes towards High-Energy Lithium-Ion Batteries. J. Alloys Compd. 2025, 1042, 184087. [Google Scholar] [CrossRef] [Scilit]
- Zou, K.; Xu, J.; Zhao, M.; Lu, S. Effects and Mechanism of Thermal Insulation Materials on Thermal Runaway Propagation in Large-Format Pouch Lithium-Ion Batteries. Process Saf. Environ. Prot. 2024, 185, 1352–1361. [Google Scholar] [CrossRef] [Scilit]
- Sun, H.; Li, G.; Yuan, C. Experimental and Kinetic Study of Thermal Runaway Gas Explosion Characteristics under Different Safety Vent Bursting Pressures of 18650 Battery. Chem. Eng. J. 2025, 525, 170166. [Google Scholar] [CrossRef] [Scilit]
- Peng, G.; Ling, X.; Lin, Y.; Jiang, H.; Ma, M.; Yu, A.; Ouyang, D. Thermal Runaway Features of Large-Format Power Lithium-Ion Cells under Various Thermal Abuse Patterns and Capacities. RSC Adv. 2023, 13, 31036–31046. [Google Scholar] [CrossRef] [Scilit] [PubMed]
- Luo, W.; Zhang, J.; Xiong, C.; Yuan, H. Numerical Study of Phase Change Materials Mitigation Strategies against Thermal Runaway in Large-Format Lithium-Ion Battery Assemblies. Process Saf. Environ. Prot. 2026, 211, 108757. [Google Scholar] [CrossRef] [Scilit]
- Kim, J.T.; Choi, J.Y.; Kang, S.; Han, N.G.; Kim, D.K. Development of thermal runaway propagation model considering vent gas combustion for electric vehicles. J. Energy Storage 2023, 60, 106535. [Google Scholar] [CrossRef] [Scilit]
- Ayayda, M.; Benger, R.; Reichrath, T.; Kasturia, K.; Klink, J.; Hauer, I. Modeling thermal runaway mechanisms and pressure dynamics in prismatic lithium-ion batteries. Batteries 2024, 10, 435. [Google Scholar] [CrossRef] [Scilit]
- Kong, D.; Wang, G.; Ping, P.; Wen, J. Numerical investigation of thermal runaway behavior of lithium-ion batteries with different battery materials and heating conditions. Appl. Therm. Eng. 2021, 189, 116661. [Google Scholar] [CrossRef] [Scilit]
- Zhou, G.; Yang, S.; Liu, Y.; Zhang, Q.; Li, Y.; Lu, H.; Wei, Z.; Huang, Q.; Zhou, W. Thermal runaway response and flame eruption dynamics of lithium-ion batteries under continuous/intermittent heating mode of dual heat sources. Appl. Therm. Eng. 2024, 249, 123363. [Google Scholar] [CrossRef] [Scilit]
- Jia, Z.; Wang, S.; Qin, P.; Li, C.; Song, L.; Cheng, Z.; Wang, Q. Comparative Investigation of the Thermal Runaway and Gas Venting Behaviors of Large-Format LiFePO4 Batteries Caused by Overcharging and Overheating. J. Energy Storage 2023, 61, 106791. [Google Scholar] [CrossRef] [Scilit]
- Liu, Z.; Guo, X.; Meng, N.; Yu, Z.; Yang, H. Study of Thermal Runaway and the Combustion Behavior of Lithium-Ion Batteries Overcharged with High Current Rates. Thermochim. Acta 2022, 715, 179276. [Google Scholar] [CrossRef] [Scilit]
- Liu, X.; Li, Z.; Lin, Z. Lithium-Ion Battery Thermal Runaway Propagation Simulation Using Joint Model of Lumped-Parameter Method for Shell and 3D Modeling for Jelly Roll. Energies 2026, 19, 2912. [Google Scholar] [CrossRef] [Scilit]
- Mishra, D.; Tummala, R.; Jain, A. Investigation of Propagation of Thermal Runaway during Large-Scale Storage and Transportation of Li-Ion Batteries. J. Energy Storage 2023, 72, 108315. [Google Scholar] [CrossRef] [Scilit]
- Kim, J.; Mallarapu, A.; Finegan, D.P.; Santhanagopalan, S. Modeling Cell Venting and Gas-Phase Reactions in 18650 Lithium-Ion Batteries during Thermal Runaway. J. Power Sources 2021, 489, 229496. [Google Scholar] [CrossRef] [Scilit]
- Wang, P.; Xu, C.; Huang, J.; Zhang, M.; Jiang, F.; Feng, X. Experimental and Simulation Study on Internal Thermal Runaway Development Drives Venting and Flammable Gas Risk Evaluate of Lithium-Ion Battery. Appl. Energy 2025, 385, 125545. [Google Scholar] [CrossRef] [Scilit]
- Pal, S.; Kashyap, P.; Panda, B.; Gao, L.; Garg, A. A Comprehensive Review of Thermal Runaway for Batteries: Experimental; Modelling, Challenges and Proposed Framework. Int. J. Green Energy 2025, 22, 2399–2422. [Google Scholar] [CrossRef] [Scilit]
- Ge, F.; Liu, J.; Cong, B. Measurement and Characterization of Internal Pressure and Jet Velocity in Lithium-Ion Battery Thermal Runaway: A Review and Outlook. J. Energy Storage 2026, 155, 121492. [Google Scholar] [CrossRef] [Scilit]
- Gan, Y.; Huang, J.; Gao, W.; Wang, H. Experimental Investigation on Thermal Runaway Propagation and Gas Venting in Large-Format Battery Packs: From Cell to Module. J. Energy Storage 2026, 161, 121952. [Google Scholar] [CrossRef] [Scilit]
- E, J.; Xiao, H.; Tian, S.; Huang, Y. A Comprehensive Review on Thermal Runaway Model of a Lithium-Ion Battery: Mechanism, Thermal, Mechanical, Propagation, Gas Venting and Combustion. Renew. Energy 2024, 229, 120762. [Google Scholar] [CrossRef] [Scilit]
- Mishra, D.; Zhao, P.; Jain, A. Thermal Runaway Propagation in Li-Ion Battery Packs due to Combustion of Vent Gases. J. Electrochem. Soc. 2022, 169, 100520. [Google Scholar] [CrossRef] [Scilit]
- Mathieu, O.; Grégoire, C.M.; Turner, M.A.; Mohr, D.J.; Alturaifi, S.A.; Thomas, J.C.; Petersen, E.L. Experimental Investigation of the Combustion Properties of an Average Thermal Runaway Gas Mixture from Li-Ion Batteries. Energy Fuels 2022, 36, 3247–3258. [Google Scholar] [CrossRef]
- Kovács, G.; Kocsis Szürke, S.; Fischer, S. Investigation of Convective and Radiative Heat Transfer of 21700 Lithium-Ion Battery Cells. Batteries 2025, 11, 246. [Google Scholar] [CrossRef] [Scilit]
- Tang, Y.; Li, T.; Cheng, X. Review of Specific Heat Capacity Determination of Lithium-Ion Battery. Energy Procedia 2019, 158, 4967–4973. [Google Scholar] [CrossRef] [Scilit]
- Wei, L.; Lu, Z.; Cao, F.; Zhang, L.; Yang, X.; Yu, X.; Jin, L. A Comprehensive Study on Thermal Conductivity of the Lithium-Ion Battery. Int. J. Energy Res. 2020, 44, 9466–9478. [Google Scholar] [CrossRef] [Scilit]
- Kong, D.; Wang, G.; Ping, P.; Wen, J. A Coupled Conjugate Heat Transfer and CFD Model for the Thermal Runaway Evolution and Jet Fire of 18650 Lithium-Ion Battery under Thermal Abuse. eTransportation 2022, 12, 100157. [Google Scholar] [CrossRef] [Scilit]

Disclaimer/Publisher’s Note: The statements, opinions and data contained in all publications are solely those of the individual author(s) and contributor(s) and not of MDPI and/or the editor(s). MDPI and/or the editor(s) disclaim responsibility for any injury to people or property resulting from any ideas, methods, instructions or products referred to in the content. |
© 2026 by the authors. Licensee MDPI, Basel, Switzerland. This article is an open access article distributed under the terms and conditions of the Creative Commons Attribution (CC BY) license.