


Abstract
This paper proposes an SOH estimation method that fuses mechanical–electrical–thermal multi-modal features by introducing expansion force monitoring. Aging tests on 16 prismatic 530 Ah LiFePO4 batteries from two brands are conducted at 25 and 45 °C. Each full cycle is divided into charge, post-charge rest, discharge, and post-discharge rest, with SOH defined by the capacity ratio. From cycle-level data, 37 candidate features are extracted and cleaned using local median and median absolute deviation. Using only training cells, Spearman correlation eliminates highly redundant features, and 12 key features are retained via internal validation. Under 4-fold cross-validation with complete battery grouping, Random Forest, XGBoost, LightGBM, and LSTM are compared. LightGBM achieves the best performance with an average MAE of 0.0032, RMSE of 0.0037, and R2 of 91.36%. Ablation shows multi-modal fusion outperforms single-type features; five-category fused features reduce RMSE by ~75.57% versus electrical-only features. Removing expansion force features increases RMSE to 0.0064 and drops R2 to 75.66%. These findings confirm that expansion force supplies critical mechanical degradation information, significantly improving SOH estimation for large-capacity energy storage batteries.
1. Introduction
With the accelerating global energy transition and the large-scale integration of renewable energy sources, the role of energy storage systems in power peak shaving, frequency regulation, and user-side energy management has become increasingly prominent. Lithium-ion batteries, by virtue of their high energy density, long cycle life, and rapid response capability, have become the core carrier in the field of electrochemical energy storage. However, batteries inevitably age during long-term cycling, manifesting as usable capacity fade and internal resistance increase, and in severe cases even leading to safety incidents such as thermal runaway [1,2]. Therefore, achieving accurate monitoring of the SOH of large-capacity energy storage batteries is a key prerequisite for ensuring the safe, efficient, and economical operation of energy storage systems [3]. Nevertheless, the battery aging process is jointly influenced by electrochemical reactions, thermal states, and structural mechanical responses, exhibiting pronounced nonlinearity and multi-factor coupling characteristics. In practical energy storage systems, sensor configurations and operational data are often constrained by engineering conditions. How to extract stable health features from collectible signals such as voltage, current, temperature, and expansion force is a critical issue in SOH estimation [4].
The mainstream approach in existing research is electrical signal monitoring, which extracts health features related to capacity degradation from voltage and current and employs machine learning models to establish the mapping relationship between features and SOH. At the feature extraction level, existing studies mainly focus on relaxation voltage, incremental capacity analysis, and multi-scale signal decomposition. Short-term relaxation voltage can reflect the polarization recovery and open-circuit voltage restoration process during the rest phase, providing effective information for capacity or SOH estimation without relying on complete charge–discharge tests [5]. Incremental capacity analysis, by differentiating the constant-current charging voltage curve, maps the internal electrode reaction processes of the battery into the voltage domain, thereby extracting health factors related to active material loss and lithium inventory loss [6]. Meanwhile, time-series features such as voltage sample entropy can characterize the complex fluctuation characteristics of the voltage profile as aging progresses, offering supplementary information for SOH estimation under fast charging or partial cycle conditions [7]. At the model construction level, to address issues such as varying temperature conditions, degradation path differences, and insufficient feature quality, researchers have further improved SOH prediction frameworks from the perspectives of cross-condition generalization, online co-estimation, and combinatorial optimization, thereby enhancing the model’s adaptability under different temperatures, degradation paths, and data conditions [8,9]. Recent work has further demonstrated the use of reconstructed current and voltage curves with deep learning for SOH estimation [10]. Differential-voltage analysis has also been applied as a non-invasive diagnostic tool to relate voltage-response changes to degradation during pulsed-current charging [11].
Unlike purely data-driven methods, approaches based on electrochemical mechanisms and physical models estimate capacity through equivalent circuit model parameter identification, state observers, or electrochemical constraints, offering strong physical interpretability [12]. In recent years, the emergence of PINNs has further promoted the fusion of mechanism models and data-driven approaches by embedding electrochemical governing equations, aging laws, and physical constraints into the neural network loss function, thereby reducing the model’s dependence on large amounts of labeled data [13]. Building on this, researchers have further applied physics-informed learning to SOH estimation under different temperatures, operating conditions, and chemical systems, improving model adaptability [14,15]. Additionally, some studies have constructed SOH estimation models using partial charging segments, reducing the reliance on complete charge–discharge tests [16,17]. However, the performance of physical model-based methods remains highly dependent on the accuracy of the model structure, the precision of parameter identification, and adaptability to changing operating conditions. When the battery system, capacity specification, or test boundary conditions change, the experimental cost required for model reconstruction and parameter recalibration is still relatively high.
For large-capacity prismatic energy storage batteries, the terminal voltage is a comprehensive external manifestation of multi-layer electrode reactions and polarization processes, and its response to internal structural changes, stress accumulation, and early hidden degradation may be subject to averaging and hysteresis, making early accurate perception difficult. Existing studies have shown that lithium-ion batteries generate measurable expansion force, stress, or strain responses during charge–discharge and aging processes, and such mechanical responses are closely related to capacity fade, SOH variation, and safety status [18,19]. From a mechanistic perspective, the expansion response is intimately linked to the lithium intercalation/de-intercalation process, material volume changes, and structural constraints [20]. As a physical quantity of mechanical response that can be measured online, expansion force can complement traditional electrical signals [21]. Along this direction, researchers have explored the fusion of stress, strain, or expansion signals with electrical signals for battery state estimation, demonstrating potential in tasks such as joint SOC and SOH estimation, dynamic condition tracking, and early thermal runaway identification [22,23]. However, existing studies incorporating mechanical signals have mostly focused on pouch cells, cylindrical batteries, or small-capacity cells, whose mechanical boundary conditions and expansion behaviors differ from those of large-capacity prismatic batteries. For large-capacity prismatic energy storage batteries, the mechanical restraint structure, clamping force design, and cell size effect make the expansion force evolution mechanism more complex. Existing studies have explored aspects such as the thermal behavior of large-capacity prismatic batteries, aging of prismatic LFP batteries, and electro-thermal-mechanical coupled aging models [24,25,26,27]. Nevertheless, the staged evolution, incomplete recovery behavior, and quantitative relationship between expansion force and capacity fade during the long-term cycling of large-capacity energy storage batteries still warrant further investigation.
In recent years, multi-physics feature fusion has gradually become an important development direction in battery state estimation. At the feature level, researchers are no longer limited to a single type of electrical signal but instead use features derived from DV and IC curves to characterize electrode reactions and capacity degradation processes [28,29]. At the level of multi-dimensional feature construction and selection, the stability and predictive performance of feature subsets can be improved by comprehensively evaluating the importance, redundancy, and complementarity of features [30,31,32]. Meanwhile, relaxation voltage and short rest segments have also been used to extract health information related to equilibrium potential recovery and polarization decay, offering the possibility for SOH estimation that does not depend on complete charge–discharge processes [33,34]. In terms of modeling data sources, partial charging segments and polarization equilibrium information have been utilized for deep learning-based SOH estimation to reduce the requirement for complete cycle data [35,36]. Regarding engineering condition adaptability, real-world condition degradation models and interpretable deep learning methods provide new ideas for SOH estimation under complex operating conditions [37,38]. Furthermore, multi-feature fusion, interactive learning of multiple aging factors, and voltage-temperature statistical features have been employed to improve the model’s ability to characterize degradation differences [39,40,41]. The fusion of CNN and IC curves can further exploit the degradation information contained in curve morphology [42], while standardized comparisons of machine learning models and SOC/SOH review studies provide references for the selection and evaluation of different models [43,44]. Moreover, the development of AI and digital twin technologies provides system-level insights for battery state estimation, life-cycle optimization, and cloud-edge collaborative management [45]. Data-driven capacity estimation has also been adapted to variable-length charge-voltage segments, further reducing reliance on complete charging records [46]. However, from an engineering application perspective, the model structure itself is not the only key factor; more importantly, it is whether stable, interpretable, and generalizable health features can be extracted from collectible data and validated through a reasonable data partitioning approach.
To address the aforementioned issues, this paper takes a total of 16 prismatic 530 Ah LiFePO4 energy storage batteries from two brands as the test objects, conducts cyclic aging tests at 25 °C and 45 °C, and constructs a mechanical–electrical–thermal multi-modal feature SOH estimation method. The main contributions of this paper include:
- (1)
- Analyzing the staged variation and irreversible accumulation characteristics of expansion force during the cycling of large-capacity batteries and discussing their relationship with capacity fade.
- (2)
- Extracting 37 candidate features from five categories—electrical, thermal, expansion force, dV/dQ, and dF/dQ—from cycle-level data, and identifying 12 key features through outlier cleaning, correlation analysis, redundancy elimination, and internal validation on the training set.
- (3)
- Employing four-fold cross-validation with complete battery grouping to compare Random Forest, XGBoost, LightGBM, and LSTM models, and conducting feature ablation experiments using LightGBM as the base model to quantitatively evaluate the contribution of different feature types to SOH estimation.
The remainder of this paper is organized as follows: Section 2 introduces the basic parameters of the energy storage batteries, the expansion force testing platform, and the cycling test procedure. Section 3 analyzes the evolution characteristics of the expansion force. Section 4 extracts the mechanical–electrical–thermal multi-field coupled features. Section 5 constructs a multi-feature SOH prediction algorithm, presents the prediction results, and conducts discussions. Section 6 concludes the paper and outlines future work.
2. Experimental Design
2.1. Basic Parameters of the Energy Storage Batteries
This study selected two commercial prismatic LiFePO4 energy storage batteries from different brands as experimental objects; their detailed performance parameters are listed in Table 1. To mitigate the influence of cell-to-cell inconsistency, eight cells of each brand were selected for parallel testing, labeled A1–A8 and B1–B8, respectively.
Table 1.
Basic specifications of the battery.
2.2. Expansion Force Testing Platform
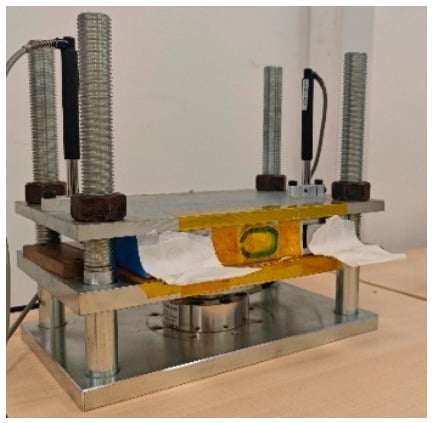
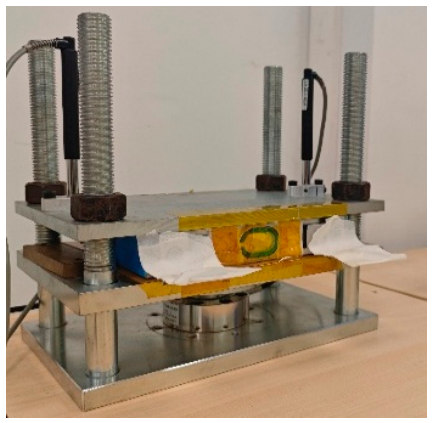
The expansion force testing platform mainly consists of a charge–discharge cabinet, a high-low temperature chamber, an expansion force sensor, and a programmable host computer. As shown in Figure 1, the cell is fixed with a specialized fixture and placed inside the high-low temperature chamber to simulate the influence of different ambient temperatures on battery performance. The preload force of the expansion force fixture is set to 2980 N to ensure consistent mechanical stress on the cell during cycling. During the charge–discharge cycle test, the host computer controls the operating mode of the charge–discharge cabinet and simultaneously acquires and records key state parameters of the cell, including current, voltage, temperature, and expansion force.
Figure 1.
Swelling force test experimental setup.
2.3. Battery Testing Procedures
The testing procedures include capacity calibration tests, cyclic aging tests, and RPT. The specific parameters of the cyclic aging test are listed in Table 2. Considering the typically long cycle life of LFP batteries for energy storage applications, a constant power charge–discharge protocol at 0.5 P was adopted to improve experimental efficiency, with a rest period of 30 min. The ambient temperature was set at two levels, 25 °C and 45 °C, for comparative testing. After every 365 cycles, an RPT was performed, which mainly included a battery capacity test and a low-current charge–discharge characteristic test to evaluate the performance evolution during battery aging.
Table 2.
Test conditions for cycling aging and reference performance tests.
3. Analysis of Expansion Force Evolution Characteristics
3.1. Expansion Force Response During Charge and Discharge
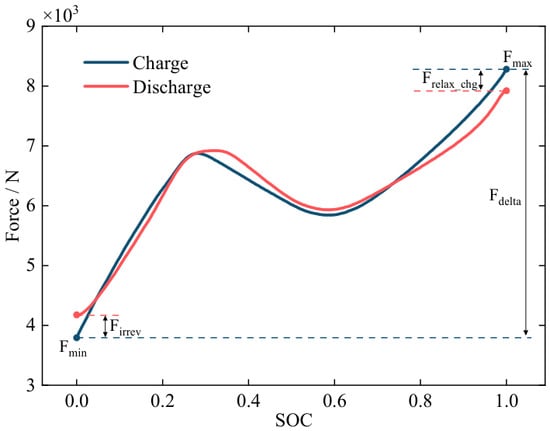
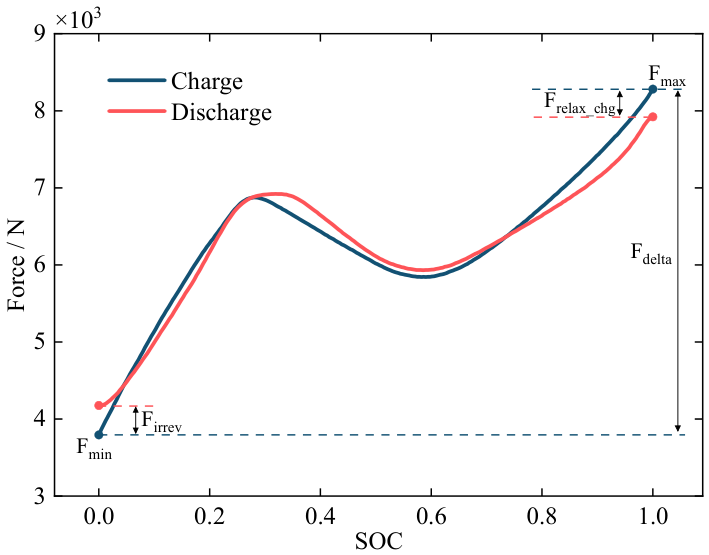
During the charge and discharge of lithium-ion batteries, the intercalation and deintercalation of lithium ions between the cathode and anode cause volume changes in the electrode materials, which, under fixture constraint conditions, manifest as measurable expansion force variations. As shown in Figure 2, the expansion force of cell A3 during the first full cycle at 45 °C exhibits pronounced nonlinear changes with the charge–discharge process. In the charge stage, the expansion force generally rises with increasing capacity, accompanied by fluctuations within certain SOC intervals; after charge termination, the expansion force undergoes a certain degree of relaxation during the rest stage. In the discharge stage, the expansion force generally decreases, but its variation path does not fully coincide with that of the charge stage, indicating notable mechanical hysteresis.
Figure 2.
Dynamic changes in swelling force of A3 battery during the first cycle.
This asymmetric response is associated with the staged lithium intercalation/deintercalation of electrode materials, changes in the internal contact state of the cell, and the viscoelastic response of the materials. The expansion force variation during the rest stages after charge and discharge reflects the mitigation of concentration gradients and the stress relaxation process. If the expansion force fails to return completely to the initial level after a complete charge–rest–discharge–rest cycle, it indicates the accumulation of residual mechanical response during cycling. Since no teardown, impedance, or material characterization was performed in this work, the specific microscopic aging mechanisms are not considered as direct proof objects; instead, the subsequent analysis focuses primarily on the statistical relationship between the measurable expansion force features and SOH.
3.2. Correlation Between Expansion Force Features and Capacity Fade During Long-Term Cycling
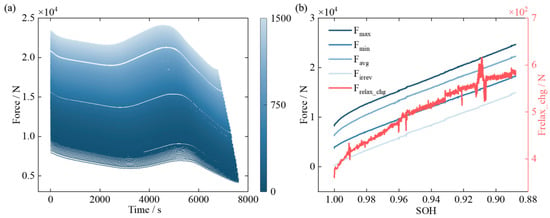
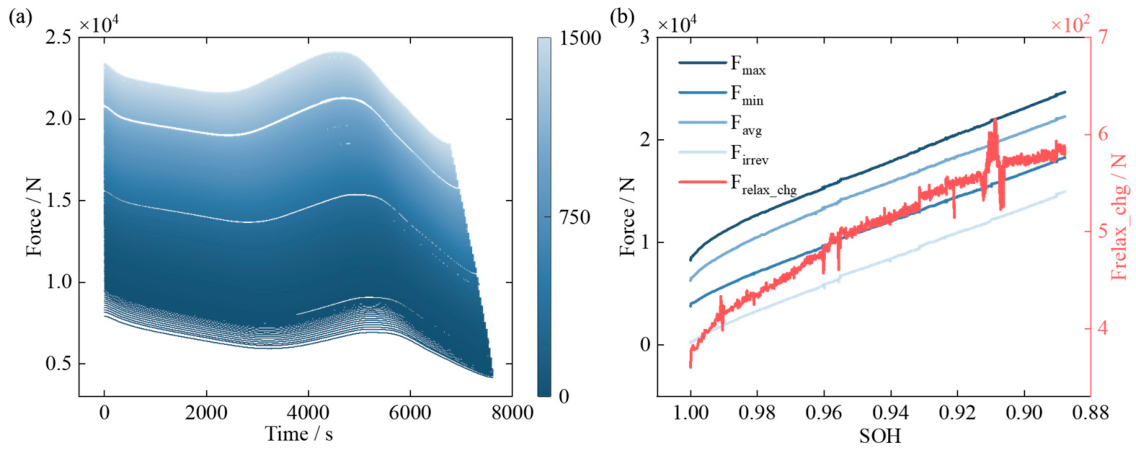
During long-term cycling, the repeated volume changes in electrode materials induce dynamic expansion force fluctuations, while processes such as interfacial side reactions, structural relaxation, and changes in contact state may also lead to the gradual accumulation of residual mechanical response. Figure 3a illustrates the evolution of the expansion force curve during cycling. As the cycle number increases, the baseline, peak value, valley value, and rest relaxation magnitude of the expansion force curve all change, indicating that the expansion force reflects not only the instantaneous mechanical response within a single charge–discharge cycle but also the long-term accumulated information caused by cyclic aging.
Figure 3.
(a) Swelling force evolution in cycling; (b) swelling force vs. capacity degradation.
To quantitatively describe the relationship between expansion force and capacity fade, this paper extracts basic mechanical features from the cycle-level expansion force curve, including the maximum, minimum, mean, variation range, start and end values of the charge and discharge stages, rest relaxation variation, and irreversible expansion force variation. Among these, the maximum expansion force reflects the peak stress state reached by the cell within a single cycle, the minimum expansion force indicates the residual pressure level after rest, the mean expansion force characterizes the overall mechanical load during cycling, the rest relaxation variation reflects the stress release process after charge and discharge, and the irreversible expansion force variation is used to describe the net change in residual pressure after a cycle. As can be seen from Figure 3b, some expansion force features exhibit continuous changes with cyclic aging and show a relatively clear synchronous relationship with capacity fade, suggesting that expansion force can serve as important additional information for the SOH estimation of large-capacity energy storage batteries.
4. Mechanical–Electrical–Thermal Multi-Field Coupled Feature Extraction
4.1. Sample Construction and Feature Sources
The preceding results indicate that the expansion force curve within a single cycle can reflect the mechanical response during charge and discharge, while the variation in expansion force features over long-term cycling is correlated with capacity fade. To transform these observable changes into inputs for the SOH estimation model, this paper constructs a cycle-level dataset with the “battery–cycle” as the basic sample unit. Each row of the sample corresponds to a complete cycle of a specific battery, containing candidate features such as electrical, thermal, expansion force, dV/dQ, and dF/dQ.
For missing cycles in the original test, no additional cycle samples are artificially supplemented; for local outliers existing in the extracted cycle-level features, independent cleaning is performed before feature selection. This approach preserves the authenticity of the original cycle test records while providing a uniform data structure for subsequent modeling inputs. Figure 4, Figure 5 and Figure 6 illustrate the physical origins of the candidate features from perspectives including the voltage–capacity relationship, differential voltage response, expansion force–capacity differential response, incremental capacity response, and temperature-related expansion force variation.
Figure 4.
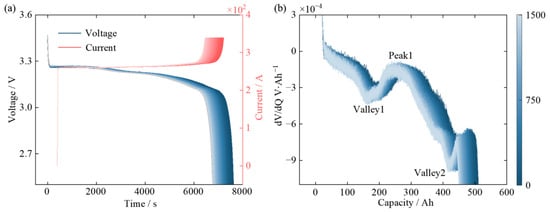
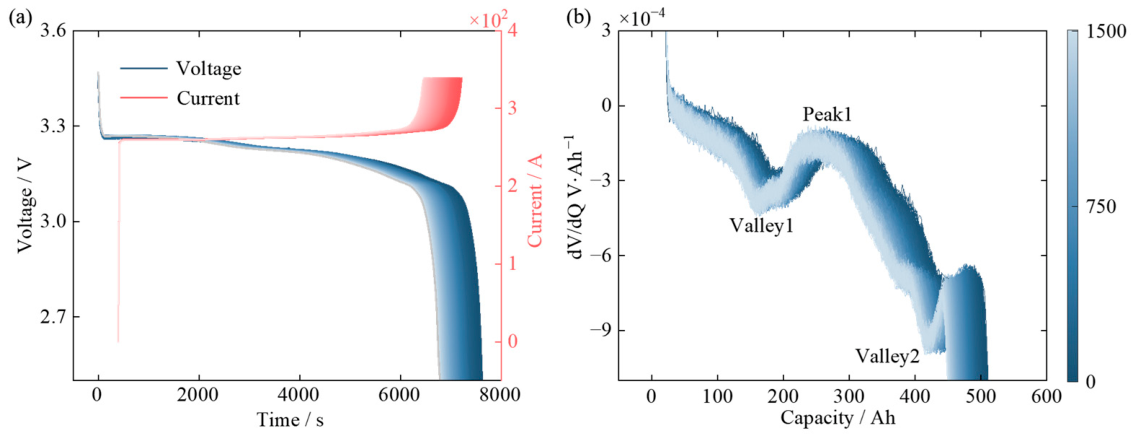
(a) V–Q degradation in cycling; (b) dV/dQ profiles during cycling.
Figure 5.
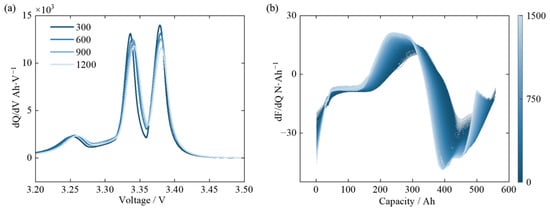
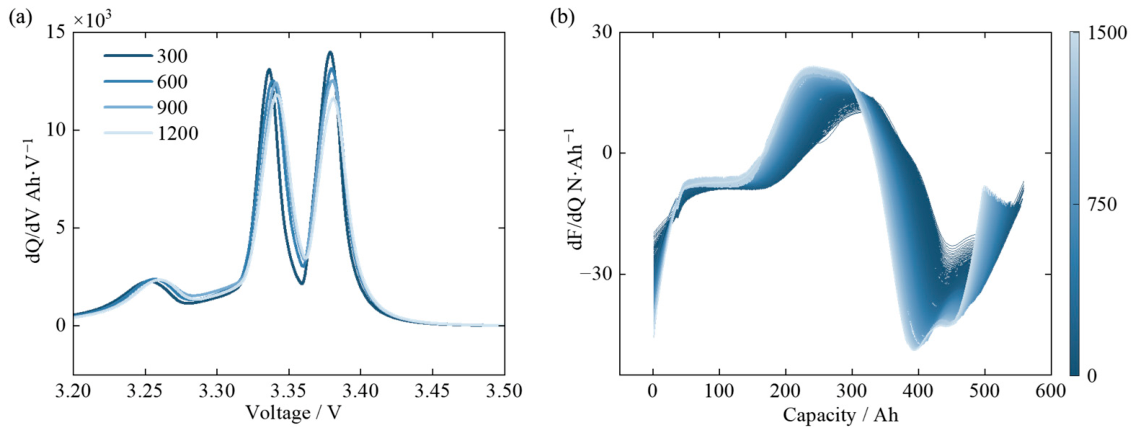
(a) dQ/dV profiles during cycling; (b) dF/dQ profiles during cycling.
Figure 6.
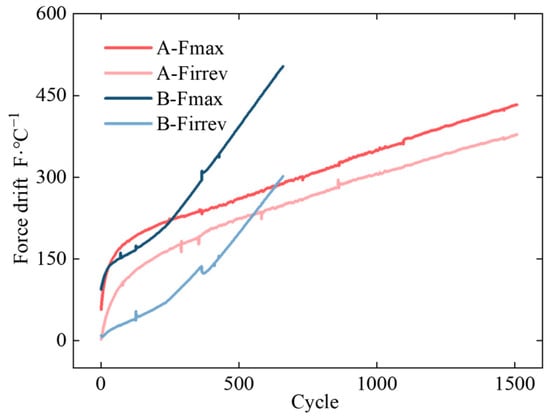
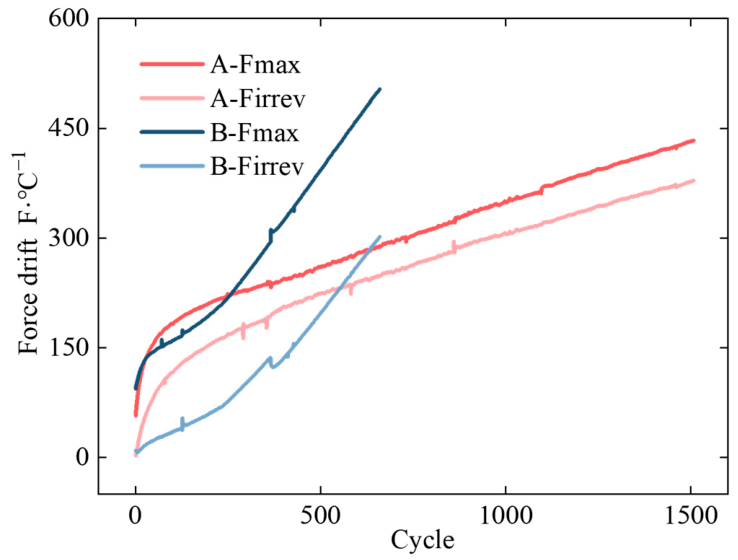
Temperature-dependent swelling force drift.
4.2. Voltage–Capacity Differential Features
The voltage–capacity (V–Q) curve can reflect the relationship between the voltage plateau and capacity during cycling. Figure 4a presents the V–Q curves and capacity fade variations at different cycles. As aging progresses, the available capacity gradually decreases, and both the position of the voltage plateau and the shape of the curve change accordingly. These changes indicate that the terminal voltage curve contains degradation information related to SOH. However, the plateau of the raw V–Q curve is relatively flat, and localized differences are not easily identified directly, making it necessary to further employ differential curves to amplify feature variations.
In this paper, the dV/dQ curve is constructed based on the relationship between capacity Q and voltage V during the discharge stage to extract local features of voltage plateau variation. To reduce the amplification effect of sampling noise during differentiation, the original curve is first smoothed, then difference-based differentiation is applied, and the curves from different cycles are interpolated onto a unified capacity coordinate. Figure 4b shows that the valleys and peaks in the dV/dQ curve shift in position and change in amplitude with cycling, reflecting the migration of the voltage plateau and local polarization variations. From the dV/dQ curve, the positions, heights, and areas of Valley 1, the main peak, and Valley 2 are extracted, yielding a total of nine candidate features. Specifically, the position denotes the capacity coordinate corresponding to the peak or valley point, the height represents the derivative value at that point, and the area denotes the integral quantity over the capacity range around the peak or valley.
The dQ/dV curve presented in Figure 5a further reveals the characteristic changes near the voltage plateau from the perspective of incremental capacity analysis. Both dQ/dV and dV/dQ are derived from the first-order differential expression of the V–Q curve and offer complementary visualization significance for changes in the plateau region. Considering the need to control the number of candidate features and reduce redundant representation in the final modeling, the positions, heights, and areas of the dV/dQ peaks and valleys are retained as the voltage differential curve features among the 37 candidate input features, while Figure 5a is mainly used to assist in illustrating the migration and morphological changes in the voltage plateau with cyclic aging.
4.3. Expansion Force–Capacity Differential Features
In addition to the voltage curve, the curve of expansion force versus capacity also contains aging-related information. The expansion force–capacity (F–Q) curve describes the mechanical response corresponding to the change in capacity per unit during the charge–discharge process. When the stages of lithium intercalation/deintercalation, the internal contact state, or the stress release process change, the local slope and the peak–valley morphology of the F–Q curve also change accordingly.
This paper further computes the first-order derivative of the F–Q curve, dF/dQ, to characterize the rate of change in the expansion force caused by the change in capacity per unit. Figure 5b shows that the dF/dQ curve exhibits a distinct peak–valley structure at different cycles, indicating that the mechanical response does not simply vary linearly with capacity but rather shows local enhancement or release in specific capacity intervals. From the dF/dQ curve, the positions, heights, and areas of the main peak and main valley are extracted, yielding a total of 6 candidate features. Compared with macroscopic statistical features such as the maximum, minimum, and relaxation magnitude of the expansion force, the dF/dQ features emphasize the local response of the expansion force with respect to capacity variation and can serve as a differential representation of mechanical degradation information.
4.4. Temperature Features and Thermal–Mechanical Coupling Information
Temperature affects the battery’s reaction kinetics, degree of polarization, and mechanical response of materials; therefore, thermal state information needs to be incorporated into SOH estimation. In this paper, six temperature features are extracted from each cycle, including the cycle-average temperature Tavg_cycle, the maximum temperature Tmax_cycle, the minimum temperature Tmin_cycle, the temperature fluctuation range Tdelta_cycle, the cycle-average of the maximum temperature difference among the four measurement points T_spread_avg, and the average chamber temperature T_chamber_avg. Among these, T_spread_avg is used to characterize the degree of temperature non-uniformity at different measurement locations of the battery, and T_chamber_avg is used to represent the external ambient temperature.
Figure 6 illustrates the differences in the variation in expansion force features under different temperature conditions. The evolution rate of the expansion force at 45 °C differs from that at 25 °C, indicating that ambient temperature affects both the accumulation process of the expansion force and the SOH degradation pathway. Elevated temperature may indirectly influence the expansion force features by altering reaction rates, polarization processes, interfacial side reactions, and the mechanical response of materials. Since this paper focuses on SOH estimation modeling, the temperature is subsequently incorporated as an input feature for feature selection and model training, without over-attributing specific thermal–mechanical coupling mechanisms.
Integrating the curve evidence from Figure 4, Figure 5 and Figure 6, the candidate features constructed in this paper are divided into five categories: electrical features, used to describe the voltage recovery process after charge and discharge; thermal features, used to characterize the cyclic thermal state and temperature non-uniformity across measurement points; expansion force features, used to describe the single-cycle stress level, stress relaxation during rest, and irreversible mechanical response accumulation; dV/dQ features, used to amplify the migration and morphological changes in the voltage plateau accompanying capacity fade; and dF/dQ features, used to depict the local response of the expansion force with respect to capacity variation. The above features characterize the battery aging process from the perspectives of electrochemical response, thermal state, and mechanical response, respectively, and exhibit a certain degree of complementarity.
5. SOH Prediction Based on Multi-Modal Features
5.1. SOH Estimation Framework
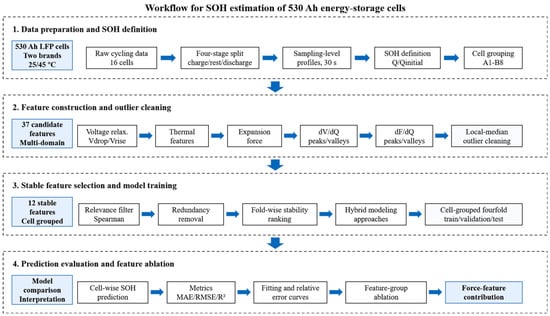
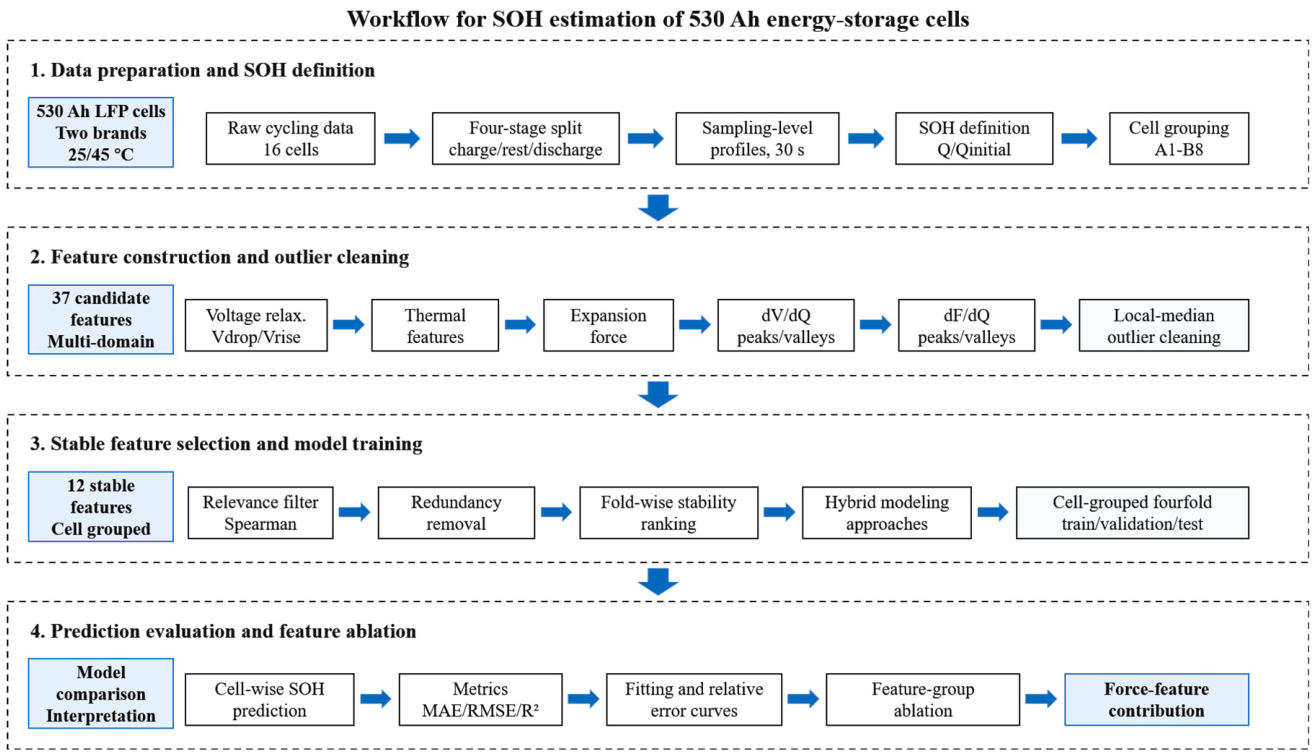
The SOH estimation framework for the 530 Ah energy storage batteries constructed in this paper is illustrated in Figure 7. First, the cycling data of the 530 Ah cells from brands A and B are organized into four stages: charge, rest after charge, discharge, and rest after discharge. The cycle SOH is then calculated with the maximum discharge capacity of the first cycle for each cell as the reference. The SOH label is derived from the maximum discharge capacity of each cycle, defined as
where denotes the maximum discharge capacity of cell i at cycle c, and denotes the maximum discharge capacity of the same cell at the first cycle.
Figure 7.
Workflow of SOH estimation using mechanical–electrical–thermal multimodal features.
Subsequently, five categories of candidate features—electrical, thermal, expansion force, dV/dQ, and dF/dQ—are constructed from the cycle-level data, and isolated outliers that significantly deviate from the variation trend of adjacent cycles are identified and corrected by interpolation. In the modeling stage, feature selection is performed exclusively on the training cells. After 12 key features are retained, grouped four-fold cross-validation is employed to evaluate the generalization ability of the models on unseen cells. Finally, the four models are compared and LightGBM-based feature-ablation experiments are conducted to quantify the contribution of the different feature categories to SOH estimation.
5.2. Feature Selection
The candidate input features are divided into five categories, as shown in Table 3. To mitigate the impact of transient sensor fluctuations and errors in curve peak/valley identification on the modeling results, outlier cleaning is performed on the 37 candidate features prior to feature selection. The cleaning is conducted independently for each battery and each feature. A sliding window with a center span of 31 cycles is used to compute the local median and the median absolute deviation (MAD), and the robust z-score is employed to identify local spikes. A feature value is marked as a candidate outlier when it significantly deviates from the local trend of adjacent cycles and satisfies |robust_z| > 6. For isolated outlier segments no longer than three cycles, linear interpolation using adjacent cycles is applied for correction; for contiguous segments of longer duration, only recording is performed without automatic replacement. The 37 candidate features contain a total of 620,009 feature values, among which 1666 are corrected by automatic interpolation, accounting for 0.269%.
Table 3.
Mechanical–electrical–thermal characteristic description.
To prevent information from the test batteries from participating in feature selection, a complete battery grouping validation strategy is adopted in this paper. In each outer fold, 4 complete batteries are used as the test set and the remaining 12 batteries serve as the training set. Feature correlation calculation, redundancy elimination, determination of the number of retained features, and model parameter selection are all performed exclusively within the training batteries, while the test batteries are used only for the final generalization performance evaluation.
The feature selection consists of three steps. First, the Spearman correlation coefficient between each candidate feature and SOH is calculated within the outer training set, and features with are retained. The Spearman correlation coefficient is used because the battery degradation process is markedly nonlinear, and the relationship between many effective features and SOH is closer to monotonic rather than strictly linear. Subsequently, the Spearman correlation coefficients among the retained features are calculated; if between any two features, they are considered to exhibit strong redundancy, and the one with the higher correlation with SOH is kept. Finally, a three-fold grouped validation is performed inside the outer training set to compare schemes of Top 8, Top 12, Top 16, Top 20, and all retained features, and the number of features that yields the lowest average RMSE on the validation set is selected.
To obtain key features that were repeatedly selected across different training battery combinations and screening models, Random Forest, XGBoost, and LightGBM were used in the screening stage. The four outer folds and three screening models generated 12 model-fold selection combinations. Features selected in at least 9 of the 12 combinations were retained as key features. Table 4 lists the 12 features retained from the 37 candidates. These features comprise electrical, thermal, expansion force, dV/dQ, and dF/dQ descriptors. In particular, three cycle-level expansion-force features and three dF/dQ descriptors were retained, indicating that both the global mechanical response and its local capacity-dependent variation provided ageing information.
Table 4.
Key features.
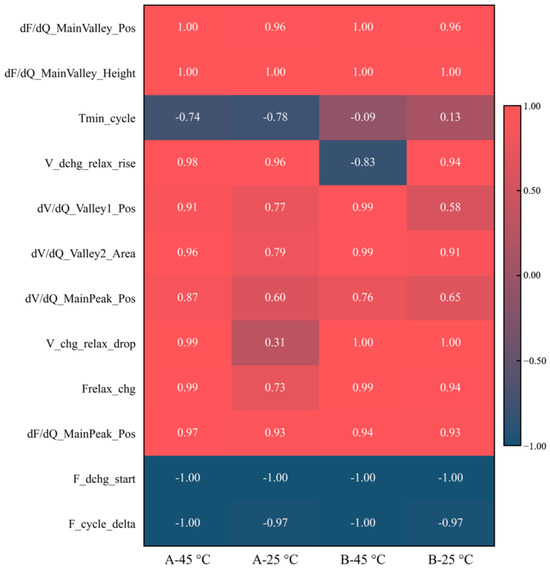
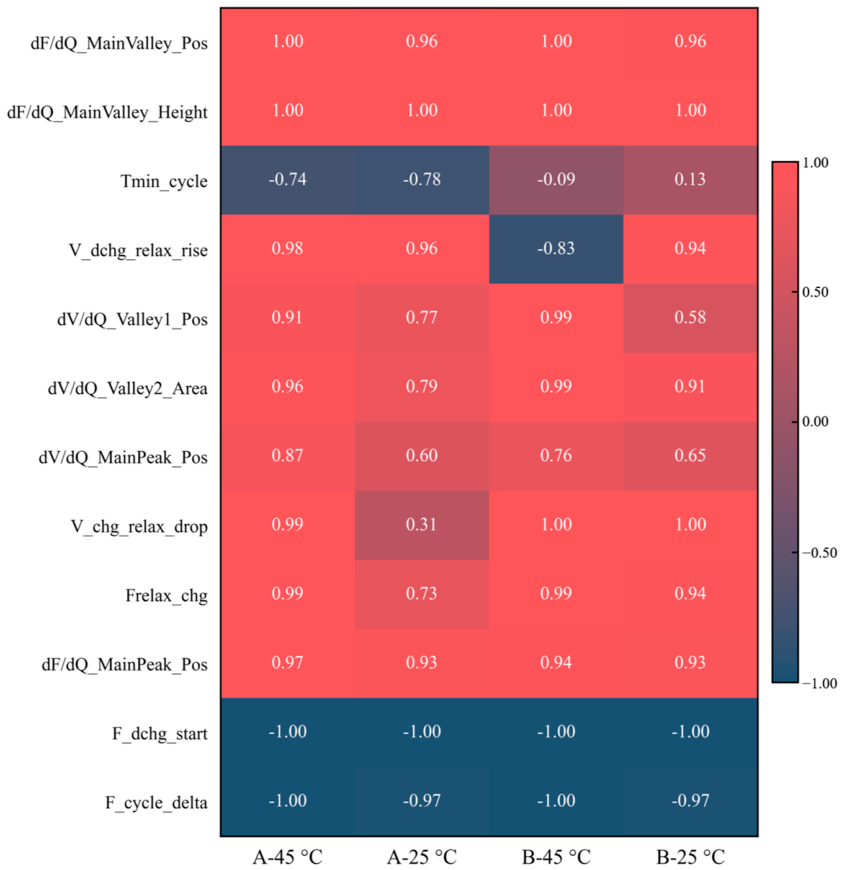
To examine whether the retained features were robust across manufacturers and temperatures, Spearman correlations between each feature and SOH were calculated separately for each cell and summarized by the median value within each brand-temperature stratum. Figure 8 shows the resulting correlations for A-45 °C, A-25 °C, B-45 °C, and B-25 °C. Most key features retained the same association direction across the four strata. In particular, F_dchg_start and F_cycle_delta were negatively associated with SOH, whereas the dF/dQ main-valley descriptors showed positive correlations. Tmin_cycle and V_dchg_relax_rise showed greater condition dependence in the B-brand cells and should therefore be interpreted as condition-sensitive descriptors rather than universal monotonic ageing indicators.
Figure 8.
Median Spearman correlation coefficients between the 12 key features and SOH across four brand-temperature strata.
5.3. Model Construction
After identifying the 12 key features, four types of SOH estimation models—Random Forest, XGBoost, LightGBM, and LSTM—are constructed in this paper. The first three models are used to evaluate the nonlinear modeling capability of cycle-level tabular features, while LSTM is employed to assess the temporal dependency information within consecutive cycle windows. For Random Forest, XGBoost, and LightGBM, each cycle-level sample is directly represented as a 12-dimensional feature vector, with the target being the SOH of that cycle. For the LSTM model, a sequence of features from 20 consecutive cycles of the same battery is used as the input window to predict the SOH of the cycle at the end of the window.
The LSTM model consists of one LSTM layer with a hidden dimension of 32; the hidden state of the last time step is fed into a fully connected output head with the structure Linear(32,16)–ReLU–Linear(16,1). The model is trained using the Adam optimizer with a learning rate of 0.001, a weight decay of 1 × 10⁻⁴, for 80 epochs, and gradient clipping is applied to limit the maximum gradient norm to 1.0. Random Forest is configured with 200 trees, a maximum depth of 8, and a minimum number of samples per leaf of 10. Both XGBoost and LightGBM adopt the squared error regression objective, a learning rate of 0.03, 260 estimators, and subsample and column sampling ratios of 0.85 to mitigate overfitting.
To evaluate generalization to unseen cells, grouped four-fold cross-validation was adopted. Table 5 shows the allocation of the test cells across the four folds. Each test fold contained one cell from each brand-temperature stratum, namely A-45 °C, A-25 °C, B-45 °C, and B-25 °C, whereas the remaining 12 cells were used for training and internal validation. This design prevents cycle samples from the same cell from appearing in both the training and test sets. MAE, RMSE, and R2 were first calculated separately for each test cell and subsequently averaged within each fold, so that cells with longer cycling records did not dominate the evaluation. To assess training stability, the complete four-fold procedure was repeated using five random seeds (42, 202, 602, 1002, and 2026). For each model, 95% confidence intervals were estimated by 2,000 bootstrap resamples of the 16 cell-level metrics after averaging the repeated results for each cell.
Table 5.
Test-cell allocation in grouped four-fold cross-validation.
5.4. Results Analysis
After outlier cleaning and key feature selection, Random Forest, XGBoost, LightGBM, and LSTM were evaluated using the same grouped four-fold partition. The four folds together covered all 16 cells, and all models used the same 12 key features. Random Forest, XGBoost, and LightGBM used cycle-level feature vectors, whereas LSTM used a 20-cycle sequence window within each cell. The repeated evaluation described in Section 5.3 was used for all aggregate performance statistics reported below.
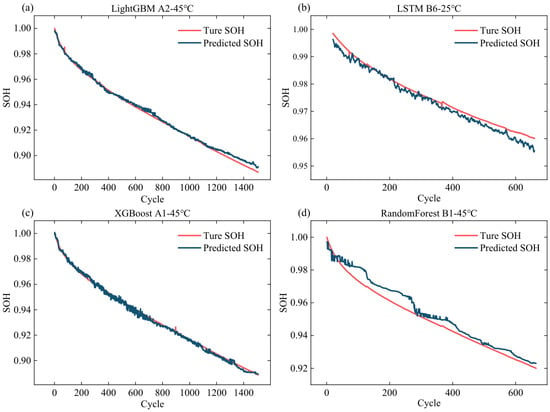
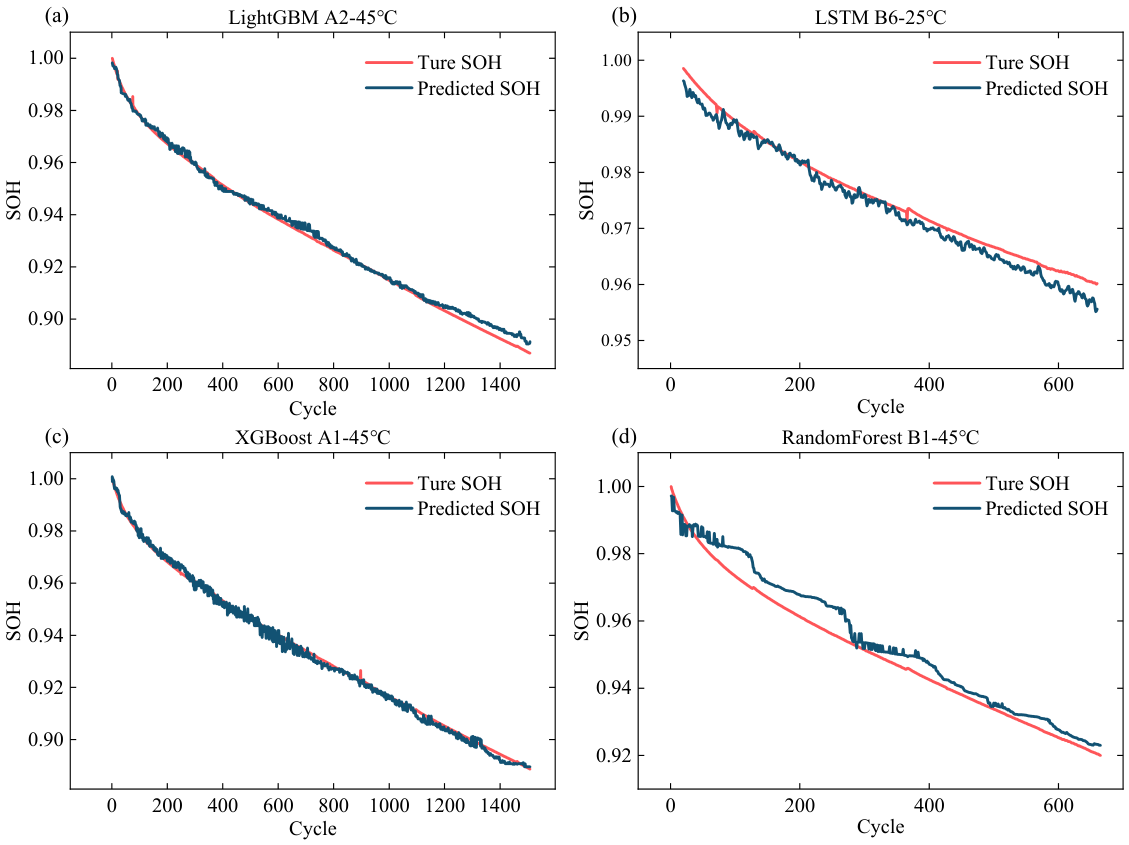
Figure 9 presents the comparison between the true and predicted SOH values of the four models on representative test batteries. It can be observed that all four models are capable of tracking the overall declining trend of SOH with cycle number, indicating that the selected multi-type features can provide effective degradation information for different models. Differences exist among the models in fitting local fluctuations and the end-of-life degradation segment: LightGBM yields a relatively stable fit to the degradation trajectory of battery A2; LSTM is able to capture the gentler degradation trend of battery B6; XGBoost and Random Forest also deliver reasonably continuous SOH prediction results on batteries A1 and B1.
Figure 9.
Representative SOH prediction results of four models: (a) LightGBM, A2-45 °C; (b) LSTM, B6-25 °C; (c) XGBoost, A1-45 °C; (d) Random Forest, B1-45 °C.
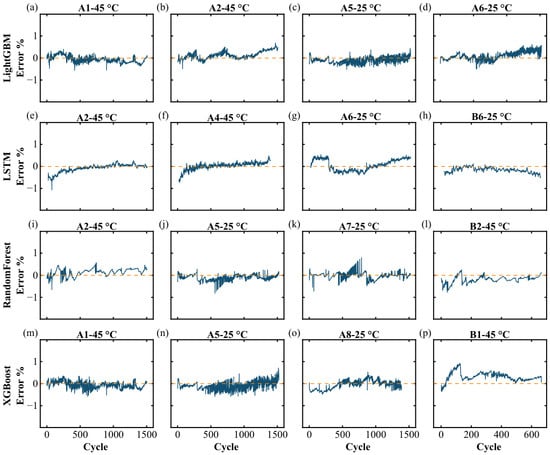
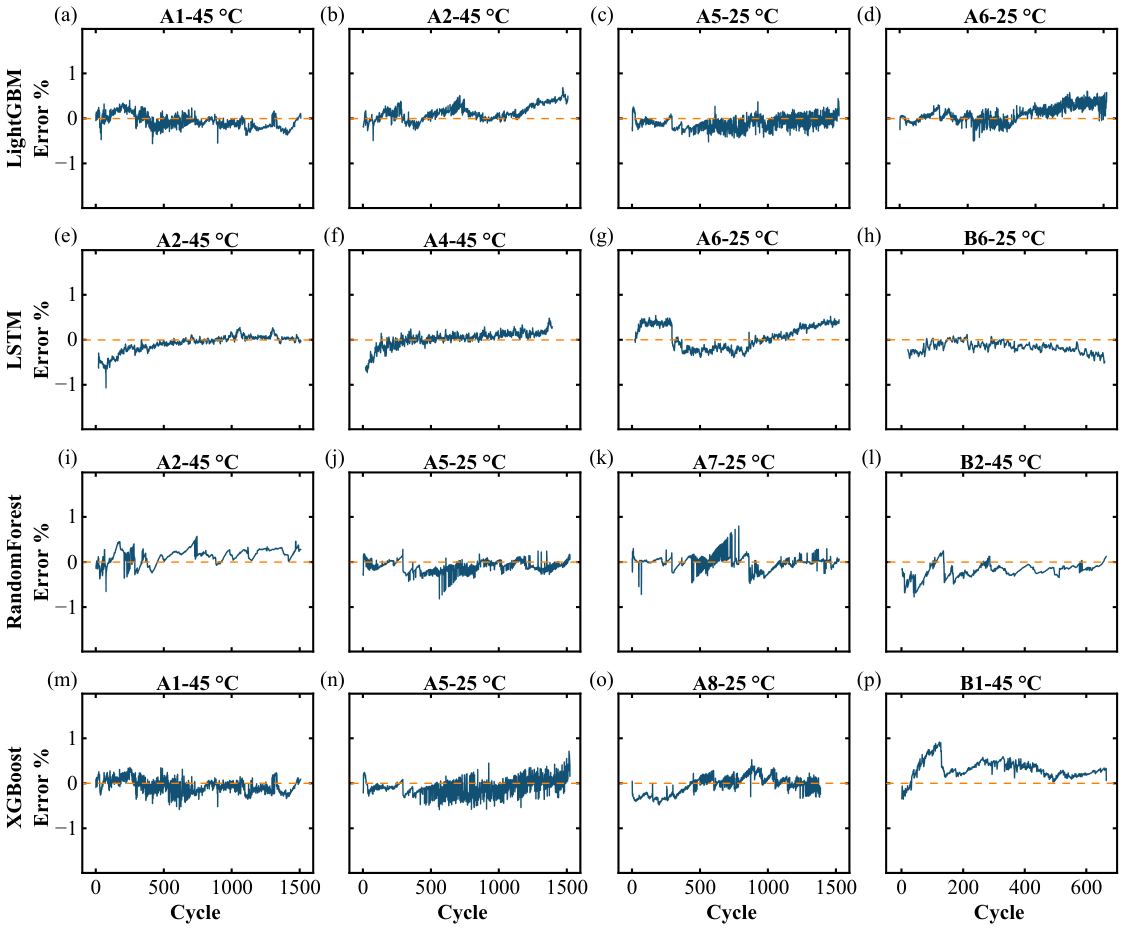
To further examine the error distribution of different models on representative test batteries, Figure 10 presents the relative error curves of the four models. Compared with the SOH fitting curves in Figure 9, Figure 10 further shows how the relative prediction error evolves with cycling. Considering that the degree of fit of different models across test batteries is not entirely uniform, four representative batteries are selected from the 16 test batteries of each model for display. Specifically, the displayed batteries are A1, A2, A5, and A6 for LightGBM; A2, A4, A6, and B6 for LSTM; A2, A5, A7, and B2 for Random Forest; and A1, A5, A8, and B1 for XGBoost. It can be observed that the relative errors of the selected batteries are mostly distributed around zero, although certain models still exhibit noticeable positive or negative deviations in some cycle stages. This indicates that while the models can track the overall SOH degradation trend reasonably well, they remain influenced by cell-to-cell variability, feature fluctuations, and differences in test conditions during localized cycle phases.
Figure 10.
Relative error curves of representative test cells for the four models: (a–d) LightGBM results for A1-45 °C, A2-45 °C, A5-25 °C, A6-25 °C; (e–h) LSTM results for A2-45 °C, A4-45 °C, A6-25 °C, B6-25 °C; (i–l) Random Forest results for A2-45 °C, A5-25 °C, A7-25 °C, B2-45 °C; (m–p) XGBoost results for A1-45 °C, A5-25 °C, A8-25 °C, B1-45 °C.
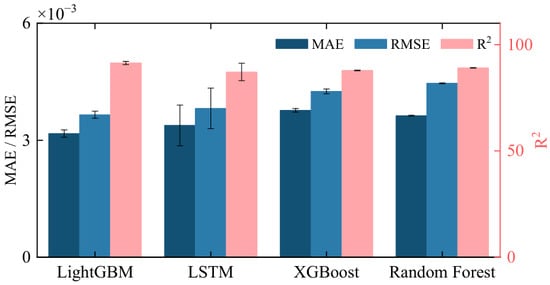
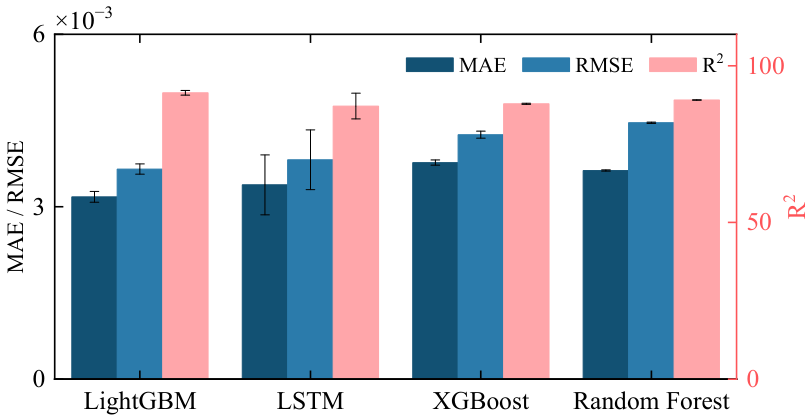
Table 6 and Figure 11 summarize the repeated grouped four-fold validation results. The model ranking remained stable across the five random seeds. LightGBM achieved the best average performance, with an MAE of 3.172 ± 0.094 × 10⁻³, an RMSE of 3.656 ± 0.089 × 10⁻³, and an R2 of 91.36 ± 0.71%. The corresponding battery-level bootstrap 95% confidence intervals were 2.202–4.322 × 10⁻³ for MAE, 2.585–4.960 × 10⁻³ for RMSE, and 85.66–96.11% for R2. Random Forest and XGBoost showed comparatively small seed-to-seed variation but higher average errors. LSTM achieved competitive mean errors but exhibited the largest variation across random seeds, reflecting its greater sensitivity to initialization in the present limited cell-level dataset.
Table 6.
Repeated grouped four-fold validation performance of the four SOH estimation models.
Figure 11.
Comparison of repeated grouped four-fold validation performance for the four SOH estimation models.
The fold-level results are reported in Table 7. Performance varied across folds because of cell-to-cell heterogeneity; nevertheless, LightGBM maintained the lowest or near-lowest error in most folds. Therefore, LightGBM was selected as the base model for the subsequent feature-ablation experiments.
Table 7.
Fold-level prediction performance (MAE × 10−3/RMSE × 10−3/R2(%)) averaged across five random seeds.
5.5. Multi-Modal Feature Ablation Experiment Based on LightGBM
To analyze the contribution of different feature types to SOH prediction, LightGBM, which showed the best overall performance in Section 5.4, was used as the base model. The data partitioning, training procedure, and model parameters were kept unchanged, and only the input feature combinations were varied. The 12 selected key features were organized into five groups: electrical, thermal, cycle-level expansion-force, dV/dQ, and dF/dQ features. Table 8 lists the specific feature composition of each ablation setting. In this section, “force” refers only to the three cycle-level expansion-force features, whereas dF/dQ features are treated as an independent differential mechanical feature group.
Table 8.
Feature composition of the ablation settings.
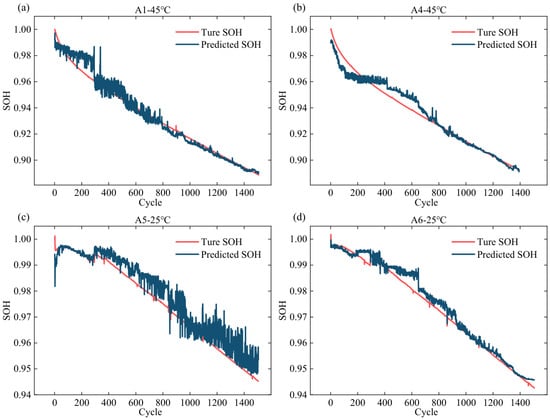
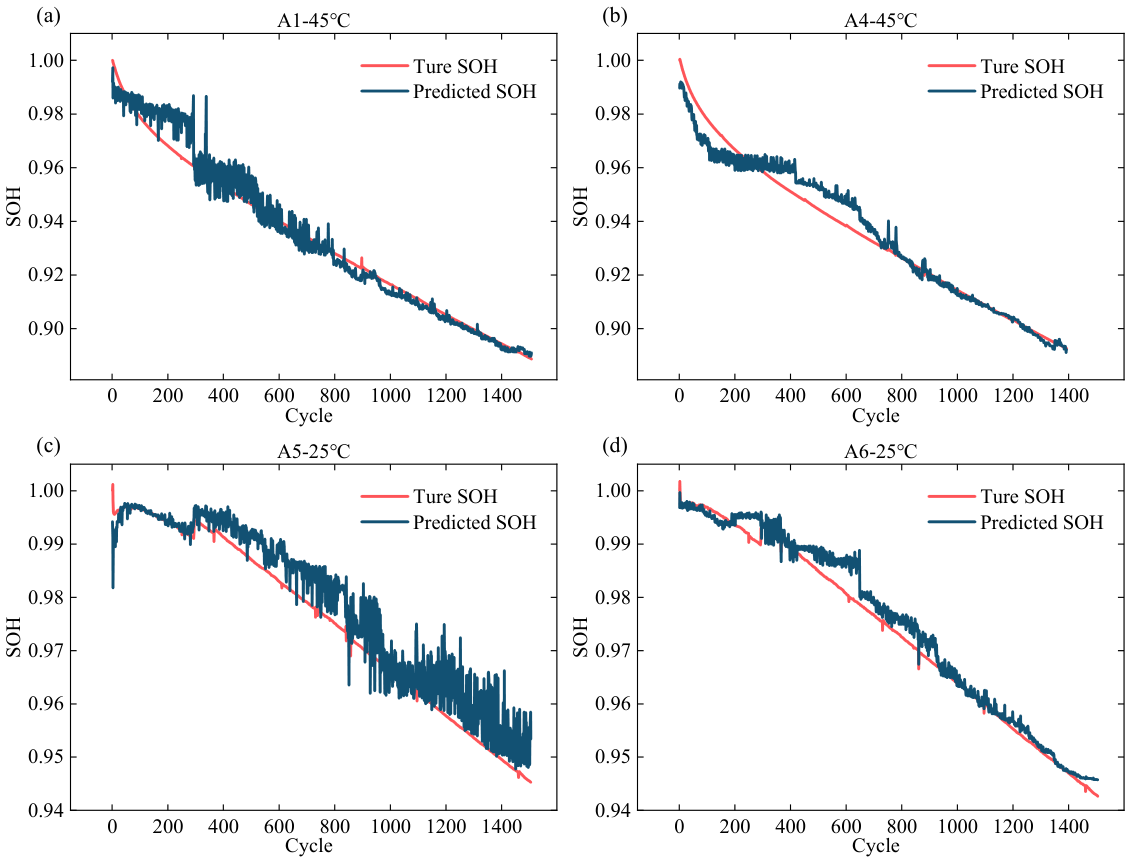
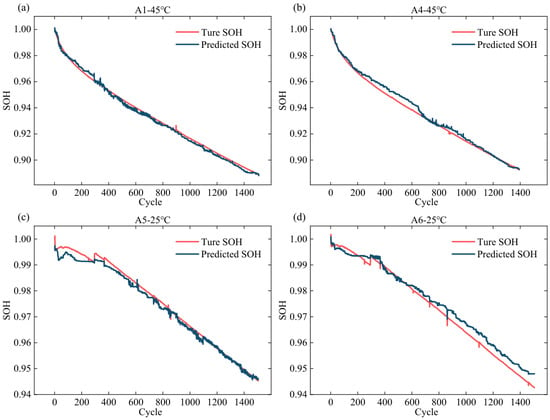
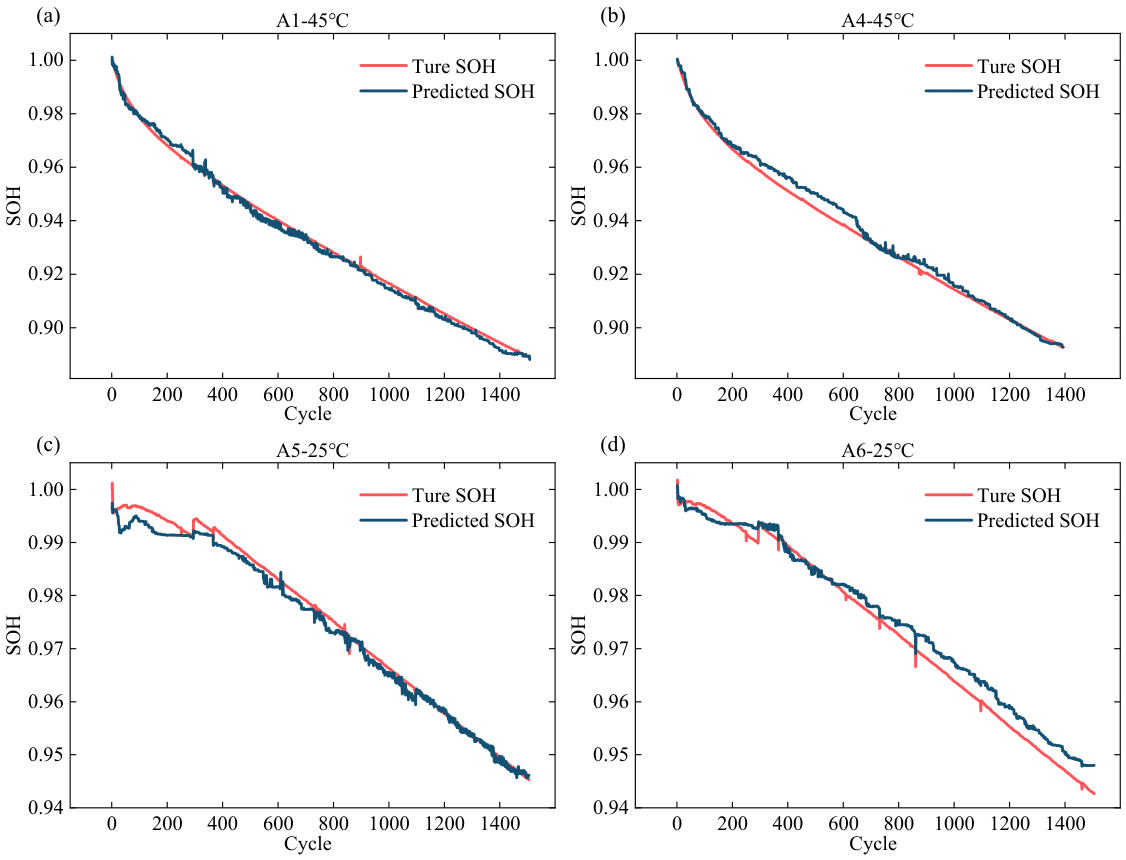
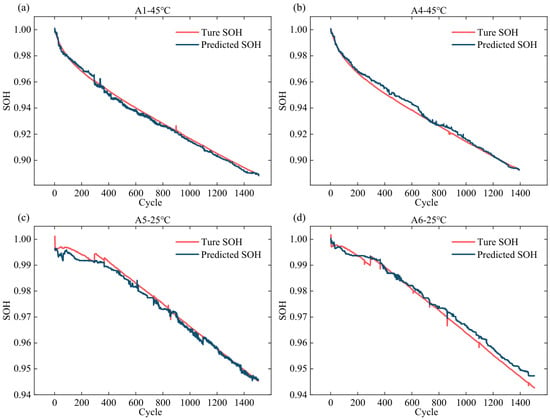
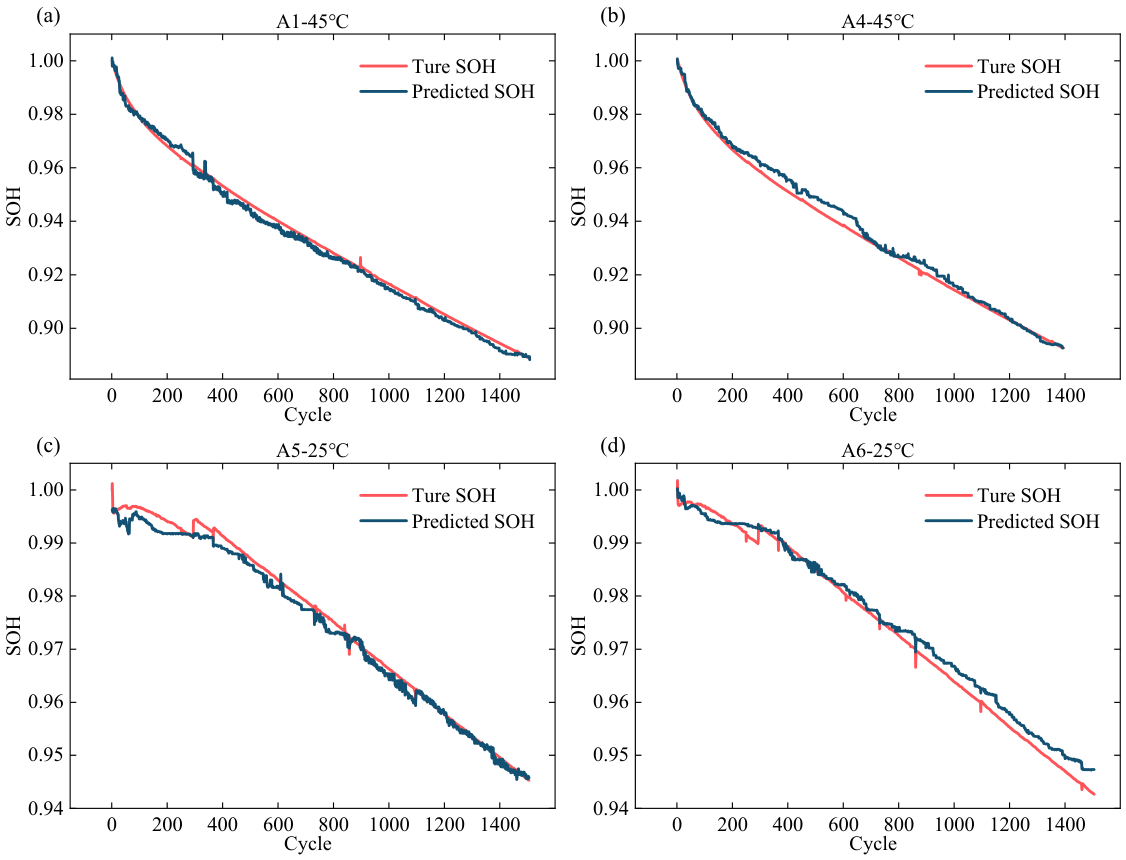
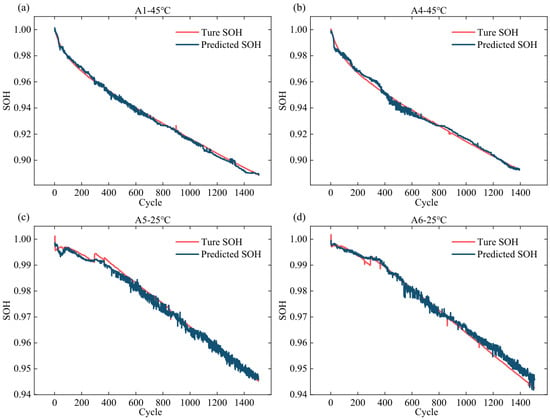
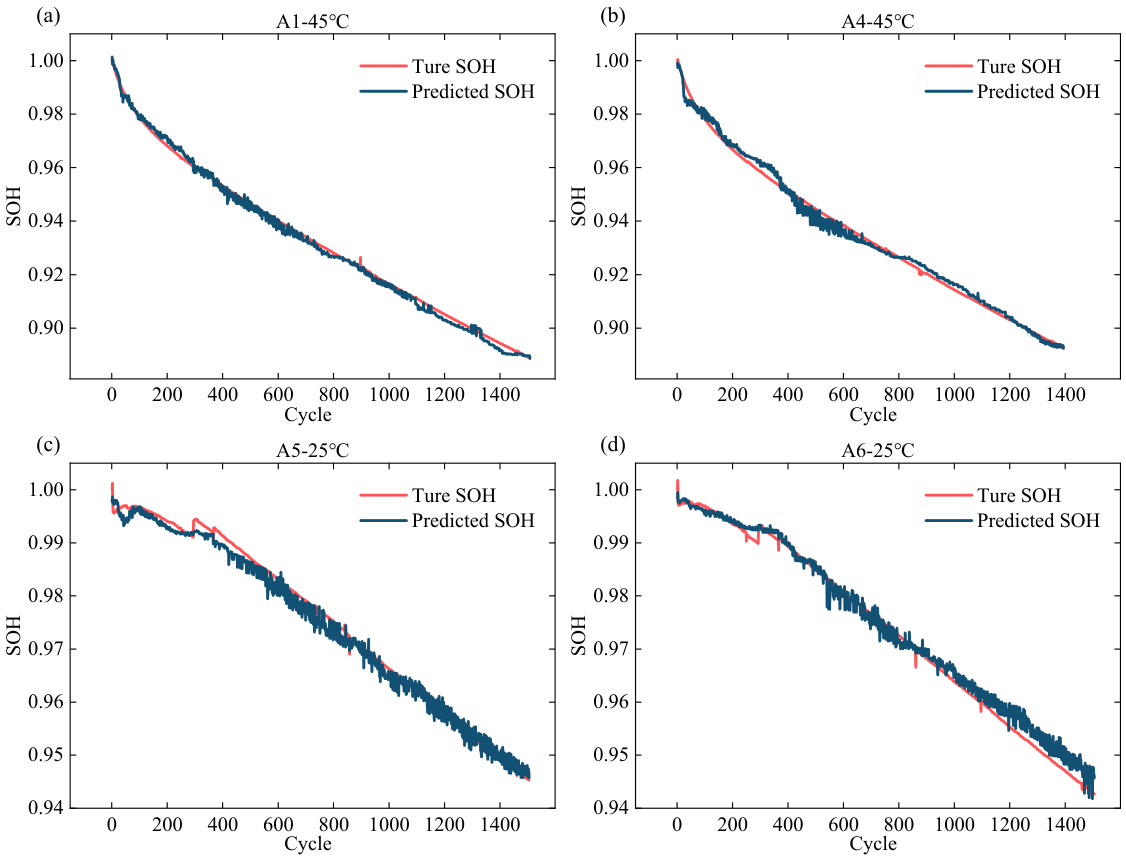
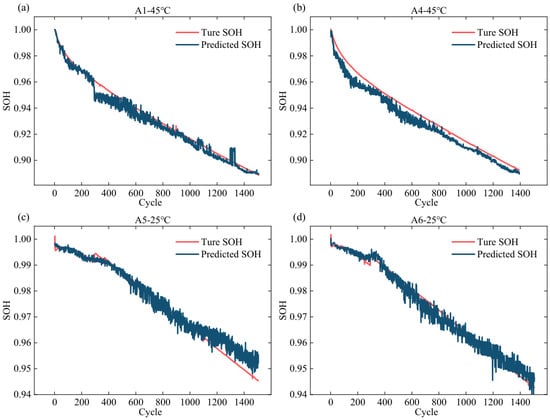
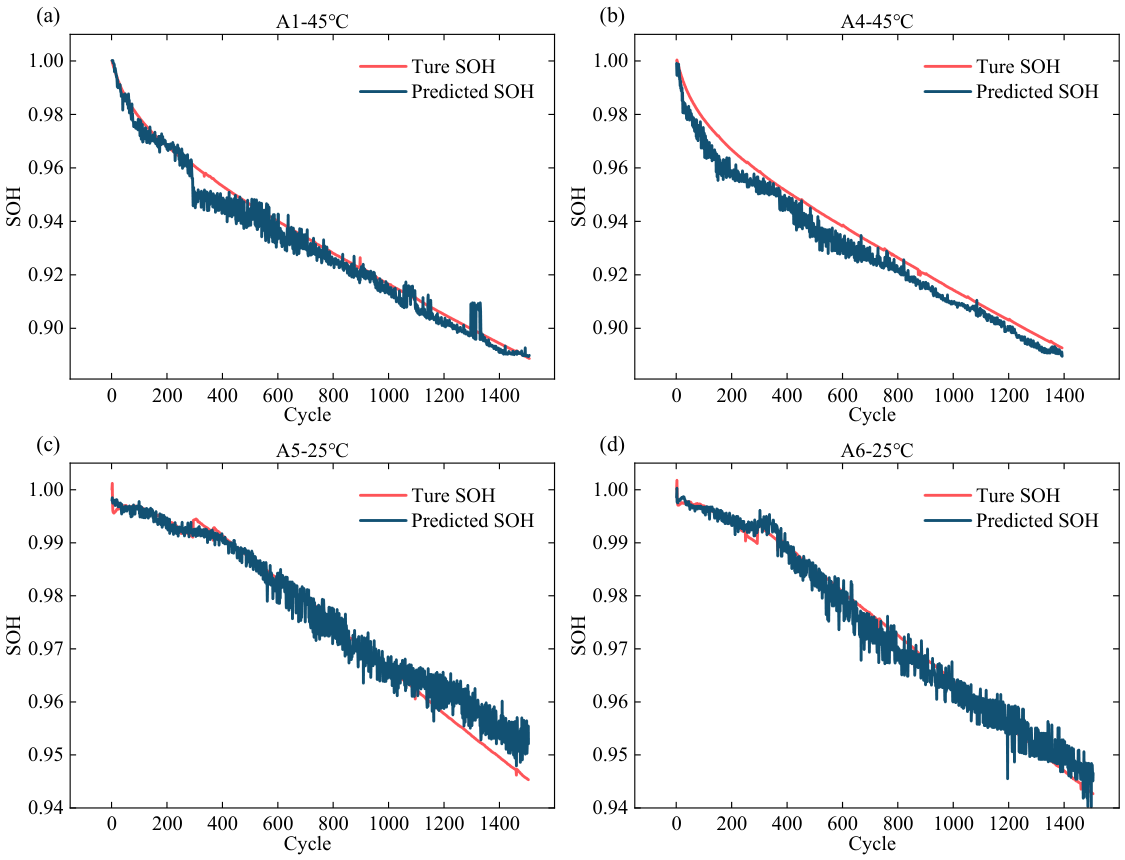
Figure 12, Figure 13, Figure 14, Figure 15 and Figure 16 show representative SOH fitting results for five feature combinations listed in Table 8, namely E-T-dV/dQ, E-T-F-dV/dQ, E-F-dV/dQ, All, and E-T-dV/dQ-dF/dQ, using batteries A1, A4, A5, and A6 as representative examples. With the E-T-dV/dQ combination, the model can track the overall declining trend of SOH, although deviations remain during the middle and later cycling stages for some cells. After the three cycle-level expansion-force features are added, the E-T-F-dV/dQ and E-F-dV/dQ combinations provide prediction curves that are generally closer to the true SOH. The All setting maintains good fitting performance, whereas its performance does not consistently exceed that of the force-containing subsets, suggesting partial information overlap among the feature groups. In contrast, the E-T-dV/dQ-dF/dQ setting excludes the three cycle-level expansion-force features while retaining the dF/dQ features; the larger deviations observed for some cells indicate that the cycle-level expansion-force features provide complementary information for tracking the SOH degradation trajectory.
Figure 12.
SOH prediction results using the electrical–thermal–dV/dQ feature combination on A1, A4, A5 and A6 cells.
Figure 13.
SOH prediction results using the electrical–thermal–force–dV/dQ feature combination on A1, A4, A5 and A6.
Figure 14.
SOH prediction results using the electrical–force–dV/dQ feature combination on A1, A4, A5 and A6 cells.
Figure 15.
SOH prediction results using all selected features on A1, A4, A5 and A6 cells.
Figure 16.
SOH prediction results using the electrical–thermal–dV/dQ-dF/dQ feature combination on A1, A4, A5 and A6 cells.
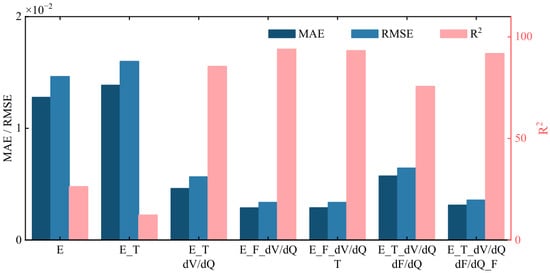
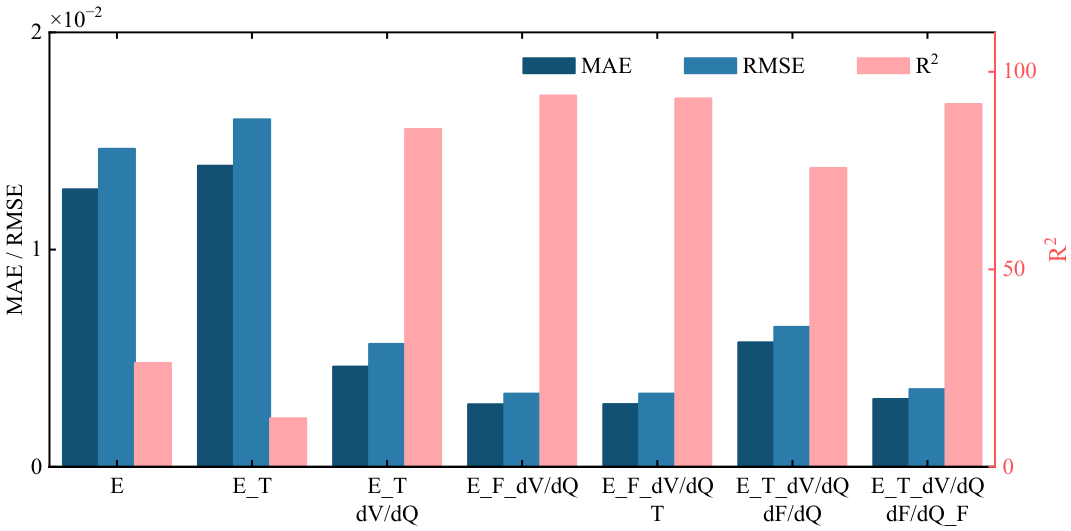
To further quantify the overall effectiveness of different feature combinations, Figure 17 summarizes the mean absolute error (MAE), root mean square error (RMSE), and coefficient of determination (R2) averaged across the 16 test cells for each combination. When using only electrical features, the average RMSE was 0.0146 and the average R2 was 26.29%. The inclusion of thermal features did not significantly reduce the error, indicating that temperature features alone are insufficient to independently characterize SOH degradation. After incorporating the dV/dQ features, the combined electrical–thermal–dV/dQ set achieved an average RMSE of 0.0057 and an average R2 of 85.49%, demonstrating that the differential voltage curve can supplement the stage-wise degradation information that is not readily captured by conventional voltage-relaxation features.
Figure 17.
Comparison of average SOH prediction metrics of the LightGBM model using different feature combinations.
The incorporation of force features further improves prediction accuracy. On the basis of the electrical–thermal–dV/dQ combination, adding force features reduces the average RMSE to 0.0034 and increases the average R2 to 93.29% for the electrical–thermal–force–dV/dQ set; the electrical–force–dV/dQ combination also achieves favorable results, with an average RMSE of 0.0034 and an average R2 of 93.99%. The full set of all features yields an average RMSE of 0.0036 and an average R2 of 91.83%, maintaining a consistently high prediction precision. After removing the cycle-level expansion-force features, the average RMSE rises to 0.0064 and the average R2 drops to 75.66%, which is markedly inferior to the combinations that include force features. These results indicate that expansion-force features can provide mechanical response information that is not directly captured by conventional voltage and temperature signals, and thus contribute significantly to SOH estimation for 530-Ah large-capacity energy-storage batteries.
6. Conclusions
In this study, 16 prismatic 530-Ah LFP energy-storage batteries from two brands were investigated. Based on cycling aging test data at 25 °C and 45 °C, a SOH estimation method integrating electrical, thermal, expansion force, dV/dQ, and dF/dQ features was constructed. Through outlier cleaning, internal feature screening within the training set, complete-cell grouping four-fold testing, and feature ablation experiments, the role of expansion-force-related features in SOH estimation for large-capacity batteries was analyzed. The main conclusions are as follows.
- (1)
- The 530-Ah prismatic energy-storage batteries exhibit pronounced nonlinear variations and charge–discharge asymmetry in expansion force during cycling. As aging progresses, certain expansion-force features show synchronous trends with capacity fade, indicating that expansion force can reflect the accumulation of irreversible internal responses from a macroscopic mechanical perspective and can serve as a valuable supplementary signal for SOH estimation.
- (2)
- From 37 candidate features, 12 key features were selected, covering five categories: electrical, thermal, expansion force, dV/dQ, and dF/dQ. Among them, expansion force and dF/dQ features together account for six items. These features were retained in at least 9 of the 12 model-fold selection combinations, indicating that the global expansion-force response and its capacity-dependent differential descriptors repeatedly contributed to feature screening. The outlier-cleaning and complete-cell grouping procedure reduced the influence of local outliers and sample-division bias on feature evaluation.
- (3)
- Under the same 12 key features and the same complete-cell grouping test protocol, Random Forest, XGBoost, LightGBM, and LSTM all track the SOH degradation trend. Among them, LightGBM achieves the best overall performance, with average MAE, RMSE, and R2 of 0.0032, 0.0037, and 91.36%, respectively. This result suggests that, given the current cycle-level feature inputs and the limited number of battery cells, nonlinear tree-based models are well suited to multimodal features; LSTM can leverage sequential cycle information, but its stability remains constrained by sample size and input formulation.
- (4)
- Feature ablation experiments demonstrate that multimodal fusion substantially outperforms single-type features. Compared with using only electrical features, the full set of five fused feature categories reduces the average RMSE by approximately 75.57%. Removing expansion-force features raises the average RMSE from 0.0036 to 0.0064 and lowers the average R2 from 91.83% to 75.66%, confirming the important contribution of expansion-force features to SOH estimation. The dF/dQ features provide local information on mechanical responses as a function of capacity, but they show some overlap with expansion-force features in the present dataset; further validation of their independent contribution using additional battery samples is warranted.
The findings of this work indicate that incorporating expansion force and its differential features into SOH estimation for large-capacity energy-storage batteries holds practical engineering value. Future research can expand the battery brands, capacity specifications, and operating conditions, combine impedance testing, post-mortem analysis, or material characterization to verify the correspondence between expansion-force features and specific degradation mechanisms, and explore lightweight multimodal SOH estimation methods suitable for online deployment.
Author Contributions
Conceptualization, R.H.; methodology, J.H.; validation, R.H. and J.H.; writing—original draft preparation, R.H. and J.H.; writing—review and editing, R.H. and L.W.; funding acquisition, R.H., S.Y. and M.W. All authors have read and agreed to the published version of the manuscript.
Funding
This research was funded by the Scientific Research Program Funded by Education Department of Shaanxi Provincial Government, grant number 24JK0542, and the National Natural Science Foundation of China, grant number 52407253, the China Postdoctoral Science Foundation (No. 2025M781270); the Guangdong Basic and Applied Basic Research Foundation (No. 2024A1515110117); and the Fundamental Research Funds for the Central Universities and the Interdisciplinary Research Project for Young Teachers of University of Science and Technology Beijing (No. FRF-IDRY-24-005).
Data Availability Statement
Data will be made available on request.
Conflicts of Interest
The authors declare no conflicts of interest.
Abbreviations
The following abbreviations are used in this manuscript:
| LFP | Lithium iron phosphate |
| SOH | State of health |
| PINN | Physics-informed neural network |
| DV | Differential voltage |
| IC | Incremental capacity |
| RPT | Reference performance tests |
References
- Li, Y.; Ding, S.; Wang, L.; Wang, W.; Lin, C.; He, X. On safety of swelled commercial lithium-ion batteries: A study on aging, swelling, and abuse tests. eTransportation 2024, 22, 100368. [Google Scholar] [CrossRef] [Scilit]
- Shi, C.; Zhu, D.; Zhang, L.; Song, S.; Sheldon, B.W. Transfer learning prediction on lithium-ion battery heat release under thermal runaway condition. Nano Res. Energy 2024, 3, e9120147. [Google Scholar] [CrossRef] [Scilit]
- Li, Q.; Song, R.; Wei, Y. A review of state-of-health estimation for lithium-ion battery packs. J. Energy Storage 2025, 118, 116078. [Google Scholar] [CrossRef] [Scilit]
- Cao, Y.; Wang, H.; Cao, J.; Li, H.; Liu, B. Mechanistic insights into the in-plane swelling of lithium-ion battery from electrode to cell. Energy Storage Mater. 2025, 83, 104712. [Google Scholar] [CrossRef] [Scilit]
- Fan, G.; Zhang, X. Battery capacity estimation using 10-second relaxation voltage and a convolutional neural network. Appl. Energy 2023, 330, 120308. [Google Scholar] [CrossRef] [Scilit]
- Huang, S.; Wang, X.; Kang, L.; Xie, D.; Zhang, X. State of Health Estimation for Lithium-Ion Battery Using Partial Incremental Capacity Curve and Transfer Learning. Batteries 2024, 10, 324. [Google Scholar] [CrossRef] [Scilit]
- Dong, G.; Hua, N.; Chen, H.; Lou, Y. Deep Transfer Learning Enabled State of Health Estimation of Lithium-Ion Battery Using Voltage Sample Entropy Under Fast Charging Profiles. IEEE Trans. Transp. Electrif. 2025, 11, 3703–3714. [Google Scholar] [CrossRef] [Scilit]
- Cao, Z.; Gao, W.; Fu, Y.; Kurdkandi, N.V.; Mi, C. A general framework for lithium-ion battery state of health estimation: From laboratory tests to machine learning with transferability across domains. Appl. Energy 2025, 381, 125086. [Google Scholar] [CrossRef] [Scilit]
- Chen, Y.; Huang, X.; He, Y.; Zhang, S.; Cai, Y. Edge-cloud collaborative estimation lithium-ion battery SOH based on MEWOA-VMD and Transformer. J. Energy Storage 2024, 99, 113388. [Google Scholar] [CrossRef] [Scilit]
- Song, S.; Zhang, C.; Song, C.; Duan, W.; Xiao, F.; Jin, L.; Qi, C. A Deep Learning Hybrid Model for Battery State of Health Estimation Based on Reconstructed Current and Voltage Vurves. Automot. Innov. 2026. [Google Scholar] [CrossRef] [Scilit]
- Jin, S.; Guo, J.; Sui, X.; Huang, X.; Wang, S.; He, X.; Stroe, D.I. Identification of Lithium-Ion Battery Degradation Mechanisms During Pulsed Current Charging Through Non-invasive and Post-Mortem Analysis. Automot. Innov. 2026, 9, 228–241. [Google Scholar] [CrossRef] [Scilit]
- Zheng, S.; Teh, J.; Alharbi, B.; Lai, C.M. A review of equivalent-circuit model, degradation characteristics and economics of Li-ion battery energy storage system for grid applications. J. Energy Storage 2024, 101, 113908. [Google Scholar] [CrossRef] [Scilit]
- Singh, S.; Ebongue, Y.E.; Rezaei, S.; Birke, K.P. Hybrid modeling of lithium-ion battery: Physics-informed neural network for battery state estimation. Batteries 2023, 9, 301. [Google Scholar] [CrossRef] [Scilit]
- Lin, C.; Tuo, X.; Wu, L.; Zhang, G.; Lyu, Z.; Zeng, X. Physics-informed machine learning for accurate SOH estimation of lithium-ion batteries considering various temperatures and operating conditions. Energy 2025, 318, 134937. [Google Scholar] [CrossRef] [Scilit]
- Lin, C.; Wu, L.; Tuo, X.; Liu, C.; Zhang, W.; Huang, Z.; Zhang, G. A lightweight two-stage physics-informed neural network for SOH estimation of lithium-ion batteries with different chemistries. J. Energy Chem. 2025, 105, 261–279. [Google Scholar] [CrossRef] [Scilit]
- Wang, S.; Zhou, R.; Ren, Y.; Liu, H.; Lin, Y.; Lian, C. A generalizable physics-informed neural network for lithium-ion battery SOH estimation utilizing partial charging segments. J. Energy Chem. 2026, 112, 977–986. [Google Scholar] [CrossRef] [Scilit]
- Luo, Y.; Ju, S.; Li, P.; Zhang, H. A method for estimating lithium-ion battery state of health based on physics-informed hybrid neural network. Electrochim. Acta 2025, 525, 146110. [Google Scholar] [CrossRef] [Scilit]
- Xu, Q.; Wang, X.; Ye, H.; Gong, L.; Tan, P.; Pan, T. An accurate state of health estimation method for lithium-ion batteries based on expansion force analysis. Energy 2025, 325, 136155. [Google Scholar] [CrossRef] [Scilit]
- Huang, J.; Zhu, G.; Guo, D.; Huang, J.; Xiao, P.; Liu, T. Study on the extreme early warning method of thermal runaway utilizing li-ion battery strain. Appl. Energy 2025, 384, 125494. [Google Scholar] [CrossRef] [Scilit]
- Zhu, K.; Wang, T.; Wu, Y.; Luo, J.; Huang, Y. Comprehensive aging model coupling chemical and mechanical degradation mechanisms for NCM/C6-Si lithium-ion batteries. Energy Storage Mater. 2024, 71, 103620. [Google Scholar] [CrossRef] [Scilit]
- Bang, J.; Chun, B.; Kim, M.; Lim, J.; Han, Y.; So, H. Rapid thermal runaway detection of lithium-ion battery via swelling-based state-of-charge monitoring using piezoresistive sponge sensor. eTransportation 2025, 24, 100404. [Google Scholar] [CrossRef] [Scilit]
- Makki, M.; Lee, C.W.; Ayoub, G. Stress distribution inside a lithium-ion battery cell during fast charging and its effect on degradation of separator. Batteries 2023, 9, 502. [Google Scholar] [CrossRef] [Scilit]
- Zhang, Y.; Lai, X.; Zhang, X.; Fan, Y.; Cheng, E.; Zheng, Y.; Tang, X.; Tang, B.; Zhu, Z. Fusion of stress and electrical signals for high-accuracy joint estimation of SOC and SOH in lithium-ion batteries. Energy 2025, 331, 137063. [Google Scholar] [CrossRef] [Scilit]
- Zhang, Y.; Zhang, W.; Kong, W. Numerical and experimental study on thermal behavior of prismatic lithium-ion battery for large-capacity energy storage. J. Energy Storage 2024, 83, 110620. [Google Scholar] [CrossRef] [Scilit]
- Kumar, R.S.; Jithin, K.V.; Rajesh, P.K. Lithium-ion ferrous phosphate prismatic cell aging analysis and assessment for the development of battery management systems. J. Energy Storage 2023, 70, 108093. [Google Scholar] [CrossRef] [Scilit]
- Zhou, H.; Yang, Y.; Zhang, Z.; Wang, W.; Yang, L.; Du, X. Charge and discharge strategies of lithium-ion battery based on electrochemical-mechanical-thermal coupling aging model. J. Energy Storage 2024, 99, 113484. [Google Scholar] [CrossRef] [Scilit]
- Zhou, H.; Yang, Y.; Song, Y.; Wang, W.; Yang, L.; Du, X. Capacity degradation of NMC/graphite battery based on electrochemical-mechanical-thermal coupling aging model. J. Energy Storage 2025, 135, 118249. [Google Scholar] [CrossRef] [Scilit]
- Wang, R.; Lin, H.; Choi, J.; Hashemi, A.; Zhu, M. Novel differential voltage features based machine learning approach to lithium-ion batteries SOH prediction at various C-rates. Energy 2025, 334, 137651. [Google Scholar] [CrossRef] [Scilit]
- Xia, F.; Wang, K.; Chen, J. State of health and remaining useful life prediction of lithium-ion batteries based on a disturbance-free incremental capacity and differential voltage analysis method. J. Energy Storage 2023, 64, 107161. [Google Scholar] [CrossRef] [Scilit]
- Li, H.; Chen, C. Lithium-ion battery SOH prediction based on multi-dimensional features and multi-model feature selector. Energy 2025, 331, 136844. [Google Scholar] [CrossRef] [Scilit]
- Du, X.; Meng, J.; Amirat, Y.; Gao, F.; Benbouzid, M. Feature selection strategy optimization for lithium-ion battery state of health estimation under impedance uncertainties. J. Energy Chem. 2025, 101, 87–98. [Google Scholar] [CrossRef] [Scilit]
- Li, X.; Zhao, J.; Yang, L.; Zhang, W. Study on lithium-ion battery state of health estimation through multiobjective feature selection and multivariate analysis. Energy Rep. 2025, 13, 3035–3049. [Google Scholar] [CrossRef] [Scilit]
- Jiang, B.; Zhu, Y.; Zhu, J.; Wei, X.; Dai, H. An adaptive capacity estimation approach for lithium-ion battery using 10-min relaxation voltage within high state of charge range. Energy 2023, 263, 125802. [Google Scholar] [CrossRef] [Scilit]
- Ko, C.J.; Chen, K.C. Using tens of seconds of relaxation voltage to estimate open circuit voltage and state of health of lithium ion batteries. Appl. Energy 2024, 357, 122488. [Google Scholar] [CrossRef] [Scilit]
- Zheng, K.; Meng, J.; Yang, Z.; Zhou, F.; Yang, K.; Song, Z. Refined lithium-ion battery state of health estimation with charging segment adjustment. Appl. Energy 2024, 375, 124077. [Google Scholar] [CrossRef] [Scilit]
- Wang, T.; Wu, Y.; Zhu, K.; Cen, J.; Wang, S.; Huang, Y. Deep learning and polarization equilibrium based state of health estimation for lithium-ion battery using partial charging data. Energy 2025, 317, 134564. [Google Scholar] [CrossRef] [Scilit]
- Li, H.; Wang, S.; Yang, L.; Zhou, Z.; Meng, Y.; Zhang, W.; Shuan, Z.; Li, Y.; Lv, F. SOH estimation method for lithium-ion battery packs under real-world operating conditions based on a new attenuated model without additional experiments. Energy 2025, 330, 136802. [Google Scholar] [CrossRef] [Scilit]
- Geng, M.; Su, Y.; Liu, C.; Chen, L.; Huang, X. Interpretable deep learning with uncertainty quantification for lithium-ion battery SOH estimation. Energy 2025, 335, 138027. [Google Scholar] [CrossRef] [Scilit]
- Chen, X.; Yang, H.; Pan, C.; Jia, Z.; Wang, Z. A vehicle-cloud collaborative framework for state of health estimation of lithium-ion batteries via multi-feature fusion and hybrid data-driven-empirical modeling. Energy 2025, 340, 139287. [Google Scholar] [CrossRef] [Scilit]
- Bao, Z.; Luo, T.; Gao, M.; He, Z.; Yang, Y.; Nie, J. A multiple aging factor interactive learning framework for lithium-ion battery state-of-health estimation. Eng. Appl. Artif. Intell. 2025, 148, 110388. [Google Scholar] [CrossRef] [Scilit]
- Ling, L.; Yang, S.; Tong, S. Lithium-ion battery state of health estimation based on statistical features derived from voltage and temperature probability density functions under realistic randomized cycling conditions. J. Energy Storage 2025, 137, 118496. [Google Scholar] [CrossRef] [Scilit]
- Zhao, J.; Zhang, X.; Hu, C. Lithium-ion battery state of health estimation using voltage-position encoding CNN and incremental capacity analysis with a novel smoothing parameter selection strategy. J. Energy Storage 2025, 130, 117296. [Google Scholar] [CrossRef] [Scilit]
- Pandit, R.; Ahlawat, N. A standardized comparative framework for machine learning techniques in lithium-ion battery state of health estimation. Future Batter. 2025, 7, 100099. [Google Scholar] [CrossRef] [Scilit]
- Ren, Z.; Du, C. A review of machine learning state-of-charge and state-of-health estimation algorithms for lithium-ion batteries. Energy Rep. 2023, 9, 2993–3021. [Google Scholar] [CrossRef] [Scilit]
- Madani, S.S.; Shabeer, Y.; Fowler, M.; Panchal, S.; Chaoui, H.; Mekhilef, S.; Dou, S.X.; See, K. Artificial intelligence and digital twin technologies for intelligent lithium-ion battery management systems: A comprehensive review of state estimation, lifecycle optimization, and cloud-edge integration. Batteries 2025, 11, 298. [Google Scholar] [CrossRef] [Scilit]
- Zhang, Q.; Zhu, J.; Wang, Y.; Wei, X.; Dai, H. A Model Cluster Adapting to Different Charge Voltage Segments for Battery Capacity Estimation. Automot. Innov. 2025, 8, 753–768. [Google Scholar] [CrossRef] [Scilit]

Disclaimer/Publisher’s Note: The statements, opinions and data contained in all publications are solely those of the individual author(s) and contributor(s) and not of MDPI and/or the editor(s). MDPI and/or the editor(s) disclaim responsibility for any injury to people or property resulting from any ideas, methods, instructions or products referred to in the content. |
© 2026 by the authors. Licensee MDPI, Basel, Switzerland. This article is an open access article distributed under the terms and conditions of the Creative Commons Attribution (CC BY) license.