


Abstract
Electrochemical Impedance Spectroscopy (EIS) is a non-destructive technique for characterizing the battery behavior for estimating the state of health (SOH). EIS provides frequency-domain information on key parameters, including solid electrolyte interphase (SEI) resistance, charge-transfer (CT) resistance, and ohmic resistance, which are sensitive to battery degradation mechanisms. In an EIS test, a sinusoidal excitation signal is applied to the battery, and the corresponding voltage response is analyzed to extract the impedance spectrum. The reliability of SOH estimation therefore depends critically on the accurate and repeatable extraction of impedance features. This paper investigates the variability in impedance spectra arising from the state of charge (SOC), temperature, rest time, and repeated measurements under nominally identical conditions. This variability is identified as drift and represents previously underexplored variations in the impedance spectrum. To quantify these variations, this work proposes a normalized resistance-based index that captures changes in the impedance spectrum using estimated equivalent circuit model (ECM) parameters. The proposed index is applicable across battery chemistries, sizes, and operating conditions. It is evaluated using published datasets spanning different chemistries, SOC levels, and temperatures, as well as laboratory data collected from repeated EIS experiments. The results show that even at fixed SOC and temperature, repeated measurements can produce measurable bias and variance in ECM parameters. These findings highlight the importance of accounting for drift in EIS analysis and motivate uncertainty-aware battery diagnostics for practical SOH monitoring systems.
1. Introduction
Electrochemical Impedance Spectroscopy (EIS) is a non-invasive, frequency-domain diagnostic technique that characterizes the dynamic response of electrochemical systems by applying a small-amplitude AC perturbation and measuring the resulting voltage or current over a wide range of frequencies [1,2]. The resulting impedance spectrum acts as a unique fingerprint of the system, encapsulating diverse electrochemical and physical phenomena, such as charge transfer resistance, double-layer capacitance, diffusion impedance, and solid electrolyte interphase (SEI) behavior [3]. In lithium-ion batteries, EIS has long been used for battery characterization, equivalent circuit parameter extraction, and fault detection [4]. More recently, EIS has been recognized for its value in battery management systems (BMS) for estimating the state of health (SOH), owing to its ability to capture subtle degradation signatures that are often missed by time-domain diagnostics like voltage relaxation or incremental capacity analysis [2,4].
Several methods have been developed to extract SOH-relevant features from EIS data. A widely adopted approach is to fit the impedance spectrum to an equivalent circuit model (ECM) [5], such as a Randles circuit, which yields interpretable parameters like ohmic resistance, SEI resistance, charge transfer (CT) resistance, double layer (DL) capacitance, and Warburg diffusion coefficients. These parameters evolve in characteristic ways with aging and are often used as inputs to predictive models. Similarly, the distribution of relaxation times (DRT) method deconvolves the impedance spectrum into a set of relaxation processes, helping to isolate overlapping degradation mechanisms, such as SEI growth and ion transport limitations [6]. While both ECM and DRT methods provide valuable physical insights, they require full-spectrum EIS measurements and iterative numerical fitting, making them less suitable for real-time or embedded applications. To address this, alternative methods have emerged that use impedance at a single frequency or a small number of characteristic frequencies. These approaches reduce measurement time and computational overhead [7] while retaining sensitivity to key aging phenomena, making them promising for integration into practical SOH monitoring systems.
With the increasing availability of high-quality EIS datasets, machine learning (ML) and deep learning (DL) models have become integral to SOH estimation [8,9]. These models can be trained using either physically derived features (e.g., ECM or DRT parameters) or the raw impedance spectra. Traditional ML algorithms, such as support vector regression (SVR) and shallow neural networks, have been used in conjunction with feature selection or optimization algorithms to map the extracted impedance features to SOH. More recently, deep learning architectures, such as convolutional neural networks (CNNs), recurrent neural networks (e.g., LSTM), and vision transformer (ViT)-based models, have enabled direct learning from high-dimensional impedance data [10]. These models excel at capturing complex nonlinear dependencies between spectral patterns and battery degradation, and some have demonstrated robustness across varying temperatures, state of charge (SOC) levels, and usage profiles. Similar EIS-informed data-driven diagnostic strategies have also been explored in other electrochemical systems, such as proton-exchange membrane fuel cells [11], further illustrating the broader relevance of impedance-derived features for SOH estimation.
While end-to-end models that consume raw impedance spectra can offer high accuracy, they often require large training datasets and lack interpretability. In contrast, analytical features derived from ECM or DRT methods are physically meaningful and often generalize better across cells and operating conditions, even with limited training data. Moreover, reduced-feature set approaches based on carefully chosen frequencies strike a balance between accuracy, interpretability, and computational efficiency. As a result, there is growing interest in using these analytical or semi-analytical features as inputs to ML models, especially in resource-constrained or safety-critical environments [12]. These hybrid strategies, rooted in electrochemical understanding yet powered by data-driven learning, present a compelling direction for the deployment of EIS-based SOH diagnostics in future battery management systems.
While analytical features derived from EIS data offer interpretability and reduced model complexity, their usefulness is highly dependent on the accuracy and consistency with which they are extracted. Improperly or inconsistently extracted features can introduce significant uncertainty into the SOH estimation process. In Table 1, a detailed review of prior studies that have identified various sources of uncertainty in the EIS spectra is provided.
Table 1.
Summary of experimental studies investigating the variability in battery impedance spectrum.
For instance, even well-established features such as the CT resistance or SEI resistance can vary depending on the rest period prior to measurement, as batteries often require stabilization to reflect their true impedance characteristics. Additionally, sensor noise and resolution limitations in practical EIS measurement systems can distort feature values, particularly at low frequencies where measurement sensitivity decreases [20]. Furthermore, many EIS features are inherently dependent on operating conditions, such as SOC [13,29] and temperature [21,23,27]. If these conditions are not tightly controlled during data acquisition, or at least properly accounted for during feature interpretation, the extracted values may reflect environmental variation rather than genuine battery degradation. These uncertainties not only reduce the reliability of the estimated SOH but may also degrade the performance of machine learning models trained on such features. Therefore, it is critical to understand and quantify the uncertainty associated with the EIS feature extraction. Incorporating such uncertainty information into the estimation pipeline can improve robustness and enable probabilistic SOH predictions that better reflect real-world conditions.
In this paper, we address the critical need for uncertainty quantification in EIS-based analytical features used for battery SOH estimation. We develop mathematical models to characterize the variability of commonly used features, such as charge transfer resistance, SEI resistance, and ohmic impedance, under different operating conditions. By leveraging the available EIS datasets from the published literature, we show variations in the estimated parameters with respect to SOC, temperature, and rest duration. By systematically modeling the sources and magnitudes of variability in EIS features, this work contributes both to the reliability of SOH predictions and to the broader development of uncertainty-aware battery management algorithms.
In addition to the statistical uncertainty model used in this paper to attribute ohmic and diffusion resistance uncertainties, the broader uncertainty quantification framework developed by the authors also includes a total resistance uncertainty model, a capacitance uncertainty model, and a Warburg impedance uncertainty model. A preliminary overview of these uncertainty quantification approaches was introduced in the authors’ earlier conference paper [44]. The conference paper primarily presented the conceptual framework and simulation-based analysis of the proposed statistical models for describing uncertainty in electrochemical impedance spectroscopy (EIS). The present manuscript substantially extends that earlier work by providing experimental validation and practical evaluation of the proposed methods.
2. Materials and Methods
2.1. EIS Variability Modeling
In this section, we introduce parameters to capture the variability in the Nyquist plots due to various factors summarized in Table 1.
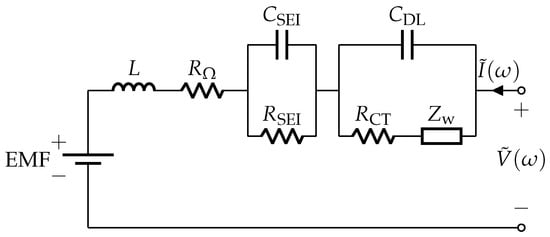
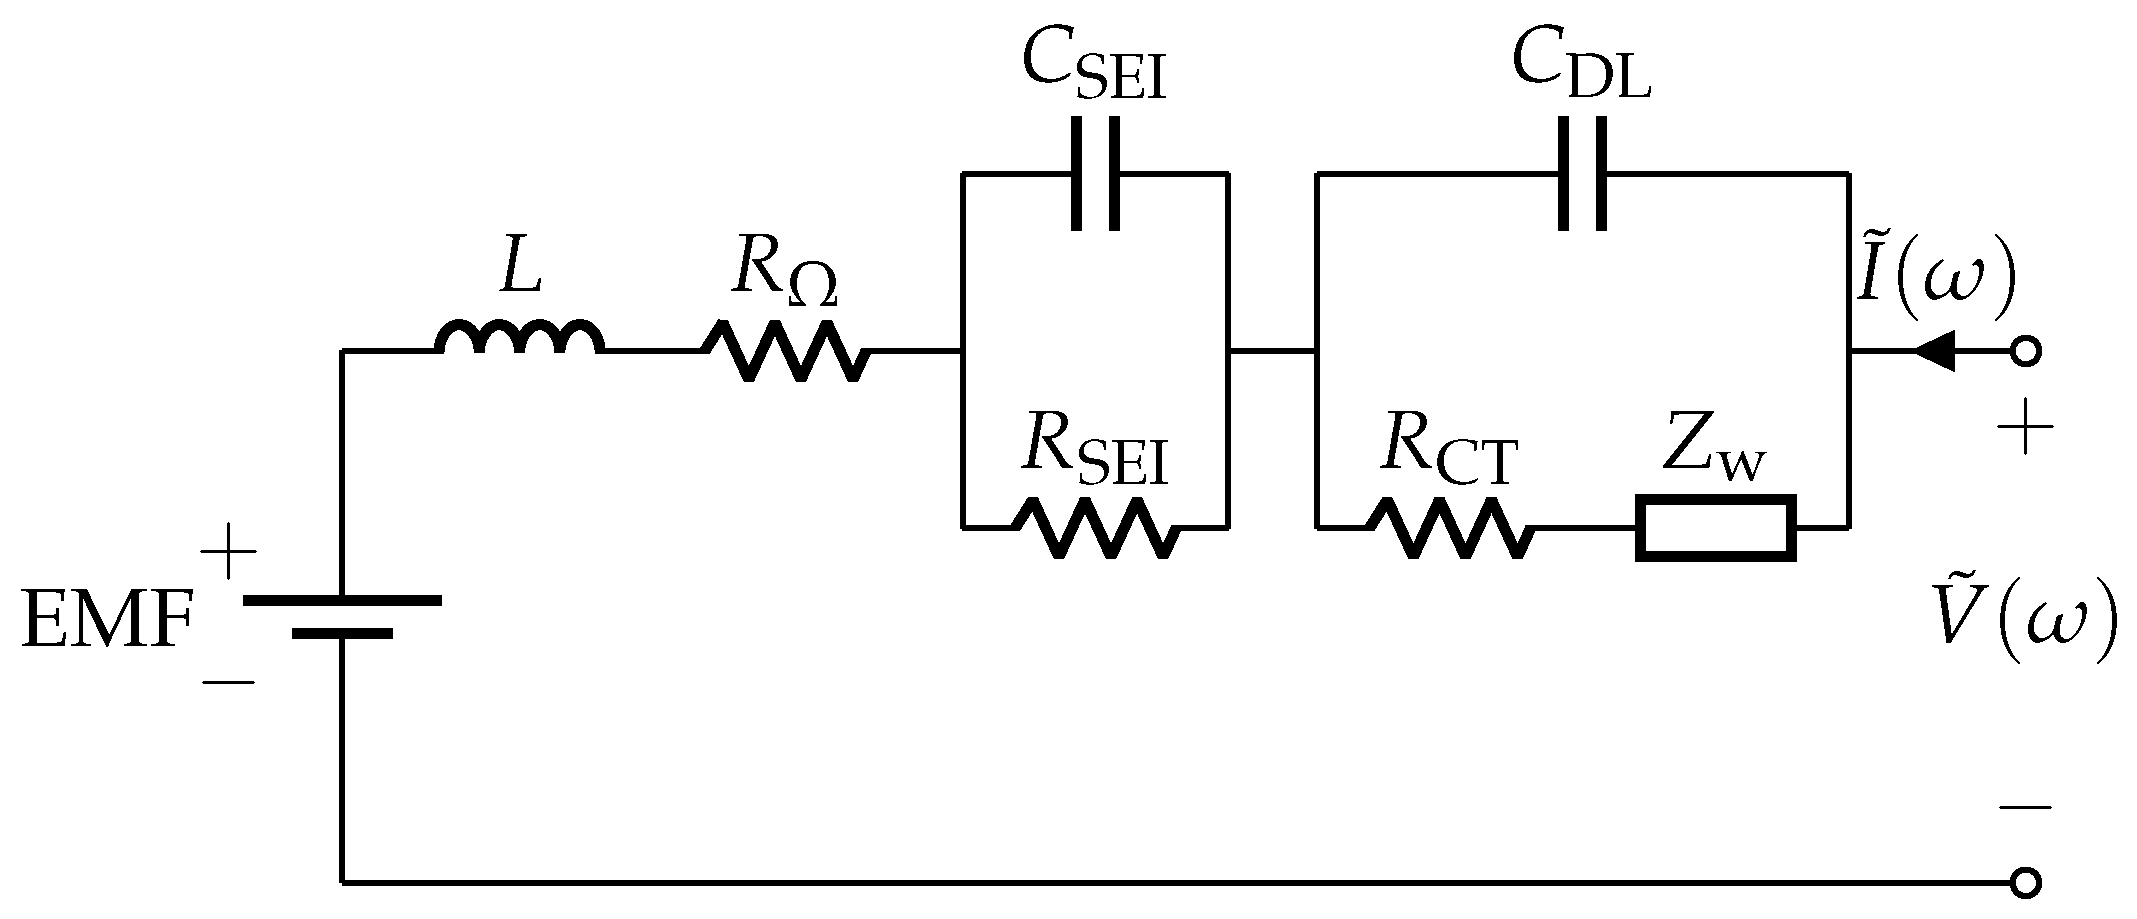
Figure 1 shows the adaptive Randles equivalent circuit model (AR-ECM) of a battery. The AR-ECM is selected in this study because it is a widely used equivalent circuit model for battery electrochemical impedance and provides sufficient accuracy while maintaining low model complexity. The EMF component represents the electromotive force of the battery, which is also known as the open circuit voltage (OCV). The remainder of the AR-ECM consists of the following elements: stray inductance L, ohmic resistance , solid electrolyte interface (SEI) resistance , SEI capacitance , charge transfer (CT) resistance , double layer (DL) capacitance , and Warburg impedance Zw, which is modeled as
where is the Warburg coefficient and is the angular frequency.
Figure 1.
Adaptive Randles equivalent circuit model (AR-ECM) of a battery.
Consider a sinusoidal excitation current of frequency applied to the battery, and let the resulting voltage response be measured. After transforming both signals to the frequency domain, e.g., using the discrete Fourier transform (DFT), we denote the current excitation and the voltage response as
where and denote the current and voltage components consisting of the DC component () and AC component (). The AC impedance of the battery at frequency can then be written as
To construct a typical battery impedance response, the AC impedance given in (4) is computed across a wide range of frequencies, typically spanning from microhertz (μHz) to megahertz (MHz).
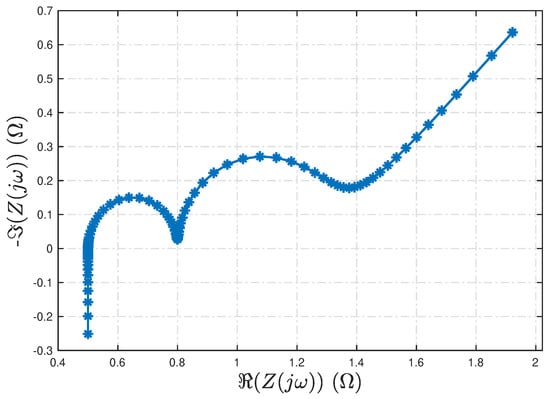
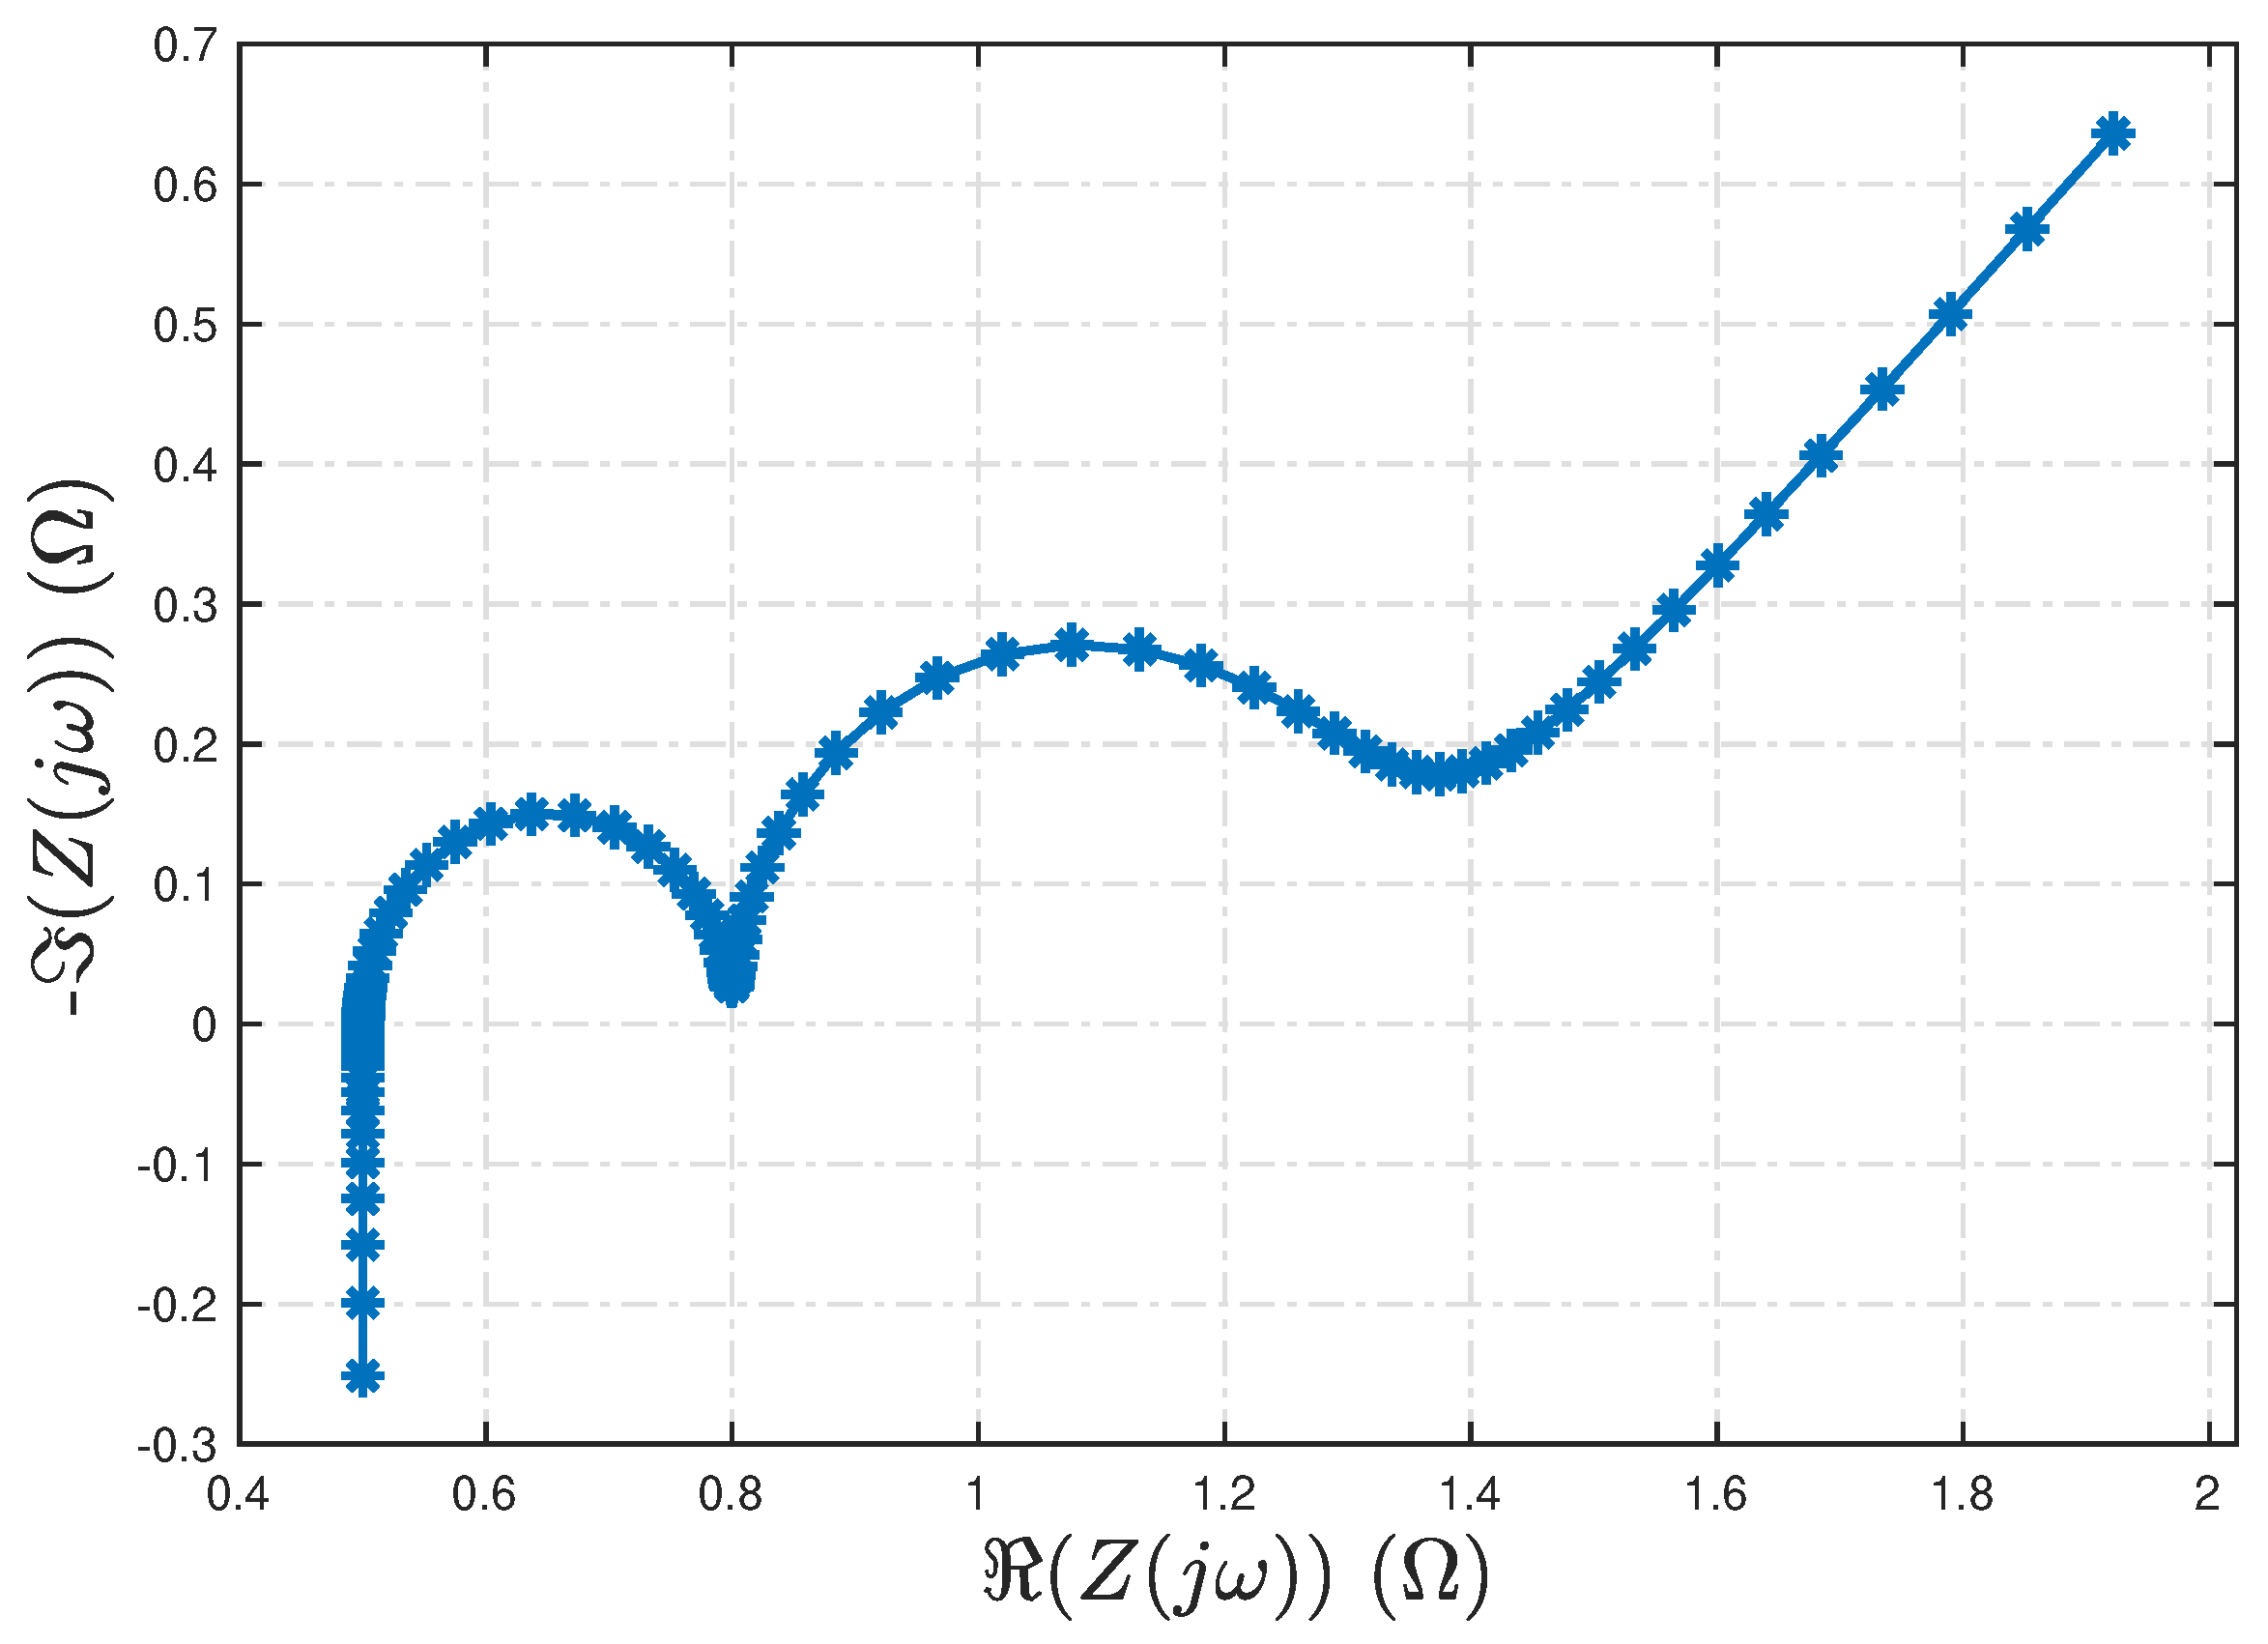
Figure 2 presents a baseline Nyquist plot of the AR-ECM shown in Figure 1, using the parameter values in Table 2. Here, the running parameter runs from right to left on the curve. All parameters of the AR-ECM can be identified from the corresponding Nyquist plot [45]. The frequency range used in Figure 2 spans from 10 μHz to 10 kHz.
Figure 2.
Baseline Nyquist plot corresponding to the AR-ECM parameters in Table 2.
Table 2.
Parameters of the AR-ECM.
2.1.1. Effect of Measurement Noise
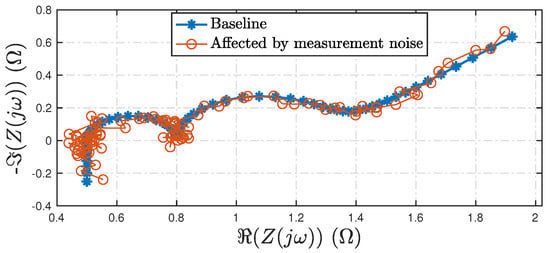
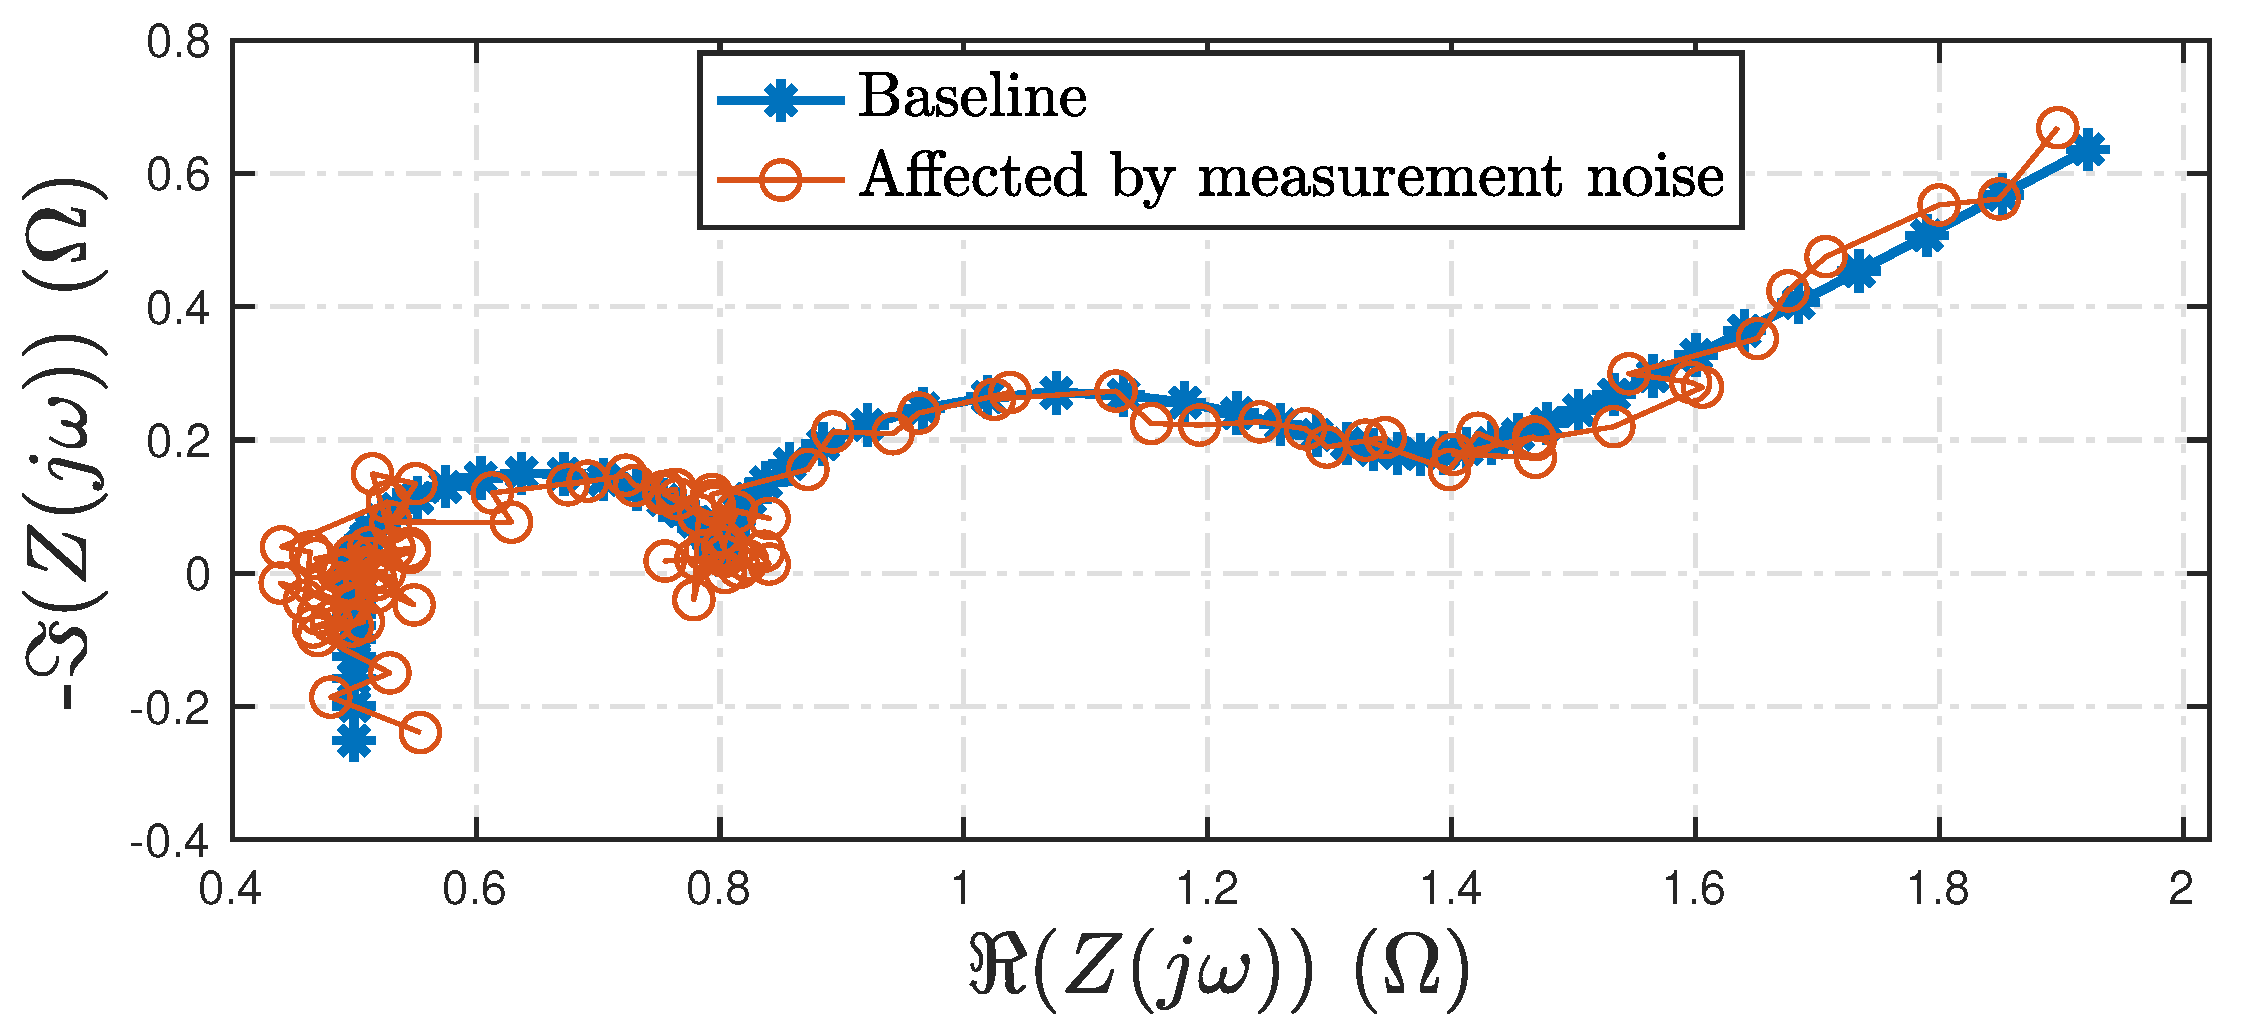
It was shown in [46] that the zero-mean property of voltage and current measurement noise is preserved under transformation to the frequency domain. Leveraging this property, Figure 3 illustrates the effect of measurement noise on the battery’s impedance spectrum. A distinctive feature of measurement noise is that it introduces increasing jitter in the Nyquist plot as the noise level rises. This feature is consistent with observations reported in the literature, where an increasing amount of measurement noise caused jittery features on the computed impedance spectrum [20].
Figure 3.
Effect of measurement noise in the baseline Nyquist plot in Figure 2.
2.1.2. Bias and Variation in the Resistance
Several of the observed changes and variations in the battery impedance spectrum outlined in Table 1 can be attributed to fluctuations in the ohmic and diffusion resistance, , which is defined as
To quantify the variations in the battery impedance spectrum, the resistances are expressed relative to a reference value as
where and represent the deviations from the reference values, and , respectively. Now, it is hypothesized that the deviations follow a Gaussian distribution with a mean (bias) and a standard deviation, denoted as
where
denotes the Gaussian distribution.
It should be noted that the Gaussian assumption is a working hypothesis and has not been rigorously validated. However, when considering cell-to-cell variability in large-scale battery systems, such an assumption may be a reasonable approximation [47,48,49].
The impedance of the battery consists of a real and imaginary impedance denoted as
where and denote the real and imaginary parts of the impedance, respectively. Under the Gaussian assumption, the impedance is rewritten as
where is an estimate of the impedance, is the true impedance, and is the uncertainty in the impedance.
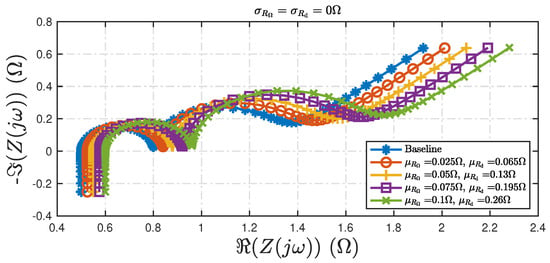
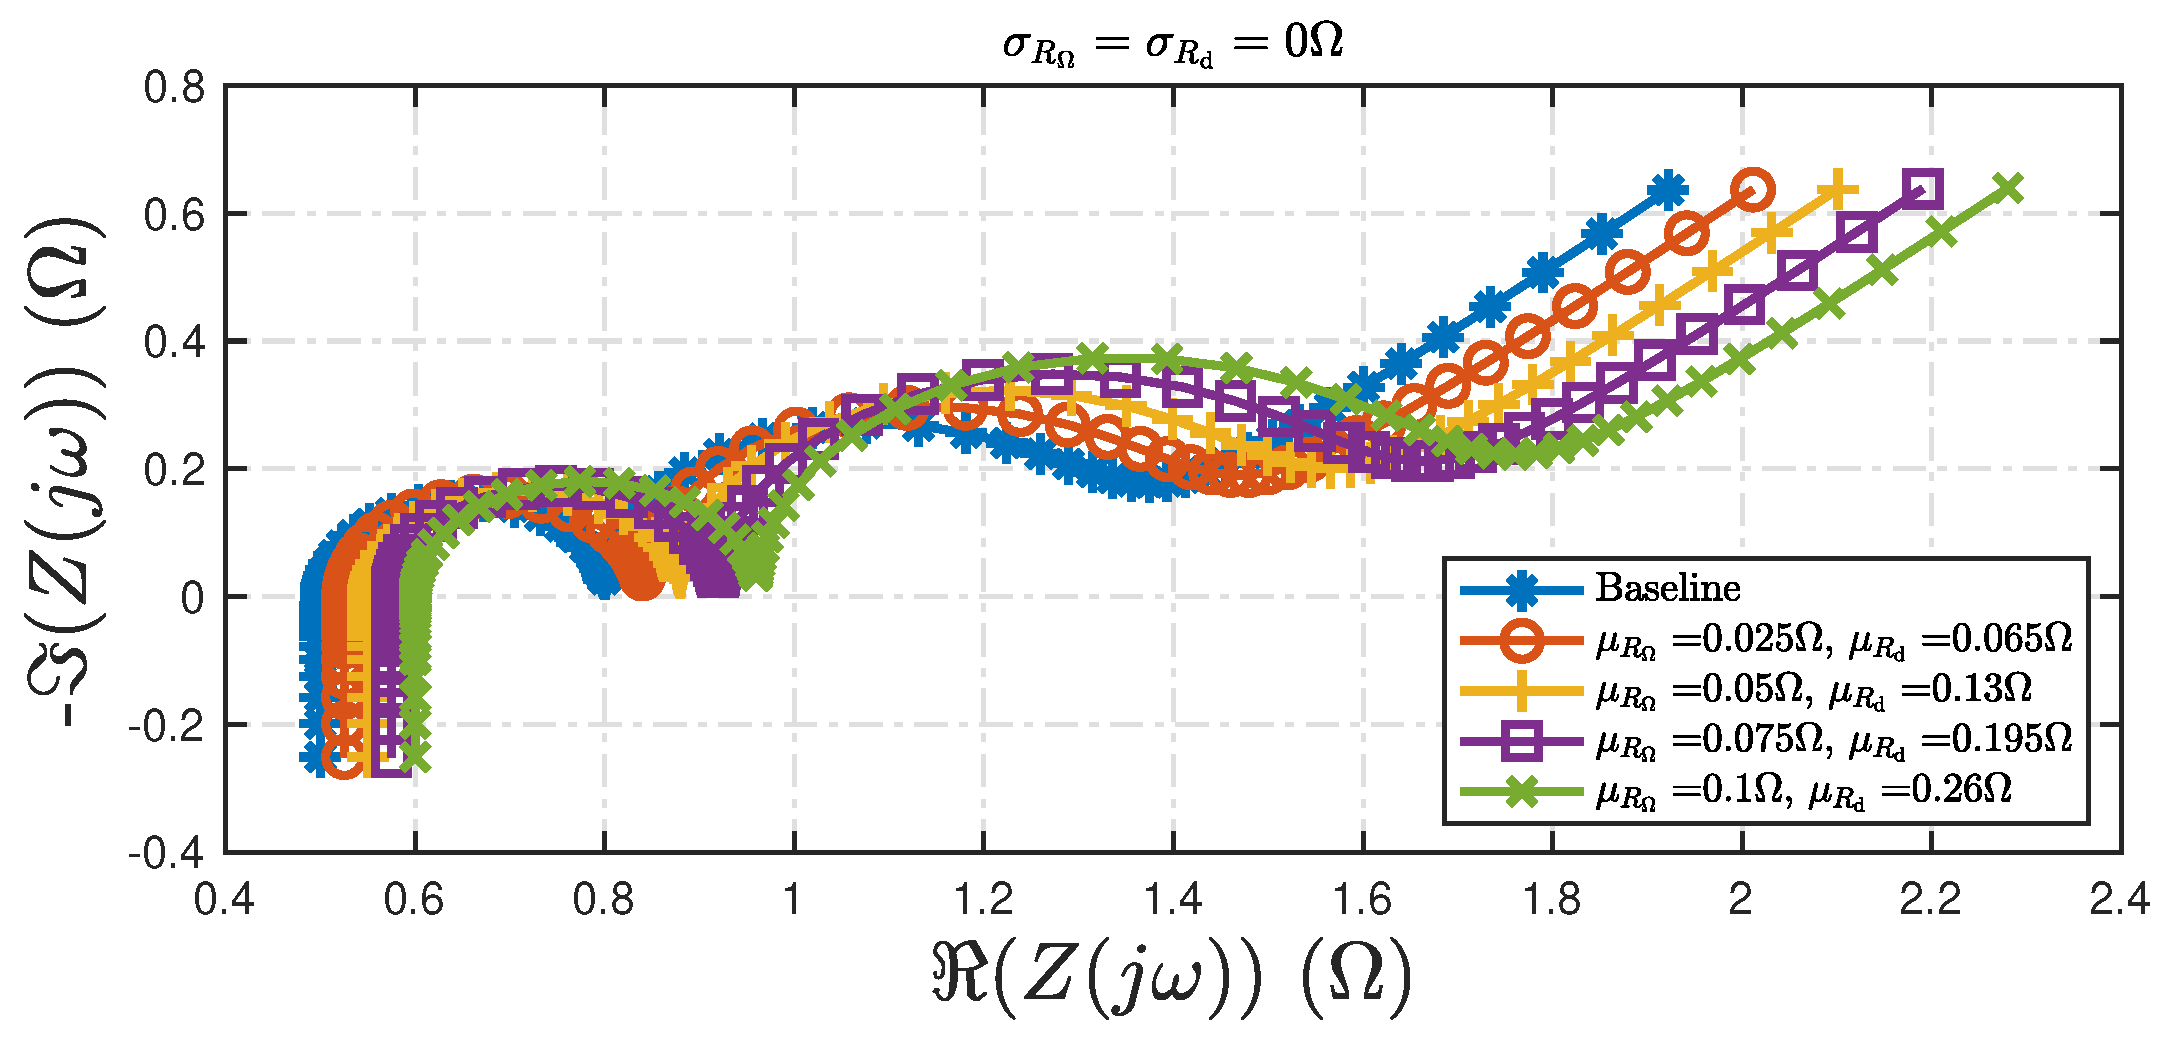
Figure 4 shows the variations in the impedance due to changes in the ohmic and diffusion resistances due to the bias effect. It can be observed from the varying bias values in Figure 4 that as the bias increases, the Nyquist plot exhibits a rightward drift, indicating an increase in the total resistance of the battery.
Figure 4.
Variations in the impedance spectrum due to different bias values for ohmic and diffusion resistances, and . It is assumed that .
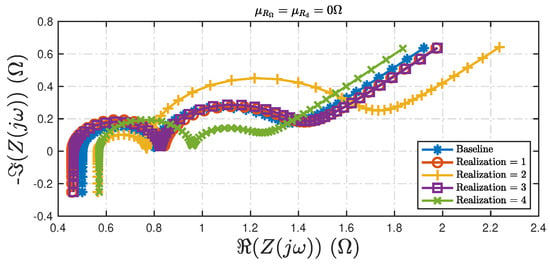
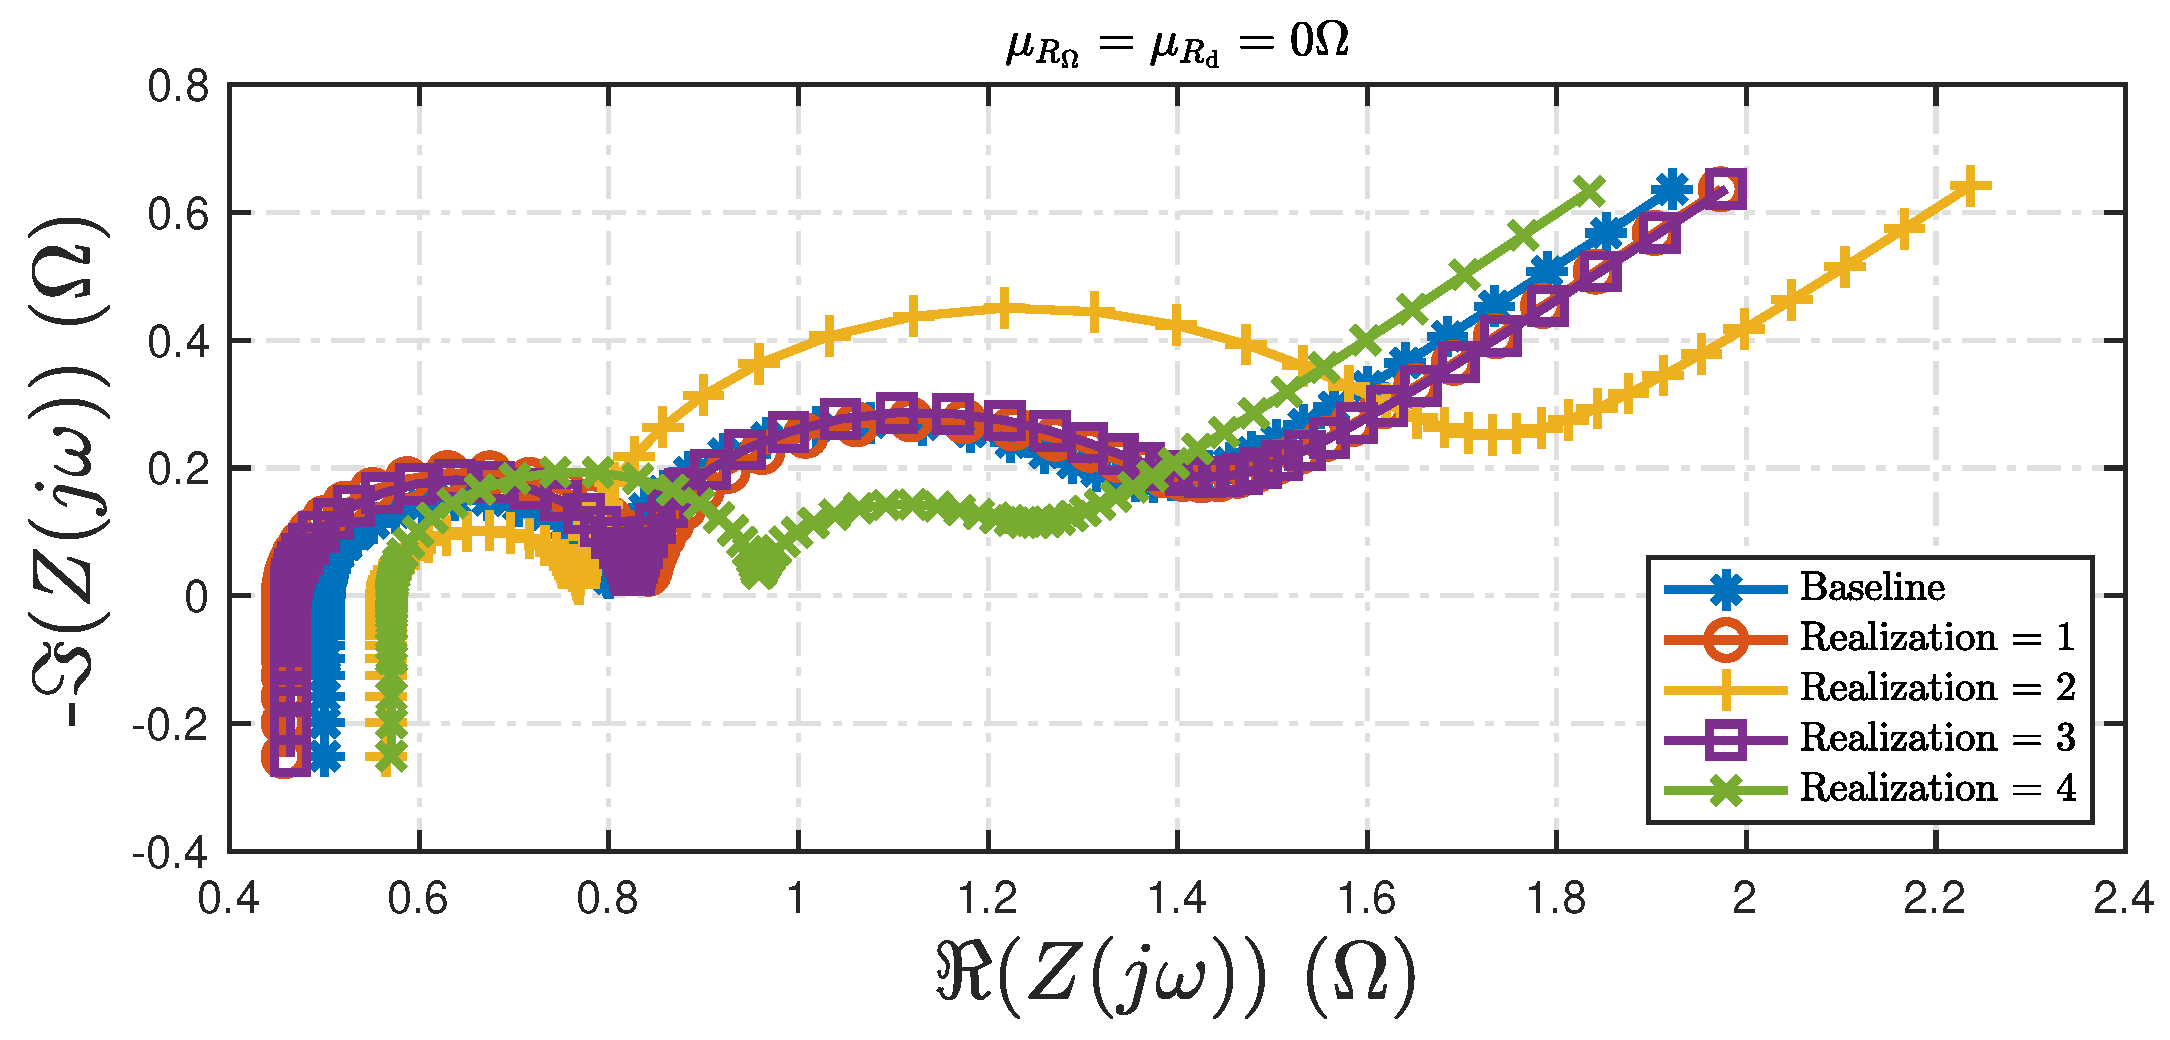
Figure 5 shows the variations in the impedance spectrum upon changes in the variance components, and . The key difference between Figure 4 and Figure 5 lies in the nature of the variability in the impedance spectrum. In Figure 4, the shift in the Nyquist plot is systematically correlated with the bias terms. In contrast, Figure 5 reflects random variations due to the variances, resulting in non-directional expansion or contraction of the impedance spectrum with respect to a certain factor.
Figure 5.
Variations in the impedance spectrum due to different variance values for ohmic and diffusion resistances, and . It is assumed that .
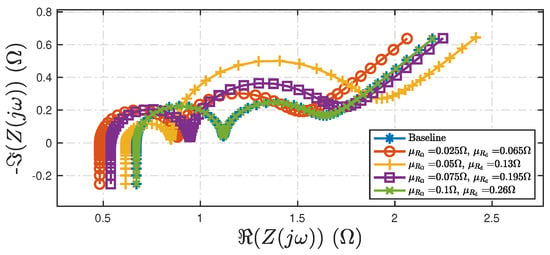
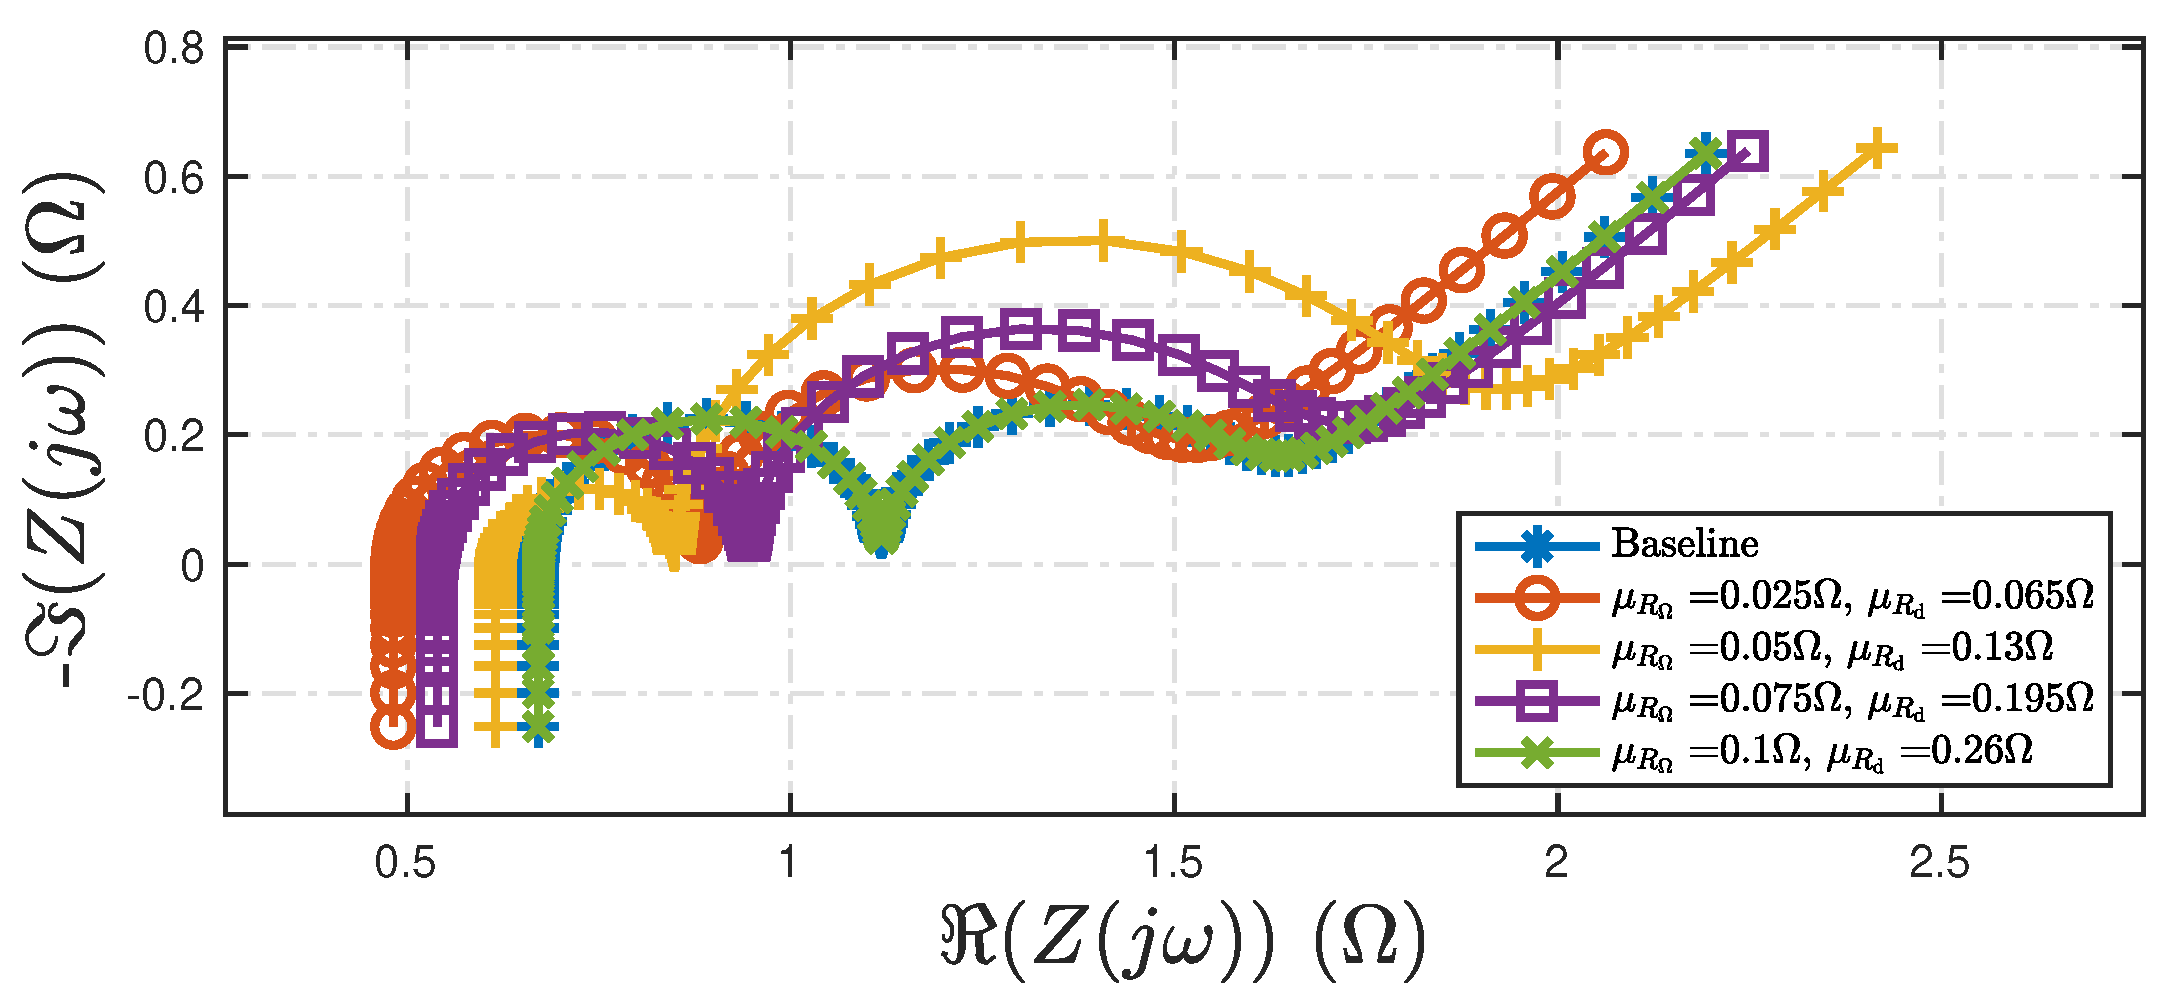
Finally, Figure 6 shows the variations in the impedance spectrum upon changes to both the bias and variance components for the assumed Gaussian distributions in (8) and (9).
From Figure 6, it can be noticed that both the bias and variance effects result in the non-directional expansion or contraction variations in the impedance spectrum, This behavior is consistent with trends reported in the literature, where an increase in has been associated with certain conditions such as a decrease in state of charge (SOC) [15].
2.2. EIS Variability Metric
This section uses data from two research articles ([13,35]) chosen from Table 1 to demonstrate the EIS variability models introduced in Section 2.1. The variability in the impedance spectrum observed in the existing literature is compared in terms of its ohmic and diffusion resistances.
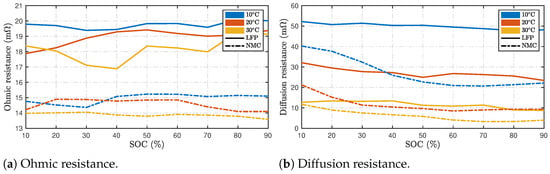
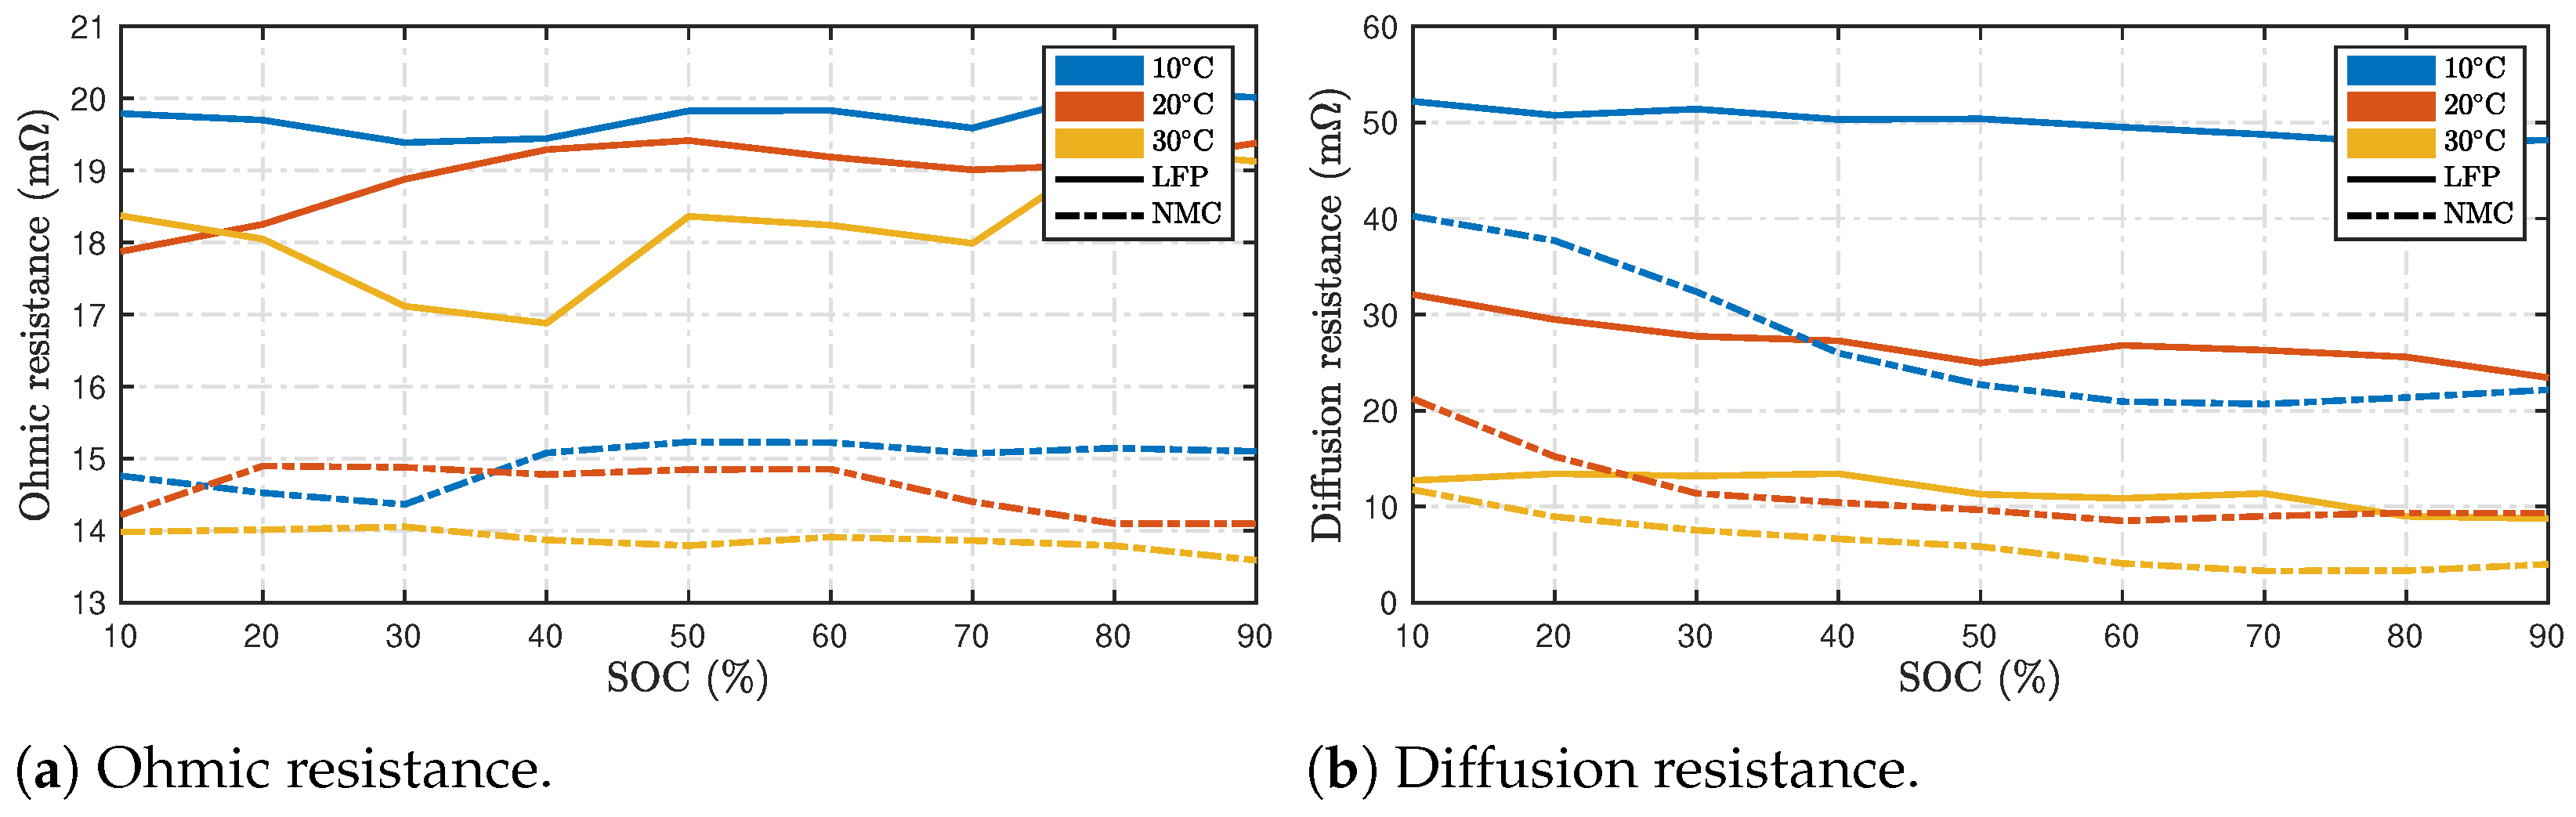
In [35], EIS experiments are conducted on LFP and NMC batteries at varying temperature ranges from 10 to 30 °C for the SOC ranges between 10 and 90%. Figure 7 summarizes the results of the ohmic and diffusion resistance recorded under these conditions. From Figure 7a, it can be noticed that the ohmic resistance is higher for the LFP batteries compared with NMC configurations at all temperatures. The diffusion resistance for the two batteries is observed to be within the range of 4 to 60 mΩ for the different experimental conditions.
Figure 7.
Estimated resistances recorded from [35].
More importantly, it can be observed from Figure 7 that the effect of temperature on the resistances is analogous to the impact of bias variations in the assumed distribution, as shown in Figure 4. Similarly, the effect of SOC on the resistances is comparable to the changes in the variance of the assumed distribution of the ohmic and diffusion resistances, as shown in Figure 5.
It can be observed from the comparison in Figure 7 that the individual impedances are recorded on varying scales, and that there is no single measure by which the resistances can be compared under different experimental conditions. This is also true for batteries of different chemistries and sizes. Further, due to cell-to-cell variations, the resistance of batteries of the same chemistry, size, and identical production procedures will have slightly different resistance values due to manufacturing process variations. Hence, there is a need to define a metric that is tolerant of these variations.
To normalize the total resistance and its variation, the following metric is defined
where is denoted as the ‘diffusion resistance’ in this paper. The d-ohm metric allows assessment of battery impedance and its variability using the resistances that contribute to the impedance spectrum. The metric is computed as a ratio against the ohmic resistance to ensure that it remains a stable and definitive metric for variation in impedance spectrum—it is because the ohmic resistance is relatively less sensitive to various factors than the diffusion resistance, as noted in Figure 7.
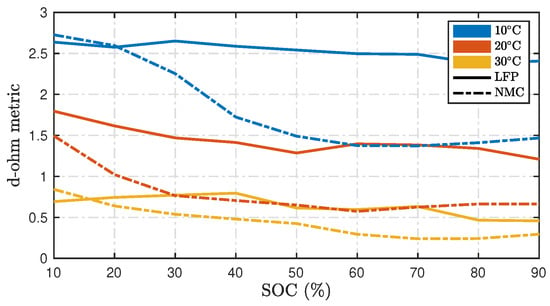
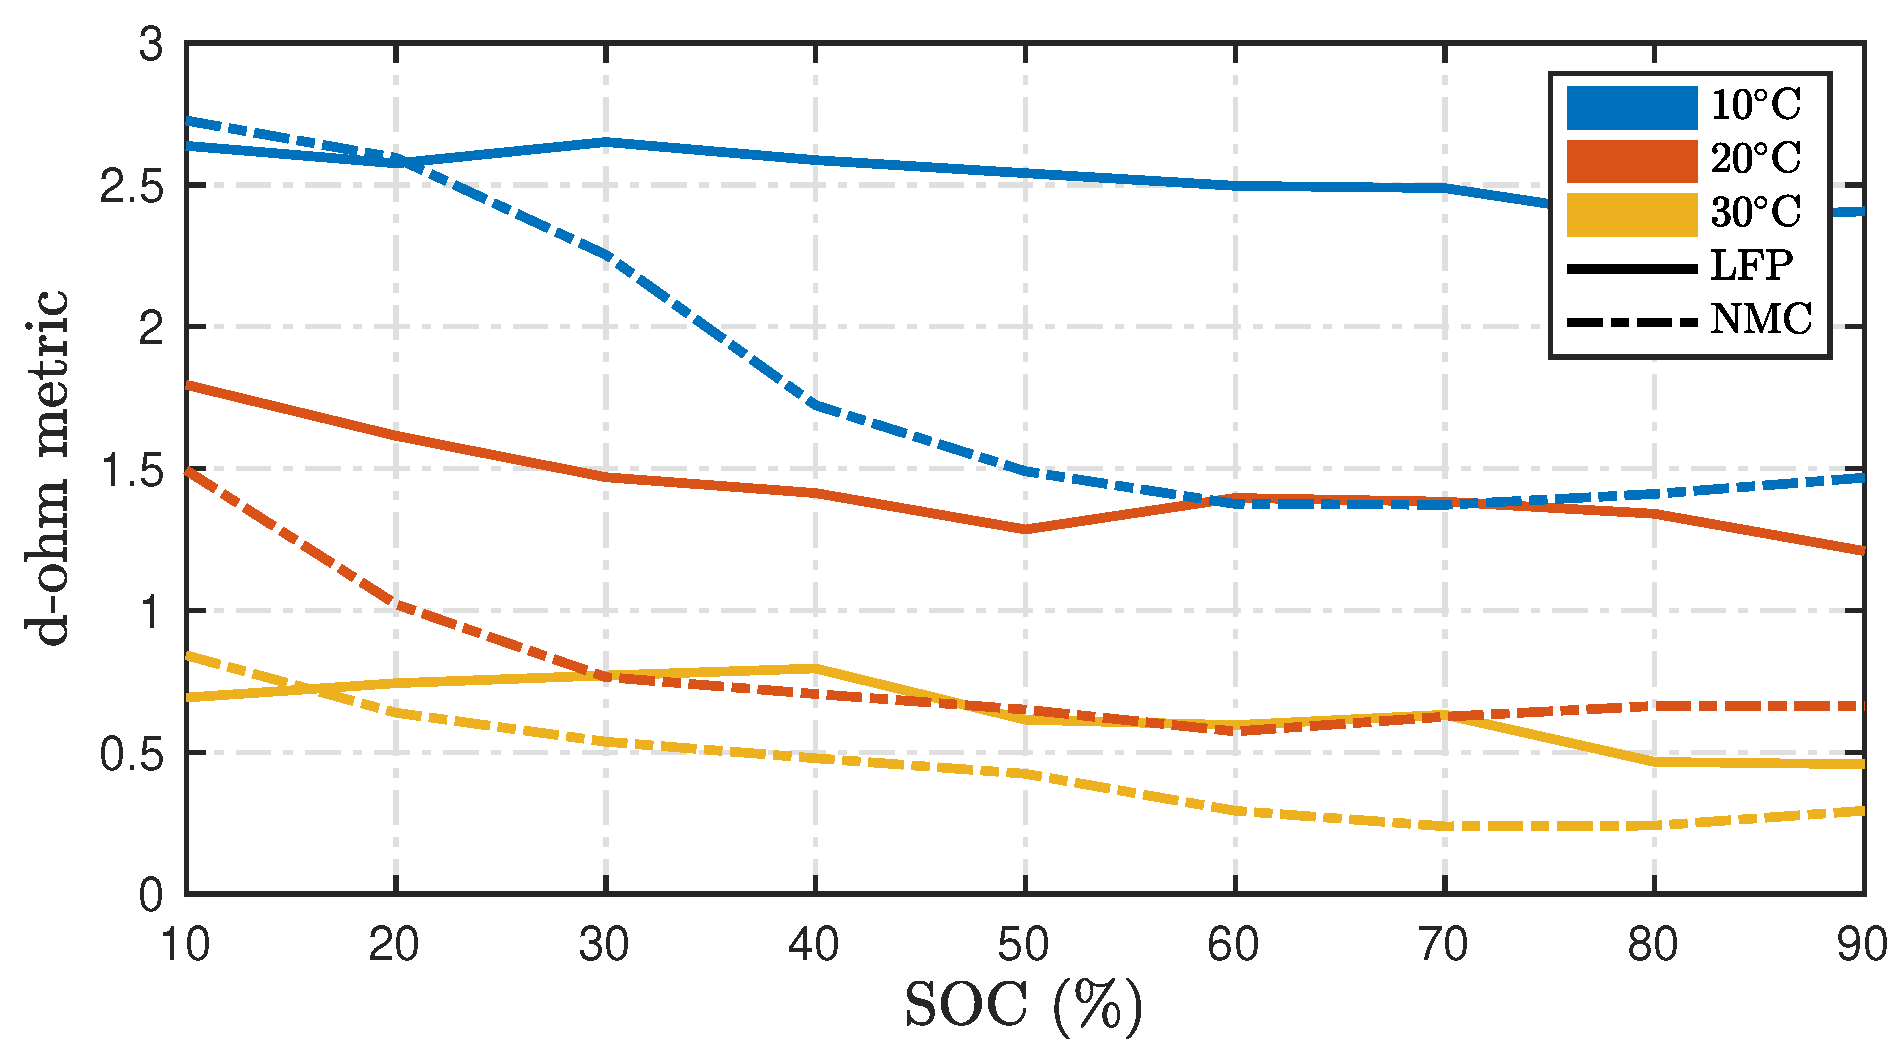
From Figure 8, it can be noticed that the d-ohm metric reduces as the temperature increases. The proposed metric allows for a direct comparison between LFP and NMC batteries, with LFP batteries generally exhibiting a slightly higher d-ohm than NMC batteries across all temperatures. Finally, it can be noted that the difference in the d-ohm values is most pronounced at lower temperatures for both LFP and NMC batteries, especially at lower SOCs for the NMC batteries.
Figure 8.
Proposed metric ‘d-ohm’ computed using (12) using estimated resistances recorded from [35].
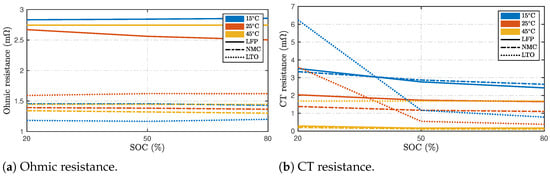
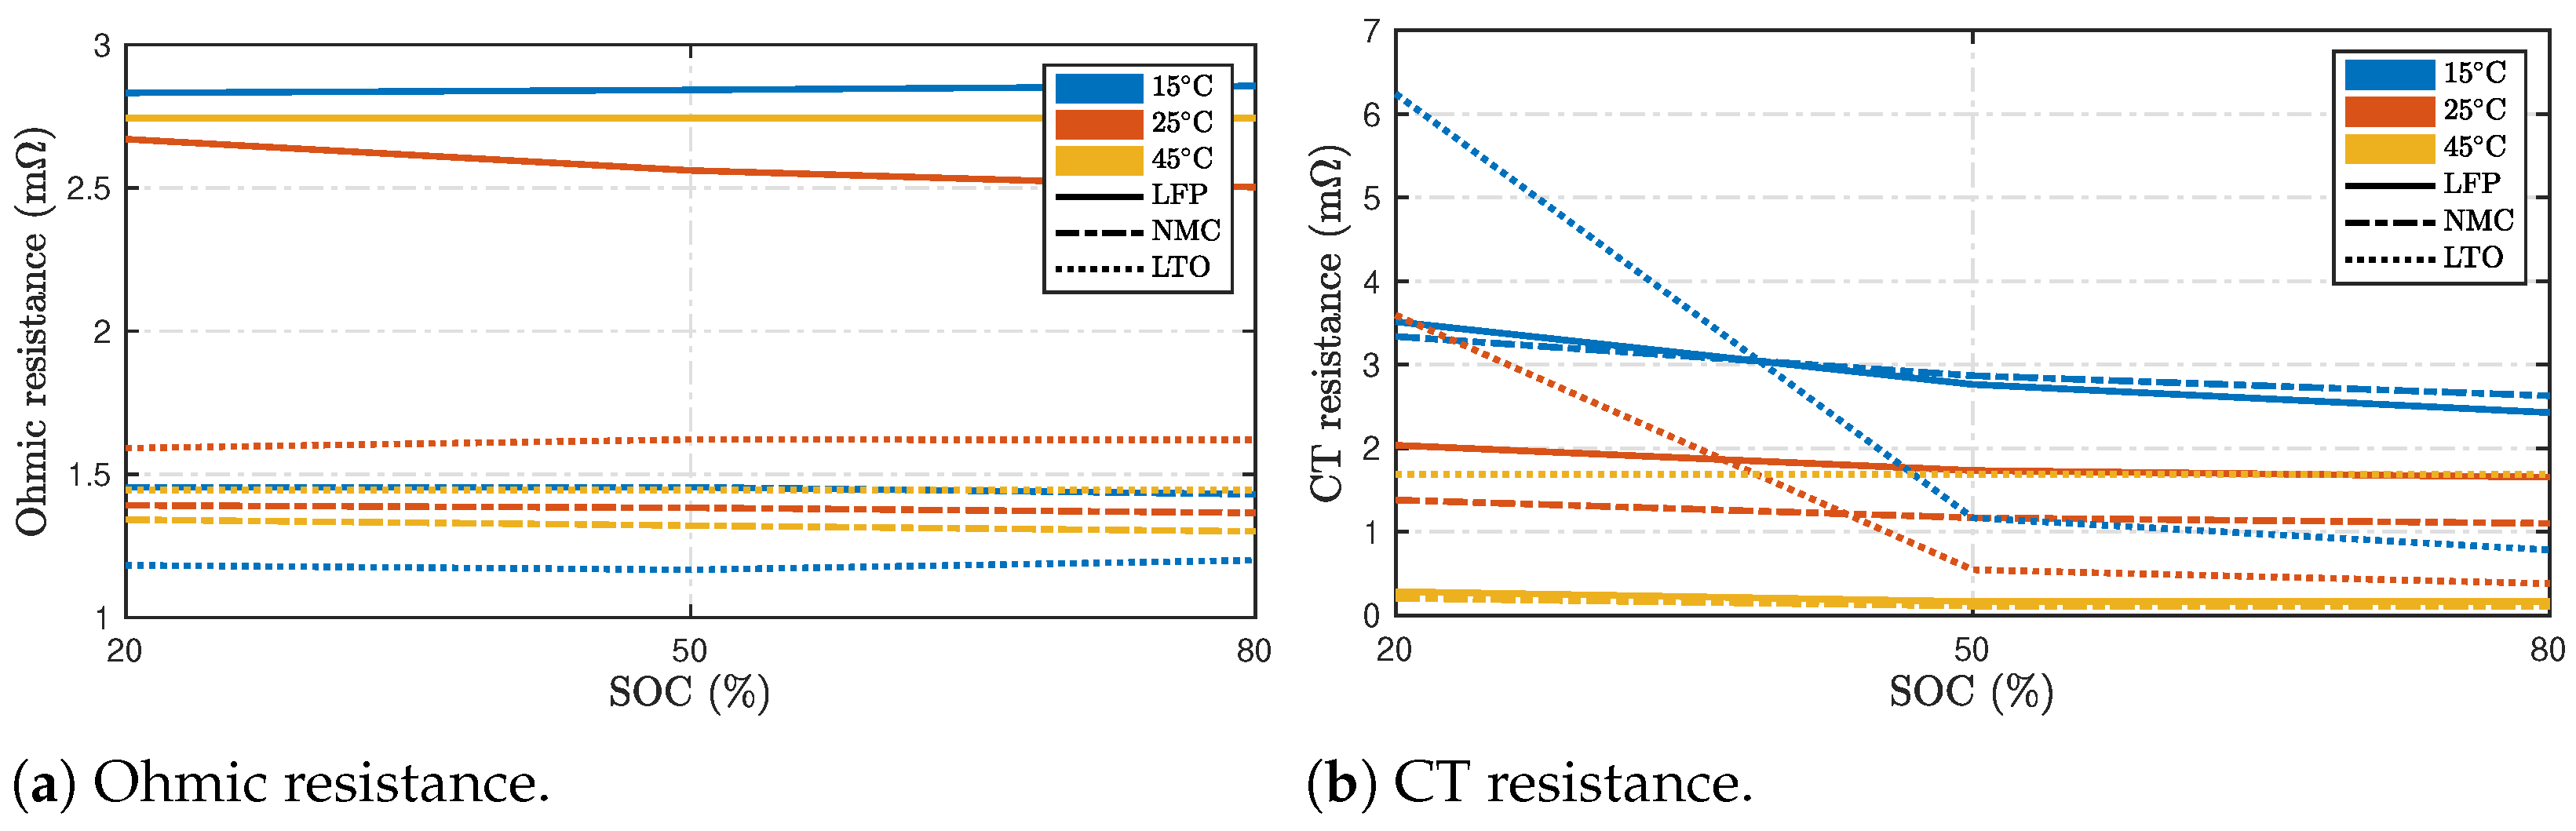
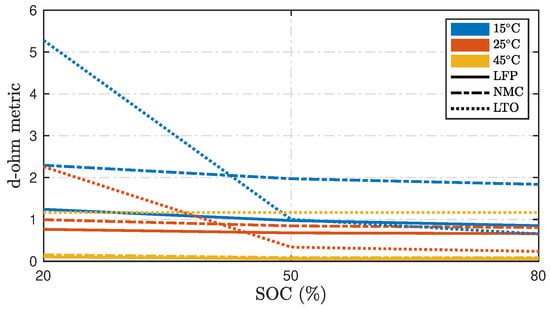
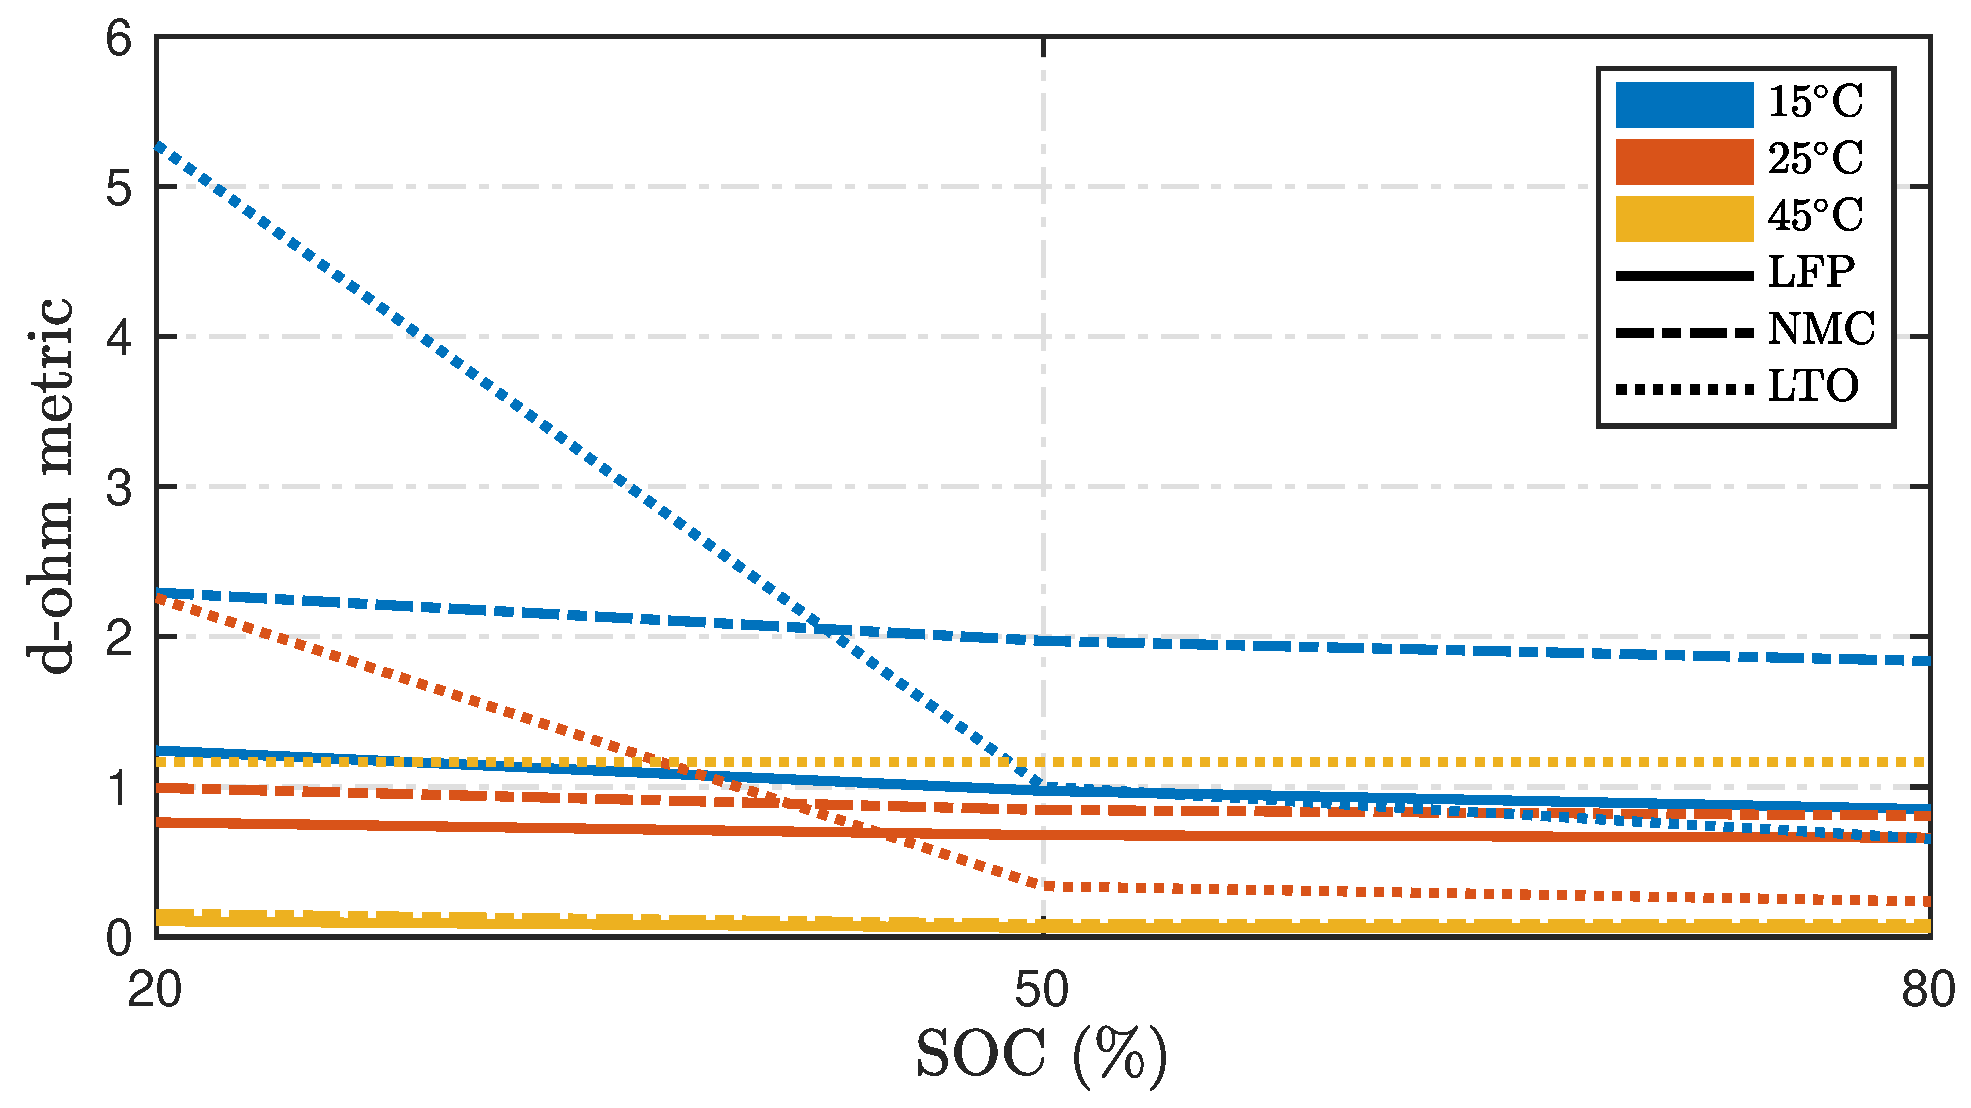
In [13], the authors investigated three lithium-ion battery technologies, NMC, LFP and LTO at varying temperature ranges from 15 to 45 °C for the SOC ranges between 20% and 80%. Figure 9 summarizes the results of the ohmic and charge transfer (CT) resistances recorded under these conditions. From Figure 9a, it can be noticed that the ohmic resistance is higher for the LFP than the NMC and LTO configurations. As noted also in Figure 7, the ohmic resistance is mostly stable with minimal variation across temperatures selected in the study. The CT resistance shown in Figure 9b is observed to be higher at lower temperatures for most configurations chosen in this study. Figure 10 shows a comparison of the computed d-ohm metrics. Similar to the observations in Figure 8, it can be noticed that the d-ohm metric reduces with temperature for LFP and NMC chemistries. Contrary to the previous study, the NMC batteries exhibited a slightly higher d-ohm than the LFP batteries across all temperatures; however, the pronounced differences at lower temperatures remained the same in both studies.
Figure 9.
Change in the Nyquist plot due to variations in the Warburg coefficient.
Figure 10.
Proposed d-ohm metric computed using (12) using estimated resistances recorded from [13].
2.3. Experimental Setup
In this section, the experimental setup used to collect data from Li-ion batteries and the dummy cell is explained.
2.3.1. Gamry Interface 5000P
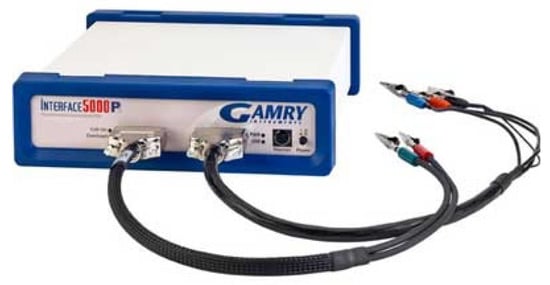
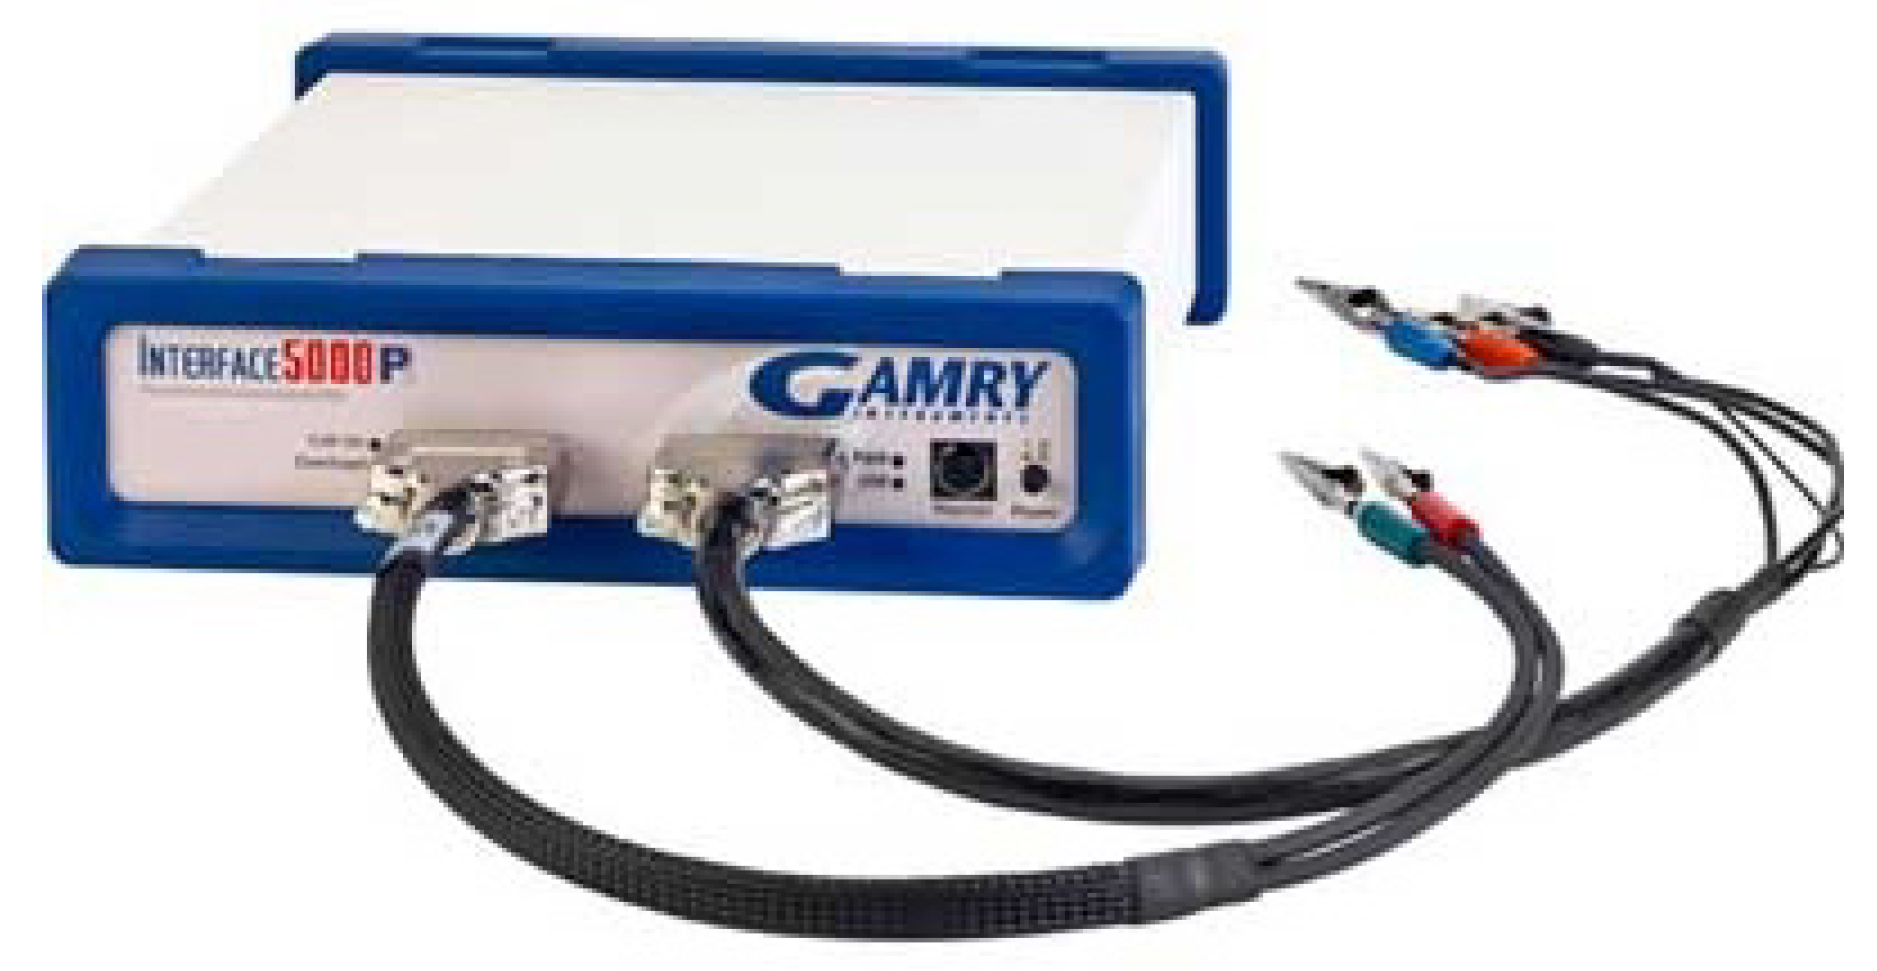
A device manufactured by Gamry Instruments, Warminster, USA called the Interface 5000P, designed for single-cell EIS testing of batteries, was used in this study, as shown in Figure 11. This instrument offers both galvanostatic and potentiostatic control modes. In both modes, the device supports currents of up to 5 A, maximum voltage potential at V and allows data acquisition between 10 μHz and 20 kHz. The galvanostat mode was utilized in this study for performing the EIS of the chosen batteries.
Figure 11.
Gamry Interface 5000P.
2.3.2. Dummy Cell
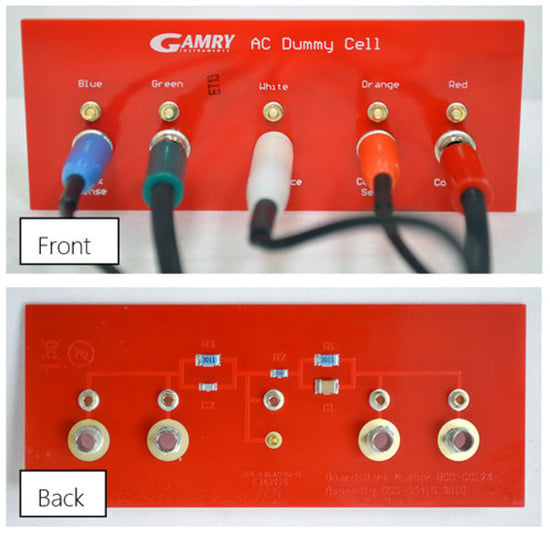
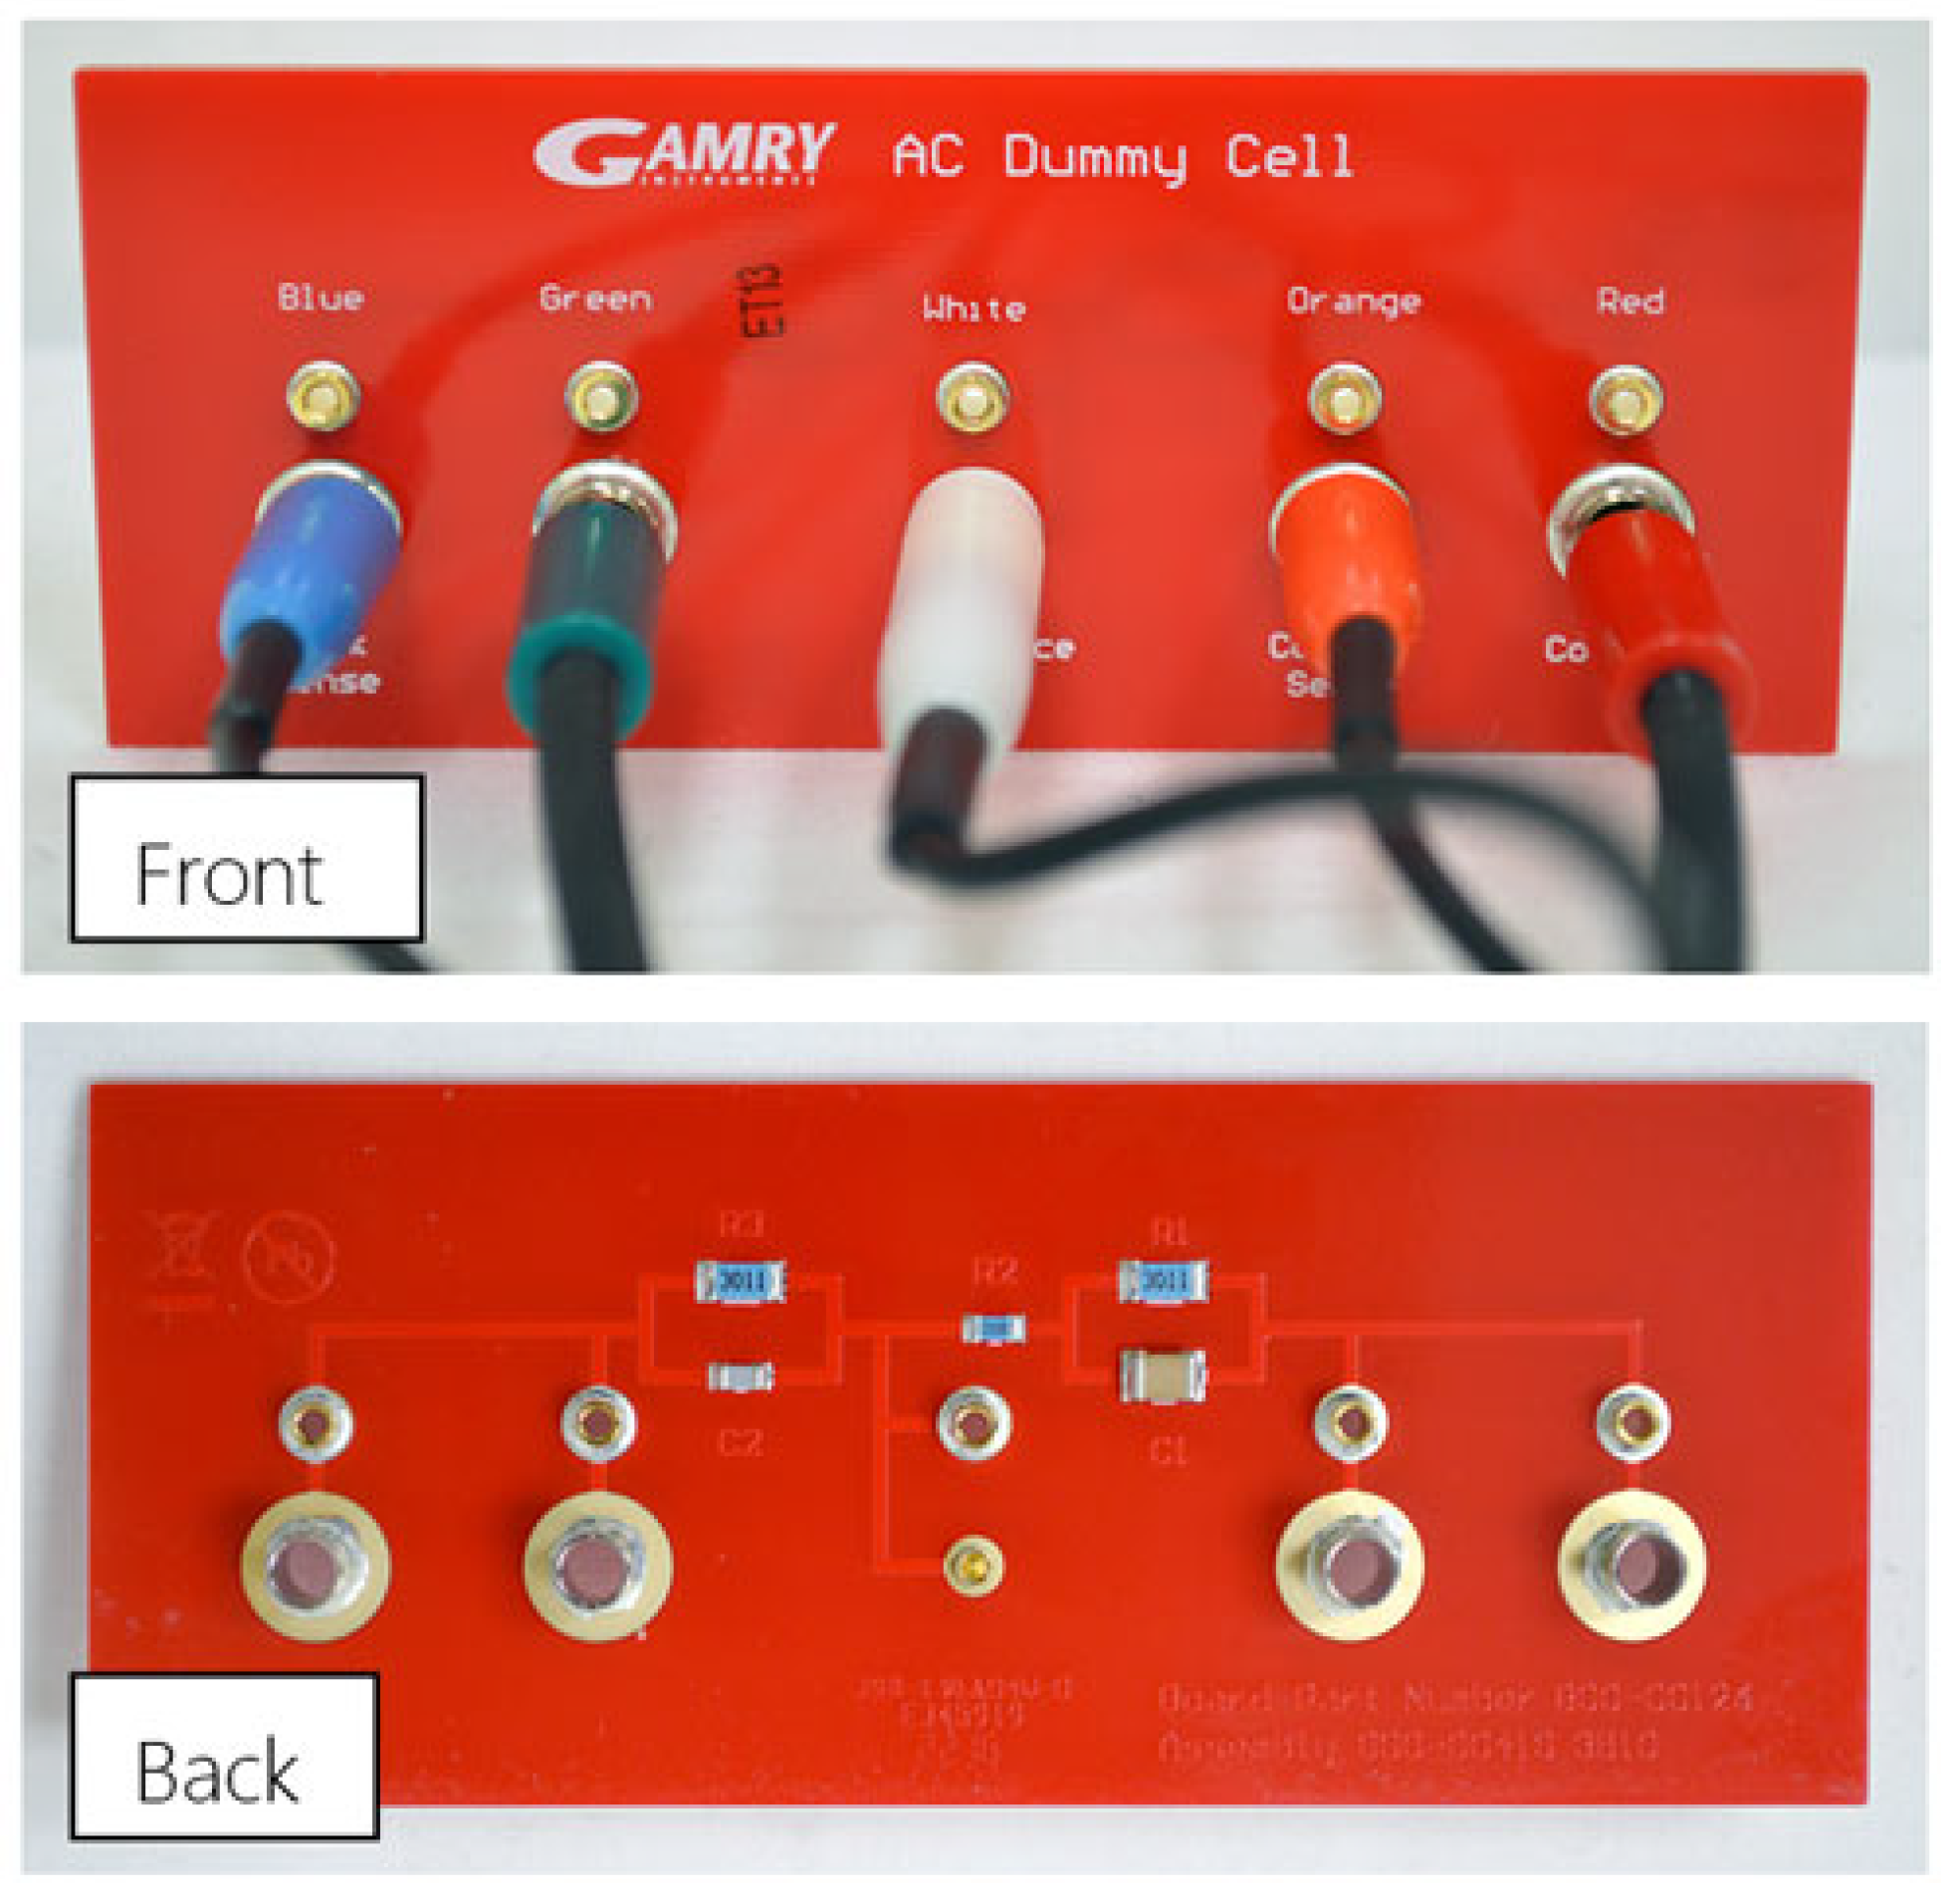
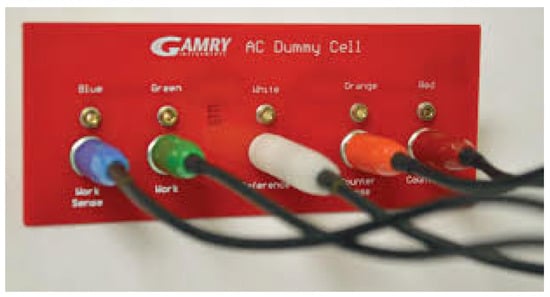
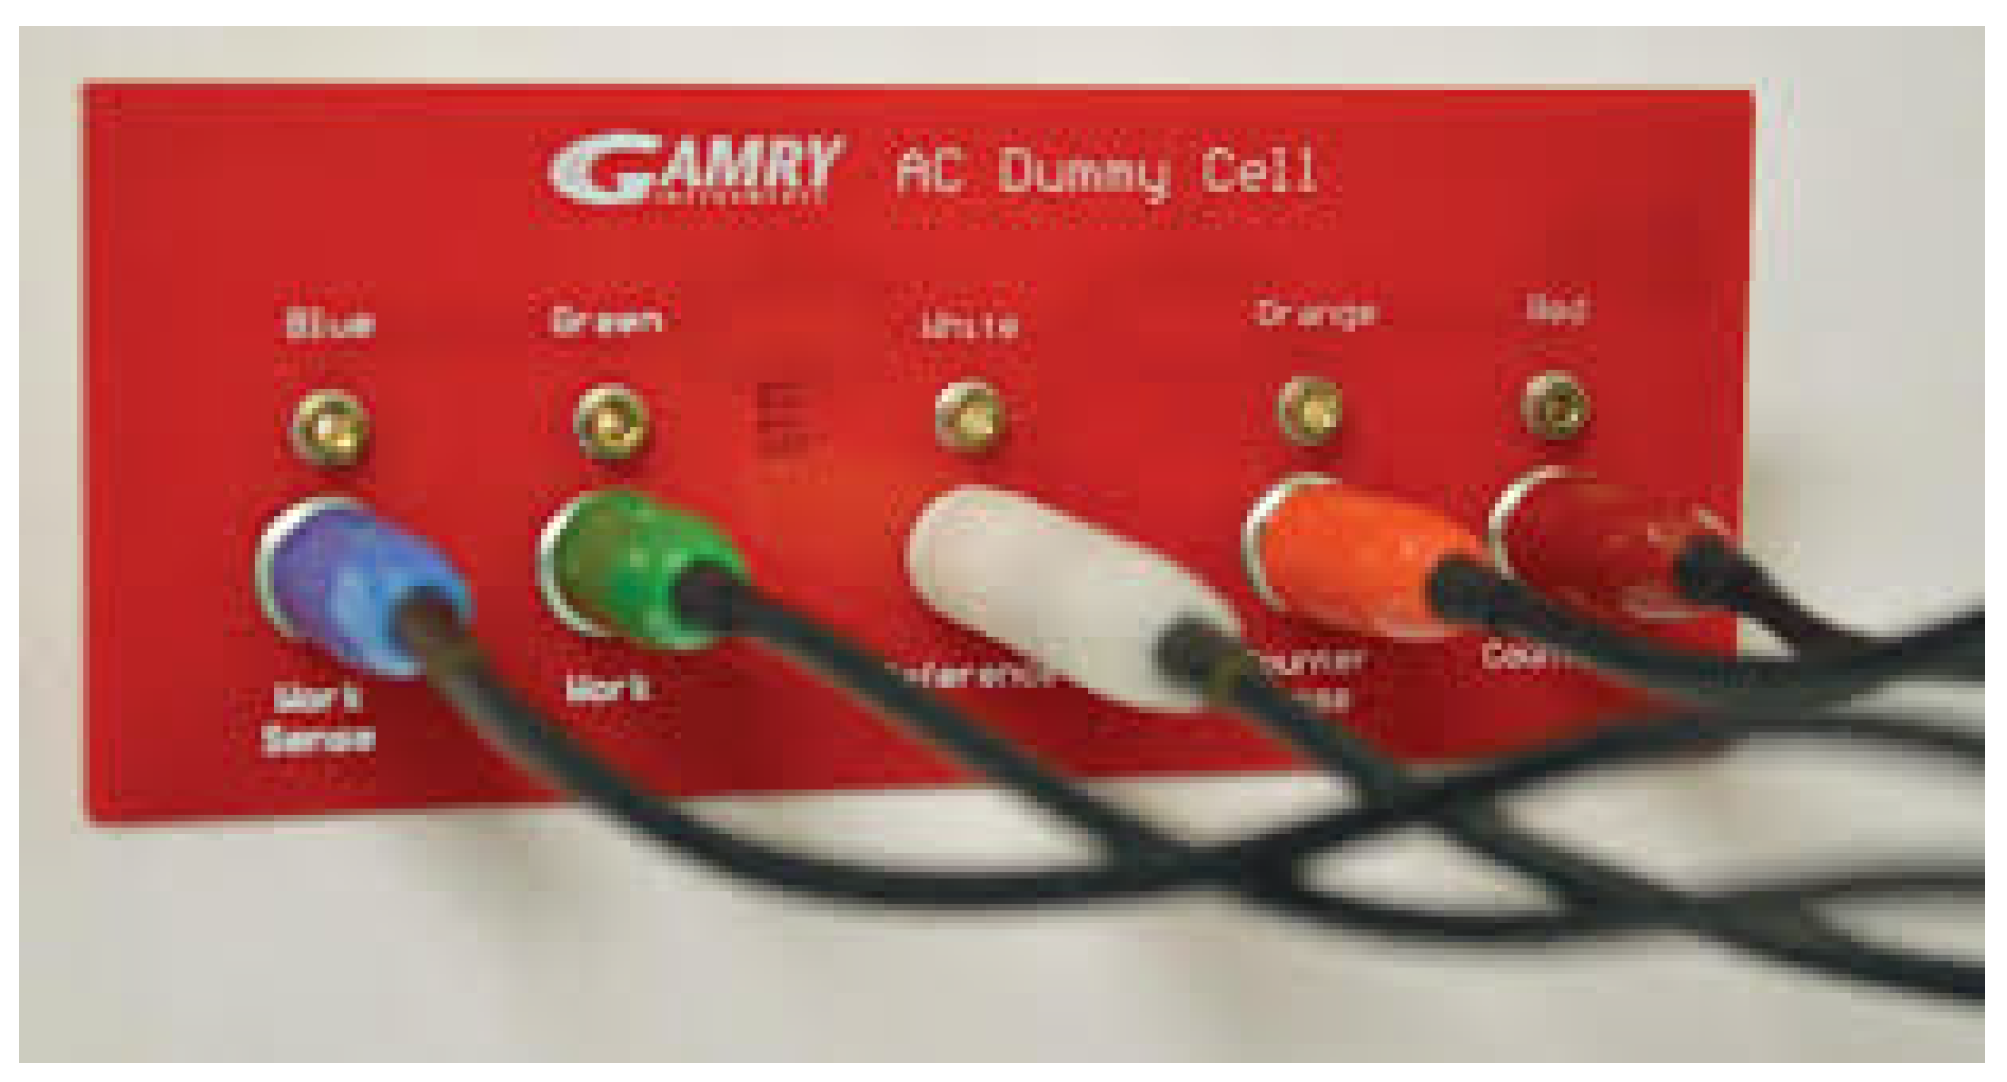
An AC Dummy Cell manufactured by Gamry Instruments, Warminster, USA as shown in Figure 12 is used in this study to obtain the control measurements. This circuit can be used to simulate an RC/2RC ECM behavior with known ECM parameters given as: kΩ, Ω, kΩ, μF, and nF. The front of the dummy cell has five banana jacks (2 mm and 4 mm) to which the potentiostat cell-cable leads are connected as shown in the illustration in Figure 13. The back shows the approximation of the 2RC circuit using an RC-R-RC electrical setup with visible traces (highlighted in Figure 12).
Figure 12.
AC Dummy Cell.
Figure 13.
Gamry Interface 5000P connections schematic to the AC Dummy Cell.
2.3.3. Battery Cell
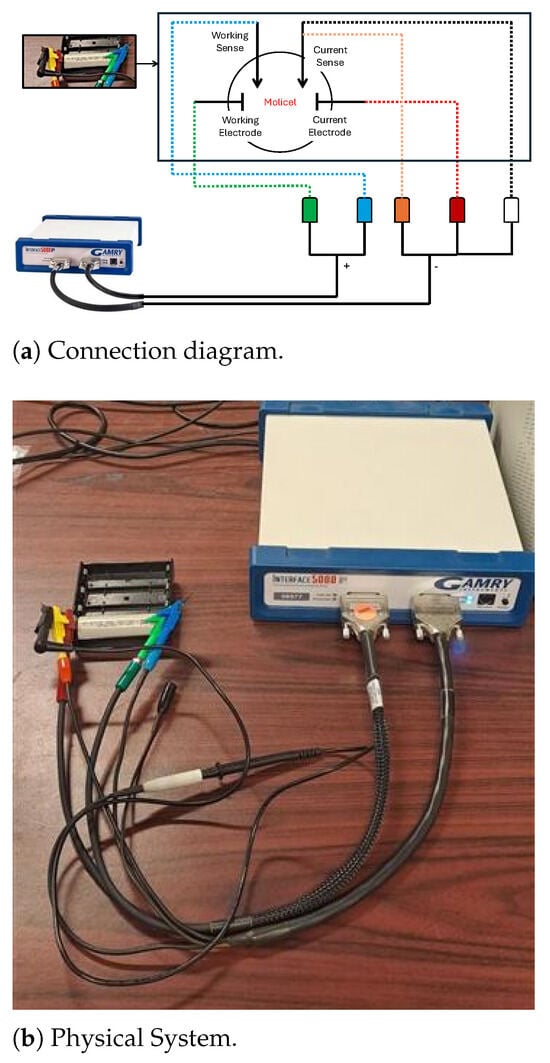
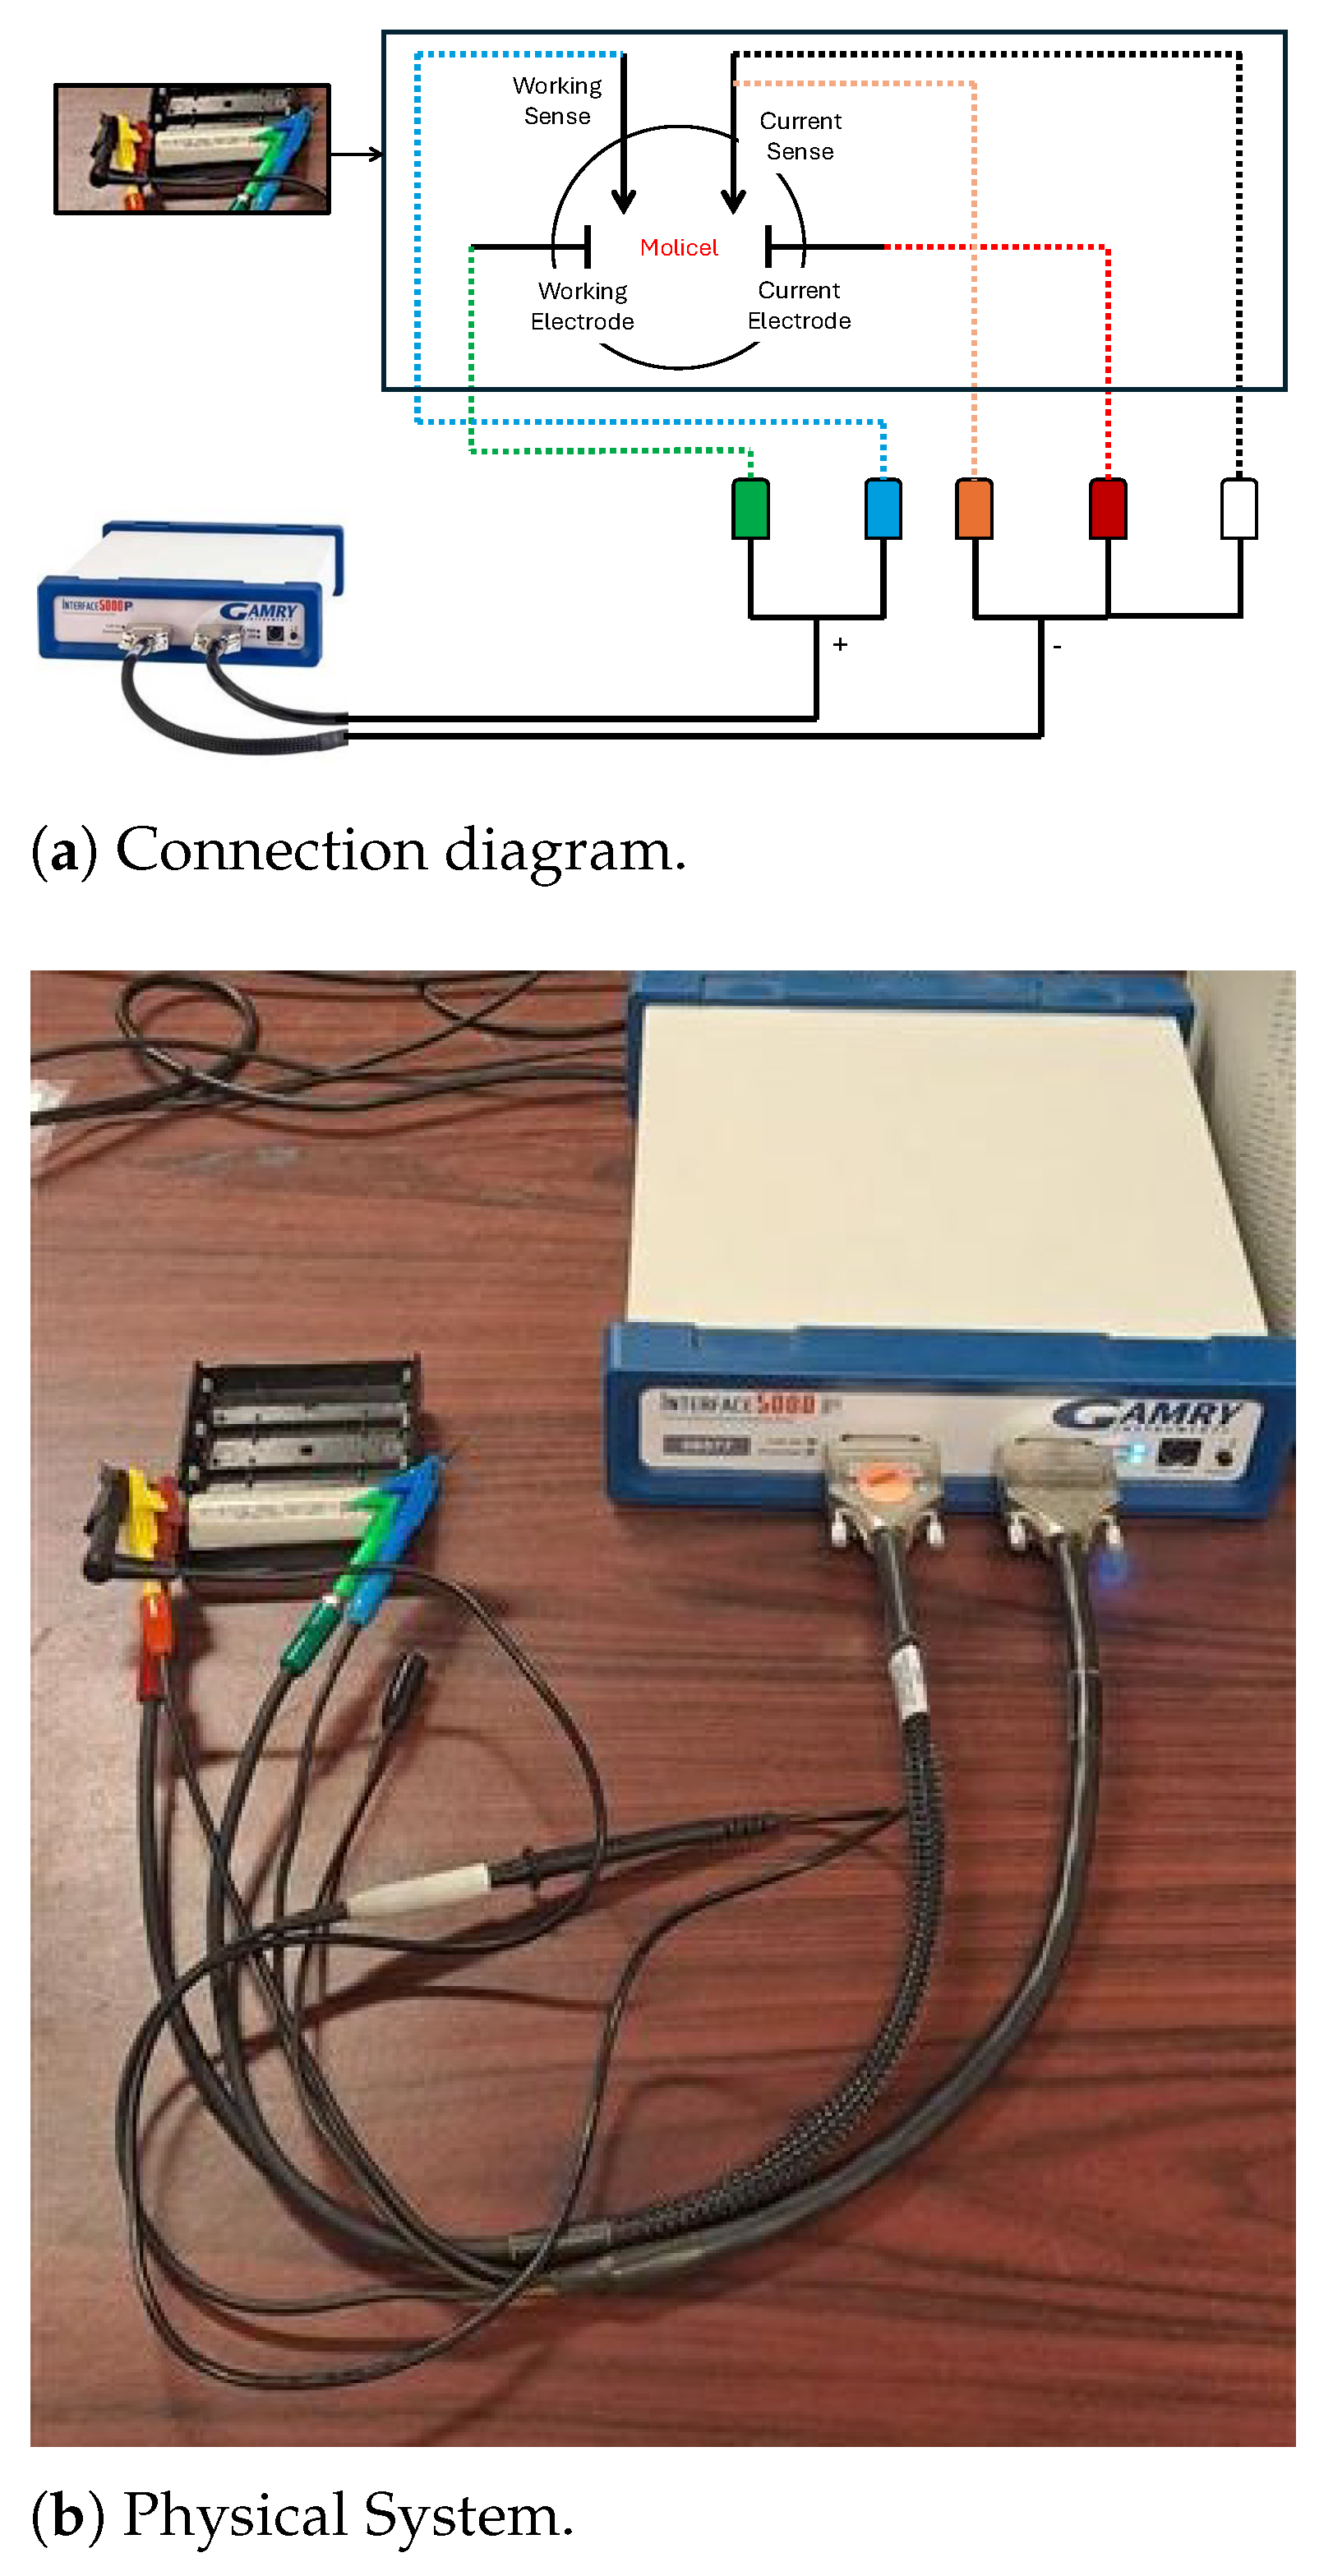
The Molicel INR-21700-P42A lithium-ion cell (E-One Moli Energy Corp., Tainan, Taiwan), known for its high power capability and robust cycle life characteristics, is selected for the testing. This cell is manufactured in the 21,700 cylindrical format and features a nickel-rich NMC () cathode paired with a graphite anode. It offers a nominal capacity of 4.2 Ah and supports continuous discharge currents of up to 45 A. The nominal voltage of the battery is 3.6 V, and its typical operating voltage range is between 2.5 V and 4.2 V. Figure 14 summarizes how the Molicel is connected to the Gamry potentiostat during the experiment.
Figure 14.
Schematic of the EIS measurement setup for a Molicel cell using the Gamry Interface 5000P. Color-coded connections indicate the Gamry leads: green—working electrode, blue—working sense, red—current electrode, orange—current sense, and white—reference/common lead.
2.3.4. Excitation Signal and Test Conditions
The EIS test was performed on both the AC Dummy Cell (Gamry Instruments, Warminster, PA, USA) and the Molicel INR-21700-P42Abattery (E-One Moli Energy Corp., Tainan, Taiwan). Using a sinusoidal current excitation signal. The excitation signal was applied across a frequency range from 500 Hz to 0.01 Hz to capture both high-frequency and low-frequency impedance characteristics. The amplitude of the sinusoidal current was set to μA for the dummy cell and for Molicel, reflecting the differences in their current-handling capabilities and ensuring that both were tested within their respective linear operating regions. A zero DC bias current with 12 complete cycles was applied in all cases to isolate the AC impedance response.
For the EIS measurements, a logarithmically spaced frequency range was employed using 10 points per decade, spanning from 0.01 Hz to 500 Hz.
2.3.5. Procedure
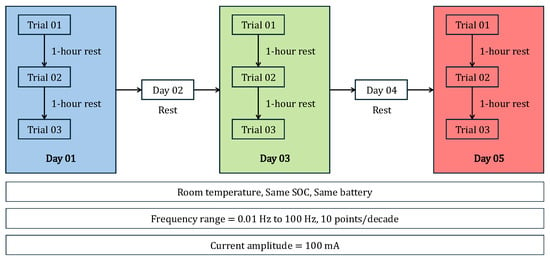
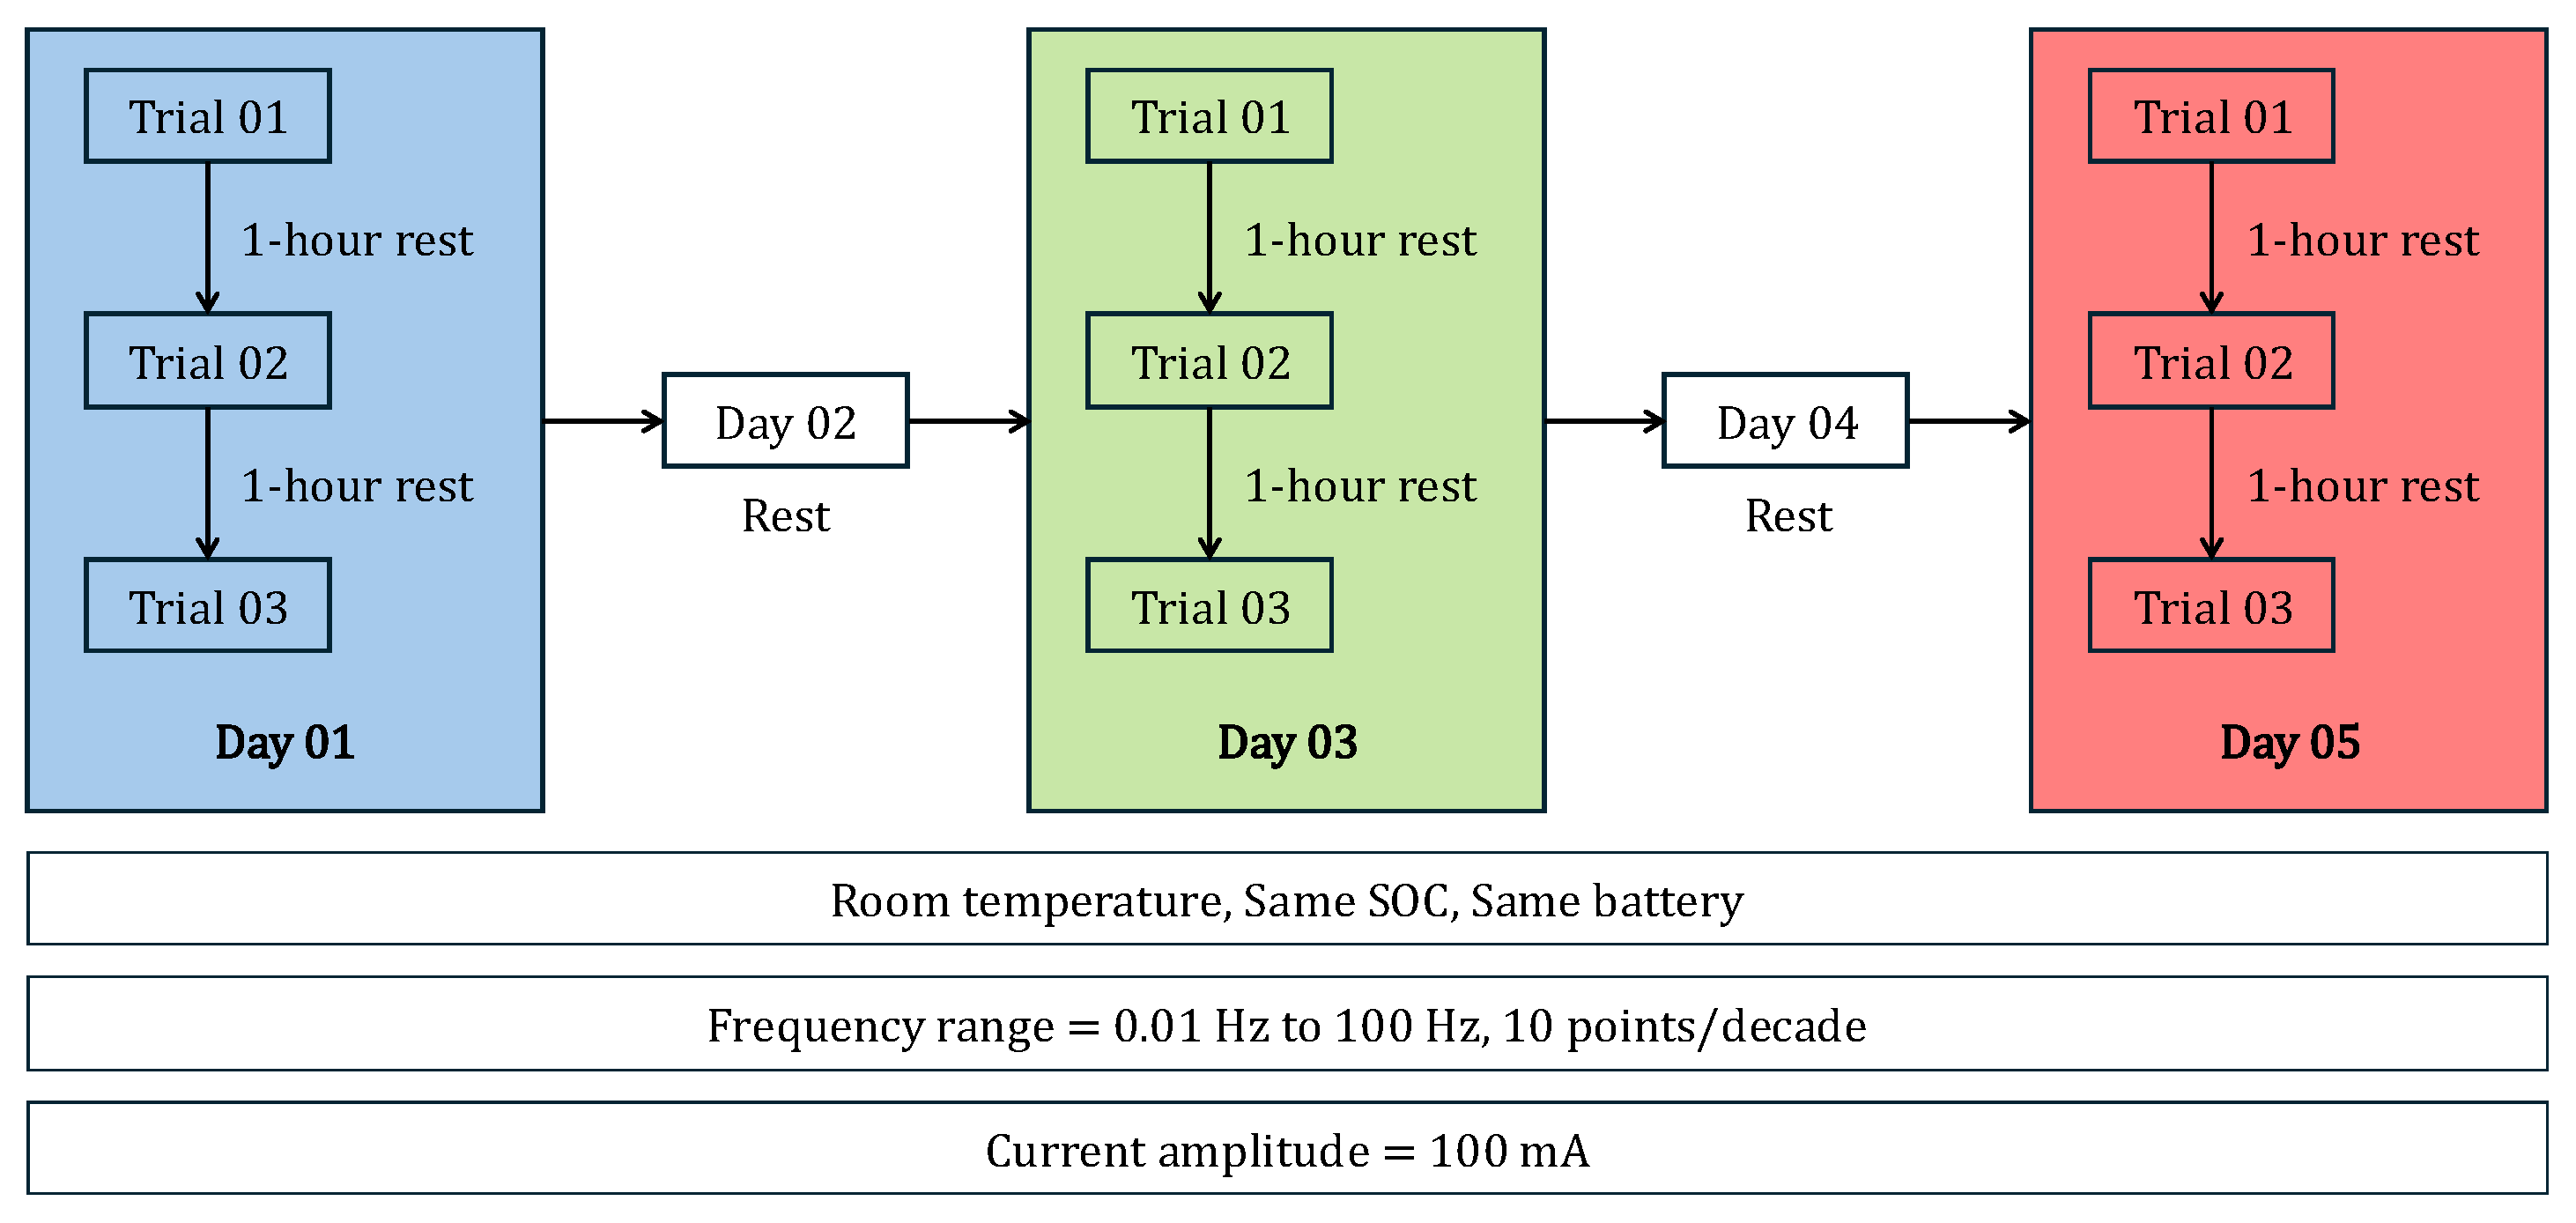
The experiment begins with an EIS test (Trial-1) on Day 01, conducted according to the specifications in Section 2.3.4 on the battery described in Section 2.3.3. Following this test, the battery is allowed to rest for 1 h. After the rest period, a second EIS test (Trial-2) is performed, followed by another 1 h rest. Next, a third EIS test (Trial-3) is conducted, after which the battery is rested for the remainder of Day 01. Subsequently, on Days 02 and 03, the three EIS trials are repeated with 1 h resting periods between each test, marking the conclusion of the experiment. Figure 15 presents a visual summary of the experimental procedure applied to the battery. The resting time was fixed at 1 h throughout this study to isolate variability in repeated EIS measurements under nominally identical conditions. The influence of different resting times (30 min, 1 h and 2 h) on impedance measurements has been investigated separately in our previous work [50].
Figure 15.
Experimental Procedure.
The pulse frequency, real and imaginary impedance data during the three trials every day were recorded and analyzed in the next section.
3. Results
This section presents the results of the variability of the impedance spectrum based on data collected using the experimental procedure in Section 2.3.
3.1. Impedance Variability
The impedance spectrum presented in this section was recorded for the dummy cell and the battery for repeated trials.
3.1.1. AC Dummy Cell
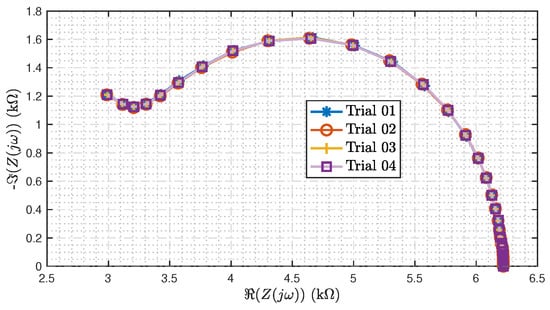
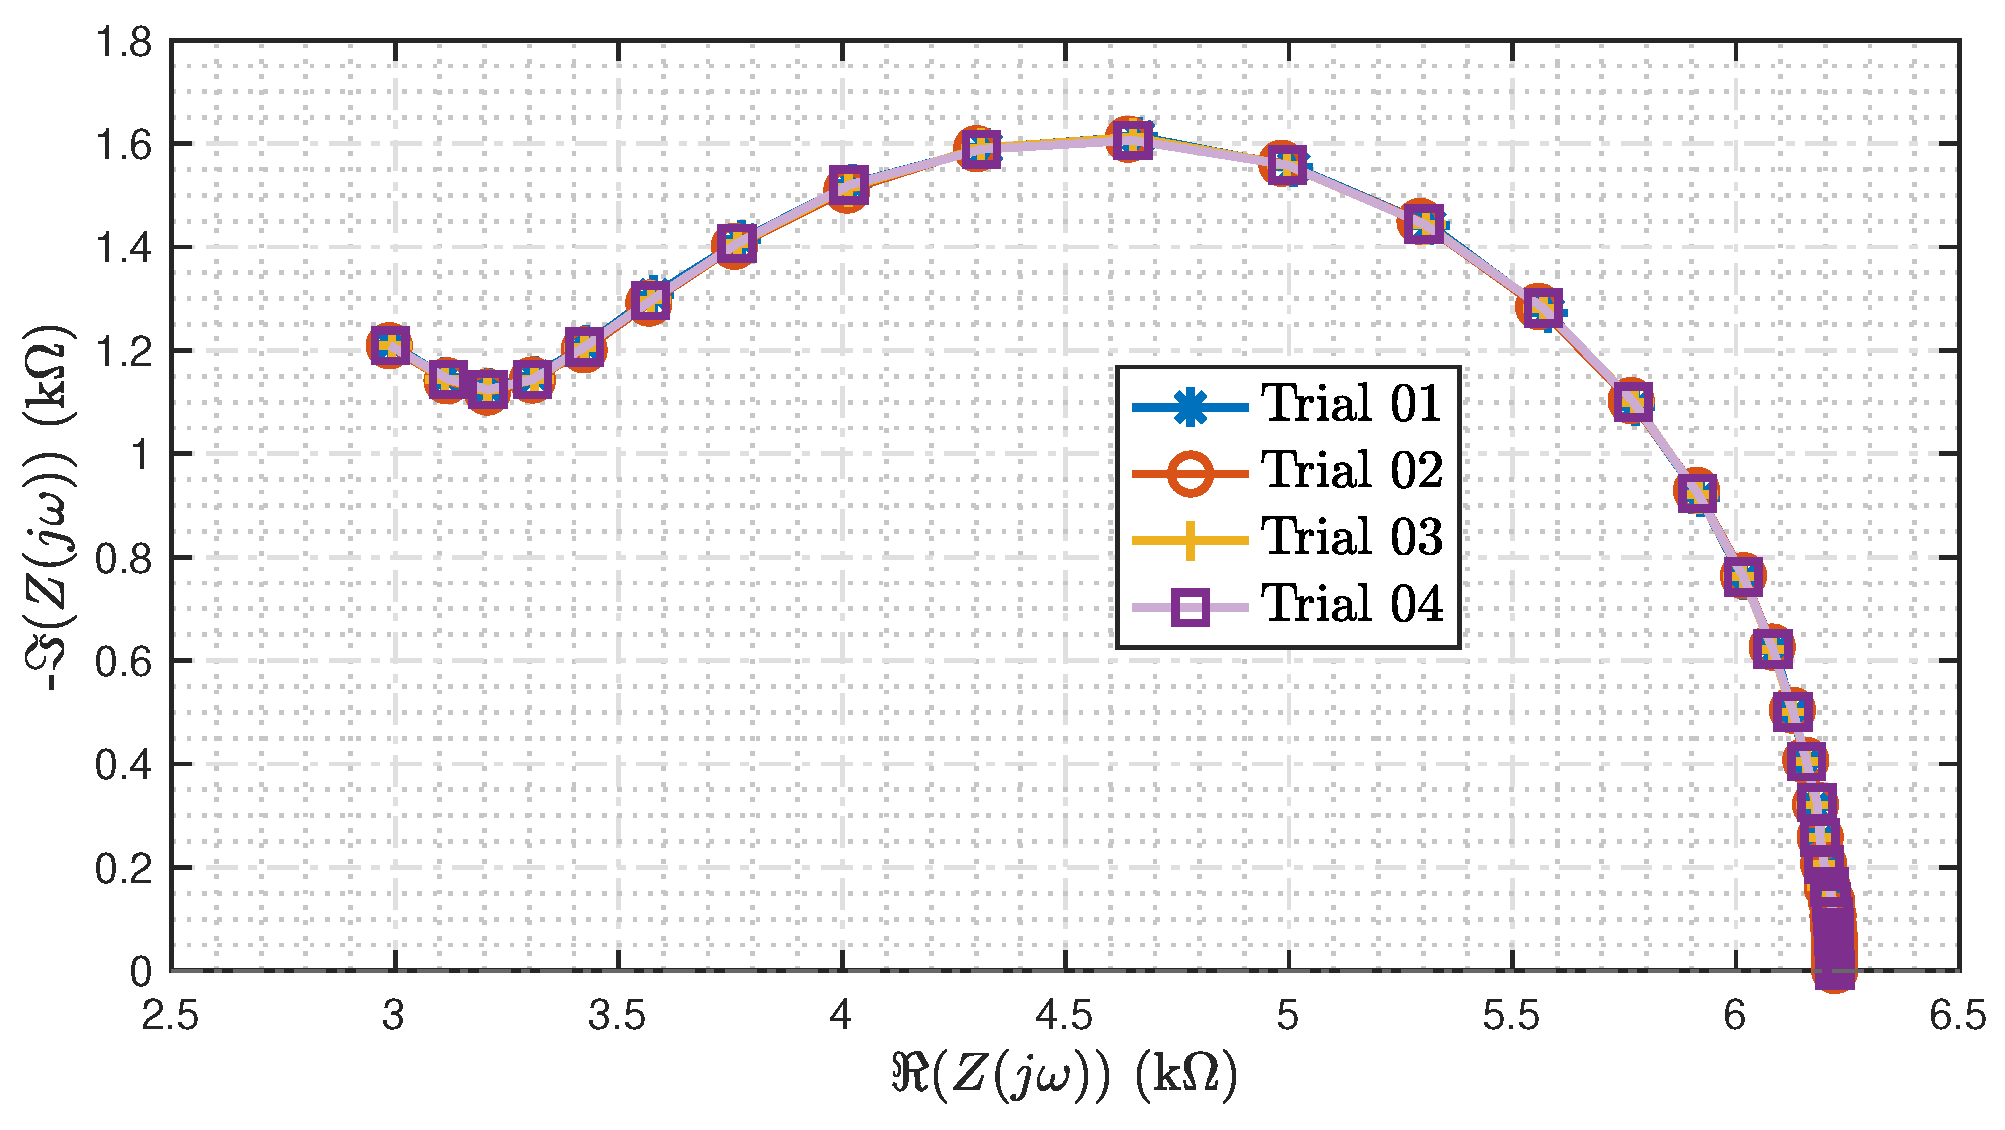
Figure 16 shows the impedance spectrum recorded for the dummy cell for four repeated trials. From the figure, it can be noticed that all four trials appear superimposed on each other. Hence, there is minimal variation between the four trials repeated for the dummy cell.
Figure 16.
Impedance spectrum for four repeated trials on the Dummy Cell.
3.1.2. Battery Cell
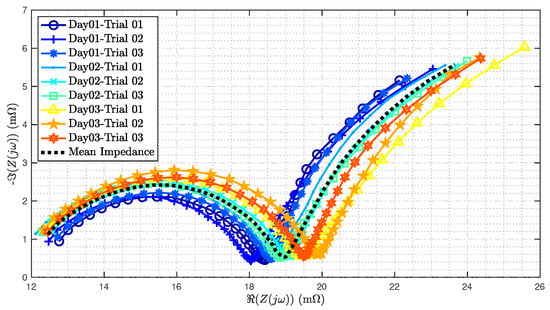
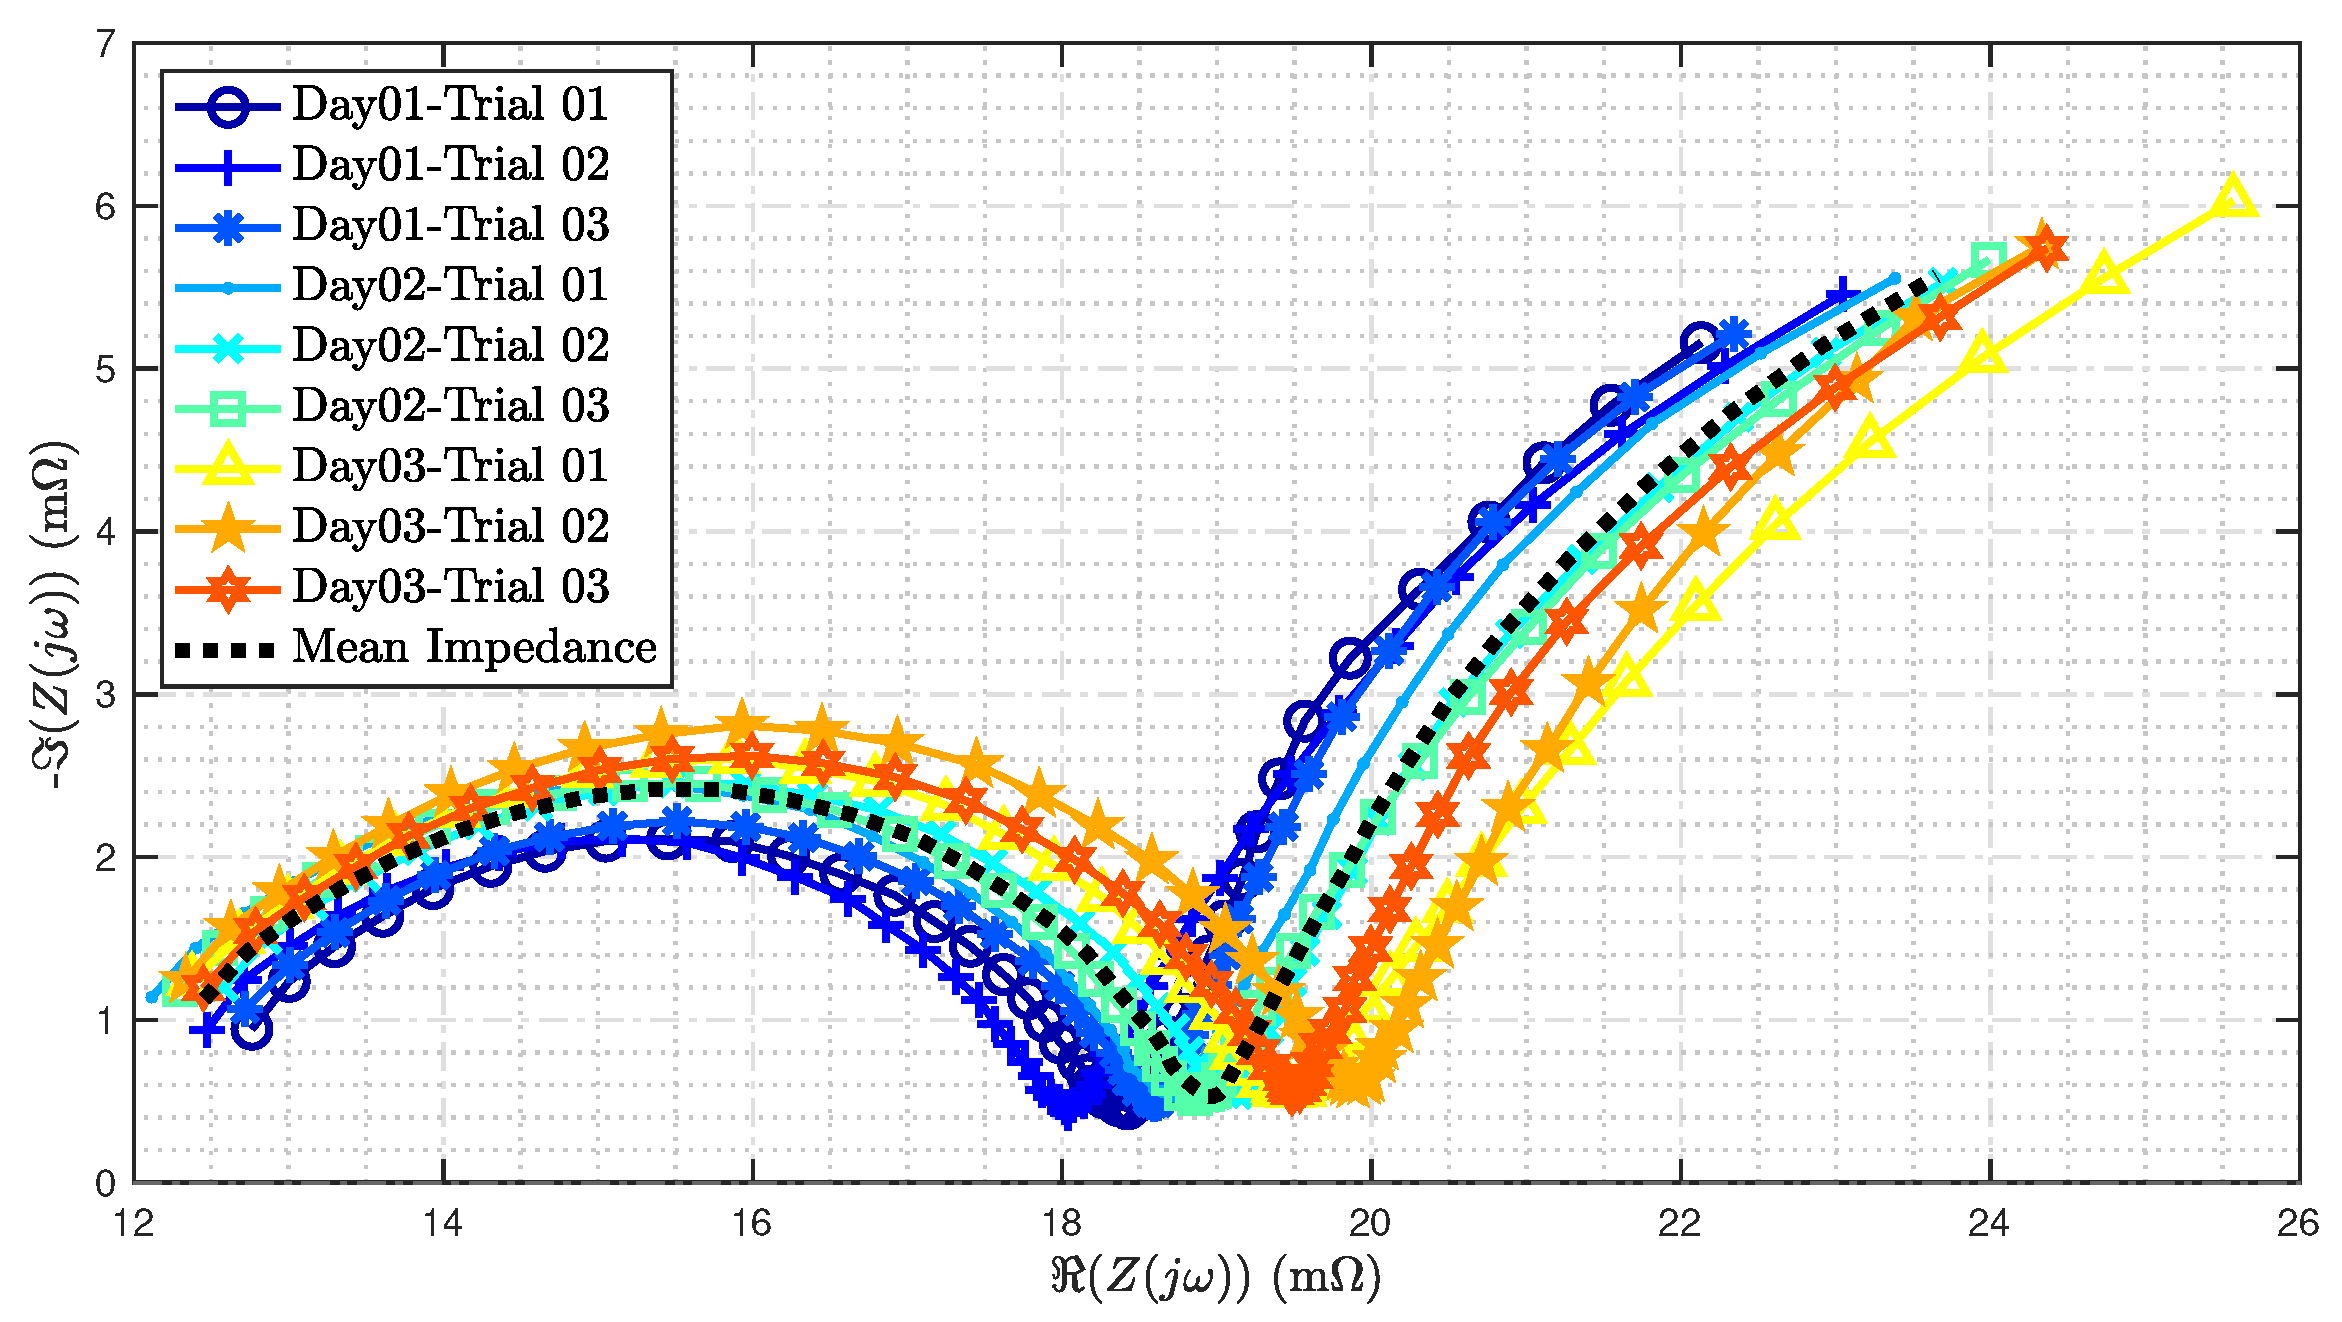
Figure 17 shows the impedance spectrum recorded for a battery cell described in Section 2.3.3. The cell underwent three trials every day, for three days, and the impedance spectrum recorded during all trials is plotted in this Figure. Details of the experimental procedure are provided in Section 2.3.5. The progression across days is represented using color and marker variations in the figure, i.e., Day 01 is shown in blue tones, Day 02 with green tones, and Day 03 in red tones. Using the impedance data across the three days, the mean impedance is computed as
In Figure 17, the mean impedance computed from the recorded data is plotted as a dotted black line.
Figure 17.
Impedance spectrum for three repeated trials on three different days for the battery. Day 01 is shown in blue tones, Day 02 in green tones, and Day 03 in red tones.
From Figure 17, there are several observations one can make. Firstly, it can be noticed that the real value of impedance increases with the progression of days, i.e, the impedance recorded for Day 01 is smaller than that for Day 02, followed by the highest impedance recorded during Day 03. A variation of 2 mΩ is observed in the recorded real impedance across the three days. This can also be noted as a maximum increase of 2 mΩ in real impedance from Day 01 to Day 03, solely observed during repeated EIS trials. It must be noted that within the three trials recorded on a particular day, no pattern of impedance was observed in this experiment. For instance, consider the impedance recorded during three trials on Day 01 (shown in blue tones) in Figure 17. The variation during the three trials does not follow an increasing or decreasing pattern consistent with factors affecting impedance spectrum in Table 1. In this paper, the variation observed in the impedance spectrum during repeated trials on the same battery is defined as drift. The drift is observed for Days 02 and 03 as well. For the trials in all three days, a drift of magnitude of mΩ was observed.
3.2. Parameter Estimation Approach
The impedance recorded for a battery can be written as a function of the AR-ECM parameters in Figure 1 using (4), i.e.,
where denotes the angular frequency of the excitation signal applied across a frequency range of to Hz, and is the vector of the parameters of the AR-ECM given as
The parameters can be obtained by solving the following optimization problem
In this paper, the ‘lsqcurvefit’ function that is a part of MATLAB’s Optimization Toolbox (Version 9.12, MathWorks, Natick, MA, USA) is utilized to solve the above optimization problem. The initial estimate of the parameters, along with their lower and upper limits, was defined using the maximum value of the real impedance , as follows,
The limits are chosen to be smaller, more realistic values to ensure that the estimate converges. The optimization was terminated when the change in objective function, and step size in parameters, were below .
3.3. Estimated Parameter Analysis
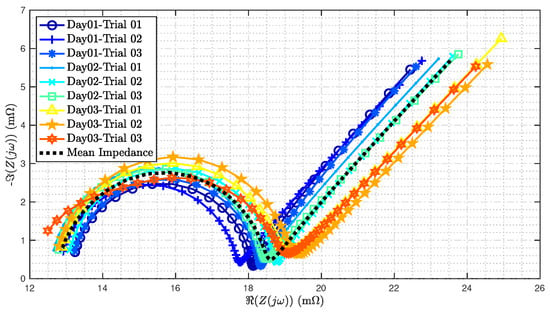
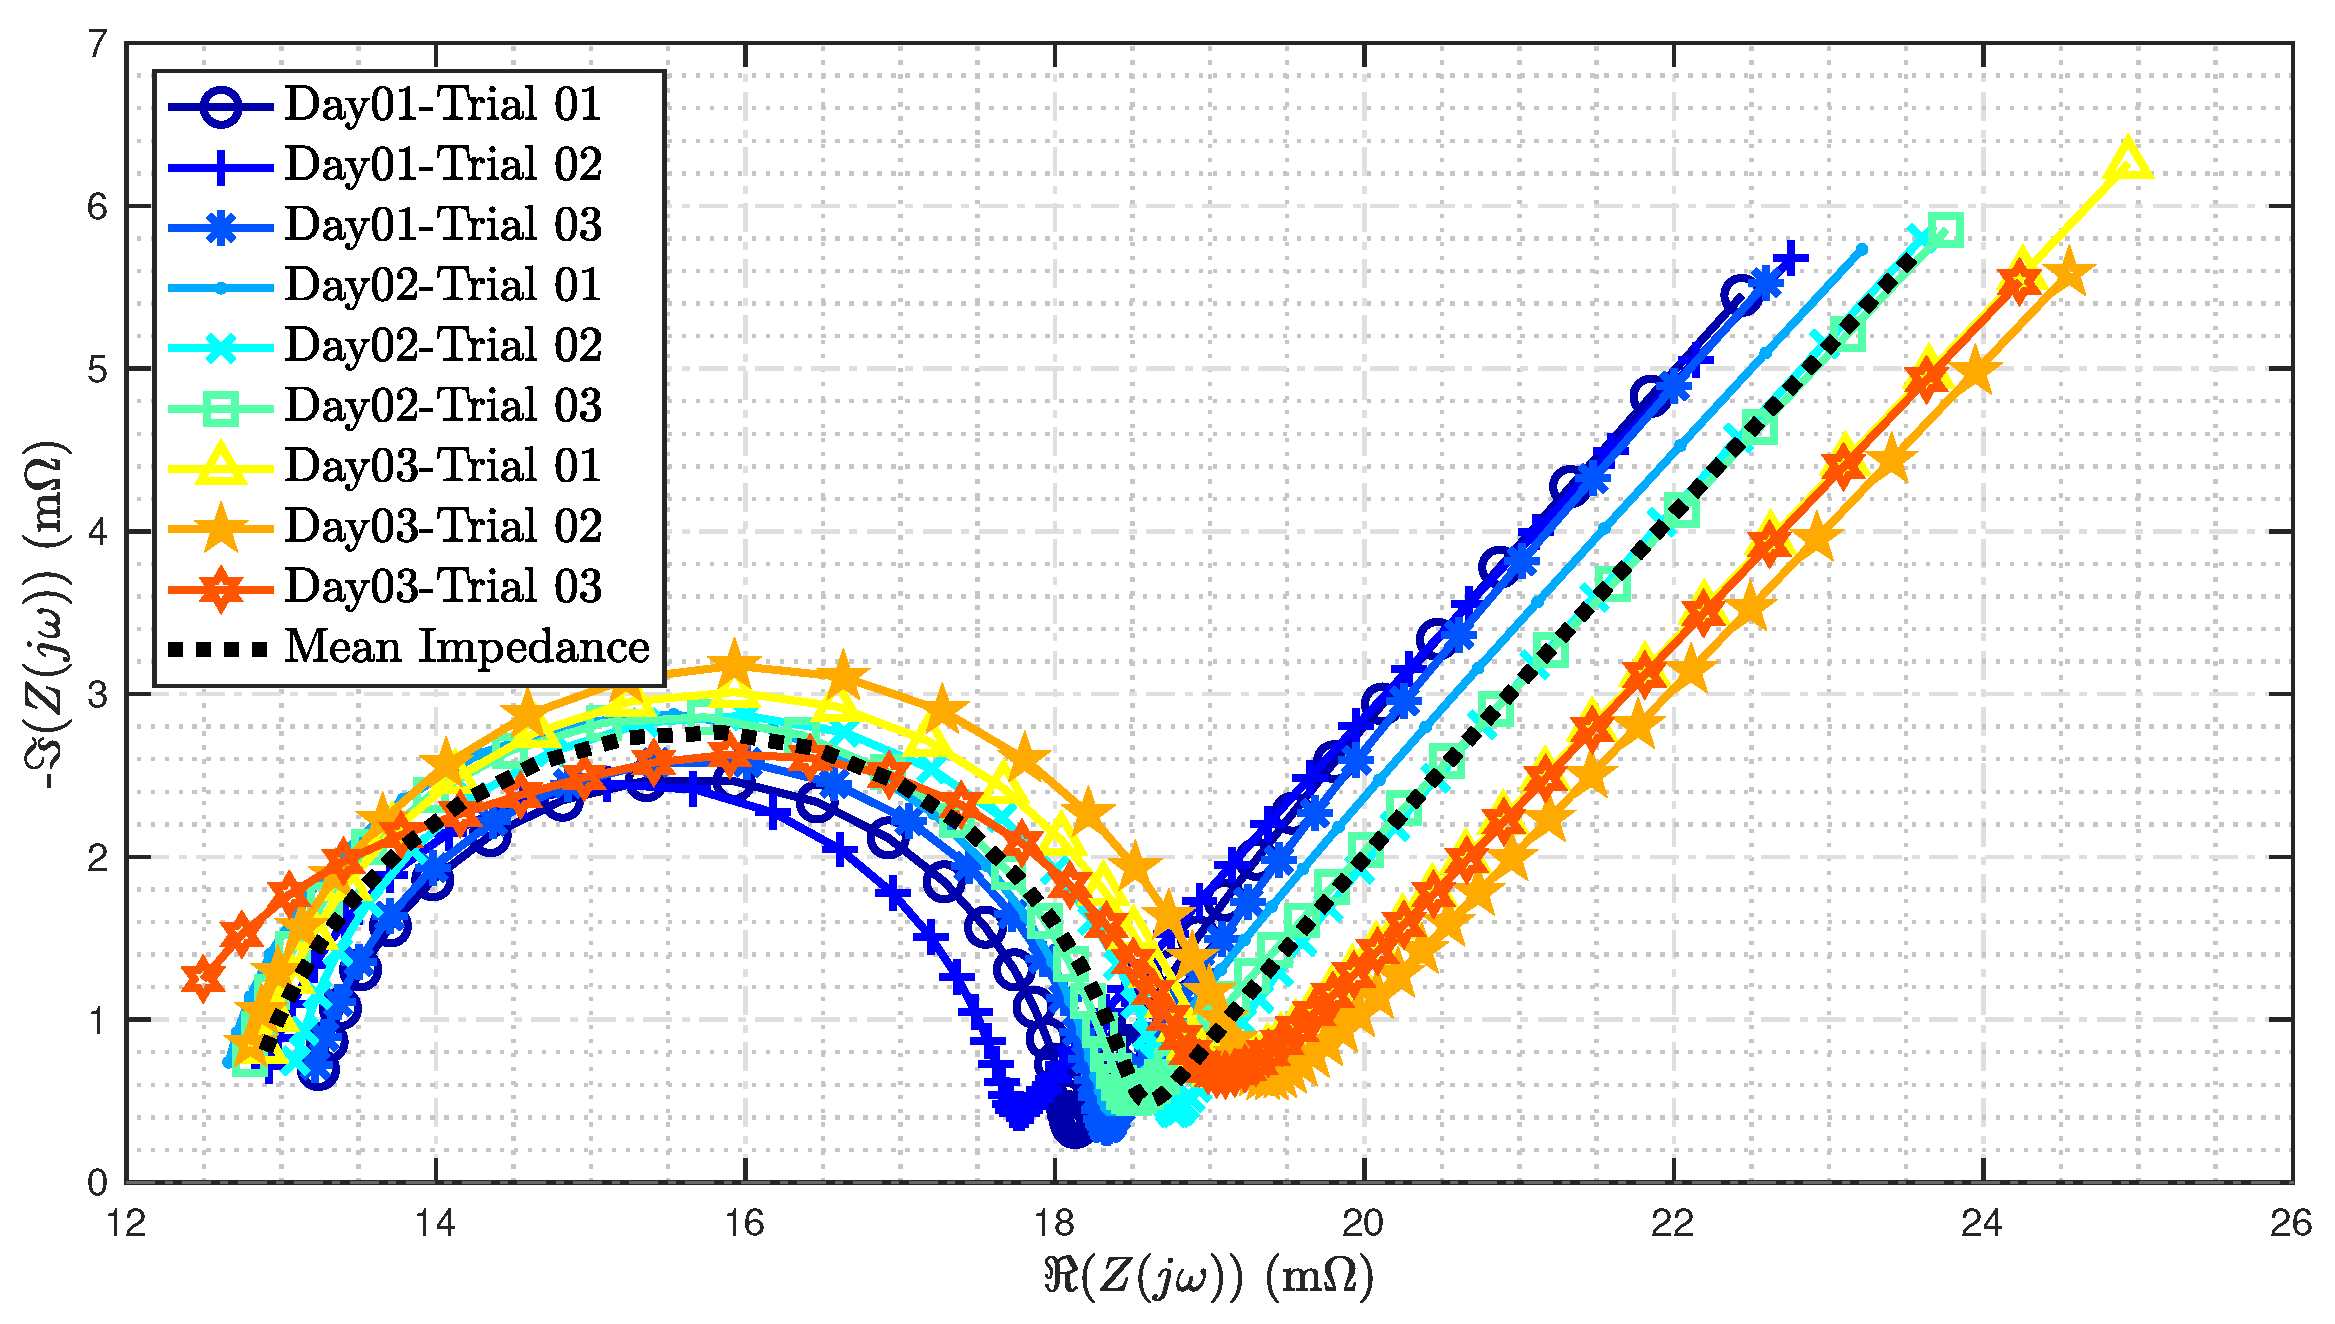
Using the optimization approach described in Section 3.2, the parameters for the AR-ECM are estimated for the battery that underwent three trials every day for three days. Using the estimated parameters, the impedance spectrum is reconstructed using (4) and plotted in Figure 18 for all trials showcased in Figure 17. Using the estimated impedance, the mean impedance across the three days is computed and is also plotted in a dotted black line in Figure 18.
Figure 18.
Impedance spectrum from estimated parameters for three repeated trials on three different days for the battery. See the corresponding measured data in Figure 17.
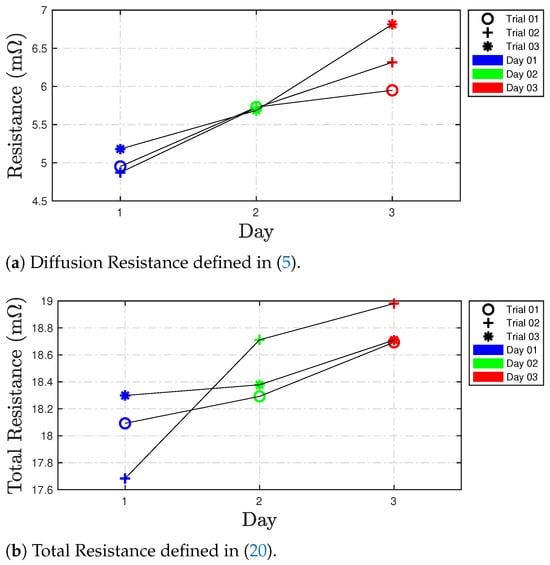
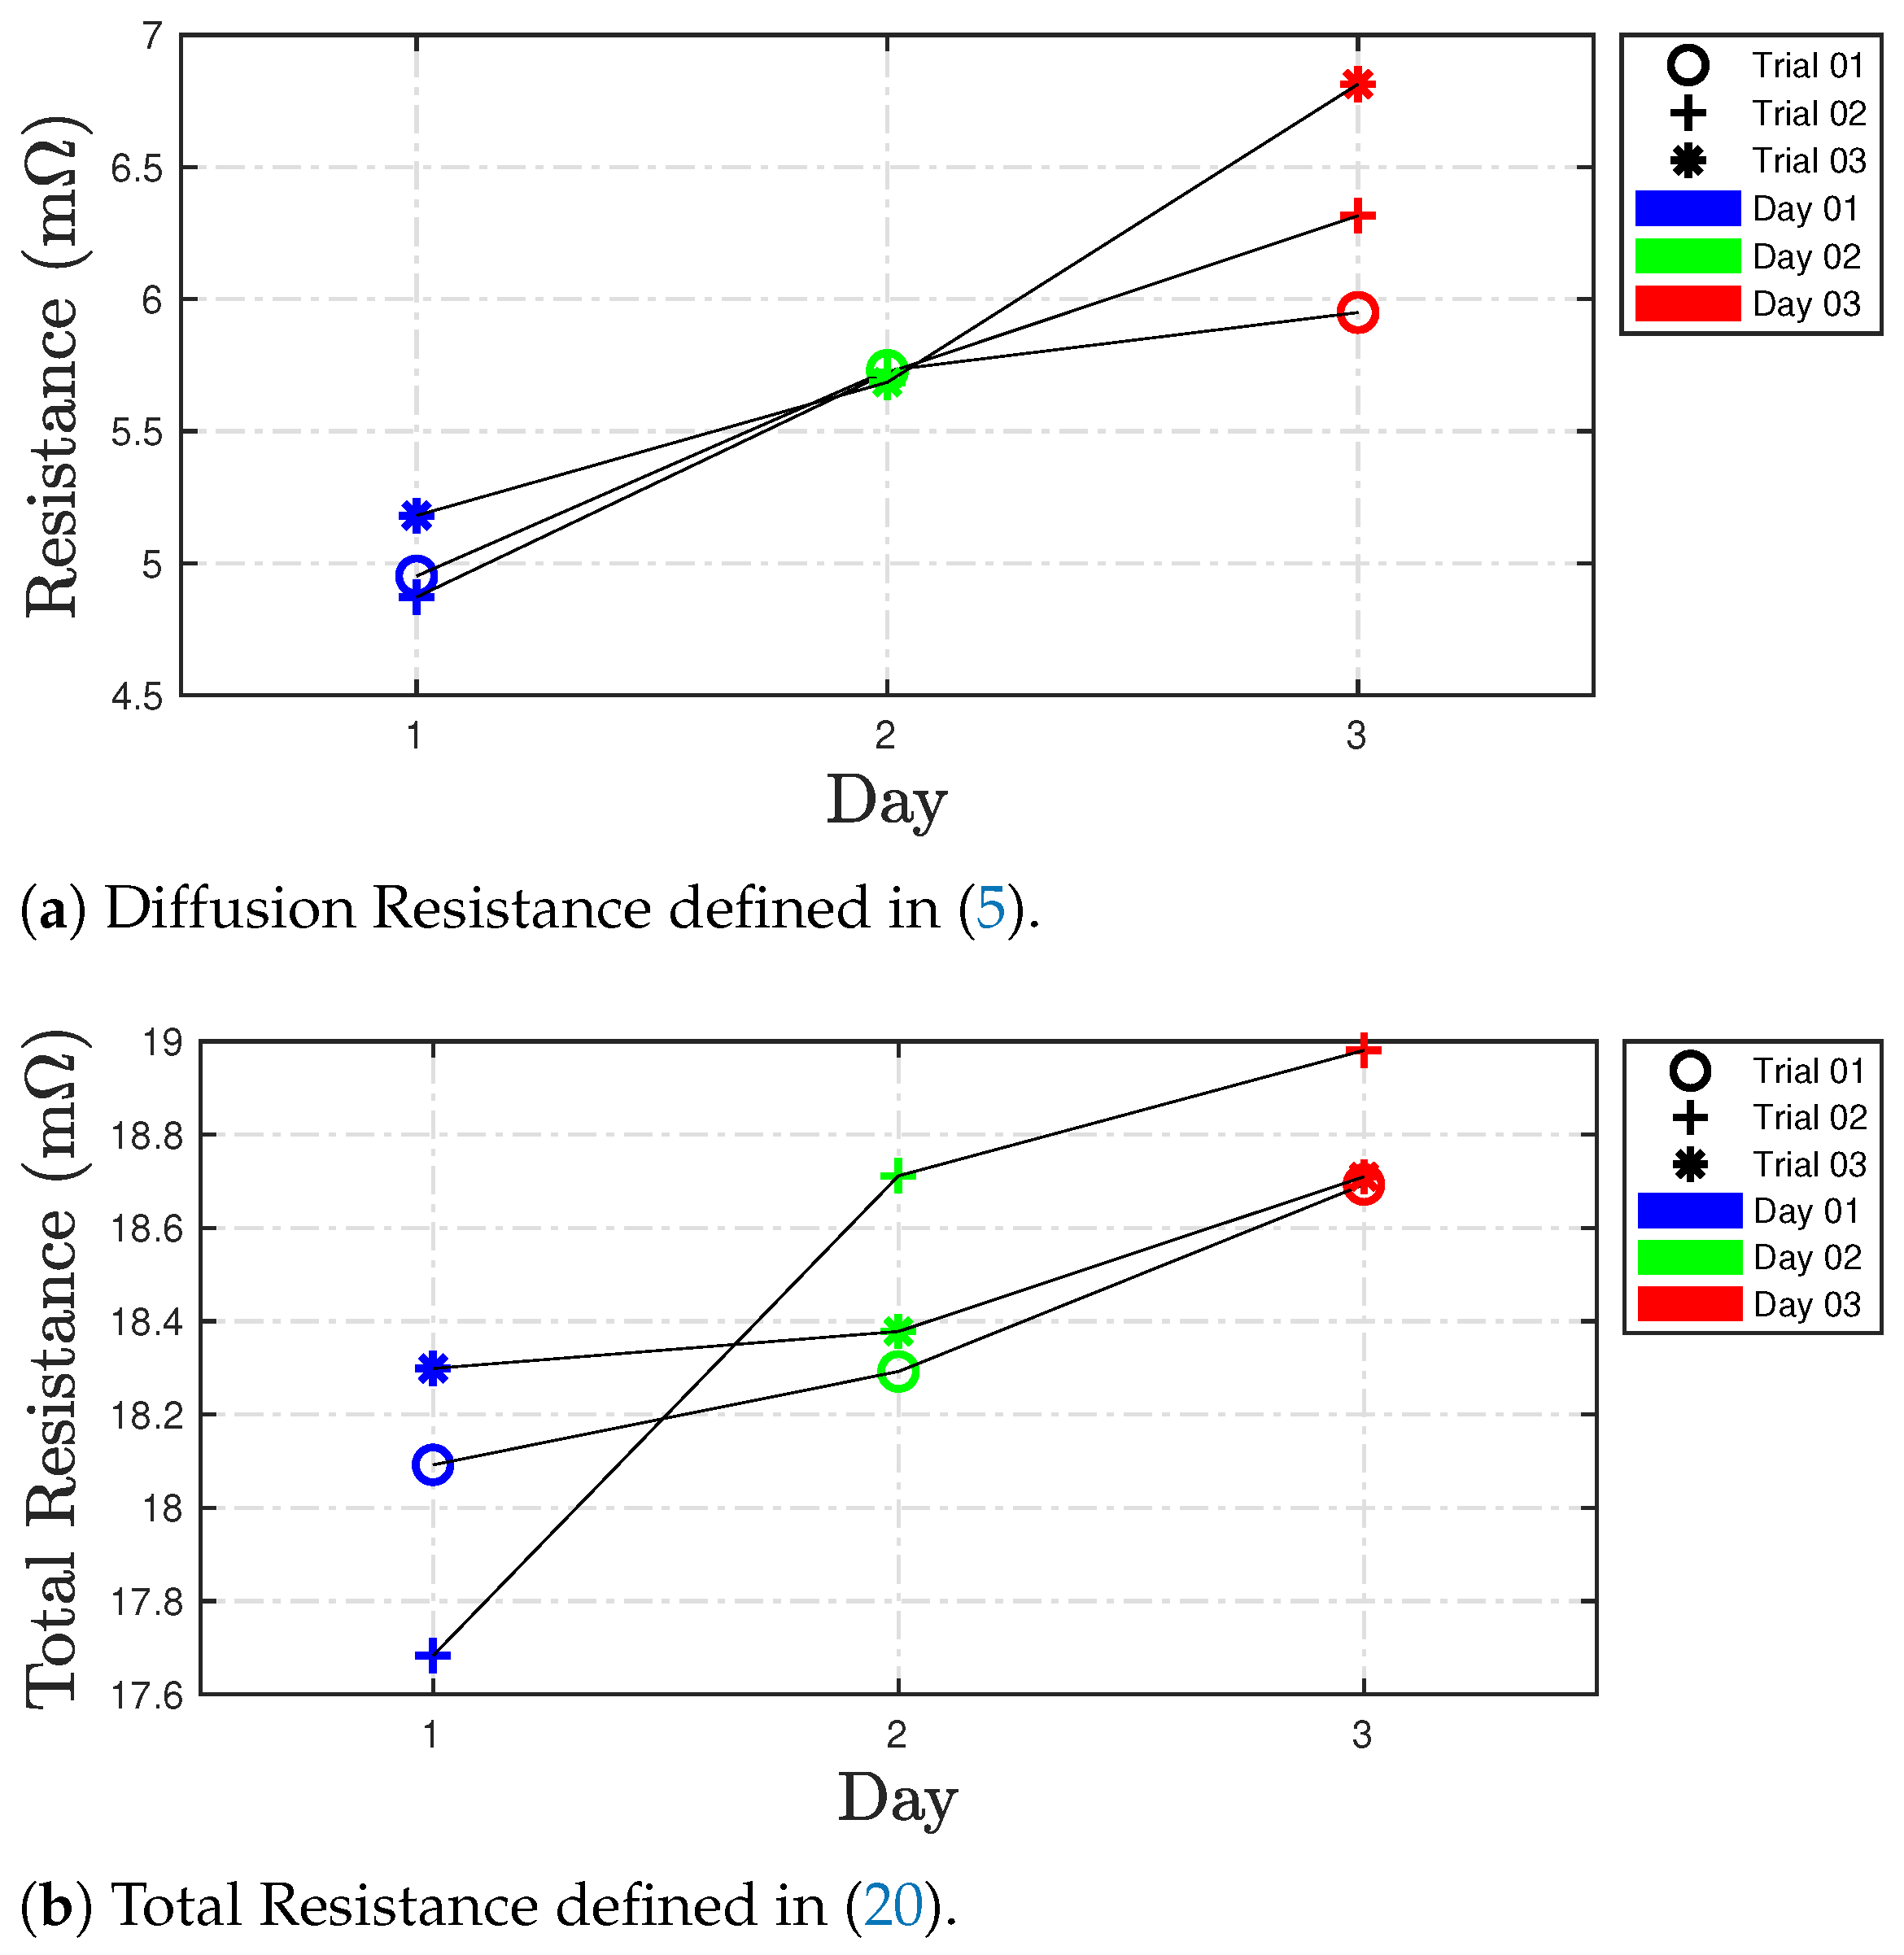
Now, using the estimates of and resistances, the diffusion resistance is computed using (5) and plotted in Figure 19a. Due to the minimal variation of the individual and resistances during Days 1 and 2, the diffusion resistance also exhibits similar patterns. Further, the diffusion resistance was observed to increase with the progression of days, i.e., the diffusion resistance recorded for Day 01 is smaller than that for Day 02, followed by the highest impedance recorded during Day 03. From Figure 19a, the variance in the diffusion resistance across the three days is observed to be 11.11%.
Figure 19.
Estimated resistance parameters.
Similarly, using the estimates of , and resistances, the total resistance is defined as
The total resistance computed above is plotted in Figure 19b. Similar to diffusion resistance, the total resistance is observed to also increase with the progression of days.
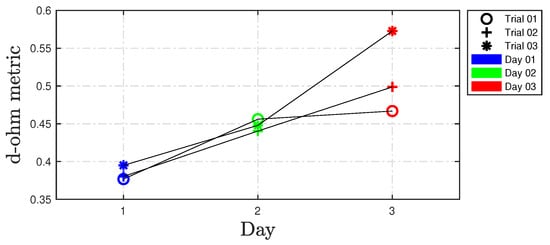
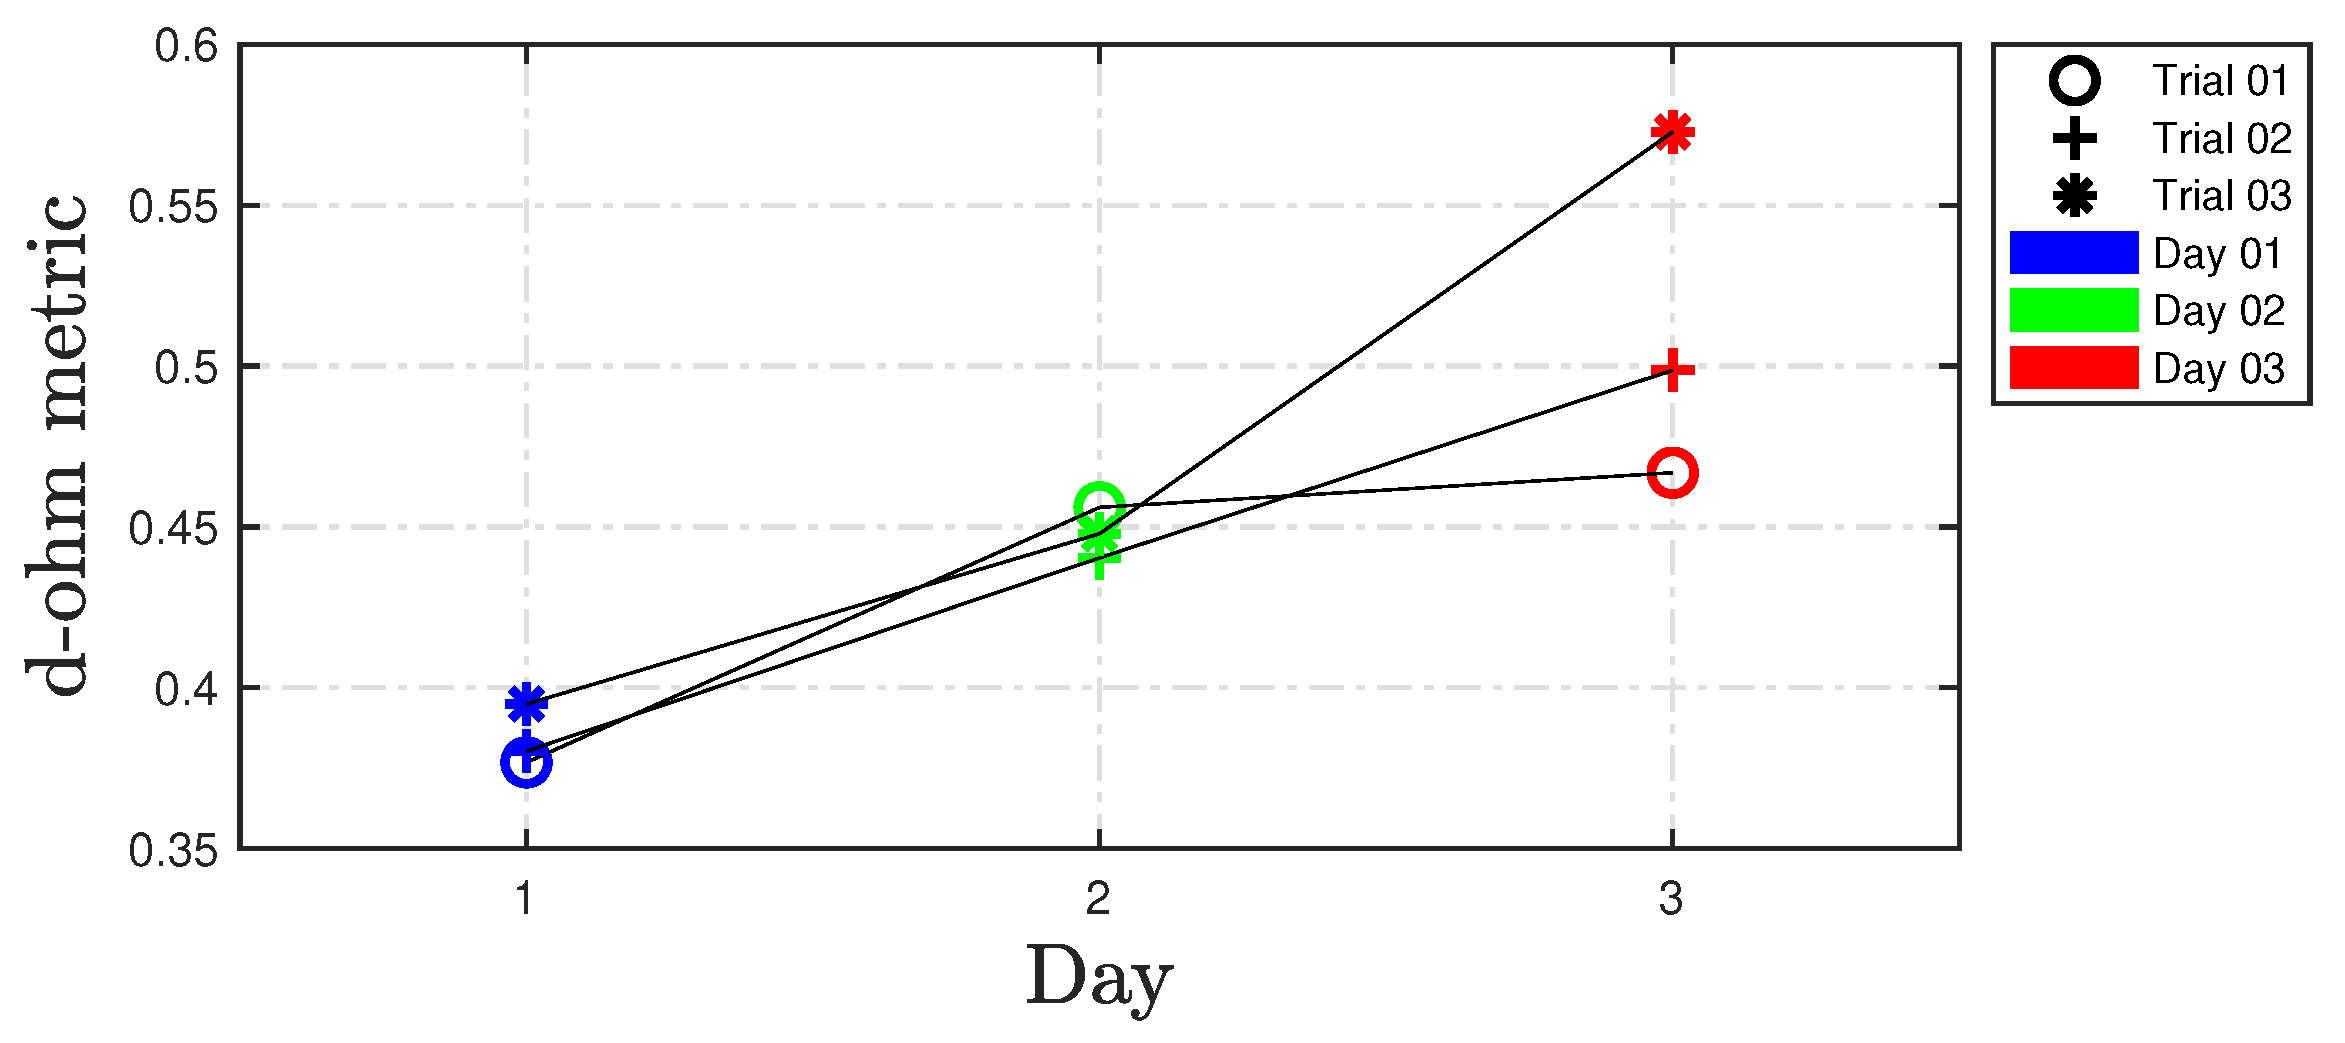
Figure 20 shows d-ohm metric computed using (12) for the battery that underwent three trials for three days. From the figure, it can be noticed that the ratio follows the same increasing pattern as that of the diffusion and total resistances shown in Figure 19.
Figure 20.
Ratio computed using (12).
4. Discussion
This paper investigates the uncertainty present in impedance spectra obtained from conventional Electrochemical Impedance Spectroscopy (EIS) measurements. For the first time, mathematical models are employed to characterize this uncertainty, and a novel d-ohm metric is introduced to quantify variations in both the impedance spectrum and the corresponding equivalent circuit model (ECM) parameters. The d-ohm metric is broadly applicable, being independent of battery chemistry, size, and experimental conditions. Its utility is demonstrated through an analysis of published datasets covering diverse chemistries, states of charge (SOC), and temperatures, as well as through repeated EIS measurements on a battery cell under controlled laboratory conditions.
Beyond the well-established factors influencing the impedance spectrum, such as state of health, SOC, temperature, and rest time, this work identifies drift as an additional source of variability. Repeated trials on the same cell at fixed SOC and temperature reveal measurable changes in the impedance spectrum, which manifest as bias and variance in ECM parameter estimation and can adversely affect SOH diagnostics. The findings highlight that current EIS-based diagnostic methodologies often overlook these systematic variations. By computing the mean impedance from multiple EIS measurements, the proposed approach mitigates drift-induced effects, providing a more robust and accurate framework for battery SOH estimation. Although the present study focuses on uncertainty in EIS-derived battery impedance features rather than on training data-driven SOH models, the observed bias and variability are relevant to such models because systematic shifts in input impedance features can propagate to downstream health estimates.
While the present study provides the first quantitative characterization of impedance drift under controlled experimental conditions, we acknowledge several limitations. The conclusions are limited to the operating conditions investigated, where SOC, AC excitation amplitude, and rest time were held constant. Consequently, the quantified impedance drift has not been separated from all other potential sources of impedance variability that may occur during battery operation. Additional studies under broader operating conditions are therefore needed to establish the generality of the proposed framework.
We identify several avenues for future research to further address variability in the impedance spectrum. Future works will aim to determine whether the identified drift effects persist under varying current profiles and to separate the respective contributions of temperature changes, ageing, rest time and other factors that lead to variations in the measured impedance. Further, systematic investigation is needed to assess whether the trends observed over three days in the battery continue beyond this timeframe and if/when the drift in the impedance spectrum stabilizes. All these future studies will help refine the d-ohm metric’s applicability across all factors affecting the impedance spectrum and allow battery researchers to accurately predict the SOH of a battery.
Author Contributions
Conceptualization, B.B. (Balakumar Balasingam) and P.P.; methodology, B.B. (Balakumar Balasingam) and P.P.; software, P.P.; validation, B.B. (Balakumar Balasingam), K.R.P. and P.P.; formal analysis, P.P.; investigation, B.B. (Banuselvasaraswathy Balasubramanian); resources, B.B. (Banuselvasaraswathy Balasubramanian); data curation, B.B. (Banuselvasaraswathy Balasubramanian); writing—original draft preparation, P.P.; writing—review and editing, K.R.P. and P.P.; visualization, P.P.; supervision, B.B. (Balakumar Balasingam) and K.R.P.; project administration, B.B. (Balakumar Balasingam). All authors have read and agreed to the published version of the manuscript.
Funding
This research was funded by the Natural Sciences and Engineering Research Council of Canada (NSERC) through the Discovery Grants (DG) Program under Grant RGPIN-2024-04557 and in part by the Alliance Program under Grant ALLRP 561015.
Data Availability Statement
The original contributions presented in this study are included in the article. Further inquiries can be directed to the corresponding author.
Conflicts of Interest
The authors declare no conflicts of interest. The funders had no role in the design of the study; in the collection, analyses, or interpretation of data; in the writing of the manuscript; or in the decision to publish the results.
References
- Kharal, A.Y.; Khalid, M.; Naqvi, I.H.; Arshad, N. Identification and quantification of degradation modes in lithium-ion battery cells under dynamic load conditions using equivalent circuit and physics-based models. J. Power Sources 2025, 632, 236274. [Google Scholar] [CrossRef] [Scilit]
- Iurilli, P.; Brivio, C.; Wood, V. On the use of electrochemical impedance spectroscopy to characterize and model the aging phenomena of lithium-ion batteries: A critical review. J. Power Sources 2021, 505, 229860. [Google Scholar] [CrossRef] [Scilit]
- Kurzweil, P.; Scheuerpflug, W.; Schell, C.; Schottenbauer, J. Useful Quantities and Diagram Types for Diagnosis and Monitoring of Electrochemical Energy Converters Using Impedance Spectroscopy: State of the Art, Review and Outlook. Batteries 2024, 10, 177. [Google Scholar] [CrossRef] [Scilit]
- Meddings, N.; Heinrich, M.; Overney, F.; Lee, J.S.; Ruiz, V.; Napolitano, E.; Seitz, S.; Hinds, G.; Raccichini, R.; Gaberšček, M.; et al. Application of electrochemical impedance spectroscopy to commercial Li-ion cells: A review. J. Power Sources 2020, 480, 228742. [Google Scholar] [CrossRef] [Scilit]
- Berrueta, A.; Urtasun, A.; Ursúa, A.; Sanchis, P. A comprehensive model for lithium-ion batteries: From the physical principles to an electrical model. Energy 2018, 144, 286–300. [Google Scholar] [CrossRef] [Scilit]
- Li, Q.; Yi, D.; Dang, G.; Zhao, H.; Lu, T.; Wang, Q.; Lai, C.; Xie, J. Electrochemical impedance spectrum (EIS) variation of lithium-ion batteries due to resting times in the charging processes. World Electr. Veh. J. 2023, 14, 321. [Google Scholar] [CrossRef] [Scilit]
- Lu, P.; Li, M.; Zhang, L.; Zhou, L. A novel fast-EIS measuring method and implementation for lithium-ion batteries. In Proceedings of the 2019 Prognostics and System Health Management Conference (PHM-Qingdao); IEEE: New York, NY, USA, 2019; pp. 1–6. [Google Scholar]
- Ng, M.F.; Zhao, J.; Yan, Q.; Conduit, G.J.; Seh, Z.W. Predicting the state of charge and health of batteries using data-driven machine learning. Nat. Mach. Intell. 2020, 2, 161–170. [Google Scholar] [CrossRef] [Scilit]
- Messing, M.; Shoa, T.; Ahmed, R.; Habibi, S. Battery SoC estimation from EIS using neural nets. In Proceedings of the 2020 IEEE Transportation Electrification Conference & Expo (ITEC); IEEE: New York, NY, USA, 2020; pp. 588–593. [Google Scholar]
- Chang, C.; Su, G.; Cen, H.; Jiang, J.; Tian, A.; Gao, Y.; Wu, T. Research on State of Health Estimation of Lithium Batteries Based on Electrochemical Impedance Spectroscopy and CNN-VIT Models. J. Electrochem. Energy Convers. Storage 2024, 21, 041008. [Google Scholar] [CrossRef] [Scilit]
- Tang, X.; Meng, X.; Liu, Z.; Miao, Y.; Hasanien, H.M.; Li, M.; Liu, J.; Sun, C. State of Health Estimation and Degradation Quantification of PEMFCs Using a Dynamic Coupling Method of Data-driven and Electrochemical Impedance. IEEE Trans. Transp. Electrif. 2026; early access.
- He, R.; Guo, B. Remaining Useful Life Prediction Based on Electrochemical Impedance Characteristic Distribution. In Proceedings of the 2024 IEEE Transportation Electrification Conference and Expo, Asia-Pacific (ITEC Asia-Pacific); IEEE: New York, NY, USA, 2024; pp. 478–483. [Google Scholar]
- Hosen, M.S.; Gopalakrishnan, R.; Kalogiannis, T.; Jaguemont, J.; Van Mierlo, J.; Berecibar, M. Impact of relaxation time on electrochemical impedance spectroscopy characterization of the most common lithium battery technologies—experimental study and chemistry-neutral modeling. World Electr. Veh. J. 2021, 12, 77. [Google Scholar] [CrossRef] [Scilit]
- Waag, W.; Käbitz, S.; Sauer, D.U. Experimental investigation of the lithium-ion battery impedance characteristic at various conditions and aging states and its influence on the application. Appl. Energy 2013, 102, 885–897. [Google Scholar] [CrossRef] [Scilit]
- Zhang, Q.; Huang, C.G.; Li, H.; Feng, G.; Peng, W. Electrochemical impedance spectroscopy based state-of-health estimation for lithium-ion battery considering temperature and state-of-charge effect. IEEE Trans. Transp. Electrif. 2022, 8, 4633–4645. [Google Scholar] [CrossRef] [Scilit]
- Li, J.; Li, T.; Qiao, Y.; Tan, Z.; Qiu, X.; Deng, H.; Li, W.; Qi, X.; Wu, W. Internal temperature estimation method for lithium-ion battery based on multi-frequency imaginary part impedance and GPR model. J. Energy Storage 2025, 118, 116287. [Google Scholar] [CrossRef] [Scilit]
- Chang, C.; Wang, S.; Tao, C.; Jiang, J.; Jiang, Y.; Wang, L. An improvement of equivalent circuit model for state of health estimation of lithium-ion batteries based on mid-frequency and low-frequency electrochemical impedance spectroscopy. Measurement 2022, 202, 111795. [Google Scholar] [CrossRef] [Scilit]
- Wang, X.; Wei, X.; Dai, H. Estimation of state of health of lithium-ion batteries based on charge transfer resistance considering different temperature and state of charge. J. Energy Storage 2019, 21, 618–631. [Google Scholar] [CrossRef] [Scilit]
- Li, Y.; Ye, M.; Wang, Q.; Lian, G.; Kemény, M.; Xia, B.; Zhang, B. Capacity estimation of lithium-ion battery through interpretation of electrochemical impedance spectroscopy combined with machine learning. Measurement 2025, 243, 116374. [Google Scholar] [CrossRef] [Scilit]
- Kasper, M.; Leike, A.; Thielmann, J.; Winkler, C.; R-Smith, N.A.Z.; Kienberger, F. Electrochemical impedance spectroscopy error analysis and round robin on dummy cells and lithium-ion-batteries. J. Power Sources 2022, 536, 231407. [Google Scholar] [CrossRef] [Scilit]
- Kollmeyer, P.; Hackl, A.; Emadi, A. Li-ion battery model performance for automotive drive cycles with current pulse and EIS parameterization. In Proceedings of the 2017 IEEE Transportation Electrification Conference and Expo (ITEC); IEEE: New York, NY, USA, 2017; pp. 486–492. [Google Scholar]
- Messing, M.; Shoa, T.; Habibi, S. Lithium-ion battery relaxation effects. In Proceedings of the 2019 IEEE Transportation Electrification Conference and Expo (ITEC); IEEE: New York, NY, USA, 2019; pp. 1–6. [Google Scholar]
- Andre, D.; Meiler, M.; Steiner, K.; Wimmer, C.; Soczka-Guth, T.; Sauer, D. Characterization of high-power lithium-ion batteries by electrochemical impedance spectroscopy. I. Experimental investigation. J. Power Sources 2011, 196, 5334–5341. [Google Scholar] [CrossRef] [Scilit]
- Fly, A.; Wimarshana, B.; Bin-Mat-Arishad, I.; Sarmiento-Carnevali, M. Temperature dependency of diagnostic methods in lithium-ion batteries. J. Energy Storage 2022, 52, 104721. [Google Scholar] [CrossRef] [Scilit]
- Gomez, J.; Nelson, R.; Kalu, E.E.; Weatherspoon, M.H.; Zheng, J.P. Equivalent circuit model parameters of a high-power Li-ion battery: Thermal and state of charge effects. J. Power Sources 2011, 196, 4826–4831. [Google Scholar] [CrossRef] [Scilit]
- Liao, L.; Zuo, P.; Ma, Y.; Chen, X.; An, Y.; Gao, Y.; Yin, G. Effects of temperature on charge/discharge behaviors of LiFePO4 cathode for Li-ion batteries. Electrochim. Acta 2012, 60, 269–273. [Google Scholar] [CrossRef] [Scilit]
- Leng, X.; Li, Y.; Xu, G.; Xiong, W.; Xiao, S.; Li, C.; Chen, J.; Yang, M.; Li, S.; Chen, Y.; et al. Prediction of lithium-ion battery internal temperature using the imaginary part of electrochemical impedance spectroscopy. Int. J. Heat Mass Transf. 2025, 240, 126664. [Google Scholar] [CrossRef] [Scilit]
- Mustafa, H.; Bourelly, C.; Vitelli, M.; Milano, F.; Molinara, M.; Ferrigno, L. SoC estimation on Li-ion batteries: A new EIS-based dataset for data-driven applications. Data Brief 2024, 57, 110947. [Google Scholar] [CrossRef] [Scilit] [PubMed]
- Budde-Meiwes, H.; Kowal, J.; Sauer, D.U.; Karden, E. Influence of measurement procedure on quality of impedance spectra on lead–acid batteries. J. Power Sources 2011, 196, 10415–10423. [Google Scholar] [CrossRef] [Scilit]
- Su, T.F.; Chen, K.C. Rapid monitor of states of lithium-ion batteries through non-quasi-static electrochemical impedance spectroscopy and terminal voltage. J. Power Sources 2023, 586, 233641. [Google Scholar] [CrossRef] [Scilit]
- Westerhoff, U.; Kroker, T.; Kurbach, K.; Kurrat, M. Electrochemical impedance spectroscopy based estimation of the state of charge of lithium-ion batteries. J. Energy Storage 2016, 8, 244–256. [Google Scholar] [CrossRef] [Scilit]
- Ran, L.; Junfeng, W.; Haiying, W.; Gechen, L. Prediction of state of charge of lithium-ion rechargeable battery with electrochemical impedance spectroscopy theory. In Proceedings of the 2010 5th IEEE Conference on Industrial Electronics and Applications; IEEE: New York, NY, USA, 2010; pp. 684–688. [Google Scholar]
- Buller, S.; Thele, M.; De Doncker, R.W.; Karden, E. Impedance-based simulation models of supercapacitors and Li-ion batteries for power electronic applications. IEEE Trans. Ind. Appl. 2005, 41, 742–747. [Google Scholar] [CrossRef] [Scilit]
- Zhang, X.; Zhang, L.; Wu, J.; Bai, W.; Dai, H.; Lin, H.; Zhang, F.; Yang, Y. SOC estimation of lithium-ion batteries using equivalent circuit model and Nyquist plots from EIS data: A machine learning approach. J. Electroanal. Chem. 2025, 987, 119093. [Google Scholar] [CrossRef] [Scilit]
- Yu, M.; Meng, S.; Wei, R.; Tang, T.; Hu, Y.; Xu, J.; Hu, D.; Ding, J. Continuous characterization of reversible and irreversible heat of lithium-ion batteries using online electrochemical impedance spectroscopy and differential isothermal calorimetry. Measurement 2025, 253, 117548. [Google Scholar] [CrossRef] [Scilit]
- Zhang, W.; Ahmed, R.; Habibi, S. Understanding the impact of recent usage on lithium-ion battery impedance through the relaxation phenomena. J. Power Sources 2025, 630, 236108. [Google Scholar] [CrossRef] [Scilit]
- Barai, A.; Chouchelamane, G.H.; Guo, Y.; McGordon, A.; Jennings, P. A study on the impact of lithium-ion cell relaxation on electrochemical impedance spectroscopy. J. Power Sources 2015, 280, 74–80. [Google Scholar] [CrossRef] [Scilit]
- Messing, M.; Shoa, T.; Habibi, S. Electrochemical impedance spectroscopy with practical rest-times for battery management applications. IEEE Access 2021, 9, 66989–66998. [Google Scholar] [CrossRef] [Scilit]
- Kindermann, F.M.; Noel, A.; Erhard, S.V.; Jossen, A. Long-term equalization effects in Li-ion batteries due to local state of charge inhomogeneities and their impact on impedance measurements. Electrochim. Acta 2015, 185, 107–116. [Google Scholar] [CrossRef] [Scilit]
- Pulido, Y.F.; Blanco, C.; Anseán, D.; García, V.M.; Ferrero, F.; Valledor, M. Determination of suitable parameters for battery analysis by Electrochemical Impedance Spectroscopy. Measurement 2017, 106, 1–11. [Google Scholar] [CrossRef] [Scilit]
- Azizighalehsari, S.; Ning, Z.; Breazu, B.; Venugopal, P.; Rietveld, G.; Soeiro, T.B. Battery dynamics exploration: Insights and implications of relaxation time in electrochemical impedance spectroscopy. In Proceedings of the 2023 IEEE 8th Southern Power Electronics Conference and 17th Brazilian Power Electronics Conference (SPEC/COBEP); IEEE: New York, NY, USA, 2023; pp. 1–6. [Google Scholar]
- De Angelis, A.; Buchicchio, E.; Santoni, F.; Moschitta, A.; Carbone, P. Uncertainty characterization of a practical system for broadband measurement of battery EIS. IEEE Trans. Instrum. Meas. 2022, 71, 1002609. [Google Scholar] [CrossRef] [Scilit]
- Giner-Sanz, J.J.; Ortega, E.; Pérez-Herranz, V. Optimization of the perturbation amplitude for EIS measurements using a total harmonic distortion based method. J. Electrochem. Soc. 2018, 165, E488. [Google Scholar] [CrossRef] [Scilit]
- Pillai, P.; Balasubramanian, B.; Pattipati, K.R.; Balasingam, B. Uncertainty Quantification of Electrochemical Impedance Spectroscopy for Battery State of Health Estimation. In Proceedings of the 2025 IEEE 4th Industrial Electronics Society Annual On-Line Conference (ONCON); IEEE: New York, NY, USA, 2025; pp. 1–6. [Google Scholar]
- Balasingam, B. Robust Battery Management System Design with MATLAB; Artech House: Norwood, MA, USA, 2023. [Google Scholar]
- Abaspour, M.; Pattipati, K.R.; Shahrrava, B.; Balasingam, B. Robust approach to battery equivalent-circuit-model parameter extraction using electrochemical impedance spectroscopy. Energies 2022, 15, 9251. [Google Scholar] [CrossRef] [Scilit]
- Pillai, P.; Nguyen, N.; Balasingam, B. Performance analysis of empirical open-circuit voltage modeling in lithium-ion batteries, part-1: Performance measures. IEEE Trans. Transp. Electrif. 2026. [Google Scholar] [CrossRef] [Scilit]
- Pillai, P.; Nguyen, J.; Balasingam, B. Performance analysis of empirical open-circuit voltage modeling in lithium-ion batteries, part-2: Data collection procedure. IEEE Trans. Transp. Electrif. 2024, 11, 153–162. [Google Scholar]
- Pillai, P.; Nguyen, J.; Balasingam, B. Performance Analysis of Empirical Open-Circuit Voltage Modeling in Lithium-Ion Batteries—Part 3: Experimental Results. IEEE Trans. Transp. Electrif. 2024, 10, 7258–7274. [Google Scholar] [CrossRef] [Scilit]
- Balasubramanian, B.; Pillai, P.; Sakr, A.H.; Balasingam, B. Quantification of Drift in Battery Impedance Spectroscopy Due to State of Charge, Current Amplitude and Rest Time. IEEE Trans. Transp. Electrif. 2026, 12, 4513–4527. [Google Scholar] [CrossRef] [Scilit]

Disclaimer/Publisher’s Note: The statements, opinions and data contained in all publications are solely those of the individual author(s) and contributor(s) and not of MDPI and/or the editor(s). MDPI and/or the editor(s) disclaim responsibility for any injury to people or property resulting from any ideas, methods, instructions or products referred to in the content. |
© 2026 by the authors. Licensee MDPI, Basel, Switzerland. This article is an open access article distributed under the terms and conditions of the Creative Commons Attribution (CC BY) license.