


Abstract
Vanadium redox flow batteries (VRBs) are a promising technology for large-scale energy storage because of their high safety, long cycle life, and flexible capacity design. However, pump malfunctions during operation may disturb electrolyte flow distribution, induce electrochemical instability, and, under severe conditions, accelerate stack degradation, thereby reducing system safety and operational reliability. Restricted by factors including the nonlinear coupling between sensor signals and operating conditions, as well as the intricate electrochemical processes triggered by pump faults, effective fault diagnosis for VRB pumps remains a prominent challenge. The paper proposes a novel Temporal Convolutional Network (TCN)–Long Short-Term Memory (LSTM)–Multi-Head Self-Attention (MATT) deep learning framework for intelligent pump fault diagnosis. The framework operates through three complementary stages. Comprehensive experimental validation is conducted using a purpose-built VRB fault experimental platform under various current conditions. The results show that the proposed model achieves diagnostic accuracies exceeding 90% for all three investigated pump fault types, namely bilateral pump fault, positive pump fault, and negative pump fault. Comparative analysis confirms that the proposed model significantly outperforms other architectures. The effectiveness of the MATT in enhancing temporal feature extraction and fault diagnosis accuracy for VRB systems is validated.
1. Introduction
Fossil fuels constitute the dominant component of global primary energy consumption, accounting for over 80% of total energy supply. Nevertheless, associated challenges including resource depletion, climate change, and geopolitical instability present significant systemic risks [1,2,3]. In response to these challenges, extensive research efforts have focused on developing renewable energy technologies to address global energy requirements. However, the intermittent and fluctuating nature of renewable energy sources, such as wind and solar power, creates challenges for stable grid integration. Therefore, high-performance energy storage technologies have attracted increasing attention because they can smooth renewable power fluctuations, enhance grid flexibility, and support sustainable energy systems [4,5,6]. Contemporary energy storage technologies can be classified into four primary categories. Mechanical and other long-duration energy storage technologies, such as flywheel, pumped hydro, and compressed air energy storage, can provide large-scale grid flexibility and support renewable energy integration, but their deployment is constrained by site conditions, storage duration, cost, and system-level operating requirements [7,8]. Electromagnetic energy storage technologies have the advantages of high power density and fast response, but their large-scale application is still limited by cost, system complexity, and application adaptability [9]. Phase change energy storage achieves thermal management through material phase transitions and, while having economic advantages, is susceptible to environmental degradation [10]. Among these technologies, electrochemical energy storage has attracted extensive attention because of its rapid response, flexible deployment, high efficiency, and suitability for renewable-energy integration and distributed energy systems [11]. Lithium-ion batteries (LIBs) have been widely studied as rechargeable batteries based on intercalation chemistry [12]. However, unlike sealed LIB cells, VRBs require continuous electrolyte circulation during operation. Therefore, pump-induced flow imbalance is a characteristic and safety-critical fault mode in VRB systems.
Among electrochemical energy storage technologies, flow battery technology has significant development prospects due to its characteristics of high safety, long cycle count, and flexible capacity expansion [13,14,15]. Among various types of flow batteries, VRBs are considered one of the most mature and promising technologies for large-scale energy storage because of their long cycle life, high safety, and flexible capacity design [16]. VRBs employ vanadium ion redox reactions and effectively reduce cross-contamination through a dual-electrolyte circulation design, demonstrating high technical maturity compared with other flow battery systems [17,18,19]. However, during dynamic operation, circulation pump faults can cause electrolyte flow imbalance and unstable mass transport, resulting in abnormal voltage responses and local electrochemical non-uniformity. Under severe or long-term fault conditions, these effects may aggravate side reactions, electrolyte imbalance, and capacity decay, posing potential risks to VRB safety and operational stability [20]. These fault characteristics exhibit strong coupling and nonlinearity, making effective pump fault diagnosis essential for safe VRB operation.
Common battery fault diagnosis methods can be categorized into three types: physics-based methods, information theory-based methods, and data-driven methods. Physics-based fault diagnosis methods establish electrochemical, thermal, or equivalent-circuit models to estimate key internal battery parameters through state estimation and parameter identification. When battery faults occur, these key parameters undergo abnormal changes, enabling identification and detection of battery fault conditions. Pan et al. [21] combined Pearson correlation coefficients with extended Kalman filtering and sliding-mode observers to monitor voltage and temperature in real time, achieving rapid detection of internal short circuits and fault severity diagnosis in lithium-ion batteries. Ma et al. [22] achieved precise localization of faulty batteries within battery packs by comparing parameter differences between the worst-performing battery and the average battery in the pack. Mehta et al. [23] investigated the integration of thermal reduced-order models (TROM) with anomaly detection (AD) algorithms to identify performance deviations for predictive battery maintenance. However, physics-based approaches exhibit limitations regarding accuracy under dynamic operating conditions and applicability to multi-fault coupling scenarios.
Information theory-based fault diagnosis methods are primarily applied at the battery pack level and can be divided into two categories: statistical analysis and signal processing. These methods usually have low computational requirements and are easy to deploy. Qiu et al. [24] proposed a multi-level Shannon entropy-based fault diagnosis and inconsistency assessment procedure for battery energy storage systems. Gu et al. [25] proposed a precise minor-fault diagnosis method for lithium-ion batteries based on phase plane sample entropy. By constructing a voltage phase plane using voltage and first-order voltage difference, the method calculates two-dimensional sample entropy in a sliding window to detect early minor faults and predict their occurrence time. Chang et al. [26] converted one-dimensional voltage signals into two-dimensional time-frequency maps using continuous wavelet transform and used image entropy to identify voltage faults. While information theory-based methods effectively quantify data uncertainty, the limited physical correlation between fault mechanisms and information indicators constrains their interpretability and practical engineering applications.
Data-driven fault diagnosis methods can perform battery fault diagnosis without requiring highly accurate battery models. For example, Zhao et al. [27] proposed an autoencoder method based on hybrid features (combining voltage, current, and equivalent circuit model parameters) and generative adversarial network (GAN) training for early detection of lithium-ion battery short-circuit faults. However, the representativeness and diversity of available fault data still affect the generalization ability of data-driven models. Recent studies have further demonstrated the potential of advanced data-driven methods for battery fault diagnosis under complex operating conditions. Zhao et al. [28] developed a spatio-temporal Transformer network for battery fault diagnosis and failure prognosis using field data from electric vehicles, showing the capability of Transformer-based models to capture multi-scale temporal information in battery operating signals. Cao et al. [29] proposed a model-constrained deep learning framework for online fault diagnosis of lithium-ion batteries under stochastic operating conditions, highlighting the importance of combining data-driven modeling with physical constraints for real-time battery safety monitoring. Ouyang et al. [30] introduced an optimized graph neural network to diagnose voltage faults by learning the coupling relationships among battery cells, which improved the localization performance of voltage-related faults. Li et al. [31] proposed a feature engineering-driven multi-scale voltage anomaly detection method using real-world electric vehicle data, demonstrating the importance of extracting sensitive voltage features for early anomaly detection. Yu et al. [32] reviewed the challenges of lithium-ion battery fault diagnosis from laboratory studies to real-world applications, emphasizing that model generalization, real operating data, and robust feature extraction remain key issues.
Although these recent studies have advanced battery fault diagnosis, most of them focus on lithium-ion battery systems. Compared with sealed lithium-ion batteries, VRBs rely on continuous electrolyte circulation, and pump-induced flow imbalance is a characteristic and safety-critical fault mode. Therefore, intelligent diagnosis of VRB pump faults under different current conditions still requires further investigation. In addition, existing single neural network architectures often have difficulty capturing local temporal patterns and long-term dependencies simultaneously, and they usually do not explicitly distinguish the importance of different time positions within a sequence.
To address the above problems, this study proposes a TCN-LSTM-MATT deep learning framework for intelligent pump fault diagnosis in VRB systems. Different from existing TCN-LSTM or attention-based fault diagnosis methods, the proposed method is developed for VRB pump fault signals under different current conditions by combining pump-fault-related feature construction with hybrid temporal feature extraction. The novelty of this work can be summarized as follows:
- Pump-fault-related input features, including current, voltage, SOC, ∆R, and dU/dt, are constructed to describe both the static operating state and dynamic voltage variation of VRB pump faults;
- A hybrid TCN-LSTM structure is developed to extract local dynamic patterns and sequential dependencies from VRB pump fault data;
- A multi-head self-attention module is introduced to adaptively weight key fault-related temporal information within the sliding window, thereby improving the diagnosis performance for different pump fault types.
The rest of this paper is organized as follows: Section 2 introduces the working principle of VRB. Section 3 describes the proposed TCN-LSTM-MATT fault diagnosis model. Section 4 presents the experimental platform, experimental procedure, data preprocessing, and fault feature extraction. Section 5 discusses the fault diagnosis results and compares the proposed method with other models. Section 6 concludes the paper and outlines future work.
2. VRB Reactions
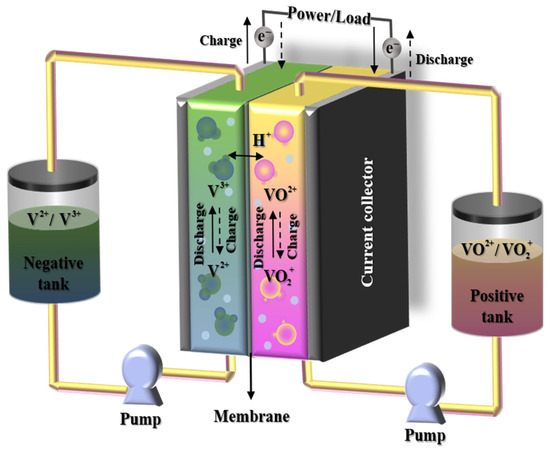
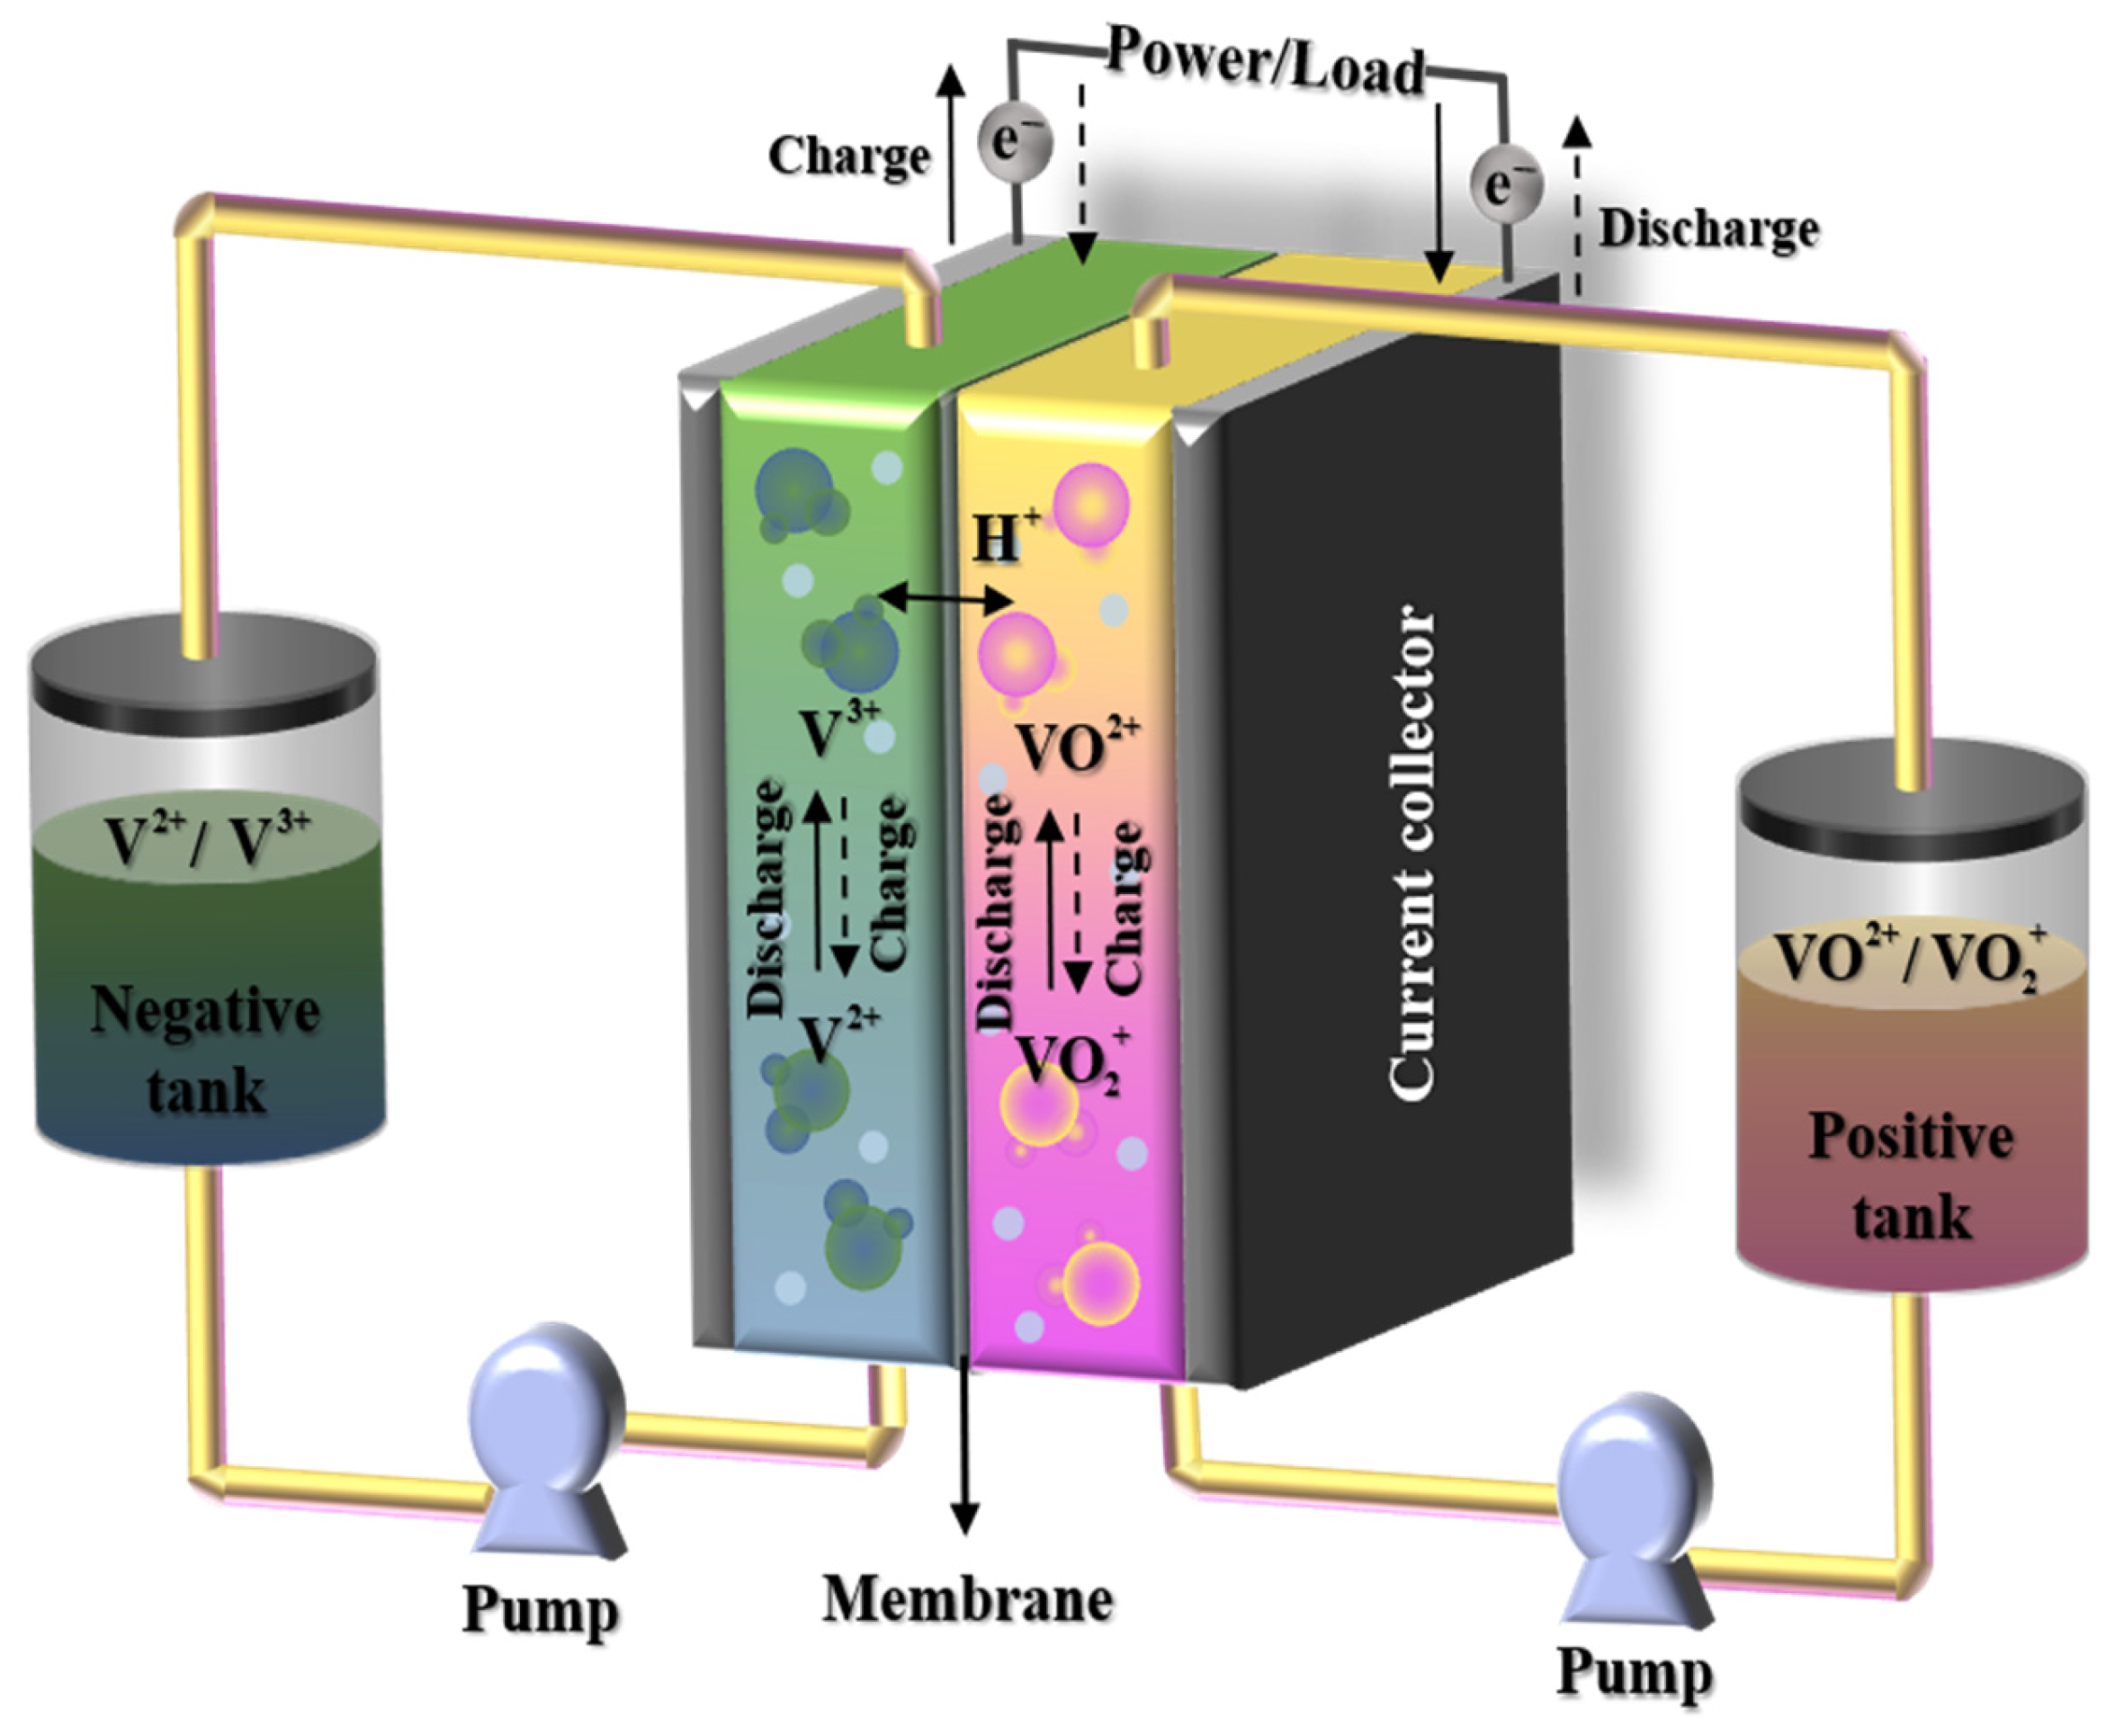
VRB is a type of redox flow battery in which vanadium ions of different valence states serve as electrode-active reactants in solution form, stored separately in positive (VO2+/VO2+ redox couple) and negative (V2+/V3+ redox couple) electrolyte tanks, as shown in Figure 1. During operation, the positive and negative electrolytes are circulated through the stack by pumps and are separated by a proton exchange membrane, which allows proton transport while reducing electrolyte crossover. Redox reactions of vanadium ions at electrodes and hydrogen ion migration across the membrane complete the charge–discharge process, with distinct color changes of vanadium ions enabling rough state estimation. VRB has a theoretical standard potential of ~1.26 V, and a practical single-cell open-circuit voltage of 1.5–1.7 V.
Figure 1.
Schematic of the VRB system.
Pump faults, typically manifested as abnormal pipeline pressure, irregular flow rate and stack voltage fluctuations, will cause electrolyte flow imbalance. Prolonged operation under pump faults leads to insufficient local electrolyte supply in the stack, elevates positive potential, accelerates electrode corrosion, and triggers high local potential gradients, which aggravate side reactions on bipolar plates. Severe faults may even cause system shutdown and irreversible structural damage, posing major threats to operation safety. All chemical reactions of VRB are listed in Table 1.
Table 1.
Chemical reactions in VRB.
3. Theoretical Background
3.1. Temporal Convolutional Networks (TCN)
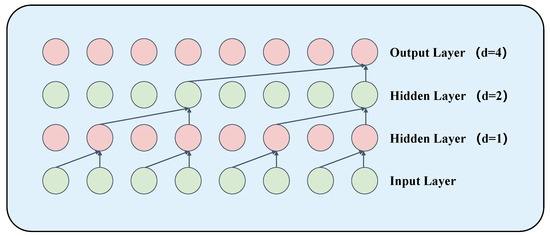
TCN is a deep learning architecture derived from convolutional neural networks (CNNs) for sequence modeling. It borrows convolution operations from CNN but uses dilated convolutions and causal convolutions, where the convolution window becomes larger in upper layers with more ‘holes’ in the convolution window. Compared with conventional CNNs, TCNs can capture long-range temporal dependencies more effectively through dilated causal convolutions.
The definition of dilated convolution is given below. For filter f = (f1, f2, …, fk) and sequence X = (x1, x2, …, xT), the dilated convolution is calculated as
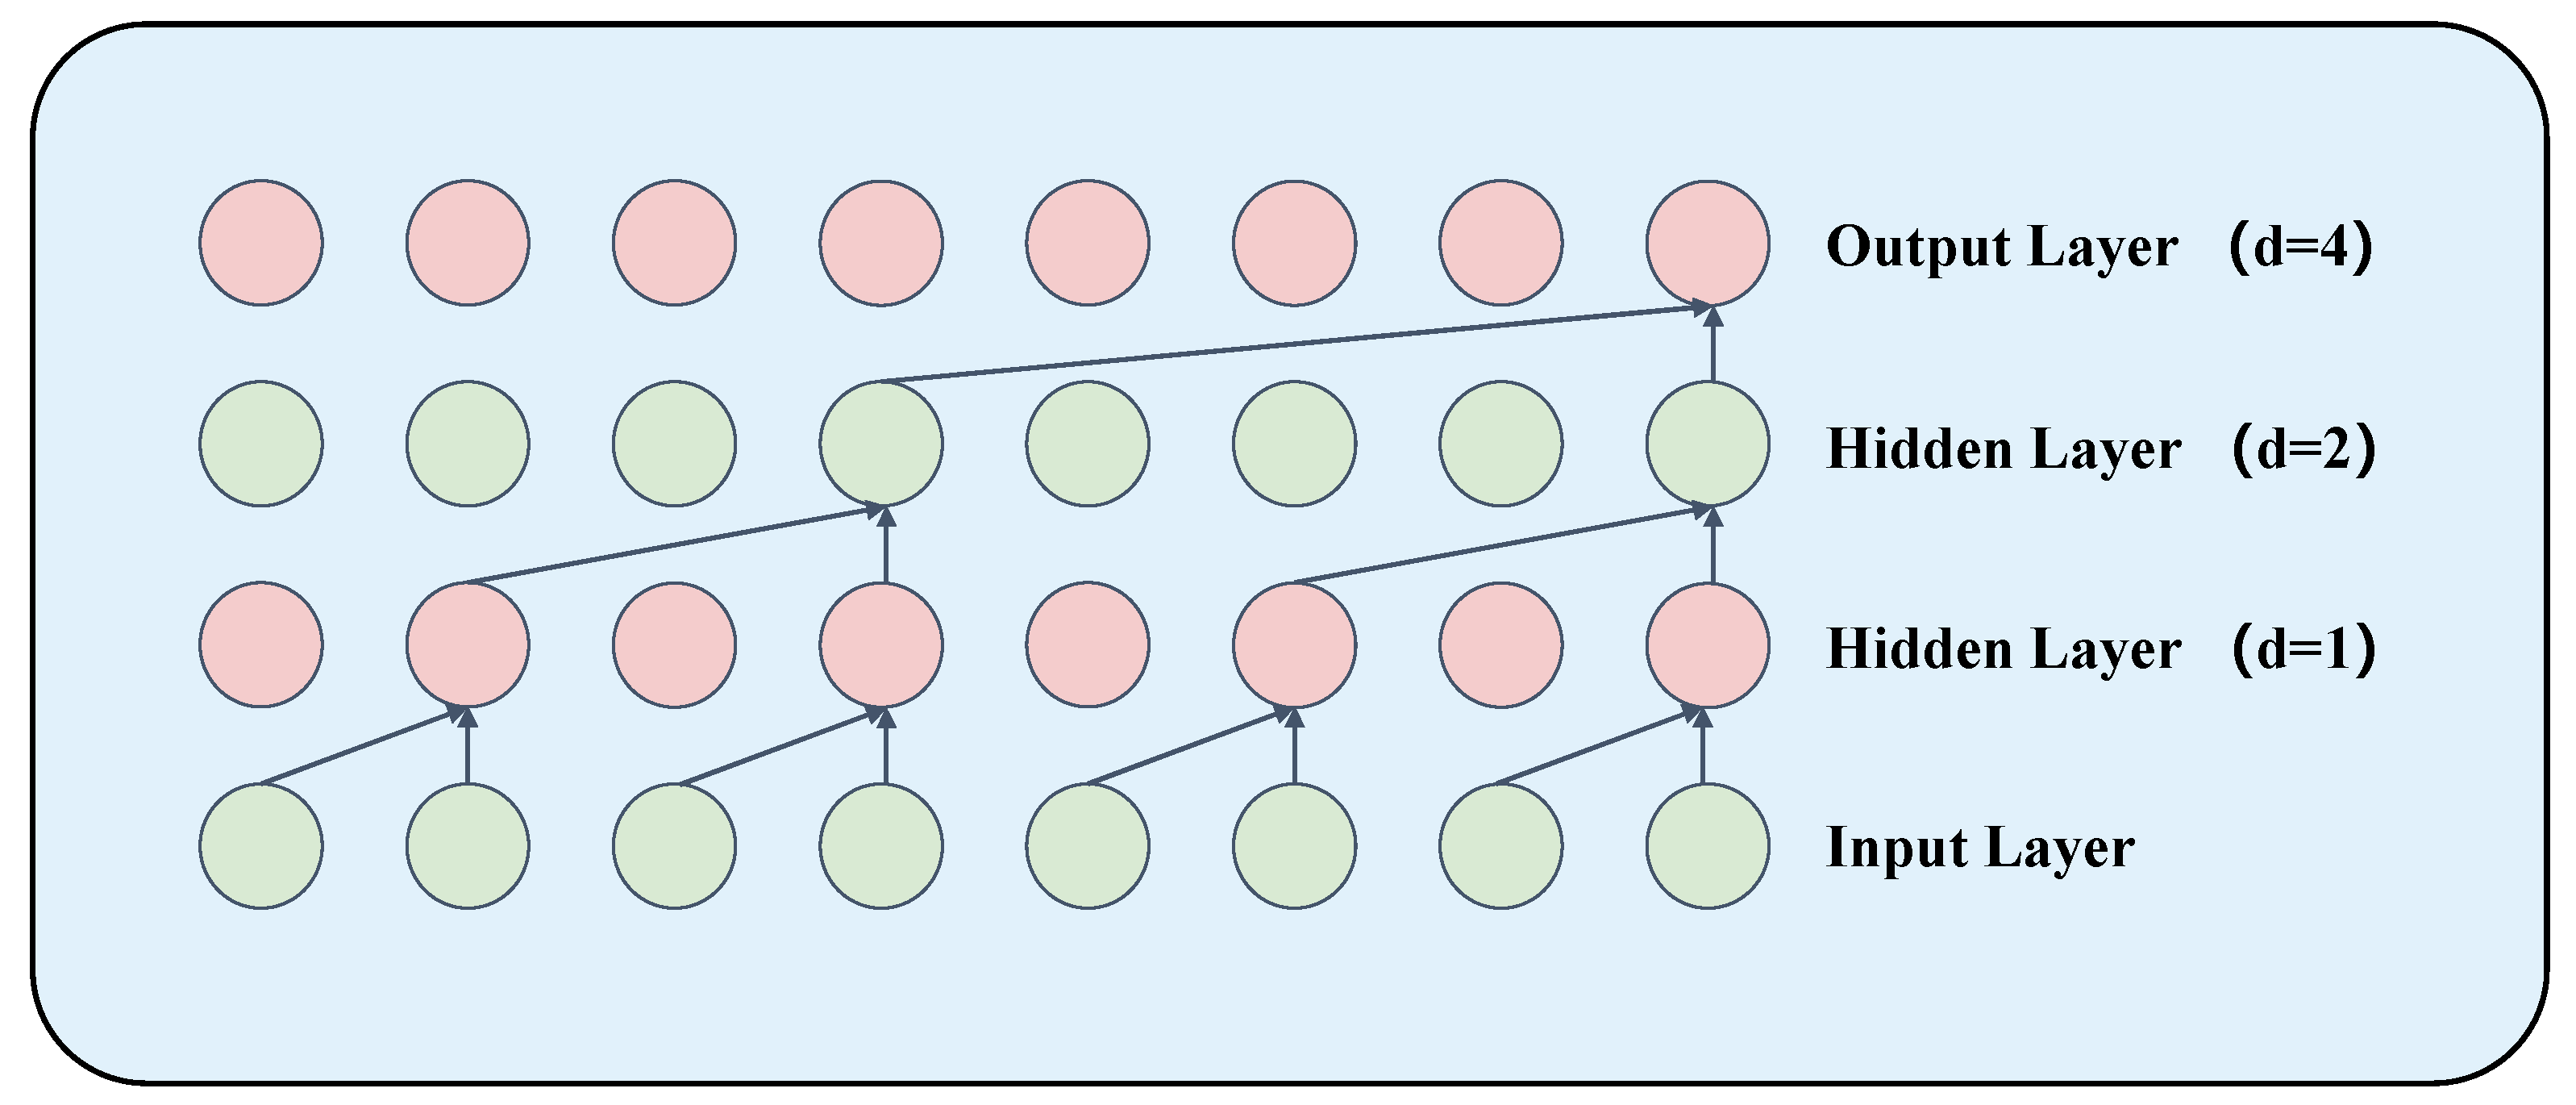
where d represents the dilation factor, k represents the filter size, i is the convolution kernel position, and subscript s-di represents the (s-di)th element of the previous layer. The specific structure is shown in Figure 2.
Figure 2.
Dilated convolution structure.
3.2. Long Short-Term Memory (LSTM)
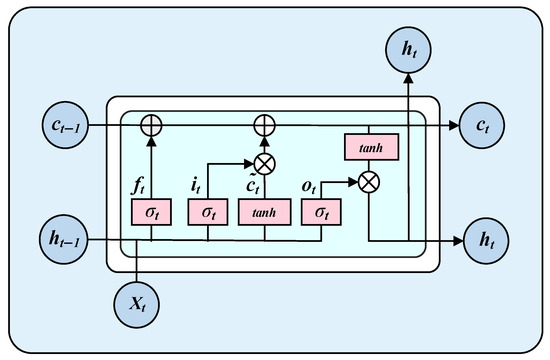
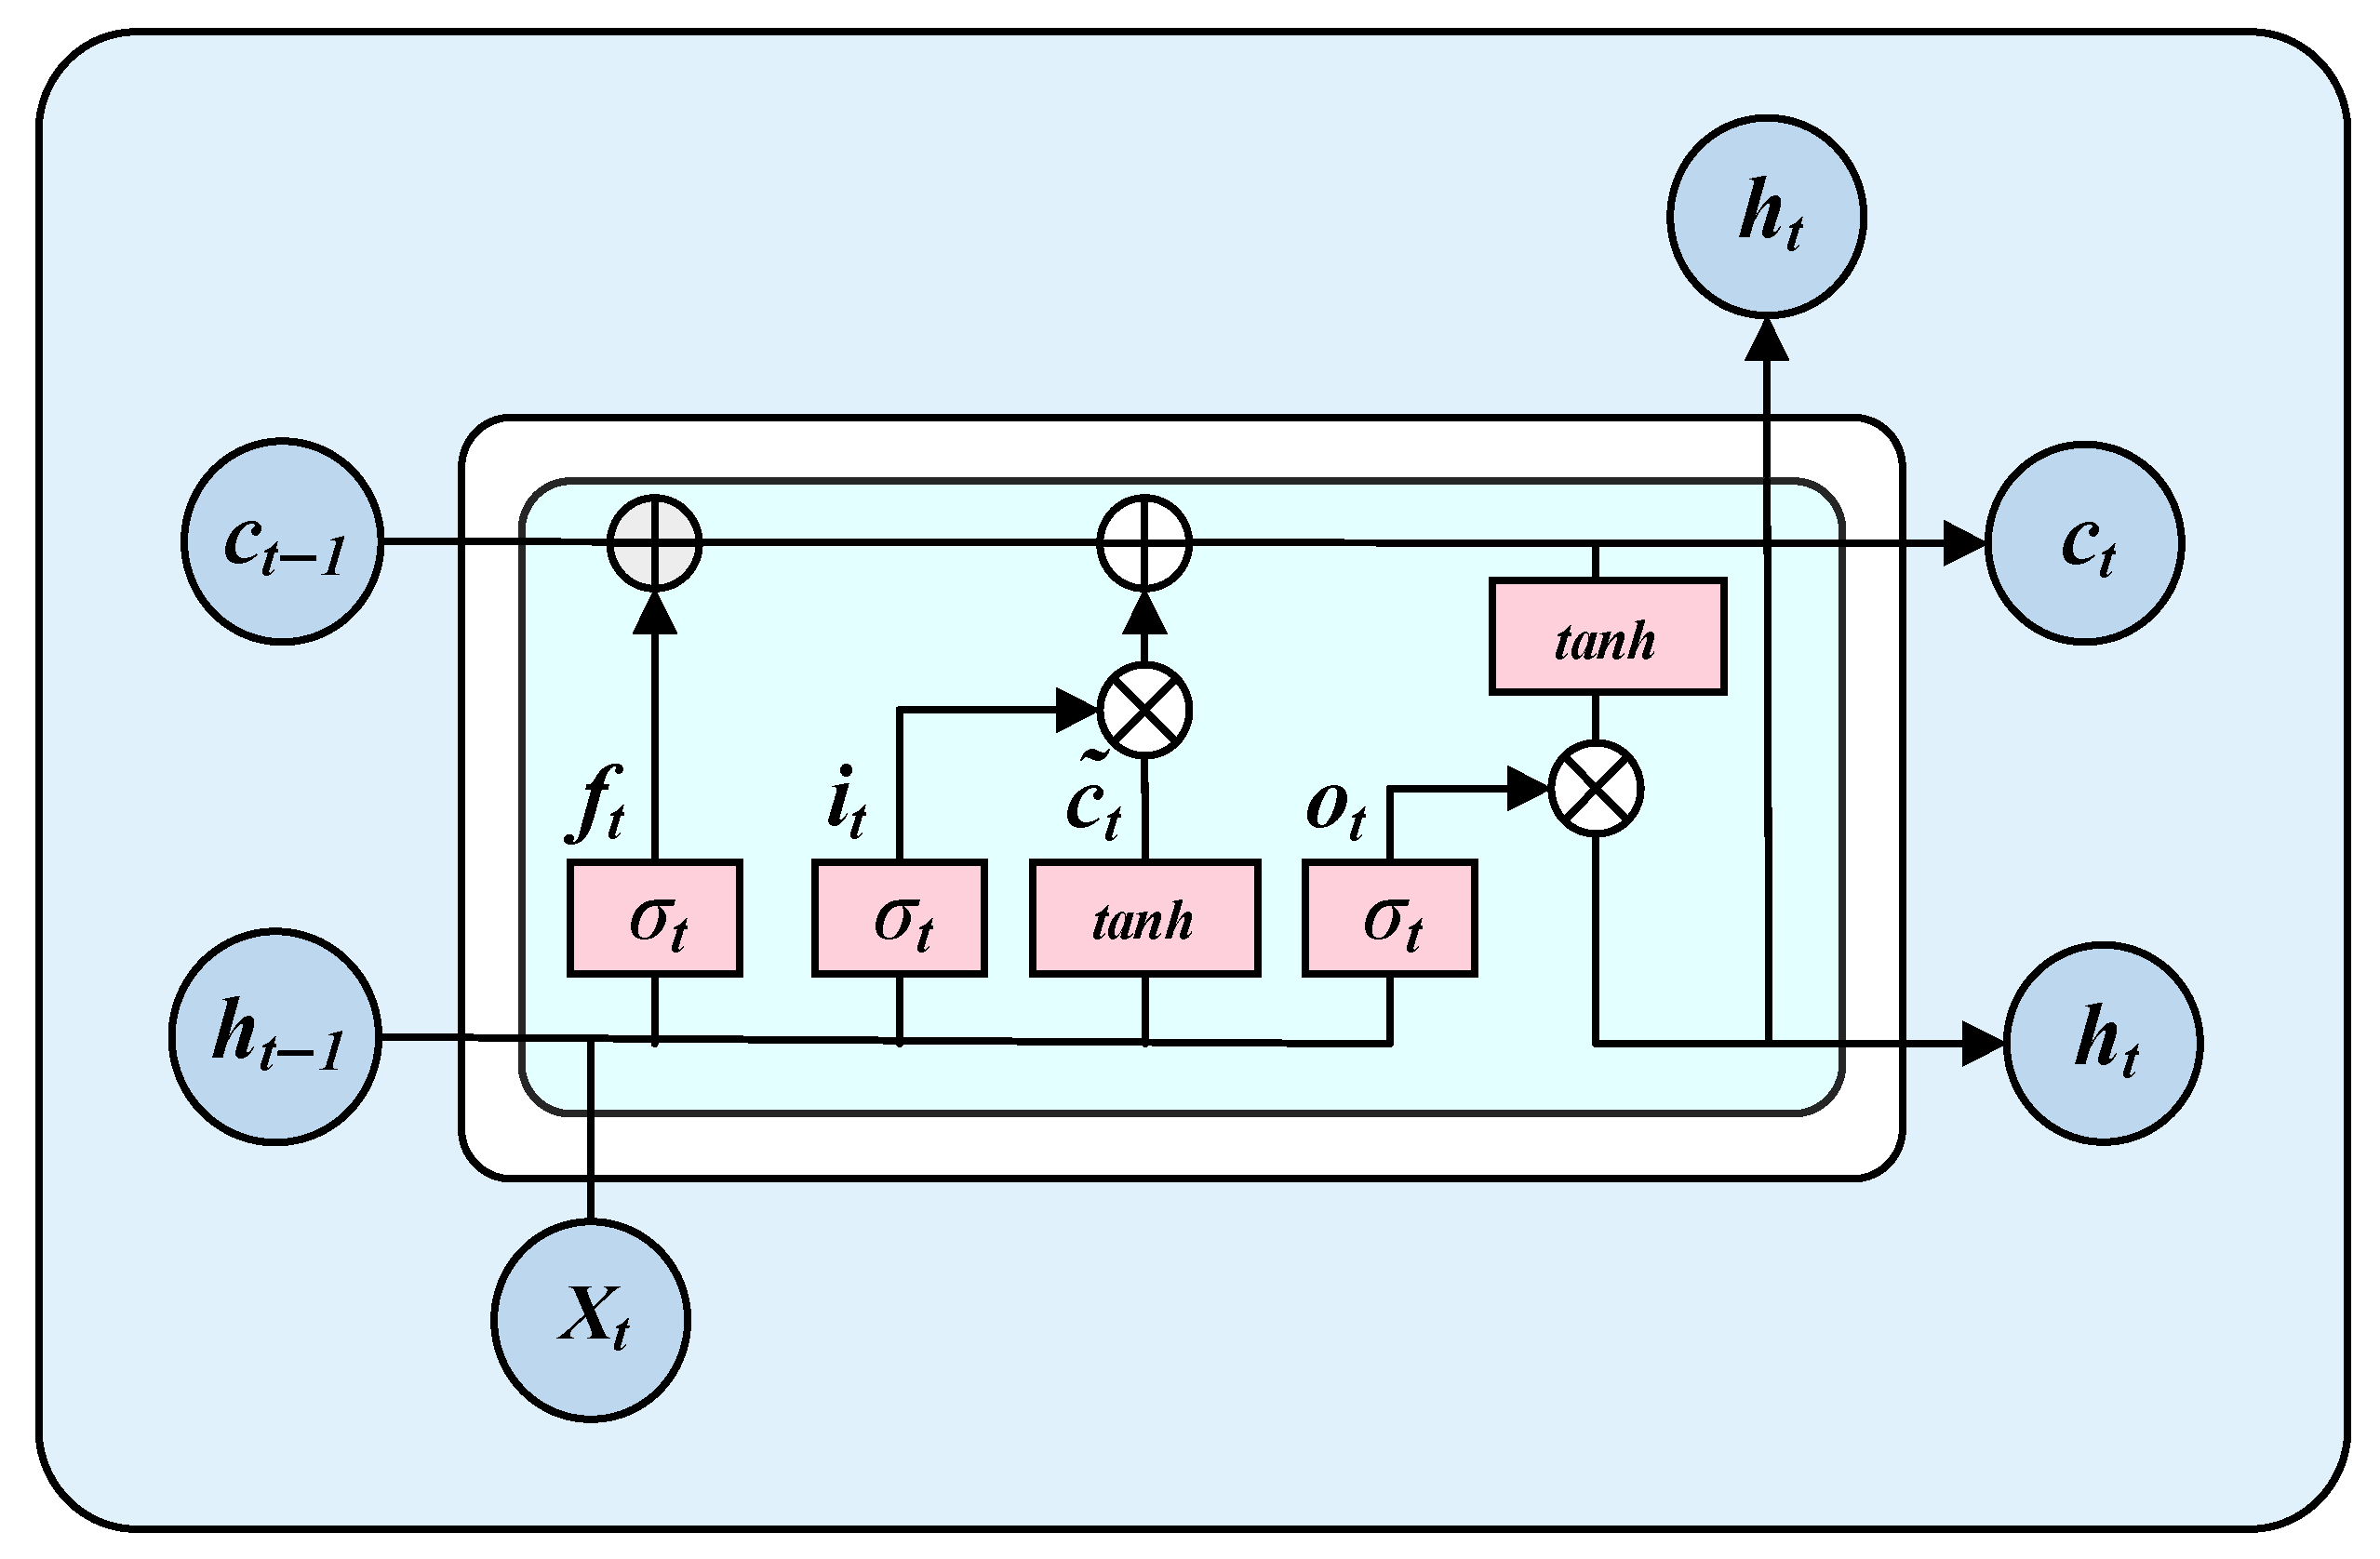
LSTM is a special type of Recurrent Neural Network (RNN) that effectively solves the gradient vanishing and gradient exploding problems of traditional RNNs when processing long sequence data by introducing gating mechanisms. It is suitable for VRB pump fault data modeling and analysis, and its structure is shown in Figure 3.
Figure 3.
LSTM structure.
LSTM achieves effective information transmission and processing through the introduction of a new memory cell ct:
where represents the retained or updated value in the cell state, designates the hidden node, xt symbolizes the input data, b characterizes the bias vector during training, ft indicates the forget gate vector, σt(·) corresponds to the sigmoid function, it represents the input gate, ht indicates the hidden node output, and ot designates the output gate.
3.3. Multi-Head Self-Attention (MATT)
Attention mechanisms assign different weights to different parts of input data and have been widely used in sequence modeling tasks. Subsequently, this mechanism has been widely applied to various fields including machine translation and time series forecasting. In this study, the multi-head self-attention (MATT) module is used to capture correlations between different positions in the input sequence. Its working principle involves calculating attention weights between each position and all other positions, then performing corresponding weighted summation on the input sequence. This mechanism enables the model to assign adaptive weights to different temporal positions and capture important sequence information more effectively.
3.4. TCN-LSTM-MATT Model Architecture
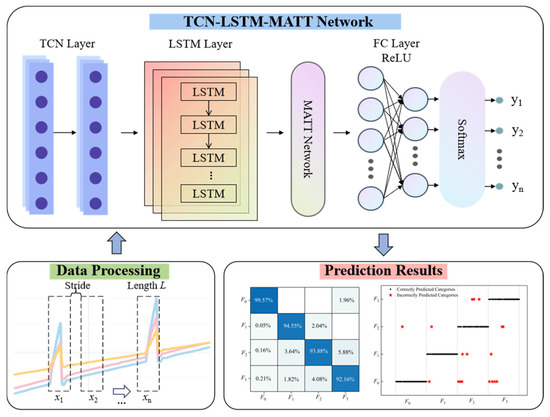
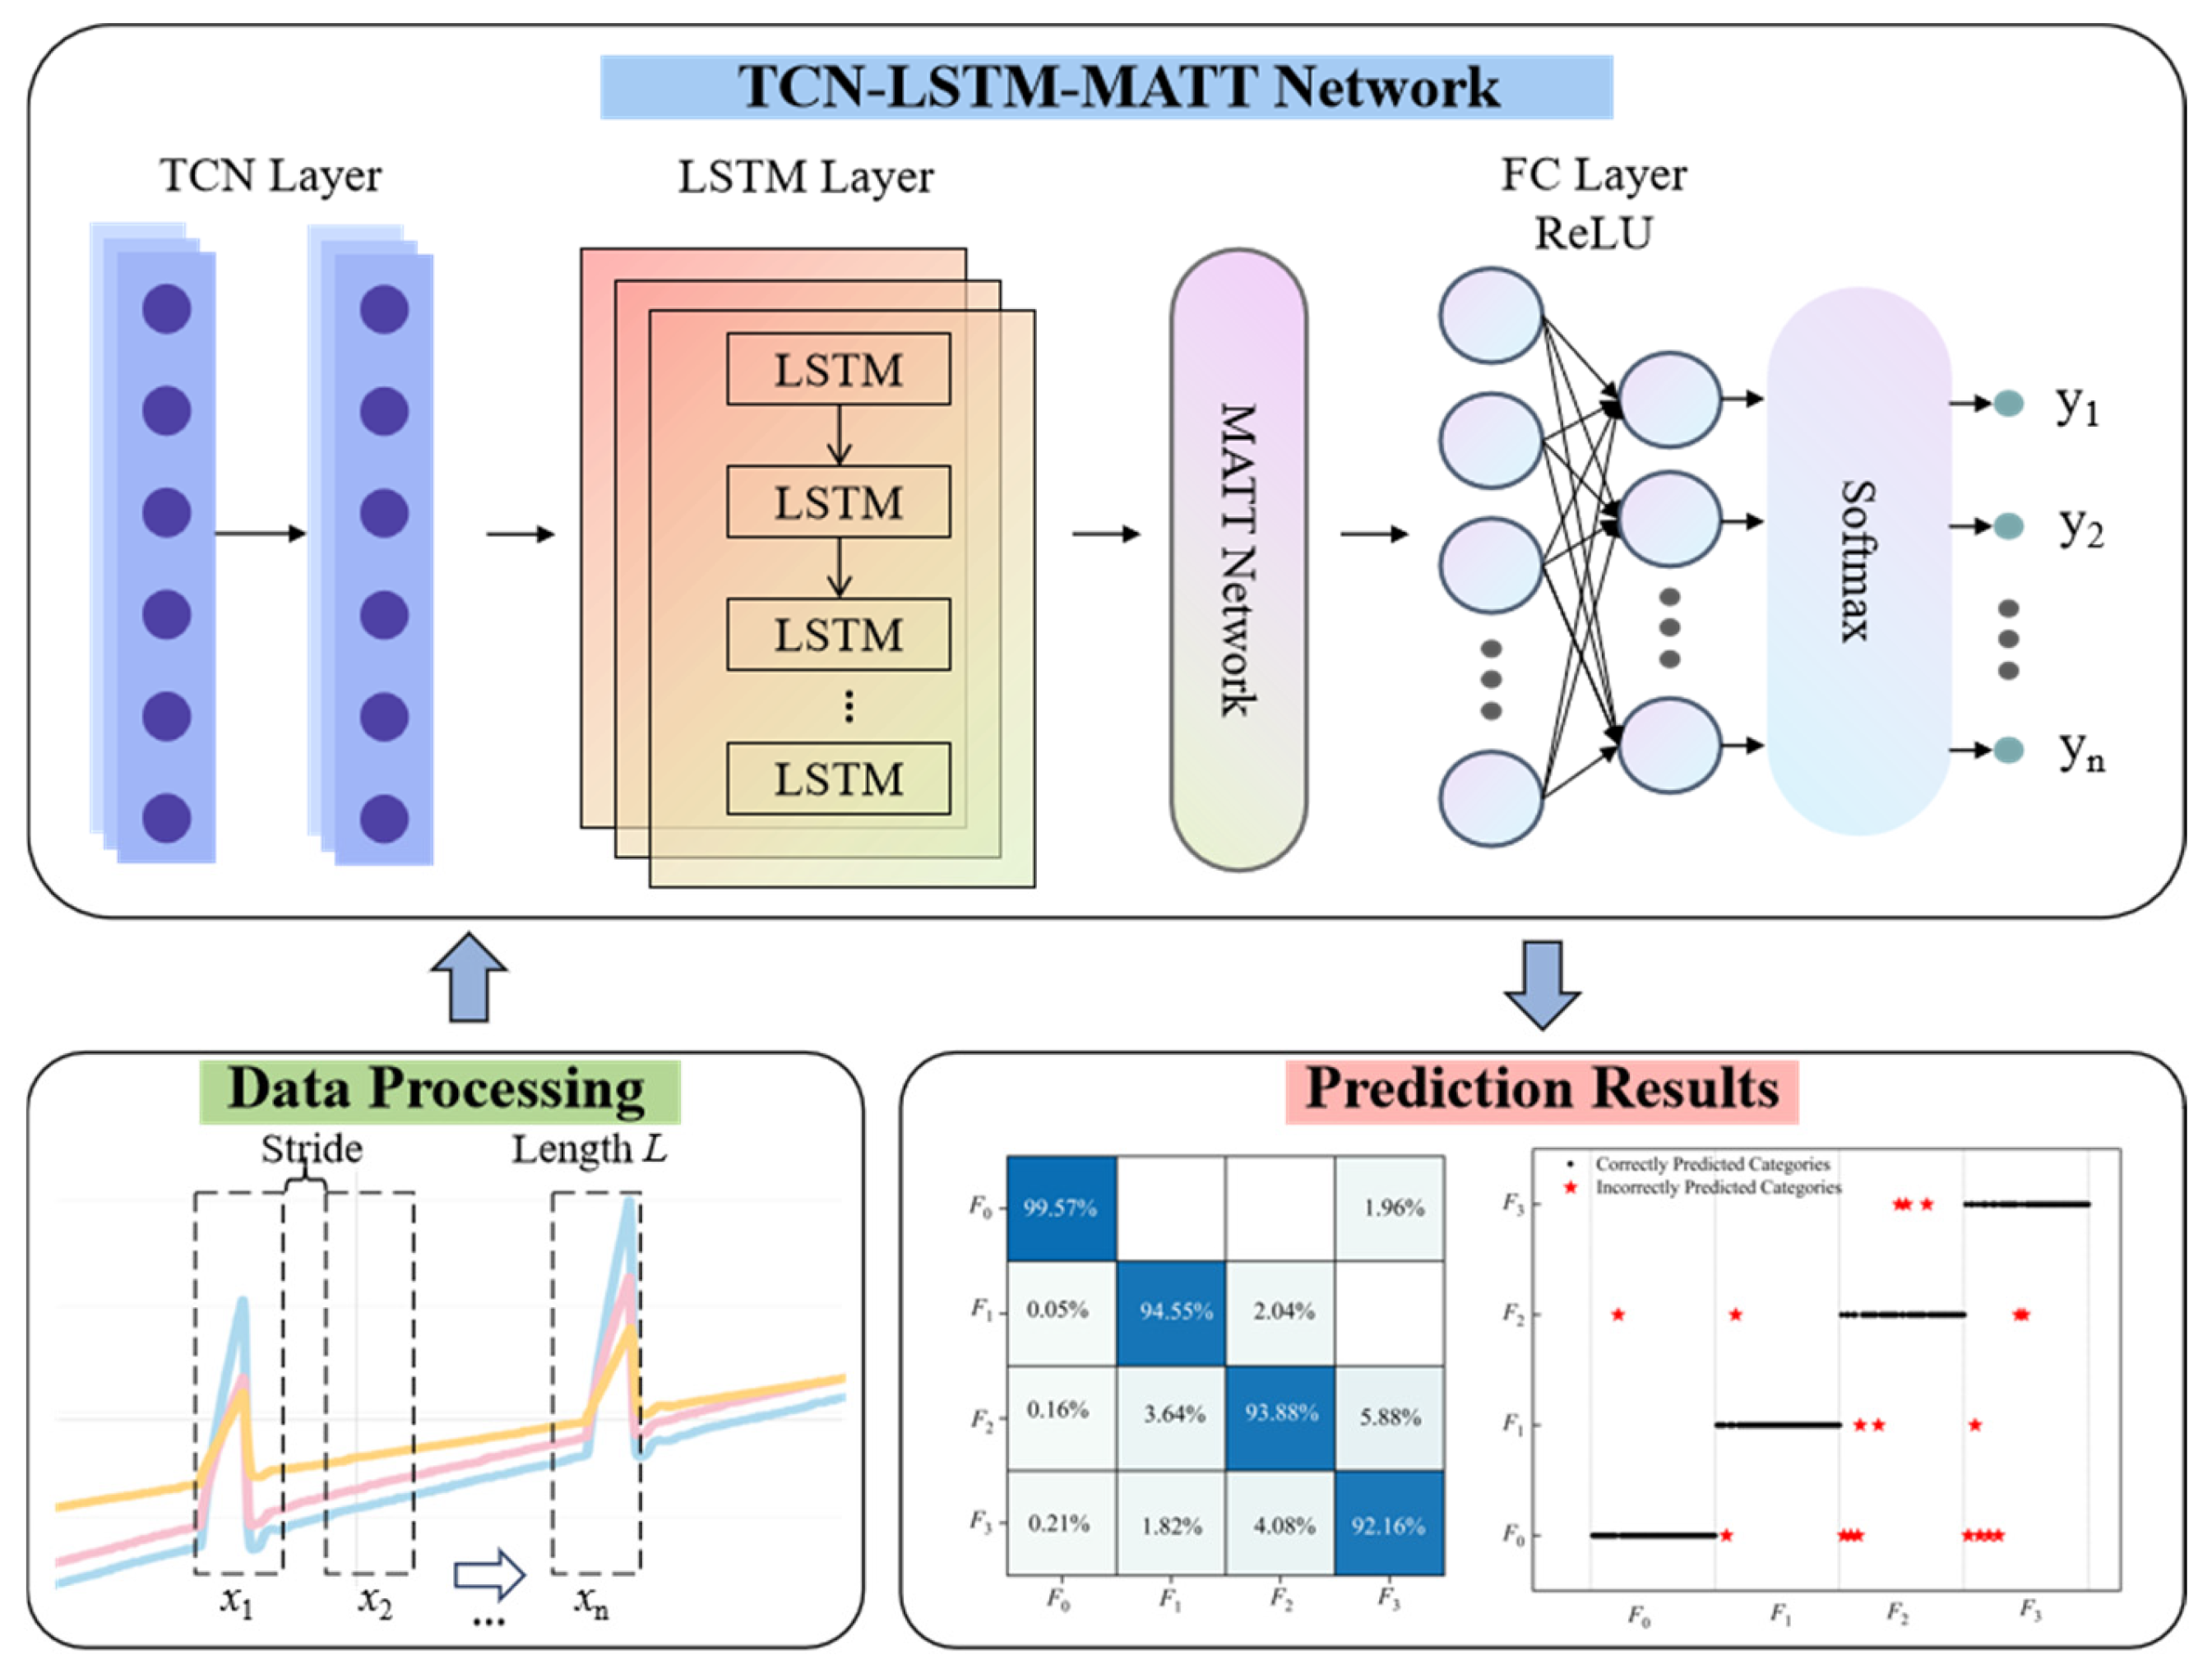
The VRB pump fault data is time series data, and these parameters contain rich spatiotemporal feature information and nonlinear relationships. To avoid data leakage caused by overlapping sliding windows, the raw chronological data were partitioned before sliding-window segmentation. In the revised implementation, continuous raw data segments with the same operating label were first identified. Complete segments were then assigned to the training and testing subsets according to a target ratio of 17:3. After that, sliding-window segmentation was performed independently within the training and testing subsets, with a window size of 5 and a step size of 1. The features within each sliding window were organized as time-series inputs, and the label of the last time step was used as the sample label. In this way, no overlapping or adjacent windows were shared between the training and testing sets, and the testing samples were generated from unseen raw chronological segments. The training data are then used to train the proposed model. The model first extracts nonlinear spatial correlation features among multiple parameters through dilated causal convolution, then combines LSTM to capture long-term temporal dependencies of fault evolution, and introduces an attention mechanism to dynamically weight fault precursor information at key time steps. Finally, fault diagnosis is output through a fully connected layer. Figure 4 shows the flowchart of the entire model.
Figure 4.
Workflow of the proposed TCN-LSTM-MATT model for VRB pump fault diagnosis.
4. Experiment
4.1. Experimental Platform
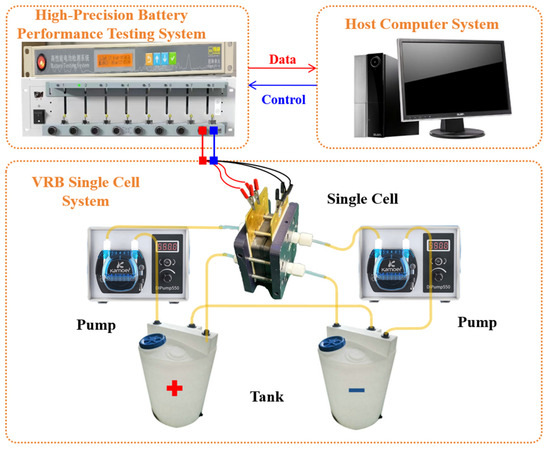
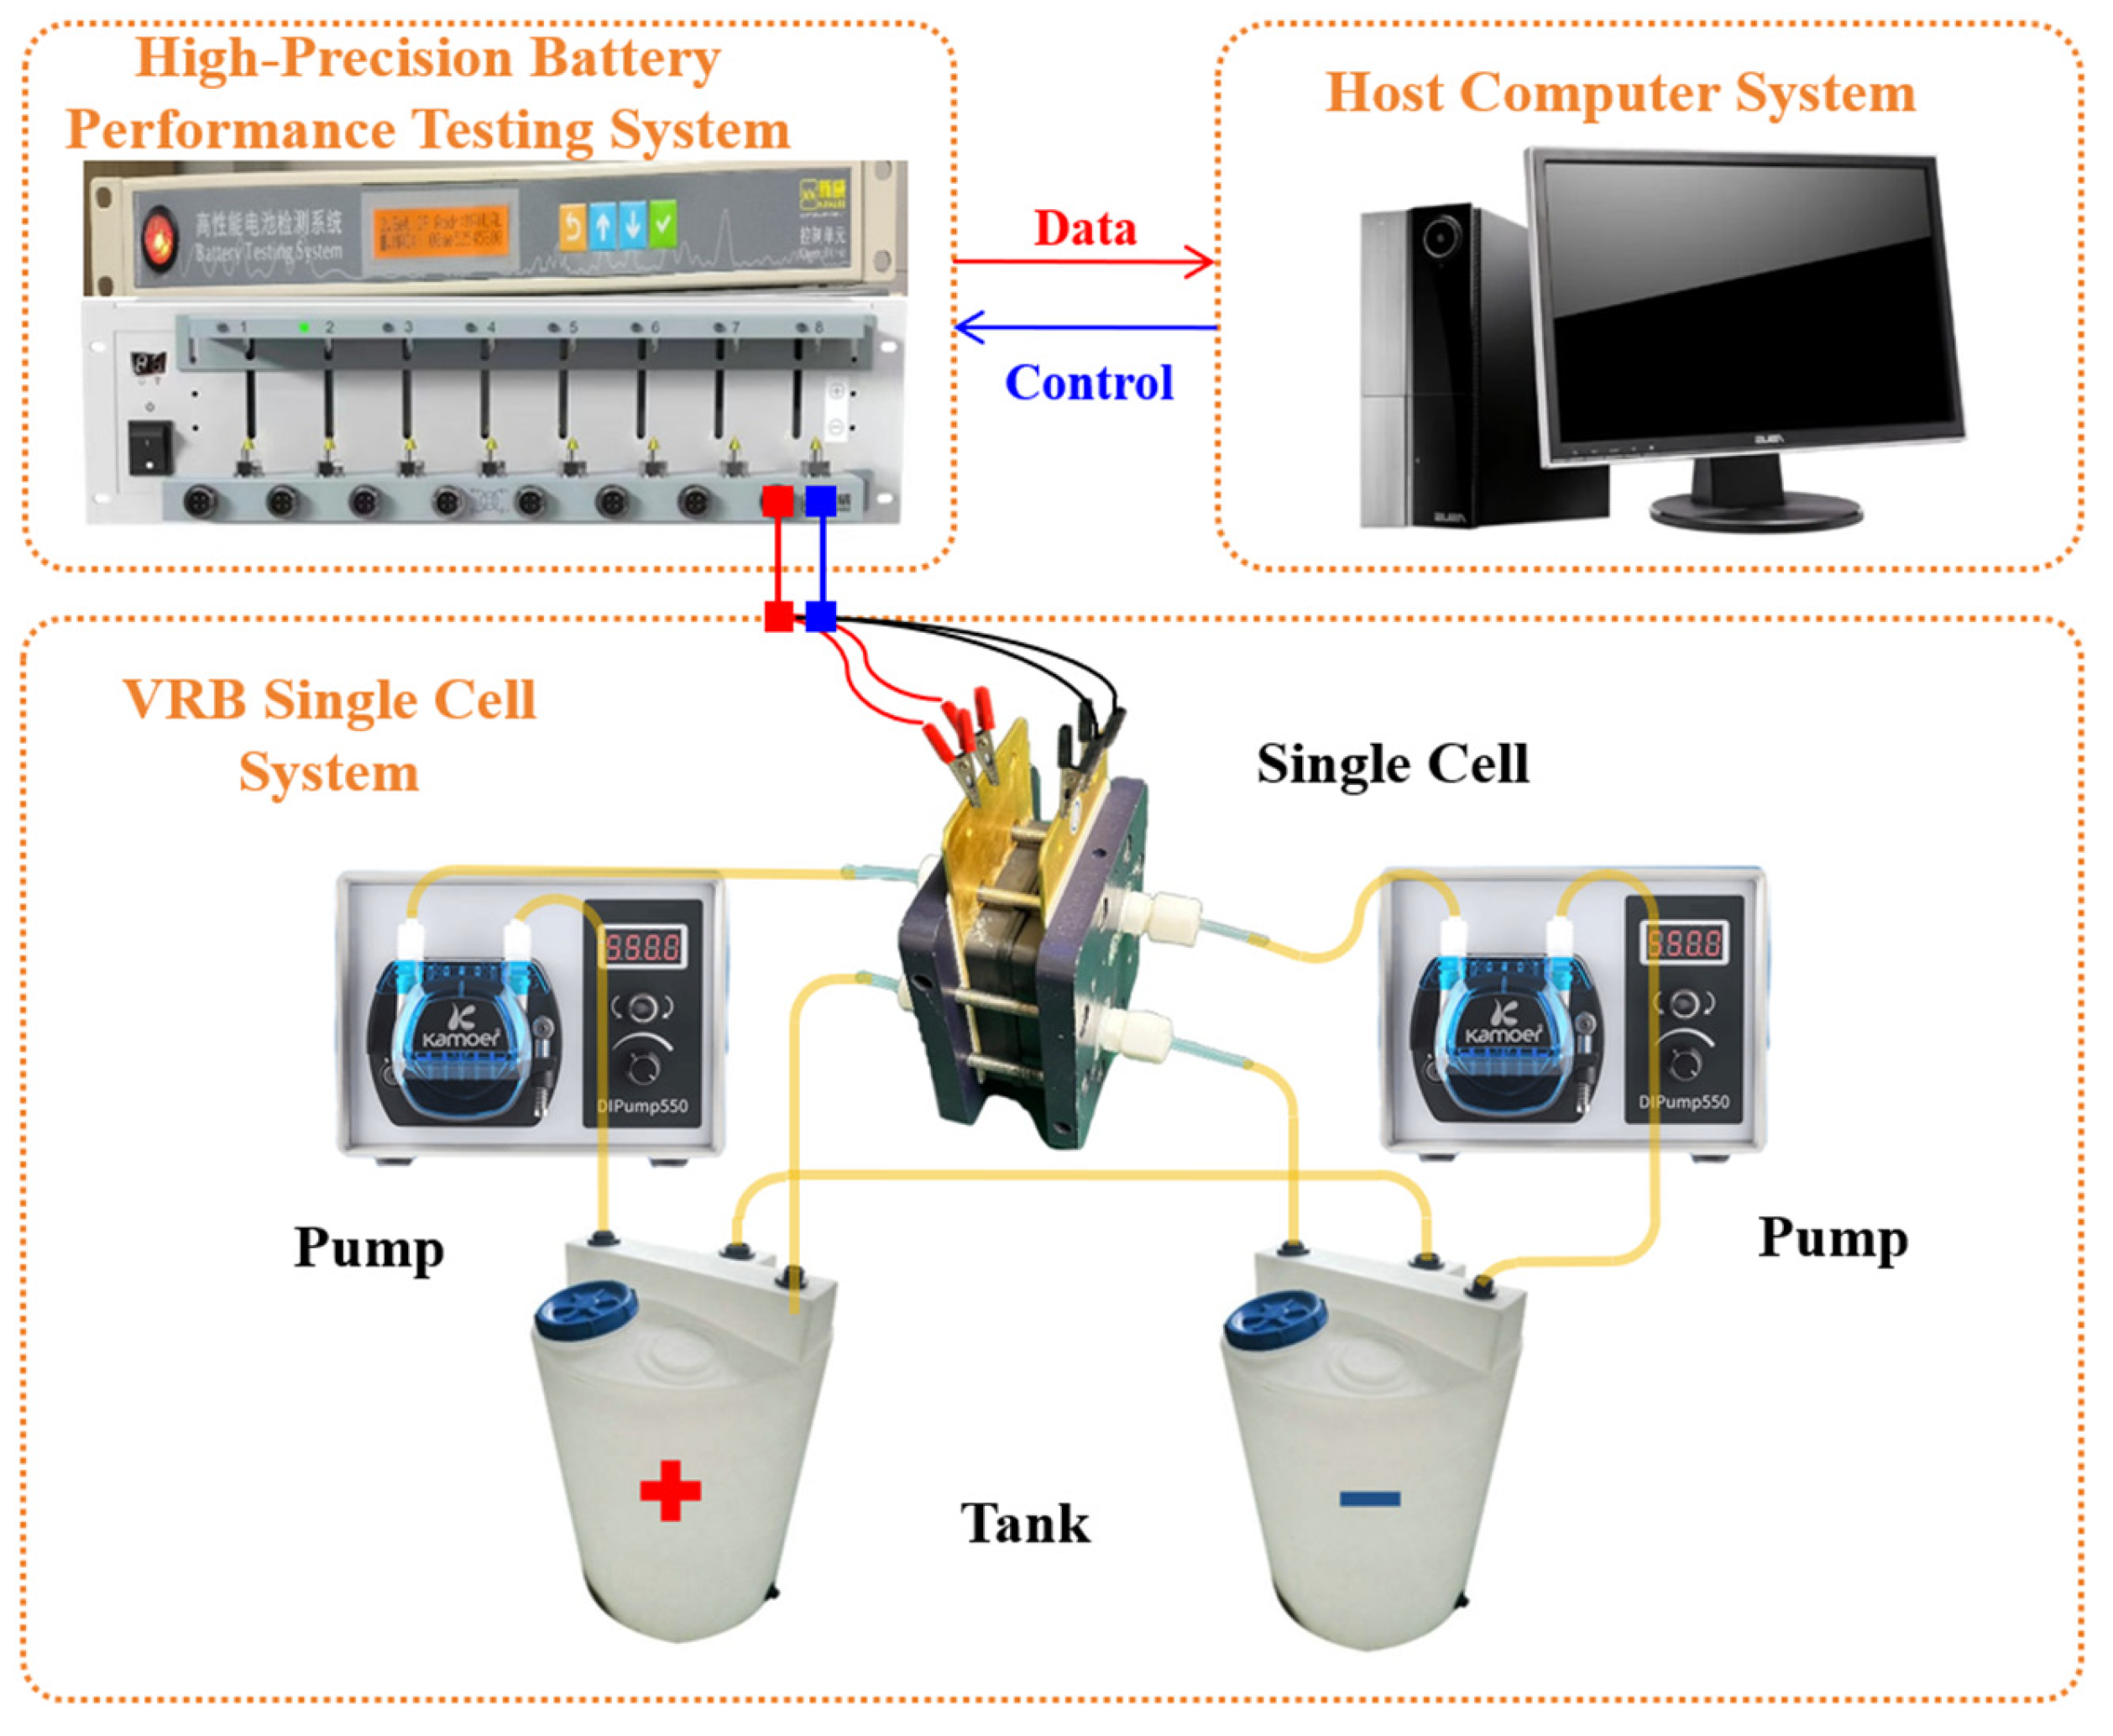
The VRB fault experimental platform consists of three core modules: single-cell system, high-precision battery performance testing system, and a host-computer monitoring system, as shown in Figure 5. This integrated platform enables controlled simulation of circulating-pump faults and real-time acquisition of battery response data, providing an experimental basis for pump fault diagnosis. The VRB test system is manufactured by Wuhan Zhisheng New Energy Co., Ltd in Wuhan City, Hubei Province, China.
Figure 5.
VRB fault experimental platform for pump fault data acquisition.
The single-cell system comprises a single cell unit, electrolyte storage vials, peristaltic pumps, and connecting conduits. The lower-level controller connects to the battery current collector plates via alligator clips and is responsible for receiving commands transmitted from the upper-level controller through the intermediate controller, controlling channel charging/discharging operations, applying current, executing charging–discharging strategies, and real-time acquisition of channel voltage and current data for transmission to the intermediate controller. The intermediate controller provides network connectivity, receives control commands from the upper-level controller and relays them to the lower-level controller, while simultaneously receiving data collected from the lower-level controller and transmitting it to the upper-level controller, with capability for temporary data storage in case of upper-level controller interruption. The upper-level controller is equipped with the BTS 7.6.X battery testing system, connected to the intermediate controller via an Ethernet cable, enabling data acquisition, command transmission, and test procedure programming.
The single-cell system serves as the core reaction unit of the experiment, with parameter design fully considering the operational characteristics of vanadium flow batteries: a Nafion N117 proton exchange membrane (thickness approximately 183 μm, ionic conductivity ≥ 0.08 S/cm) was employed to ensure selective permeation of vanadium ions; porous electrodes (0.03 m × 0.03 m) utilized graphite felt material (porosity > 90%) to maximize the electrochemical reaction surface area; a serpentine flow channel design (channel width 2 mm, depth 1 mm) was implemented to optimize electrolyte distribution uniformity and minimize concentration polarization; complementary 200 mL electrolyte tanks ensured continuous supply of reactants. Table 2 provides detailed specifications of key parameters and equipment models for the single-cell system, establishing standardized criteria for experimental reproducibility and result comparability.
Table 2.
VRB single-cell system parameters.
4.2. Experimental Steps
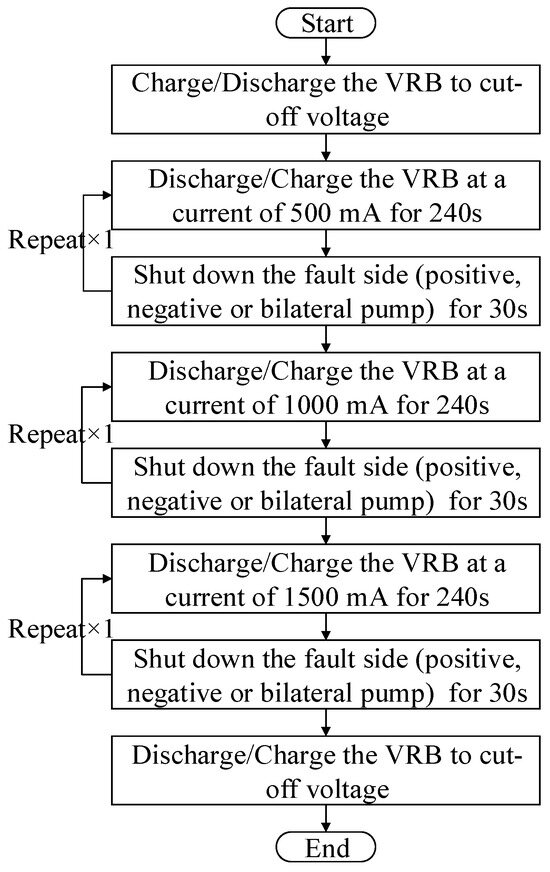
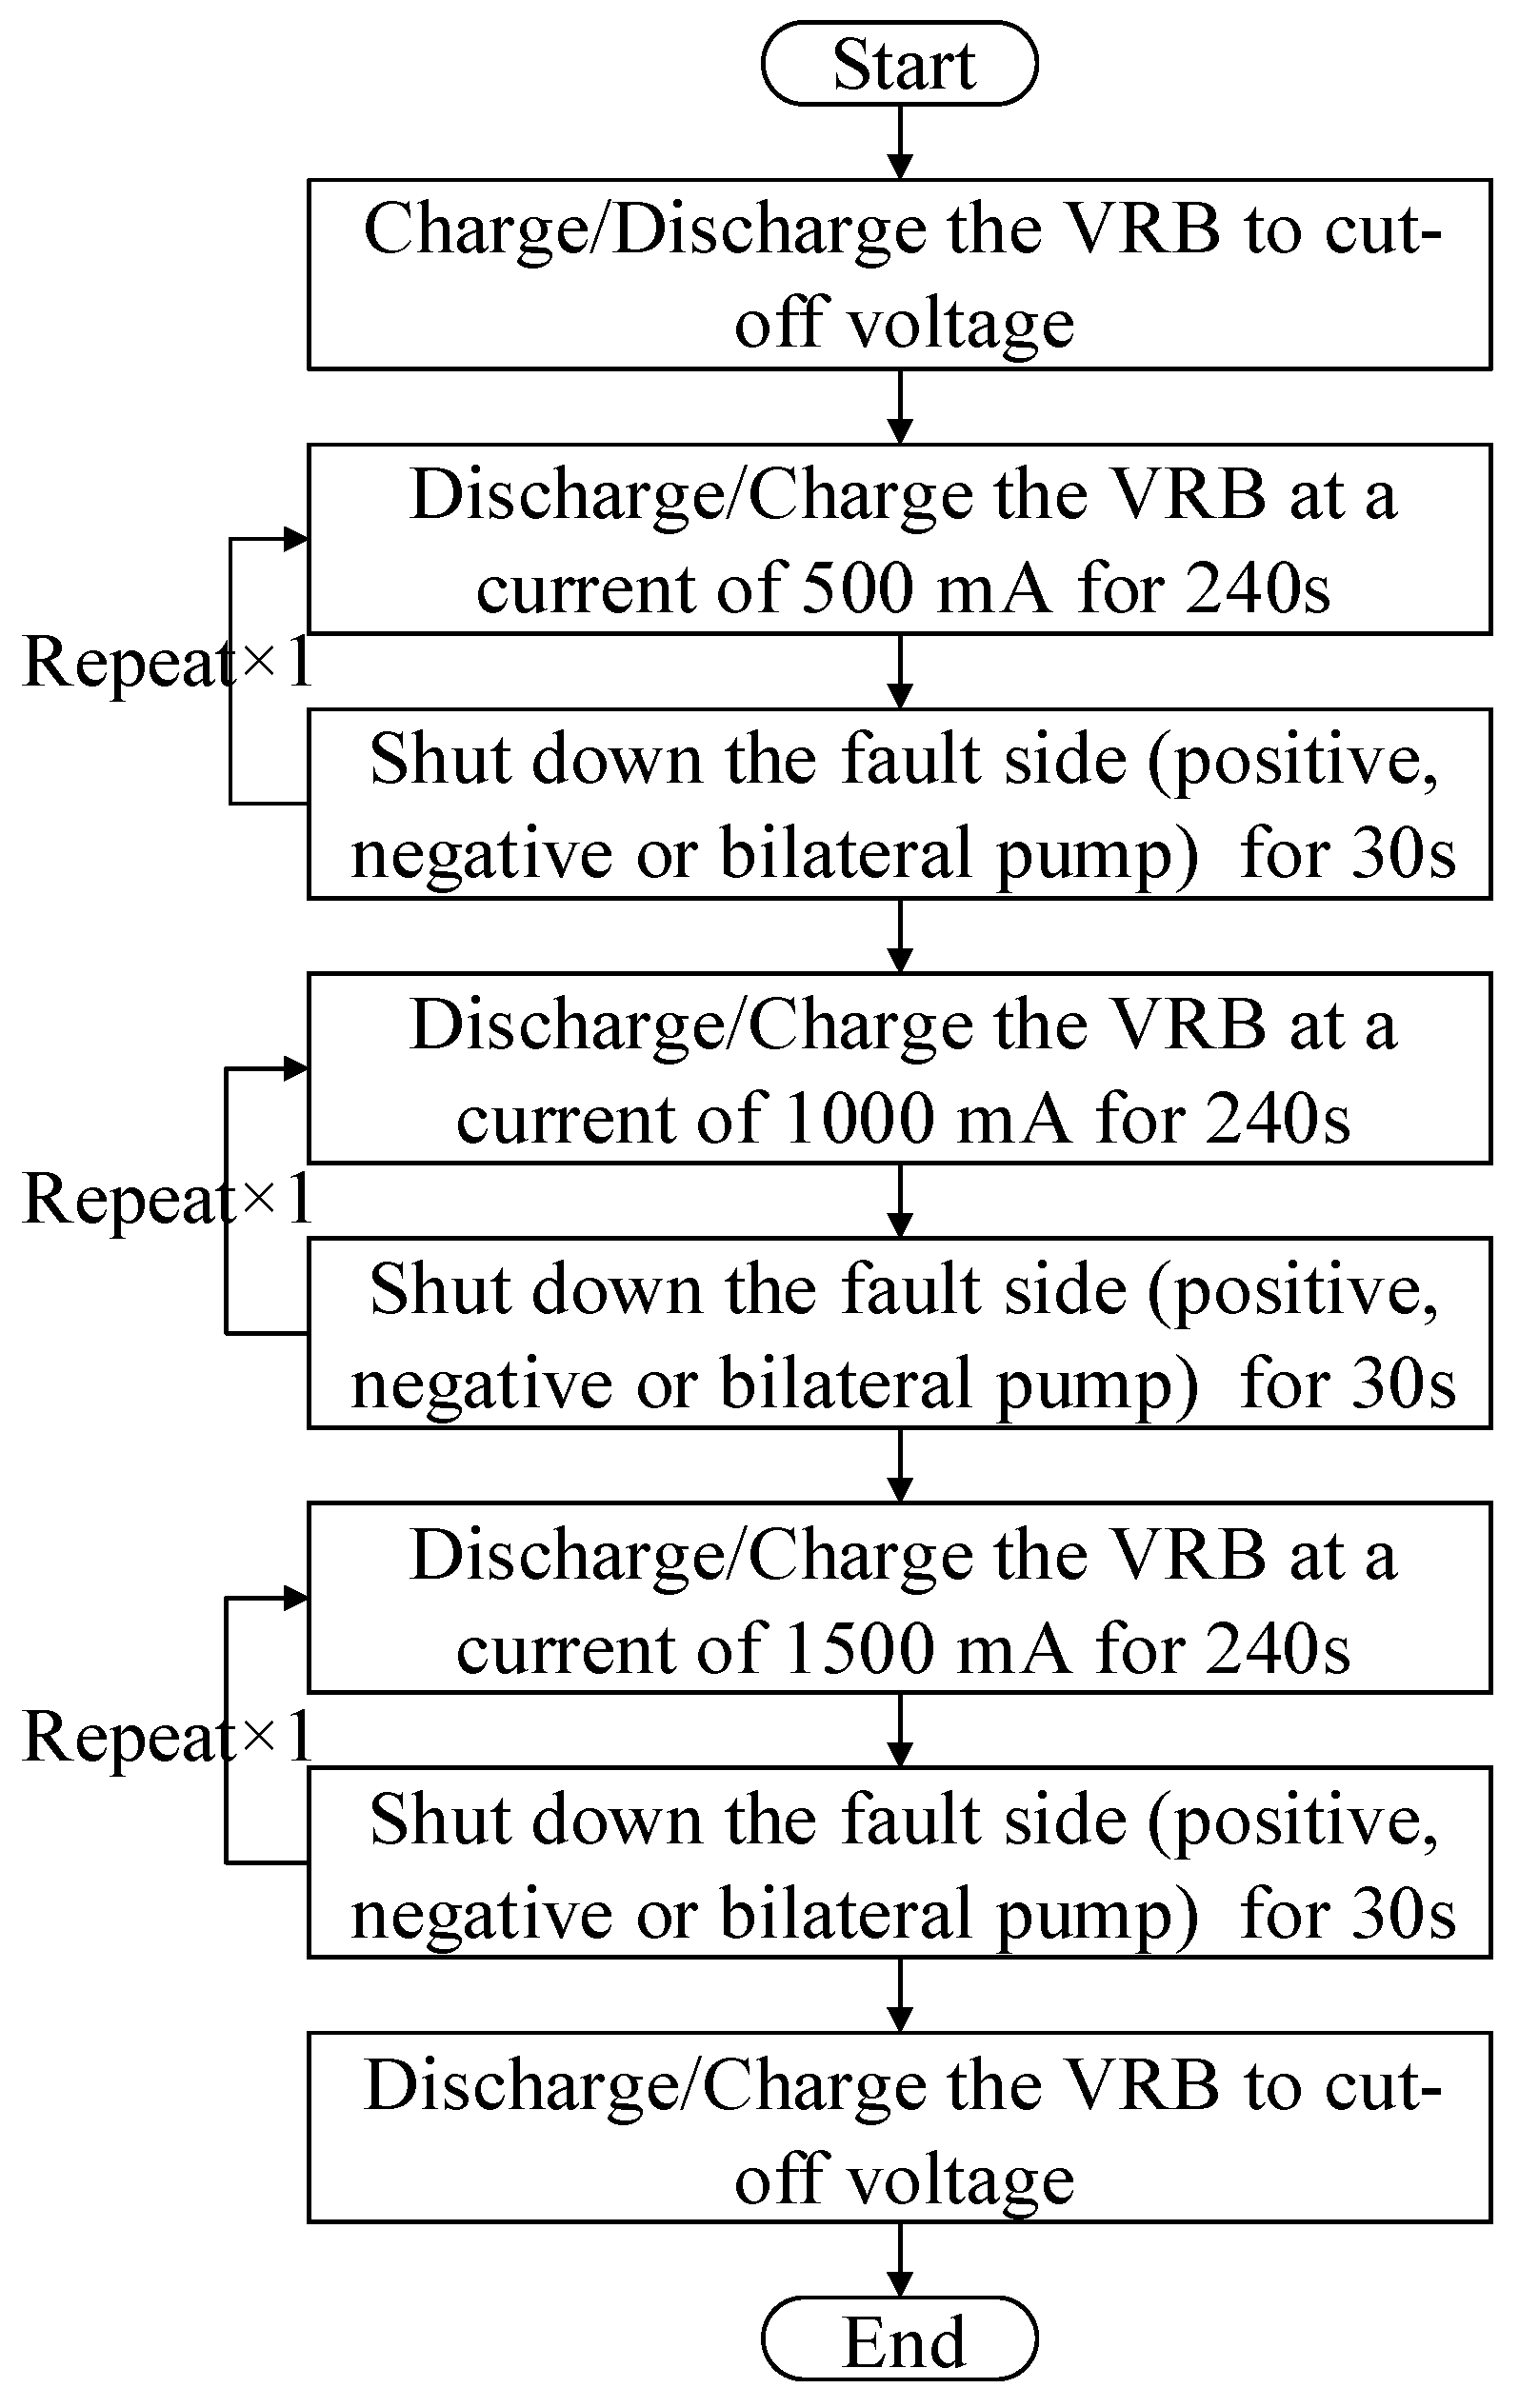
To comprehensively reveal the characteristic performance of VRB under pump fault conditions, this section designs VRB pump fault experiments with constant current charging–discharging under different charging–discharging currents (500 mA, 1000 mA, and 1500 mA). In the experiments, recoverable faults are artificially created, specifically including positive pump fault, negative pump fault, and bilateral pump fault. In practical operation, pump faults may develop progressively, leading to a gradual decrease in electrolyte flow rate and eventually to pump stoppage under severe conditions. In this study, pump shutdown was used as a controlled and repeatable experimental method to simulate an extreme pump fault condition with complete flow-supply interruption. This artificial fault setting mainly represents short-term severe and recoverable pump fault conditions and does not fully cover long-term real-world pump degradation modes, such as gradual flow-rate decay, intermittent pump-speed fluctuation, partial blockage, or pump efficiency degradation. The initial preparatory stage prior to charging serves to ensure complete discharging of the VRB, and data from this phase are excluded from the valid experimental results. According to the calculation results of the Nernst equation, when the voltage is less than or equal to 1.0 V, the VRB is considered to be in a completely discharged state with 0% SOC. Conversely, when the voltage is greater than or equal to 1.7 V, the VRB is considered to be in a completely charged state with 100% SOC. Therefore, the charging–discharging voltage range of VRB is always maintained between 1.0 V and 1.7 V. The initial preparatory phase ensures complete VRB discharge, with corresponding data excluded from experimental analysis. The initial step functions as a preparatory phase to achieve complete VRB discharging, with corresponding data excluded from the experimental analysis. The specific experimental procedure settings are illustrated in Figure 6.
Figure 6.
Experimental procedure for artificially induced VRB pump faults under different current conditions.
The charging process experimental steps are as follows:
Step 1.1: Discharging with a constant current of 1.0 A until the terminal voltage reaches 1.0 V.
Step 1.2: Charging with a constant current of 500 mA for 4 min, then shut down the fault-side (positive, negative and bilateral) circulation pump for 30 s.
Step 1.3: Charging with a constant current of 1000 mA for 4 min, then shut down the corresponding fault-side circulation pump for 30 s.
Step 1.4: Charging with a constant current of 1500 mA for 4 min, then shut down the fault-side circulation pump for 30 s.
Step 1.5: Charging with a constant current of 1500 mA until the terminal voltage reaches 1.7 V.
The discharging process experimental steps are as follows:
Step 2.1: Charging with a constant current of 1.0 A until the terminal voltage reaches 1.7 V.
Step 2.2: Discharging with a constant current of 1500 mA for 4 min, then shut down the fault-side circulation pump for 30 s.
Step 2.3: Discharging with a constant current of 1000 mA for 4 min, then shut down the corresponding fault-side circulation pump for 30 s.
Step 2.4: Discharging with a constant current of 500 mA for 4 min, then shut down the fault-side circulation pump for 30 s.
Step 2.5: Discharging with a constant current of 500 mA until the terminal voltage reaches 1.0 V.
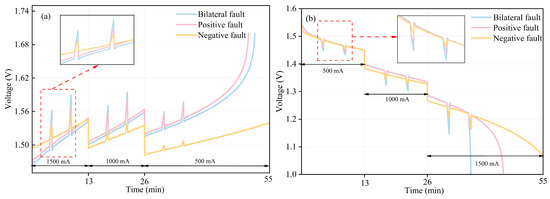
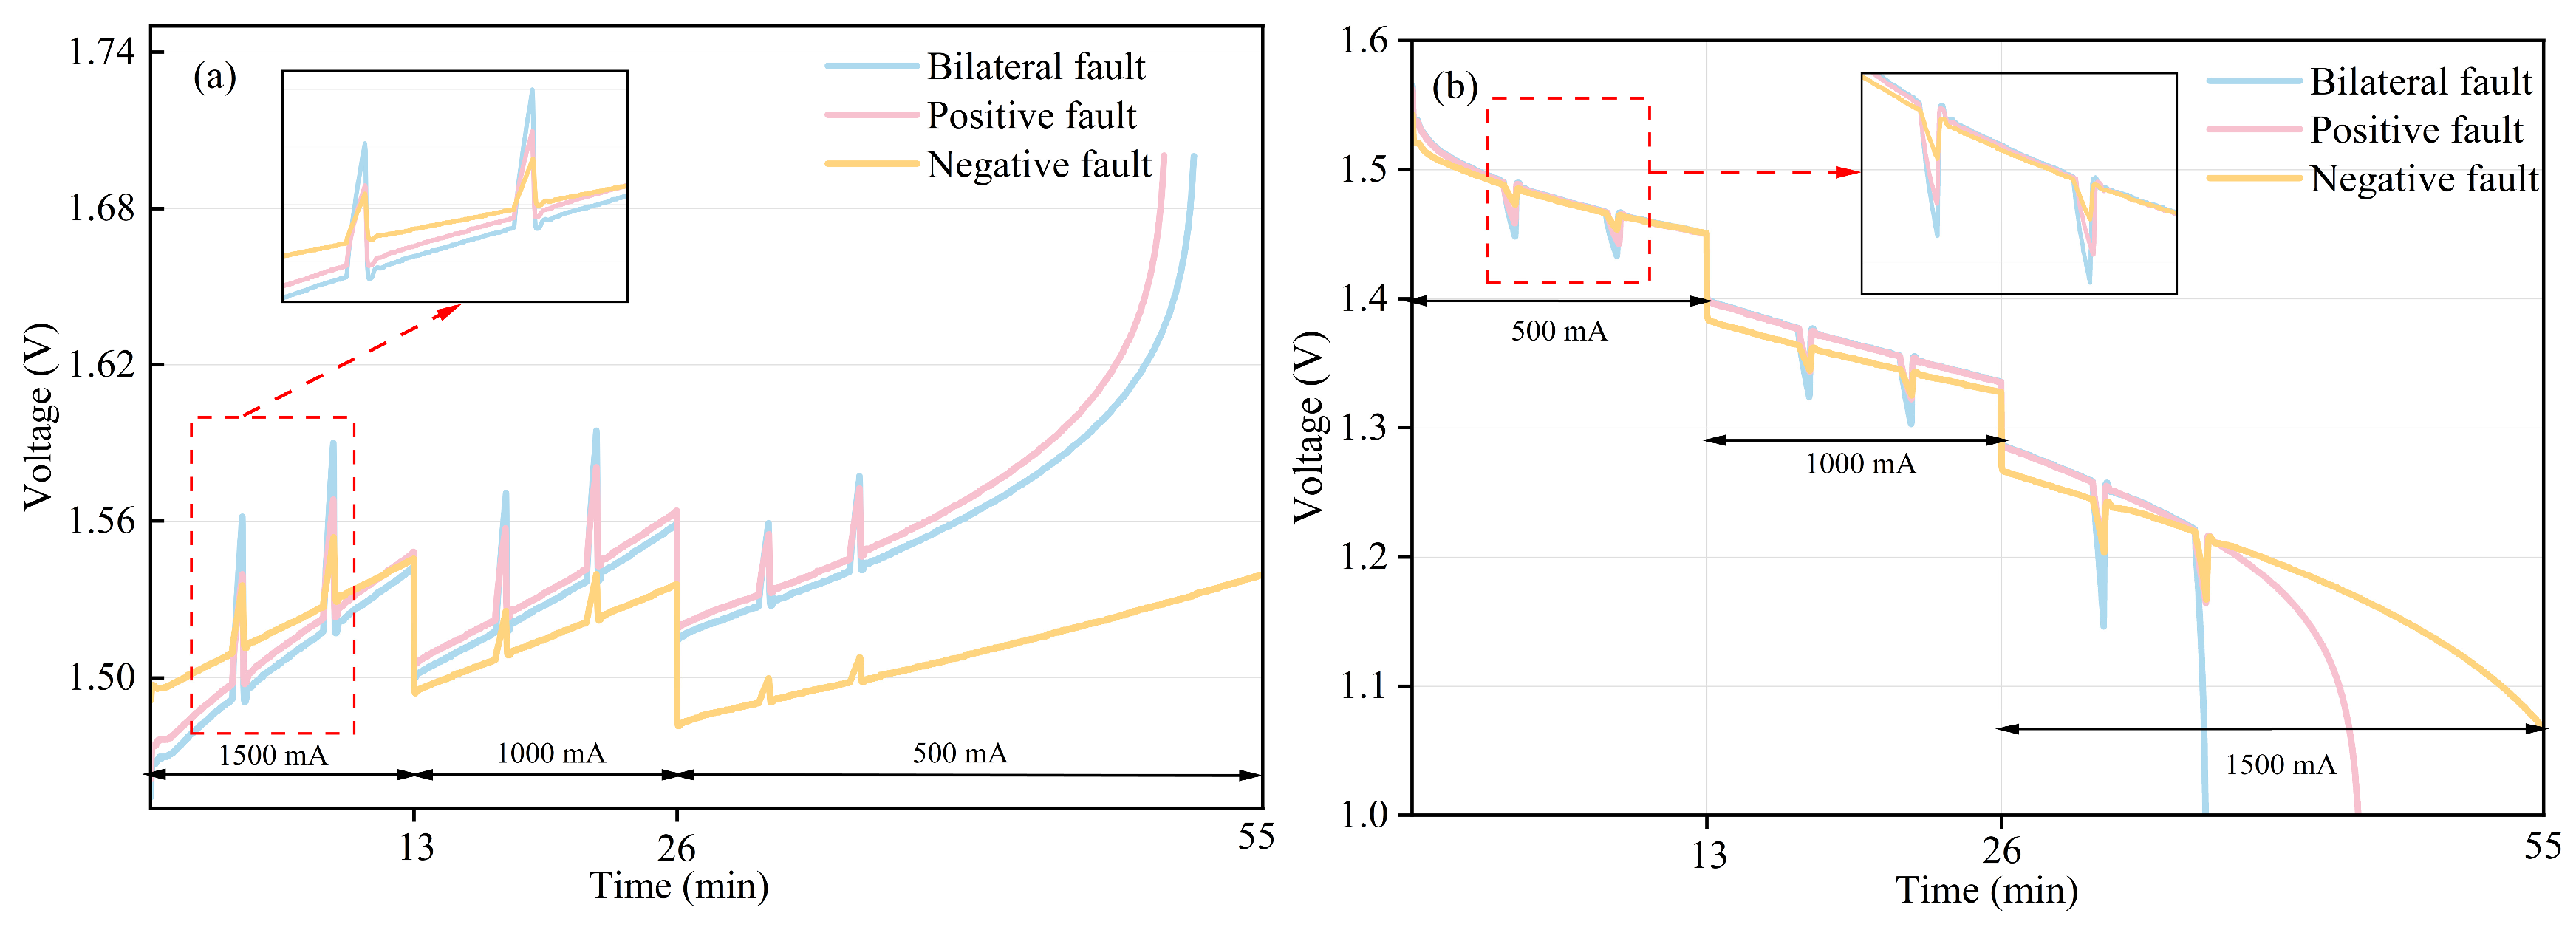
In the above experimental steps, the flow rate is uniformly set to 60 mL min−1, and the voltage data sampling frequency is once per second. The partial terminal voltage changes of the VRB single cell obtained from the fault experiments are shown in Figure 7. Analysis of the experimental data demonstrates the occurrence of abnormally elevated voltages at each fault location. This phenomenon results from non-uniform vanadium ion concentration distribution on the affected electrode, leading to local abnormally high potentials within the VRB stack. Under severe or prolonged fault conditions, such local potential elevation may aggravate electrochemical non-uniformity and increase the risk of side reactions and stack degradation. Therefore, this local ultra-high potential actually promotes the occurrence of fault-side reactions, further deteriorating the operating conditions of the VRB system.
Figure 7.
VRB single-cell terminal voltage variation: (a) charging; (b) discharging.
4.3. Data Preprocessing
Based on the VRB pump fault experiments described in Section 4.2, experimental data were collected for three pump fault categories.
The experimental protocol comprises two primary phases to ensure data quality and system stability. During the experimental preparation phase, the initial terminal voltage of the VRB is recorded at the onset of each fault experiment. The initial state of charge (SOC) is subsequently determined using the established open-circuit voltage (OCV)-SOC calibration curve.
The BT100M-YZ1515X peristaltic pump used in this study has a speed range of 0.1–100 rpm and a speed resolution of 0.1 rpm. When equipped with the YZ1515X pump head, its flow-rate range is 0.007–380 mL min−1, with a flow error of less than ±0.5%. The pump supports digital speed control, RS485/MODBUS communication, and external analog control signals, including 0–5 V, 0–10 V, and 4–20 mA. In this study, the electrolyte flow rate was set to 60 mL min−1.
Due to the hardware configuration of the current laboratory platform, flow-rate adjustment was performed manually, and the system was temporarily paused during the adjustment process. This pause was an artifact of the laboratory setup rather than a requirement of the pump or the proposed diagnostic model. The data collected during the pause and transition periods were excluded from model training and testing. In an automated online BMS, pump operation can be electronically controlled, and continuous monitoring signals can be collected without manual interruption. Therefore, future work will further validate the model using continuous online stack-level data.
After excluding idle, manual-adjustment, and transition-period data, the remaining valid chronological data were used for feature extraction and model training. To prevent information leakage, the data were first divided at the raw segment level before sliding-window generation. Continuous segments with the same operating label were identified, and complete segments were assigned to the training and testing subsets according to a target ratio of 17:3. Sliding-window segmentation was then conducted separately within each subset, with a window size of 5 and a step size of 1. Normalization parameters were calculated only from the training set and then applied to the testing set.
Table 3 reports the distribution of the three pump fault categories. The normal-state samples F0 were extracted from normal operating periods and were included in the complete four-class dataset used for model training, testing, and comparison experiments in Section 5.
Table 3.
Quantity distribution of VRB single-cell system pump fault experimental fault dataset.
4.4. Fault Feature Extraction
The input feature parameters available for the VRB pump fault diagnosis model include charging–discharging current, flow rate, SOC, and historical voltage data types. In the paper, current I, voltage U, state of charge SOC, ∆R, and the derivative of voltage with respect to time dU/dt are selected as input features.
The voltage signal is affected by electrochemical characteristics, temperature, flow rate, and VRB material properties. Therefore, the voltage signal is one of the key signals in VRB health detection indices.
To eliminate the influence of current changes, we consider using ∆R as an input feature parameter, with the calculation formula as follows:
where Ut is the voltage at time t, Ut−1 is the voltage at the previous time t − 1, and It is the current at time t.
When the VRB undergoes charging–discharging cycles, ∆R fluctuates when discharging approaches 1.0 V or charging approaches 1.7 V. Therefore, SOC is selected as one of the input feature parameters to limit the fluctuations in ∆R when charging–discharging approaches the cutoff voltage.
According to the voltage variation curves in Section 4.2, it can be observed that abnormally high voltages appeared at each fault point on the fault side. Therefore, we present the derivative of voltage with respect to time to further enhance the characteristics generated when pump faults occur.
4.5. Feature Correlation and Importance Analysis
To further evaluate the rationality of the selected input features and examine possible feature redundancy, Pearson correlation analysis, Random Forest-based feature importance analysis, permutation importance evaluation, and ablation analysis were conducted.
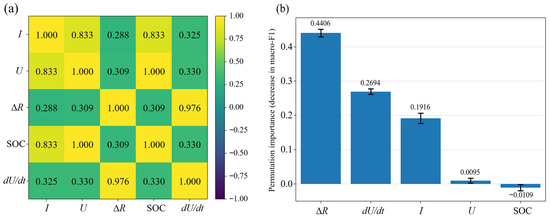
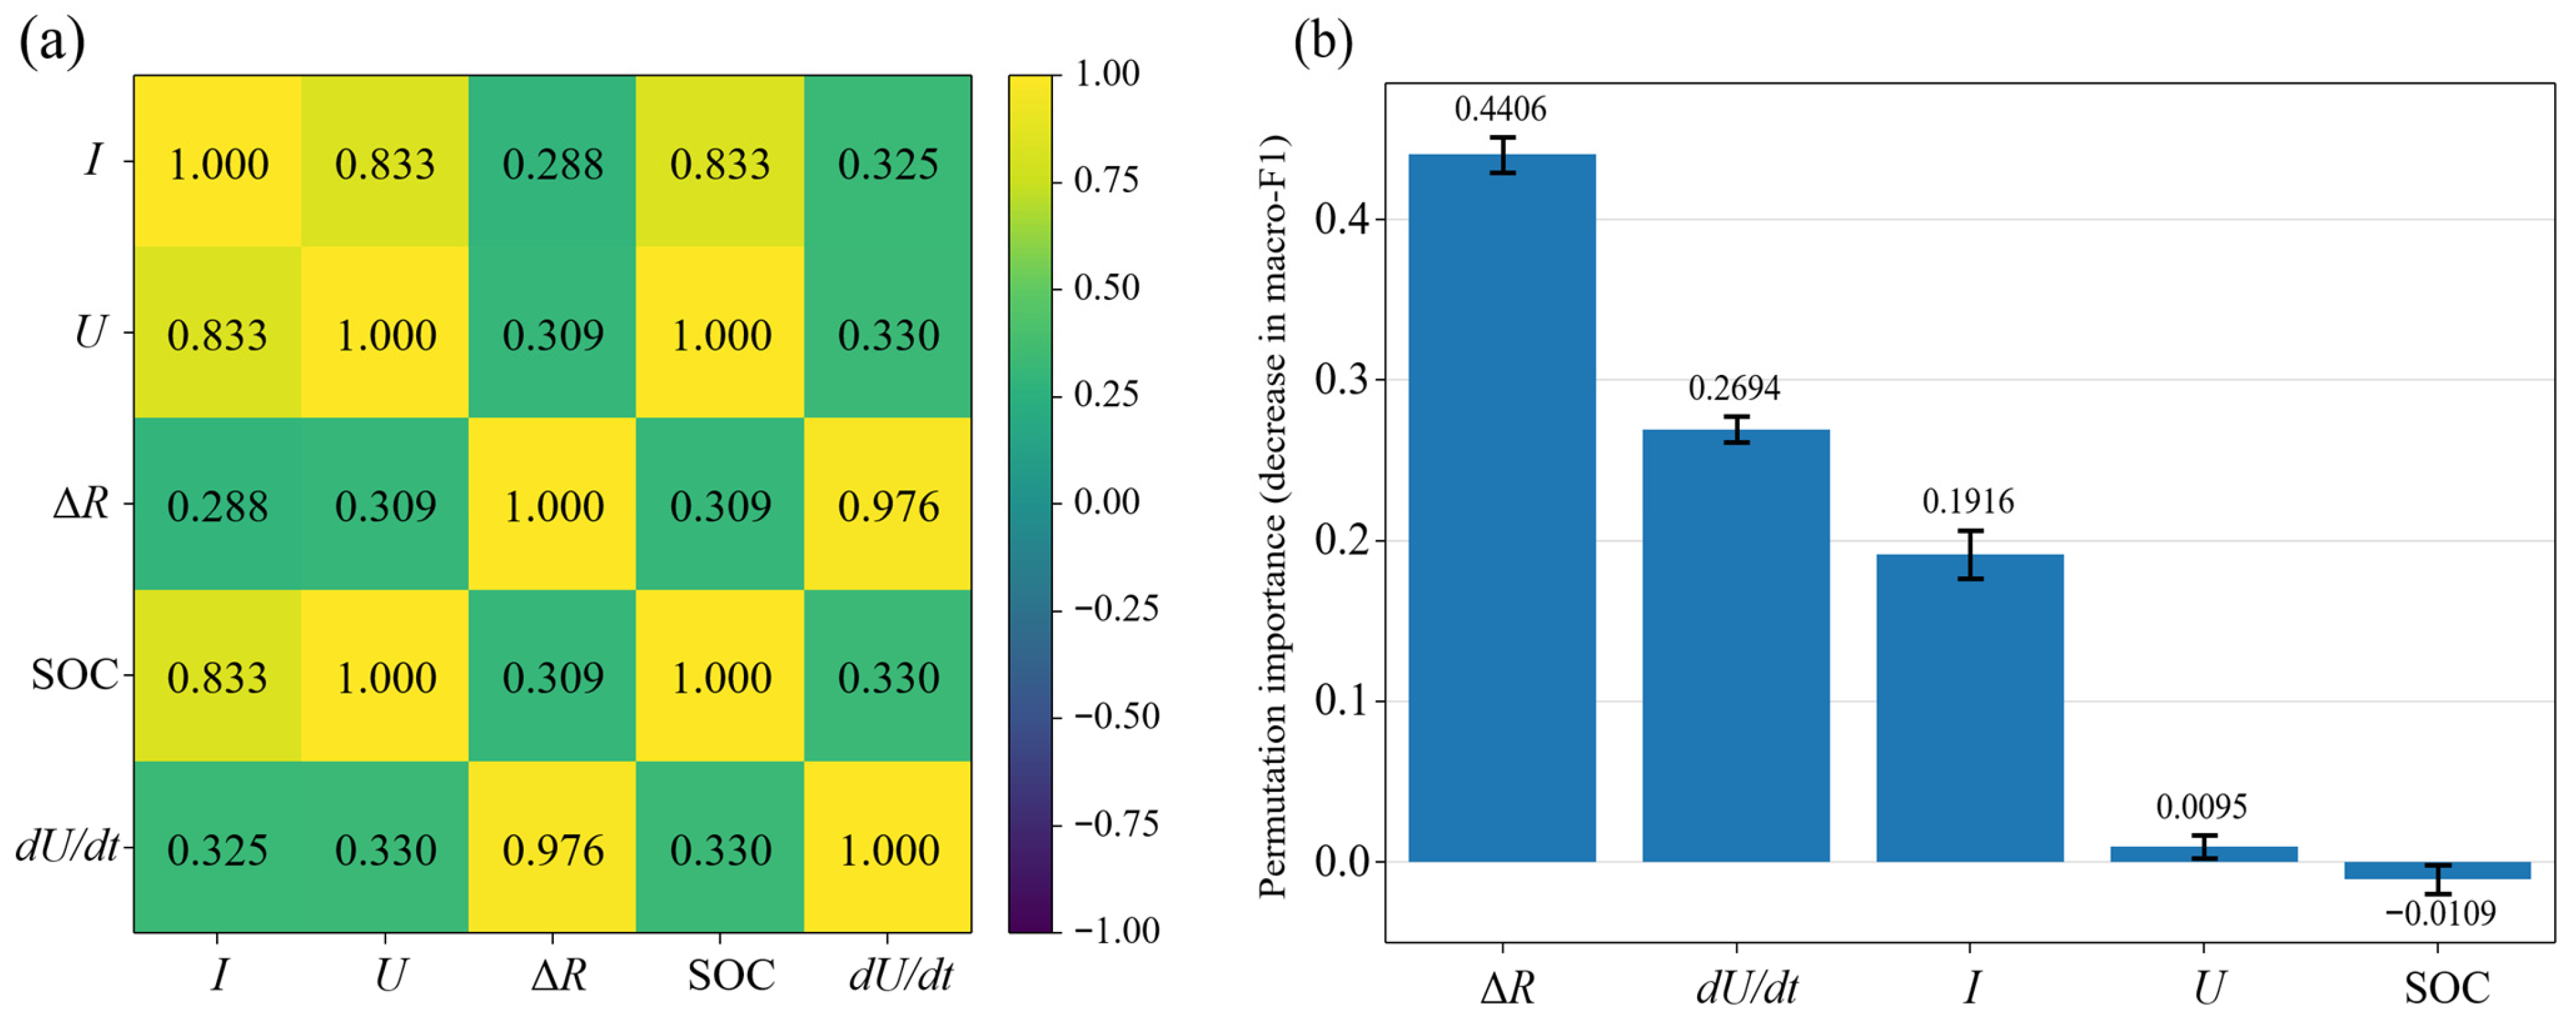
Figure 8a shows the Pearson correlation matrix of the input features. The correlation coefficient between ∆R and dU/dt is 0.976, indicating a high correlation. This is expected because both features are derived from terminal voltage variation and describe the dynamic voltage response during pump faults. In addition, U and SOC show a high correlation coefficient of 1.000, since SOC is closely related to the voltage state of the VRB. However, the correlations between U and ∆R, and between U and dU/dt, are much lower, with values of 0.309 and 0.330, respectively. This indicates that the static voltage level and dynamic voltage variation still provide different diagnostic information.
Figure 8.
Feature correlation and importance analysis: (a) Pearson correlation matrix of input features; (b) feature importance and permutation importance.
Figure 8b shows the permutation importance analysis of the input features. The results show that ∆R and dU/dt have the highest permutation importance values, which are 0.4406 and 0.2694, respectively. These values are higher than those of U and SOC, indicating that the two dynamic voltage-related features play an important role in pump fault diagnosis.
To further evaluate the contribution of these features, an ablation analysis was performed, as shown in Table 4. When all features were used, the macro-F1 score was 0.8612. When ∆R or dU/dt was removed individually, the macro-F1 score decreased to 0.8459 and 0.8290, respectively. When both ∆R and dU/dt were removed, the macro-F1 score decreased significantly to 0.2874. This result indicates that although ∆R and dU/dt are highly correlated, they contain essential dynamic fault information and should not be regarded as ineffective redundant inputs.
Table 4.
Confusion matrix for two-class problem.
Therefore, the simultaneous use of U, ∆R, and dU/dt did not degrade performance the proposed TCN-LSTM-MATT model after normalization and nonlinear feature extraction. Instead, these features provide complementary information for identifying pump fault characteristics from both static voltage state and dynamic voltage variation.
5. Results and Discussion
5.1. Model Performance Evaluation Metrics
For the constructed data-driven VRB fault classifier, to ensure the visualization of its performance and effectiveness, corresponding performance indicators need to be adopted to evaluate the fault diagnosis results of the classifier. The main performance indicators focused on in this section include diagnosis accuracy, precision, recall, confusion matrix.
One of the most informative methods for evaluating classifier performance is based on confusion matrix analysis. Table 4 shows the confusion matrix for a two-class problem, with class labels as negative and positive.
Quantities of commonly used metrics for evaluating machine learning system performance from the confusion matrix, including overall fault detection accuracy (ACC), sensitivity (SE), and positive predictive value (PPV) are introduced, are calculated by
5.2. Diagnostic Results
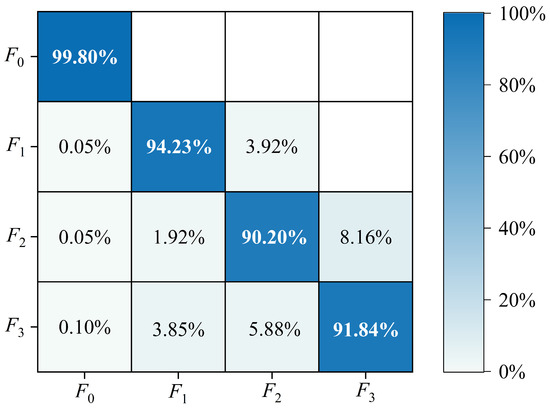
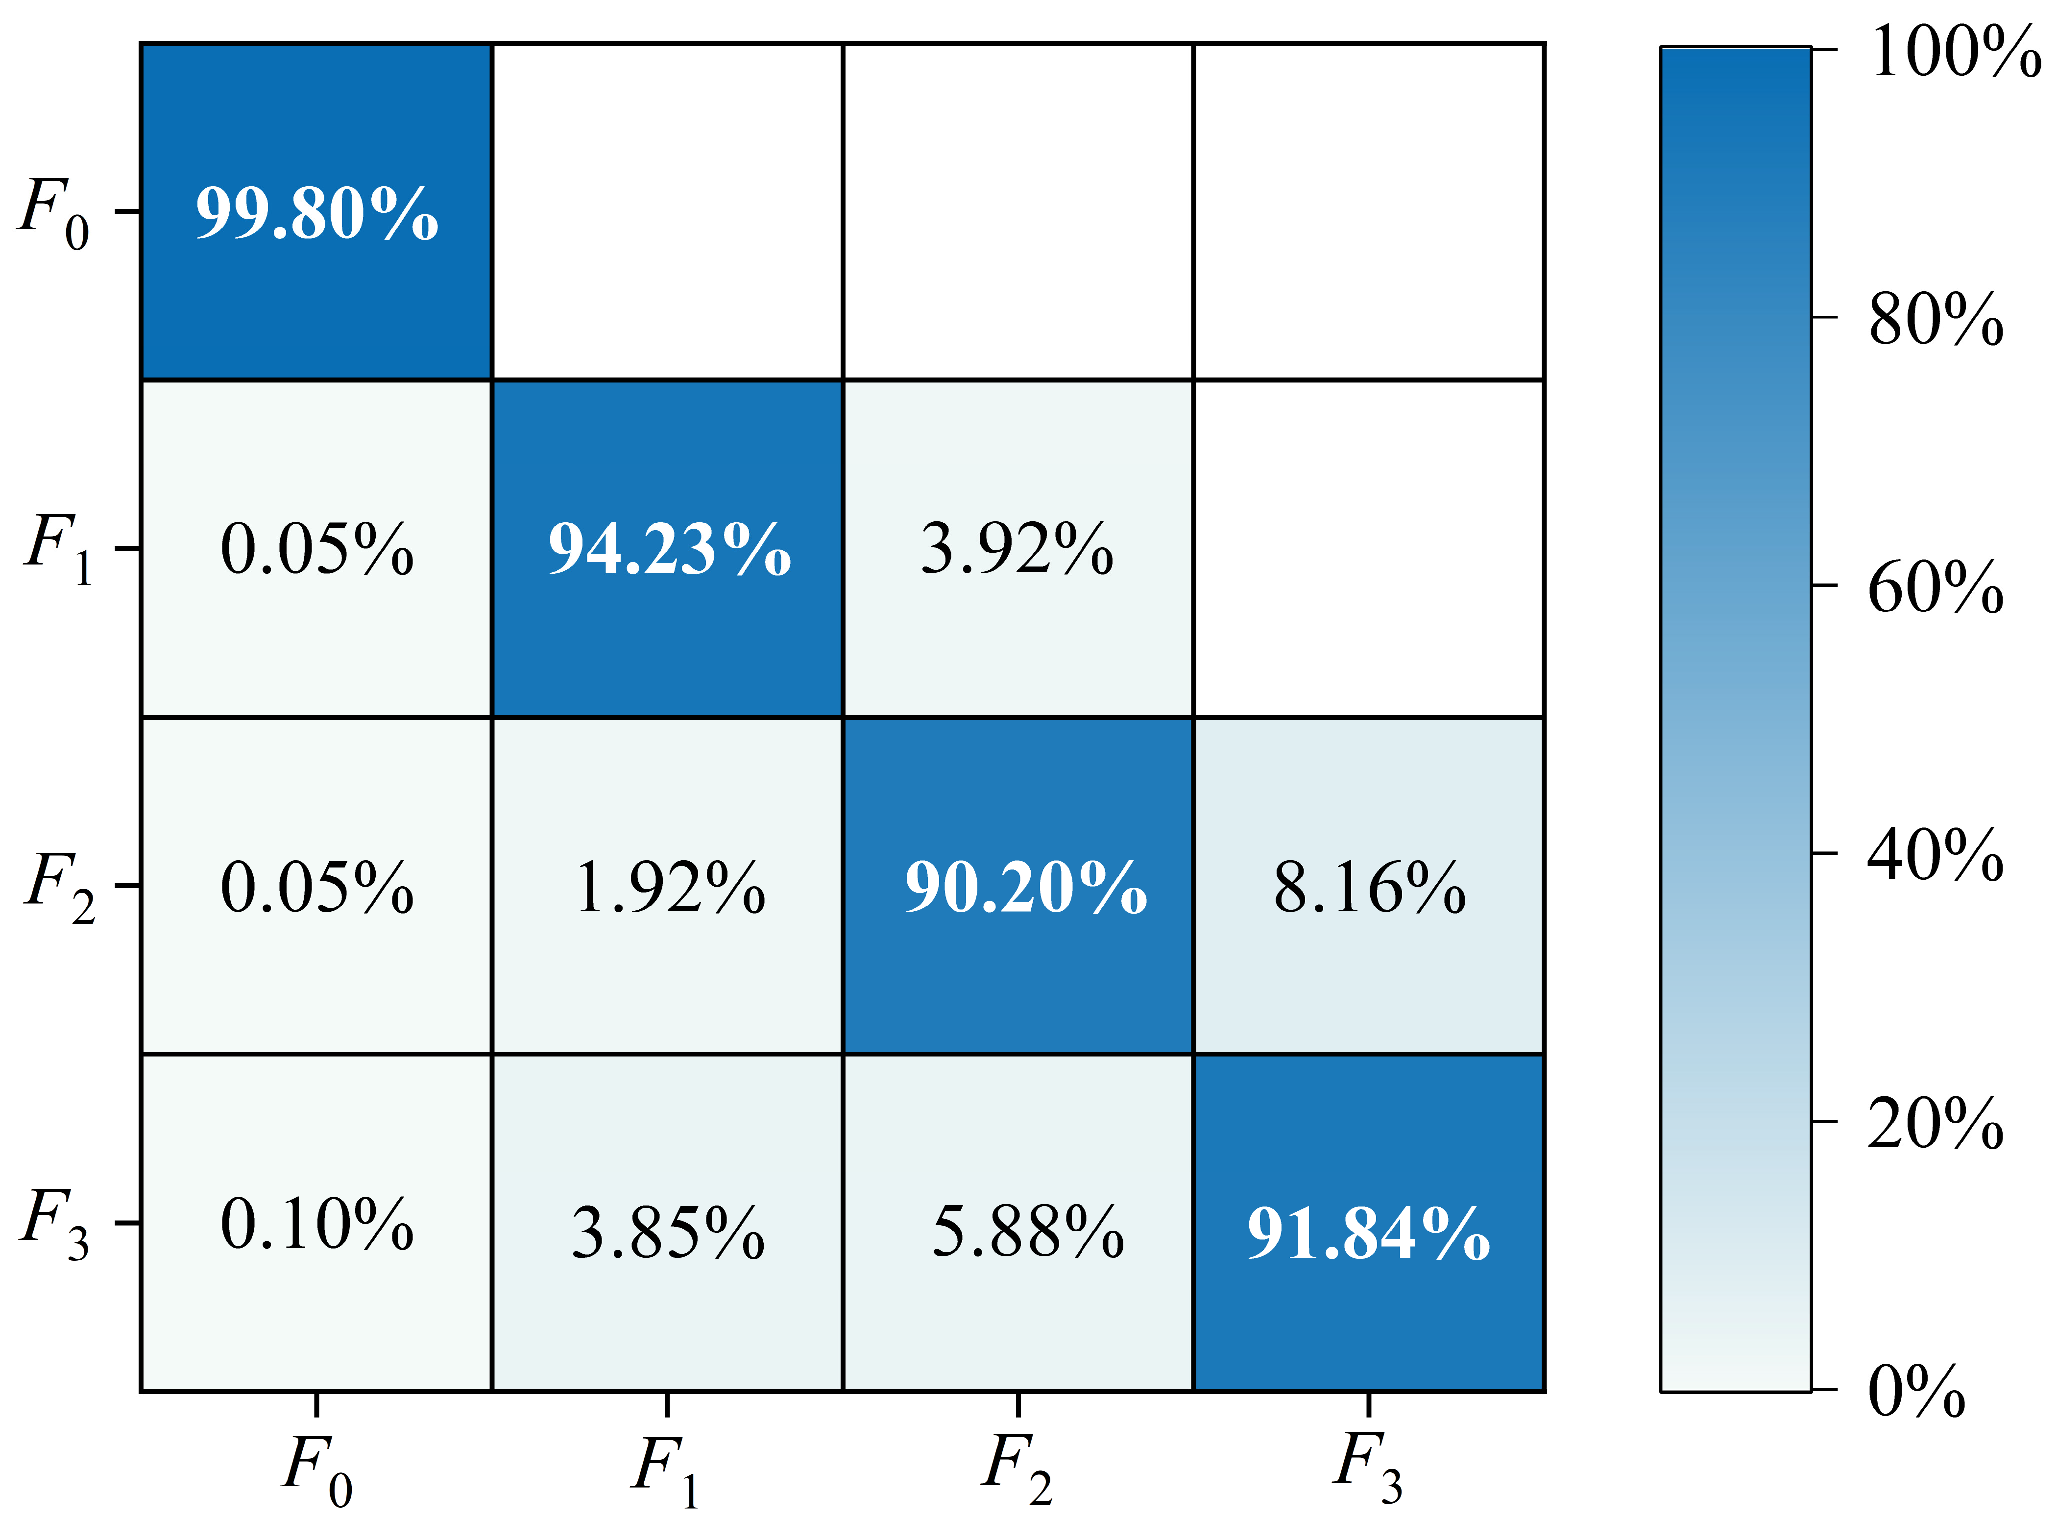
The paper defines F0 as normal condition, F1 as bilateral pump fault, F2 as positive pump fault, and F3 as negative pump fault. Using the leakage-free segment-level partitioning strategy described in Section 3.4 and Section 4.3, the raw chronological segments were first assigned to the training and testing subsets according to a target ratio of 17:3. Sliding-window segmentation was then performed independently within each subset before model training and testing. To comprehensively and accurately evaluate the classifier’s performance, PPV and SE are adopted as key evaluation metrics, with their specific values presented in Table 5. The confusion matrix in Figure 9 presents the detailed classification results, where each row represents the true labels and each column represents the predicted labels. It should be noted that the reported ACC of 99.25% mainly reflects the overall fault detection performance of the model in distinguishing normal and faulty operating data. The diagnosis capability for specific pump fault types is evaluated using class-wise diagnostic precision. The diagnostic precisions for F1, F2, and F3 are 94.23%, 90.20%, and 91.84%, respectively, all exceeding 90%. These results indicate that the proposed model achieves effective diagnosis for the three investigated pump fault types.
Table 5.
VRB pump fault diagnosis results based on TCN-LSTM-MATT.
Figure 9.
Confusion matrix of the proposed model for VRB pump fault diagnosis.
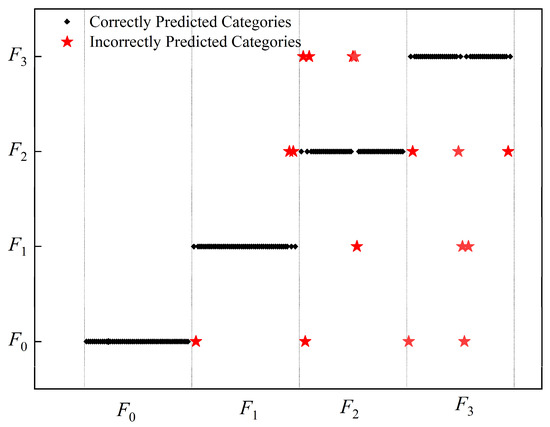
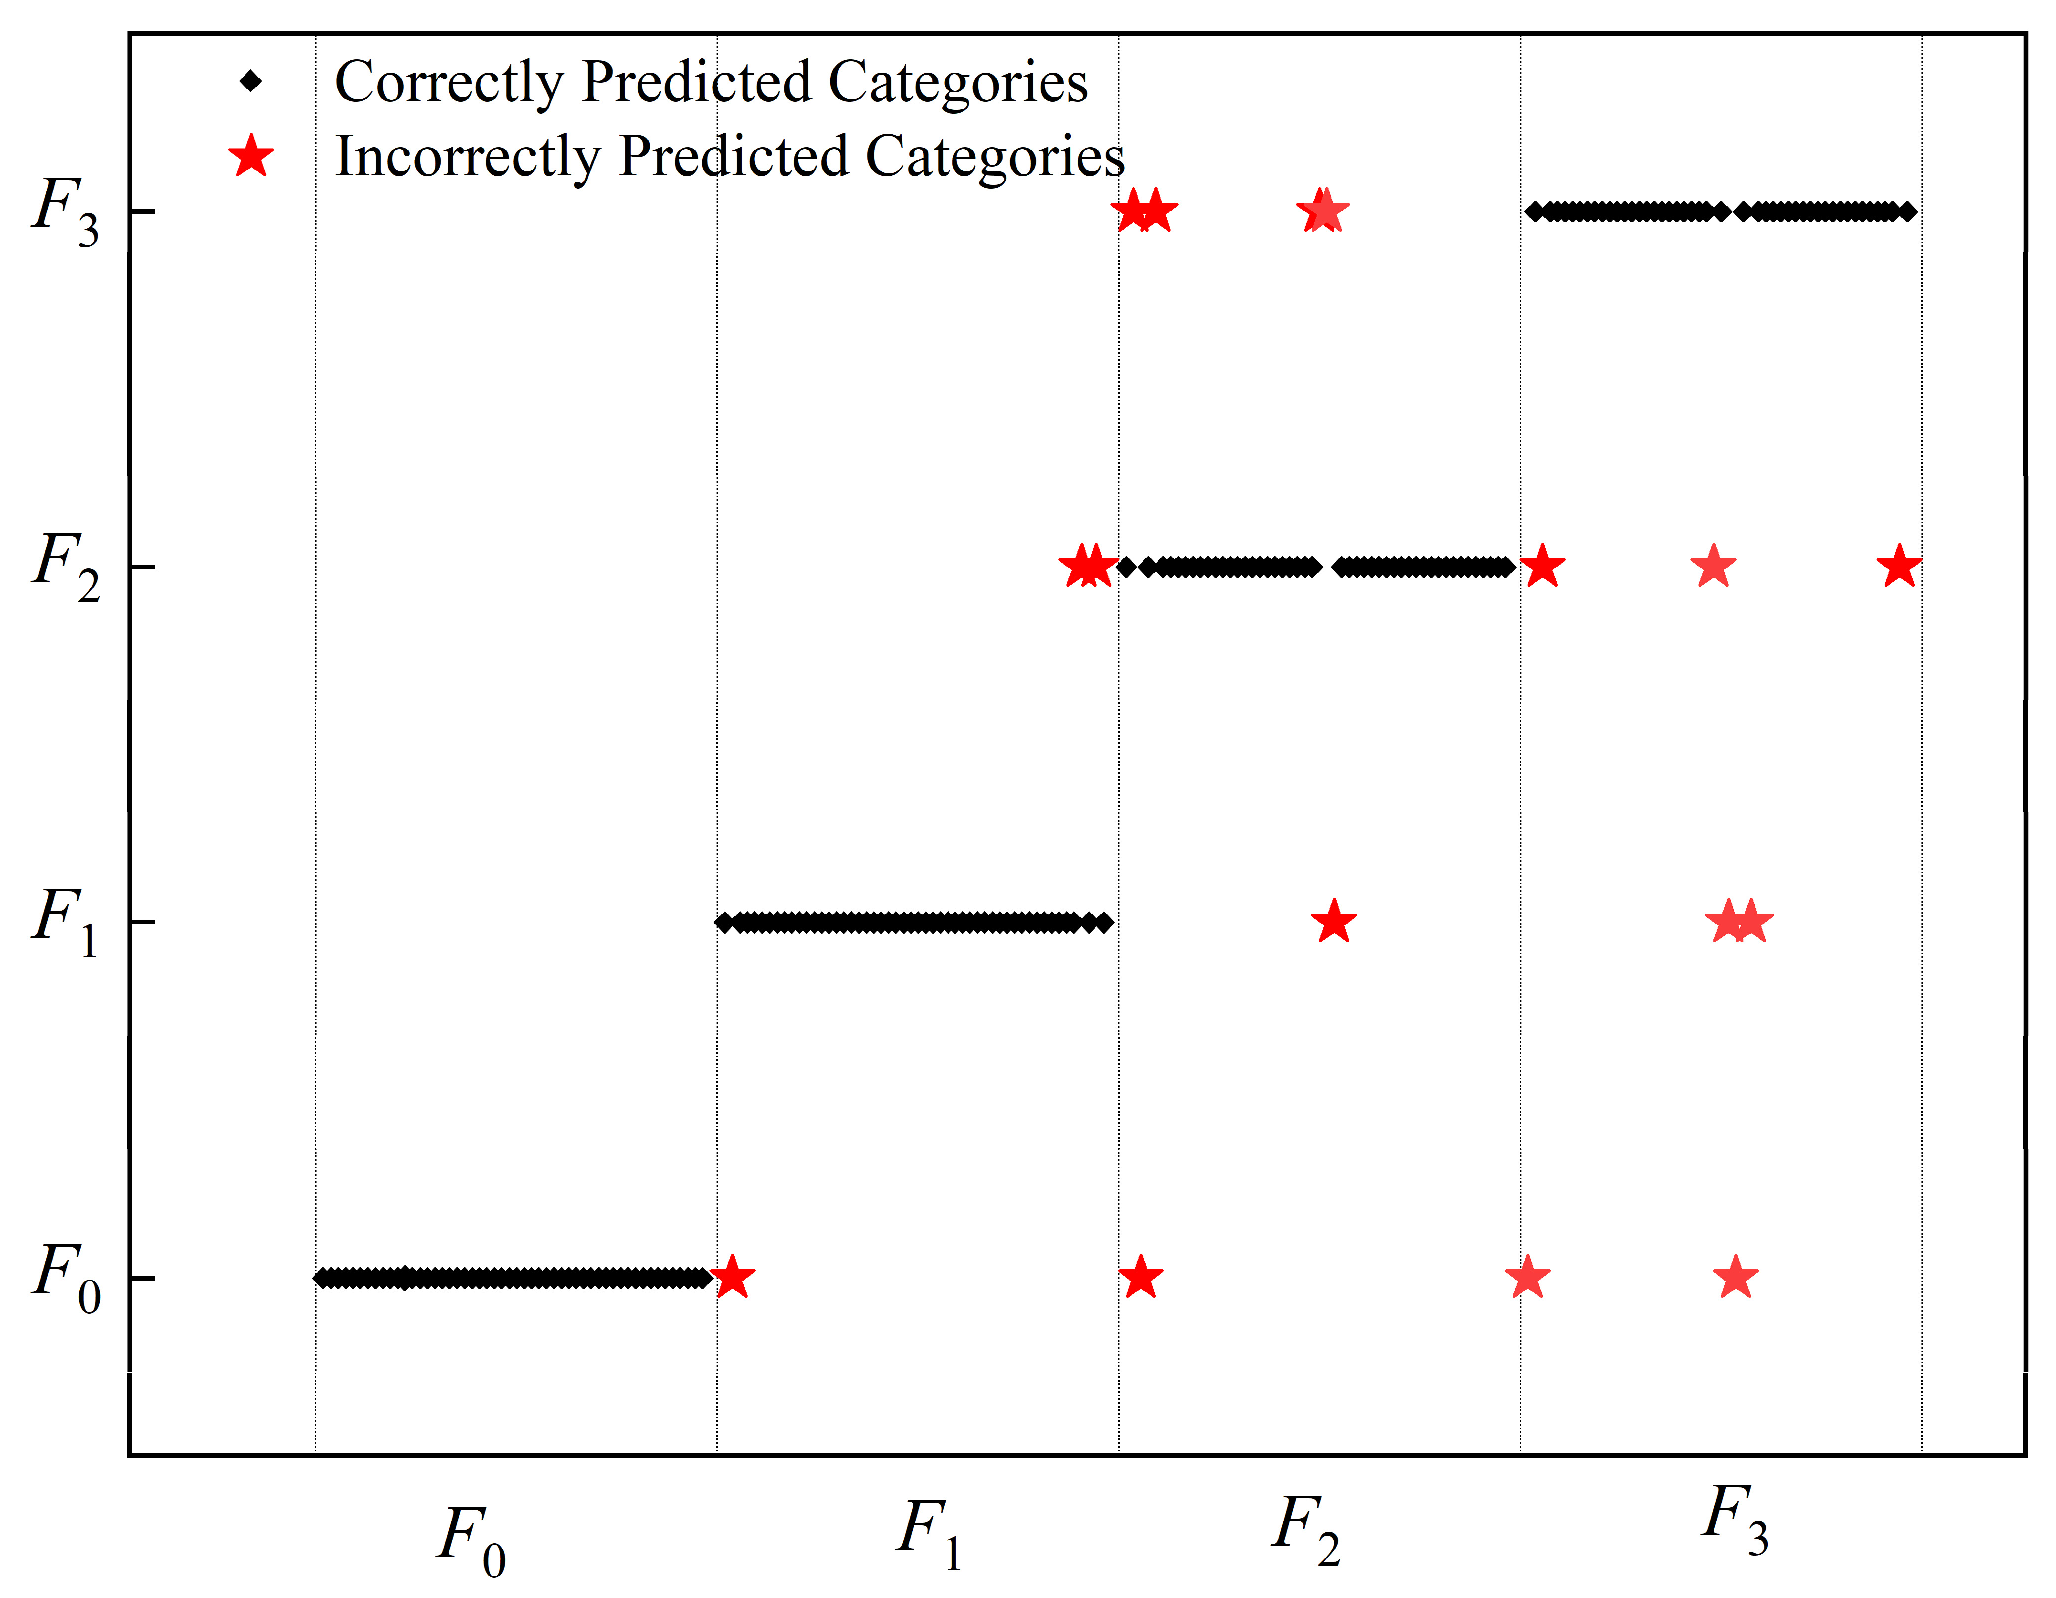
As depicted in Figure 10, the confusion matrix evidences the outstanding classification accuracy of the proposed approach across all fault categories, indicating robust performance in multi-class fault diagnosis applications. The diagonal distribution of correctly predicted categories (black diamonds) indicates high classification accuracy, with most predictions concentrated along the main diagonal. The sparse distribution of incorrectly predicted categories (red stars) reveals minimal misclassification errors, primarily occurring between adjacent fault categories F2 and F3.
Figure 10.
Prediction results of the proposed model for normal and pump fault operating conditions.
The main misclassification occurs between F2 and F3, namely positive pump fault and negative pump fault. Although these two faults involve different half-cell redox reactions, the experiments were conducted on a small-scale single-cell platform, and no obvious side reactions were observed during the short pump-shutdown period. In addition, the selected input features, including terminal voltage, current, SOC, ∆R, and dU/dt, mainly describe the global cell response rather than the individual positive and negative half-cell potentials. Under short-term pump interruption, both faults can cause insufficient electrolyte supply, weakened convective mass transfer, voltage fluctuation, and impedance-related variation. Therefore, similar terminal-voltage-based dynamic patterns may be generated, leading to bidirectional misclassification between F2 and F3.
This result indicates a limitation of the current feature set. In future work, positive and negative half-cell potentials measured by reference electrodes will be introduced to better capture asymmetric electrochemical behavior and improve the separability between positive and negative pump faults.
Notably, F0 and F1 exhibit excellent discrimination with virtually no misclassification, demonstrating the model’s robustness in distinguishing between healthy and critical system states.
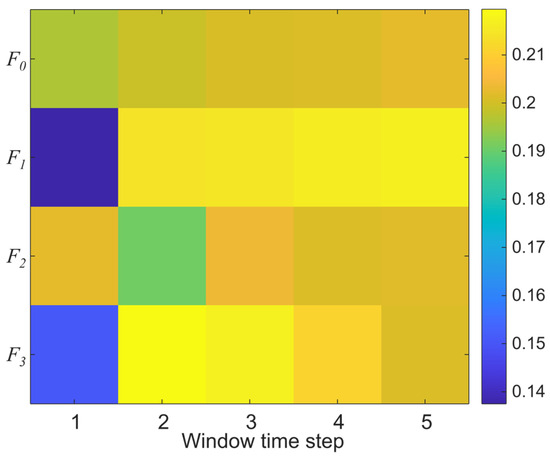
To further improve the interpretability of the proposed TCN-LSTM-MATT model, the temporal attention scores generated by the multi-head self-attention layer were visualized, as shown in Figure 11. Different from post hoc normalized activation values, the attention scores were computed by reconstructing the scaled dot-product attention from the trained multi-head self-attention layer. Specifically, for each correctly classified test sample, the LSTM outputs were projected using the learned QueryWeights and KeyWeights to obtain the query and key representations. The scaled dot-product softmax attention scores were then calculated and averaged across attention heads, query positions, and correctly classified test samples from the same class.
Figure 11.
Mean softmax attention scores computed from the trained multi-head self-attention layer.
Since the sliding-window size was set to 5, the horizontal axis represents the five relative time positions within each input window rather than the five input features. For each class, the averaged attention scores over the five time positions approximately sum to one, which is consistent with the softmax attention mechanism. As shown in Figure 11, the model assigns different attention scores to different time positions within the sliding window. The middle and later time positions generally receive relatively higher attention scores, indicating that the MATT module helps the model focus on important temporal information close to the diagnosis moment. This is consistent with the sliding-window labeling strategy, where the last time step is used as the sample label.
5.3. Comparison of Different Models
The proposed model was implemented in MATLAB R2023a on a computer equipped with an Intel Core i5-14500HX CPU with 14 cores and 20 logical processors, an NVIDIA GeForce RTX 4060 Laptop GPU, and 16 GB of RAM. The leakage-free training and testing subsets generated by segment-level partitioning were used for all compared models. The comparison of diagnostic results of four models is shown below.
Table 6 presents an ablation comparison to evaluate the progressive contribution of TCN, LSTM, and MATT in the proposed architecture.
Table 6.
PPV of diagnostic results for the four models.
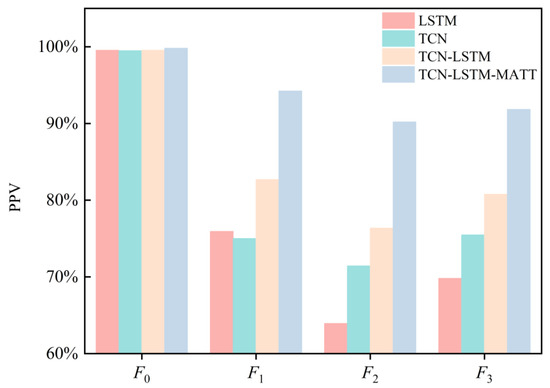
The comparative results presented in Figure 12 and Table 6 reveal the performance differences among the four models. The LSTM model shows the lowest fault diagnosis performance, mainly because a single recurrent structure has limited ability to extract local temporal patterns from VRB pump fault signals. The TCN model performs better than LSTM, which can be attributed to its dilated causal convolution structure for capturing local and long-range temporal dependencies. The TCN-LSTM hybrid architecture further improves diagnostic precision by combining the local temporal feature extraction ability of TCN with the sequential modeling ability of LSTM.
Figure 12.
Comparison of diagnostic results of four models.
The proposed TCN-LSTM-MATT model achieves the highest precision values for the three pump fault categories. This indicates that the MATT module can adaptively assign different weights to temporal positions within the sliding window and help the model focus on fault-related temporal information. Therefore, the progressive improvement from LSTM and TCN to TCN-LSTM and TCN-LSTM-MATT demonstrates the effectiveness of combining local temporal feature extraction, sequential dependency modeling, and temporal attention weighting for VRB pump fault diagnosis. The consistent performance gains across the fault categories further indicate the effectiveness and stability of the proposed approach.
To further evaluate the performance and robustness of the proposed model under different amounts of training data, comparative experiments were conducted using the leakage-free segment-level holdout protocol. The training data scales were set to 10%, 20%, 40%, 80%, and 100%. These percentages refer to the proportion of the training candidate pool used for model training, rather than the total number of samples listed in Table 3. The testing set was kept fixed for fair comparison. Complete label-homogeneous segments were first assigned to the training and testing subsets, and sliding-window segmentation was then performed independently within each subset to avoid data leakage.
In addition to LSTM, TCN, Transformer, and the proposed TCN-LSTM-MATT model, two recent time-series models, PatchTST and TimesNet, were also introduced as advanced baselines. Transformer-based models have been widely used for sequence modeling, while PatchTST and TimesNet have shown strong capability in time-series representation learning. Therefore, LSTM, TCN, Transformer, PatchTST, TimesNet, TCN-LSTM, and the proposed TCN-LSTM-MATT model were compared under the same training and testing splits. The maximum, minimum, and average accuracies of repeated experiments were reported to evaluate the diagnostic performance and robustness of each method.
As shown in Table 7, the diagnostic accuracy of all models generally increases as the training data scale increases. Compared with LSTM and TCN, Transformer, PatchTST, and TimesNet achieve higher accuracies, indicating that advanced temporal modeling structures can improve the extraction of short-term dynamic fault features. Among all compared models, the proposed TCN-LSTM-MATT model achieves the highest average accuracy under all training data scales. This demonstrates that the combination of TCN-based local temporal feature extraction, LSTM-based sequential dependency modeling, and multi-head attention-based temporal weighting is effective for VRB pump fault diagnosis, especially under limited training data conditions.
Table 7.
Diagnostic accuracy of different models under different training-set percentages.
6. Conclusions
Previous methods did not comprehensively consider temporal information or distinguish the importance of different temporal positions, and single neural network architectures have difficulty capturing local temporal patterns and long-term dependencies simultaneously. To address these challenges, this study proposes a TCN-LSTM-MATT model for intelligent VRB pump fault diagnosis. The results show that the proposed model achieves high overall diagnostic accuracy, and the class-wise PPVs of all investigated pump fault categories exceed 90%. Compared with the baseline models, the proposed model achieves better diagnostic performance. In particular, compared with the TCN-LSTM model, the TCN-LSTM-MATT model achieves higher diagnostic accuracy, indicating that the MATT module can enhance the representation of fault-related temporal information within the sliding window. These results demonstrate the effectiveness of combining local temporal feature extraction, sequential dependency modeling, and temporal attention weighting for VRB pump fault diagnosis. This study provides a basis for intelligent monitoring systems that can support early pump fault diagnosis and improve the operational reliability of VRB systems for grid-scale energy storage applications.
Although the proposed TCN-LSTM-MATT model achieves high diagnostic accuracy on the single-cell experimental platform, its direct application to kW-class stack systems still requires further validation. In stack-level VRB systems, pipeline pressure drop, electrolyte transport delay, shunt current, and non-uniform flow distribution may change the amplitude, delay, and coupling characteristics of the measured signals. Therefore, the input feature set, window length, and model parameters may need to be adjusted when the model is transferred from single-cell voltage monitoring to full-stack monitoring. In future work, stack-level signals, including stack voltage, single-cell voltage distribution, inlet/outlet pressure, flow rate, and temperature, will be introduced to improve the adaptability and robustness of the model in practical kW-class VRB systems. In addition, the present study simulated an extreme pump fault condition with complete flow-supply interruption. More realistic progressive pump degradation modes, such as gradual flow-rate decay, intermittent pump-speed fluctuation, partial blockage, pressure variation, and long-term pump performance degradation, will be further considered to improve the practical applicability of the proposed diagnosis method. The real-time deployment of the proposed model will also be evaluated by analyzing its computational cost, inference speed, memory usage, and embedded implementation performance on practical BMS hardware.
Author Contributions
Conceptualization, L.L. and X.Z.; methodology, S.W.; software, L.L., F.D. and C.L.; validation, X.Z., F.D. and S.W.; formal analysis, J.F. and C.L.; investigation, L.L. and J.T.; resources, B.X.; data curation, F.D. and J.T.; writing—original draft preparation, L.L., X.Z., J.F. and F.D.; writing—review and editing, S.W., B.X., J.T. and C.L.; visualization, L.L., J.F. and C.L.; supervision, B.X.; project administration, B.X. and X.Z.; funding acquisition, B.X. All authors have read and agreed to the published version of the manuscript.
Funding
This research was funded by the National Natural Science Foundation of China (No. 52177221).
Data Availability Statement
The data of this study are available from the corresponding authors upon available request.
Conflicts of Interest
Authors Xunzhao Zheng and Feifei Dong were employed by the company North China Power Engineering CO., LTD. The remaining authors declare that the research was conducted in the absence of any commercial or financial relationships that could be construed as a potential conflict of interest.
References
- Xu, H.; Cheng, L.; Paizulamu, D.; Zheng, H. Safety and Reliability Analysis of Reconfigurable Battery Energy Storage System. Batteries 2025, 11, 12. [Google Scholar] [CrossRef] [Scilit]
- Li, Y.; Zhang, X.; Lu, T.; Zhang, Y.; Li, X.; Yu, D.; Zhao, G. Boosting the Capacitance of Aqueous Zinc-Ion Hybrid Capacitors by Engineering Hierarchical Porous Carbon Architecture. Batteries 2023, 9, 429. [Google Scholar] [CrossRef] [Scilit]
- Ning, K.; Zhao, G.; Liu, H.; Hu, M.; Huang, F.; Li, H.; Zhang, L.; Zhu, G.; Wang, H.; Shi, J. N and S Co-Doped 3D Hierarchical Porous Carbon as High-Performance Electrode Material for Supercapacitors. Diam. Relat. Mater. 2022, 126, 109080. [Google Scholar] [CrossRef] [Scilit]
- Suraparaju, S.K.; Samykano, M.; Vennapusa, J.R.; Rajamony, R.K.; Balasubramanian, D.; Said, Z.; Pandey, A.K. Challenges and Prospectives of Energy Storage Integration in Renewable Energy Systems for Net Zero Transition. J. Energy Storage 2025, 125, 116923. [Google Scholar] [CrossRef] [Scilit]
- Meng, D.; Bian, Z.; Su, K.; Wang, Y.; Lu, Z.; Cai, E.; Lang, J. Improvement of Interphase Stability of Hard Carbon for Sodium-Ion Battery by Ionic Liquid Additives. Batteries 2025, 11, 102. [Google Scholar] [CrossRef] [Scilit]
- Qazi, S.H.; Kalhoro, M.D.; Bozalakov, D.; Vandevelde, L. Transforming Grid Systems for Sustainable Energy Futures: The Role of Energy Storage in Offshore Wind and Floating Solar. Batteries 2025, 11, 233. [Google Scholar] [CrossRef] [Scilit]
- Ji, W.; Hong, F.; Zhao, Y.; Liang, L.; Du, H.; Hao, J.; Fang, F.; Liu, J. Applications of Flywheel Energy Storage System on Load Frequency Regulation Combined with Various Power Generations: A Review. Renew. Energy 2024, 223, 119975. [Google Scholar] [CrossRef] [Scilit]
- Staadecker, M.; Szinai, J.; Sánchez-Pérez, P.A.; Kurtz, S.; Hidalgo-Gonzalez, P. The Value of Long-Duration Energy Storage under Various Grid Conditions in a Zero-Emissions Future. Nat. Commun. 2024, 15, 9501. [Google Scholar] [CrossRef] [Scilit] [PubMed]
- Adetokun, B.B.; Oghorada, O.; Abubakar, S.J. Superconducting Magnetic Energy Storage Systems: Prospects and Challenges for Renewable Energy Applications. J. Energy Storage 2022, 55, 105663. [Google Scholar] [CrossRef] [Scilit]
- Liu, L.; Shao, S. Recent Advances of Low-Temperature Cascade Phase Change Energy Storage Technology: A State-of-the-Art Review. Renew. Sustain. Energy Rev. 2023, 186, 113641. [Google Scholar] [CrossRef] [Scilit]
- Elalfy, D.A.; Gouda, E.; Kotb, M.F.; Bureš, V.; Sedhom, B.E. Comprehensive Review of Energy Storage Systems Technologies, Objectives, Challenges, and Future Trends. Energy Strategy Rev. 2024, 54, 101482. [Google Scholar] [CrossRef] [Scilit]
- Manfo Theodore, A. Structural, Electrical, and Electrochemical Studies of the Olivine LiMPO4 (M = Fe, Co, Cr, Mn, V) as Cathode Materials for Lithium-Ion Rechargeable Batteries Based on the Intercalation Principle. Mater. Open Res. 2023, 2, 11. [Google Scholar] [CrossRef] [Scilit]
- Xiao, Z.; Zhang, R.; Lu, M.; Ma, Q.; Li, Z.; Su, H.; Li, H.; Xu, Q. Numerical Simulation of Impact of Different Redox Couples on Flow Characteristics and Electrochemical Performance of Deep Eutectic Solvent Electrolyte Flow Batteries. Batteries 2025, 11, 18. [Google Scholar] [CrossRef] [Scilit]
- Wang, W.; Yuan, B.; Sun, Q.; Wennersten, R. Application of Energy Storage in Integrated Energy Systems—A Solution to Fluctuation and Uncertainty of Renewable Energy. J. Energy Storage 2022, 52, 104812. [Google Scholar] [CrossRef] [Scilit]
- Zhao, Z.; Liu, X.; Zhang, M.; Zhang, L.; Zhang, C.; Li, X.; Yu, G. Development of Flow Battery Technologies Using the Principles of Sustainable Chemistry. Chem. Soc. Rev. 2023, 52, 6031–6074. [Google Scholar] [CrossRef] [Scilit] [PubMed]
- Li, L.; Chen, X.; Feng, Z.; Jiang, Y.; Dai, L.; Zhu, J.; Liu, Y.; Wang, L.; He, Z. Recent Advances and Perspectives of Practical Modifications of Vanadium Redox Flow Battery Electrodes. Green Chem. 2024, 26, 6339–6360. [Google Scholar] [CrossRef] [Scilit]
- Rychcik, M.; Skyllas-Kazacos, M. Characteristics of a New All-Vanadium Redox Flow Battery. J. Power Sources 1988, 22, 59–67. [Google Scholar] [CrossRef] [Scilit]
- Wang, S.; Li, Y.; Li, C.; Lin, X.; Ma, W.; Tong, N.; Xiong, B. A Systematic Study of Pipe and Electrical Connections for Multi-Stack Vanadium Redox Flow Battery Modules Considering Electrolyte Transport Delays. Chem. Eng. J. 2025, 519, 164929. [Google Scholar] [CrossRef] [Scilit]
- Chen, H.; Zhang, X.; Zhang, S.; Wu, S.; Chen, F.; Xu, J. A Comparative Study of Iron-Vanadium and All-Vanadium Flow Battery for Large Scale Energy Storage. Chem. Eng. J. 2022, 429, 132403. [Google Scholar] [CrossRef] [Scilit]
- Wang, Y.; Mu, A.; Wang, W.; Yang, B.; Wang, J. A Review of Capacity Decay Studies of All-Vanadium Redox Flow Batteries: Mechanism and State Estimation. ChemSusChem 2024, 17, e202301787. [Google Scholar] [CrossRef] [Scilit] [PubMed]
- Pan, T.; Yu, Z.; Ma, S.; Xu, D.; Ye, Y.; Li, J. Detection of Internal Short Circuit in Lithium-Ion Batteries Based on Electrothermal Coupling Model. J. Energy Storage 2025, 106, 114685. [Google Scholar] [CrossRef] [Scilit]
- Ma, M.; Duan, Q.; Li, X.; Liu, J.; Zhao, C.; Sun, J.; Wang, Q. Fault Diagnosis of External Soft-Short Circuit for Series Connected Lithium-Ion Battery Pack Based on Modified Dual Extended Kalman Filter. J. Energy Storage 2021, 41, 102902. [Google Scholar] [CrossRef] [Scilit]
- Mehta, M.R.; Crowley, K.M.; Khasin, M.; Kulkarni, C.S.; DeMattia, B.; Lawson, J.W. Anomaly Detection in Li-Ion Cells Using Physics-Based Reduced-Order Thermal Models. J. Power Sources 2025, 631, 236190. [Google Scholar] [CrossRef] [Scilit]
- Qiu, Y.; Cao, W.; Peng, P.; Jiang, F. A Novel Entropy-Based Fault Diagnosis and Inconsistency Evaluation Approach for Lithium-Ion Battery Energy Storage Systems. J. Energy Storage 2021, 41, 102852. [Google Scholar] [CrossRef] [Scilit]
- Gu, X.; Li, J.; Liu, K.; Zhu, Y.; Tao, X.; Shang, Y. A Precise Minor-Fault Diagnosis Method for Lithium-Ion Batteries Based on Phase Plane Sample Entropy. IEEE Trans. Ind. Electron. 2024, 71, 8853–8861. [Google Scholar] [CrossRef] [Scilit]
- Chang, C.; Wang, Q.; Jiang, J.; Jiang, Y.; Wu, T. Voltage Fault Diagnosis of a Power Battery Based on Wavelet Time-Frequency Diagram. Energy 2023, 278, 127920. [Google Scholar] [CrossRef] [Scilit]
- Zhao, H.; Zhang, C.; Liao, C.; Wang, L.; Liu, W.; Wang, L. Data-Driven Strategy: A Robust Battery Anomaly Detection Method for Short Circuit Fault Based on Mixed Features and Autoencoder. Appl. Energy 2025, 382, 125267. [Google Scholar] [CrossRef] [Scilit]
- Zhao, J.; Feng, X.; Wang, J.; Lian, Y.; Ouyang, M.; Burke, A.F. Battery Fault Diagnosis and Failure Prognosis for Electric Vehicles Using Spatio-Temporal Transformer Networks. Appl. Energy 2023, 352, 121949. [Google Scholar] [CrossRef] [Scilit]
- Cao, R.; Zhang, Z.; Shi, R.; Lu, J.; Zheng, Y.; Sun, Y.; Liu, X.; Yang, S. Model-Constrained Deep Learning for Online Fault Diagnosis in Li-Ion Batteries over Stochastic Conditions. Nat. Commun. 2025, 16, 1651. [Google Scholar] [CrossRef] [Scilit] [PubMed]
- Ouyang, J.; Lin, Z.; Hu, L.; Fang, X. Voltage Faults Diagnosis for Lithium-Ion Batteries in Electric Vehicles Using Optimized Graphical Neural Network. Sci. Rep. 2025, 15, 27328. [Google Scholar] [CrossRef] [Scilit] [PubMed]
- Li, S.; Zhang, C.; Du, J.; Zhang, L.; Jiang, Y. Feature Engineering-Driven Multi-Scale Voltage Anomaly Detection for Lithium-Ion Batteries in Real-World Electric Vehicles. Appl. Energy 2025, 377, 124634. [Google Scholar] [CrossRef] [Scilit]
- Yu, Q.; Wang, C.; Li, J.; Xiong, R.; Pecht, M. Challenges and Outlook for Lithium-Ion Battery Fault Diagnosis Methods from the Laboratory to Real World Applications. eTransportation 2023, 17, 100254. [Google Scholar] [CrossRef] [Scilit]

Disclaimer/Publisher’s Note: The statements, opinions and data contained in all publications are solely those of the individual author(s) and contributor(s) and not of MDPI and/or the editor(s). MDPI and/or the editor(s) disclaim responsibility for any injury to people or property resulting from any ideas, methods, instructions or products referred to in the content. |
© 2026 by the authors. Licensee MDPI, Basel, Switzerland. This article is an open access article distributed under the terms and conditions of the Creative Commons Attribution (CC BY) license.