3.1. Synthesis and Characterization
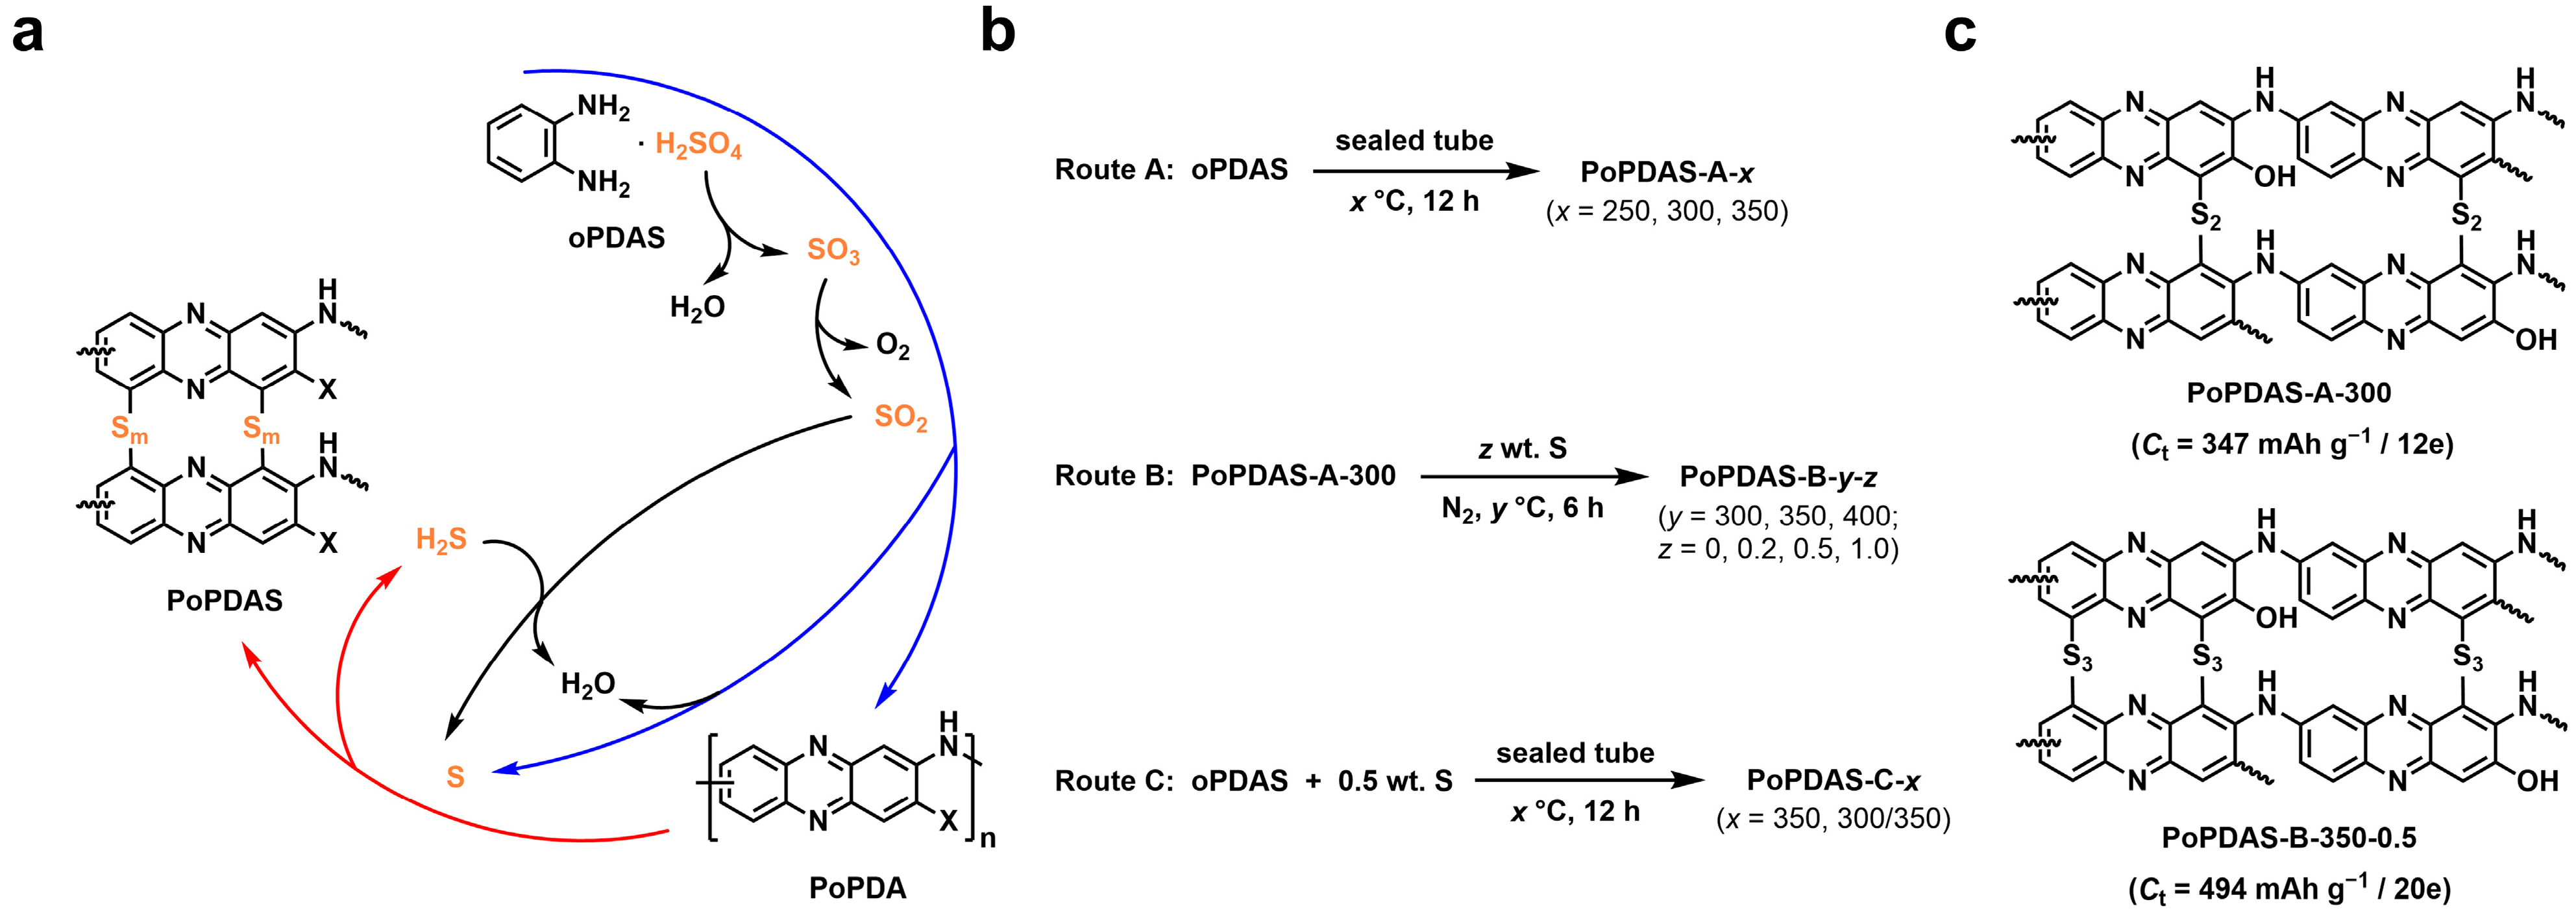
In our previous work, we successfully synthesized PoPDA via solution oxidative polymerization using oPDA, APS, and glacial acetic acid as the monomer, oxidant, and solvent, respectively. Despite the low cost of these raw materials and a relatively high product yield (~75%), the substantial consumption of organic solvent poses a significant obstacle to large-scale production. Consequently, we explored a solvent-free solid-phase synthesis of PoPDA and identified commercially available oPDAS as a promising single-source precursor (
Figure 1a). In this system, the oPDA moiety serves as the essential monomer, while the H
2SO
4 moiety and its high-temperature decomposition products [
23] (SO
3, SO
2, and O
2) function as in situ oxidants. The reaction byproducts likely include H
2O and S, originating from the eliminated protons of oPDA and the reduced sulfur species, respectively. At the polymerization temperature, the generated S may further react with the nascent PoPDA to form sulfide derivatives, analogous to our previously reported two-step polymerization–sulfurization procedure used to prepare SPoPDA. The sulfurization byproduct, H
2S, can subsequently react with the remaining SO
2 to regenerate S, thereby sustaining the sulfurization process. Although this inevitable concurrent sulfurization precludes the formation of pristine PoPDA, it could be advantageous for the product’s application as an OCM, as the introduced disulfide or polysulfide bonds can provide additional reversible capacity [
24].
To systematically optimize the synthetic conditions and improve the electrochemical performance of the products, we adopted three synthetic routes to realize the above proposed hypothesis (
Figure 1b; detailed synthetic conditions and yields are summarized in
Table S1). In Route A, the oPDAS precursor was placed in a vacuum-sealed ampoule and heated at
x °C (
x = 250, 300, 350) for 12 h. The resulting products were washed sequentially with dilute ammonia, deionized water, toluene, and ethanol to remove potential doping anions (e.g., SO
42− or HSO
4−), unreacted monomer, low-molecular-weight oligomers, and residual elemental S. After vacuum drying, the resulting black powder was designated as PoPDAS-A-
x. To enhance the covalently bonded sulfur content in the polymer matrix and thus improve the reversible capacity, Route B was applied as a secondary sulfurization treatment. Specifically, the optimal material from Route A, PoPDAS-A-300, was homogeneously mixed with elemental S at
z times its weight (
z = 0, 0.2, 0.5, 1.0). The sample with
z = 0 served as a control to evaluate the thermal stability of the precursor under further heating. The mixture was placed in a partially sealed vessel, and heated at
y °C (
y = 300, 350, 400) in a nitrogen atmosphere for 6 h. The post-synthesis treatment followed the same procedure as Route A, and the obtained products were designated as PoPDAS-B-
y-
z. To examine the feasibility of a one-step synthetic route yielding products similar to Series B, we also attempted Route C. This route was nearly identical to Route A but used a mixture of oPDAS and half its weight in elemental S (an optimal condition based on the results of Route B) as the precursor. The resulting materials were designated as PoPDAS-C-
x, where
x = 350 refers to heating at 350 °C for 12 h, and
x = 300/350 refers to stepwise heating at 300 °C for 6 h followed by 350 °C for another 6 h, which may be more suitable for polymerization and sulfurization, respectively. For simplicity, the common prefix “PoPDAS-“ in the above material names is omitted in many cases of the subsequent discussion.
The synthesis yields reflect the effects of polymerization and sulfurization, particularly within the same product series. To ensure a fair comparison across different series, the yield in
Table 1 is defined as the ratio of the product mass to the theoretical mass of PoPDA (where X = NH
2 in
Figure 1a) derived from the oPDAS monomer. For Series A-
x, the yields are 32%, 94%, and 86% for
x = 250, 300, and 350, respectively. These results indicate that a moderate reaction temperature of 300 °C is optimal; lower temperatures are insufficient to drive the oxidative polymerization, while higher temperatures may induce further pyrolysis of the nascent PoPDA. Subsequent electrochemical tests confirmed that A-300 exhibits the best performance among the three, and thus it was selected as the precursor for synthesizing Series B materials. To preliminarily examine the thermal stability of A-300 under further heating, it was pyrolyzed at 300, 350, and 400 °C. The product yields decreased from 94% for A-300 to 92%, 91%, and 76% for B-300-0, B-350-0, and B-400-0, respectively. Evidently, 300 °C and 350 °C are suitable for secondary sulfurization, whereas 400 °C is excessive and considerably degrades the original polymer matrix structure. For Series B-300-
z, as
z (the mass ratio of added elemental S to PoPDAS-A-300) increases from 0 to 0.2, 0.5, and 1.0, the yield gradually rises from 92% to 98%, 100%, and 105%. This verifies that at 300 °C, while a higher feed of elemental S enhances the extent of sulfurization, there is a diminishing return in its utilization. At an elevated temperature of 350 °C, the yields are notably higher compared to the analogues synthesized at 300 °C with the same
z value (i.e., 101%, 105%, and 138% for
z = 0.2, 0.5, and 1.0, respectively). This confirms that 350 °C is more effective for enhancing sulfurization efficiency, and the subsequent electrochemical tests demonstrated its slight superiority in improving electrochemical performance. For Series C, high yields of 145% and 152% were obtained for C-350 and C-300/350, respectively, indicating a high degree of sulfurization. However, distinct structural characterization results and significantly lower reversible capacities compared to those of Series A and B suggest a fundamentally different polymer matrix.
The fourteen synthesized PoPDAS samples listed in
Table 1 were characterized using FT-IR and Raman spectroscopy, with the resulting spectra presented in
Figure S1 and Figure S2, respectively. The FT-IR spectra show no significant variations among most samples, with the exception of the two Series C samples, which exhibit notable differences. For Raman spectra, variations across all samples are negligible. These results confirm that the majority of the samples share a qualitatively similar molecular skeleton composed of the same functional groups. It is suggested that different synthesis temperatures and feed ratios of elemental sulfur primarily influence the relative abundance and distribution of these groups, particularly within the same sample series. For brevity, one representative sample from each series—A-300, B-350-0.5, and C-300/350—was selected for a detailed discussion of the characteristic FT-IR and Raman peaks.
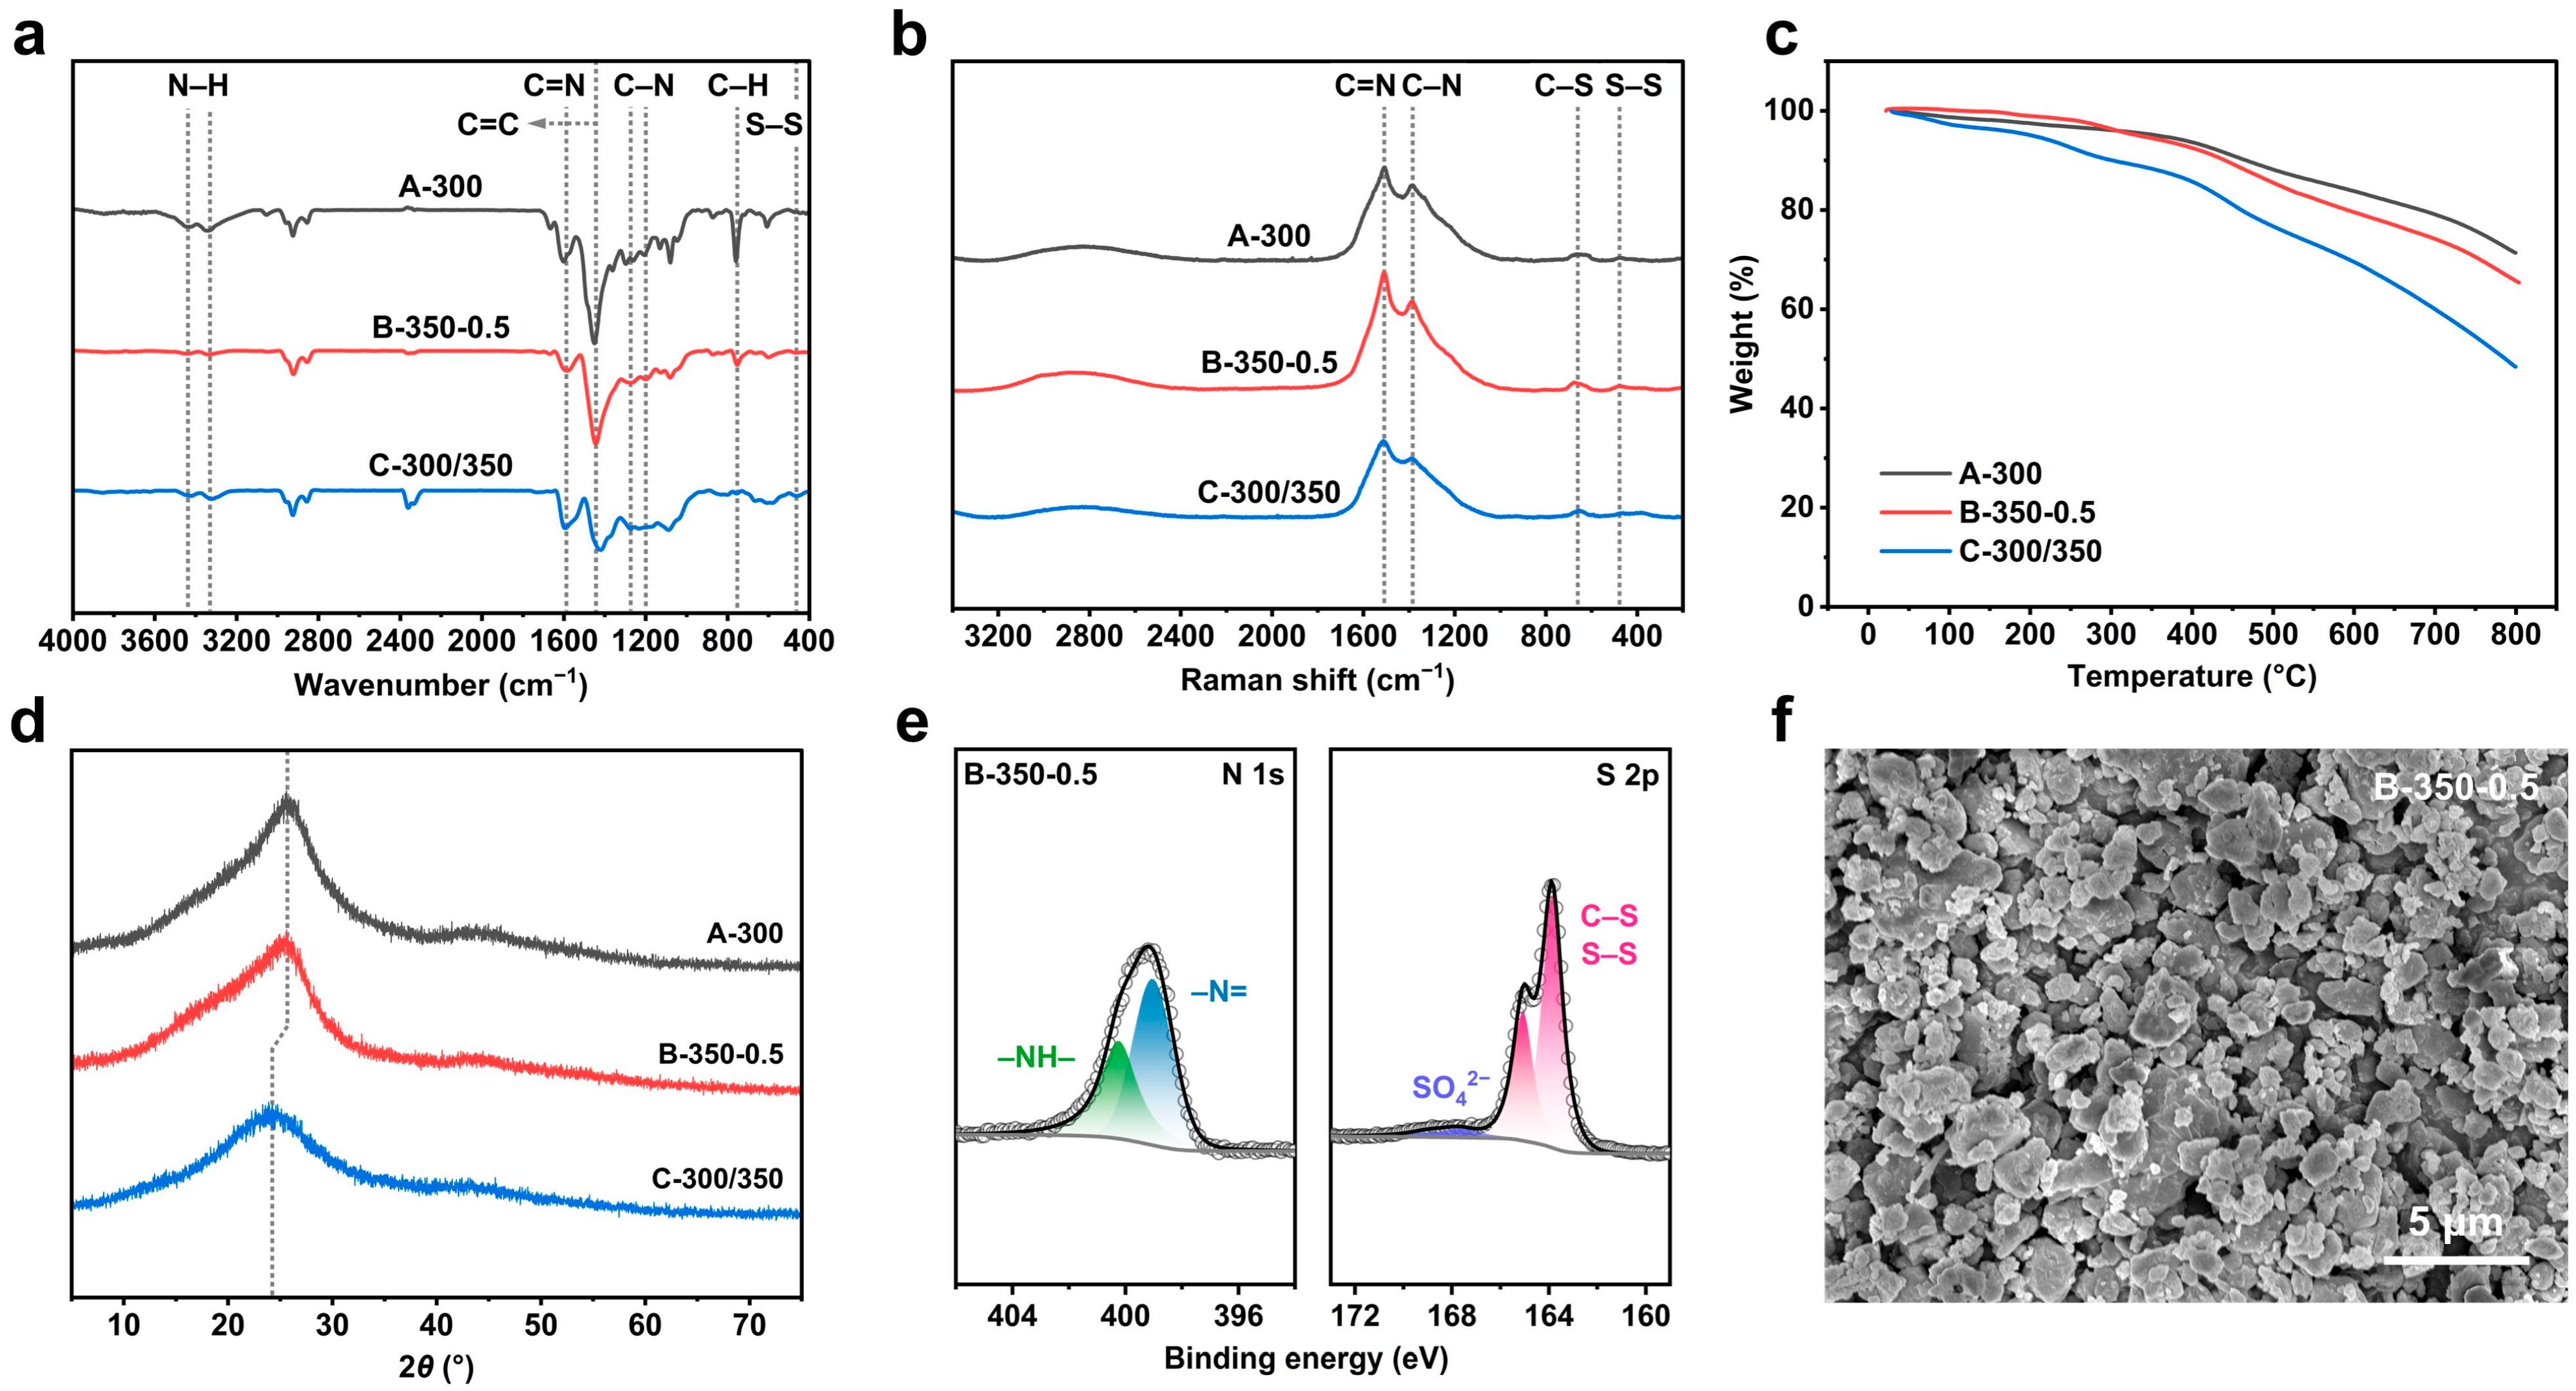
Figure 2a displays the FT-IR spectra of the three selected samples, with the corresponding characteristic peak assignments detailed in
Table S2. For samples A-300 and B-350-0.5, the weak doublet observed at ~3444 and ~3336 cm
−1 is attributed to N–H stretching vibrations, confirming the presence of secondary amine structures within the polymer chains. The medium peak at ~1595 cm
−1 and the strong peak at ~1448 cm
−1 are assigned to C=N stretching and C=C skeletal vibrations, respectively [
25]. These features provide evidence for the formation of phenazine moieties as repeating structural units and –NH– as linkages in the PoPDA polymer backbone. Due to the inherently low sensitivity of the S–S bond in FT-IR spectroscopy [
26], only a subtle peak at ~465 cm
−1 offers a clue regarding the polymer’s sulfurization. Furthermore, the peak at ~756 cm
−1, corresponding to the out-of-plane bending vibration of C–H bonds in the benzene ring, shows a significant reduction in intensity for B-350-0.5 compared to A-300. This confirms that hydrogen atoms on the benzene rings were substantially substituted by sulfur atoms during secondary sulfurization. In contrast to A-300 and B-350-0.5, the spectrum of C-300/350 exhibits more pronounced differences, including red-shifted N–H and C=C peaks (by 11–32 cm
−1), a diminished C–H peak, and distinct patterns in the fingerprint region. These observations indicate a distinctly different molecular skeleton and a higher degree of sulfurization, which likely stem from the interplay between concurrently occurring oxidative polymerization and sulfurization in Route C.
Figure 2b displays the Raman spectra of the three materials. Distinct characteristic peaks observed at ~1513 cm
−1 and ~1386 cm
−1 are attributed to the stretching vibrations of C=N and C–N bonds, respectively. These features corroborate the successful formation of the phenazine backbone. Furthermore, the presence of C–S and S–S bonds is verified by the signals appearing at ~666 cm
−1 and ~476 cm
−1, respectively [
26].
The thermal stabilities of the three samples were subsequently evaluated via TG under a nitrogen atmosphere (
Figure 2c). A-300 and B-350-0.5 exhibit negligible mass loss below 200 °C, consistent with the FT-IR results indicating the absence of adsorbed water. Significant decomposition begins above 300 °C, accompanied by a gradual weight loss, ultimately yielding char residues of 71.4% and 65.7% at 800 °C, respectively. In contrast, C-300/350 displays a similar TG curve trend but exhibits significantly lower weight retention throughout the heating process, with a residual mass of only 48.4% at 800 °C. The thermal stability of the three samples, as indicated by their weight retention, shows a negative correlation with their sulfur content, the values of which were obtained from elemental analysis and will be reported later.
The crystal structures of the three representative materials were further investigated by XRD, as shown in
Figure 2d. All samples exhibit only a broad, low-intensity peak, characteristic of a predominantly amorphous structure. However, C-300/350 displays a noticeable shift to a lower angle (2
θ = 24°) compared to A-300 and B-350-0.5 (2
θ = 26°). This shift suggests a distinct condensed-phase structure, likely arising from differences in the molecular architecture.
Compared to the qualitative characterization methods discussed above, elemental analysis (EA) provides a more powerful approach for the quantitative assessment of the chemical composition and structure of the synthesized products.
Table 1 summarizes the measured mass fractions of C, H, N, S, and O for all fourteen samples, where the O content was determined by difference. Given that the benzene ring is the most stable structural unit throughout the polymerization and sulfurization processes, we adopted it as a fundamental reference unit. Consequently, the molar ratios of H, N, S, and O atoms per benzene ring were calculated to simplify the analysis (
Table 1). First, the N/benzene ratio for all samples was found to be approximately 1.5, rather than the expected value of 2 based on the stoichiometry of the oPDAS monomer. This suggests that the nascent –NH
2 terminal groups on the phenazine repeating units greatly disappeared, likely through hydrolysis into –OH groups via high-temperature vapor or deamination leading to direct coupling between benzene rings under high-temperature, highly oxidative conditions. The presence of –OH groups is further inferred from the O/benzene ratios ranging from 0.2 to 0.5, particularly since FT-IR spectra exclude the existence of absorbed H
2O, which could otherwise account for the O content. Second, the S/benzene ratios exhibit a distinct trend across and within the different sample series. For Series A, the ratio is relatively low, at 0.40–0.52. Following secondary sulfurization, this value increases to 1.00–1.20 for Series B-300 and 1.04–1.68 for Series B-350. A comparison of Series B-300 and B-350 samples reveals that the S/benzene ratios increase with both the amount of feed elemental S and the reaction temperature, a finding consistent with the trends observed in the aforementioned product yields. For Series C, the S/benzene ratio is 1.44–1.51, which is significantly higher than that of the Series B analogues prepared with the same amount of feed elemental S (B-
y-0.5). Furthermore, the H/benzene and S/benzene ratios generally exhibit a trade-off relationship, although the larger error margin associated with measured H contents in EA may affect this interpretation. This observation aligns well with the substitution of S for H atoms during the sulfurization reaction.
Complementing the aforementioned analyses, additional XPS characterization was conducted for the optimal sample, B-350-0.5 (
Figure 2e). The N 1s signal can be deconvoluted into two distinct components: –NH– and –N= species, centered at 400.3 and 399.0 eV, respectively. The S 2p spectrum is primarily dominated by C–S and S–S bonds, with the characteristic spin–orbit doublet peaks (2p
1/2 and 2p
3/2) located at 163.9 and 165.1 eV, respectively. A minor signal observed at approximately 168 eV is attributed to trace residual sulfate (SO
42−) anions, likely acting as counterions for protonated amine terminals (–NH
3+). These XPS findings corroborate the structural assignments derived from FT-IR, Raman, and elemental analysis.
Furthermore, SEM was utilized to examine the materials’ microstructure. B-350-0.5 (
Figure 2f) consists of irregularly shaped particles with primary sizes ranging from 0.5 to 2 μm, a morphology well-suited for achieving homogeneous mixing with conductive carbon in the electrode. By contrast, A-300 and C-300/350 (
Figure S3) display markedly larger particle sizes (reaching ~5 μm and ~20 μm, respectively) along with a broader and less uniform size distribution.
Based on the aforementioned analysis, particularly the EA results, we propose plausible molecular structures for two representative samples, A-300 and its secondary sulfurization product B-350-0.5, as illustrated in
Figure 1c. Both materials share an identical polymeric backbone comprising phenazine repeating units, amine (–NH–) linkages, and hydroxy (–OH) substituents. The primary structural distinction resides in the sulfur substitution sites and the length of the polysulfide (–S
n–) chains. Derived from the S/benzene molar ratios of 0.48 and 1.13, approximately 4 and 9 S atoms are deduced for every 4 phenazine units (equivalent to 8 benzene rings) in A-300 and B-350-0.5, respectively. These can be statistically assigned to two –S
2– and three –S
3– linkages, as depicted in
Figure 1c. Considering the proposed molecular architectures and assuming a two-electron (2e) transfer capacity for each phenazine unit and S–S bond, the theoretical capacities of A-300 and B-350-0.5 are calculated to be 347 and 494 mAh g
−1, corresponding to 12e and 20e redox reactions, respectively. This calculation underscores the necessity of secondary sulfurization for enhancing the reversible capacity of the PoPDAS materials.
3.2. Electrochemical Performance
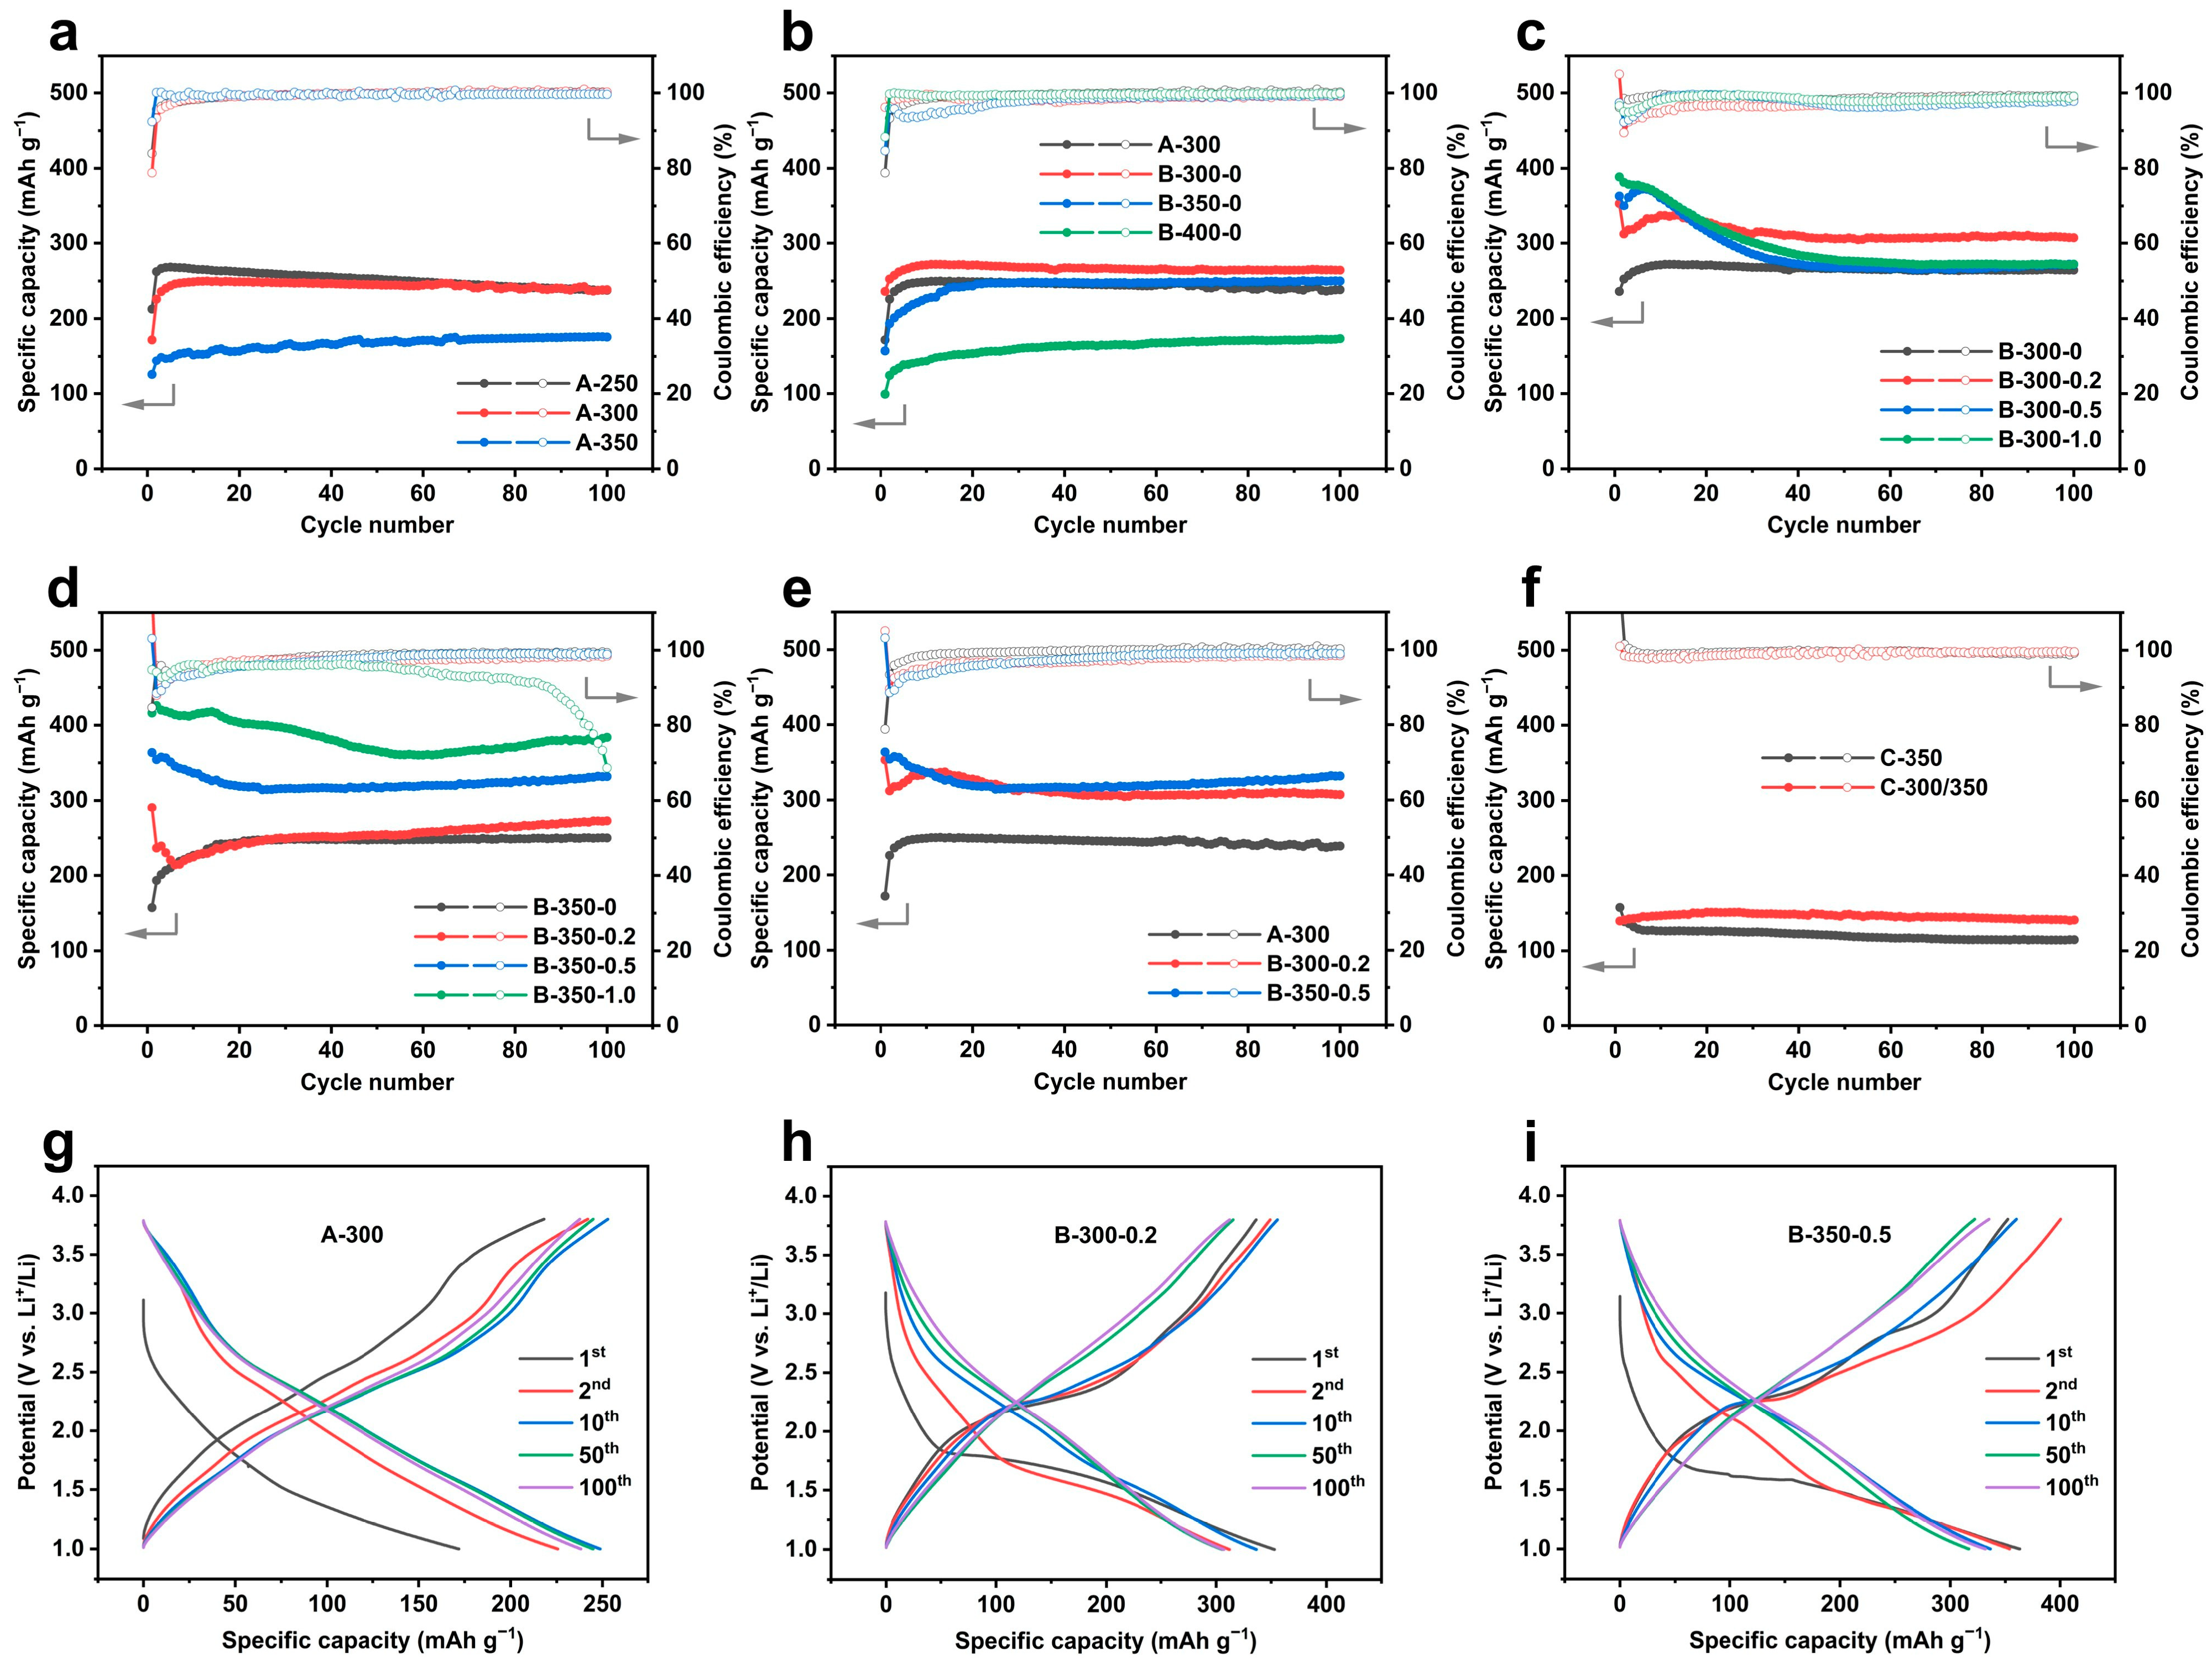
To evaluate the electrochemical performance of the fourteen PoPDAS samples as cathode materials in rechargeable batteries, we employed an electrode composition of AM/KB/PVA = 6:3:1 and utilized 1 M LiTFSI/G2 as the electrolyte. All electrochemical tests were conducted within a voltage window of 1.0–3.8 V. Initially, galvanostatic discharge–charge profiles for all samples were recorded at a current rate of 100 mA g
−1; the results are categorized into six groups (
Figure 3a–f) to facilitate comparative discussion. In the following analysis, reversible capacity is defined as the maximum discharge capacity achieved during cycling, excluding the initial cycle, which may involve irreversible discharge capacity from reductive decomposition of the electrolyte. Additionally, capacity retention is defined as the ratio of the discharge capacity at a specified cycle number to the reversible capacity rather than that of the initial cycle. Notably, minor periodic oscillations are observed in the capacity curves of some samples, which can be attributed to ambient temperature fluctuations during cycling; however, these do not affect the overall long-term capacity retention trend.
Figure 3a presents the electrochemical performance of the three Series A samples. Following a few initial activation cycles, A-250 and A-300 reach maximum discharge capacities of 268 and 250 mAh g
−1, respectively. After 100 cycles, both samples retain nearly identical capacities, 237 and 238 mAh g
−1, corresponding to capacity retentions of 88% and 95%, respectively. Coupled with their markedly different synthesis yields (32% for A-250 vs. 94% for A-300), this suggests that, despite their similar molecular structures, A-300 likely possesses a higher degree of polymerization, which contributes to its enhanced cycling stability. In contrast, A-350 delivers a significantly lower maximum discharge capacity of only 176 mAh g
−1, even though it exhibits excellent cycling stability. This implies that an excessively high reaction temperature may promote further pyrolysis of the polymeric framework, thereby compromising redox activity. Based on this analysis, A-300 was identified as the optimal material in Series A and was subsequently used both as the precursor for synthesizing Series B materials and as the benchmark for evaluating the electrochemical performance of other samples.
To introduce additional S–S bonds and thereby enhance reversible capacity, A-300 was further sulfurized to produce the Series B materials. As a preliminary step to assess the thermal stability of A-300 upon further heating and to identify an appropriate sulfurization temperature, A-300 was heated at different temperatures in the absence of elemental S, yielding the Series B-
y-0 samples (where
y = 300, 350, 400). Their electrochemical performance is shown in
Figure 3b and compared with that of the A-300 precursor. Overall, apart from the initial activation cycles, B-300-0 and B-350-0 exhibit reversible capacities and cycling stability comparable to those of A-300, with differences within 30 mAh g
−1. In contrast, B-400-0 delivers a significantly lower reversible capacity of 173 mAh g
−1, indicating substantial degradation of the polymer framework. This observation is consistent with its markedly reduced synthesis yield and lower S/benzene ratio relative to B-300-0 and B-350-0, as summarized in
Table 1.
Subsequently, 300 °C and 350 °C were selected as the reaction temperatures for the secondary sulfurization of A-300, yielding the Series B-300-
z and B-350-
z materials, whose cycling performance is presented in
Figure 3c,d. Within each series, increasing the amount of elemental S fed (denoted by
z) into the reaction generally enhances the reversible capacity as expected. The highest capacities, 389 and 426 mAh g
−1, are achieved by B-300-1.0 and B-350-1.0, respectively. However, higher reversible capacity comes at the expense of cycling stability and Coulombic efficiency. Notably, B-350-1.0 exhibits a rapid decay in Coulombic efficiency before reaching 100 cycles. This underscores the need to strike a balance between capacity and stability by carefully tuning the S content in the polymer structure. This trade-off is chemically reasonable: a higher S content increases the average chain length (
n > 2) in the –S
n– moieties, thereby boosting discharge capacity. However, it also promotes the formation of dissociative sulfur species (e.g., Li
2S) during discharge. While the polymer matrix can confine these species to some extent, excessive amounts may overwhelmits encapsulation capacity, leading to active material loss and the polysulfide shuttle effect—ultimately resulting in capacity fading and reduced Coulombic efficiency, respectively. Among the two series, B-300-0.2 and B-350-0.5 represent optimal compromises, delivering reversible capacities of 337 and 358 mAh g
−1 and capacity retentions of 91% and 93% after 100 cycles, respectively. Despite slightly reduced cycling stability and Coulombic efficiency compared to A-300, both exhibit significantly enhanced reversible capacities, as clearly illustrated in
Figure 3e. These results suggest that a moderate S content of approximately 25%, corresponding to a S/benzene ratio of about 1.1 (
Table 1), represents an optimal balance for regulating the structure of PoPDAS.
The cycling performance of the two Series C samples, C-350 and C-300/350, is presented in
Figure 3f (with corresponding discharge–charge voltage profiles shown in
Figure S4). Despite exhibiting reasonable cycling stability, both samples deliver significantly lower reversible capacities compared to the Series A and B materials, 139 and 151 mAh g
−1, respectively. This reduced capacity is unexpected given their notably higher S/benzene ratios (1.44 and 1.51), which would typically suggest enhanced theoretical capacity. The discrepancy is likely attributable to differences in their polymer backbone structure, which appears less defined and possibly redox-inactive, thereby contributing negligible electrochemical capacity. These results indicate that the current one-pot synthesis strategy for preparing high-sulfur-content PoPDAS has not yet been successful. Nevertheless, there remains considerable potential for improvement through further optimization of synthetic conditions, particularly once a clearer understanding of the underlying synthetic reaction mechanism is established (
Figure 1a).
Figure 3g–i present the discharge–charge voltage profiles over cycling for three representative materials: A-300, B-300-0.2, and B-350-0.5. All exhibit an initial activation process over the first few cycles; therefore, the 10th cycle is selected as representative for analyzing their intrinsic electrochemical behavior. Generally, aside from differences in capacity, their representative discharge–charge curves show no significant distinctions: no distinct voltage plateaus are observed, and the profiles exhibit smooth, sloping curves across the entire voltage window of 1.0–3.8 V, particularly within the 1.0–3.0 V range. The average discharge voltages (at the 10th cycle) for A-300, B-300-0.2, and B-350-0.5 are 2.05, 1.92, and 1.99 V, respectively, indicating only minor variations among the three materials. Compared with A-300, B-300-0.2 and B-350-0.5 exhibit relatively larger overpotential during the first few cycles. This is likely attributed to the higher degree of sulfurization, which enhances cross-linking between polymer backbones and renders the material less accessible to electrolyte infiltration initially. After several discharge–charge cycles, however, the active material gradually swells as it becomes more thoroughly wetted by the electrolyte, eventually reaching a relatively stable state that facilitates reversible redox reactions.
When accounting for variations in testing conditions, the reversible capacity, voltage profiles, and cycling stability of A-300 agree well with those of our previously synthesized PoPDA prepared via solution polymerization. This consistency in electrochemical performance further supports the successful construction of the PoPDA framework using the solid-phase synthesis method. The two –S
2– moieties present in the structure of A-300 (
Figure 1c) do not appear to enhance reversible capacity, likely due to a trade-off between the increased number of redox-active electrons and the higher molecular weight of the repeating unit. In contrast, the structure of B-350-0.5 featuring three –S
3– moieties (
Figure 1c) demonstrates its superiority, achieving higher reversible capacity while maintaining relatively stable structural integrity during discharge–charge cycling. It should be noted that the reversible capacities of both A-300 and B-350-0.5 (250 and 358 mAh g
−1, respectively) remain significantly below their theoretical values (347 and 494 mAh g
−1). This gap becomes even more pronounced when the contribution from KB carbon is subtracted (based on a KB-only electrode delivering ~110 mAh g
−1 as shown in
Figure S5 and a KB-to-AM mass ratio of 1:2 in the composite electrode, the KB contribution is estimated at ~55 mAh g
−1). Beyond potential discrepancies between the idealized and actual molecular structures, a key limiting factor is the electrochemical stability window of the electrolyte, which restricts full utilization of the theoretical capacity. This is reflected in the continuously sloping voltage profile observed above 1.0 V, suggesting incomplete redox conversion. While integrating multiple electroactive C=N and S–S into a conjugated backbone substantially increases theoretical capacity, the electrostatic repulsion from already injected electrons may significantly lower the redox potential required for complete reduction of the molecule.
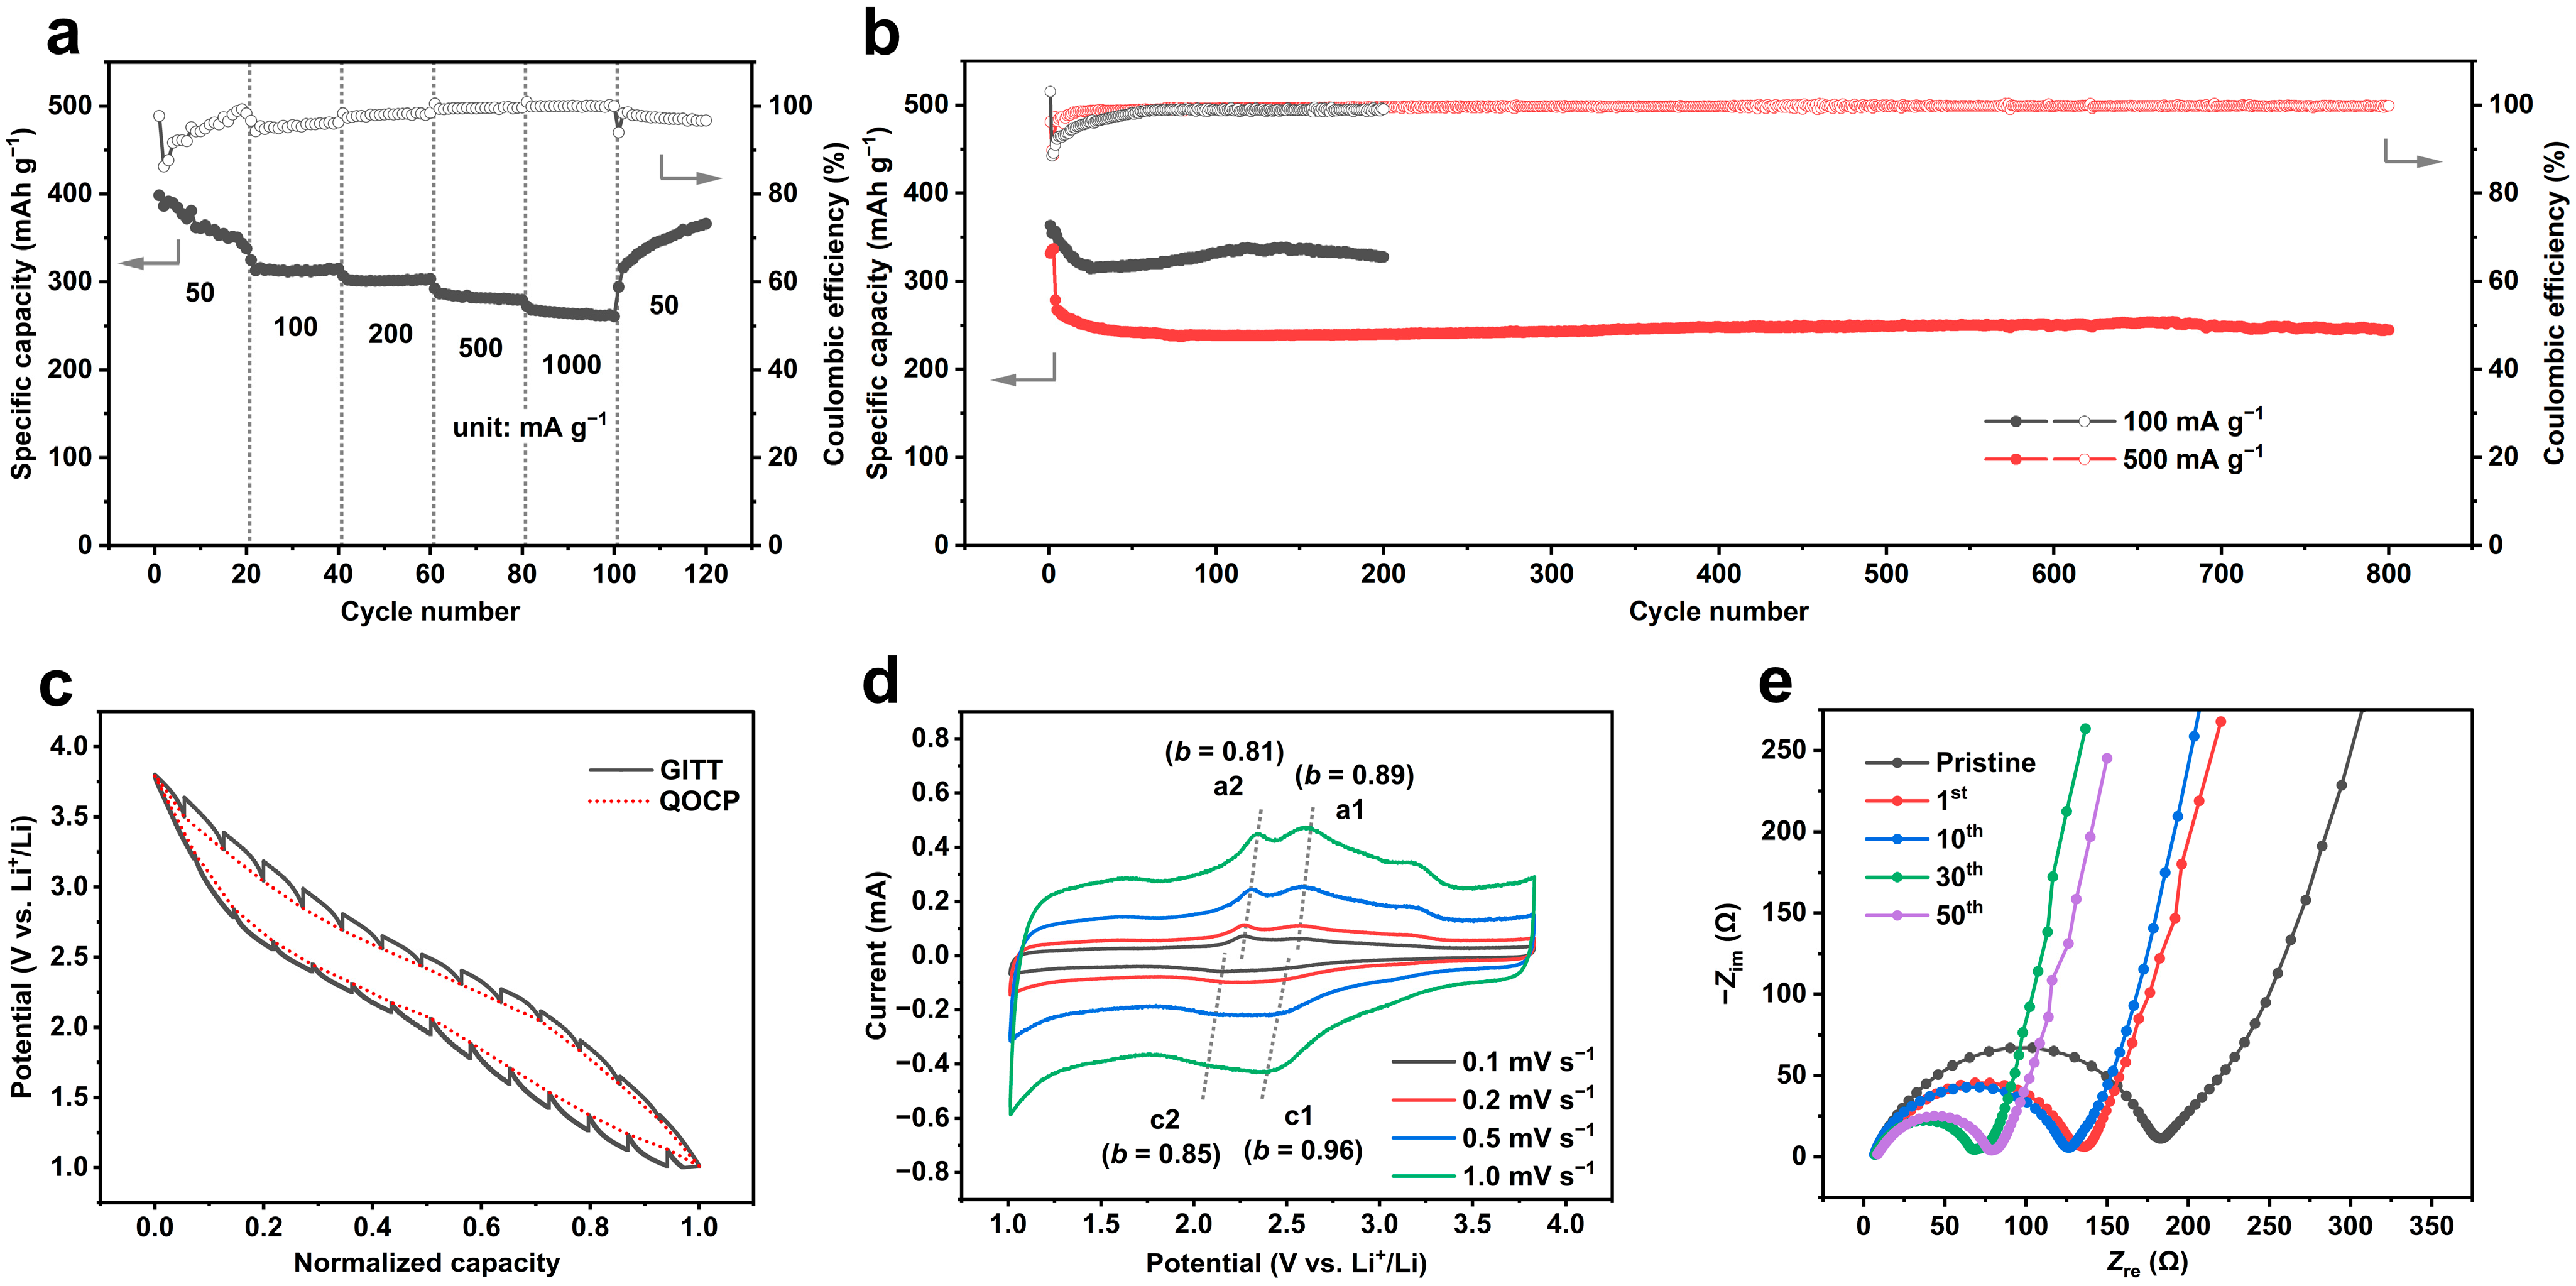
As the top-performing material among the fourteen samples, B-350-0.5 was selected for further electrochemical evaluation, as summarized in
Figure 4.
Figure 4a presents its rate capability, measured under a stepwise current-rate-increase protocol. Relative to the reversible capacity at 50 mA g
−1, B-350-0.5 retains 81%, 78%, 74%, and 69% at current rates of 100, 200, 500, and 1000 mA g
−1, respectively, demonstrating excellent rate performance. Furthermore,
Figure 4b illustrates the long-term cycling stability of B-350-0.5. At a current rate of 100 mA g
−1, it delivers a discharge capacity of 327 mAh g
−1 after 200 cycles, corresponding to a capacity retention of 91%. At an elevated current rate of 500 mA g
−1 (preceded by three activation cycles at 100 mA g
−1), the material maintains a capacity of 245 mAh g
−1 after 800 cycles, representing 88% retention relative to its reversible capacity of 279 mAh g
−1 (measured at the 4th cycle). Together, these results confirm that B-350-0.5 exhibits among the best cycling stability reported to date for OCMs with comparable reversible capacities.
Figure 4c presents the typical GITT curve and the corresponding quasi-open-circuit potential (QOCP) profile of B-350-0.5. The voltage hysteresis between discharge and charge is approximately 0.5 V, which primarily arises from the equilibrium potential gap (~0.35 V) and, to a lesser extent, from kinetic overpotentials during discharge and charge (~0.07 V each). This notable disparity suggests that the electrochemical reduction and reoxidation of PoPDAS proceed via somewhat different reaction pathways. To further probe the reaction kinetics, CV measurements were carried out on B-350-0.5 (
Figure 4d). Despite significant peak overlap, two pairs of redox peaks—centered at approximately 2.6/2.5 V and 2.3/2.2 V at slow scan rates—remain discernible in the CV curves. A linear fit of the peak currents (
ip) vs. scan rates (
v) (
Figure S6) yields
b-values of 0.96, 0.85, 0.89, and 0.81 for redox peaks c1, c2, a1, and a2, respectively. These
b-values close to 1 indicate that the electrochemical response of the B-350-0.5 electrode is predominantly pseudocapacitive in nature, which supports its excellent rate capability observed in
Figure 4a.
To investigate the evolution of the electrode state during cycling, EIS measurements were performed on cells employing the B-350-0.5 cathode in both the pristine and charged states. The corresponding Nyquist plots are shown in
Figure 4e, while the equivalent circuit model and detailed fitting parameters used for quantitative analysis of the impedance components are summarized in
Table S3. The pristine electrode exhibits a charge transfer resistance (
RCT) of 183 Ω, which decreases significantly to 136 Ω after the first cycle and further gradually declines to 68 Ω by the 30th cycle. This trend correlates well with the substantial reduction in overpotential observed after the initial cycle, as reflected in the discharge–charge voltage profiles (
Figure 3i), where the overpotential decreases progressively in subsequent cycles. The continuous decline in
RCT is attributed to enhanced electrolyte infiltration into the polymeric active material, facilitated by the swelling of the polymer during discharge. This swelling is driven by Li
+ insertion and electrostatic repulsion among negatively charged moieties. By the 50th cycle,
RCT increases only slightly to 78 Ω, indicating that the electrode structure reaches a relatively stable state after an initial self-accommodation process, thereby enabling long-term cycling stability (
Figure 4b).
3.3. Electrochemical Redox Mechanism
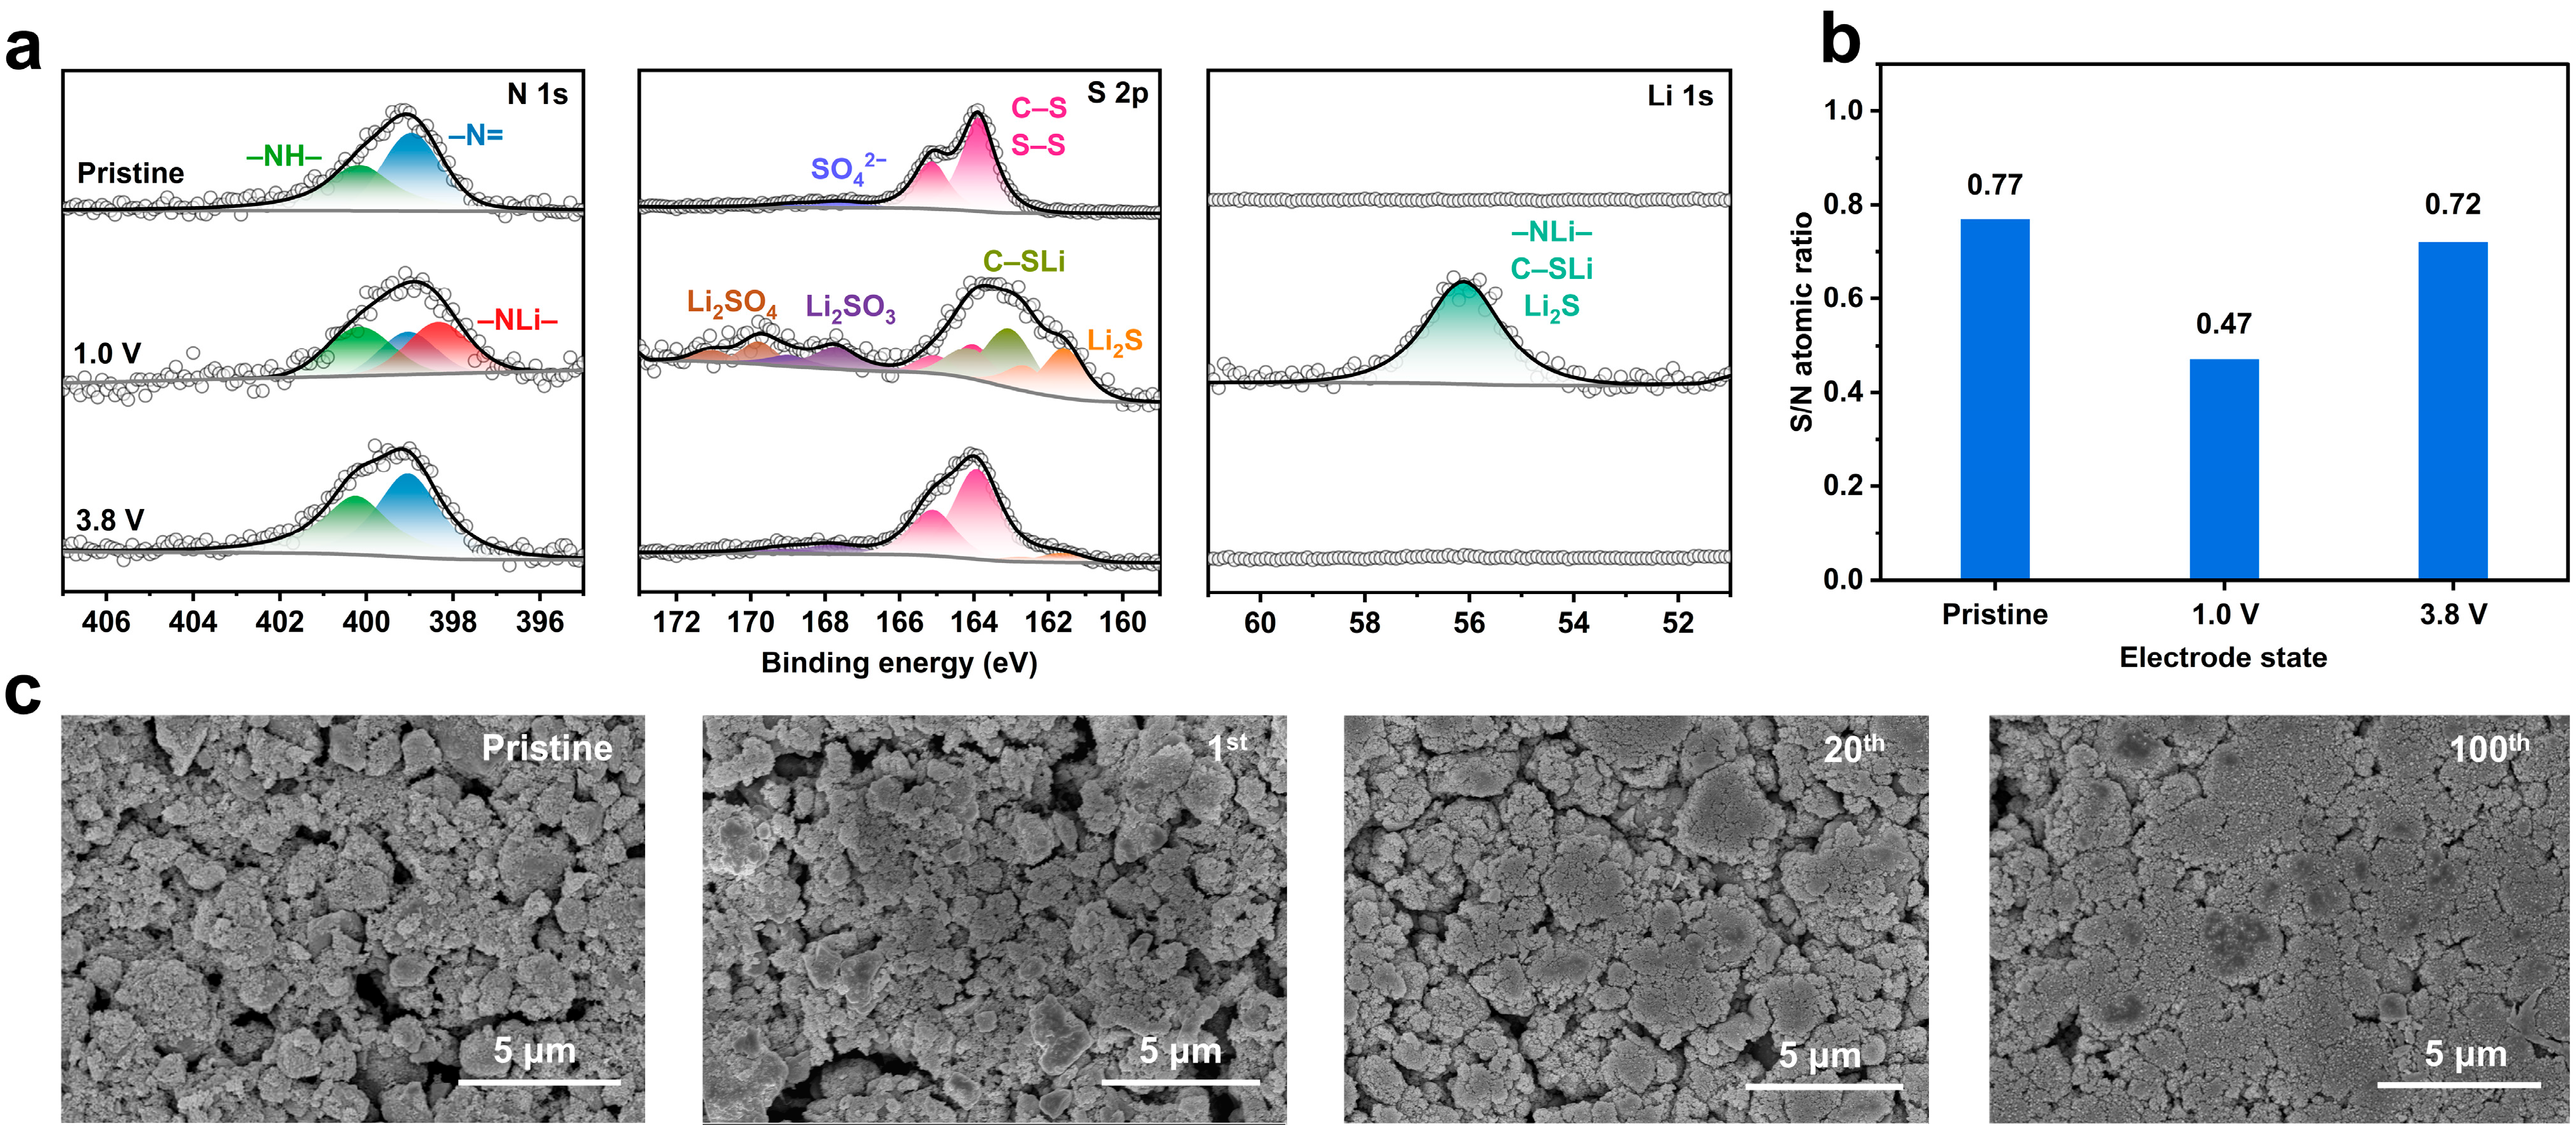
To elucidate the electrochemical redox mechanism of B-350-0.5, as a representative sample of PoPDAS, various ex situ characterization techniques, including XPS, EA, and SEM, were performed on electrodes harvested at distinct states: pristine, discharged to 1.0 V, and recharged to 3.8 V. As shown in
Figure 5a, the XPS N 1s spectra reveal that upon discharge, the peak intensity corresponding to the imine group (–N=) at 399.0 eV decreases markedly, accompanied by the emergence of a new component at 398.3 eV, which is assigned to the –NLi– moiety. In the S 2p spectra, the signals associated with C–S/S–S bonds (163.9 eV for S 2p
3/2; binding energies hereinafter refer to S 2p
3/2 unless otherwise noted) observed in the pristine electrode shift predominantly to lower binding energies after discharge, giving rise to peaks at 163.1 eV assigned to C–SLi and 161.6 eV assigned to Li
2S. Additionally, minor features appear at higher binding energies, 169.7 eV and 167.7 eV, which can be reasonably attributed to Li
2SO
4 and Li
2SO
3, respectively, as decomposition products of the LiTFSI [LiN(SO
2CF
3)
2]-based electrolyte [
27,
28]. In the N 1s and S 2p spectra of the discharged electrode, the residual signals corresponding to the –N= and C–S/S–S moieties confirm the incomplete reduction of the redox-active groups, supporting our earlier explanation for the discrepancy between the practical and theoretical capacities. In the Li 1s spectra, a pronounced peak emerges at 56.1 eV after discharge, consistent with the formation of –NLi–, C–SLi, and Li
2S species. However, due to overlapping binding energies, these contributions cannot be deconvoluted with high precision. Following the subsequent charge to 3.8 V, the N 1s, S 2p, and Li 1s spectral features almost fully revert to those of the pristine state, demonstrating excellent redox reversibility. Nevertheless, a residual trace of Li
2S remains detectable in the S 2p spectrum, suggesting that a small fraction of the discharged Li
2S product fails to be re-oxidized back to –S
n– moieties. This incomplete recovery is likely attributable to the poor electronic and ionic conductivities of Li
2S. Such irreversible accumulation of Li
2S is probably responsible for the slight capacity fading observed during the initial cycles of Series B materials (
Figure 3c,d). Based on the above analysis, we can draw a clear conclusion: both the C=N bonds in the phenazine units of the polymer backbone and the S–S bonds in the side-chain –S
n– linkages contribute to the reversible capacity and exhibit high reversibility during the discharge–charge process.
To gain a more quantitative understanding of the reaction mechanism, particularly the evolution of sulfur species, we performed EA on electrodes at the three different states. In contrast to the ex situ XPS protocol described above, the discharged and recharged electrodes were thoroughly rinsed with water to completely remove Li
2S and other potentially soluble sulfur species. This washing protocol ensures that only sulfur atoms covalently bound to the polymer backbone remain in the electrode (although C–SLi moieties may undergo hydrolysis to form C–SH), while dissociative or non-covalently bound sulfur species are effectively eliminated. Consequently, the sulfur content measured by EA reflects exclusively the fraction of fixed (i.e., backbone-integrated) sulfur, and the fraction of dissociative sulfur can be derived by a difference method. Since N originates solely from the PoPDAS active material and its total elemental content remains invariant during the discharge–charge process, the N content serves as a reliable internal reference. Thus, the S/N atomic ratio can be used as a quantitative indicator of the relative change in covalently bound sulfur during electrochemical cycling. The CHNS-mode EA results for the pristine, discharged, and recharged electrodes are summarized in
Table S4 (for the pristine state, the B-350-0.5 powder data from
Table 1 were used directly, as the S/N atomic ratio remains unchanged upon electrode fabrication). From these data, the corresponding S/N atomic ratios were calculated and presented in
Figure 5b: 0.77 for the pristine electrode, decreasing to 0.47 after discharge, and largely restored to 0.72 upon recharge. Based on these values, we estimate the atomic ratio of dissociative sulfur to fixed sulfur in the discharged state to be approximately 0.39. This value is in reasonable agreement with the theoretical ratio of 0.33 predicted by our proposed molecular structure for B-350-0.5 (
Figure 1c). The incomplete recovery of the S/N ratio after charging is consistent with the XPS results, which also indicate residual Li
2S remaining in the electrode (
Figure 5a).
To investigate the morphological evolution of the PoPDAS electrodes during discharge–charge cycling, SEM images of electrodes at various cycle numbers were recorded (
Figure 5c). The pristine electrode exhibits a loosely agglomerated morphology. Throughout cycling, the electrode maintains good structural integrity, with no obvious voids or cracks—features that would typically indicate active material dissolution. This observation underscores the effective confinement of sulfur species by the polymer matrix. Such morphological stability is a key factor contributing to the electrode’s excellent long-term cycling performance (
Figure 4b).