


Abstract
As the global automotive industry is transitioning toward sustainable development, new energy vehicles (NEVs) have experienced rapid global growth due to their environmental friendliness and high efficiency. Global sales of NEVs are projected to reach 50 million units by 2030. Nevertheless, safety incidents caused by impacts on traction batteries remain a major factor restricting the development of NEVs. Prismatic batteries, which account for over 90% of the traction battery market owing to their high energy density and structural robustness, nevertheless continue to face significant safety challenges under mechanical loading conditions. Typical failure modes involve structural damage induced by external compressive forces during severe vehicular collisions, which can subsequently result in the tearing of internal electrode layers and rupture of the separator, thereby initiating internal short circuits and leading to severe incidents. Accordingly, this research focuses on the mechanism of structural damage transmission for prismatic lithium-ion batteries under compression conditions. By integrating a refined mechanical model, it further elucidates the structural failure mechanisms and conducts a microscopic analysis of the damaged battery structure to investigate the effects of varying damage levels on battery safety performance, providing significant guidance for the safety and reliability of new energy vehicles.
1. Introduction
The global automotive industry is transitioning toward sustainable development, and new energy vehicles (NEVs), with the advantages of environmental friendliness and high efficiency, have experienced rapid global growth. The rapid expansion of the NEV industry not only reduces global dependence on conventional fossil fuels and lowers carbon emissions, but also accelerates technological advancement and innovation within the automotive sector [1,2].
As the core component of NEVs, the traction battery plays a critical role in determining the overall vehicle performance and ensuring the safety of users’ lives and property, which is the main energy storage component of the vehicle [3]. In recent years, accidents caused by battery safety issues in new energy vehicles have occurred frequently, such as fires and explosions. These incidents have not only resulted in significant losses for consumers but have also negatively affected the healthy development of the new energy vehicle industry [4]. Accordingly, ensuring the safety performance of traction batteries has become one of the key challenges in the development of new energy vehicles [5]. Prismatic batteries, due to the high energy density and structural stability, account for more than 90% of the traction battery market. Nevertheless, the safety risks under mechanical loads remain to be resolved. Typical failure modes include structural damage caused by external compressive forces during severe collisions of new energy vehicles [6], leading to tearing of internal electrode plates and rupture of separators, triggering internal short circuits and resulting in serious safety accidents.
However, current standards do not specify safety thresholds under dynamic loading conditions. Mechanical abuse can easily cause irreversible damage to batteries, triggering thermal runaway [7]. Li investigated the mechanical–electrochemical coupling behavior of a multifunctional composite lithium-ion battery integrated sandwich composite structure under low-velocity impact loading [8], and found that under high-velocity impact energy, the degradation rate accelerates, and damage and densification of the active materials and separator lead to a sudden loss of capacity and performance degradation. Chai employed finite element simulation to establish a low-speed compression scenario and developed simplified mechanical, electrical, and thermal models to quantitatively analyze the effects of different states of charge (SOC) and punch sizes on battery safety [9]. Wang investigated the mechanical–electrical–thermal properties of pouch cells through indentation testing and found that increasing the loading rate reduces the duration of internal short circuits [10]. D. Song developed a homogenized finite element model for prismatic cells based on empirical data to analyze the dynamic mechanical behavior under complex loading conditions [11]. Juner Zhu established a refined model for cylindrical cells, through precise mechanical analysis [12], and elucidated the causes of short circuits during axial loading. Nevertheless, existing studies have rarely addressed the coupling mechanism among electrochemical reactions, structural damage, and thermal runaway in prismatic lithium-ion cells under different extrusion-induced damage processes. The relationship between casing rupture fracture of the internal core materials during structural damage has not been clearly elucidated. Due to the high complexity of modeling, current research has mainly focused on localized refined modeling. Existing studies have primarily concentrated on localized refined simulations of pouch cells or prismatic lithium-ion cells with relatively thin casings. There is a lack of refined mechanical model studies for large-capacity prismatic cells used in vehicles, as well as a lack of microscopic safety performance analyses of the same cell under different degrees of mechanically induced damage [13,14].
This study systematically investigates the microscopic analysis of batteries with varying damage depths, further elucidating the transmission mechanisms following structural damage, which focuses on simulating the mechanical damage of the battery in different degrees through extrusion damage. The battery with different degrees of mechanical damage is analyzed by means of capacity difference before and after damage, disassembly analysis and microscopic measurement, so as to further reveal a series of safety change characteristics of the battery after structural damage. A refined mechanical model of vehicle-grade prismatic lithium-ion batteries is established to analyze the coupled responses of mechanical, electrical, and thermal multiple physical parameters. The aim is to comprehensively and deeply reveal the mechanisms and influencing patterns of mechanical compression on batteries, thereby providing data support for defining the safety boundaries of batteries under mechanical compression conditions.
2. Experimental
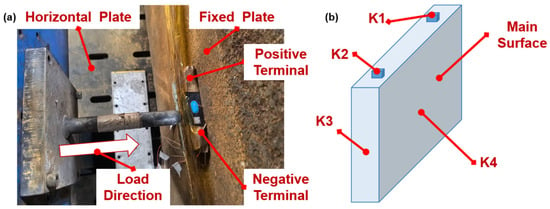
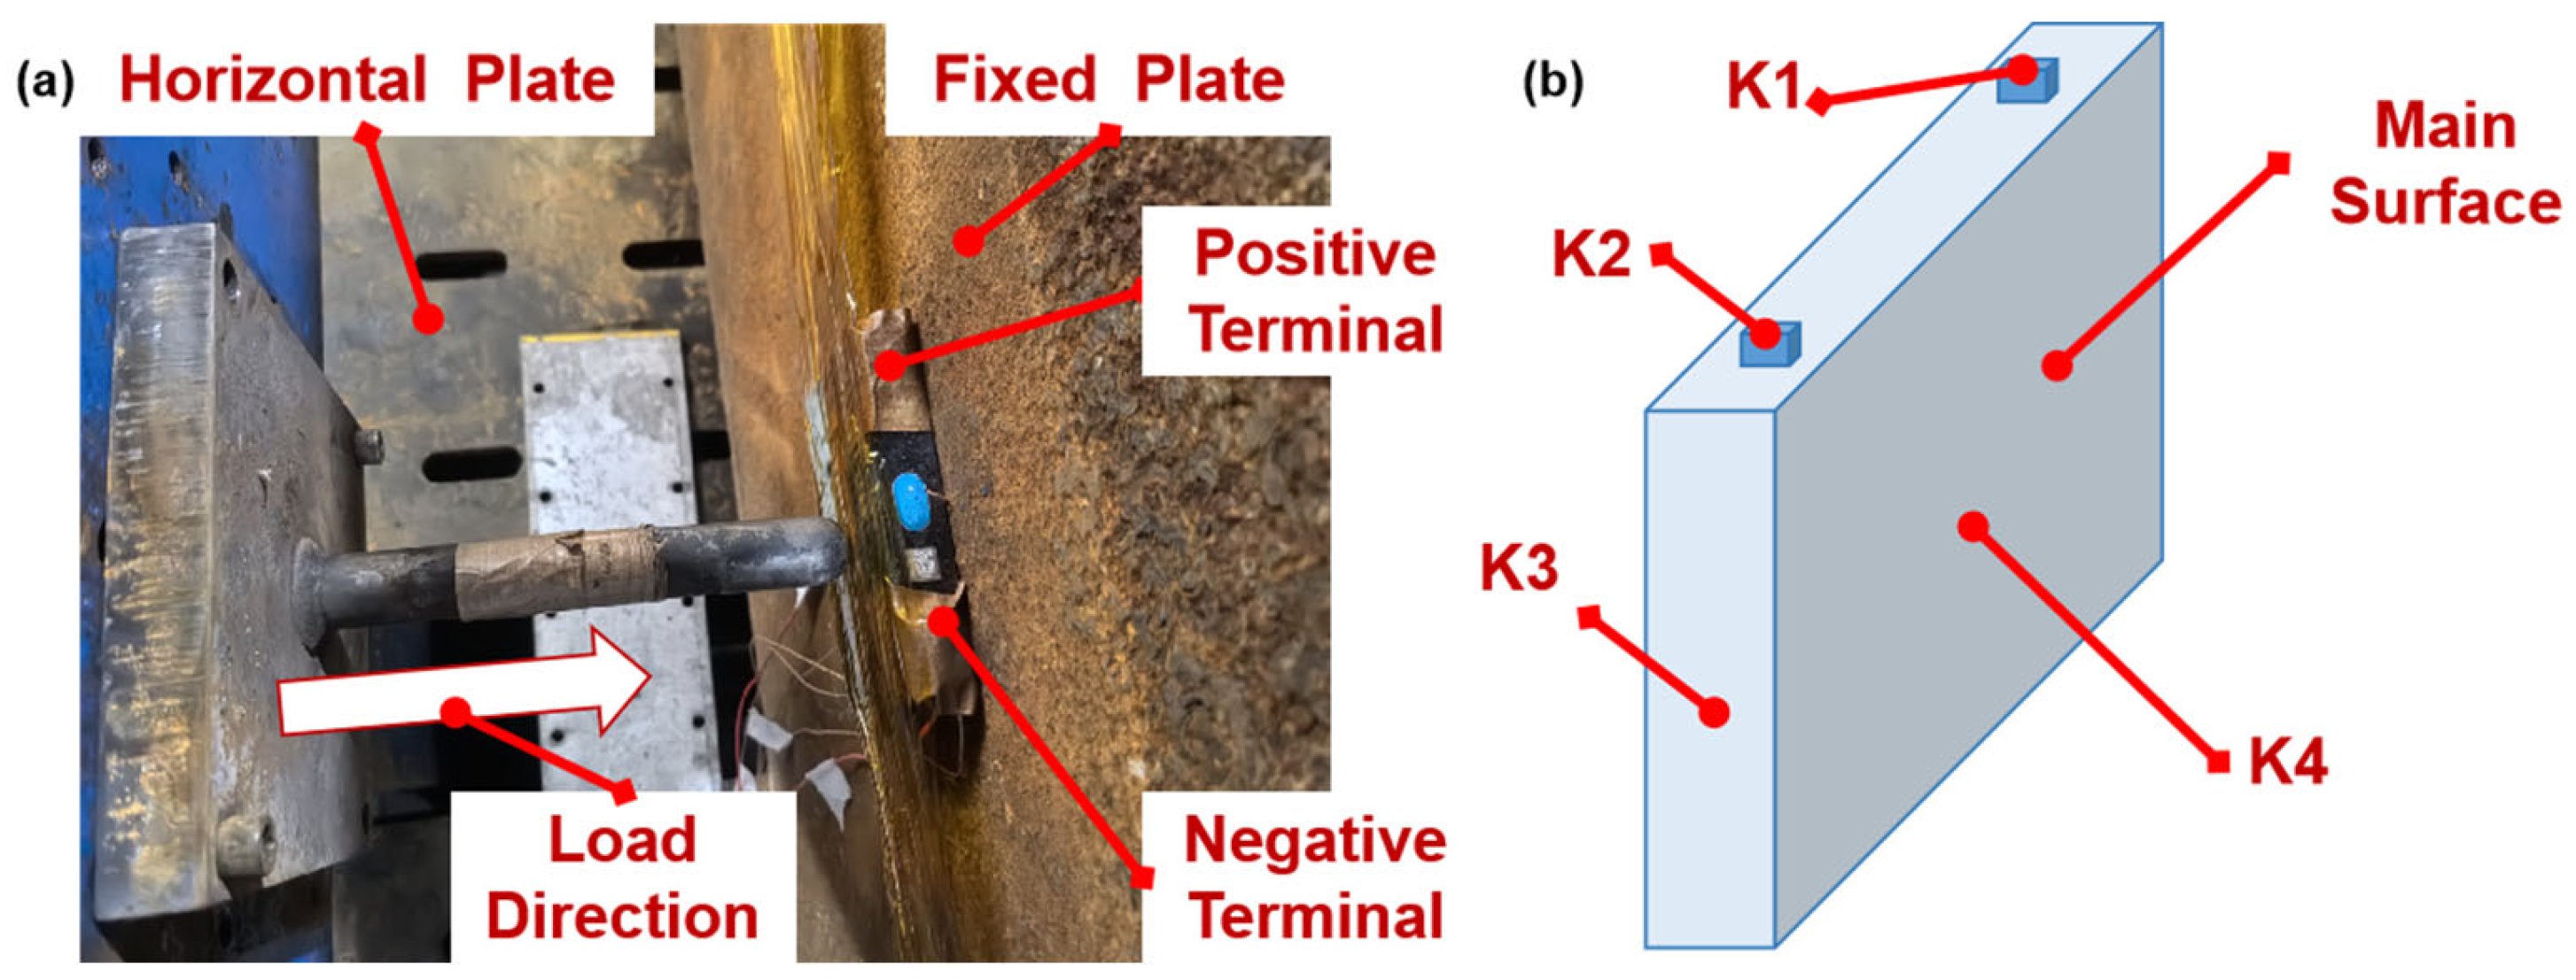
In this study, a widely used prismatic lithium-ion battery with high energy density was selected as the experimental sample. The nominal capacity of the experimental battery was 32 Ah, the nominal voltage was 3.65 V, the LFP cell product specifications model is LF32 with the cut-off voltage of charge and discharge 3.7~2.5 V, and the battery dimensions (length × width × height) were 148 mm × 26 mm × 92 mm. The setup of the lithium-ion battery crush damage simulation platform is presented in Figure 1, which consists of a crush stage, an experimental battery, and force, temperature, and voltage sensors, the equipment is manufactured by the China Automotive Technology Research Center in Tianjin, China.
Figure 1.
Lithium-ion battery extrusion damage simulation platform. (a) Schematic diagram of extrusion platform; (b) schematic diagram of sensor pasting position.
Based on the statistical analysis of damage conditions under collision scenarios, the battery damage primarily appears in the form of dimples, with the pit surface diameter most frequently distributed around 30 mm. According to GB38031-2025 [15], the impact head diameter for battery impact conditions is defined as 30 mm. Accordingly, in this battery compression test, the compression head was designed as a steel hemispherical head with a diameter of 30 mm. During the experiment, the battery cell was fixed on a fixed iron plate perpendicular to the horizontal plane, keeping the large surface of the battery and the back plate attached. The moving direction of the extrusion head was perpendicular to the large surface of the battery, and the extrusion target point was the center point of the large surface of the battery. By controlling the displacement parameters during the compression process, the impact intensity of the new energy vehicle was simulated. The prismatic lithium-ion battery was fixed onto a backplate, and compressive damage was applied to the principal surface area where the structural load-bearing capacity is weakest, using different compression displacements. The test was terminated when the battery exhibited smoke emission or when the preset target damage displacement was reached.
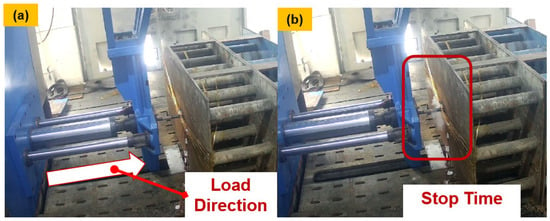
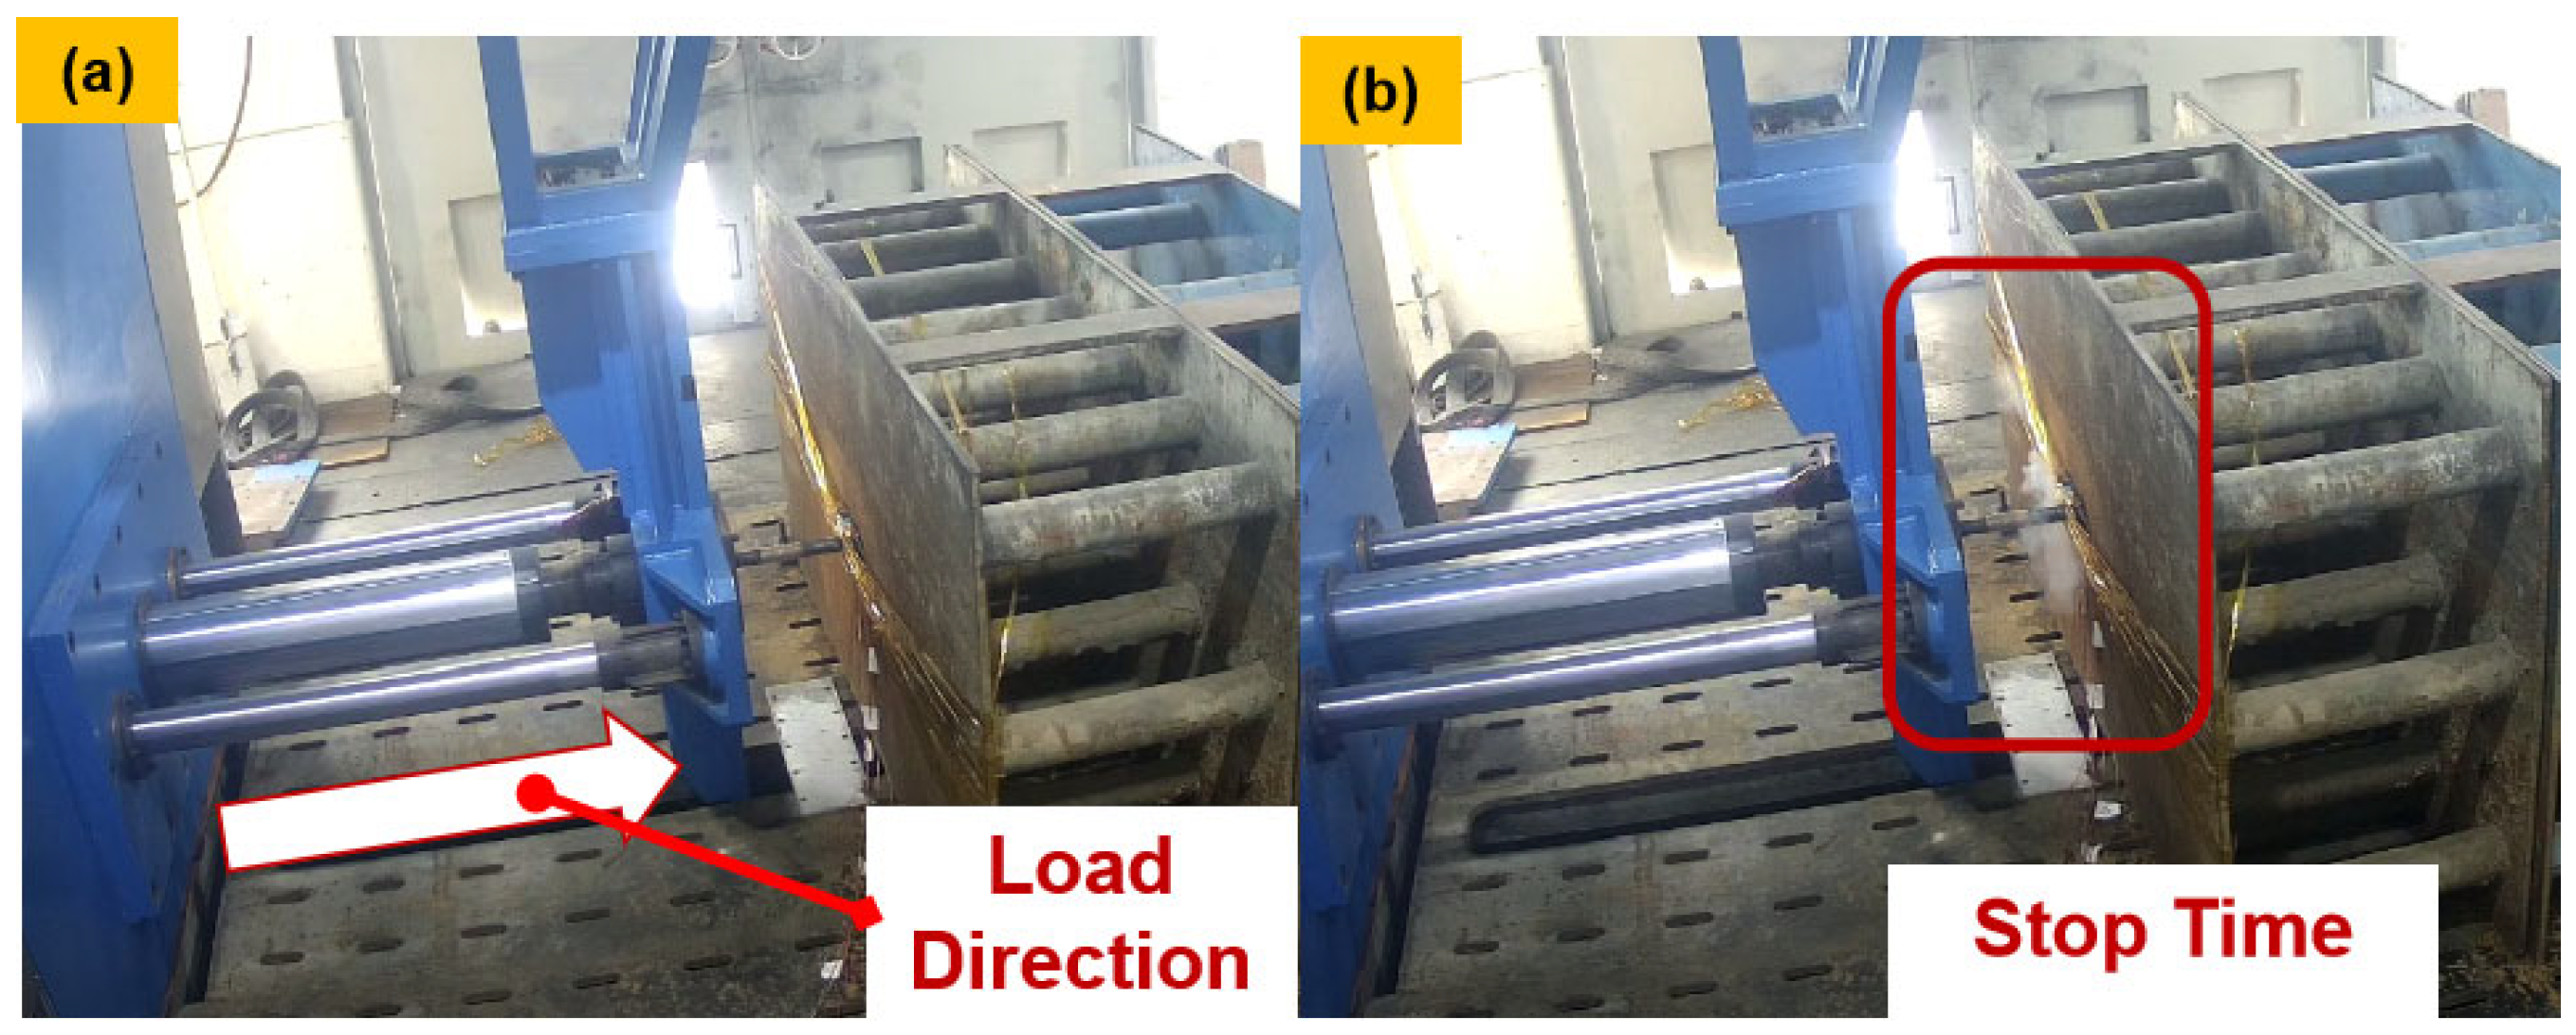
K-type thermocouple temperature sensors were installed on the positive electrode, negative electrode, main surface and side surface of the battery, as presented in Figure 1, represented by K1/K2/K3/K4. The temperature measurement range is 20 °C to 1300 °C, which is used to monitor the reaction temperature on the surface of the battery cell during the experiment. The voltage sensor is a BMS5T cell voltage sensor with a range of 0~100 V, and the extrusion table is a test table with a range of 0~100 kN. The table extrusion head can be replaced according to the test requirements. To ensure laboratory and personnel safety and to prevent unexpected incidents during testing, this experiment was conducted in a laboratory equipped with a water immersion pool and sprinkler system. The testing process of compression leading to thermal runaway is shown in Figure 2.
Figure 2.
Structural crushing failure test process. (a) Squeezing direction during experiment; (b) experimental stop time status.
3. Results and Discussion
3.1. Response Analysis of Different Extrusion Experiments
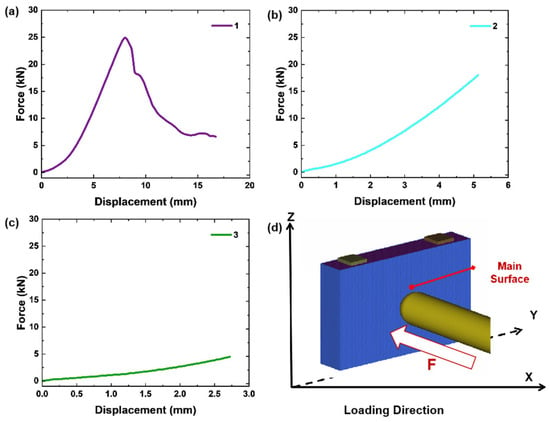
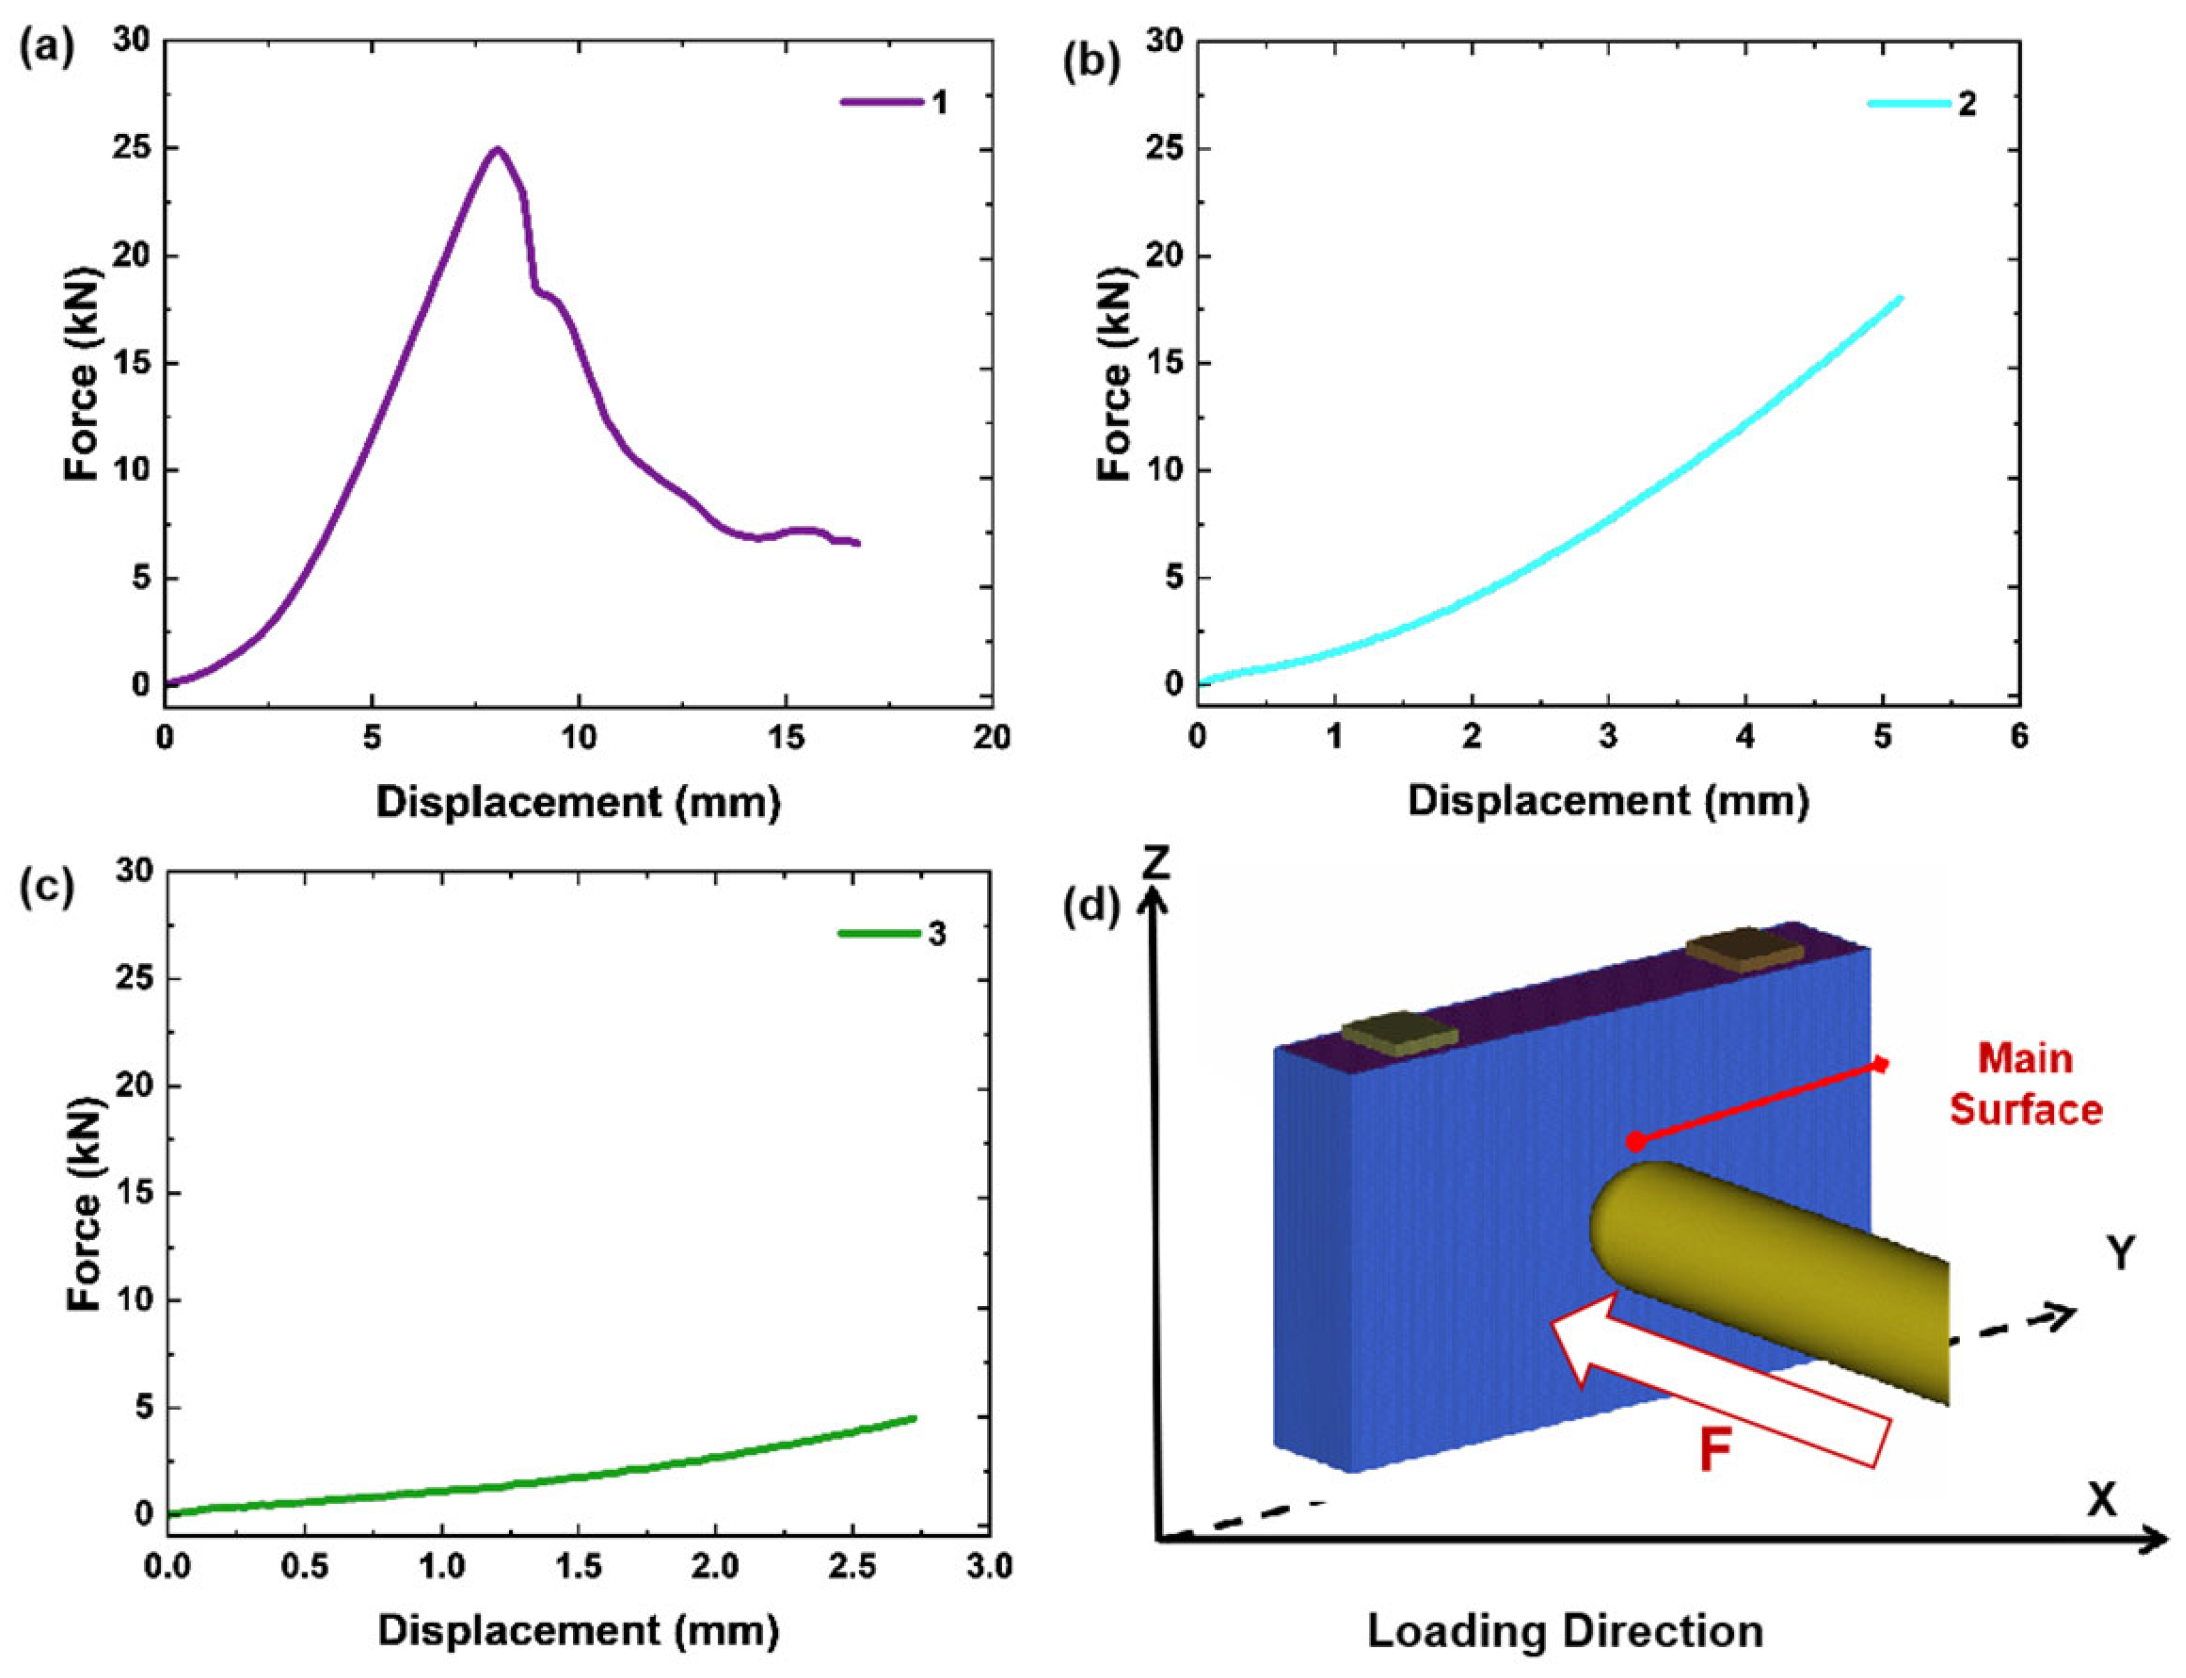
By controlling the displacement parameters during the extrusion process, the impact intensity indicators of new energy vehicles during collision are simulated. The experimental batteries are 1, 2, and 3. Battery No. 1 was simulated to be squeezed to the extent of thermal runaway, breaking through the damage level of the battery safety boundary. The No. 2 and No. 3 batteries were simulated to be damaged to a certain extent before breaking through the damage level of the battery safety boundary, but suffered mechanical damage. The specific extrusion displacements for Batteries No. 2 and No. 3 are determined based on the displacement boundary at the moment when the structure of Battery No. 1 completely fails. As shown in Figure 3, an extrusion coordinate system is established, and the load–displacement curves of Batteries No. 1, No. 2, and No. 3 during the extrusion process are presented in Figure 3a, Figure 3b, and Figure 3c, respectively.
Figure 3.
Load response results under different damage intensities. (a) Result of load variation with displacement for Battery No.1; (b) result of load variation with displacement for Battery No.2; (c) result of load variation with displacement for Battery No.3; (d) schematic diagram of load direction.
In this study, the displacement refers to the travel distance of the impactor, which represents the depth of indentation on the battery surface. By extracting the load–displacement response curve of Battery No. 1 during the entire process of being squeezed to thermal runaway, as shown in Figure 3a, the results demonstrate that the experiment was stopped when the battery was squeezed to the point of thermal runaway and smoke emission. At this point, the squeezing displacement of Battery No. 1 was 17 mm, but the moment of abrupt load drop occurred at a squeezing displacement of 8 mm. The results indicate that the load reduction caused by the failure of the battery structure occurs earlier than the occurrence of thermal runaway, and the structural failure cannot be recovered. Therefore, when defining the compression safety boundary of the battery structure, the moment of sudden load drop, at which the compression displacement is 8 mm, should be taken as its safety boundary. That is, in the design of battery protection, when considering the ultimate compression boundary of polar battery cells, 8 mm should be used as a reference. To further investigate the differences in the impact of different degrees of mechanical damage on batteries, the mechanical damage of batteries 2 and 3 was set to be less than 8 mm compared to the experimental result of Battery 1, while maintaining their differences. In this experiment, the compression displacement of Battery 2 and Battery 1 was set to 5 mm and 3 mm, respectively. The load response curve analysis of Battery No. 1 during the entire experimental process demonstrates that within the 0–8 mm squeezing displacement range, the load response increases exponentially, and the squeezing force rapidly increases from 0 kN to 25 kN. After the 8 mm displacement damage point, the load drops sharply, indicating that the battery structure is severely damaged, and the mechanical strength of the outer shell and inner core exceeds the battery’s own bearing capacity, resulting in irreversible structural fracture failure, leading to a sudden change in the squeezing force. This observation was further confirmed in the post-compression X-ray scanning results of the battery after squeezing damage. Accordingly, it can be determined that the structural failure safety boundary of this battery is at a displacement of 8 mm, which is earlier than the displacement boundary of 17 mm at the onset of thermal runaway.
As shown in Figure 3b, the load response of battery 2 increases exponentially from 0 kN to 18 kN during the 0–5 mm displacement compression process. Battery 2, with moderate damage, reached a compressive force of 17.28 kN at a displacement of 5 mm, which slightly exceeded two-thirds of the peak load force of 25 kN at the 8 mm structural threshold. This behavior is attributed to the ongoing compaction of the internal electrode-separator assemblies during the loading process, which induces an exponential increase in the compressive force response. The shell and core assembly is continuously compressed to the limit position, a state which corresponds to different mechanical impact strengths. Once the structural strength limit is exceeded, fracture failure occurs. As shown in Figure 3c, the load response of Battery 3 increases exponentially from 0 kN to 5 kN during the 0–3 mm displacement compression process. The crushing force of Battery 3, which had sustained minor damage, reached 4.51 kN at a displacement of 2.73 mm. At this point, the target displacement was nearly reached, and the test was manually terminated to maintain the minor damage objective. Because the replacement of the extrusion table tooling will lead to a certain displacement change of the tooling, resulting in a certain error in the experimental results. Since the purpose of this study is to determine the trend differences in test results caused by different degrees of mechanical damage, rather than a quantitative and accurate study of the differences, more attention is paid to the damage results rather than the exact differences in the loading process. Throughout the testing process, the load response under different target damage levels remained consistent with the load trend during direct crushing to failure. Overall, the changes in different stages of the failure process were well reproduced.
3.2. Response of Multiple Physical Parameters
During mechanical abuse, a single battery cell undergoes a progressive mechanical failure process characterized by casing deformation, sagging, cracking, and complete rupture, while internal electrode plates develop initial cracks that may propagate into large-scale fractures. Throughout this process, there exists a measurable correlation between multiple physical field parameters such as peak load, cell voltage signal, and temperature signal [16]. When the battery cell is subjected to compressive deformation, the casing structure undergoes plastic deformation under the applied compressive force and subsequently enters a necking and fracture stage under continued loading. The separator between the positive and negative electrodes may be compressed or abraded, leading to electrolyte leakage or internal short circuit. Meanwhile, the current-collecting materials between the electrodes, such as copper foil or aluminum foil, may also rupture or break, resulting in voltage drop or failure of the battery cell [17,18,19]. Specifically, when a battery cell is subjected to compressive force, stress concentration may occur locally in the internal electrode sheets or separator. Within the allowable stress strength range of the material, stress is proportional to strain, and the cell material exhibits elastic behavior. Nevertheless, if the stress exceeds the ultimate strength of the material, the electrode sheets begin to undergo plastic deformation, at which point stress and strain are no longer proportional, the electrodes lose elasticity, and cracks or fractures may appear. During the compression deformation of the battery, when the load reaches its maximum, the cell may experience internal short-circuiting due to casing strength failure and increased deformation, leading to self-heating and eventually thermal runaway [20,21]. Accordingly, in the analysis of mechanical abuse-induced damage of battery cells, focusing on the correlation among mechanical, electrical, and thermal signals enables a more accurate interpretation of the evolution mechanism during mechanical damage and provides an effective basis for selecting thermal runaway early warning parameters.
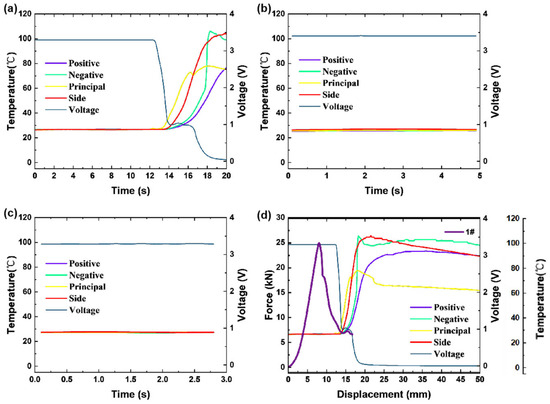
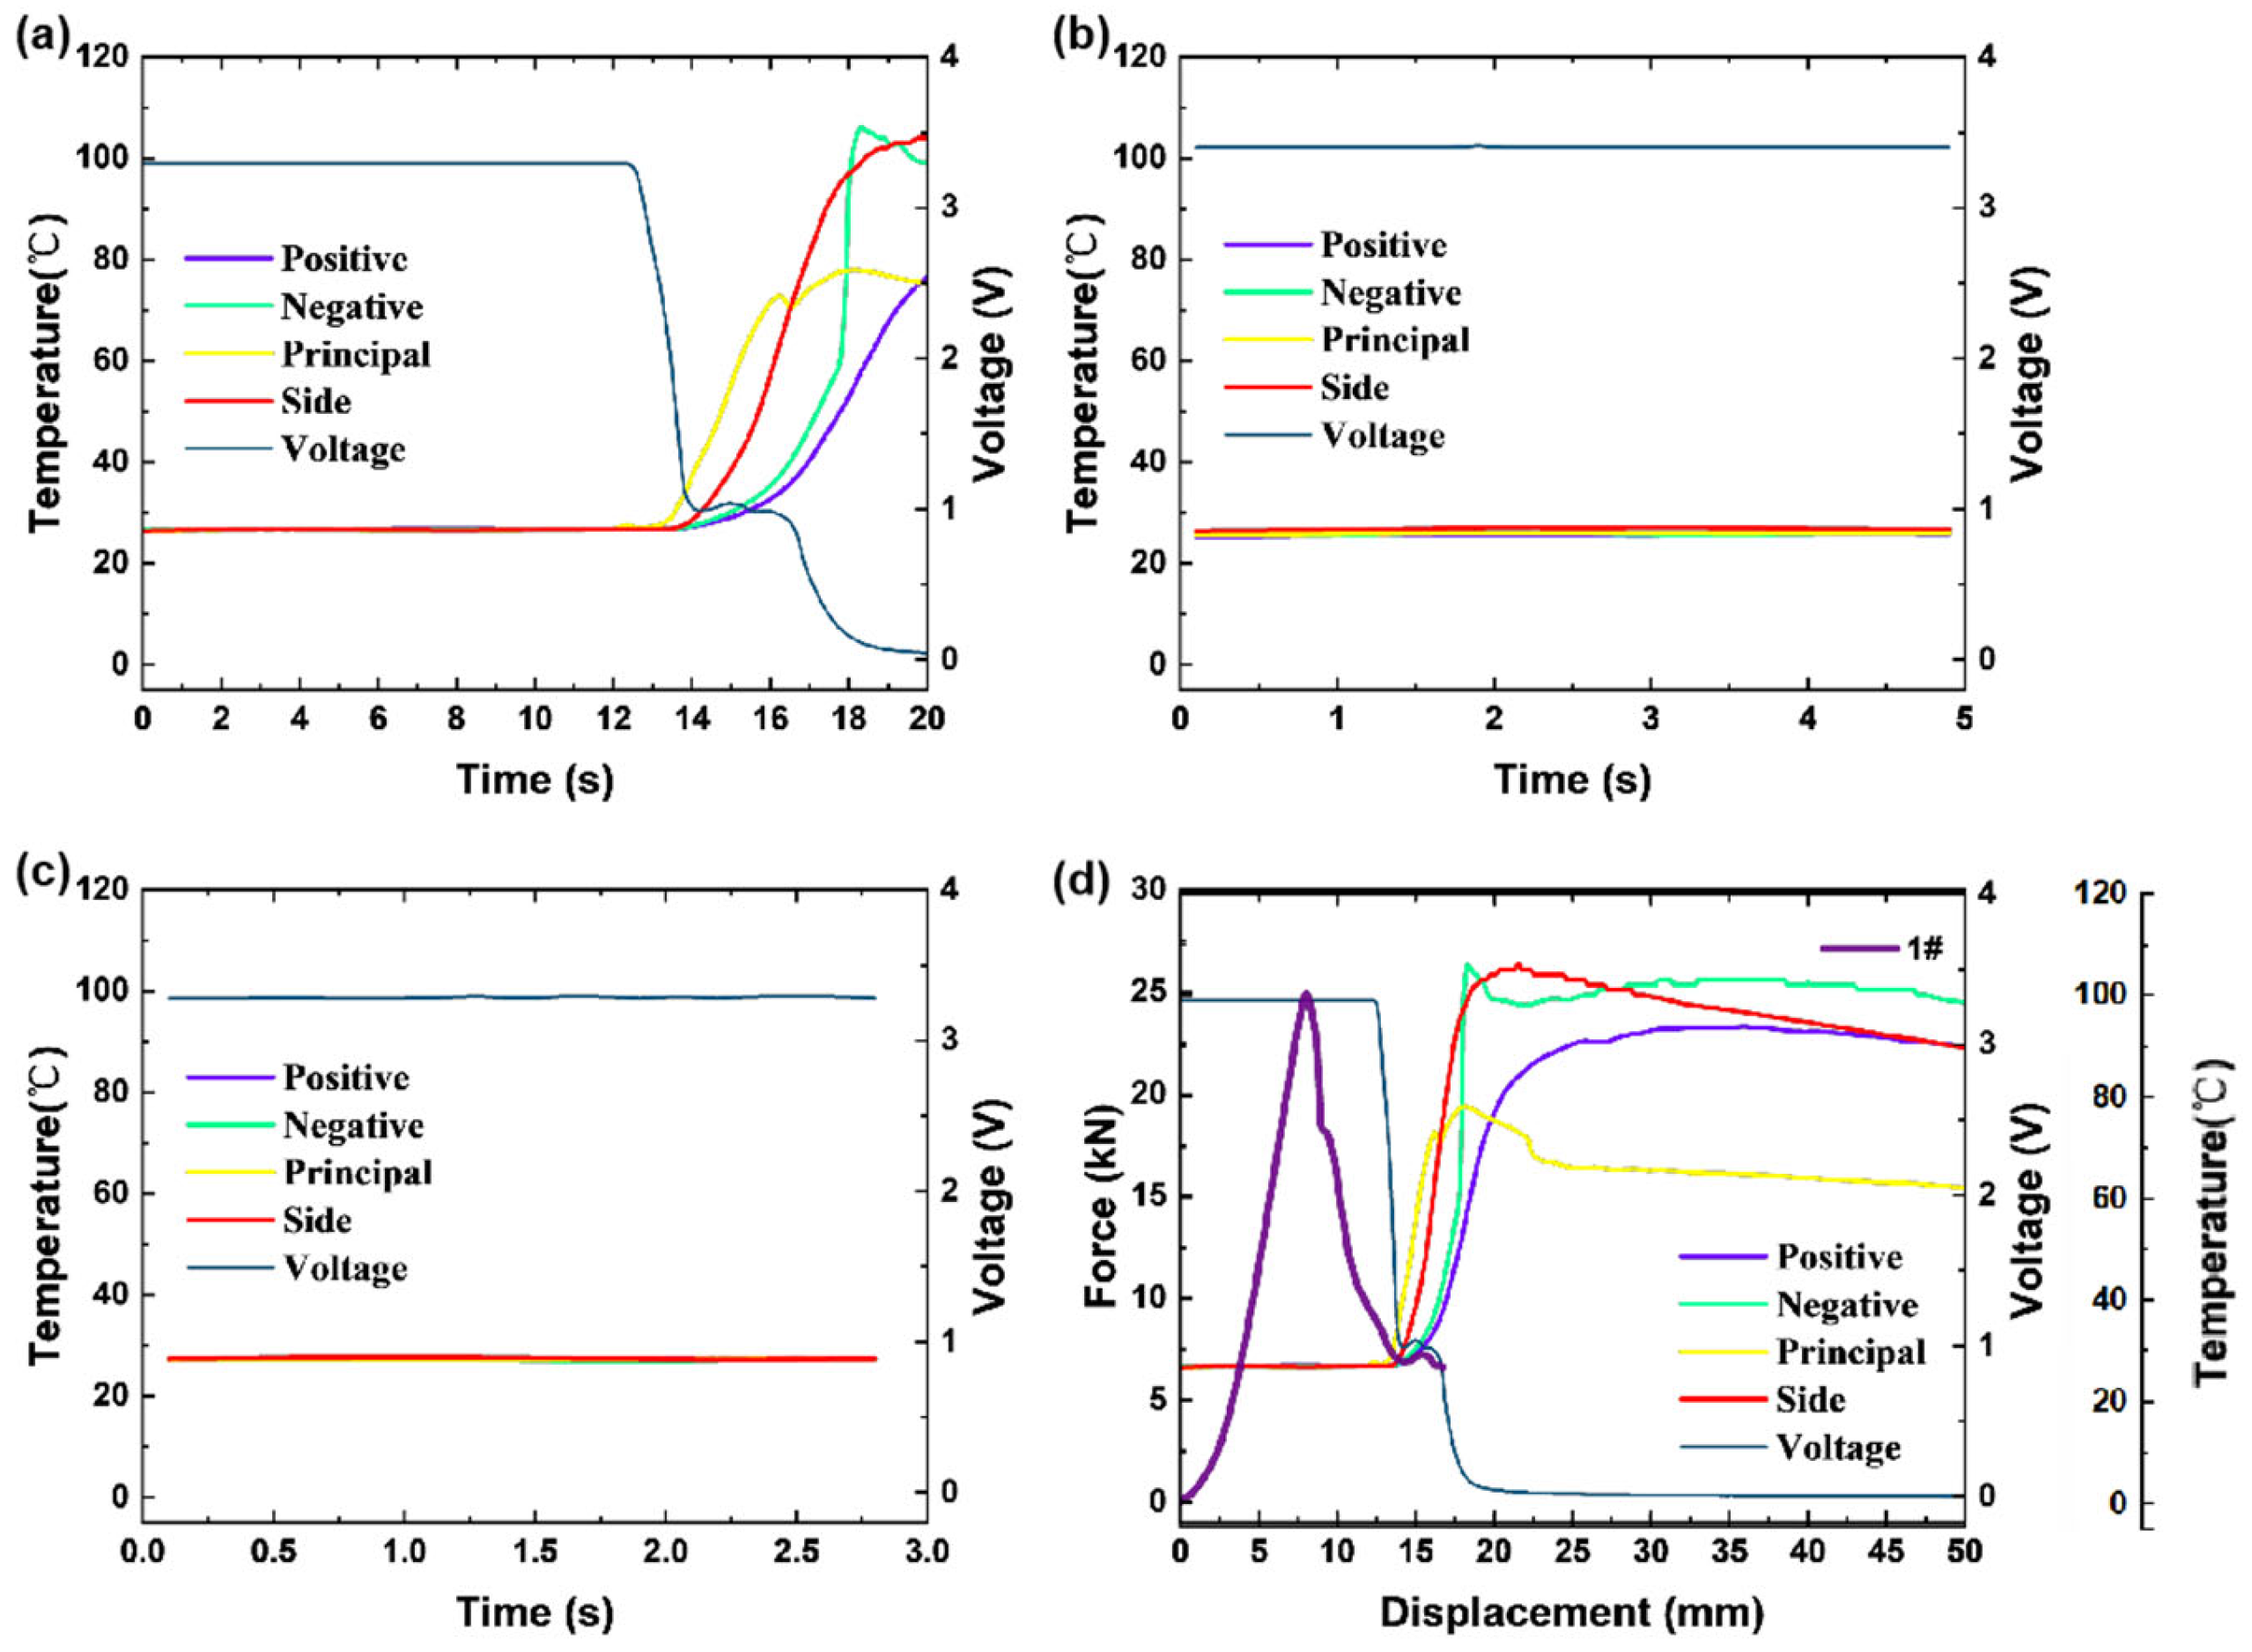
Force, electrical, and thermal signals of batteries under different damage levels were collected and analyzed during the damage-inducing process, as shown in Figure 4. Specifically, the temperature signals are monitored at the battery’s positive electrode, negative electrode, side, and the center of its main surface.
Figure 4.
Multi-physics response results under different damage intensities. (a) Result of temperature variation of Battery No.1 over time; (b) result of temperature variation of Battery No.2 over time; (c) result of temperature variation of Battery No.3 over time; (d) comparison of multi-field signal response results for temperature, squeezing force, and voltage of Battery No.1.
As shown in Figure 4a, the voltage and temperature signals of different surfaces of battery No. 1 undergoing thermal runaway are plotted against the elapsed compression time. The voltage signal experienced a sudden drop at 13 s, plummeting from 3.29 V to 1.13 V within 1 s. Simultaneously, the temperature of each surface began to rise rapidly. From 13 s to 15 s, the temperature rise on the principal surface started earlier than that on the side and the positive/negative terminals. This is attributed to the squeezing point being located at the center of the principal surface, where structural failure led to a localized internal short circuit. The temperature rapidly increased after heat generation and propagated to the surroundings areas. Accordingly, the temperature at the initial stage of failure decreased in the order of principal surface, side, negative terminal, and positive terminal. Furthermore, at 17 s, the battery thermal runaway was accompanied by smoke. Subsequently, the peak temperature of the principal surface was lower than that of other Surveillance points. This is because the principal surface was in close contact with the steel tooling back plate at room temperature, resulting in heat transfer to the lower-temperature steel tooling back plate. In contrast, the side and positive/negative terminal surveillance points were surrounded by air, and the thermal conductivity of air is significantly lower than that of the steel tooling back plate. As shown in Figure 4b, the voltage and temperature signals of different surfaces of Battery No. 2 with moderate damage are plotted against the compression time. The voltage signal remains at 3.29 V throughout the squeezing process from 0 s to 5 s, with no significant voltage drop observed. Similarly, the temperature remains stable around the initial temperature of 26.1 °C, without any noticeable fluctuations. Figure 4c illustrates the voltage and temperature signals of different surfaces of Battery No. 3 with slight damage as a function of squeezing time. The voltage signal remains constant at 3.29 V during the entire compression process from 0 s to 3 s, showing no significant voltage drop. The temperature also remains stable around the initial temperature of 26.1 °C, with no obvious fluctuations. The results indicate that the voltage and temperature signals of Battery 2 and Battery 3 did not exhibit significant changes within the 5 mm damage deformation range during the experiment. Further comparison of the correlation between force, electrical, and thermal signals of Battery 1 during mechanical crush failure is presented in Figure 4d. The force signal drop occurred at 8 s, the voltage signal drop occurred at 13 s, and the thermal signal began to show a significant inflection at 13 s. The temperature increased to an irreversible runaway at 17 s, with obvious white smoke appearing on the battery surface, leading to further thermal runaway and complete failure. In terms of the priority of early warning for thermal runaway, the force signal is more capable of providing advanced warning, preceding the electrical signal by 5 s and the thermal signal by 9 s. This suggests that the deformation failure of the battery during mechanical abuse is due to structural rupture and damage, which induces an internal short circuit and a subsequent voltage drop. This eventually results in a sharp temperature increase due to heat generation, further leading to irreversible thermal runaway. Throughout this process, no abnormal changes were observed in the voltage and temperature signals for damage within the 0–5 mm range. Nevertheless, the force signal drop at a severe damage of 8 mm demonstrates an earlier warning capability.
3.3. Simulation Model
The samples used in this study were lithium iron phosphate batteries. The positive electrode material consists of lithium iron phosphate (LiFePO4) active material coated with a binder onto aluminum foil serves as positive current collector, tightly adhered to the upper and lower surfaces of the current collector [22,23]. The thickness of the positive electrode aluminum foil is 15 μm, and the thickness of the active material layer on one side is 100 μm. The negative electrode material consists of graphite bonded with an adhesive to a copper foil negative current collector, tightly adhered to the upper and lower surfaces of the current collector. The thickness of the negative electrode copper foil is 10 μm, and the thickness of the active material layer on one side is 90 μm. To meet the safety and ion conduction requirements of high-capacity batteries, PP/PE/PP three-layer composite membranes are the mainstream for mass production as separators between the positive and negative electrodes. The polyethylene (PE) layer in the middle accounts for 30% of the total thickness and has a melting point of 135 °C, providing a thermal shutdown function. When the battery overheats, the PE layer melts and shrinks, blocking the pores and reducing the porosity from 40% to below 5%, further cutting off ion transport and preventing thermal runaway. The thickness of each of the two polypropylene (PP) layers on the upper and lower surfaces of the separator accounts for 30%, with a tensile strength of 150 MPa, which is sufficient to support the separator structure and prevent penetration by electrode particulates. The separator thickness represents a critical design parameter: a thickness below approximately 12 μm compromises mechanical durability, while a thickness exceeding approximately 16 μm incurs excessive ionic resistance [24]. Accordingly, the separator thickness is typically 16 μm after electrolyte impregnation.
The electrode samples were selected, and the elastic modulus of the positive and negative electrodes was measured using a three-point bending method on a mechanical testing device. The elastic modulus increases with increasing compaction density. Typically, when the compaction density is 2.4 g/cm3, E can reach 10 GPa. Furthermore, owing to the greater graphite flexibility than lithium iron phosphate, the elastic modulus of the negative electrode is lower than that of the positive electrode, which can buffer part of the expansion force during cycling. Similarly, tensile testing can be performed on both positive and negative electrodes using a universal testing machine to measure transverse and longitudinal strain, thereby determining the Poisson’s ratio of the electrodes. Typically, the differences in Poisson’s ratio among the positive electrode, negative electrode, and separator are small, and a uniform value of 0.3 is adopted for modeling.
Experimental tests alone cannot fully capture the detailed mechanical responses of the battery shell and internal components during compression [25]. Thus, this study integrates experimental data with numerical simulations to systematically analyze battery stress distribution and damage evolution. The simulation analysis is based on the software LS-DYNA R11.0, explicit dynamics analysis was used by the Flanagan-Belytschko stiffness form, the hourglass coefficient was 0.1, and the automatic time step control factor was 0.9. The battery shell was meshed with solid elements (C3D8R) to ensure computational accuracy while balancing efficiency.
The finite element model established is a layered homogenization model. The shell structure of the battery was established by the Piecewise_linear_plasticity model MAT_24 as shown in Table 1, the failure occurs with the maximum principal strain exceeding 0.2, and the isotropic collapsible foam material constitutive model MAT_63 is used to simulate the internal structure of the battery. Specifically, for the internal structure of the battery, the failure occurs when the maximum principal strain exceeds 0.15, which is consistent with the reference [26]. The boundary conditions are the same as in the above experiments.
Table 1.
Model material parameters.
The internal jellyroll was discretely modeled, comprising three distinct components (separator, negative electrode, positive electrode) to accurately represent their respective structural properties. Given the intimate lamination between the electrodes and separator in the physical cell, a shared-node formulation was employed at these interfaces to eliminate artifacts associated with contact stiffness. In contrast, a finite gap exists between the jellyroll and the casing due to manufacturing tolerances; therefore, a general contact algorithm with a penalty function was applied to this interface. Contact algorithm between different components was surface-to-surface contact with friction coefficient. To prevent numerical penetration—a critical consideration for the thin, compliant separator—a hard contact model with Coulomb friction 0.1 was implemented for the internal electrode-separator interfaces. A contact stiffness scale factor of 1.5 was prescribed to limit excessive interlayer sliding while permitting separation. For the core-casing interface, a soft contact formulation was used in the normal direction to mitigate unrealistic initial contact pressures, coupled with Coulomb friction 0.1 to enable pressure transfer during core expansion.
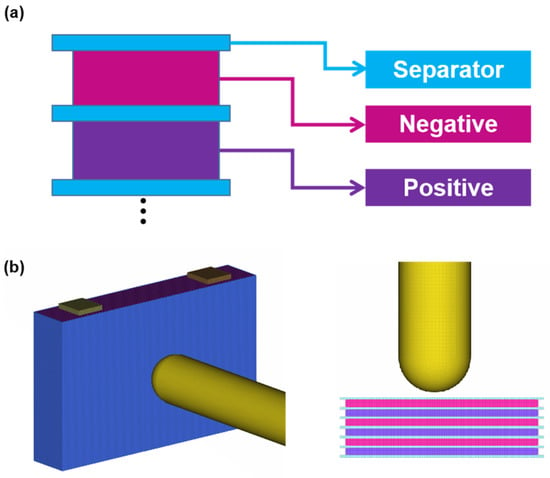
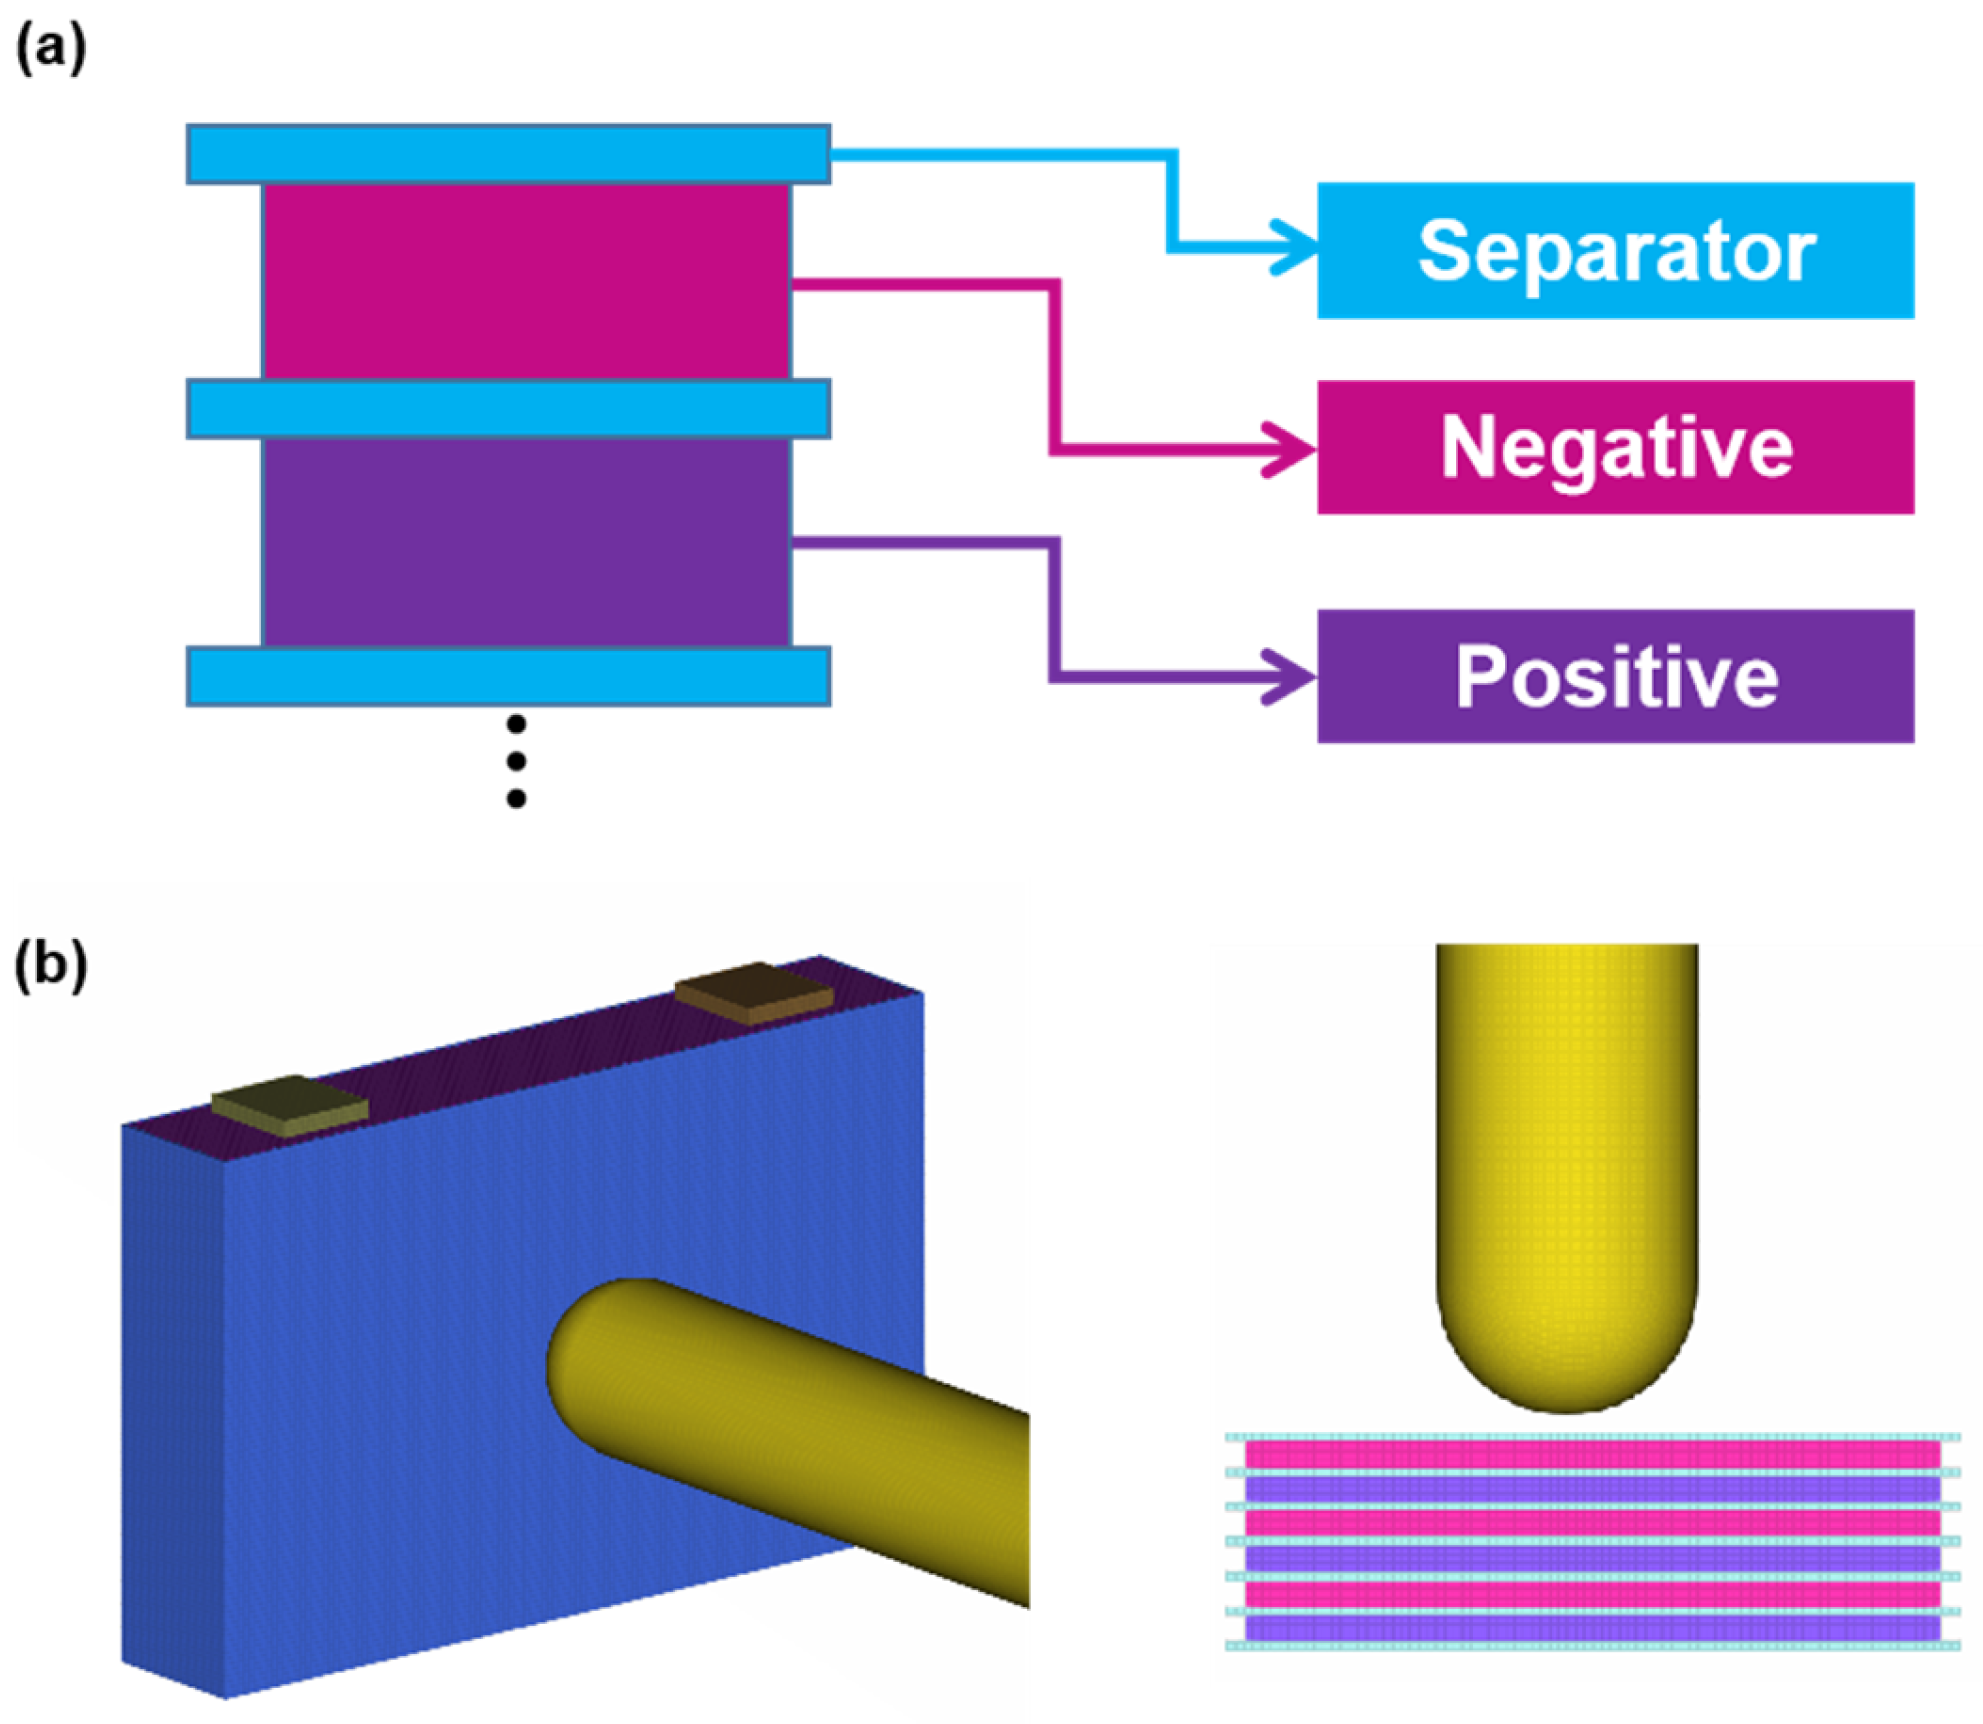
Given the focus on compression at the center of the battery’s principal surface, the internal core’s layered modeling approach has negligible impact on damage prediction. Thus, the electrodes and separator were modeled as alternating stacked layers (Figure 5a), with all components meshed using hexahedral solid elements. The FE model (Figure 5b) was setted with the same boundary conditions with the experimental, including fixed constraints on the backplate and displacement-controlled to the principal surface.
Figure 5.
Schematic diagram of the compression simulation model. (a) Schematic diagram of internal structure, as shown in the figure, blue represents the separator, red represents the negative electrode, and purple represents the positive electrode; (b) simulation model construction diagram.
3.4. Response Characteristics of Simulation Parameters
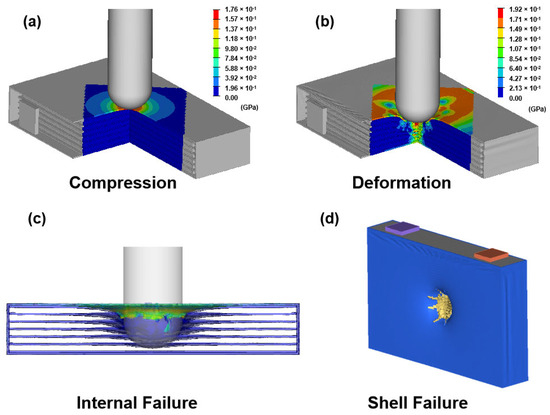
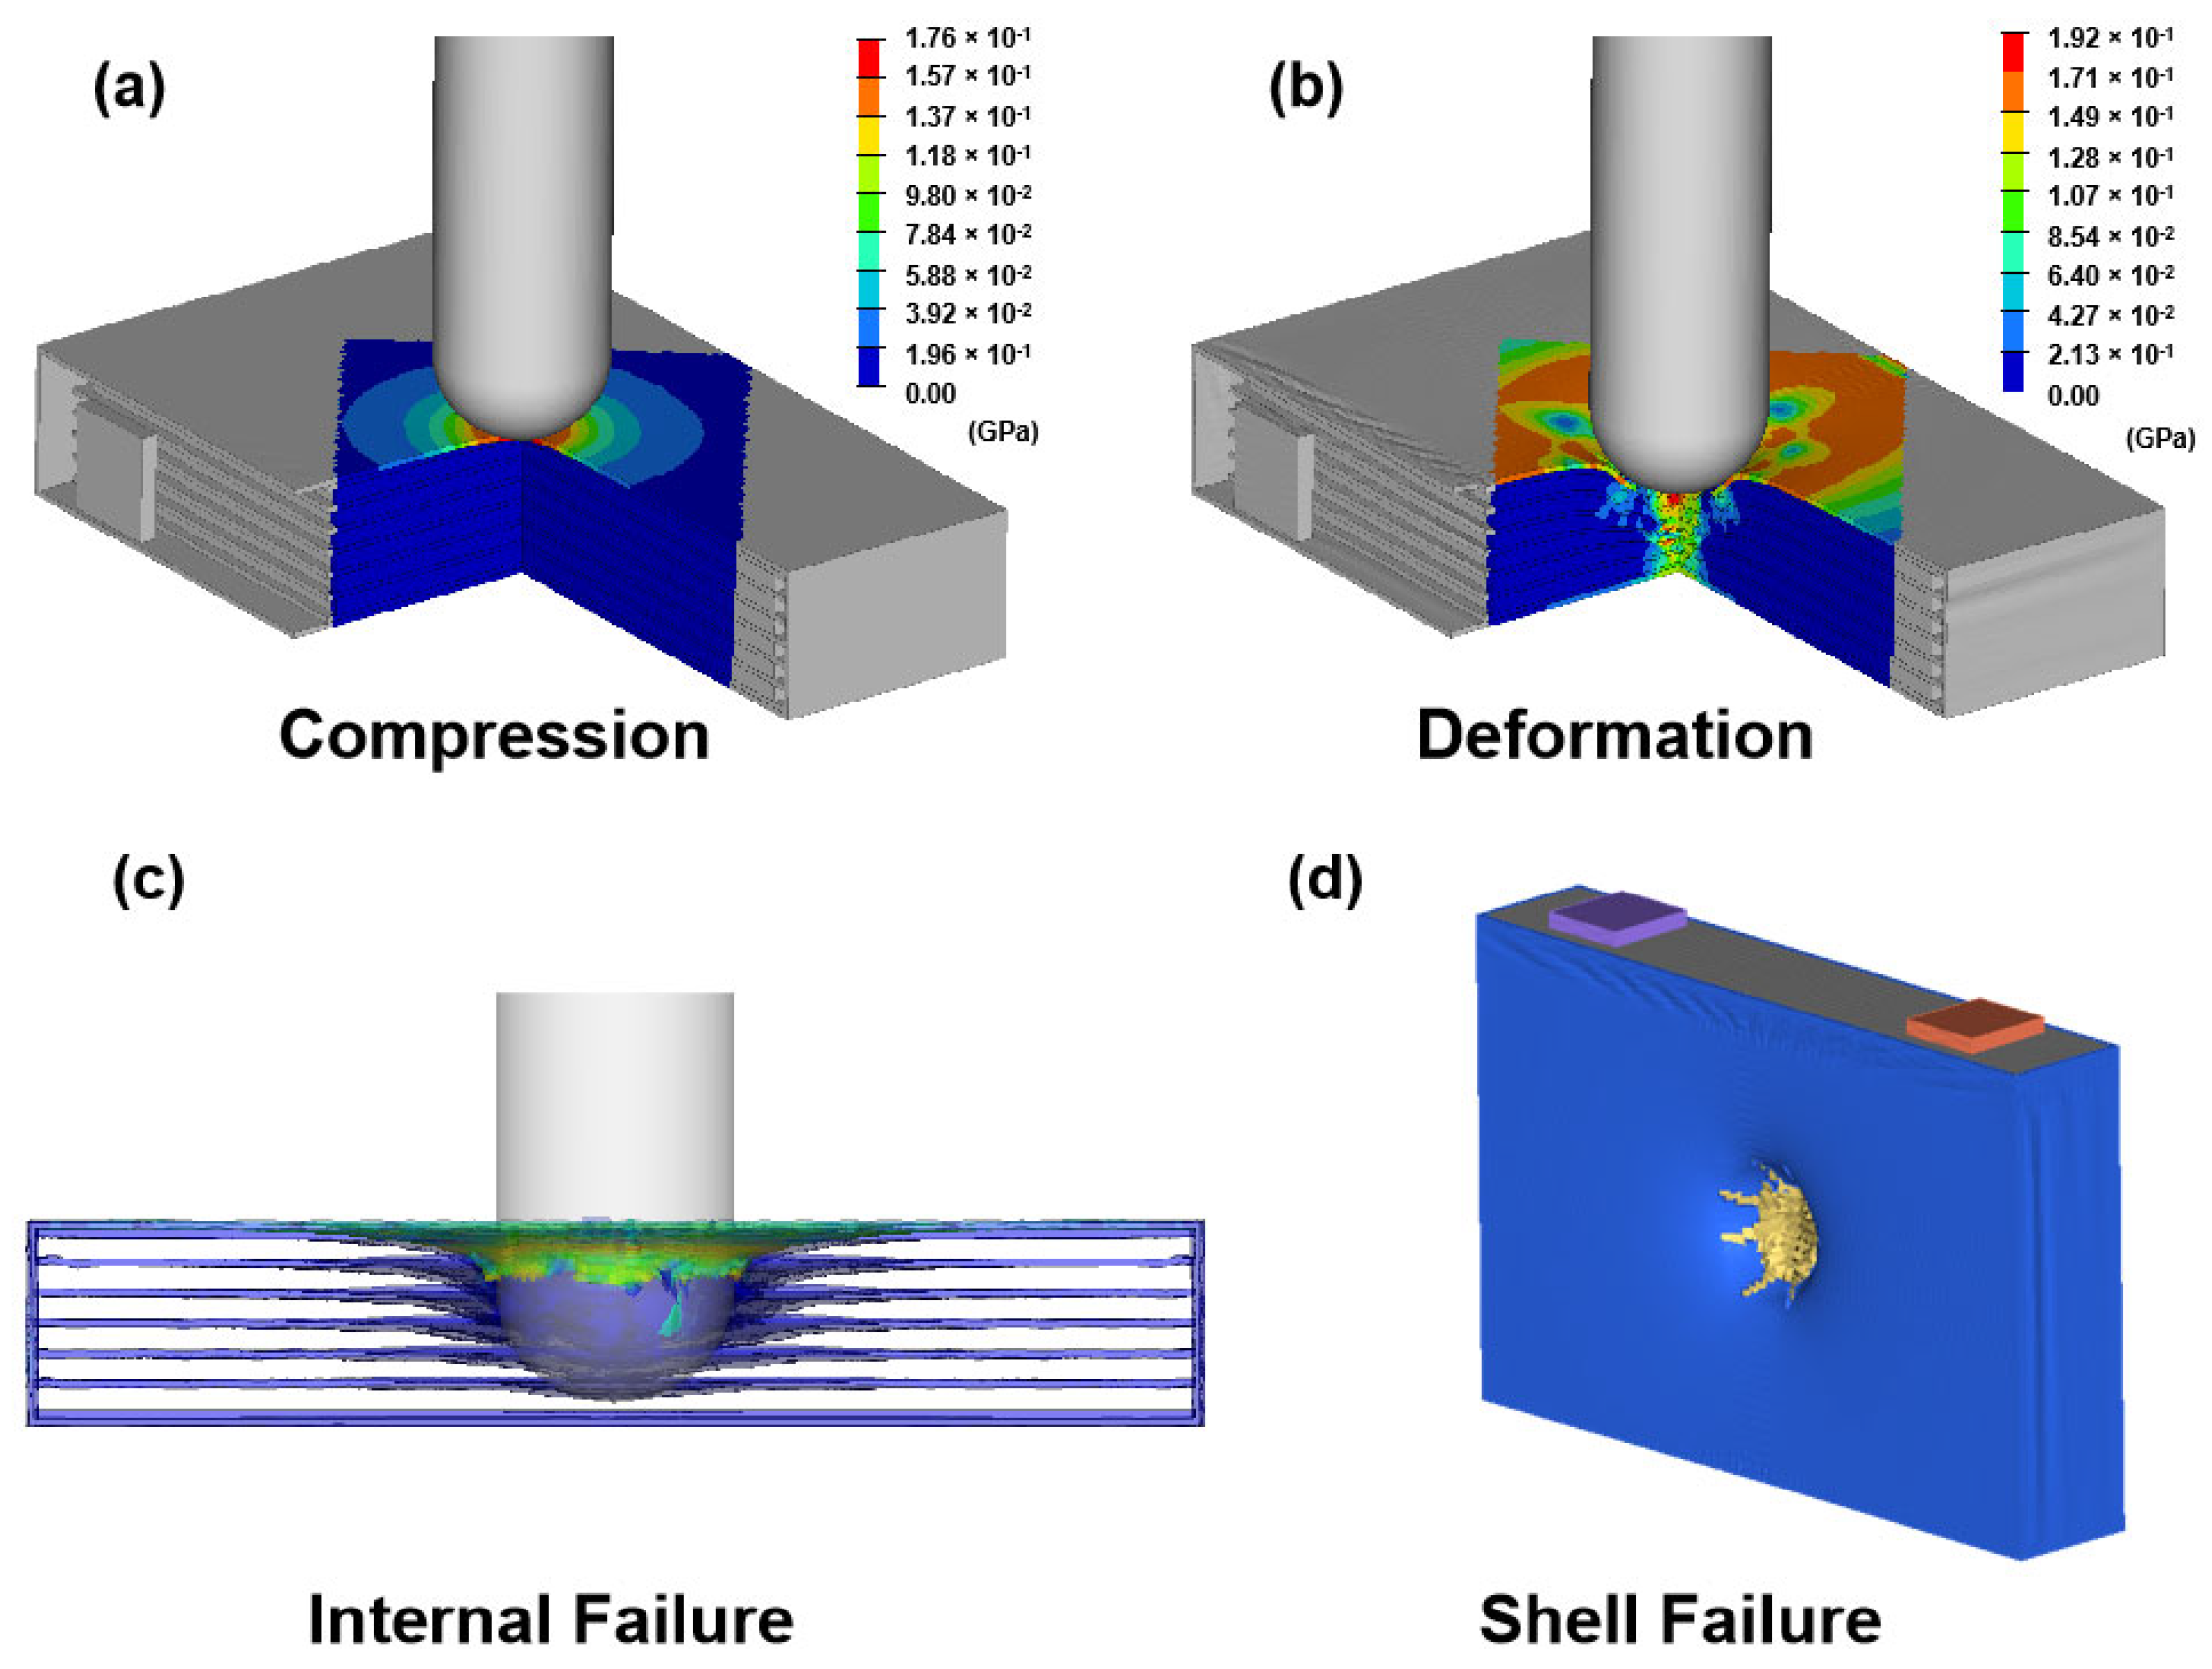
To enable direct comparison with the experiments, the loading protocol was consistent with that of Battery 1 (the compression-induced thermal runaway test), as illustrated in Figure 6. The ultimate tensile strength of the battery shell was set to 200 MPa based on material characterization data. Figure 6a presents the simulation results for minor damage (target displacement: 3 mm), Figure 6b for moderate damage (target displacement: 5 mm), and Figure 6c,d for severe damage (target displacement: 17 mm). Analysis of simulated stress contours indicates that casing fracture initiates when the local von Mises stress exceeds the material’s ultimate strength, with pronounced stress concentration localized beneath the rigid impactor. Critically, the casing rupture morphology under severe compression closely matches experimental observations, thereby validating the model’s capability to capture realistic structural failure modes. From initial contact through the compaction phase, the progressive electrode fracture is accompanied by material densification. Correspondingly, the stress distribution exhibits a sequential decay from the outer contact region toward the battery interior. This phenomenon corroborates the load transfer mechanism induced by mechanical damage, whereby the applied compressive force propagates inward through the casing and core, driving progressive damage accumulation.
Figure 6.
Simulation stress contour maps under different compression levels. (a) Squeezing force state; (b) obvious compression deformation state; (c) internal rupture failure state; (d) shell rupture failure state.
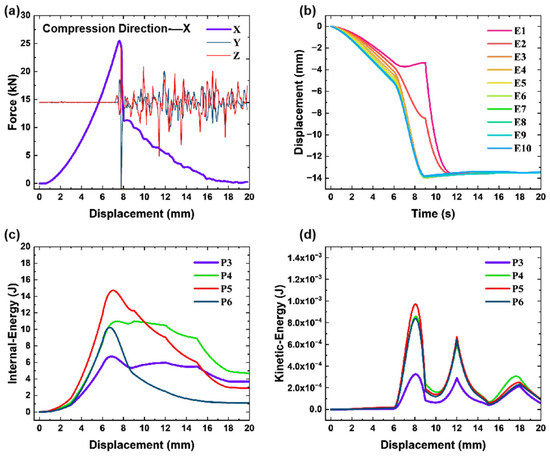
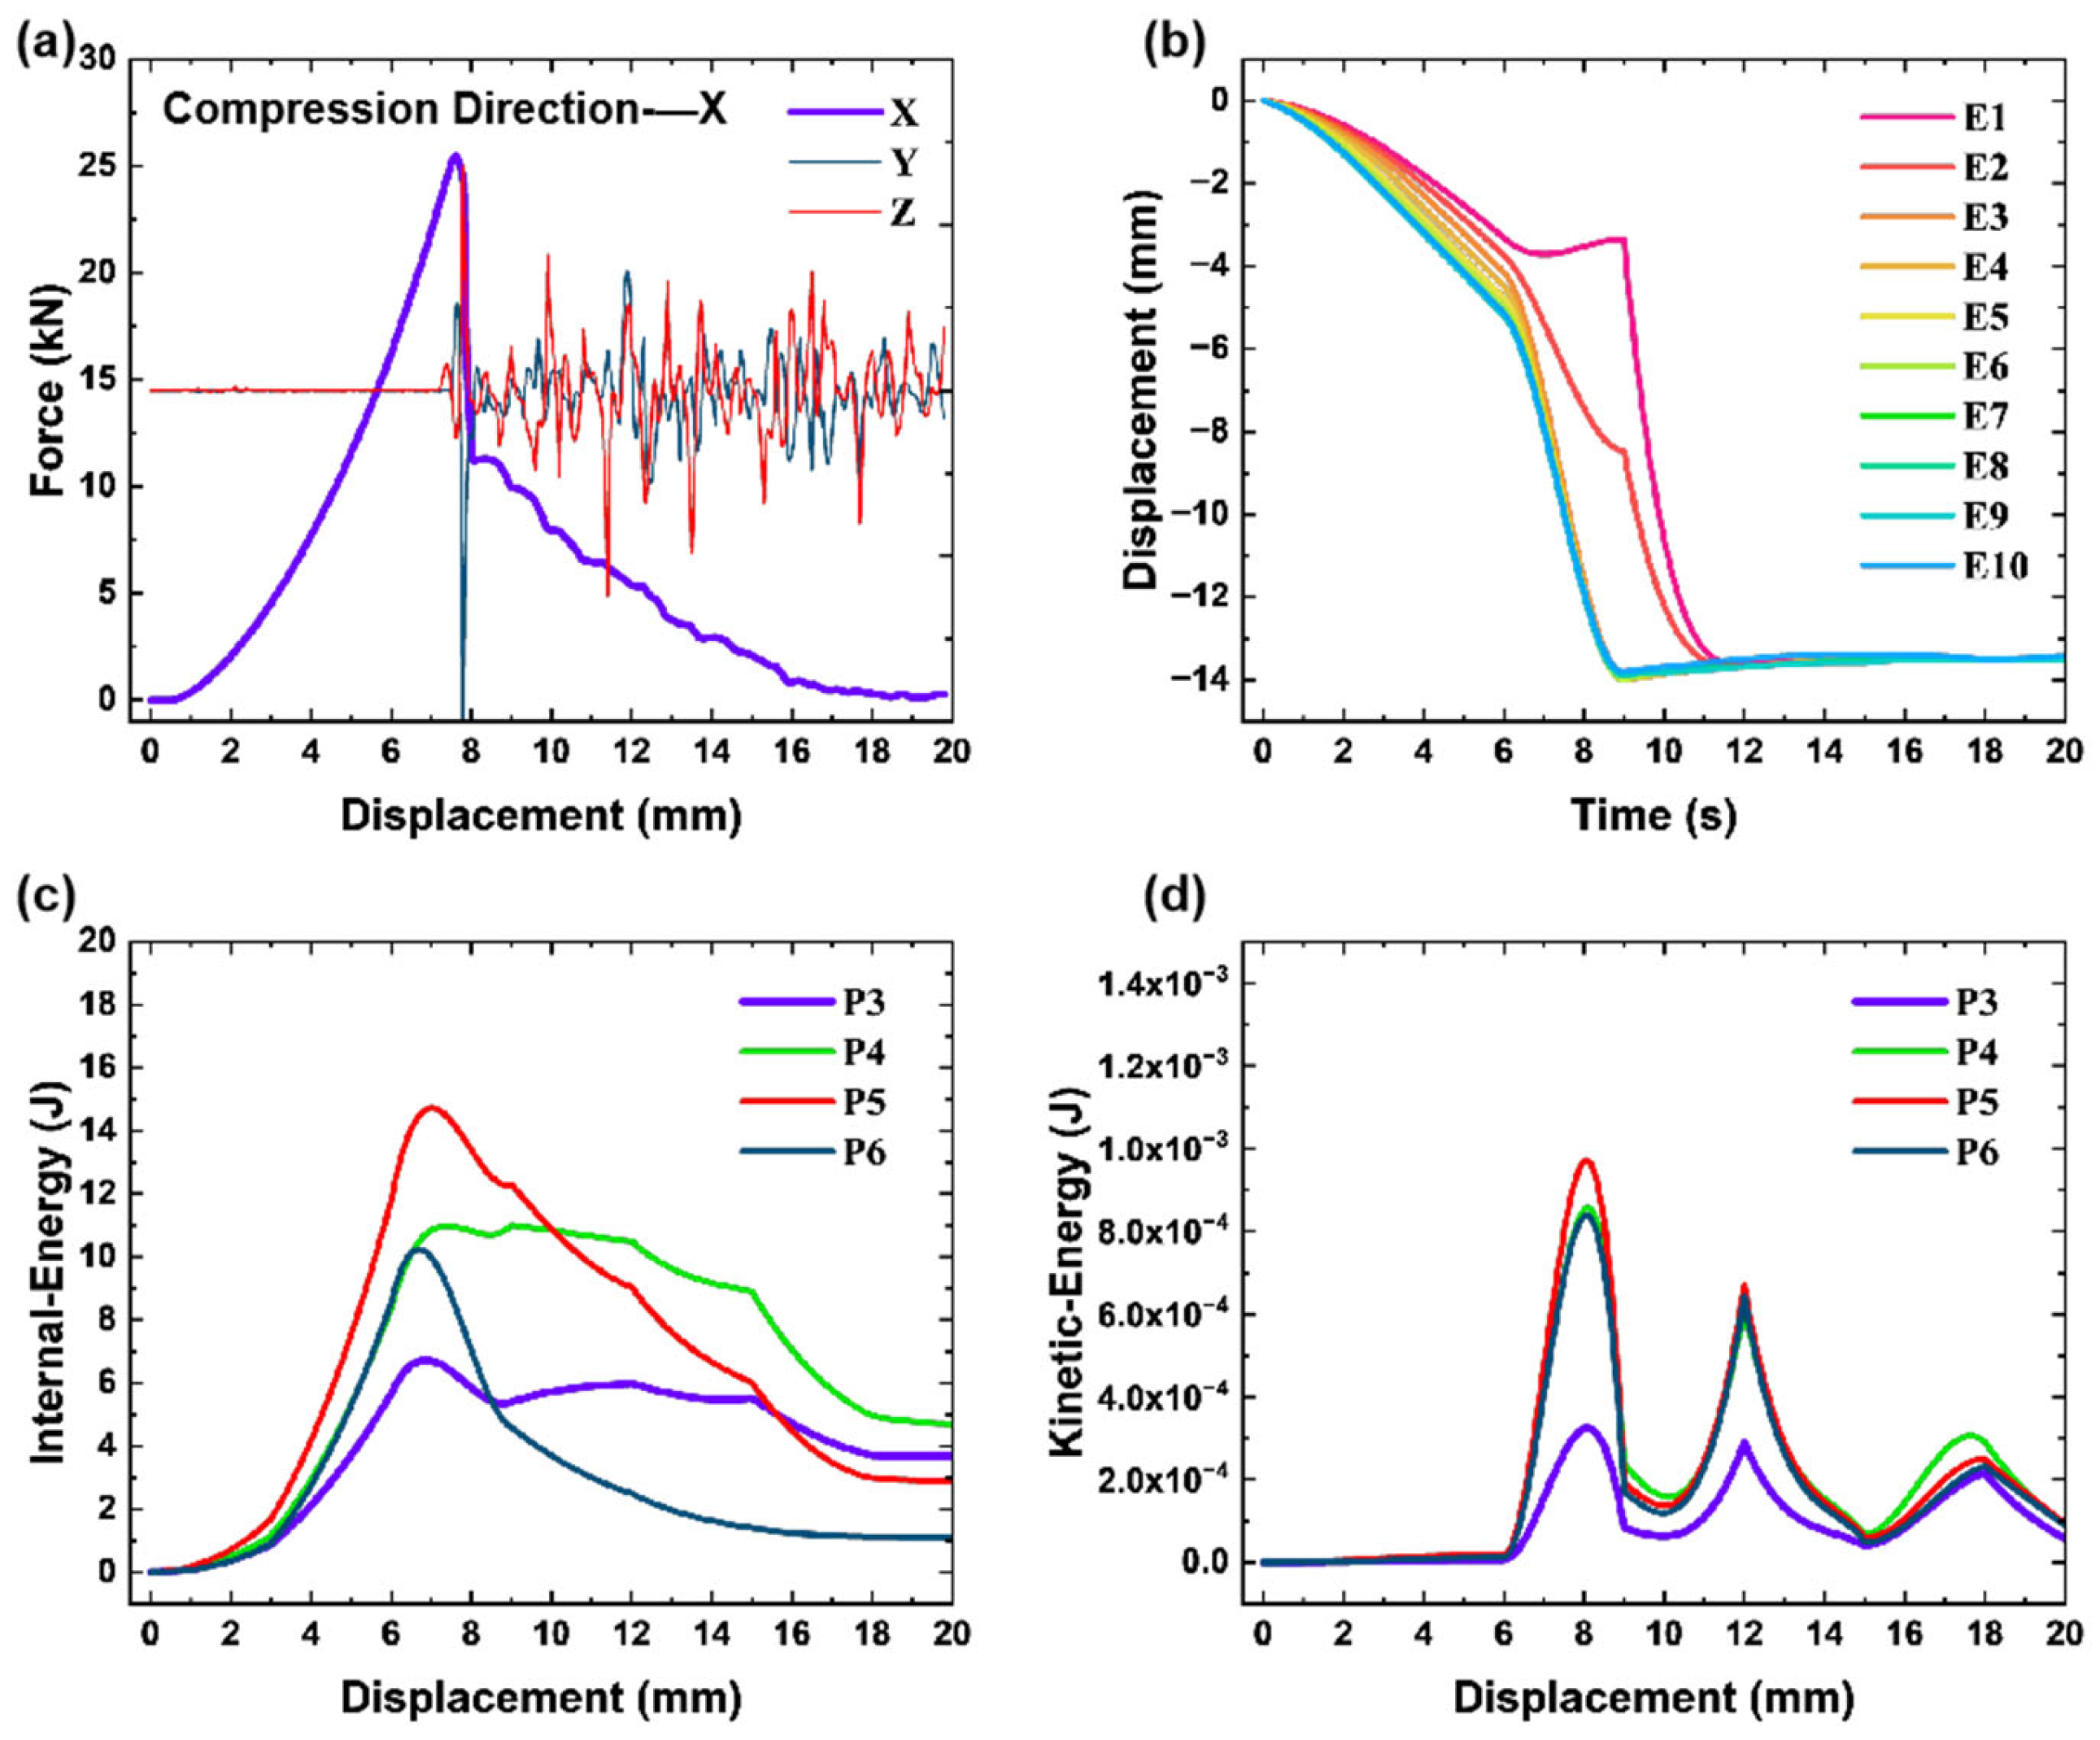
Multi-field analysis during compression-induced damage (Figure 7) demonstrates that the compressive force evolves with displacement as the shell deforms and fractures. As illustrated in Figure 7a, an abrupt drop in the out-of-plane (X-direction) force occurs at 7.8 mm displacement, corresponding to shell rupture. Concurrently, the in-plane force increases sharply from 0 to 0.2 kN due to rupture-induced sliding. Subsequent compression leads to load fluctuations caused by friction between the impact head and fractured internal structures, with the peak force gradually decreasing. At 17 mm displacement, the out-of-plane force approaches 0 kN, coinciding with irreversible electrochemical reactions and TR (consistent with experimental smoke emission). The experimental peak force of 24.9 kN at 8 mm displacement (followed by an abrupt drop) is closely matched by the simulation’s peak force of 25.5 kN at 7.8 mm displacement (relative error < 3%), confirming the model’s accuracy in predicting structural failure. Figure 7b depicts history of ten monitoring elements near the compression center. Under the applied load, these elements undergo rapid displacement, progressively penetrating the battery interior. Element motion ceases at approximately 7.8 mm displacement, marking the point of casing fracture and structural collapse. Figure 7c,d illustrates the energy response of key components (shell P3, separator P4, negative electrode P5, positive electrode P6). Energy absorption peaks within the 0–8 mm displacement range, followed by a sharp decrease in kinetic energy at 7.8 mm—indicating structural fracture. Post-rupture, internal electrochemical reactions and structural instability cause kinetic energy fluctuations, which eventually stabilize at 0 as the battery reaches complete failure.
Figure 7.
Multi-field parameter evolution during compression-induced damage. (a) Squeezing force varies with displacement; (b) squeezing deformation displacement changes with time; (c) internal-energy variation during extrusion process; (d) kinetic-energy variation during extrusion process.
A quantitative comparison of the experimental and simulation results demonstrates a high degree of consistency in both failure morphology and load–displacement response. The developed FE model, grounded in actual material properties and structural geometry, successfully reproduces the damage initiation, progression, and peak load characteristics during mechanical compression. This study establishes a reliable numerical framework for evaluating the mechanical integrity of prismatic LFP batteries, providing a foundation for design optimization and the definition of mechanical safety boundaries.
3.5. Computed Tomography Analysis
X-ray computed tomography (CT) scanning was performed on the batteries to characterize internal defects and structural features non-destructively with high resolution. Leveraging differences in X-ray attenuation across materials, three-dimensional (3D) structural images of internal components (e.g., electrodes, separator, tabs, and shell) were generated [27]. To avoid uneven X-ray absorption caused by residual charge, the batteries were first discharged to 0% state of charge and rested for 2 h. Each battery was then fixed at the center of the sample stage, with a laser aligner ensuring alignment between the battery center and the rotation axis. No contact with the equipment was permitted during scanning to prevent vibration-induced artifacts. In order to comprehensively and accurately characterize the internal structure of mechanically damaged batteries, this study adopts a complementary testing strategy combining X-ray computed tomography (CT) and disassembly analysis. CT scanning is used to monitor the overall fracture morphology of damaged batteries; however, CT scanning has limitations in distinguishing the microscopic characteristics and chemical changes of electrode materials. In contrast, disassembly analysis can provide samples for subsequent DSC and XRD material characterization tests. Therefore, the combination of these two complementary methods can not only obtain the three-dimensional spatial distribution of damage, but also reveal the differences in microscopic damage, ensuring a comprehensive and reliable evaluation of battery safety characteristics under different degrees of mechanical damage.
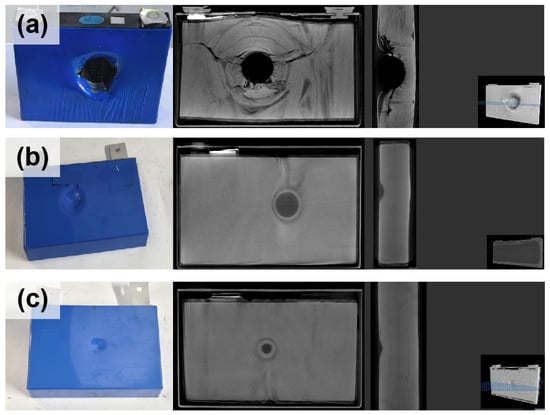
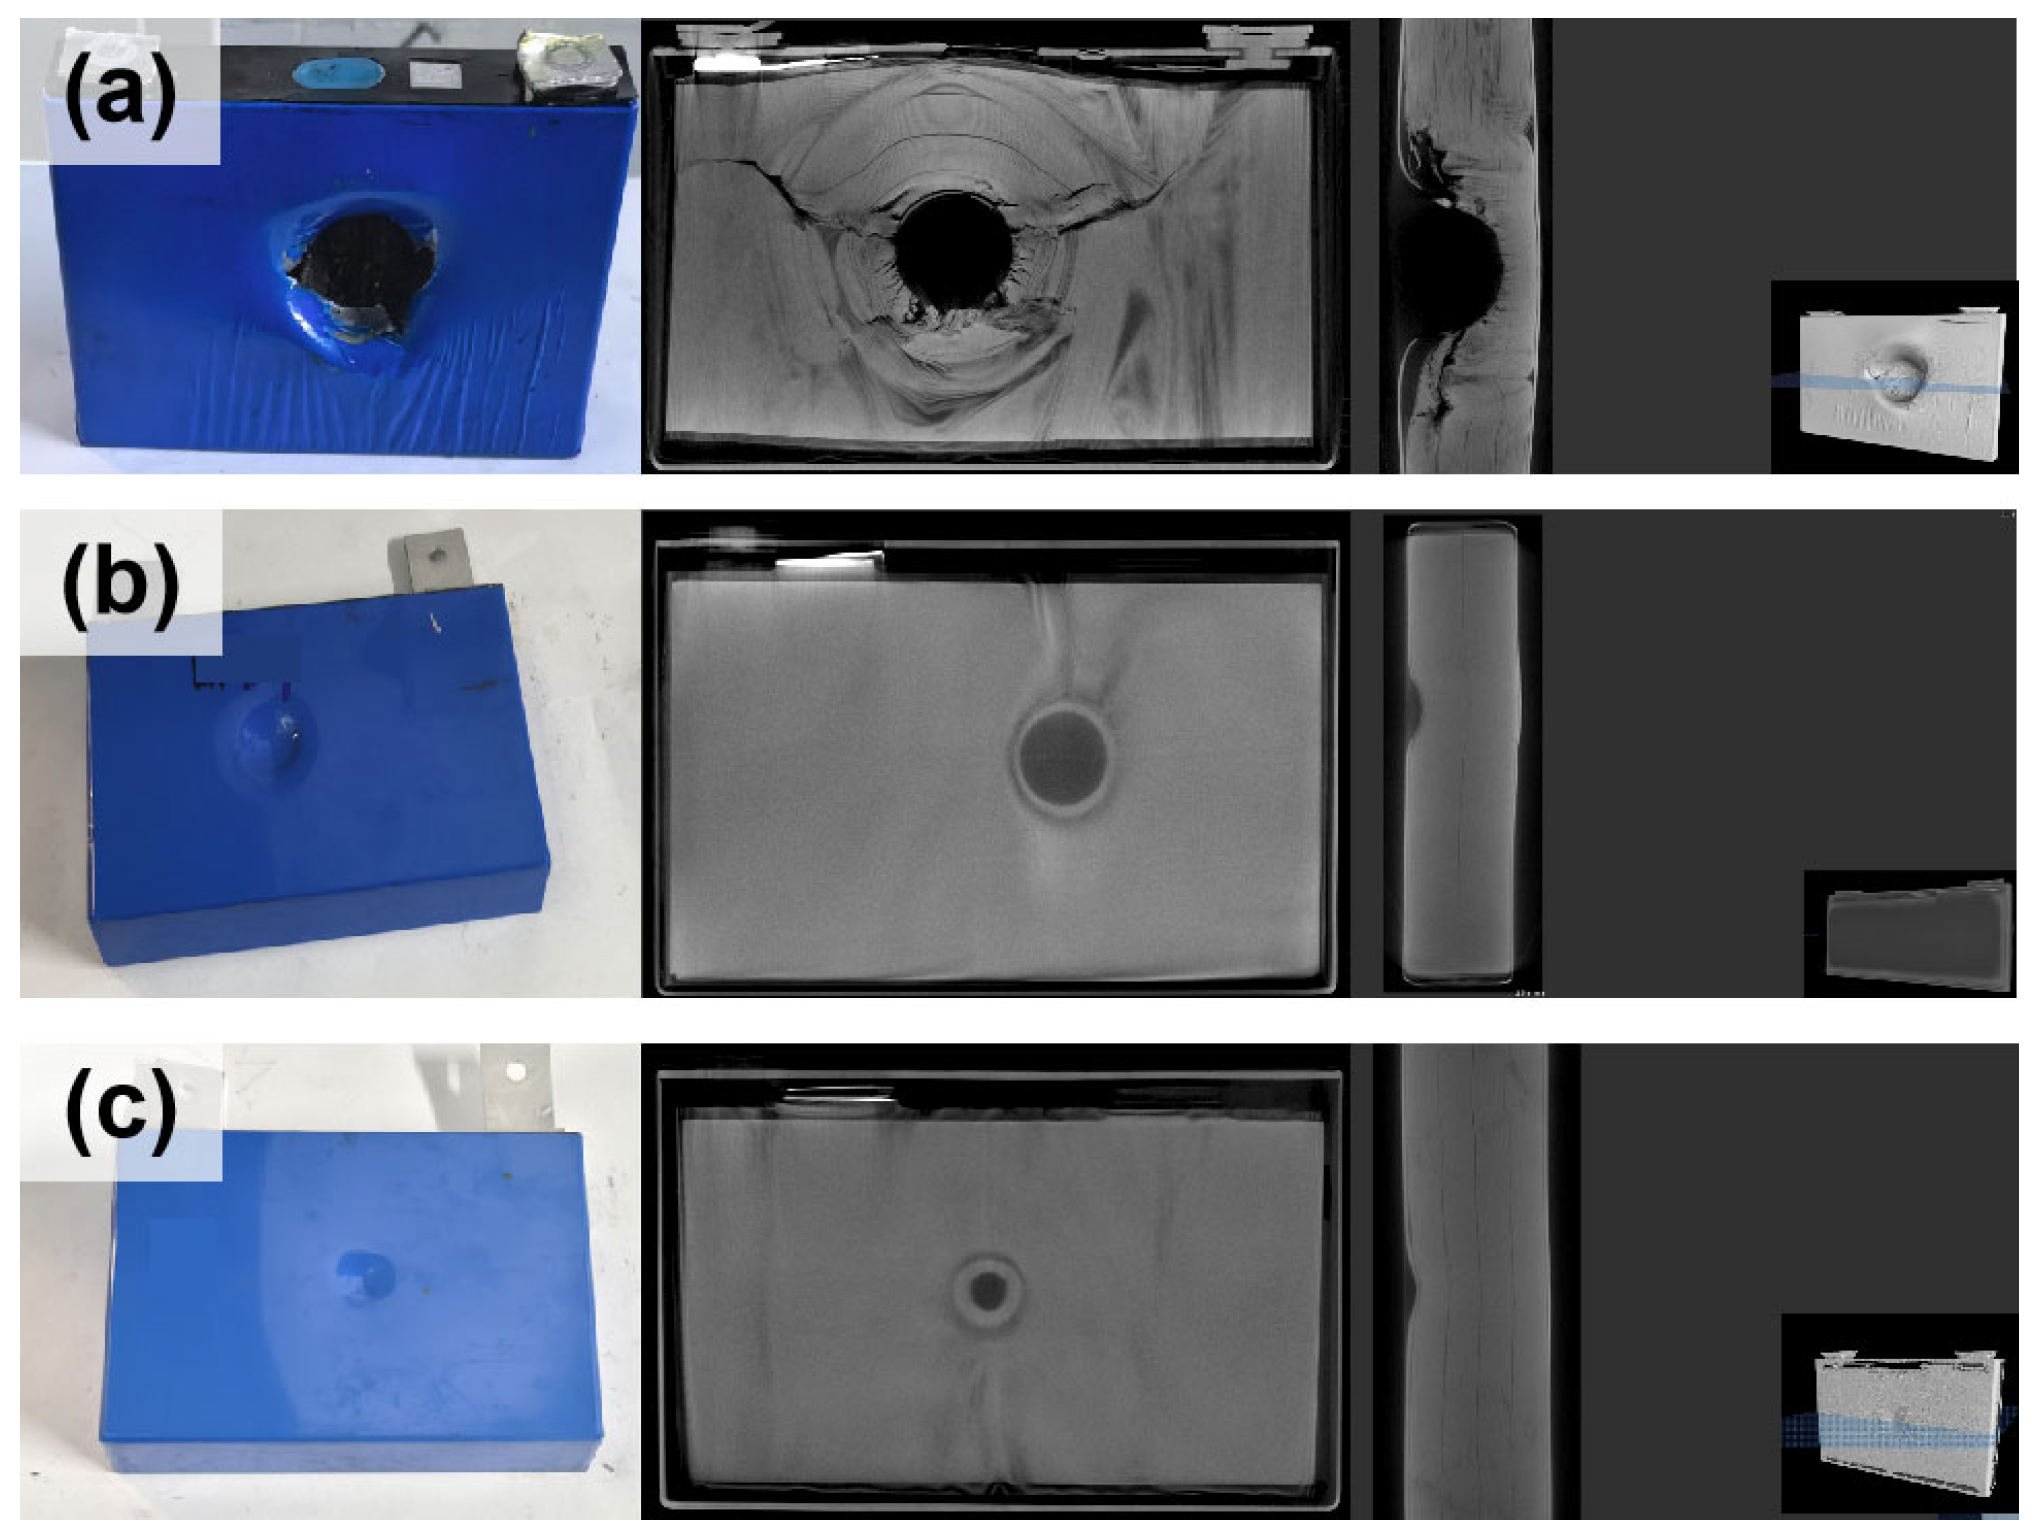
As shown in Figure 8, Battery 1 exhibited extensive shell rupture and internal cell cracking in an X-radiating pattern. Lateral CT images revealed that the compression nearly penetrated the entire battery, with the remaining regions compacted to a high-density state. Battery 2 (moderate damage, 5 mm compression) displayed obvious surface pits, and CT scans clearly showed electrode wrinkling and indentations—with minimal impact on other electrode areas. Battery 3 (minor damage, 3 mm compression) had significantly smaller surface pits compared to Batteries 1 and 2. CT results indicated only slight electrode indentation at the contact point, with intact overall electrode alignment and the least influence on non-contact regions. Collectively, these observations demonstrate that under mechanical compression of increasing severity, the battery casing progressively ruptures, and internal electrodes experience gradual compaction (i.e., increasing densification). Ultimately, the electrode material strength is exceeded, resulting in widespread fracture failure.
Figure 8.
Comparison of CT scanning results for damaged batteries. (a) Diagram of Battery No.1 results; (b) diagram of Battery No.2 results; (c) diagram of Battery No.3 results.
3.6. Capacity Characteristic Analysis
Mechanical compression damage can lead to electrode-current collector delamination, solid electrolyte interphase (SEI) film rupture, and inadequate electrolyte wetting. Conversely, cycling at low current densities facilitates the uniform reformation of a passivating SEI film, thereby sealing interfacial gaps at propagated electrode microcracks. This process partially repairs interfacial damage, reactivates electrode materials, identifies potential safety hazards, and calibrates the true electrochemical performance of the battery. The underlying mechanism lies in the slow ion migration and interfacial reconstruction under low-polarization conditions, which re-establishes effective mass transfer and electron conduction pathways between the electrode and electrolyte [28].
To mitigate the interference from initial irreversible capacity loss caused by damage and acquire accurate data on the true capacity, Coulombic efficiency, and cycle stability of damaged batteries, direct high-current cycling was avoided (as it exacerbates polarization at damaged sites). Instead, the compression-damaged lithium iron phosphate (LFP) batteries were subjected to 0.05 C low-current charge–discharge cycling post-experiment. The low rate enables sufficient Li+ intercalation and deintercalation into/out of the LFP lattice, breaking up active material agglomeration or surface passivation induced by mechanical compression. Low polarization promotes full electrolyte wetting: the ultra-low current density corresponding to 0.05 C significantly reduces the polarization potential on the electrode surface, minimizes electrolyte decomposition side reactions, and allows the electrolyte to fully penetrate into the micropores and cracks generated by compression—eliminating “electrolyte contact blind zones.” Compression damage may cause LFP particle agglomeration, lattice microdistortion, or detachment of electrodes from conductive agents/binders. Under low current, the mild electric field enables Li+ to slowly penetrate the damaged passivation layer on particle surfaces, re-establishing a continuous transport pathway of “electrolyte-Li+-active particles-conductive agent-current collector.” During the slow electrochemical reaction, the two-phase transition between LiFePO4 and FePO4 is more complete, which reduces internal stress concentration in particles, avoids secondary fragmentation of damaged particles, and promotes uniform SEI film deposition at damaged interfaces. Collectively, these effects lower Li+ transport resistance in subsequent cycles, restore the electrochemical activity of electrode materials, and enhance crystal structure and interfacial stability.
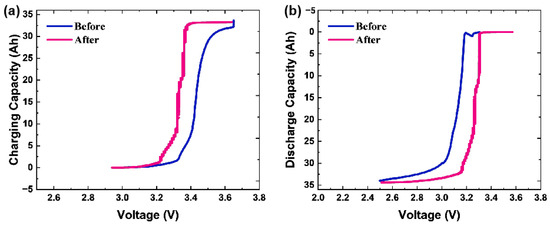
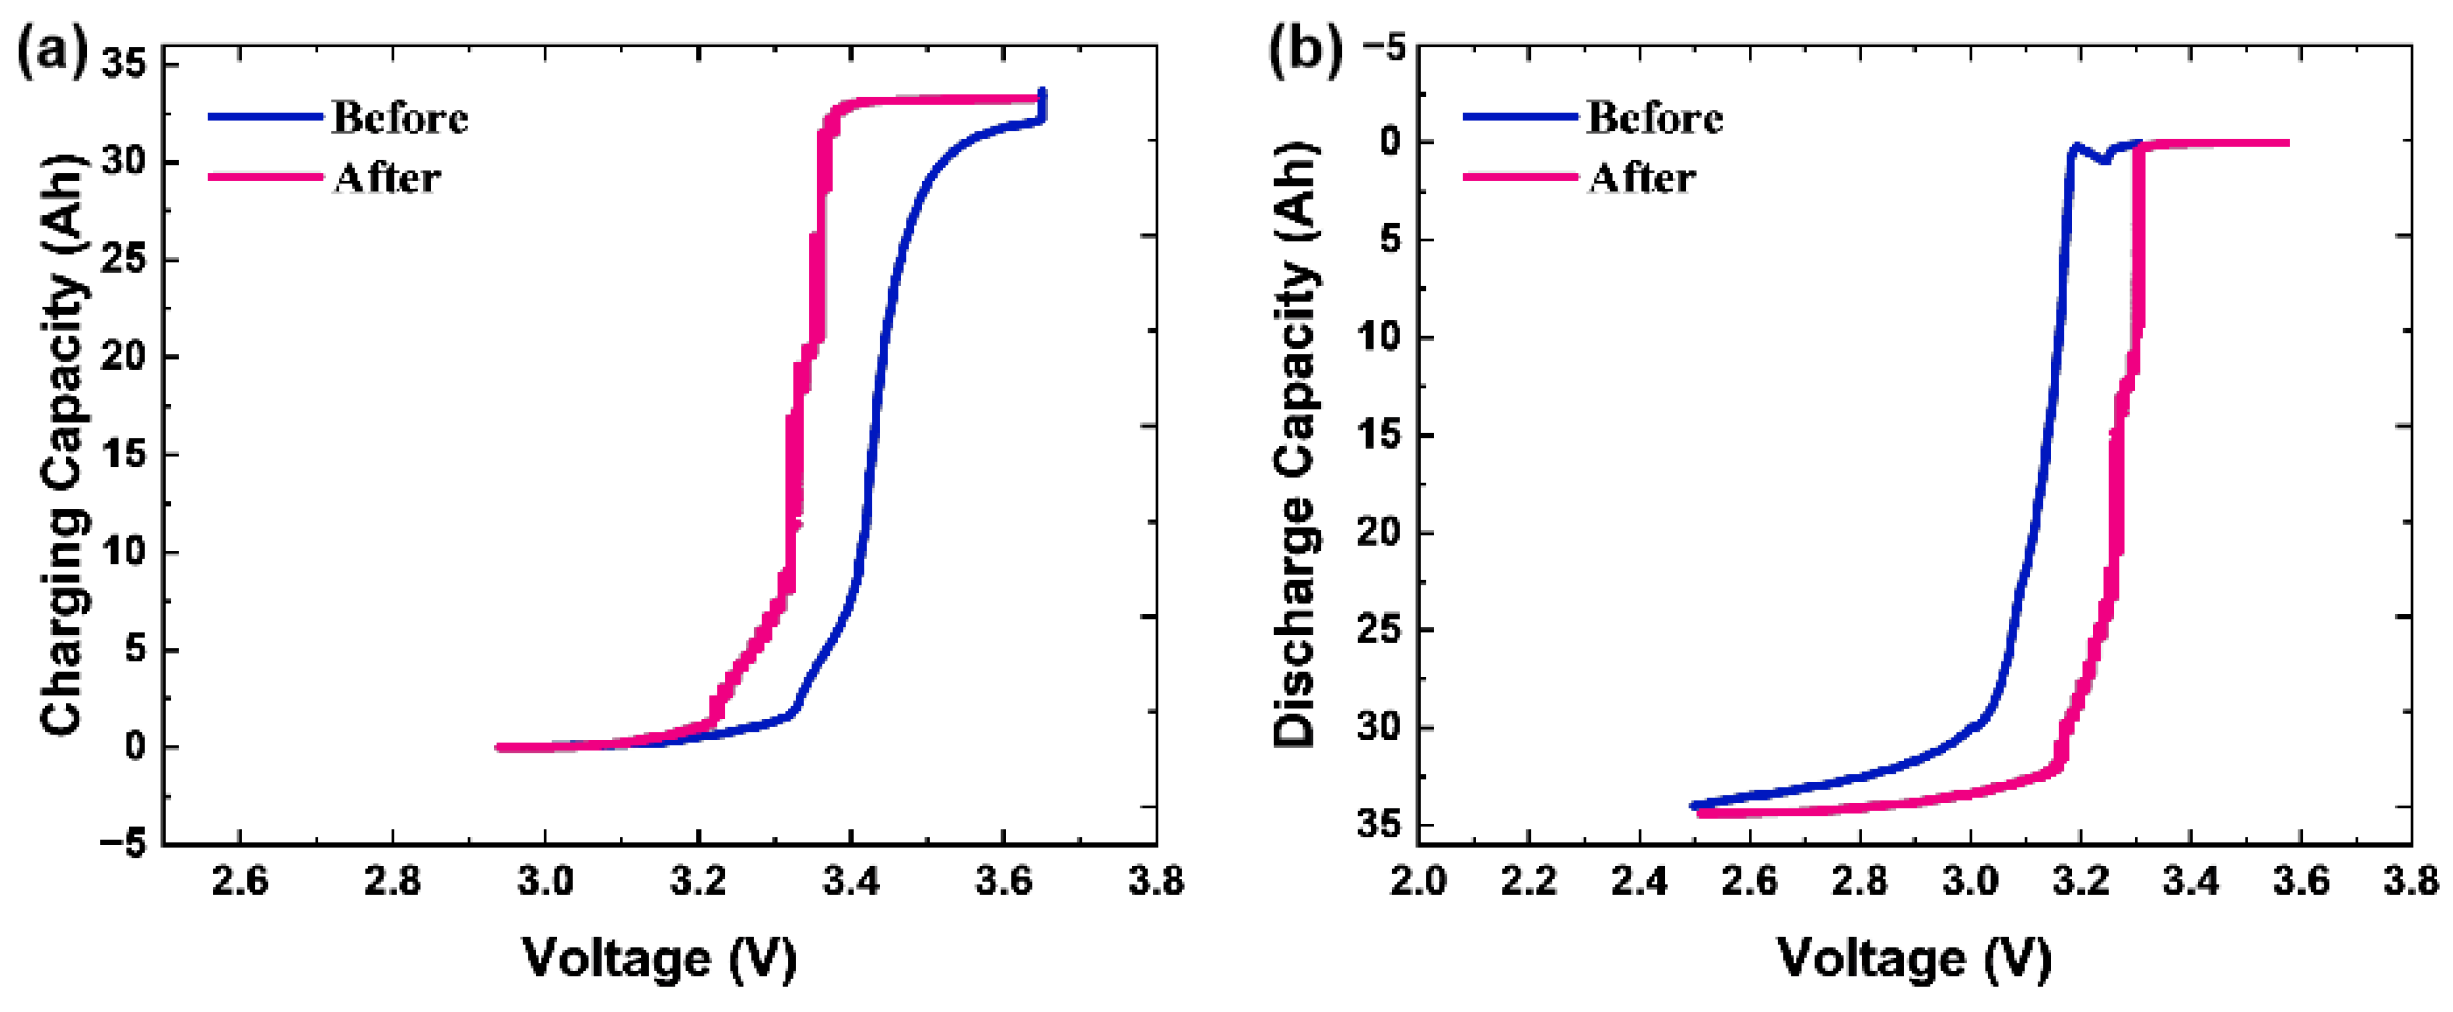
The test protocol for Battery 2 (moderate damage) was as follows: first, discharged from 30% SOC to 0% SOC at 1 C, rested for 30 s, subsequently charged to 100% SOC at 0.05 C, rested for 30 s, and finally discharged to 0% SOC at 0.05 C with another 30 s rest period. As shown in Figure 9, the pre-damage terminal charging curve of Battery 2 was relatively smooth, with capacity gradually increasing as voltage rose. After compression damage, the charging capacity plateaued at 3.38 V and remained unchanged despite continued voltage elevation to the charge cut-off voltage. The damaged battery exhibited a faster charging characteristic, with premature capacity saturation at a lower voltage. During discharge, the capacity of the moderately damaged Battery 2 dropped sharply immediately after the start of discharge: at 3.2 V, the capacity had decreased by 32 Ah, which was significantly lower than the pre-damage state. The damaged battery also showed a faster discharge behavior, further confirming significant capacity degradation induced by compression. This degradation is attributed to compression-induced direct damage to internal electrode structures, interfacial properties, and ion transport channels: porous structure collapse reduces active material utilization and causes abrupt changes in polarization behavior. Compression leads to local electrolyte enrichment or depletion; separator compression reduces pore size, temporarily shortening ion migration paths. Post-damage, reduced separator thickness and increased defects significantly lower Li+ transport resistance across interfaces, accelerating ion intercalation and deintercalation during charge–discharge. During charging, Li+ primarily intercalates into the surface layers of active particles; during discharge, Li+ readily deintercalates into the electrolyte without significant diffusion into the particle bulk, completing the circuit externally—which manifests as accelerated charge–discharge rates.
Figure 9.
Charge–discharge capacity changes of the battery before and after moderate compression damage. (a) Relationship diagram between charging capacity and voltage variation; (b) relationship diagram between discharge capacity and voltage variation.
3.7. Disassembly Analysis
Mechanical abuse can induce latent internal structural damage, such as separator rupture and electrode misalignment. Active material detachment may lead to “dead lithium” formation, increasing the risk of lithium dendrite growth and further exacerbating internal short circuits (ISCs). Electrode misalignment causes localized current density inhomogeneity, facilitating “hotspot” generation during charging and accelerating separator aging. Electrolyte leakage exceeds results in reduced ionic conductivity and subsequent capacity degradation. SEI film rupture exposes negative electrode active materials to the electrolyte, triggering the formation of an unstable new SEI film and leading to “abrupt capacity loss” [29]. These covert issues cannot be comprehensively identified through visual inspection or conventional electrochemical tests, thereby necessitating in-depth post-mortem analysis. The CT scan was performed to non-destructively observe the internal structural damage of the battery cell after mechanical impact, which showed the internal damage distribution inside the cell.
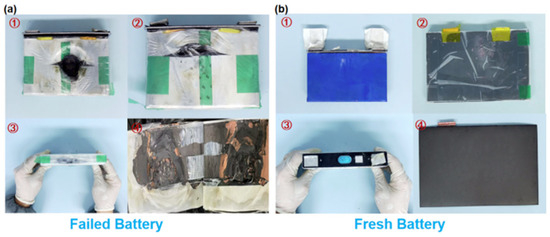
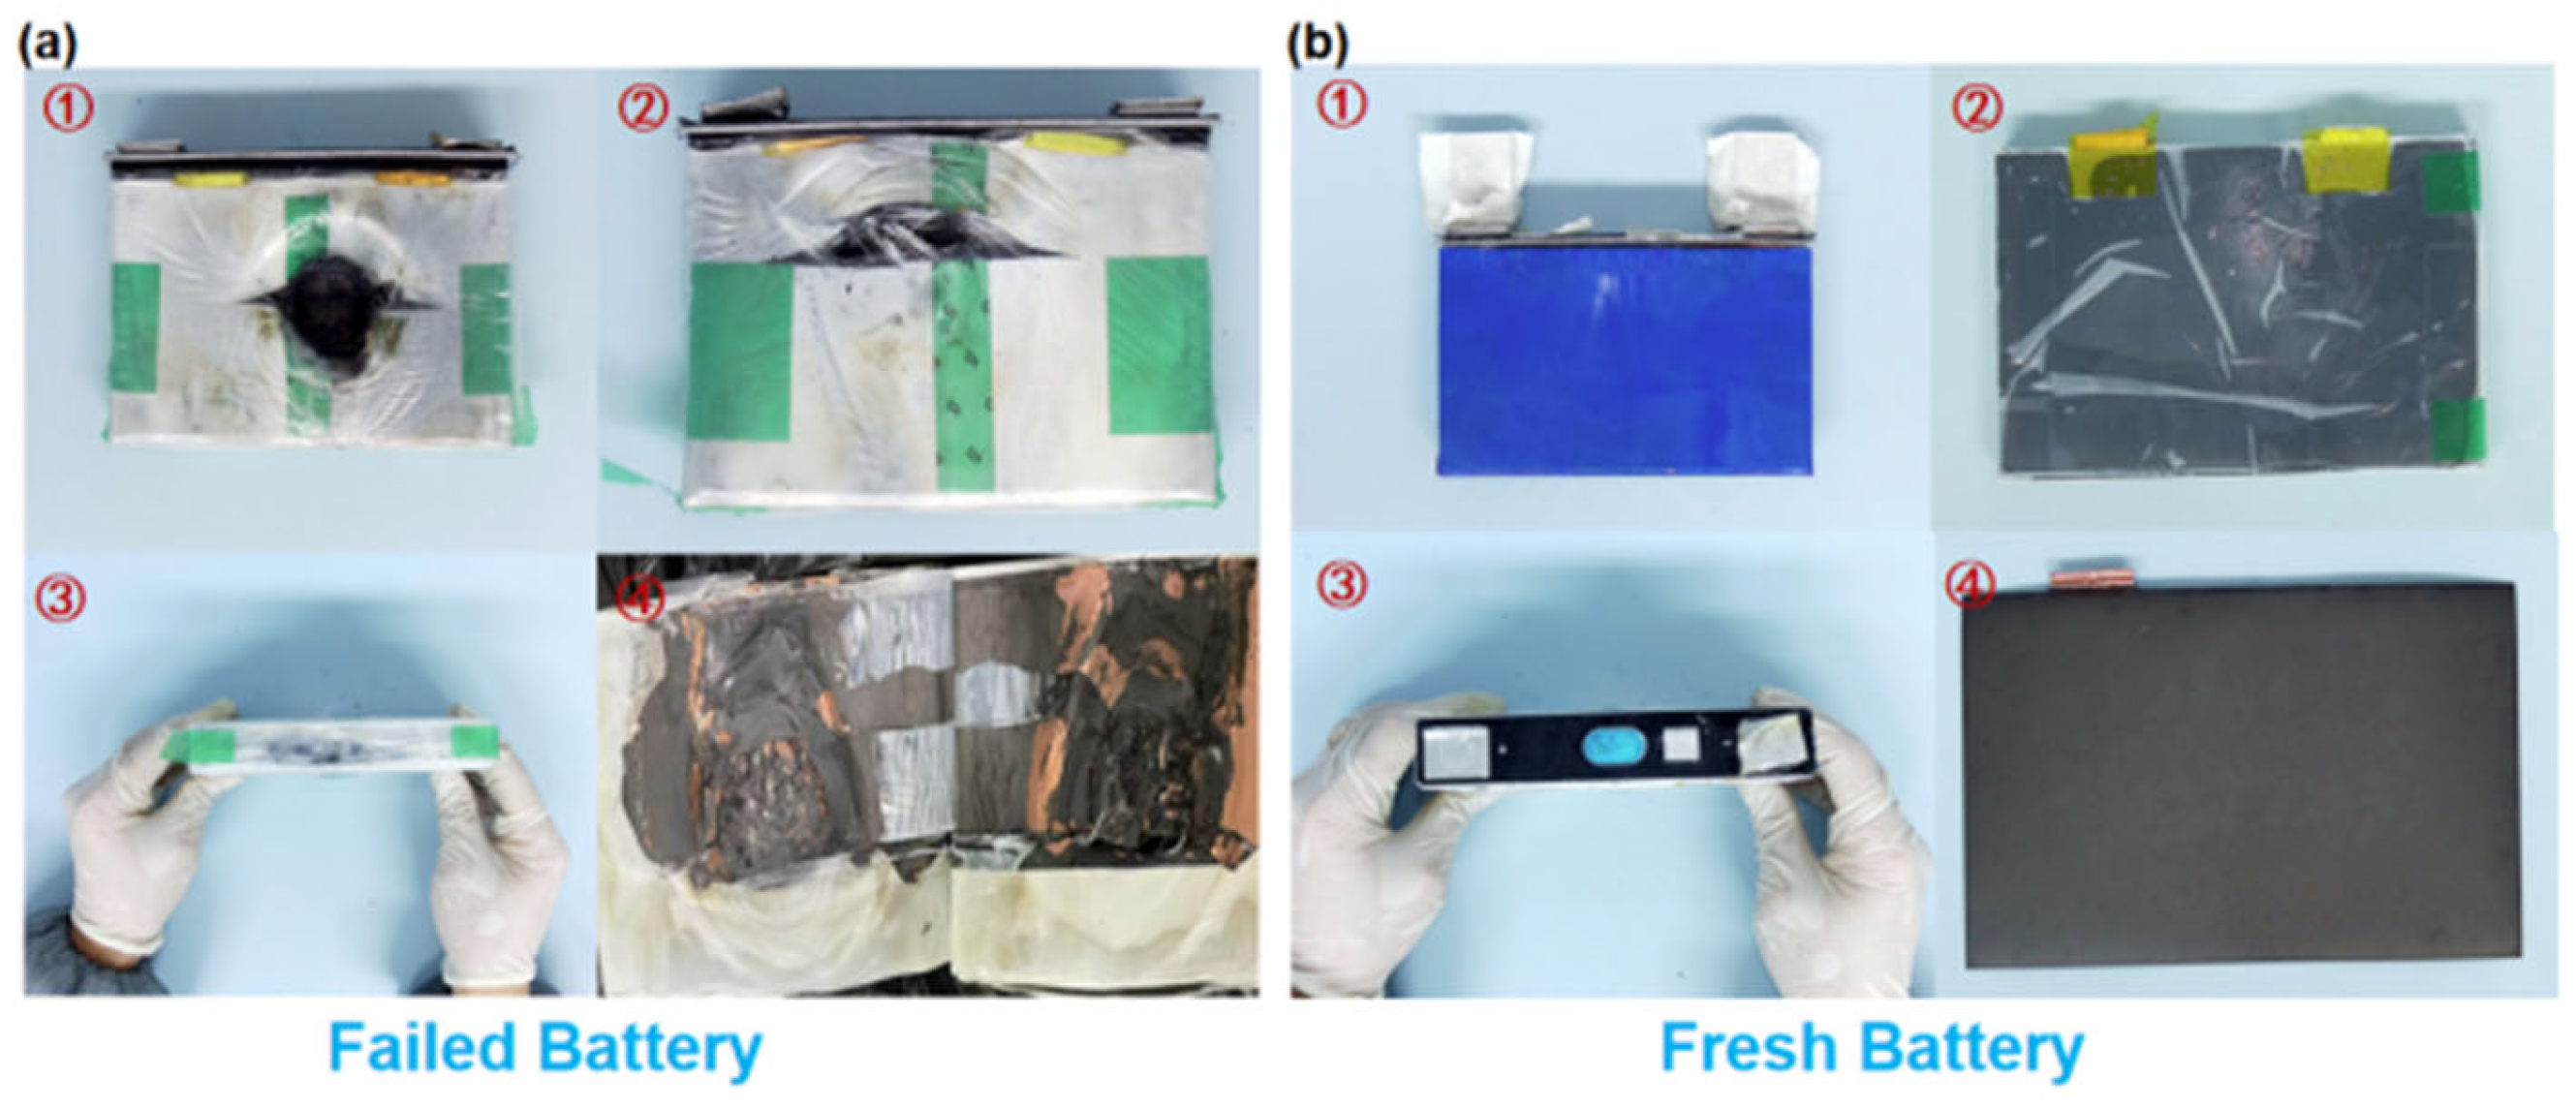
The compression-damaged batteries were first fully discharged to 0% state of charge (SOC), which can avoid the risk of high-current short circuits between the positive and negative electrodes during disassembly. After discharging, the batteries were rested for 2 h. A screwdriver was used to remove the cover plate screws, and a plastic pry bar was inserted into the side gap of the shell. To prevent further shell deformation and secondary damage to internal components, uniform and gentle force was applied during prying, followed by extraction of the cell core. Disassembly analysis and comparison were conducted on Battery 1 and Battery 3 as shown in Figure 10. Figure 10a shows the disassembly results due to thermal runaway failure; from 1 to 4 are the results of the overall damage morphology of the shell after disassembly, the disassembly of the battery under compression near the fixed back plate, the side state of the battery, and the damage to the pole pieces. Figure 10b shows the disassembly results of the fresh battery; from 1 to 4 are the results of the blue film, separator, side, and intact pole pieces.
Figure 10.
Internal damage morphology after disassembly. (a) Image display of battery disassembly results due to thermal runaway failure; (b) fresh battery disassembly result.
Battery 1 exhibited severe internal cell damage due to shell rupture. Mechanical compression-induced shell deformation led to extensive electrode tearing, intense internal electrochemical reactions, and post-combustion blackening. In contrast, Battery No. 3 showed only slight electrode indentations. Electrode wrinkling blocks lithium-ion transport channels, resulting in capacity loss. Moreover, electrode compression can induce crystal structure distortion or particle fragmentation of the cathode material, directly diminishing active material utilization and causing permanent capacity fade. Detached active material particles may subsequently penetrate the separator, thereby aggravating internal short circuits (ISCs).
3.8. Differential Scanning Calorimetry
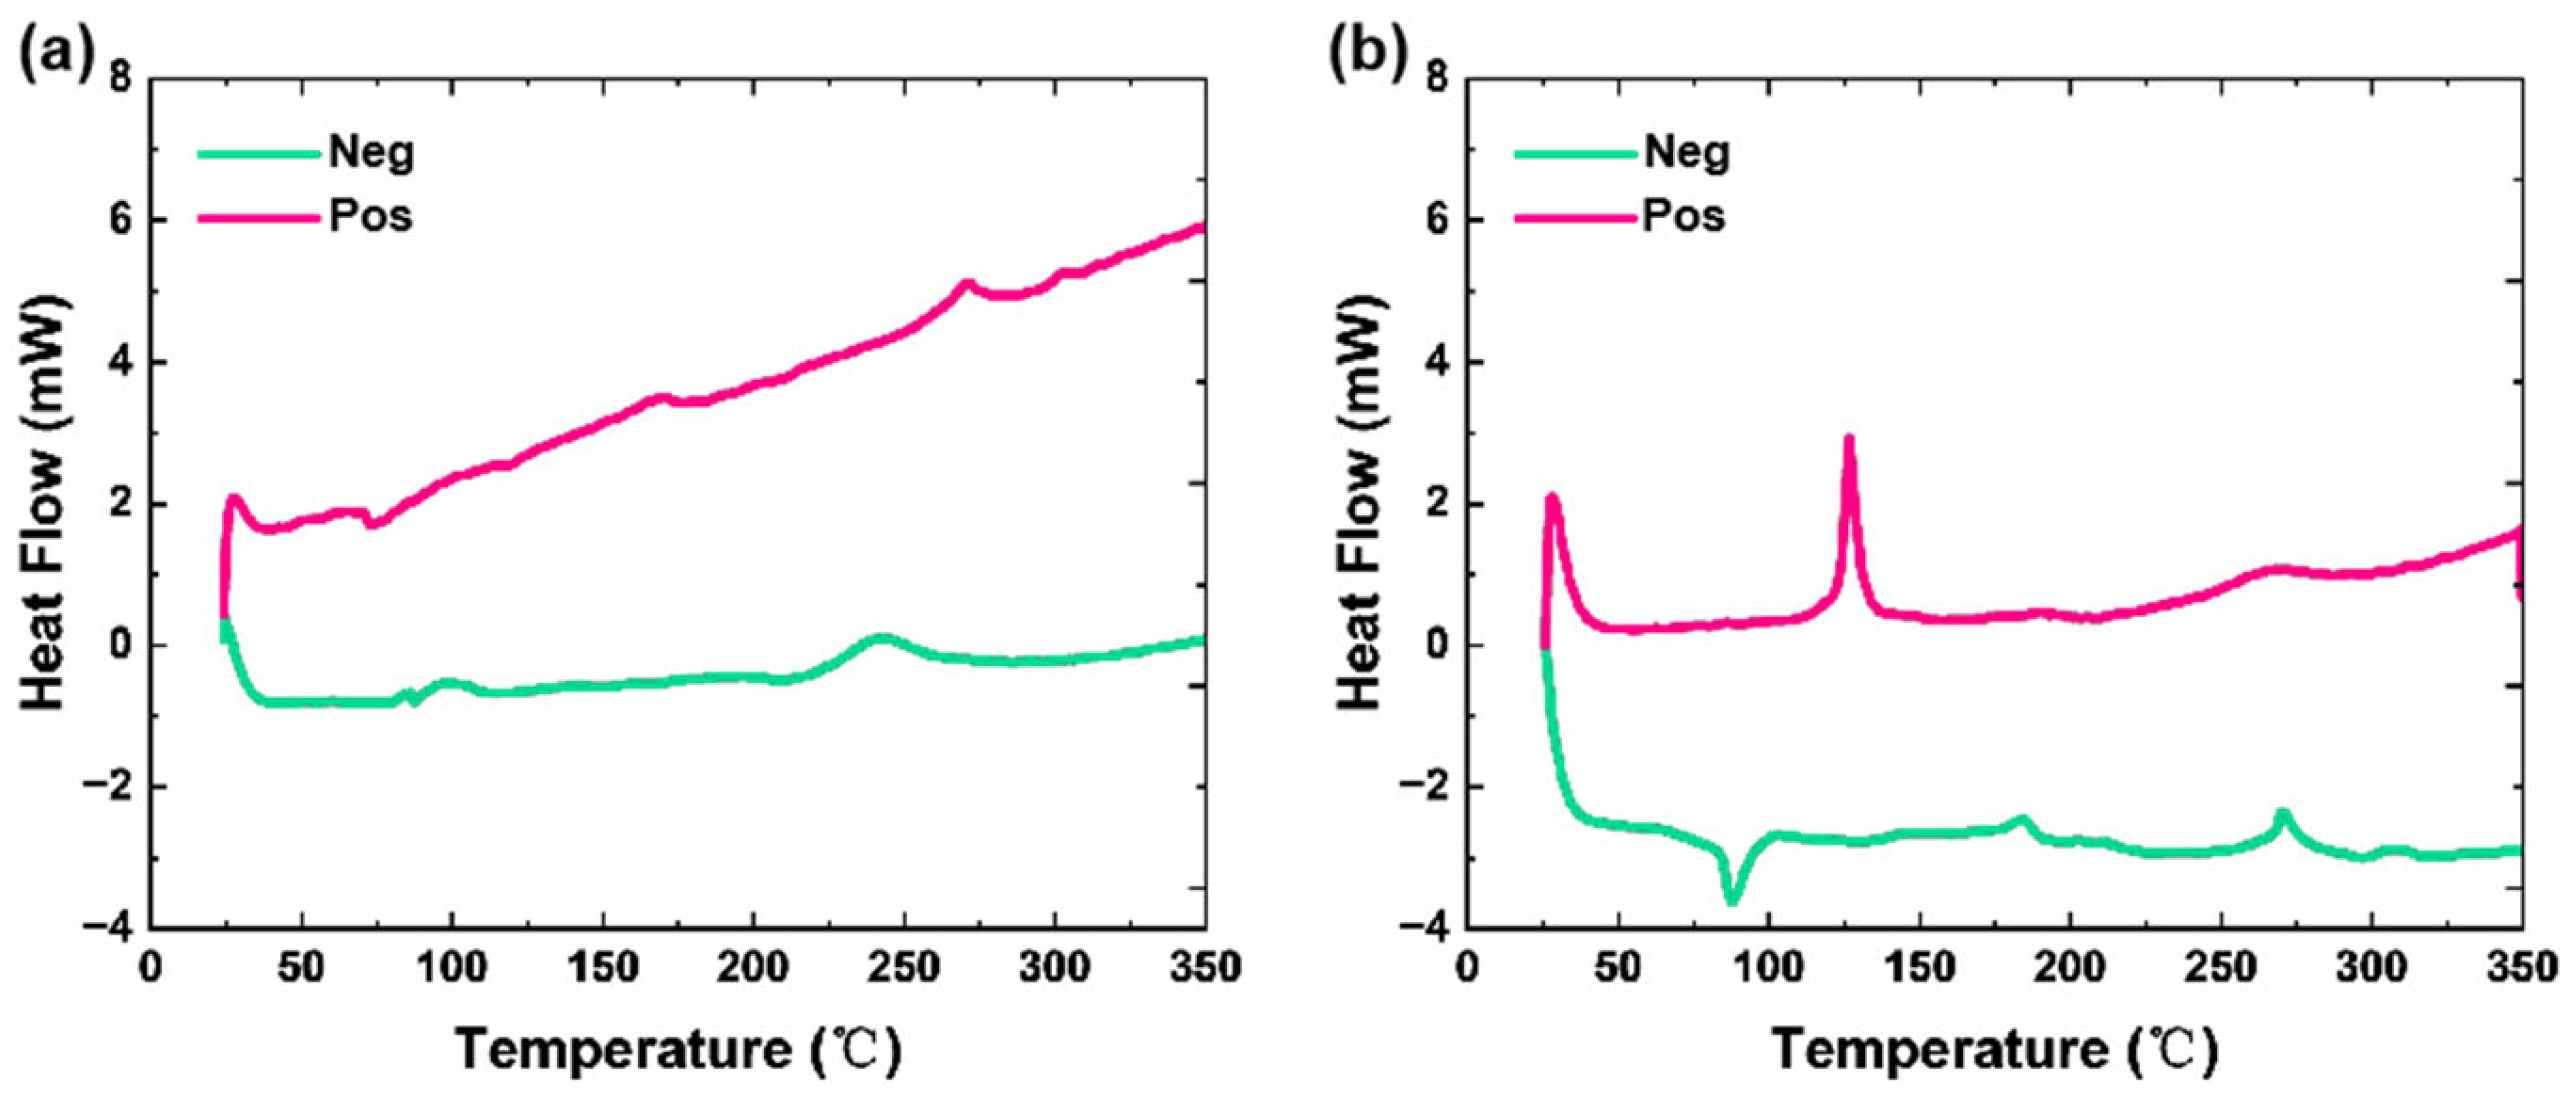
The primary aim of differential scanning calorimetry (DSC) testing for mechanically compressed batteries is to monitor “heat flow differences” during temperature ramps or isothermal holding, correlate internal thermal behavior with electrochemical reactions, and evaluate thermal safety, thermal stability, and thermal performance limits. This yields essential insights for battery design, process optimization, and safety control. Under abuse conditions, batteries undergo a series of exothermic reactions, including active material phase transition, electrolyte decomposition, and solid electrolyte interphase (SEI) film fracture and regeneration. DSC testing provides precise quantification of the “temperature thresholds” and “exothermic intensity” of these reactions, effectively translating the battery’s “microscopic thermal behavior” into quantifiable “macroscopic thermal parameters” to assess thermal risks and material stability under various operating conditions [30,31]. The onset exothermic temperature (T0)—“start-up threshold of thermal risk”—is used to monitor the critical temperature at which a cell transitions from exhibiting “no significant thermal effect” to “initiating continuous heat release.” This parameter serves as the core indicator for determining the “early warning line” of thermal runaway. If a cell exhibits an onset exothermic temperature of only 80 °C at SOC = 100%, it indicates poor thermal stability and a high likelihood of premature heat release during high-temperature storage or fast charging. The peak exothermic temperature (Tp)—representing the “maximum intensity of the thermal reaction”—is used to monitor the temperature corresponding to the peak heat flow during the exothermic process. It reflects the “most intense moment” of the internal exothermic reaction within the cell and serves as a key parameter for evaluating the “explosive intensity” of thermal runaway. For normal cells, the peak exothermic temperature typically falls within the range of 150–250 °C, depending on the material. If a cell exhibits a peak exothermic temperature below 150 °C accompanied by an extremely high peak heat flow, it indicates a more intense thermal runaway reaction, which is more likely to trigger fire or explosion. The total heat release from the onset to the completion of the exothermic reaction can be calculated by integrating the area under the exothermic peak on the DSC curve. The unit is typically expressed as J/g (based on the mass of active material) or J/cell (based on a single cell). The total heat release directly correlates with the severity of hazards following thermal runaway; the greater the heat release, the higher the probability of thermal propagation, where the failure of one cell initiates combustion in adjacent cells.
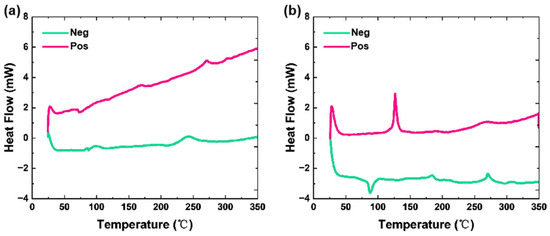
As shown in Figure 11, two types of test samples were prepared, (1) positive electrode material + electrolyte and (2) negative electrode material + electrolyte, each sealed in hermetically sealed high-pressure crucibles. DSC tests were conducted in a nitrogen-purged chamber with the following parameters: initial temperature = 25 °C, heating rate = 4 °C/min, and target temperature = 350 °C. Figure 11a,b presents the DSC results for Battery 1 and Battery 3, respectively. For Battery No. 1, the positive electrode exhibited exothermic peaks at 165 °C and 265 °C, while the negative electrode showed peaks at 100 °C and 246 °C. For Battery No. 3, the positive electrode displayed exothermic peaks at 126 °C and 269 °C, and the negative electrode at 165 °C and 266 °C. Notably, the exothermic peak intensity of both electrodes in Battery No. 1 was significantly lower than that in Battery No. 3. This is attributed to severe electrochemical reactions and substantial loss of active material in Battery No. 1 during compression-induced TR. Overall, the exothermic peak intensity decreases with increasing damage severity, as mechanical compression-induced structural destruction compromises the active material’s capacity for exothermic activity.
Figure 11.
DSC test results for batteries with different damage severities. (a) Results of positive (Pos) and negative (Neg) electrodes of Battery 1; (b) Results of positive (Pos) and negative (Neg) electrodes of Battery 3.
3.9. X-Ray Diffraction
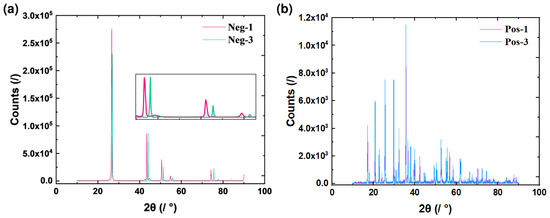
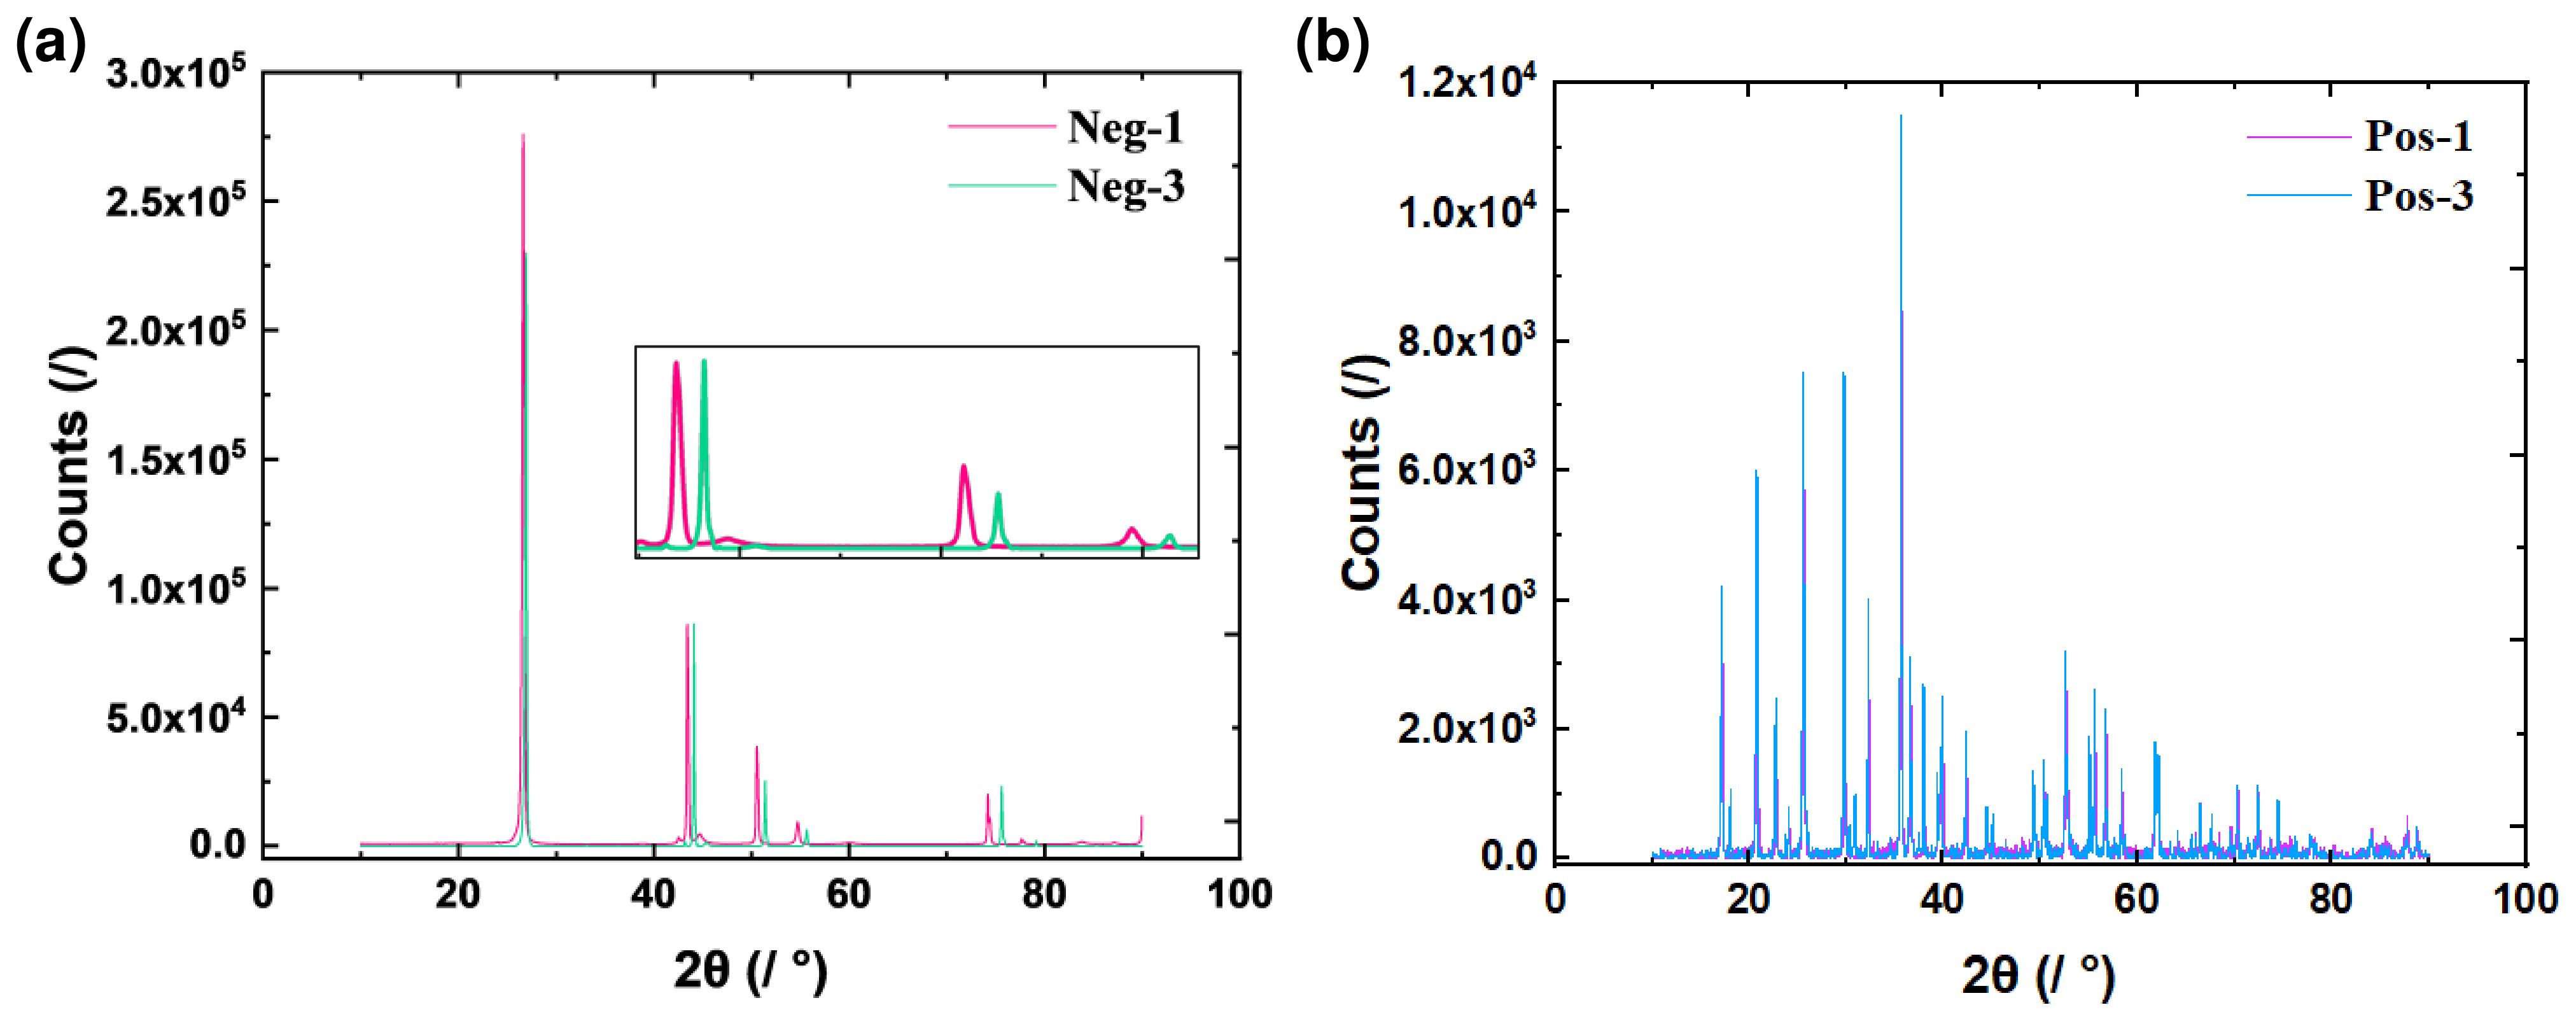
After mechanical extrusion damage, X-ray diffraction (XRD) testing is performed on the battery cell. As shown in Figure 12, XRD tests were performed on the damaged batteries. Figure 12a presents a comparison of the anode XRD results. The diffraction patterns at different angles indicate that the diffraction peaks of the severely damaged battery shift to the left. With increasing diffraction angle, the peak intensity gradually decreases and the degree of deviation increases progressively. Figure 12b shows the cathode XRD comparison results, where no significant differences in diffraction peaks were observed between damaged and undamaged samples. Peak broadening and intensity reduction are associated not only with grain size but also with internal crystalline defects (e.g., dislocations, stacking faults). The left shift of the peak indicates an increase in the interlayer spacing of graphite, which is caused by mechanical stress-induced lattice expansion. The decreased intensity at higher angles is due to the formation of micro-cracks and structural disorder in the graphite particles [32,33]. These microstructural changes may be some evidence of the mechanical damage caused by the impact, which ultimately leads to the degradation of the anode performance. Analysis of changes in peak shape enables qualitative or semi-quantitative assessment of material defect density.
Figure 12.
XRD patterns of electrode materials. (a) Results of positive (Pos) and negative (Neg) electrodes of Battery 1 that was damaged; (b) results of positive (Pos) and negative (Neg) electrodes of the undamaged Battery 3.
Based on the analysis of the above damage results, the main findings are shown in Table 2 below.
Table 2.
Summary of main findings.
4. Conclusions
This study investigates the mechanical crush damage scenario of prismatic lithium-ion batteries. Through experimental investigation and refined mechanical simulation modeling, it further elucidated the response characteristics of key parameters during the thermal runaway process triggered by structural damage.
Regarding damage and failure characteristics, we can intuitively observe that the force signal during the testing process, a sudden load drop accompanied by casing rupture occurred at a displacement of 8 mm, while thermal runaway with smoke emission was observed at 17 mm. In failure simulation, based on CT scanning results, the refined simulation model effectively reproduced the morphology of damage and fracture, as well as the relationship between damage state and displacement. Both experimental and simulation results exhibited earlier warning features of load response. During the discharge process, as the voltage decreased from 3.65 V to 3.2 V, the damaged battery exhibited a statistically significantly higher discharge capacity than the pristine undamaged battery. The battery structure exhibits certain differential patterns from different perspectives after mechanical damage, providing effective support for further analysis of the mechanical damage mechanism and safety performance evaluation of batteries.
In the future, the research will focus on developing a fully coupled mechanical–electrical–thermal model by integrating the refined mechanical model proposed in this study with the standard SOC-OCV model, which could enable more accurate evaluation of the impact of mechanical damage on battery electrical performance and provide a more comprehensive safety assessment framework for electric vehicle batteries.
Author Contributions
Conceptualization, P.Y. and T.M.; Methodology, P.Y. and F.W.; Software, P.Y.; Resources, F.W., T.M., L.C., G.H., L.H. and Z.S.; Data curation, P.Y.; Writing—original draft, P.Y.; Writing—review & editing, P.Y.; Supervision, P.Y., F.W., G.H. and T.M. All authors have read and agreed to the published version of the manuscript.
Funding
This research was funded by China Automotive Technology Research Center Youth Science and technology talent training project, grant number 25276309, the National Key R&D Program of China, grant number 2023YFB2504103 and 2024YFB2505004, and The APC was funded by 25276309.
Data Availability Statement
The data presented in this study are available on request from the corresponding author due to the restrictions of industrial data confidentiality.
Conflicts of Interest
Authors Pengfei Yan, Fang Wang, Tianyi Ma, Liduo Chen, Liqiong Han, and Zhipeng Sun were employed by the company China Automotive Technology and Research Center Co., Ltd. The remaining author declares that the research was conducted in the absence of any commercial or financial relationships that could be construed as a potential conflict of interest.
References
- Wang, H.; Wang, Q.; Zhao, Z.; Jin, C.; Xu, C.; Huang, W.; Yuan, Z.; Wang, S.; Li, Y.; Zhao, Y.; et al. Thermal runaway propagation behavior of the Cell-to-Pack battery system. J. Energy Chem. 2023, 84, 162–172. [Google Scholar] [CrossRef]
- Camacho, D.L.N.; Martínez, J.; Gómez, J.R.; Gómez, M. Hydrogen fuel cell heavy-duty trucks: Review of main research topics. Int. J. Hydrogen Energy 2022, 47, 29505–29525. [Google Scholar] [CrossRef] [Scilit]
- Zhang, Q.; Shang, Y.; Li, Y.; Zhu, R. A Concise Review of Power Batteries and Battery Management Systems for Electric and Hybrid Vehicles. Energies 2025, 18, 3750. [Google Scholar] [CrossRef] [Scilit]
- Ding, Y.; Zheng, Y.; Li, S.; Dong, T.; Gao, Z.; Zhang, T.; Li, W.; Shun, R.; Yang, X.; Chen, Y.; et al. A review of battery thermal management methods for electric vehicles. J. Electrochem. Energy Convers. Storage 2022, 20, 021002. [Google Scholar] [CrossRef] [Scilit]
- Chen, P.; Xia, Y. Damage assessment method of battery pack of electric vehicle in undercarriage collision. In Proceedings of the ASME 2021 International Mechanical Engineering Congress and Exposition, Virtual, 1–5 November 2021; ASME: New York, NY, USA, 2021. [Google Scholar] [CrossRef] [Scilit]
- Zhang, S.A.; Zhou, Q.; Xia, Y. Influence of mass distribution of battery and occupant on crash response of small lightweight electric vehicle. In SAE 2015 World Congress & Exhibition; SAE Technical Paper 2015-01-0575; SAE International: Warrendale, PA, USA, 2015. [Google Scholar] [CrossRef] [Scilit]
- Luo, W.; Zhang, S.; Gao, Y.; Shen, C. Review of mechanisms and detection methods of internal short circuits in lithium-ion batteries. Ionics 2025, 31, 3945–3964. [Google Scholar] [CrossRef] [Scilit]
- Li, H.; Zhou, D.; Cao, J.; Xia, Y.; Xue, Q.; Zhao, Z. On the damage and performance degradation of multifunctional sandwich structure embedded with lithium-ion batteries under impact loading. J. Power Sources 2023, 581, 233509. [Google Scholar] [CrossRef] [Scilit]
- Chai, Z.; Liu, Z.; Xue, Q.; Xiao, Y.; Tan, P.; Qiu, M.; Li, J. Efficient Coupled Mechanical-Electrical-Thermal Modeling and Safety Assessment of Lithium-Ion Battery under Mechanical Abuse. J. Energy Storage 2025, 114, 115917. [Google Scholar] [CrossRef] [Scilit]
- Wang, R.; Liu, G.; Wang, C.; Xia, Y.; Xue, Q.; Zhao, Z. A comparative study on mechanical-electrical-thermal characteristics and failure mechanism of LFP/NMC/LTO batteries under mechanical abuse. eTransportation 2024, 22, 100359. [Google Scholar] [CrossRef] [Scilit]
- Song, D.; Chen, X.; Wang, T.; Xia, Y.; Xue, Q.; Zhao, Z. Investigation of the mechanical response and modeling of prismatic lithium-ion batteries upon abusive loading. J. Energy Storage 2024, 113, 114489. [Google Scholar] [CrossRef] [Scilit]
- Zhu, J.; Li, W.; Wierzbicki, T.; Sahraei, E. Deformation and failure of lithium-ion batteries treated as a discrete layered structure. Int. J. Plast. 2019, 121, 293–311. [Google Scholar] [CrossRef] [Scilit]
- Wang, R.; Liu, G.; Wang, C.; Xia, Y.; Xue, Q.; Zhao, Z. Multiaxial failure characterization and short-circuit prediction of large-format prismatic lithium-ion batteries. Appl. Energy 2026, 402, 126963. [Google Scholar] [CrossRef] [Scilit]
- Xing, B.; Xiao, F.; Korogi, Y.; Ishimaru, T.; Xia, Y. Direction-dependent mechanical-electrical-thermal responses of large-format prismatic Li-ion battery under mechanical abuse. J. Energy Storage 2021, 43, 103270. [Google Scholar] [CrossRef] [Scilit]
- GB 38031-2025; Electric Vehicles Traction Battery Safety Requirements. National Standard of the People’s Republic of China: Beijing, China, 2025. Available online: https://openstd.samr.gov.cn (accessed on 28 March 2025).
- Zhang, C.; Santhanagopalan, S.; Sprague, M.A.; Pesaran, A.A. Coupled mechanical-electrical-thermal modeling for short-circuit prediction in a lithium-ion cell under mechanical abuse. J. Power Sources 2015, 290, 102–113. [Google Scholar] [CrossRef] [Scilit]
- Zhao, Z.; Lv, Q.; Cai, Y.; Xia, Y.; Xue, Q.; Zhou, D. On the strain-rate dependent compressive failure behavior of 2.5D woven composites. Int. J. Impact Eng. 2024, 188, 104944. [Google Scholar] [CrossRef] [Scilit]
- Qu, Y.; Xing, B.; Xia, Y.; Xue, Q.; Zhao, Z.; Zhou, D. How does room temperature cycling ageing affect lithium-ion battery behaviors under extreme indentation. eTransportation 2024, 20, 100331. [Google Scholar] [CrossRef] [Scilit]
- Lei, E.; Gong, H.; Zhang, J.; Luo, W.; Ma, K.; Jin, L.; Chen, Z. Impact of lithium plating on the electrothermal stability in battery systems. Guangdong Electr. Power 2024, 37, 54–62. [Google Scholar] [CrossRef]
- Wang, L.; Chen, J.; Li, J.; Xia, Y.; Xue, Q.; Zhao, Z. A novel anisotropic model for multi-stage failure threshold of lithium-ion battery subjected to impact loading. Int. J. Mech. Sci. 2022, 236, 107757. [Google Scholar] [CrossRef] [Scilit]
- Zhang, N.; Mei, W.; Li, Y.; Feng, X.; Ouyang, M. Investigation on mechanical bending caused thermal runaway of lithium-ion cell. J. Energy Storage 2023, 68, 107688. [Google Scholar] [CrossRef] [Scilit]
- Lin, J.; Lim, J.-M.; Youn, D.H.; Liu, Y.; Cai, Y.; Kawashima, K.; Kim, J.-H.; Peng, D.-L.; Guo, H.; Henkelman, G.; et al. Cu4SnS4-rich nanomaterials for thin-film lithium batteries with enhanced conversion reaction. ACS Nano 2019, 13, 10671–10681. [Google Scholar] [CrossRef] [Scilit] [PubMed]
- Lee, C.-R.; Jeong, H.-Y. Development of headform impactor finite element model considering the hyperelastic and viscoelastic responses of rubber. Int. J. Automot. Technol. 2018, 19, 523–534. [Google Scholar] [CrossRef] [Scilit]
- Yu, F.; Zhang, L.; Li, Y.; An, Y.; Zhu, M.; Dai, B. Mechanism studies of LiFePO4 cathode material: Lithiation/delithiation process, electrochemical modification and synthetic reaction. RSC Adv. 2014, 4, 54576–54602. [Google Scholar] [CrossRef] [Scilit]
- Li, Z.; Chen, J.; Lan, F.; Zheng, W. Analysis and evaluation on system safety of power battery pack under mechanical loading. J. Mech. Eng. 2019, 55, 137–148. [Google Scholar] [CrossRef] [Scilit]
- Lan, F.; Zheng, W.; Li, Z.; Chen, J. Compression Load-Deformation Response and Internal Short Circuit Failure Analysis of Vehicle Powered Batteries. J. South China Univ. Technol. 2018, 46, 65–72. [Google Scholar] [CrossRef]
- Pietsch, P.; Wood, V. X-ray tomography for lithium ion battery research: A practical guide. Annu. Rev. Mater. Res. 2017, 47, 451–479. [Google Scholar] [CrossRef] [Scilit]
- Laresgoiti, I.; Käbitz, S.; Ecker, M.; Sauer, D.U. Modeling mechanical degradation in lithium ion batteries during cycling: Solid electrolyte interphase fracture. J. Power Sources 2015, 300, 112–122. [Google Scholar] [CrossRef] [Scilit]
- Li, J.-L.; Wang, Y.-N.; Sun, S.-Y.; Zheng, Z.; Gao, Y.; Shi, P.; Zhao, Y.-J.; Li, X.; Li, Q.; Zhang, X.-Q.; et al. Understanding and Regulating the Mechanical Stability of Solid Electrolyte Interphase in Batteries. Adv. Energy Mater. 2025, 15, 2402445. [Google Scholar] [CrossRef] [Scilit]
- Song, L.; Zheng, Y.; Xiao, Z.; Wang, C.; Long, T. Review on thermal runaway of lithium-ion batteries for electric vehicles. J. Electron. Mater. 2022, 51, 30–46. [Google Scholar] [CrossRef] [Scilit]
- Takagishi, Y.; Kitagawa, H.; Yamaue, T. Analytical Solution for Thermal Runaway of Li-Ion Battery with Simplified Thermal Decomposition Equation. Appl. Sci. 2025, 15, 6574. [Google Scholar] [CrossRef] [Scilit]
- Lin, C.; Tang, A.; Wu, N.; Xing, J. Electrochemical and Mechanical Failure of Graphite-Based Anode Materials in Li-Ion Batteries for Electric Vehicles. J. Chem. 2016, 2016, 2940437. [Google Scholar] [CrossRef] [Scilit]
- Zhao, H.; Wang, X.; Chen, S.; Li, H.; Wang, J. Understanding the Crack Formation of Graphite Particles in Cycled Commercial Lithium-Ion Batteries by Focused Ion Beam-Scanning Electron Microscopy. J. Power Sources 2017, 365, 235–239. [Google Scholar] [CrossRef] [Scilit]

Disclaimer/Publisher’s Note: The statements, opinions and data contained in all publications are solely those of the individual author(s) and contributor(s) and not of MDPI and/or the editor(s). MDPI and/or the editor(s) disclaim responsibility for any injury to people or property resulting from any ideas, methods, instructions or products referred to in the content. |
© 2026 by the authors. Licensee MDPI, Basel, Switzerland. This article is an open access article distributed under the terms and conditions of the Creative Commons Attribution (CC BY) license.