Article

Operando Mechanochemical Evolution of Cylindrical 18650 NMC Lithium-Ion Cell Under Progressive High-Rate and Deep-Discharge Conditions Using Fiber Bragg Grating Sensing

Department of Mechanical and Control Engineering, Handong Global University, Pohang 37554, Republic of Korea
*
Author to whom correspondence should be addressed.
Batteries 2026, 12(5), 151; https://doi.org/10.3390/batteries12050151
Submission received: 28 March 2026 / Revised: 19 April 2026 / Accepted: 22 April 2026 / Published: 24 April 2026

Abstract

Operando mechanical behavior of lithium-ion batteries under aggressive conditions remains insufficiently quantified, especially under combined high-rate and deep-discharge operation. This study investigated strain evolution in a commercial 18650 NMC lithium-ion cell using surface-mounted fiber Bragg grating sensors across 20 sequential conditions combining five discharge rates (1–4.5 C) and four cutoff voltages (2.5–1.0 V). All tests were performed on a single cell using identical 0.5 C constant-current constant-voltage charging, followed by a 2 h rest period and controlled discharge, to systematically evaluate mechanochemical evolution with increasing electrochemical severity. Maximum tensile strain during charging ranged from 45 to 59 µε and showed limited sensitivity to discharge severity. In contrast, discharge behavior exhibited clear rate- and cutoff-dependent transitions from tensile to compressive deformation; the most severe condition (4.5 C, 1.0 V cutoff) produced a peak compressive strain of about −27 µε and the most negative residual strain after relaxation. Although temperature increased monotonically with C-rate, strain evolution was nonlinear and non-monotonic, indicating that electrochemically induced stress dominated over thermal expansion alone. These findings reveal progressive amplification of irreversible deformation under severe discharge and demonstrate the value of fiber Bragg grating sensing for operando assessment of electrochemical–mechanical coupling in cylindrical lithium-ion cells.

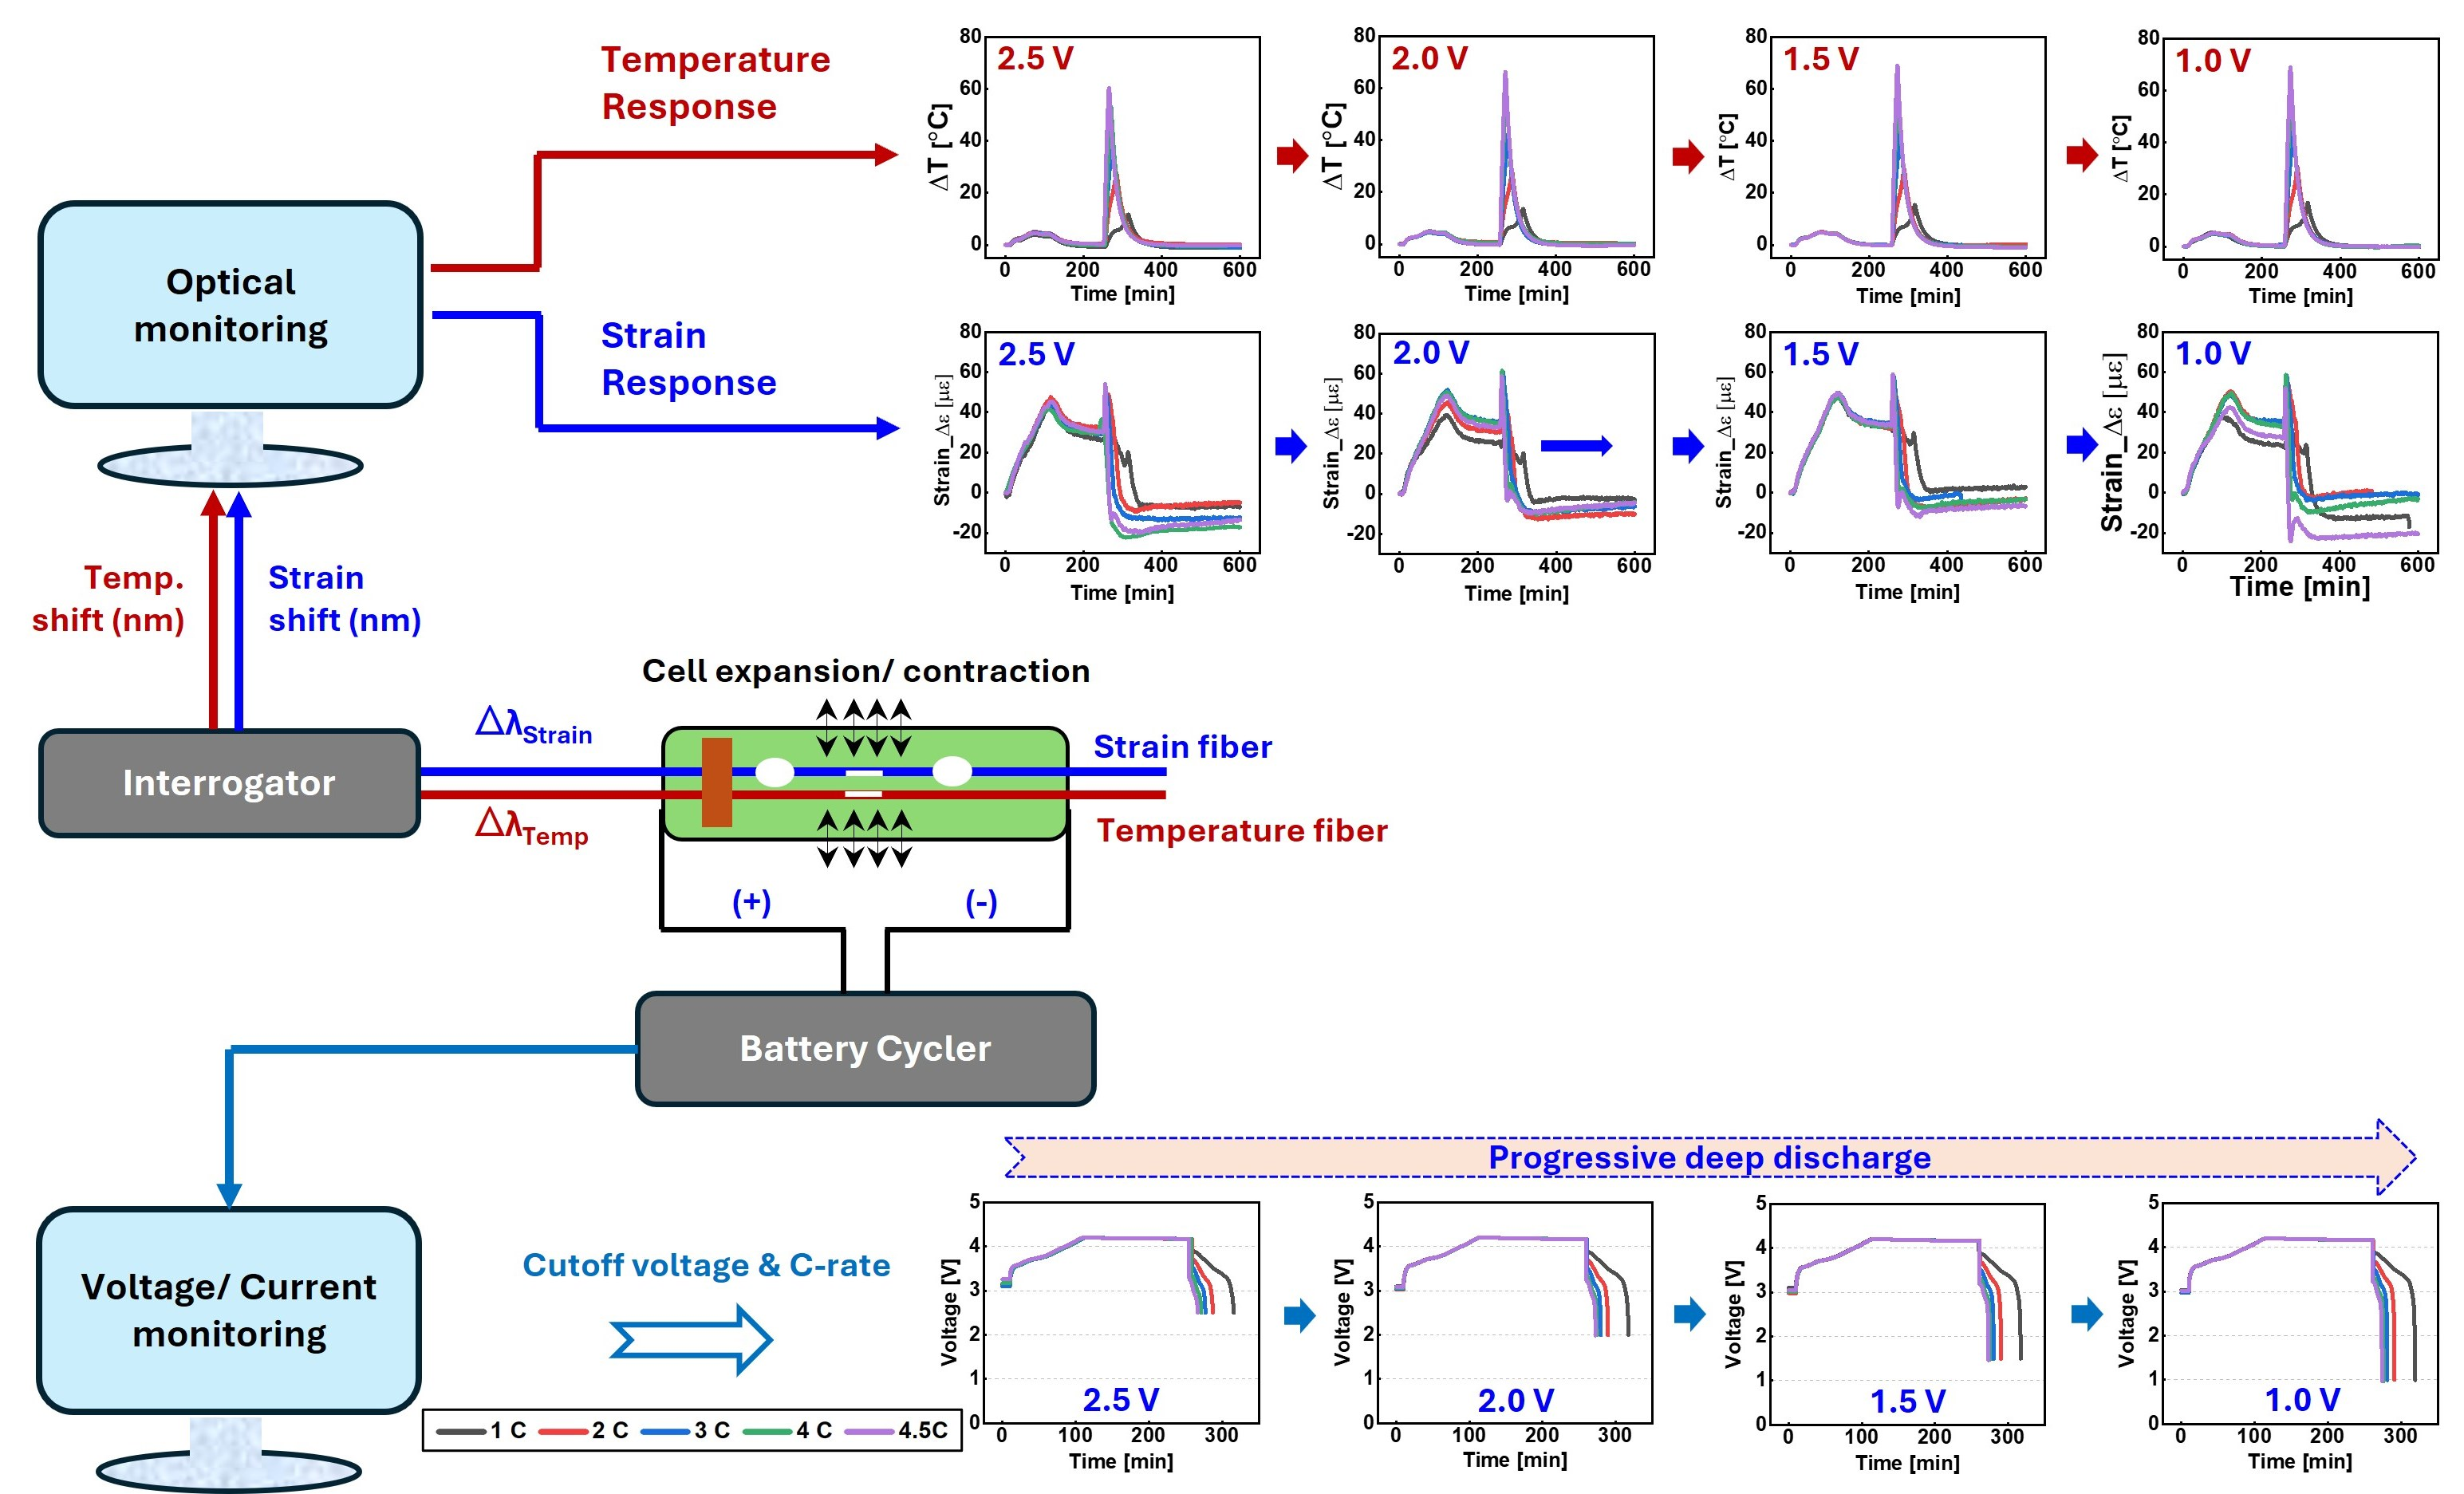
Graphical Abstract

1. Introduction

Lithium-ion batteries (LiBs) have become the dominant electrochemical energy storage technology for portable electronics, electric vehicles, and grid-scale energy storage systems because of their high energy density, long cycle life, and favorable power-to-weight ratio [1,2,3]. As their use continues to expand, modern LiBs are increasingly required to operate under demanding conditions involving fast charging, rapid energy delivery, and high-power discharge. Such aggressive operating conditions raise important concerns regarding safety, durability, and structural reliability, particularly when cells are repeatedly exposed to severe electrochemical and thermal loading [4,5,6].
One of the fundamental challenges in LiBs is that electrochemical cycling is inherently coupled with mechanical deformation. During lithiation and delithiation, active materials undergo repeated volume expansion and contraction, generating internal stress throughout the electrode architecture and cell assembly. These stresses can develop across multiple length scales, from active particles to composite electrodes and the full cell structure, and may eventually promote fracture, stress localization, and mechanical instability [7,8,9,10]. As cycling proceeds, these mechanically driven effects can evolve into interfacial damage, crack propagation, delamination, and irreversible structural degradation that contribute to long-term performance loss and reduced service life [11,12,13,14]. Importantly, the severity of these processes is governed not only by material composition but also by operating protocols. Factors such as C-rate, depth of discharge, and charge–discharge strategy influence polarization, reaction heterogeneity, transport limitation, and lifetime response, thereby strongly affecting the extent to which degradation accumulates during use [15,16,17,18].
Although battery monitoring has traditionally relied on electrical observables such as voltage, current, impedance, and fault-feature analysis, these methods do not always provide direct access to the onset of internal mechanical response. In many cases, the mechanical origin of degradation develops before obvious capacity fades or catastrophic failure becomes visible in standard electrical signals. As a result, there is growing interest in non-destructive characterization and diagnostic methods that can reveal structural evolution more directly and at an earlier stage [19,20,21].
Among emerging approaches, sensing-based monitoring has attracted particular attention because it offers the possibility of directly tracking cell behavior during operation. Optical-fiber-based methods are especially promising because they can be integrated with electrochemical systems while maintaining electrical isolation, small size, and high measurement sensitivity. Recent work has highlighted the broader role of sensing in safe and sustainable energy storage systems, while optical fibers have been used to monitor internal temperature, internal structural deformation, and expansion-related battery behavior under operando conditions [22,23,24,25,26]. Within this family of techniques, fiber Bragg grating (FBG) sensors are especially attractive because they provide high strain sensitivity, multiplexing capability, immunity to electromagnetic interference, and the possibility of simultaneous strain-temperature measurement when appropriate compensation strategies are used. Previous reports have demonstrated that FBG sensing can be used for lithium-ion battery monitoring in several ways. Peng et al. reported high-precision external strain monitoring using an FBG-based sensor and also discussed earlier embedded and surface-mounted FBG approaches for battery sensing [27]. Matuck et al. demonstrated simultaneous strain and temperature discrimination at multiple positions on a commercial 18650 cylindrical Li-ion battery using polarization-maintaining FBGs [28]. Bonefacino et al. further showed that externally attached optical-fiber sensors can provide high-fidelity operando strain and temperature measurements, highlighting the broader utility of FBG-based sensing for battery monitoring [29].
Previous studies have also reported direct measurements of mechanochemical degradation-related behavior in Li-ion batteries. Chen et al. reported in situ strain characterization in lithium battery working electrodes, while Sethuraman et al. demonstrated real-time stress measurements in lithium-ion battery negative electrodes during lithiation and delithiation. Cannarella and Arnold further showed that stress evolution in constrained lithium-ion pouch cells is closely related to capacity fade, highlighting the link between mechanical response and electrochemical degradation. Additional studies have also quantified internal deformation and cell expansion under operando conditions, further supporting the importance of strain- and stress-based analysis for understanding degradation -related structural evolution in commercial Li ion cells [24,26,27,28,29,30,31,32]. A summary of representative previous studies is provided in Table 1.
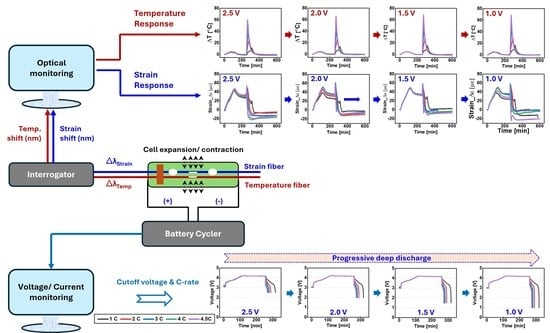
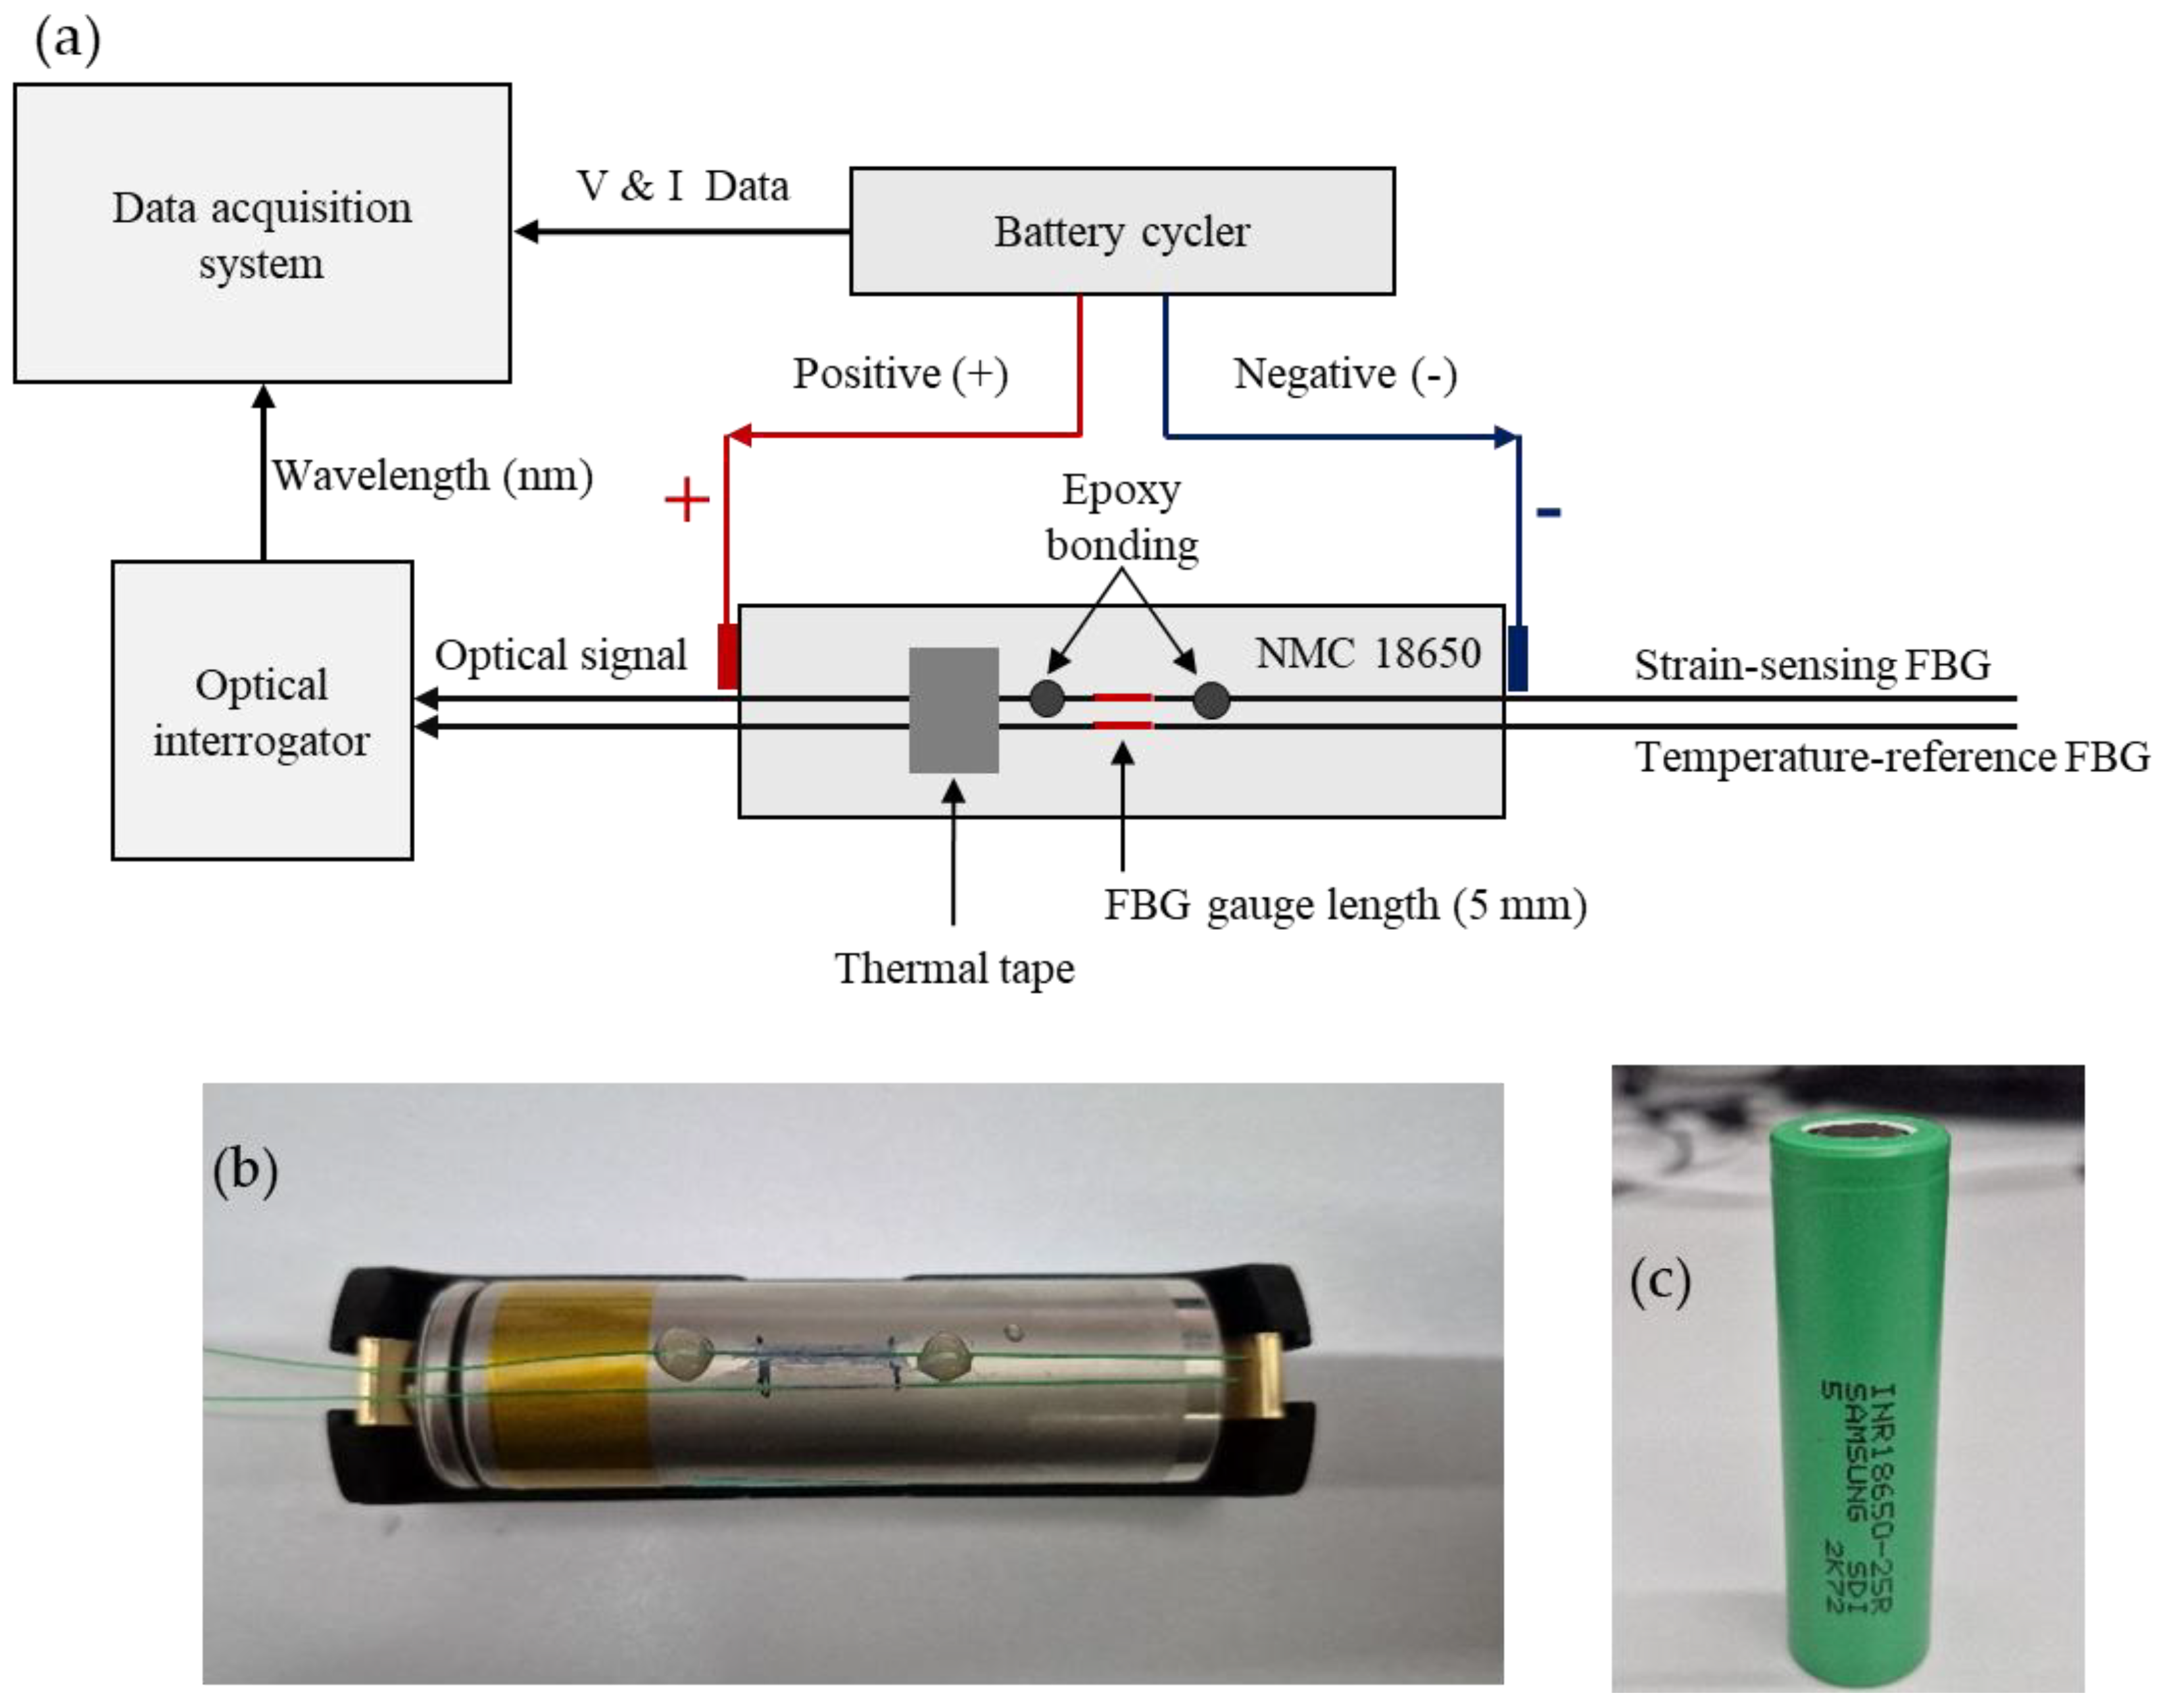
In the present setup, the strain-sensing FBG was bonded along the axial direction near the middle region of the cylindrical cell so that deformation of the cell casing during charge and discharge could be transferred to the fiber as a wavelength shift. A second FBG was used as a temperature-reference sensor and was mounted under reduced mechanical constraint, with one side fixed and the other side left free to move, in order to maintain thermal contact while minimizing strain transfer. The wavelength shifts from both FBGs were recorded by the optical interrogator, while the battery cycler simultaneously controlled the charge–discharge protocol and recorded the corresponding current and voltage data. These datasets were then analyzed together to separate mechanical strain and temperature effects through thermal compensation.
Such measurements are important because battery deformation is not merely a secondary by-product of cycling; rather, it reflects the evolving internal mechanical state of the electrochemical system. Direct experimental measurements have shown that stress and strain evolve dynamically during lithiation and delithiation, while mechanically constrained cells can exhibit clear links between stress accumulation and electrochemical performance loss [30,31,32]. In parallel, fracture and debonding analyses, finite-strain modeling, and cell-scale stress calculations have demonstrated that electrochemical reactions, diffusion, mechanical constraint, and material constitutive response are tightly coupled in lithium-ion systems [33,34,35]. Additional work on plastic deformation, in situ stress evolution, electrode stress characterization, and multiphysics modeling has further established that irreversible deformation and mechanical hysteresis can emerge from the interaction of electrochemistry, mechanics, thermodynamics, and kinetics [36,37,38,39]. Thermal behavior must also be considered in this framework, since temperature rise alters transport, reaction kinetics, and internal resistance, thereby modifying the conditions under which mechanical stress develops during operation [40].
Despite these advances, an important gap remains in the context of commercial cylindrical cells operated under aggressive discharge conditions. In particular, limited attention has been given to how discharge C-rate and discharge cutoff voltage jointly affect the post-cycle residual strain state after a single charge–discharge event. Residual strain, defined as the non-recoverable deformation remaining after discharge and subsequent relaxation, can provide insight into early-stage irreversible mechanical accommodation before clear electrochemical degradation signals become evident. Discharge C-rate affects the rate of lithium extraction, concentration-gradient formation, and stress development, and prior studies have shown that rate-dependent mechanical stress and diffusion-induced cracking can become significant under nonequilibrium conditions [41,42,43]. More broadly, coupled electrochemical-thermal diagnostic modeling of abnormal internal states highlights the importance of identifying additional observables that can complement conventional voltage-based monitoring when batteries are exposed to increasingly severe operating conditions [44].
To address this gap, the present study performs an operando experimental investigation of a commercial 18650-type NMC lithium-ion cell using surface-mounted fiber Bragg grating (FBG) sensors. A progressive single-cell framework was intentionally adopted to track mechanochemical evolution under increasing discharge severity, rather than to establish statistical variability across multiple cells. The experimental matrix consists of 20 sequential single-cycle operating conditions combining five discharge C-rates (1 C to 4.5 C) and four discharge cutoff voltages (2.5 V to 1.0 V), while maintaining an identical 0.5 C constant-current constant-voltage (CC-CV) charging protocol and a 2 h rest period before discharge. By continuously monitoring temperature-compensated strain throughout charging, rest, and discharge, this study evaluates the evolution of peak tensile strain, end-of-rest strain, transient strain response at discharge initiation, peak compressive strain, and residual strain after discharge. Through this framework, the study aims to clarify how discharge C-rate and cutoff voltage influence the transient and residual mechanochemical response of a cylindrical commercial Li-ion cell and to demonstrate the sensitivity of FBG sensing to high-severity discharge conditions.

2. Materials and Methods

2.1. Cell Selection and Experimental Philosophy

A commercial cylindrical lithium-ion cell (INR18650-25R, Samsung SDI Co., Ltd., Cheonan-si, Chungnam, Republic of Korea) with a nominal capacity of 2.5 Ah and nominal voltage of 3.6 V was used in this study. The cell employs an NMC (LiNiMnCoO2) based cathode chemistry. The specifications are summarized in Table 2. All experiments were conducted sequentially on a single commercial cell to examine mechanochemical evolution under progressively increasing electrochemical severity. The objective of this study was to investigate strain evolution under controlled escalation of discharge rate and cutoff voltage, rather than to assess statistical variation among multiple cells. Because deep-discharge operation can induce irreversible structural and electrochemical changes, the test matrix was implemented as a progressive severity sequence, with the discharge cutoff voltage reduced stepwise from 2.5 V to 1.0 V. This approach enables systematic evaluation of cumulative mechanical response under increasingly aggressive operating conditions.

2.2. Charge–Discharge Protocol

Charge–discharge tests were conducted using a programmable battery cycler (ECT6008-5V12A, INITIAL ENERGY SCIENCE & TECHNOLOGY (XIAMEN) Co., Ltd., Xiamen, China). All operating conditions followed an identical charging protocol to ensure a consistent initial electrochemical state prior to discharge. The cell was charged using a constant-current constant-voltage (CC-CV) method at 0.5 C (1.25 A) until the voltage reached 4.2 V. The voltage was then held at 4.2 V until the current decreased to 125 mA. After charging, the cell was rested under open-circuit conditions for 2 h to allow thermal and electrochemical stabilization. Discharge tests were conducted at five C-rates (1 C, 2 C, 3 C, 4 C, and 4.5 C) combined with four cutoff voltages (2.5 V, 2.0 V, 1.5 V, and 1.0 V), resulting in 20 operating conditions. The cutoff voltage was progressively reduced in the sequence 2.5 V → 2.0 V → 1.5 V → 1.0 V. For each cutoff voltage, discharge rates were varied to evaluate the combined influence of current density and depth-of-discharge. For each operating condition, a single charge–rest–discharge cycle was performed. The progressive test sequence enabled systematic assessment of strain evolution under increasing electrochemical severity within the same cell. The complete charge–discharge matrix is summarized in Table 3.
The cell testing protocol used in this work was designed specifically for the present study to investigate strain evolution under progressively severe discharge conditions and was not intended to exactly reproduce a previously reported cycling procedure. The exact sequential order of the 20 operating conditions applied to the single cell, together with the corresponding charge and delivered discharge capacities, is summarized in Table 4.

2.2.1. Justification for the 1.0 V Cutoff

The 1.0 V cutoff condition was intentionally included as an extreme deep-discharge case to probe the mechanochemical response of the cell under abusive operation and to assess whether increasingly severe discharge conditions would amplify irreversible deformation and residual strain. This condition was used only for experimental investigation and should not be interpreted as a recommended practical operating limit for the commercial cell.

2.2.2. Safety Precautions

Because the 1.0 V cutoff represented a severe over-discharge condition, all tests were conducted under controlled laboratory conditions using a programmable battery cycler with built-in current and voltage protection. In addition to the nominal cycling protocol, tight protection limits were set close to the intended operating values, and the cycler automatically paused or stopped the test if an over-current or over-limit condition occurred. The cell was placed inside an enclosed protective box with openings only for the power cable connections and optical fiber feedthrough, and the experiments were closely monitored throughout testing. Appropriate personal protective equipment, including safety clothing, gloves, and safety glasses, was used during the experiments.

2.3. Strain and Temperature Measurement

Strain evolution was monitored using two surface-mounted fiber Bragg grating (FBG) sensors connected to a high-resolution optical interrogator (HYPERION si155, Micron Optics, Atlanta, GA, USA). One FBG sensor (1550 nm) was bonded along the axial direction of the cylindrical cell to measure mechanical strain. A second adjacent FBG (1535 nm), positioned in close thermal contact but mechanically isolated from axial strain, was used as a temperature reference to enable thermal compensation.
The temperature-reference FBG was positioned adjacent to the strain-sensing FBG in close thermal contact with the cell surface and mounted with reduced mechanical coupling to minimize axial strain transfer while preserving thermal response. Additional comparison experiments using different reference-FBG mounting configurations were performed to assess possible parasitic strain pickup.
Prior to sensor installation, the cell surface was cleaned with ethanol to ensure proper adhesion. The strain-sensing FBG was bonded using a two-part epoxy adhesive and pre-tensioned with a 100 g weight to ensure effective strain transfer and minimize slack in optical fiber. The adhesive was cured at room temperature for 24 h prior to testing.
Wavelength data were recorded at 5 s intervals throughout each experiment. Mechanical strain was extracted from the measured wavelength shifts using a dual-sensor thermal compensation method, as described in Section 2.4. All strain values were baseline-corrected relative to the initial state at the beginning of each test. The FBG attachment configuration and overall experimental setup are illustrated in Figure 1a–c.

2.4. Strain-Temperature Decoupling and Data Processing

The wavelength shift (Δλ) of a surface-bonded fiber Bragg grating (FBG) sensor contains contributions from both mechanically induced strain (ε) and temperature change (ΔT). The total wavelength variation can be expressed as:
Δ λ = k ε   ε + k T Δ T
where k ε ( p m / μ ε ) and k T ( p m / ° C ) are the strain and temperature sensitivity coefficients of the FBG sensor, respectively. According to the manufacturer’s specification, the strain sensitivity coefficient was k ε = 0.83 p m / μ ε . The temperature sensitivity coefficient was experimentally calibrated to be k T = 9.2   p m / ° C under strain-free conditions by imposing controlled temperature variation and determining the liner wavelength-temperature relationship.
To separate mechanical strain from thermal effects, a dual-sensor compensation method was employed [27,29]. The temperature variation ( Δ T ) was obtained from the adjacent temperature-reference FBG according to:
Δ T = Δ λ T k T
where Δ λ T represents the wavelength shift measured by the temperature-reference FBG.
The mechanically induced strain was then isolated by subtracting the thermal component from the total wavelength shift of the strain-sensing FBG [27,29]:
ε = Δ λ S k T Δ T k ε
where Δ λ S and Δ λ T denote the wavelength shifts of the strain-sensing and temperature-reference FBGs, respectively. All strain data were baseline-corrected using the initial wavelength recorded at the start of each test. To improve visual readability, a 40-point moving-average filter was applied only to selected time-series plots. Because this smoothing attenuated the discharge-start transient response, all quantitative strain values reported in the revised manuscript were extracted from the raw measured data, while the smoothed curves were retained only for visual presentation in selected figures.
From each operating condition, four strain metrics were extracted to quantify mechanical response under varying electrochemical severity: (i) Maximum tensile strain during CC-CV charging (εmax), (ii) Strain at the end of the 2 h rest period (εrest,end), (iii) Peak compressive strain during discharge (εpc), and (iv) Residual strain, defined as the average strain measured between 420 and 600 min following discharge completion (εresidual). The measured strain represents axial surface deformation of the cylindrical cell casing and is interpreted as an external proxy for internal mechanochemical evolution, rather than a direct local measurement of electrode strain.

3. Results and Discussion

3.1. Representative Electro-Mechanical Response During a Single Cycle

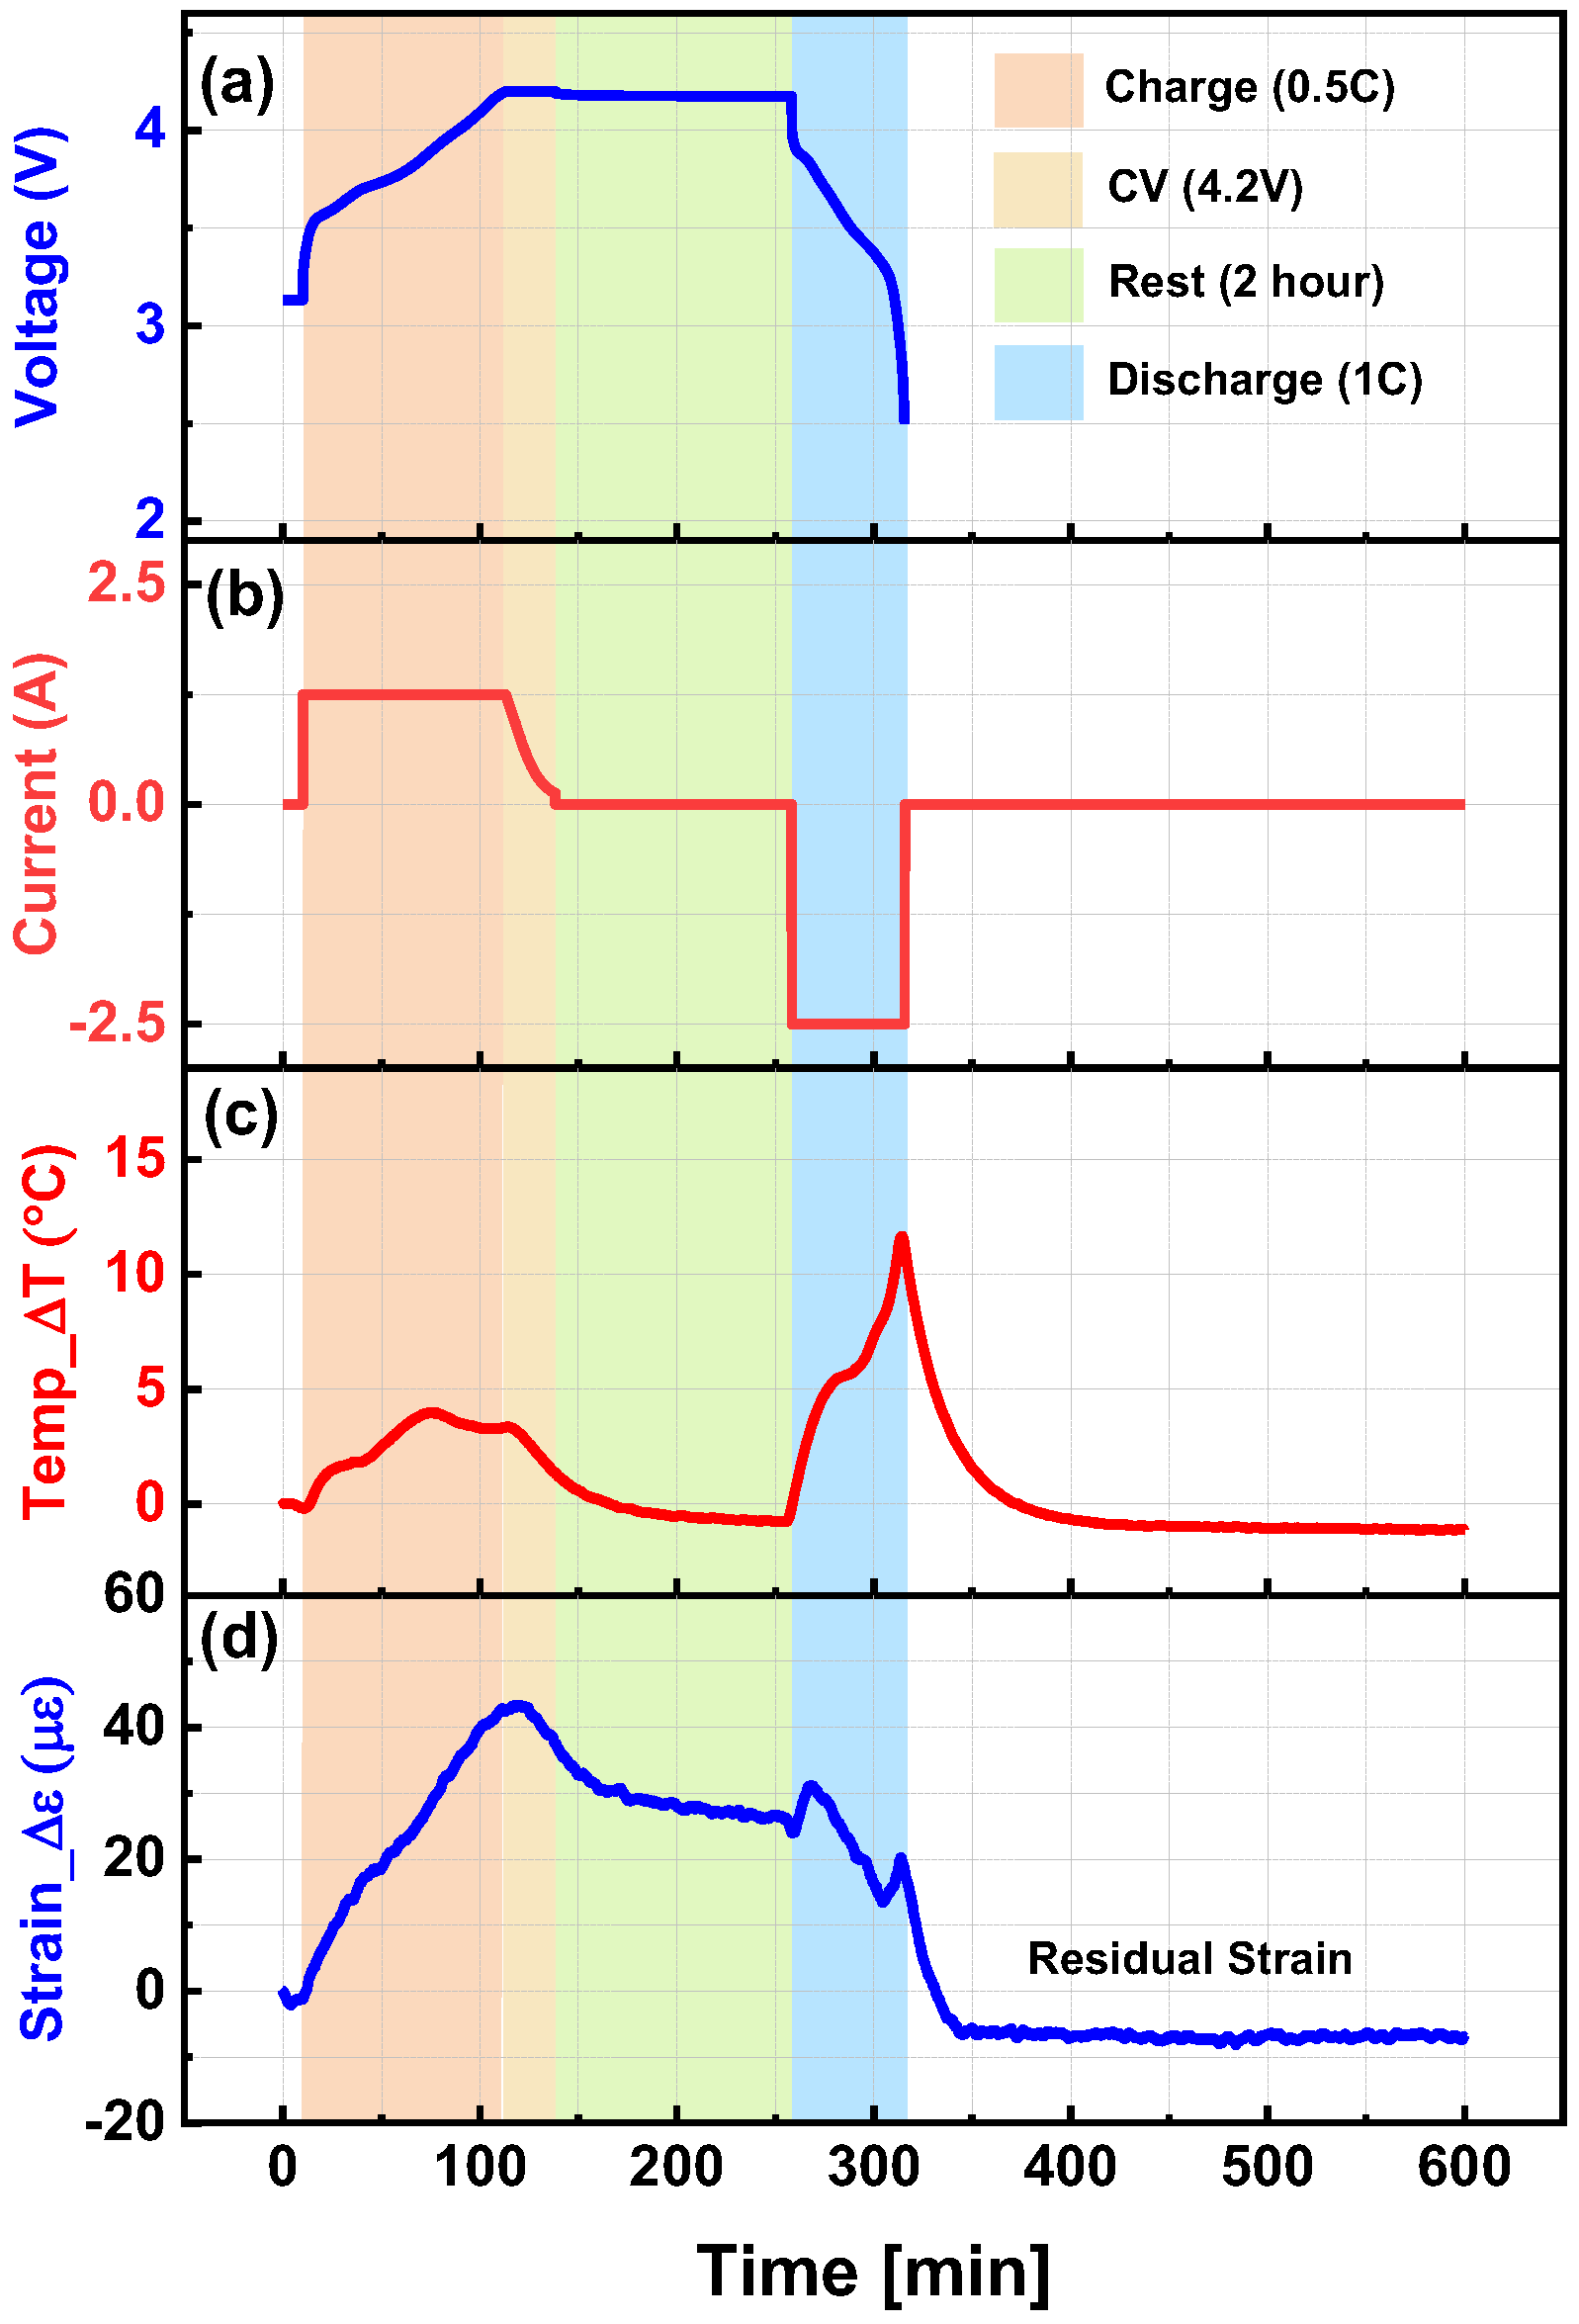
Figure 2 presents the synchronized voltage, current, temperature rise (ΔT), and temperature-compensated strain evolution (Δε) for a representative operating condition (1 C discharge with 2.5 V cutoff) obtained from the tested 18650 NMC cell. The full sequence consists of CC-CV charging at 0.5 C, a 2 h open-circuit rest period, and subsequent constant-current discharge. This representative case illustrates the fundamental electrochemical–mechanical behavior that forms the basis for the subsequent progressive severity analysis.
During the constant-current charging stage, the cell voltage increases toward 4.2 V, accompanied by a gradual rise in tensile strain. The strain reaches a maximum value of approximately 52 µε near the end of the CC-CV phase. This increase in measured full-cell tensile strain during charging is consistent with lithium intercalation processes reported in graphite-based lithium-ion cells. However, the present measurements do not directly distinguish the separate strain contributions of the anode, cathode, and other cell components within the cylindrical structure. Simultaneously, a moderate temperature increase of approximately 4.5 °C is observed, primarily driven by resistive (Joule) heating.
During the subsequent 2 h rest period, the voltage stabilizes and the temperature gradually approaches ambient conditions. The strain exhibits partial relaxation but remains tensile, indicating incomplete mechanical recovery following lithiation. This response suggests that a portion of the deformation is elastically recoverable, while another component may reflect time-dependent stress redistribution or irreversible structural accommodation within the electrode stack.
Upon discharge at 1 C, a clear mechanical contraction occurs, and the measured strain decreases progressively. This behavior is consistent with lithium deintercalation processes reported for graphite-based cells, although the present full-cell measurement does not directly isolate the contribution of the graphite electrode from those of other cell components. The strain decreases progressively and reaches a minimum value near the end of discharge (peak compressive strain), followed by stabilization during the post-discharge relaxation period. The final strain remains slightly compressive ~8 µε, indicating the presence of residual deformation after completion of a single electrochemical cycle.
Although the temperature rise during discharge is more pronounced than during charging, the strain evolution does not strictly follow the thermal profile. This divergence confirms that the measured deformation is predominantly governed by electrochemically induced stress rather than simple thermal expansion, validating the effectiveness of the temperature-compensation procedure described in Section 2.4.
This representative cycle highlights four characteristic mechanical stages investigated throughout this study: (i) peak tensile strain during charging, (ii) partial strain relaxation during rest, (iii) peak compressive strain during discharge, and (iv) residual strain after discharge completion. These strain metrics provide a consistent framework for evaluating progressive mechanochemical evolution under increasing electrochemical severity in the following sections.

3.2. Effect of Discharge Rate on Temperature Evolution

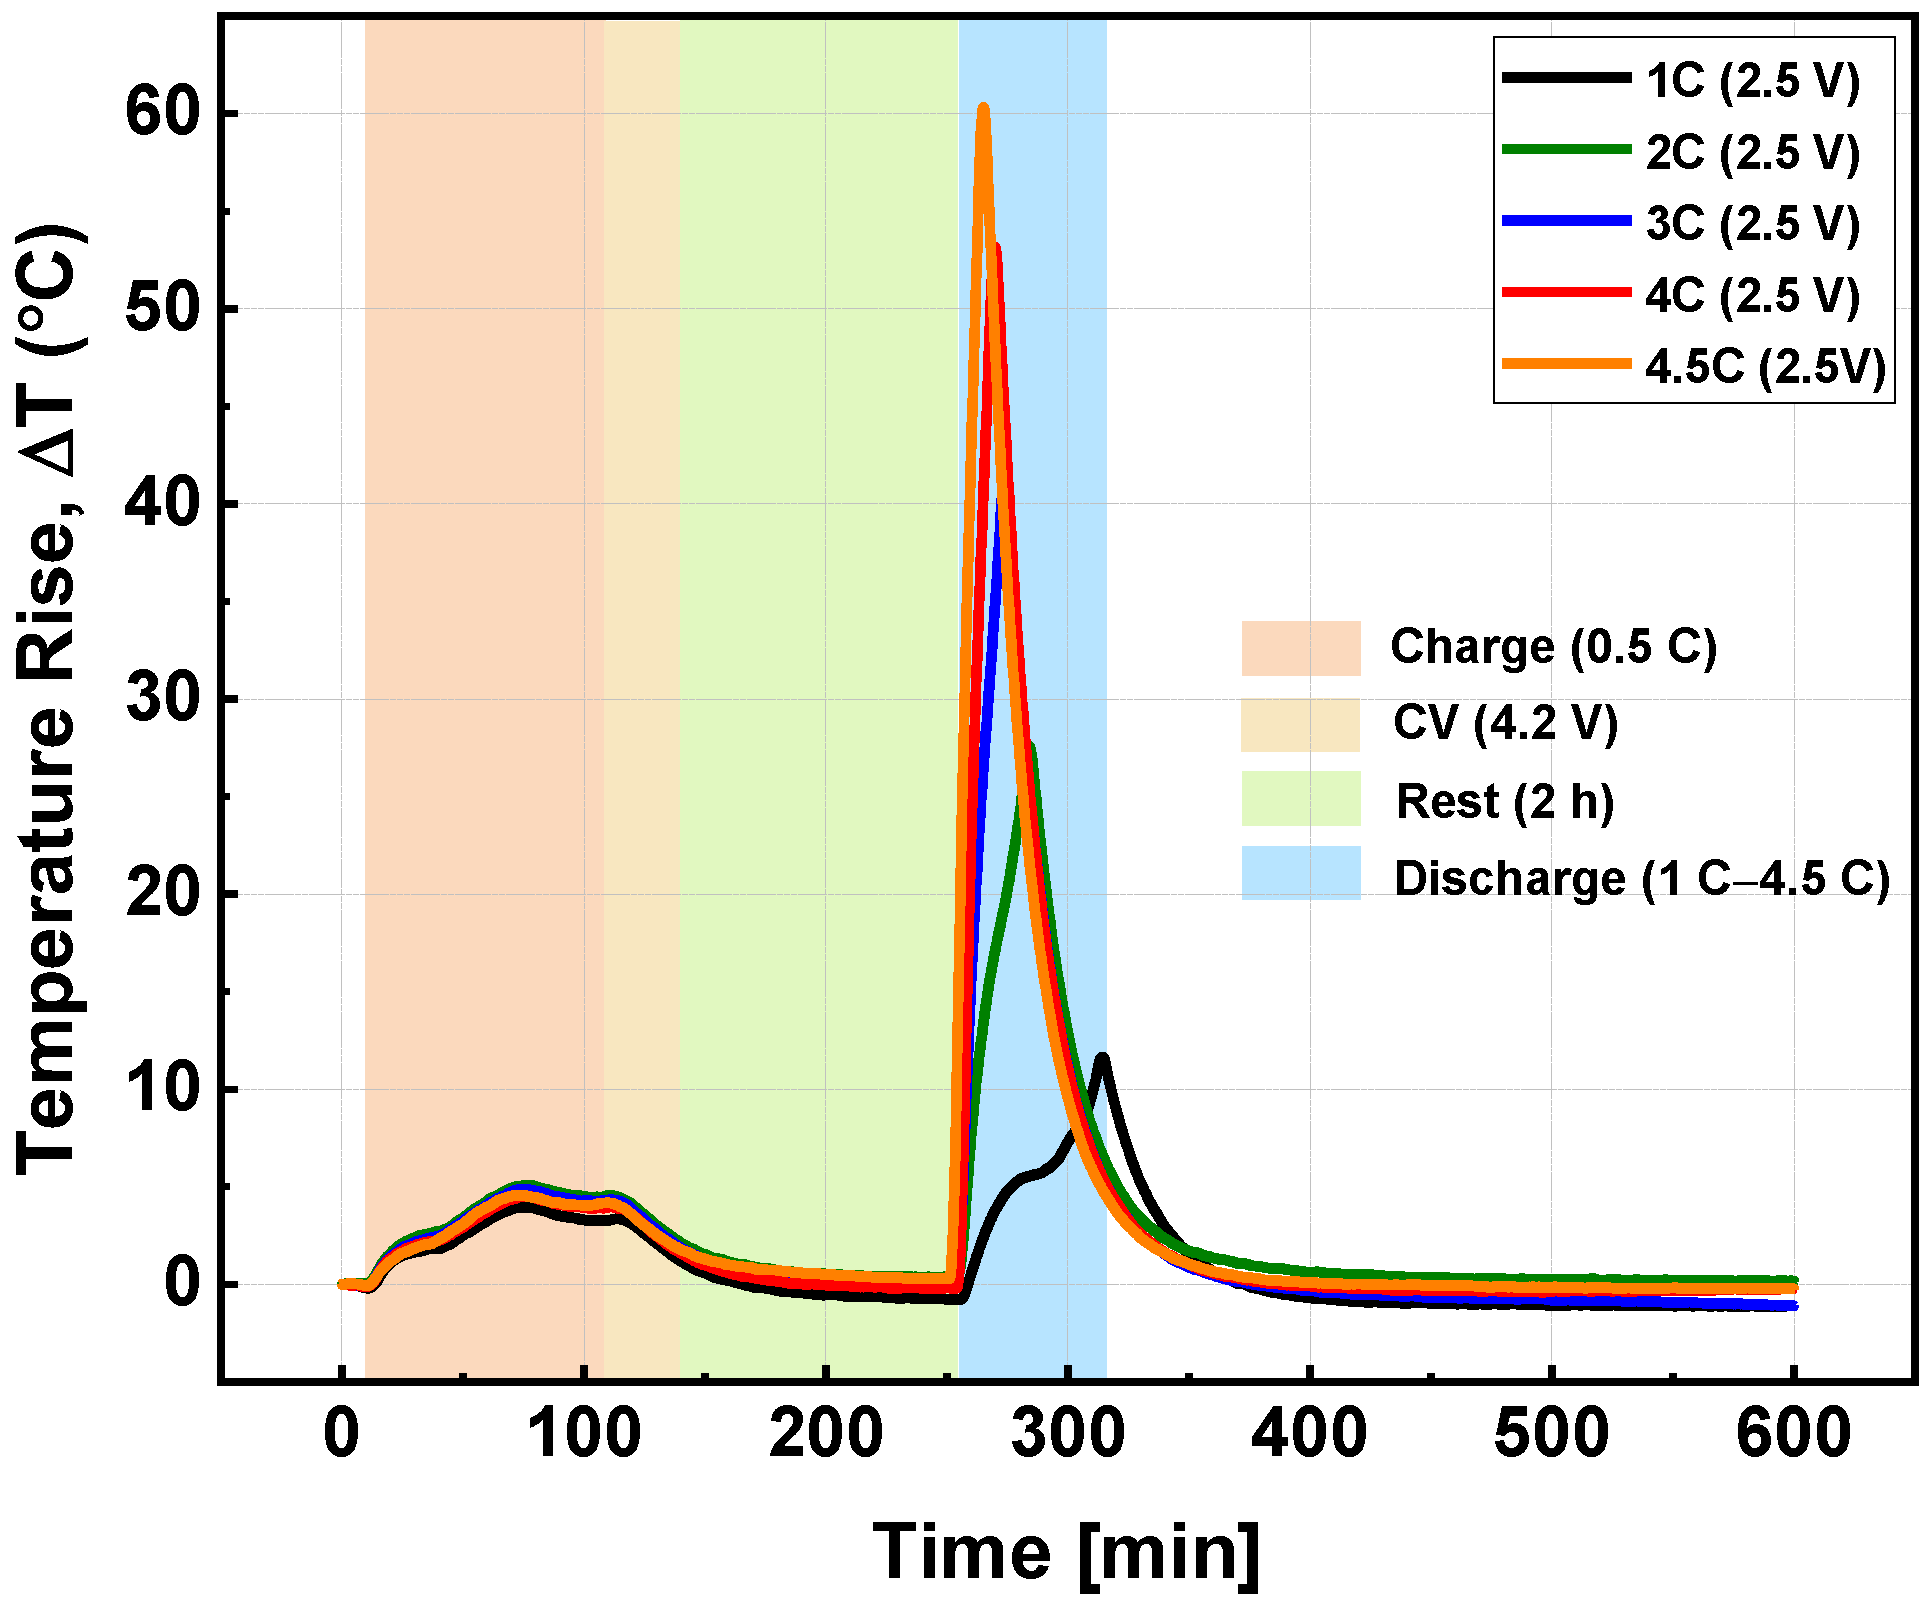
Figure 3 presents the temperature rise (ΔT) of the tested cell under varying discharge rates (1–4.5 C) at a cutoff voltage of 2.5 V. All cases followed an identical 0.5 C (CC-CV) charging protocol and a 2 h rest period prior to discharge, providing a consistent pre-discharge electrochemical state for evaluating rate-dependent thermal behavior within the progressive test sequence. Complete temperature evolution profiles for all cutoff voltages are provided in the Supplementary Information (Figure S2). The lumped heat capacity of the INR18650-25R cell was estimated to be approximately 45 J K−1 from the manufacturer-specified cell mass (45.0 g max) and a literature-based specific heat capacity of about 1000 J kg−1 K−1 [45,46].
During CC-CV charging, a gradual temperature increase of approximately ~4.5 °C was observed, reflecting moderate heat generation associated with internal resistance and electrochemical reaction processes. The subsequent 2 h rest period enabled partial thermal relaxation, with temperature returning close to ambient conditions before discharge initiation. The more pronounced temperature rise during discharge is primarily attributed to the higher discharge current (1–4.5 C) relative to the fixed 0.5 C charging current, which increases irreversible heat generation from ohmic resistance and electrochemical polarization [47,48].
In contrast, the discharge phase exhibited a strong and nearly monotonic dependence on C-rate. The peak temperature rise reached 11.7 °C at 1 C, increasing to 27.6 °C at 2 C and 41.5 °C at 3 C. At higher discharge rates, the thermal response intensified further, reaching 53.2 °C at 4 C and 60.3 °C at 4.5 C. This progressive increase is consistent with Joule heating behavior, which scales approximately with the square of current (I2R), indicating substantial internal heat generation under high-rate operation. The pronounced thermal spike observed at 4.5 C is consistent with elevated polarization and internal resistance under aggressive discharge conditions.
Following discharge completion, the temperature gradually decayed toward ambient conditions during the post-discharge relaxation period. The clear monotonic relationship between discharge rate and peak temperature rise contrasts with the nonlinear strain behavior discussed in subsequent sections. This divergence suggests that thermal expansion alone cannot explain the observed mechanical response, highlighting the dominant contribution of electrochemically induced stress and concentration-gradient-driven effects under high-rate loading.

3.3. Strain Evolution Under Varying Discharge Rates

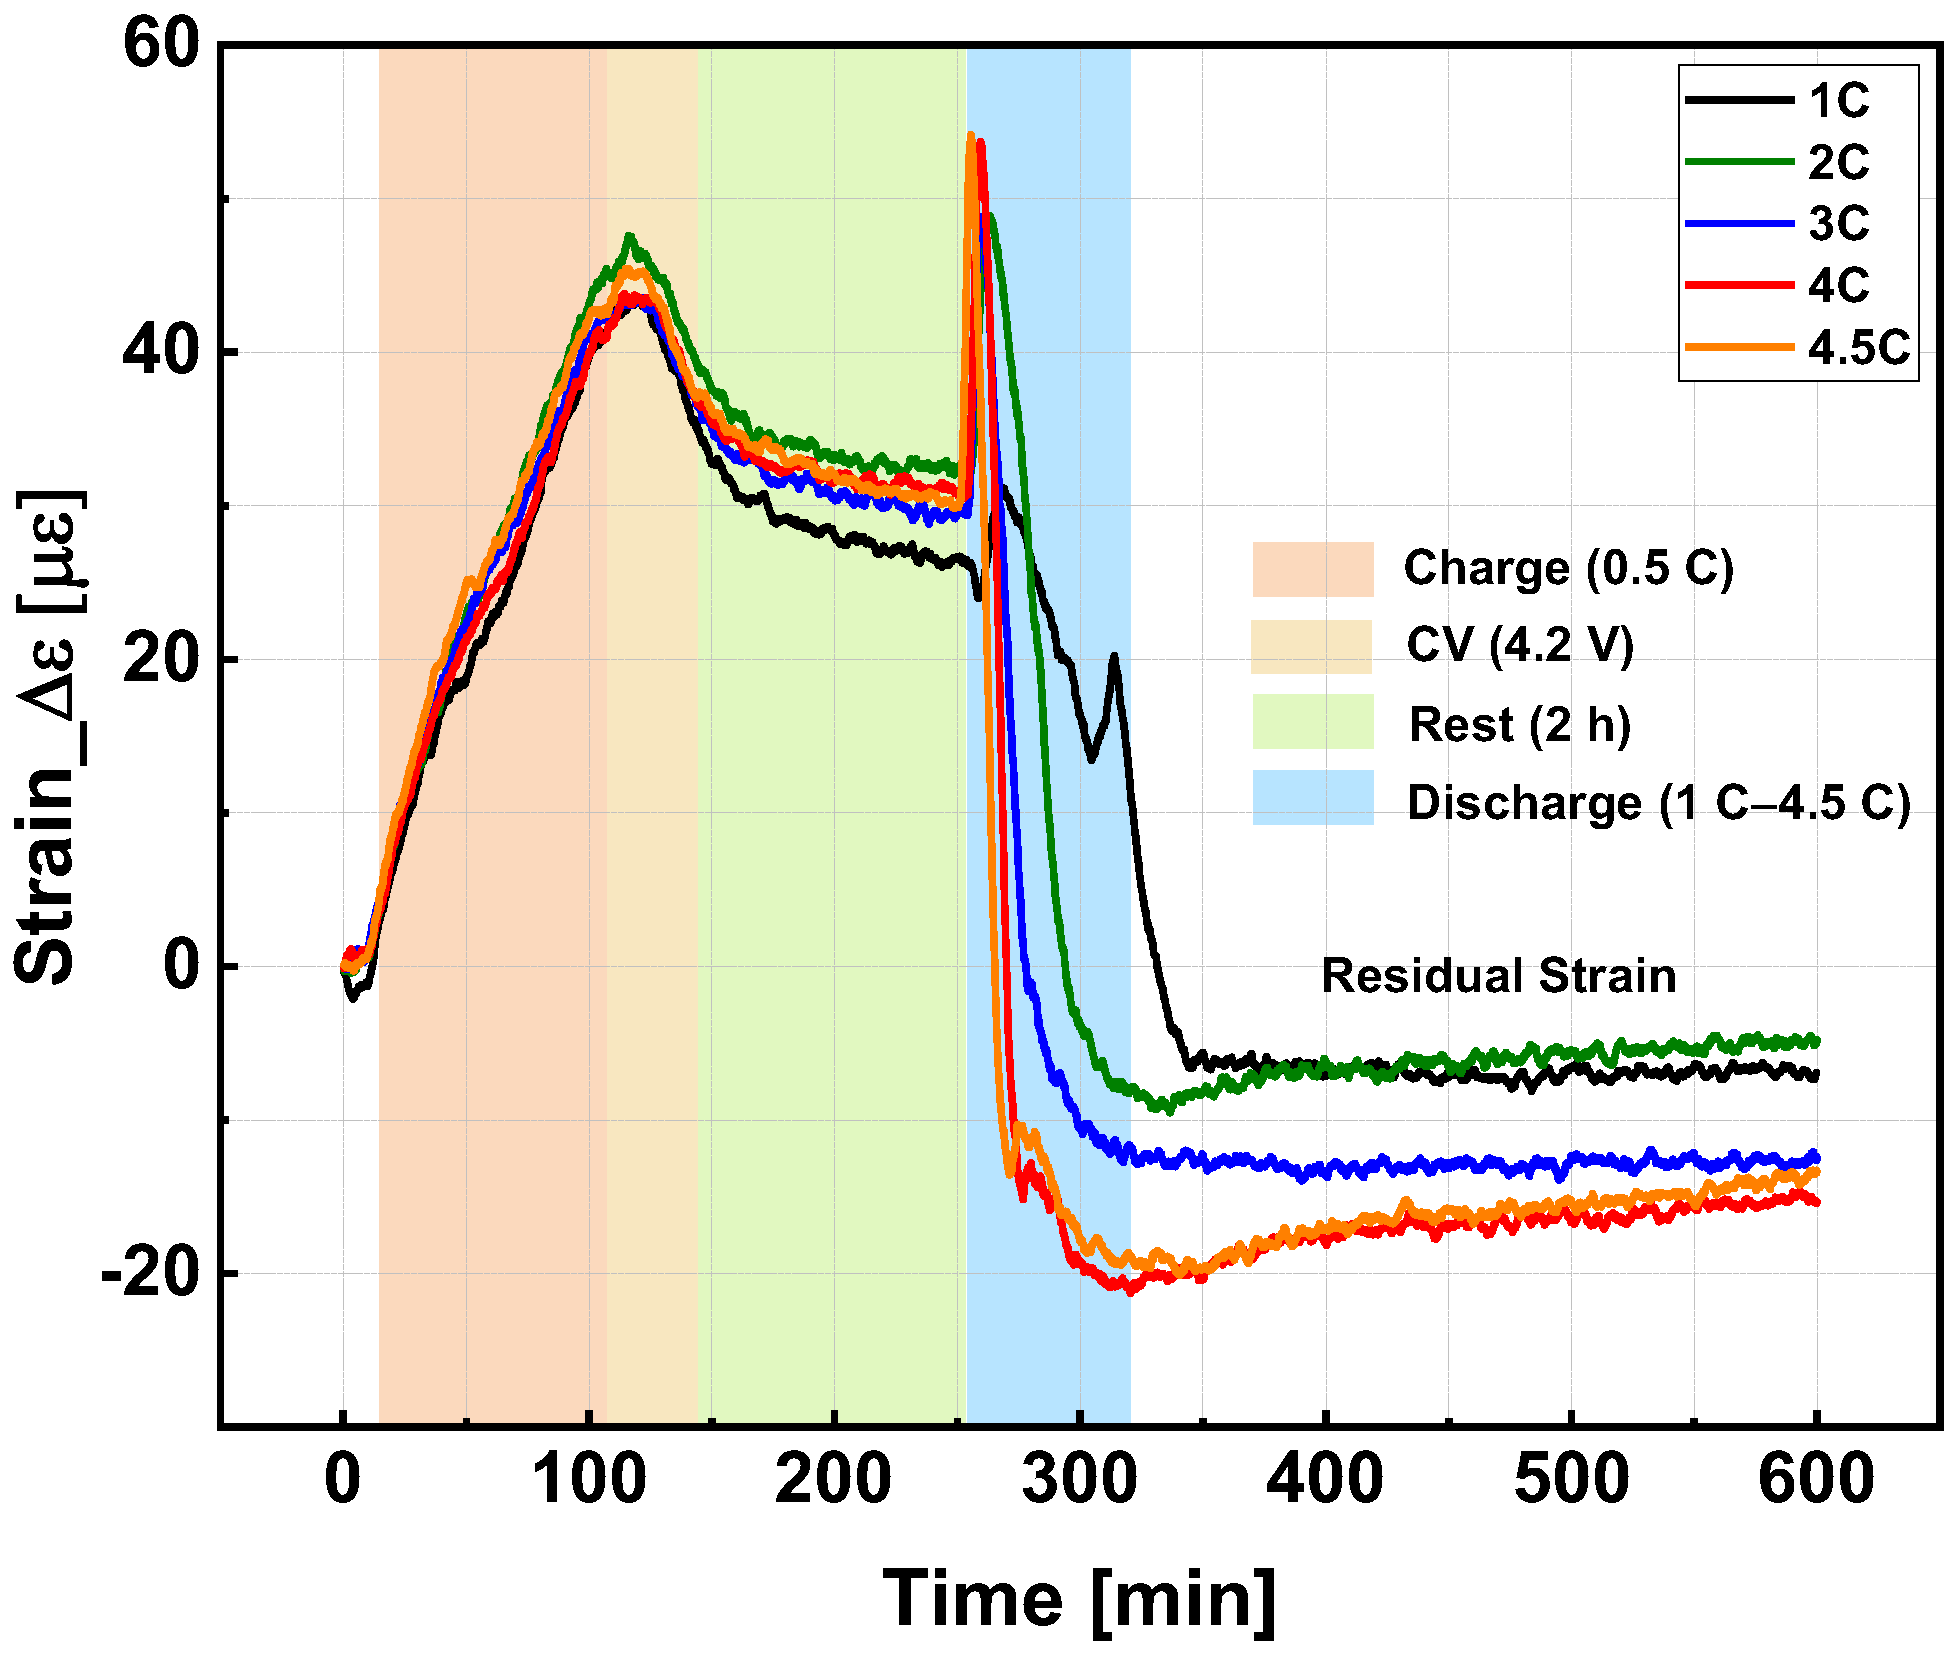
Figure 4 illustrates the strain evolution (Δε) of the tested 18650 NMC cell under different discharge rates (1–4.5 C) at a cutoff voltage of 2.5 V. All cases followed an identical 0.5 C CC-CV charging protocol and 2 h rest period prior to discharge, providing a consistent electrochemical baseline within the progressive test sequence for evaluating rate-dependent mechanical behavior.
During the CC-CV charging phase, all conditions exhibited progressive tensile expansion, with peak strain values in the range of 47–59 µε. This tensile response is attributed to lithiation-induced volumetric expansion of electrode materials and internal pressure buildup within the constrained jelly-roll structure. The similarity of the charging profiles indicates that the pre-discharge mechanical state remained comparable prior to each discharge condition.
Following charging, the 2 h rest period resulted in partial strain relaxation. Although the strain decreased relative to the charging peak, it remained tensile, indicating incomplete mechanical recovery. This behavior is consistent with stress redistribution and diffusion-driven equilibration within the electrode stack under open-circuit conditions.
During discharge, the strain response exhibited a clear dependence on C-rate. At lower rates (1 C and 2 C), strain decreased gradually, transitioning from tensile expansion toward mild compressive deformation. As the discharge rate increased (3–4.5 C), the response became increasingly abrupt and nonlinear. High-rate discharge induced rapid tensile-to-compressive transitions, characterized by pronounced peak compressive strain shortly after discharge initiation.
The magnitude of compressive strain increased with increasing C-rate. While 1 C discharge produced modest compressive values, higher rates (4 C and 4.5 C) resulted in substantially larger compressive deformation, indicating enhanced mechanical contraction under elevated electrochemical severity. This behavior is consistent with intensified internal stress gradients, increased polarization, and accelerated lithium deintercalation kinetics at higher current densities.
After discharge completion, residual strain remained negative for all cases, indicating the presence of irreversible mechanical deformation following a single cycle. The magnitude of residual compressive strain increased progressively with C-rate, suggesting that higher discharge current amplifies permanent structural accommodation within the cell. These results indicate that high-rate operation intensifies transient stress excursions and promotes greater residual mechanical offset.
In contrast to the monotonic increase in temperature with discharge rate, the strain evolution displayed nonlinear transitions between tensile and compressive regimes. This divergence suggests that the mechanical response cannot be explained solely by thermal expansion, but is likely influenced by electrochemically induced stress, concentration-gradient-driven effects, and internal structural constraints within the cylindrical geometry.
Overall, within the progressive single-cell test framework, discharge rate exerts a strong influence on both transient peak compressive strain and residual deformation, with high-rate discharge promoting increasingly severe mechanochemical response.
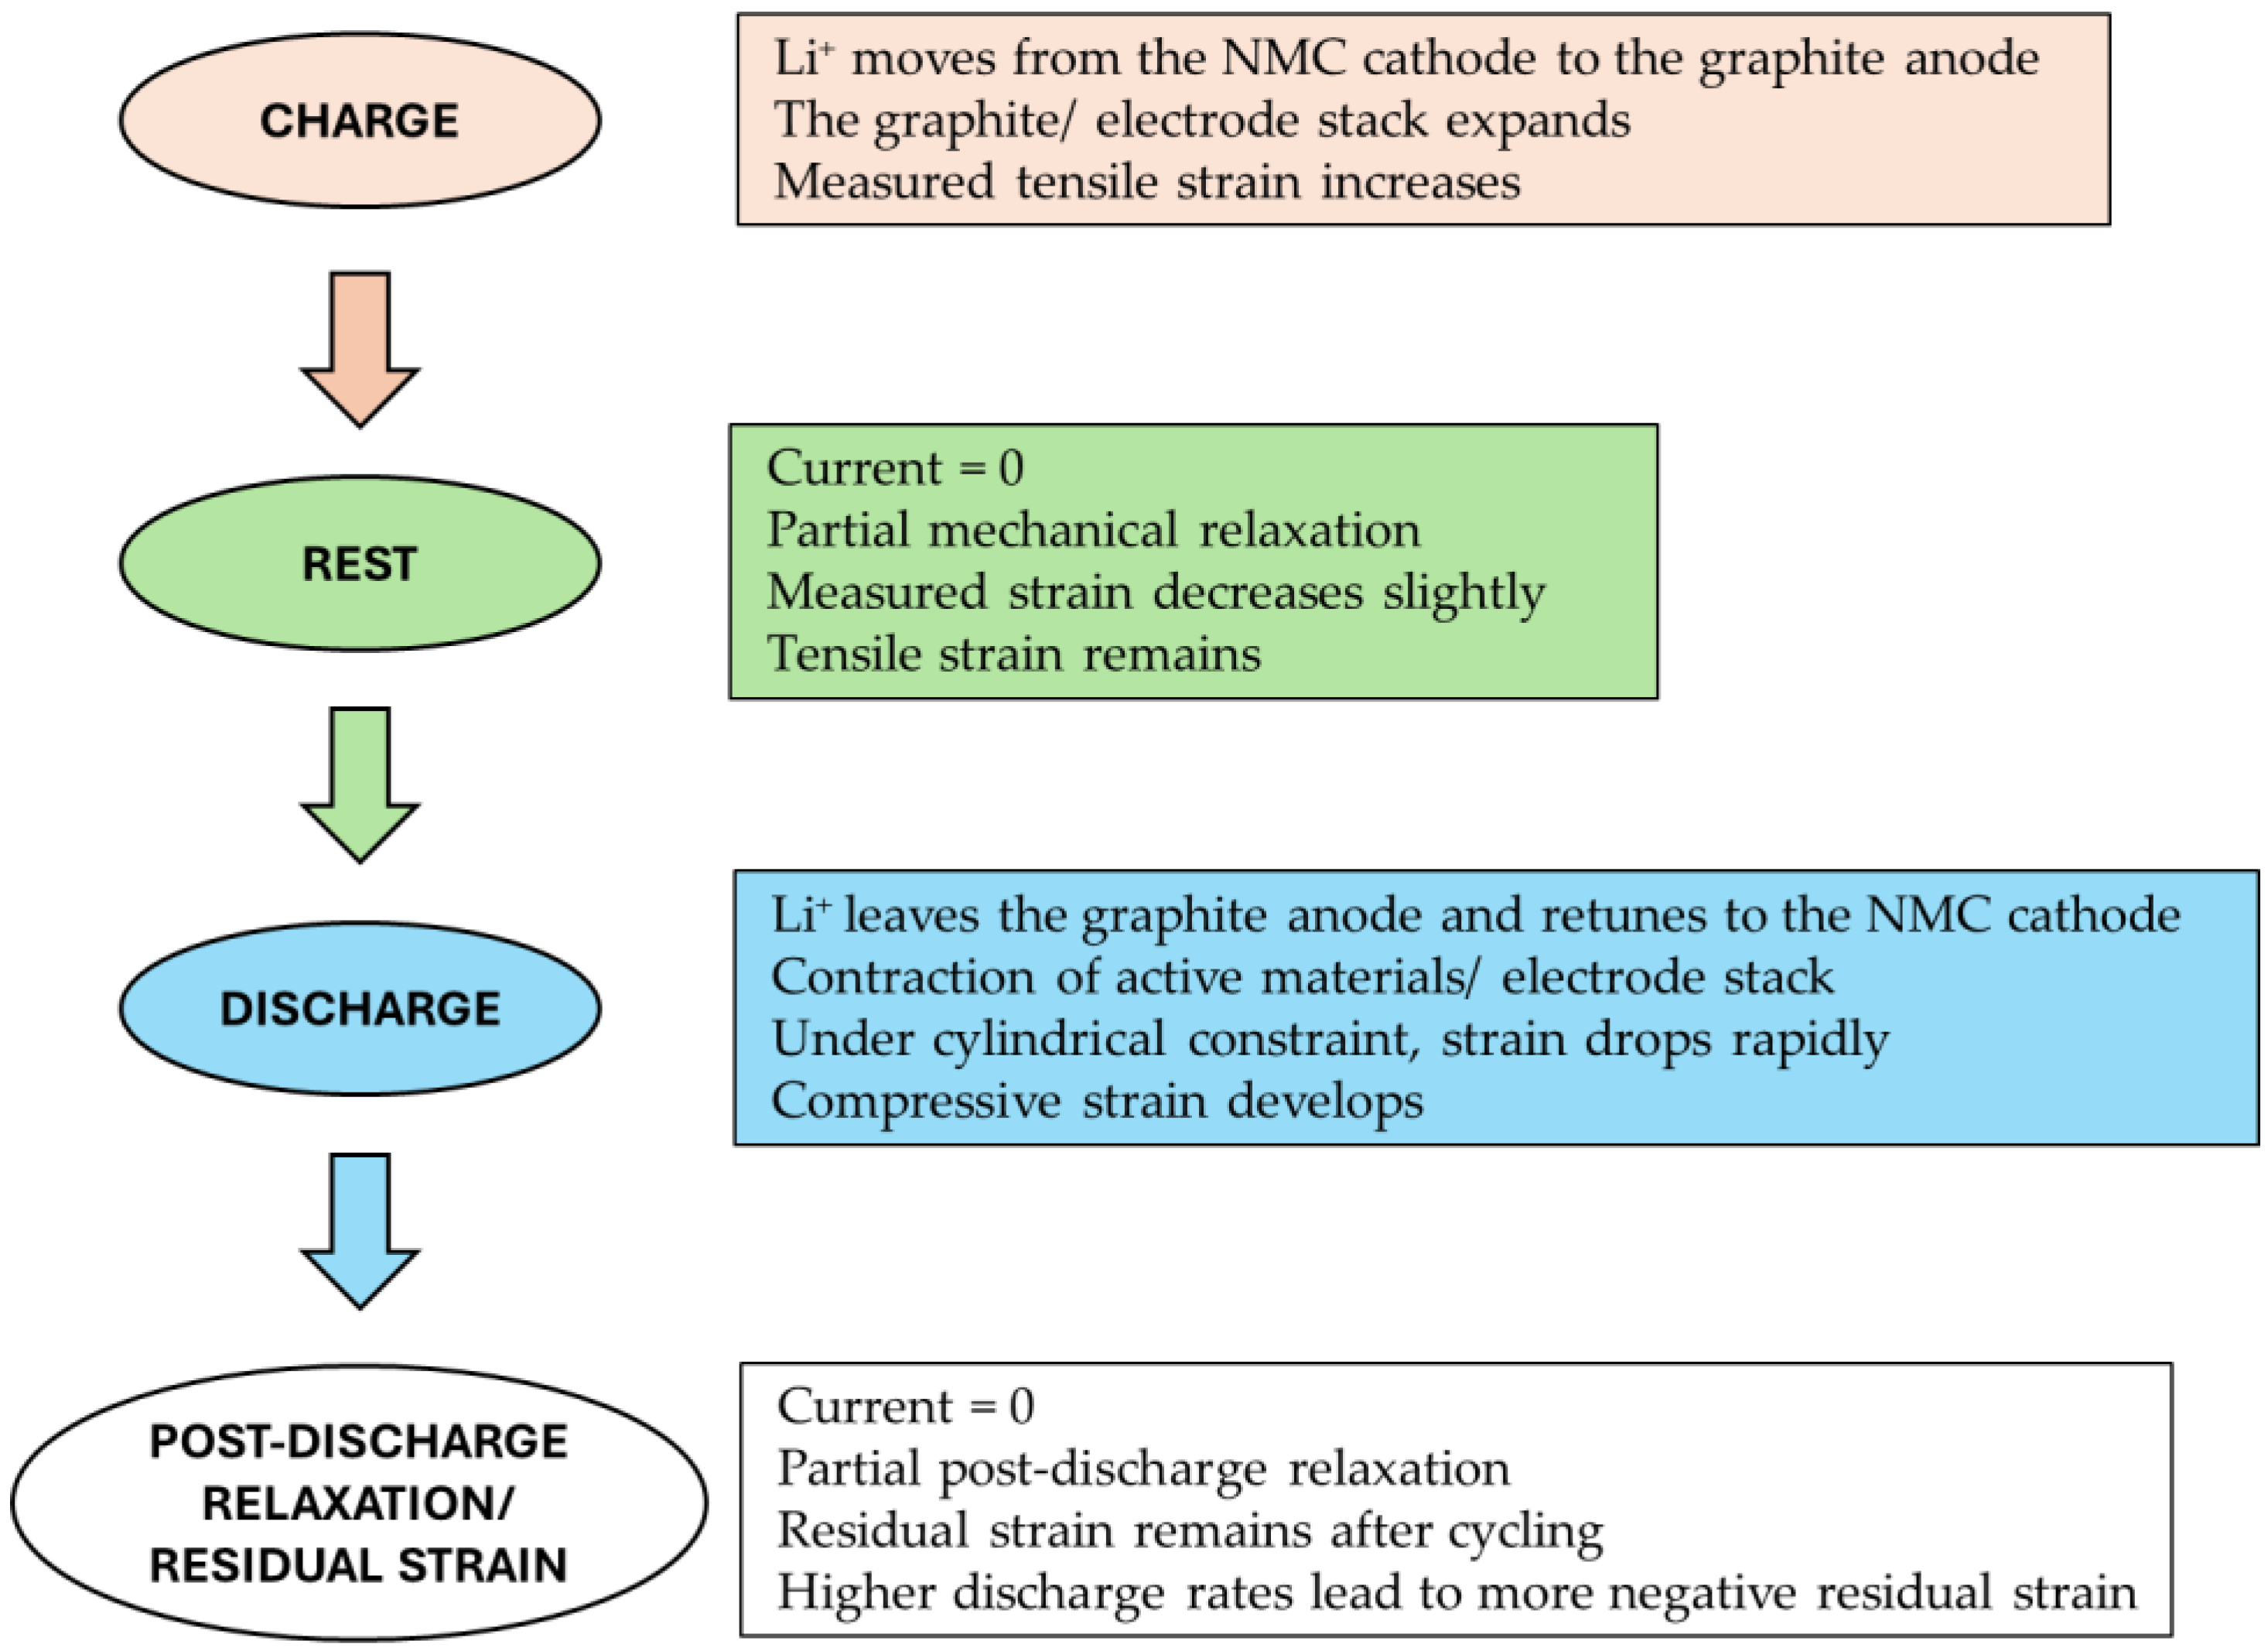
A schematic interpretation of the proposed electrochemically induced stress mechanism corresponding to the strain behavior in Figure 4 is shown in Figure 5. Improved temperature control would be expected to reduce the thermal contribution to cell deformation and strain nonuniformity by limiting temperature rise and internal temperature gradients, although this effect was not directly evaluated in the present study.

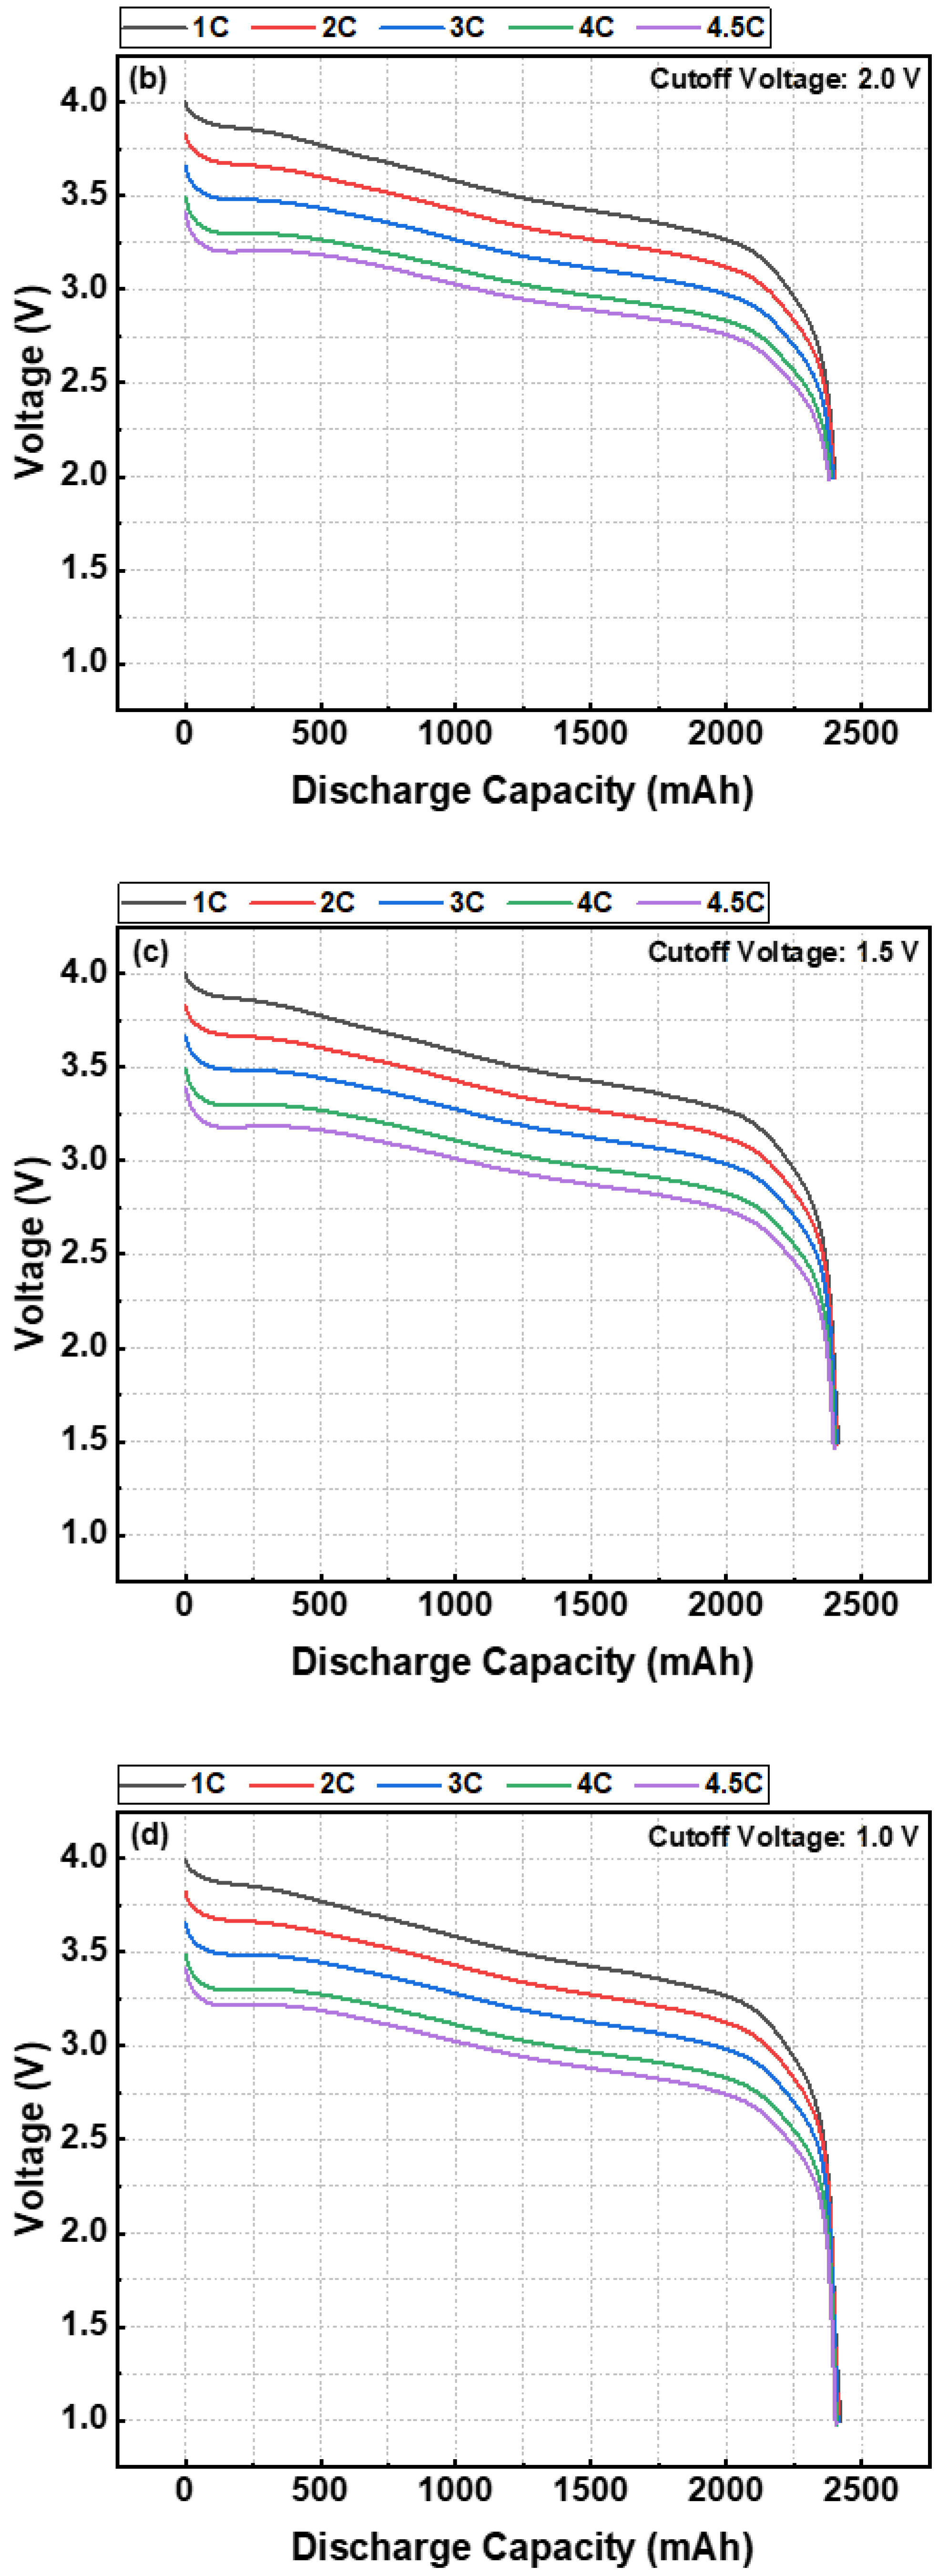
3.4. Effect of Discharge Rate and Cutoff Voltage on Voltage Polarization

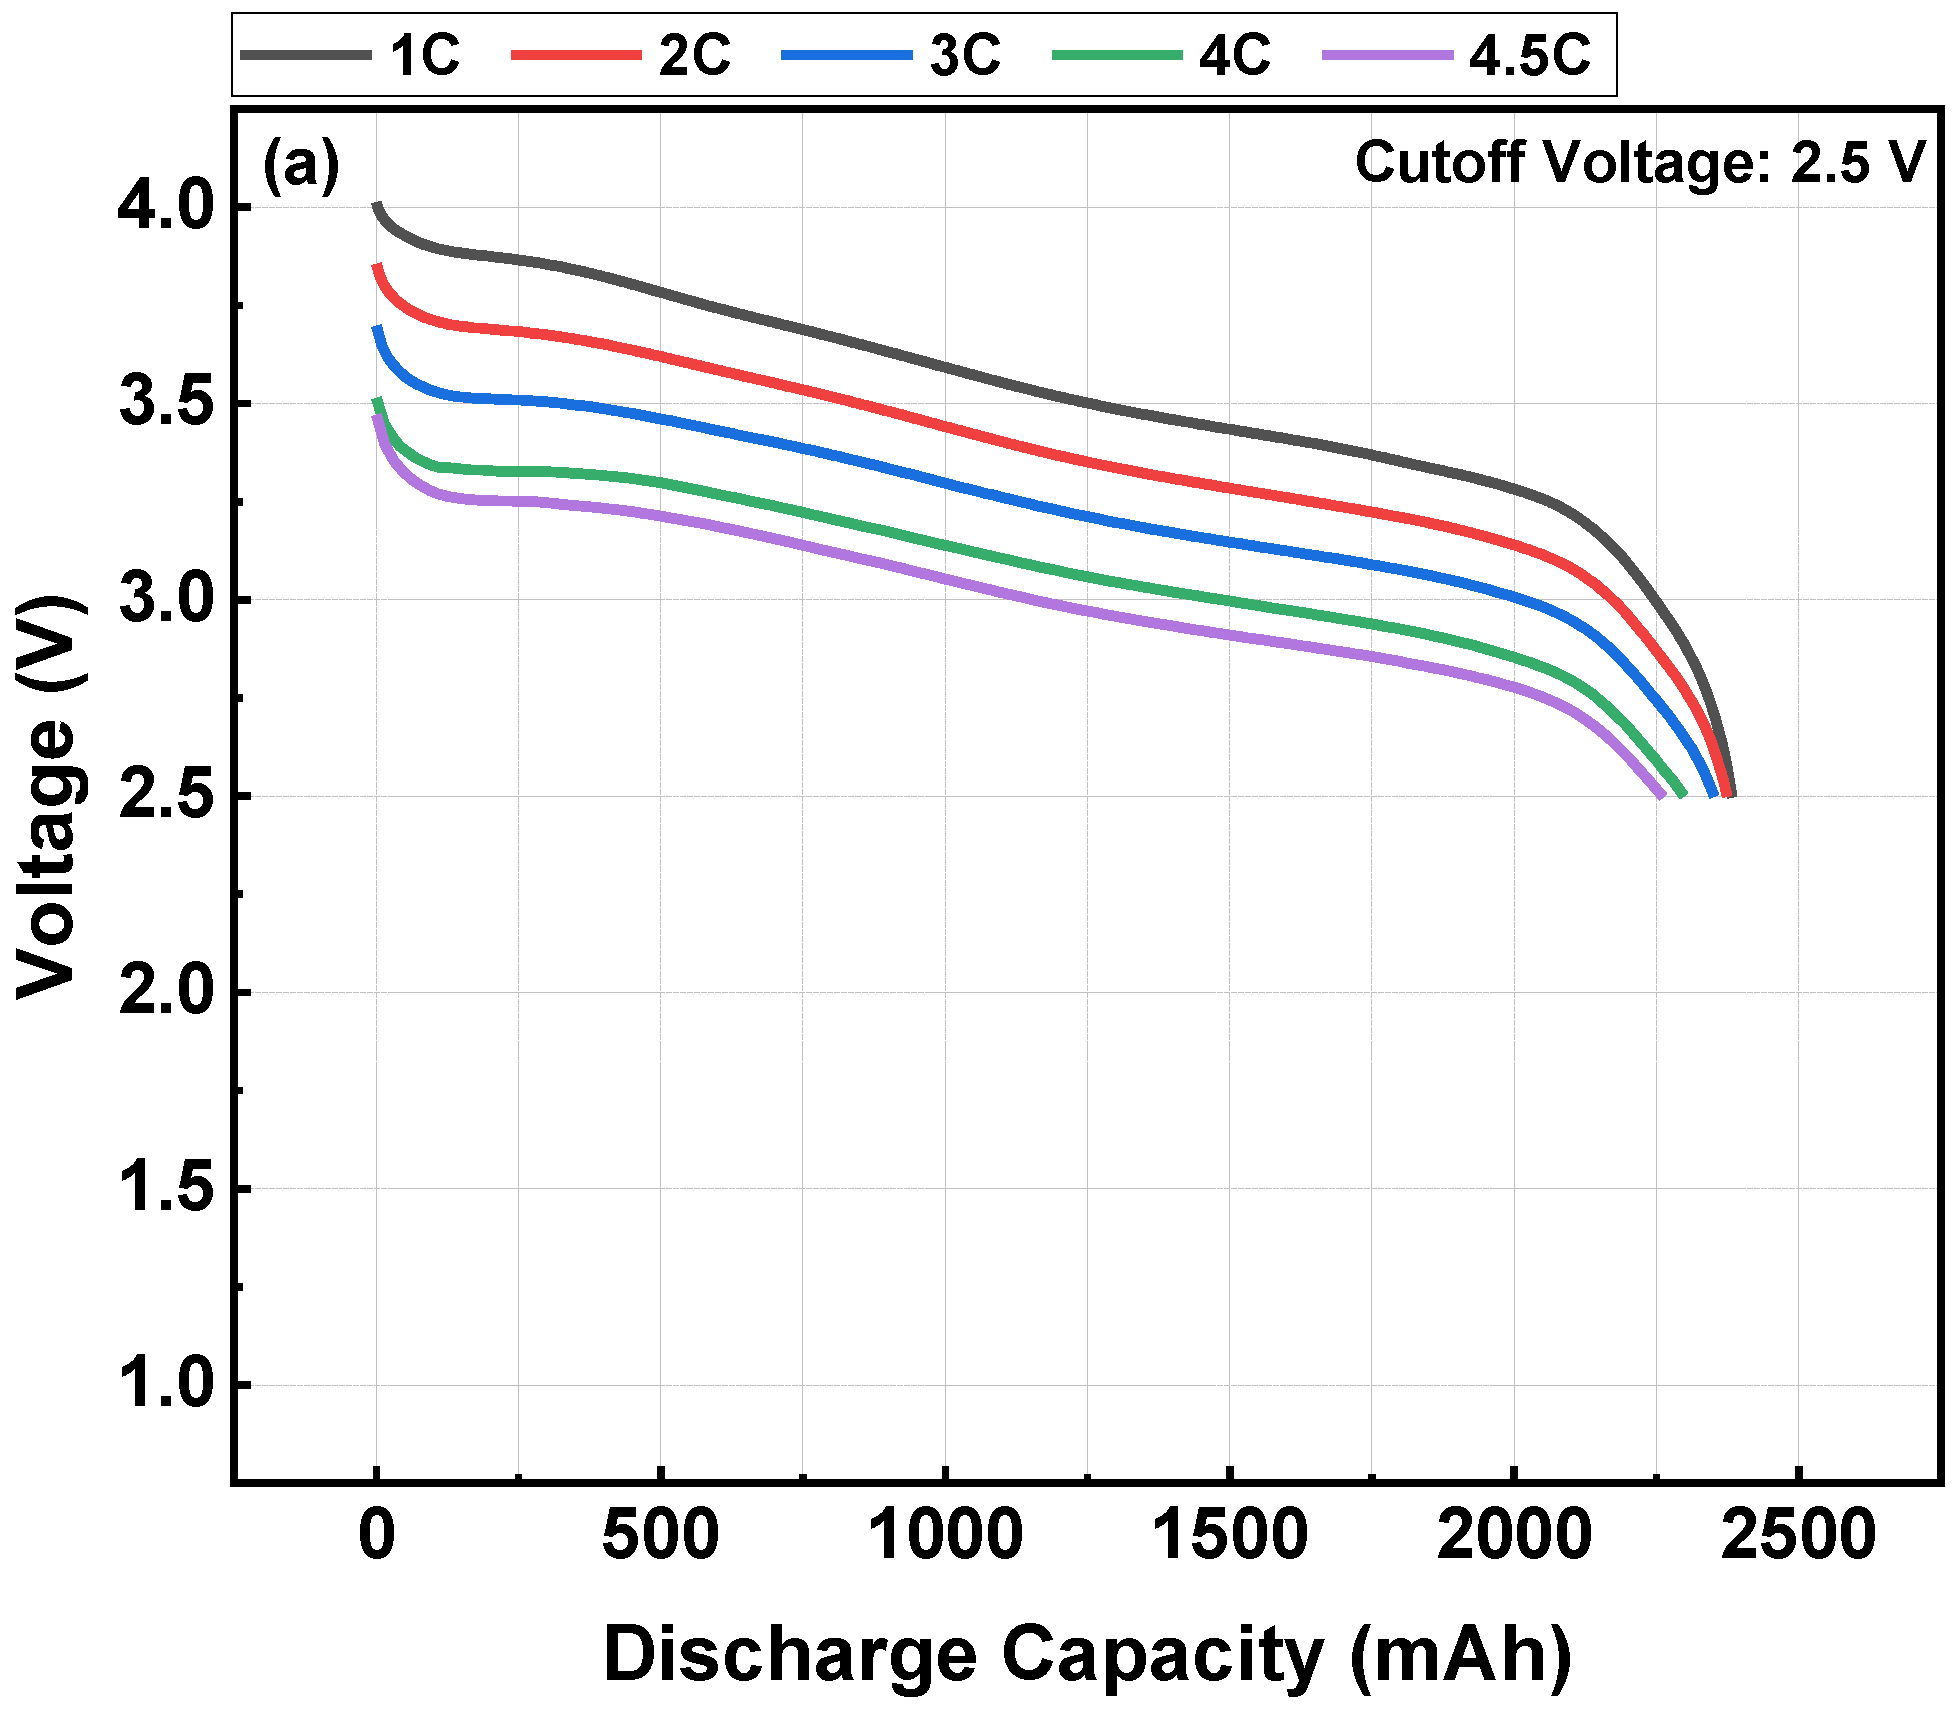
Figure 6 presents the discharge voltage profiles as a function of capacity at five discharge rates (1–4.5 C) under four cutoff voltages (2.5, 2.0, 1.5, and 1.0 V) obtained within the progressive single-cell test sequence. Clear rate-dependent polarization behavior is observed across all cutoff conditions.
At a given cutoff voltage, increasing the discharge rate produces a systematic downward shift of the voltage plateau and a steeper voltage decline during discharge. This behavior reflects enhanced ohmic resistance and charge-transfer polarization at higher current densities. The initial voltage drop becomes more pronounced with increasing C-rate, indicating stronger internal resistance effects. As a result, the effective operating voltage decreases under high-rate conditions despite identical charging protocols.
A moderate reduction in delivered discharge capacity is also observed at higher C-rates. Although the nominal capacity of the cell is 2.5 Ah, the accessible capacity decreases progressively from 1 C to 4.5 C, particularly near the end-of-discharge region. This trend becomes more pronounced under deeper cutoff voltages (1.5 V and 1.0 V), where increased overpotential accelerates the approach to the voltage limit.
Lower cutoff voltages extend the discharge capacity by enabling deeper lithium extraction from the electrode materials. However, this extended delithiation region is accompanied by intensified polarization and a sharper voltage knee near the cutoff point. At 1.0 V, the knee region becomes markedly steeper at high C-rates, indicating elevated electrochemical severity under combined high-rate and deep-discharge operation.
Overall, increasing discharge rate and decreasing cutoff voltage jointly amplify polarization losses and internal electrochemical gradients. These electrochemical effects provide the mechanistic basis for the nonlinear strain evolution and pronounced compressive behavior discussed in the subsequent sections. The cycle capacity showed dependence on cutoff voltage, with lower cutoff voltages generally yielding higher delivered discharge capacity because a deeper discharge window was accessed.

3.5. Quantitative Analysis of Strain Metrics Under Combined Discharge Rate and Cutoff Voltage

3.5.1. Maximum Tensile Strain During CC-CV Charging

Figure 7 summarizes the maximum tensile strain measured during the constant-current–constant-voltage (CC-CV) charging phase at 0.5 C across the progressive sequence of discharge rate and cutoff voltage conditions. Because the charging protocol was identical in every test, variations in peak tensile strain primarily reflect differences in the evolving mechanical state of the tested cell rather than differences in lithiation current.
Across all conditions, the peak charging strain remains within a relatively narrow range (~45–59 µε), indicating that lithiation-induced expansion at 0.5 C remains mechanically constrained and stable throughout the progressive test sequence. The absence of a strong monotonic trend with respect to discharge rate suggests that charging-induced expansion is comparatively insensitive to variations in discharge severity imposed in the preceding cycle.
Importantly, deep-discharge conditions (1.0 V) do not produce a systematic amplification of peak tensile strain during subsequent charging at 0.5 C. This observation suggests that lithiation at moderate rate remains largely accommodated within the elastic tolerance of the cylindrical structure, even after exposure to aggressive discharge conditions. The mechanical asymmetry observed in this study therefore appears to originate predominantly from delithiation-induced contraction rather than from lithiation-induced expansion of the anode.

3.5.2. End-of-Rest Strain After Charging

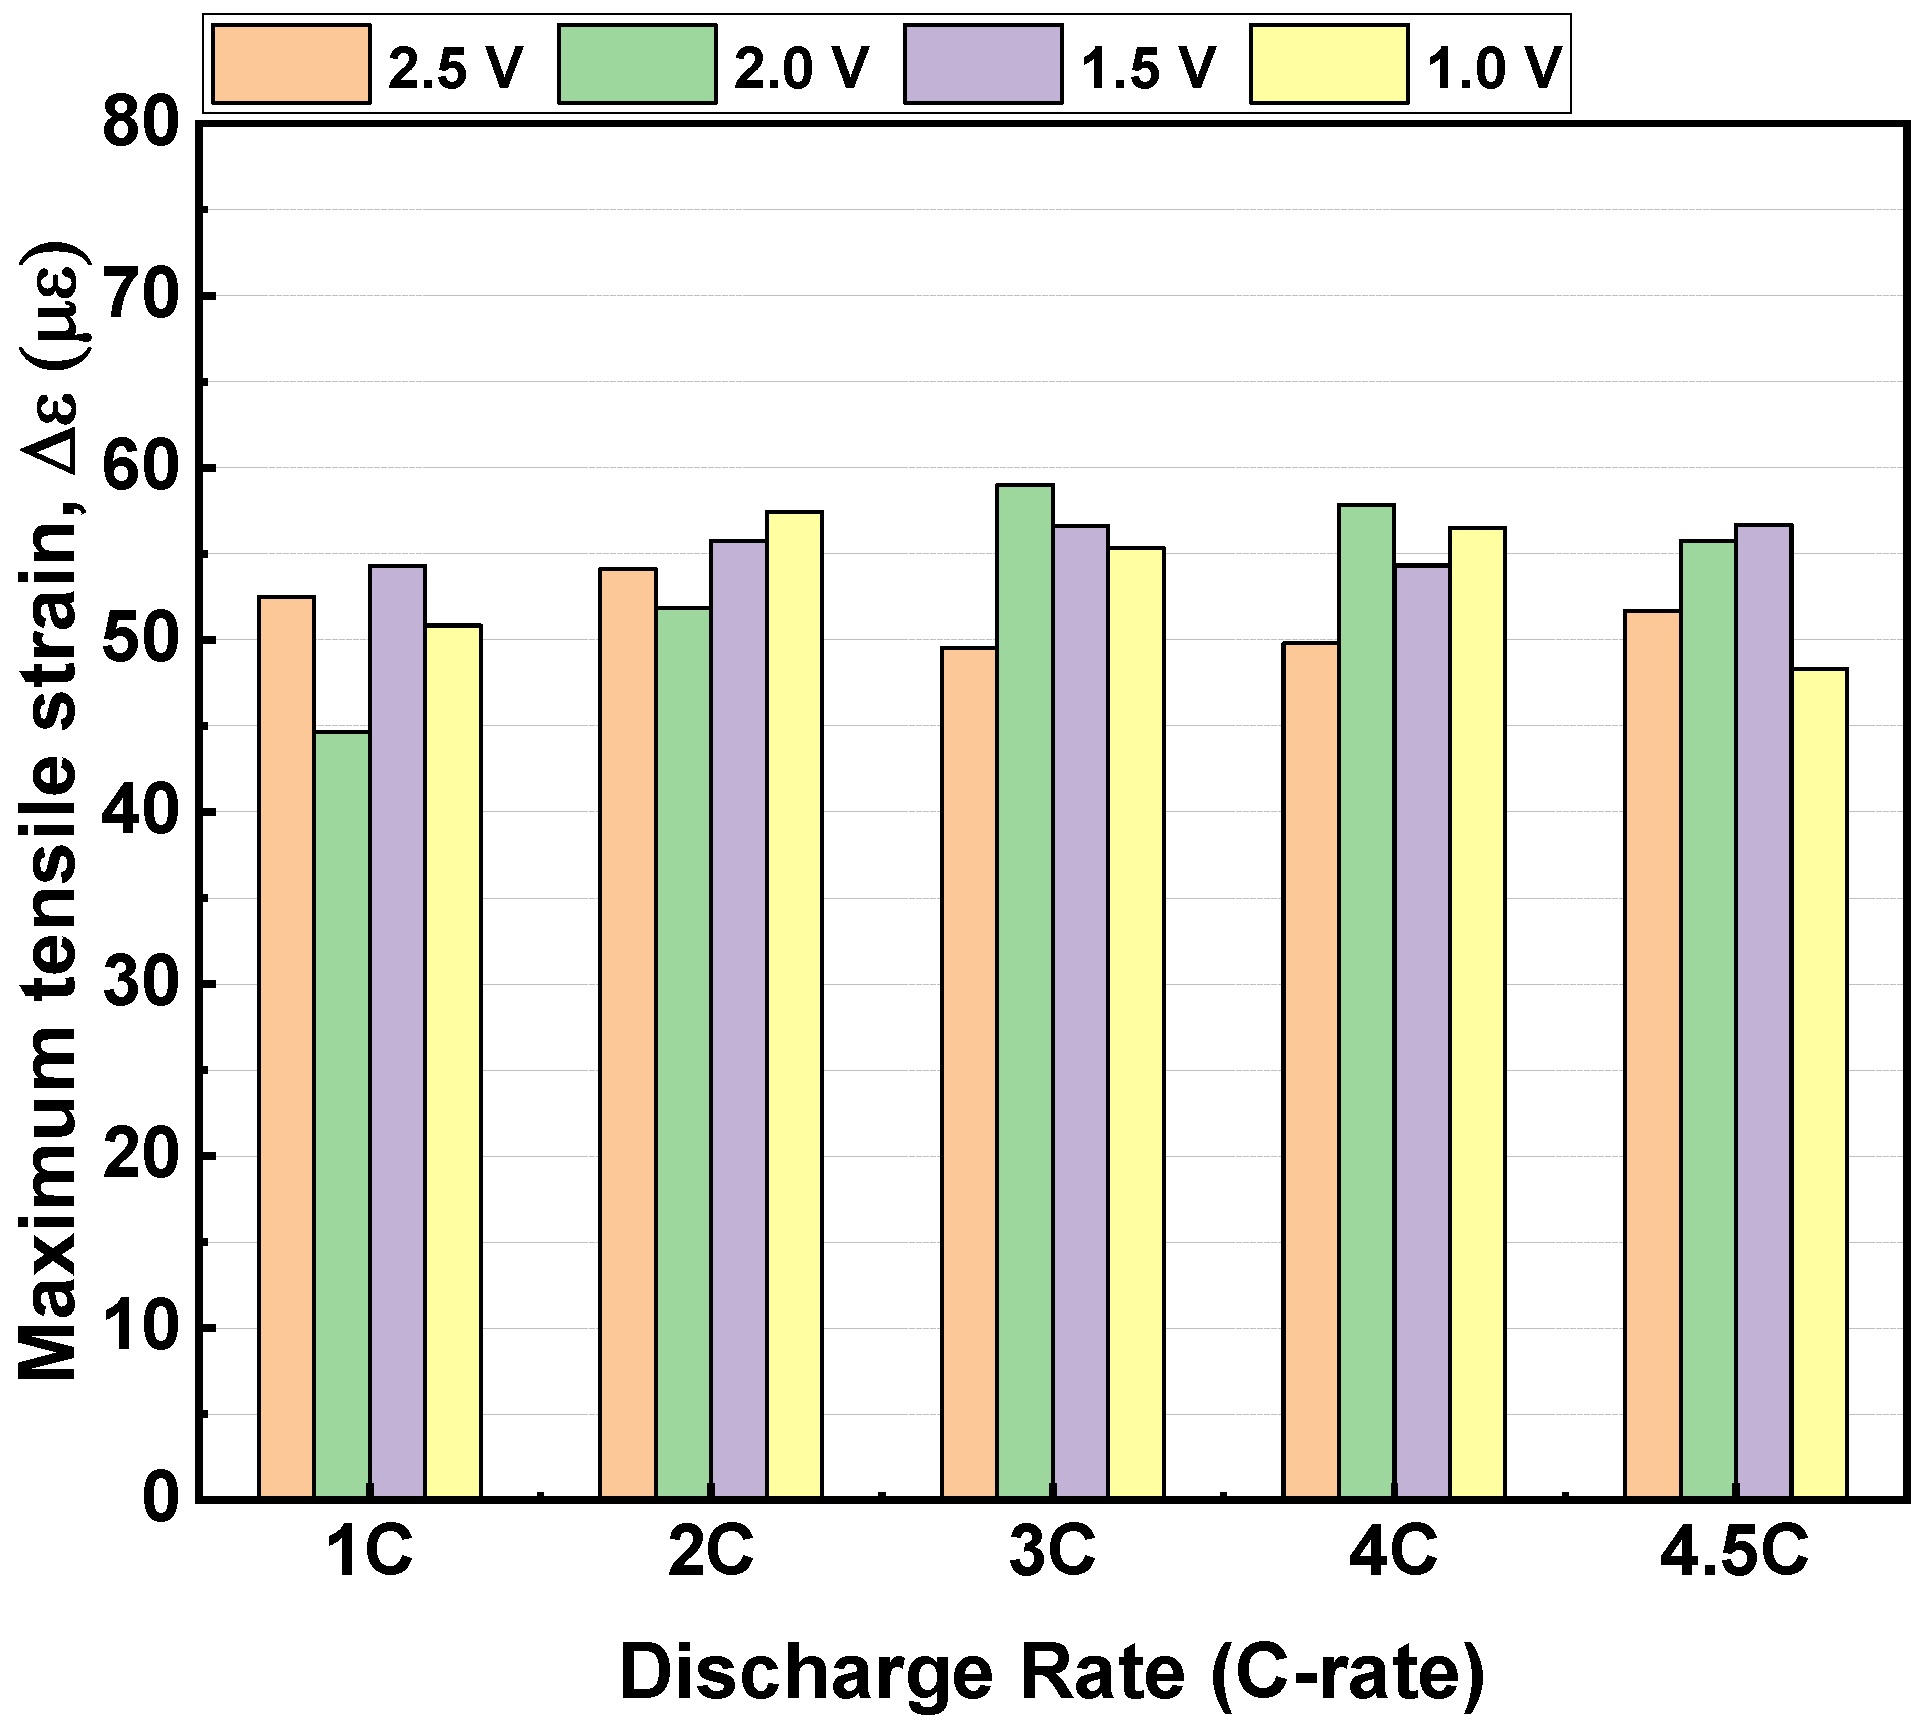
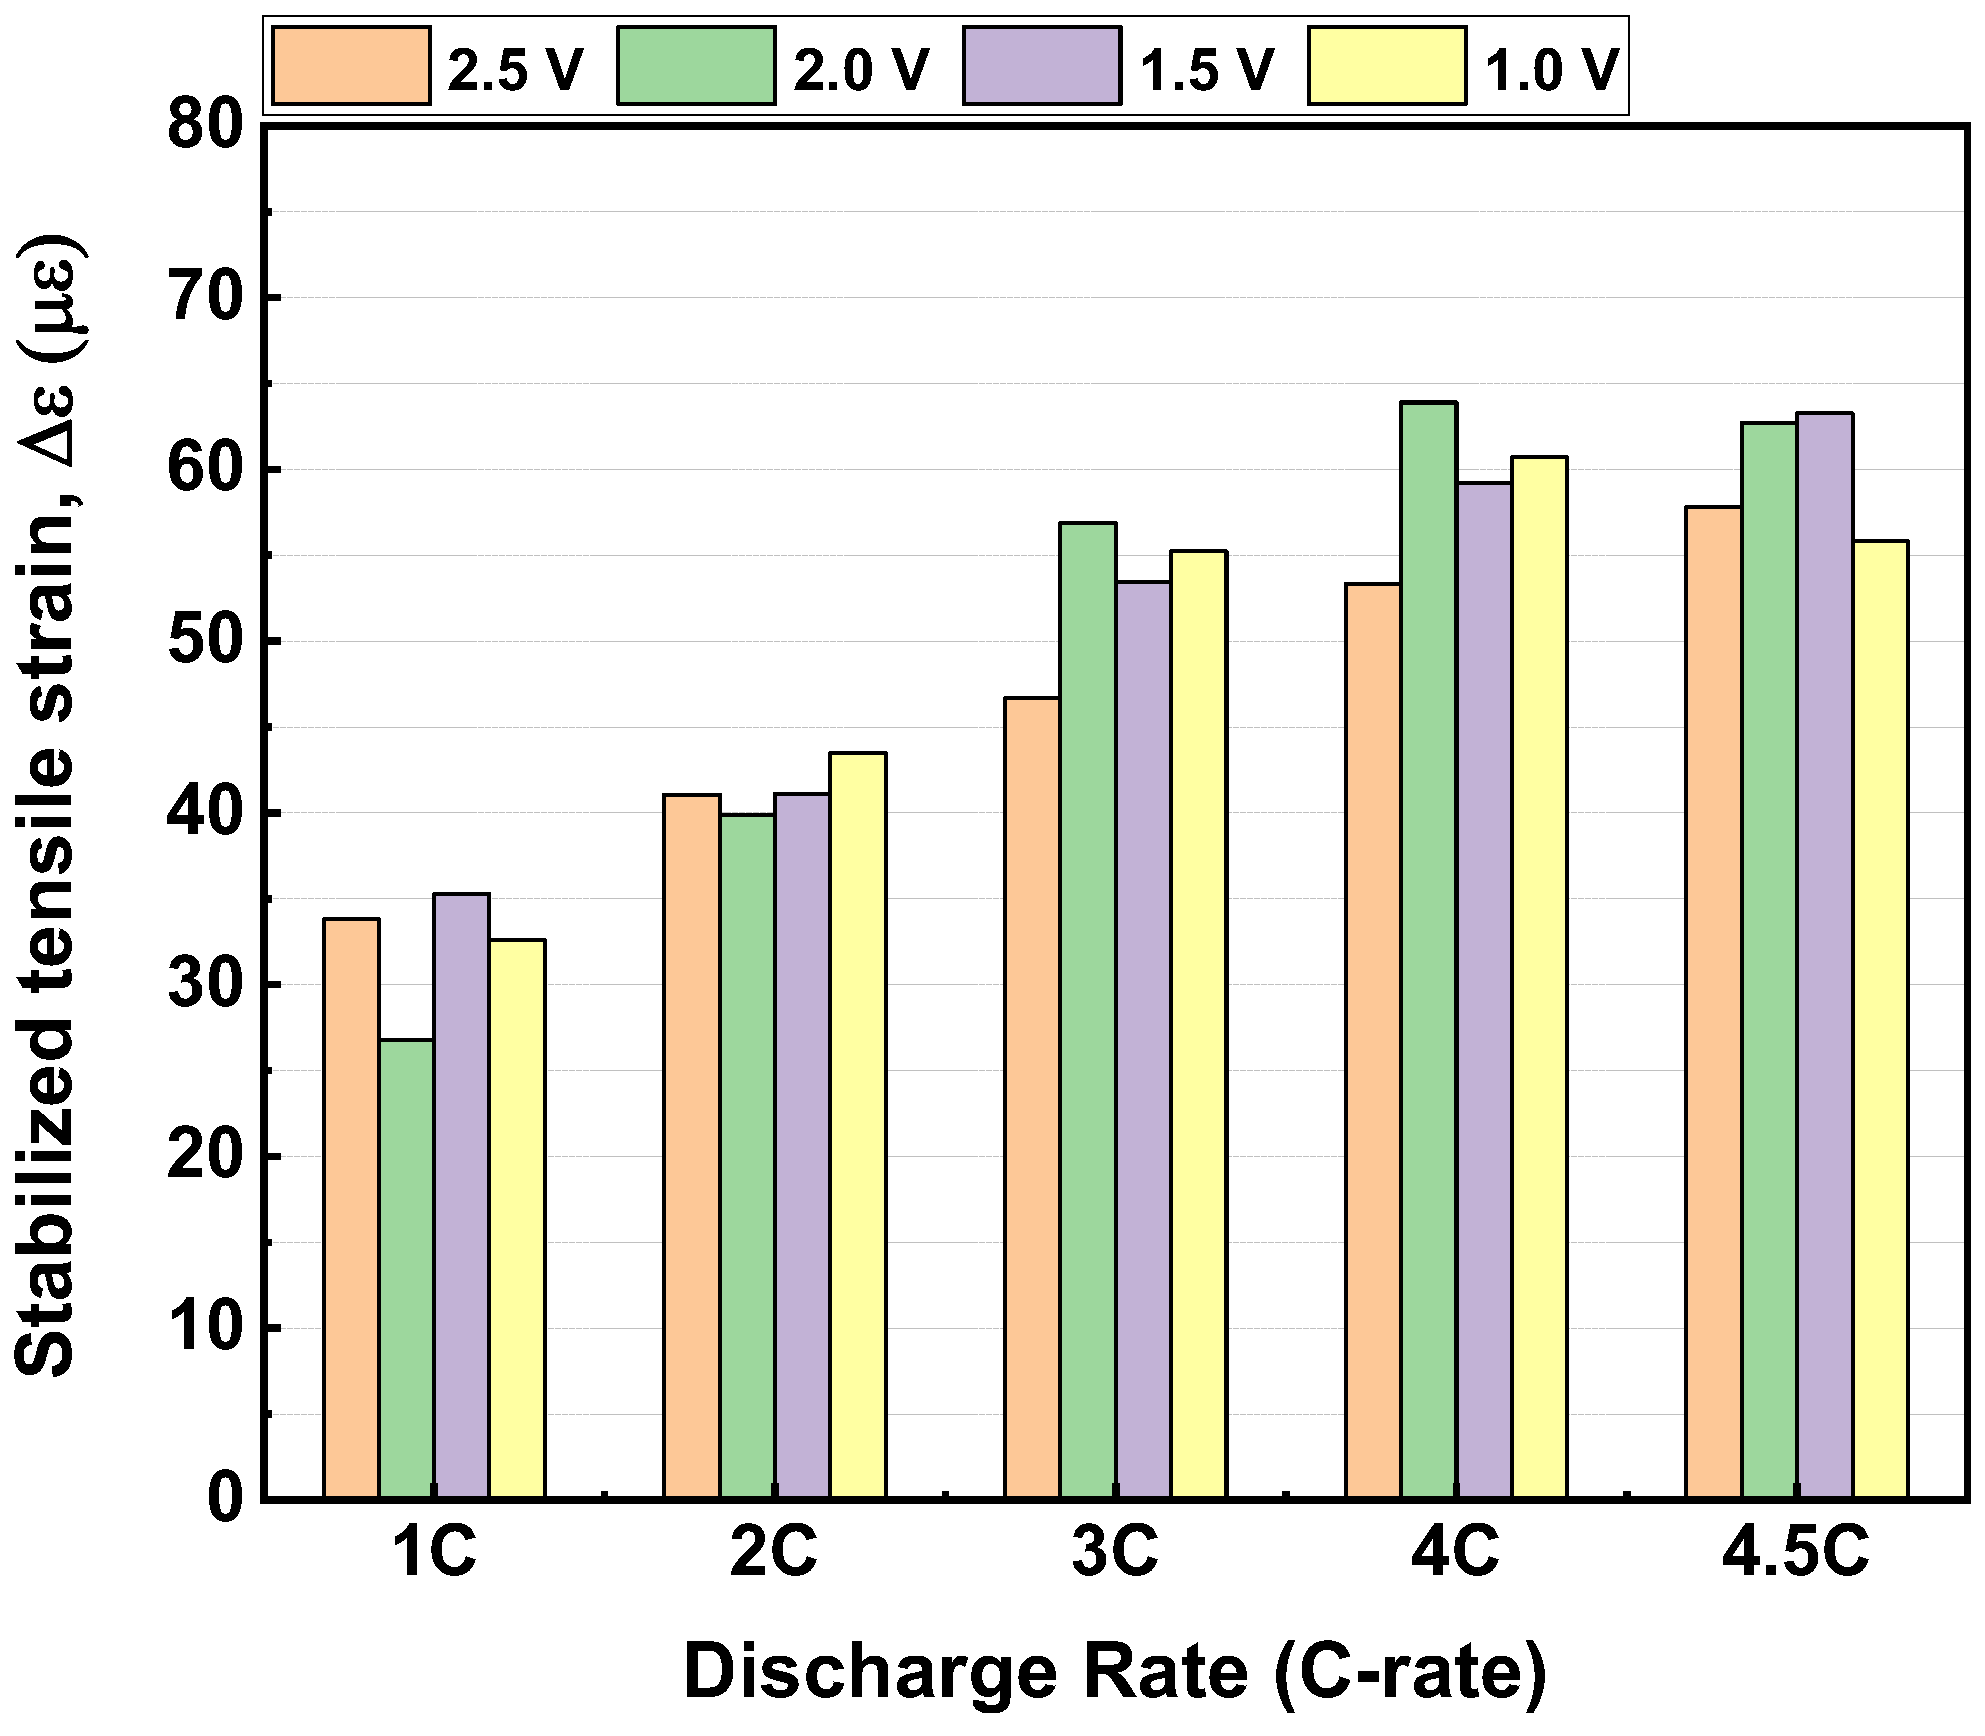
Figure 8 presents the tensile strain measured at the end of the 2 h open-circuit rest period following 0.5 C CC-CV charging within the progressive test sequence. These values represent the stabilized mechanical state immediately prior to discharge initiation for each operating condition.
In all cases, the strain remains positive after the rest period, confirming incomplete mechanical relaxation following lithiation-induced expansion. Compared to the peak charging strain Figure 6, a reduction in magnitude is observed, indicating partial stress redistribution and diffusion-driven equilibration under open-circuit conditions. However, the absence of full recovery suggests that a time-dependent mechanical component persists beyond the 2 h relaxation window.
Unlike the relatively stable peak charging strain, the end-of-rest strain exhibits a gradual increase with increasing discharge rate, particularly at higher rates (4–4.5 C). Although discharge has not yet commenced in the current cycle, each data point reflects the evolving electrochemical and mechanical state of the same cell following exposure to different discharge severities earlier in the sequence. The slight rate dependence of the end-of-rest strain after charging is attributed to history-dependent effects from the preceding discharge condition, including small residual deformation and incomplete relaxation in the sequential single-cell test protocol. More aggressive discharge conditions may leave a modified residual stress distribution or altered lithium concentration gradient, which influences subsequent mechanical relaxation behavior during charging and rest.
The retained tensile strain therefore defines the pre-discharge mechanical baseline for each condition. This mechanically preconditioned state contributes to the magnitude of the subsequent tensile spike and peak compressive strain observed during discharge. These results demonstrate that mechanical memory effects persist across sequential operating conditions, highlighting the cumulative nature of mechanochemical evolution in the tested cell.

3.5.3. Maximum Transient Strain During Discharge

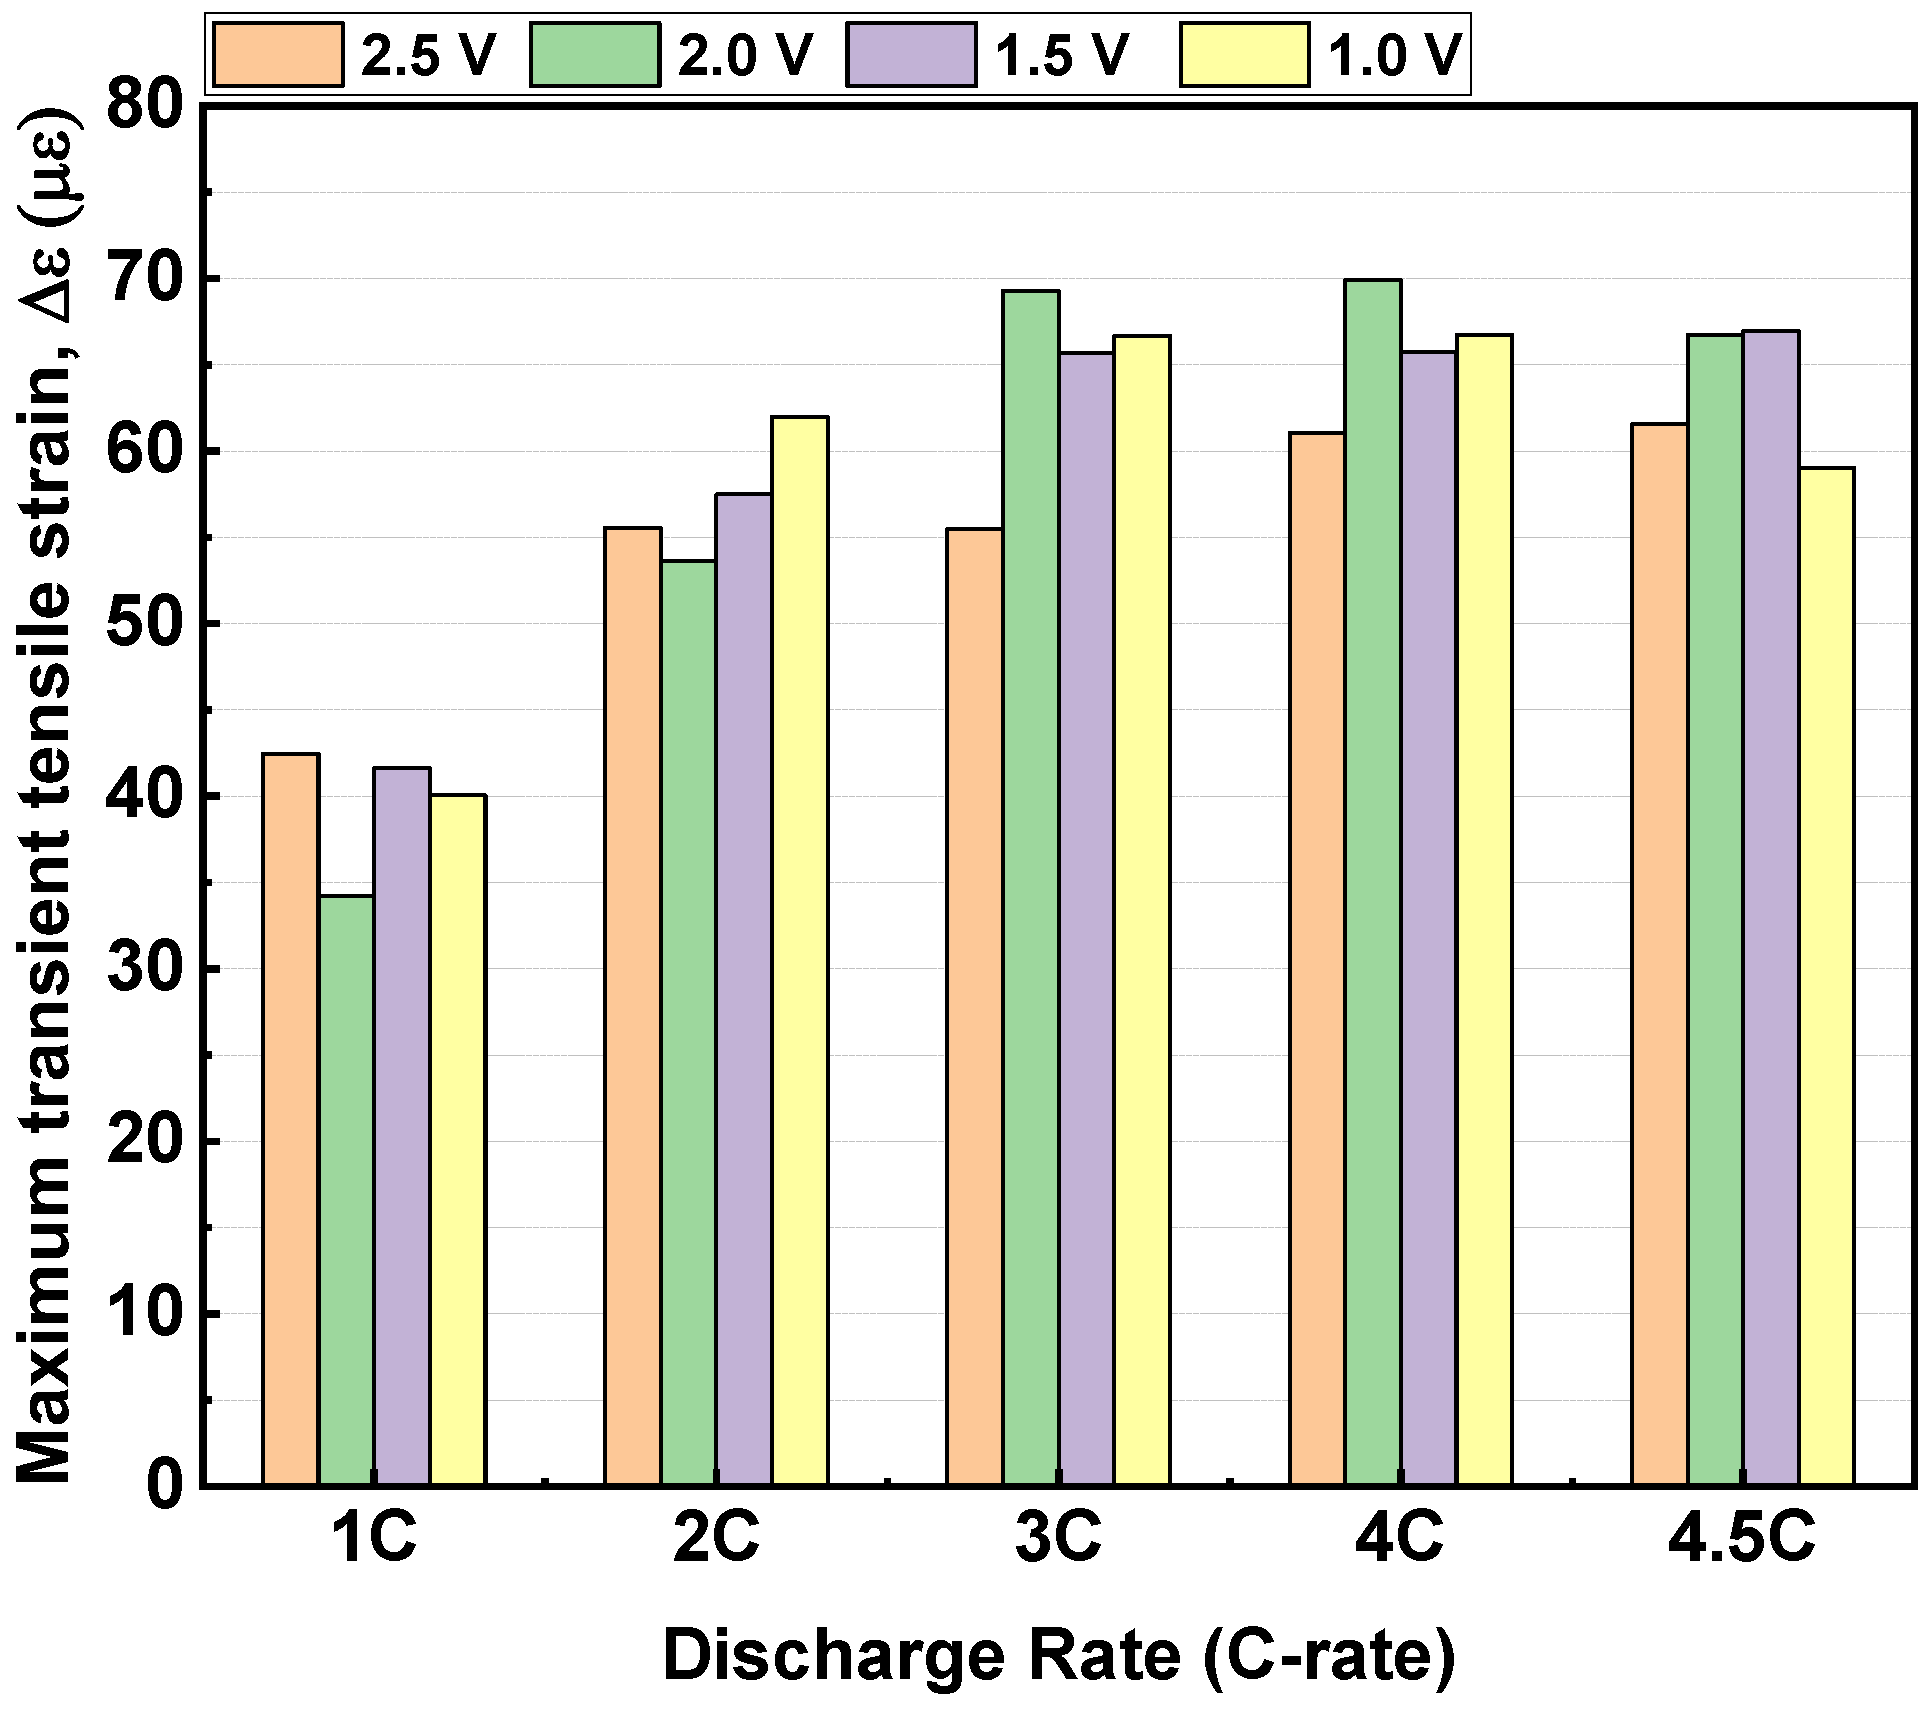
Figure 9 presents the maximum tensile strain observed immediately after discharge initiation across the progressive sequence of discharge rates and cutoff voltages. This value corresponds to a transient strain spike occurring during the transition from open-circuit rest to constant-current discharge, prior to the development of dominant contraction behavior.
A pronounced rate dependence is evident. At 1 C, the transient strain remains moderate (~34–42 µε), whereas increasing the discharge rate to 3 C results in a substantial rise in peak tensile strain, reaching ~69 µε. This trend is consistent with intensified electrochemical polarization and rapid concentration-gradient development at higher current densities.
The transient tensile spike is consistent with a diffusion-induced stress response associated with nonuniform delithiation across the electrode thickness. At elevated C-rates, the larger transient spike is consistent with more severe transient lithium concentration gradients developing between surface and interior regions of active particles and across the electrode stack. The resulting differential strain may contribute to a temporary mechanical expansion of the cylindrical casing before bulk contraction dominates as delithiation progresses.
Beyond 3 C, the peak strain exhibits partial saturation or fluctuation at 4–4.5 C. This nonlinearity suggests that mechanical response does not increase indefinitely with current density, likely because transport limitations and polarization-dominated behavior restrict further gradient amplification under extreme discharge conditions.
Compared to the relatively stable peak strain during 0.5 C charging Figure 6, the discharge-induced transient spike becomes significantly larger at elevated C-rates, highlighting the asymmetric mechanical response between lithiation and delithiation. Within the progressive single-cell framework, these transient stress excursions represent an additional mechanical loading component that intensifies under high-rate operation and contributes to the evolving mechanochemical state of the cell.

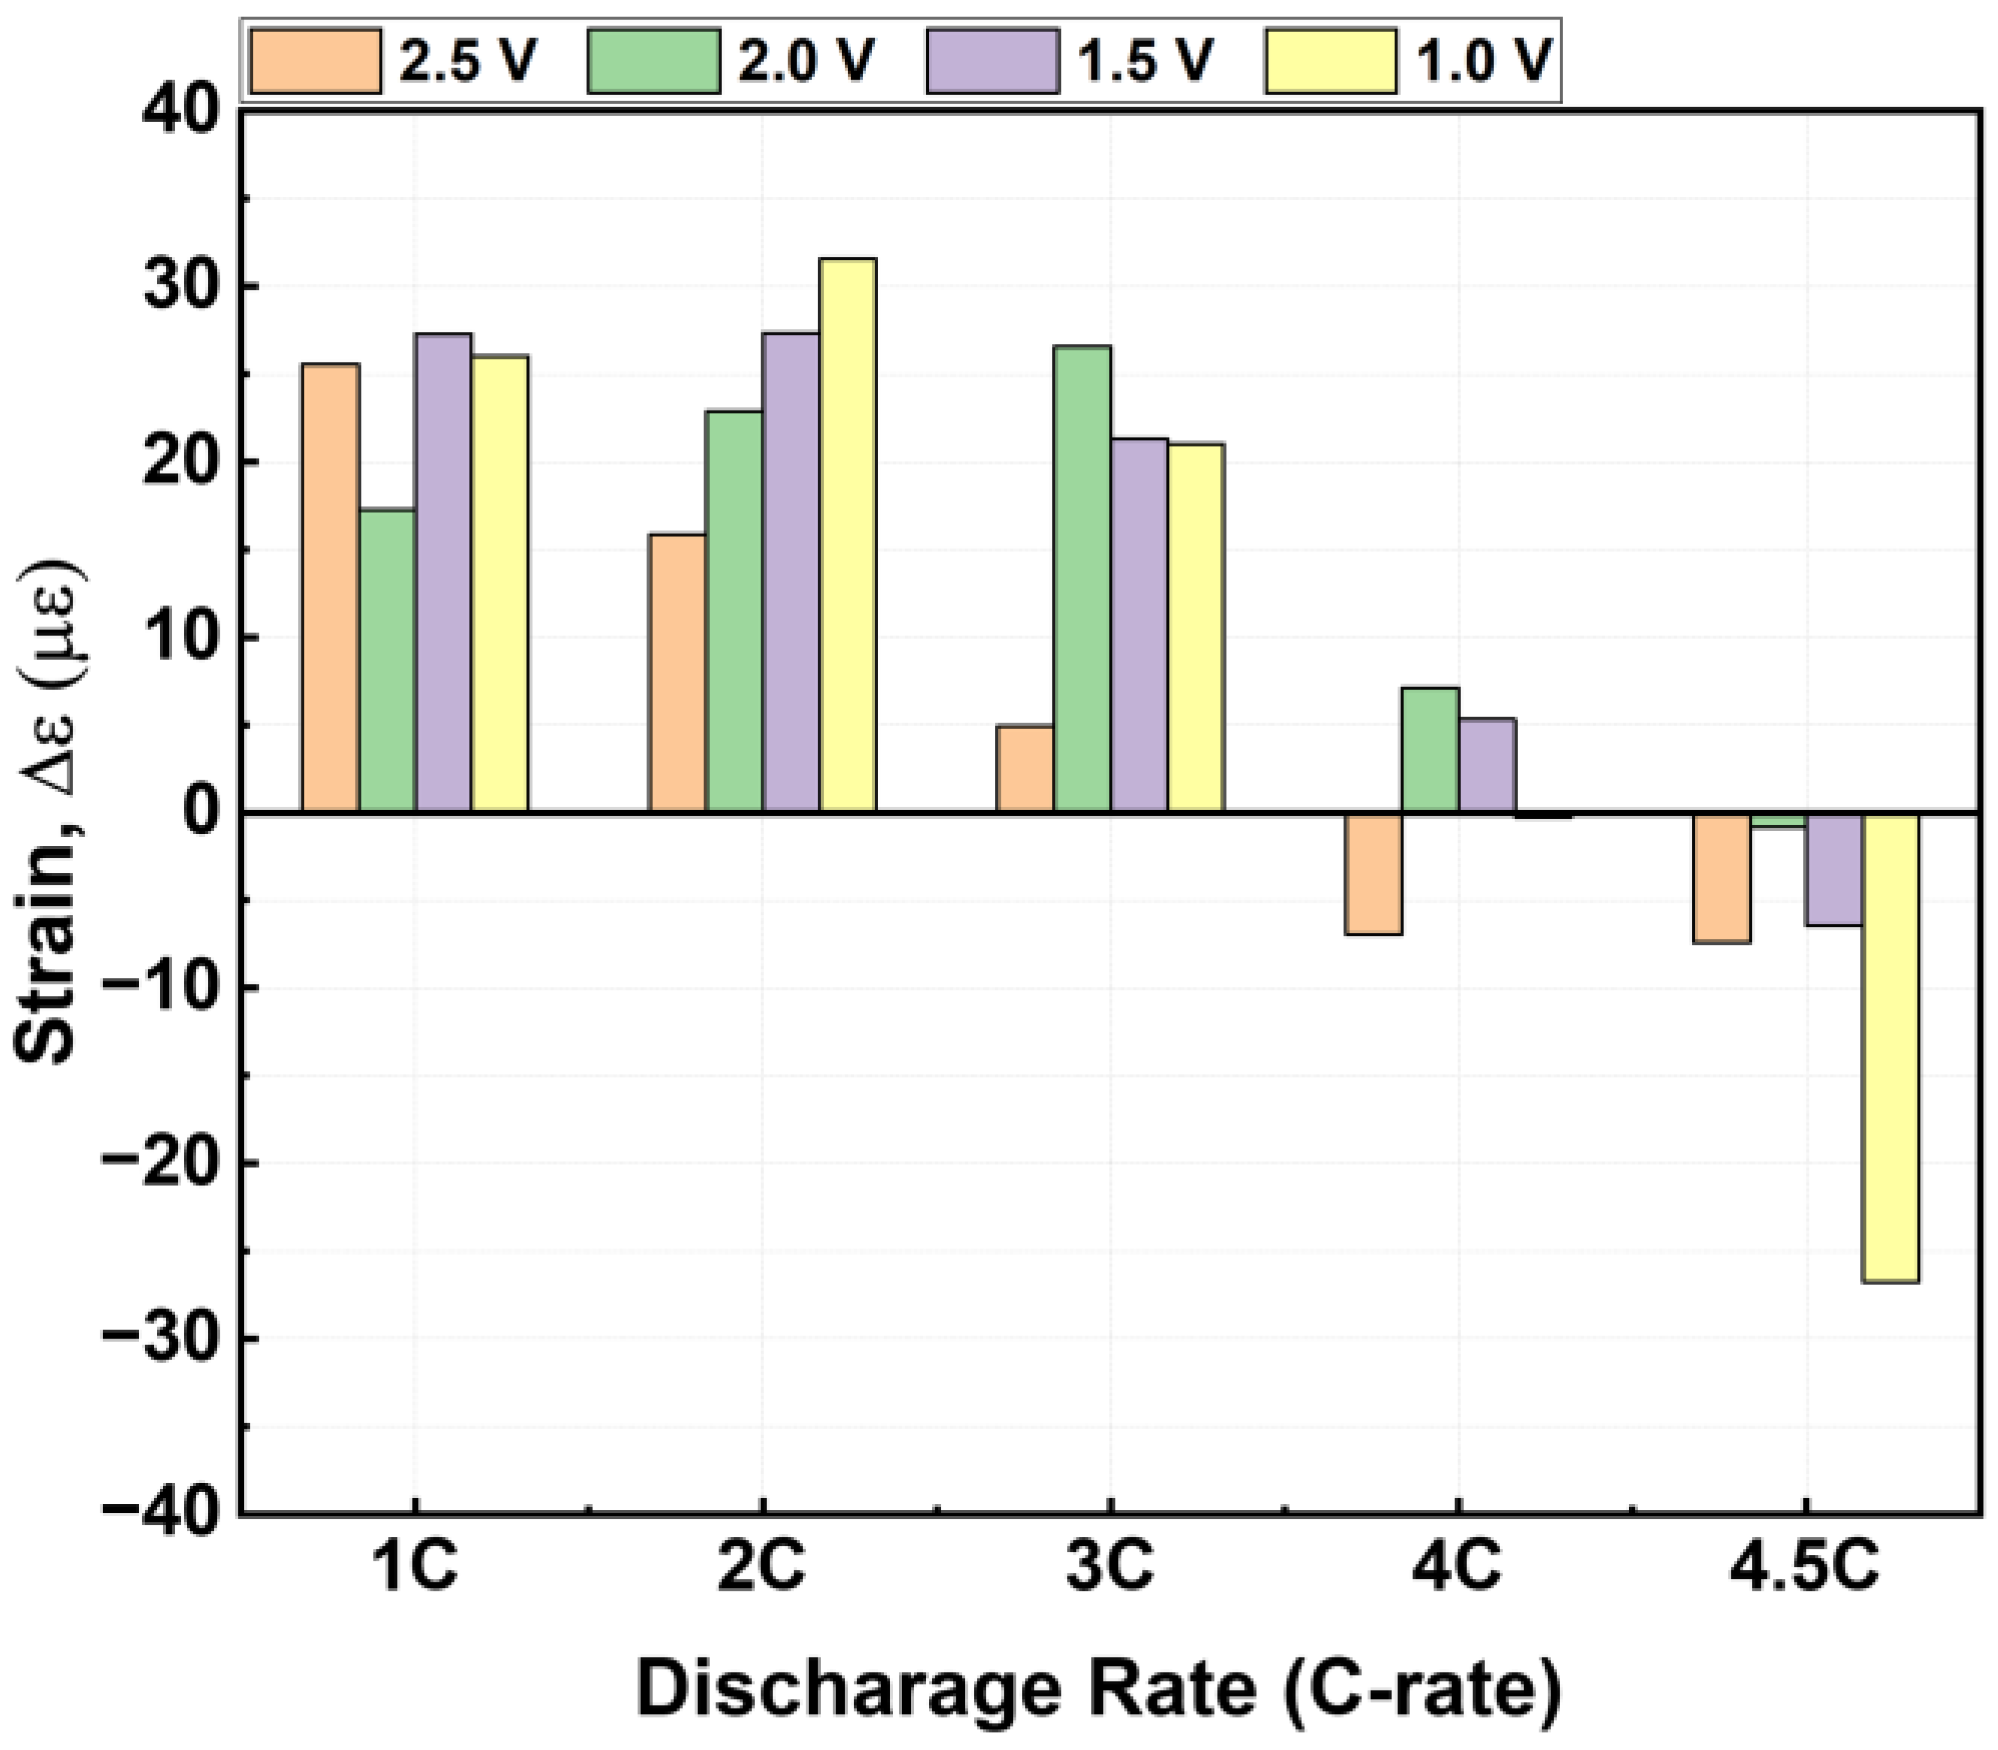
3.5.4. Peak Compressive Strain During Discharge

Figure 10 presents the minimum strain attained during discharge, corresponding to the maximum mechanical contraction (peak compressive strain) observed within the progressive sequence of discharge rates and cutoff voltages. In contrast to the predominant tensile deformation during charging, the discharge phase exhibits an increasing tendency toward compressive behavior as electrochemical severity intensifies.
A compressive response becomes evident at high discharge rates (4–4.5 C), particularly under deeper cutoff voltages. At 4.5 C with a 1.0 V cutoff, the minimum strain reaches approximately −27 µε. This strongly negative value indicates that delithiation-induced contraction exceeds the retained tensile baseline established during charging and rest, resulting in net macroscopic contraction of the constrained cylindrical structure.
The combined influence of discharge rate and cutoff voltage reflects a synergistic mechanochemical effect within the progressive single-cell framework. Increasing C-rate enhances electrochemical polarization and accelerates the formation of lithium concentration gradients, while lowering the cutoff voltage enforces deeper delithiation. Together, these factors amplify internal stress heterogeneity and promote more severe compressive deformation.
Rather than representing an isolated failure event, the peak compressive strain indicates a shift in the balance between expansion and contraction mechanisms under aggressive discharge conditions. Within the sequential test design, the increasing magnitude of compressive excursion provides a quantitative measure of mechanical severity and highlights operating regimes that intensify mechanochemical loading. The complete strain evolution profiles for each discharge rate and cutoff voltage are provided in the Supplementary Information (Figure S1).

3.5.5. Residual Strain After Discharge

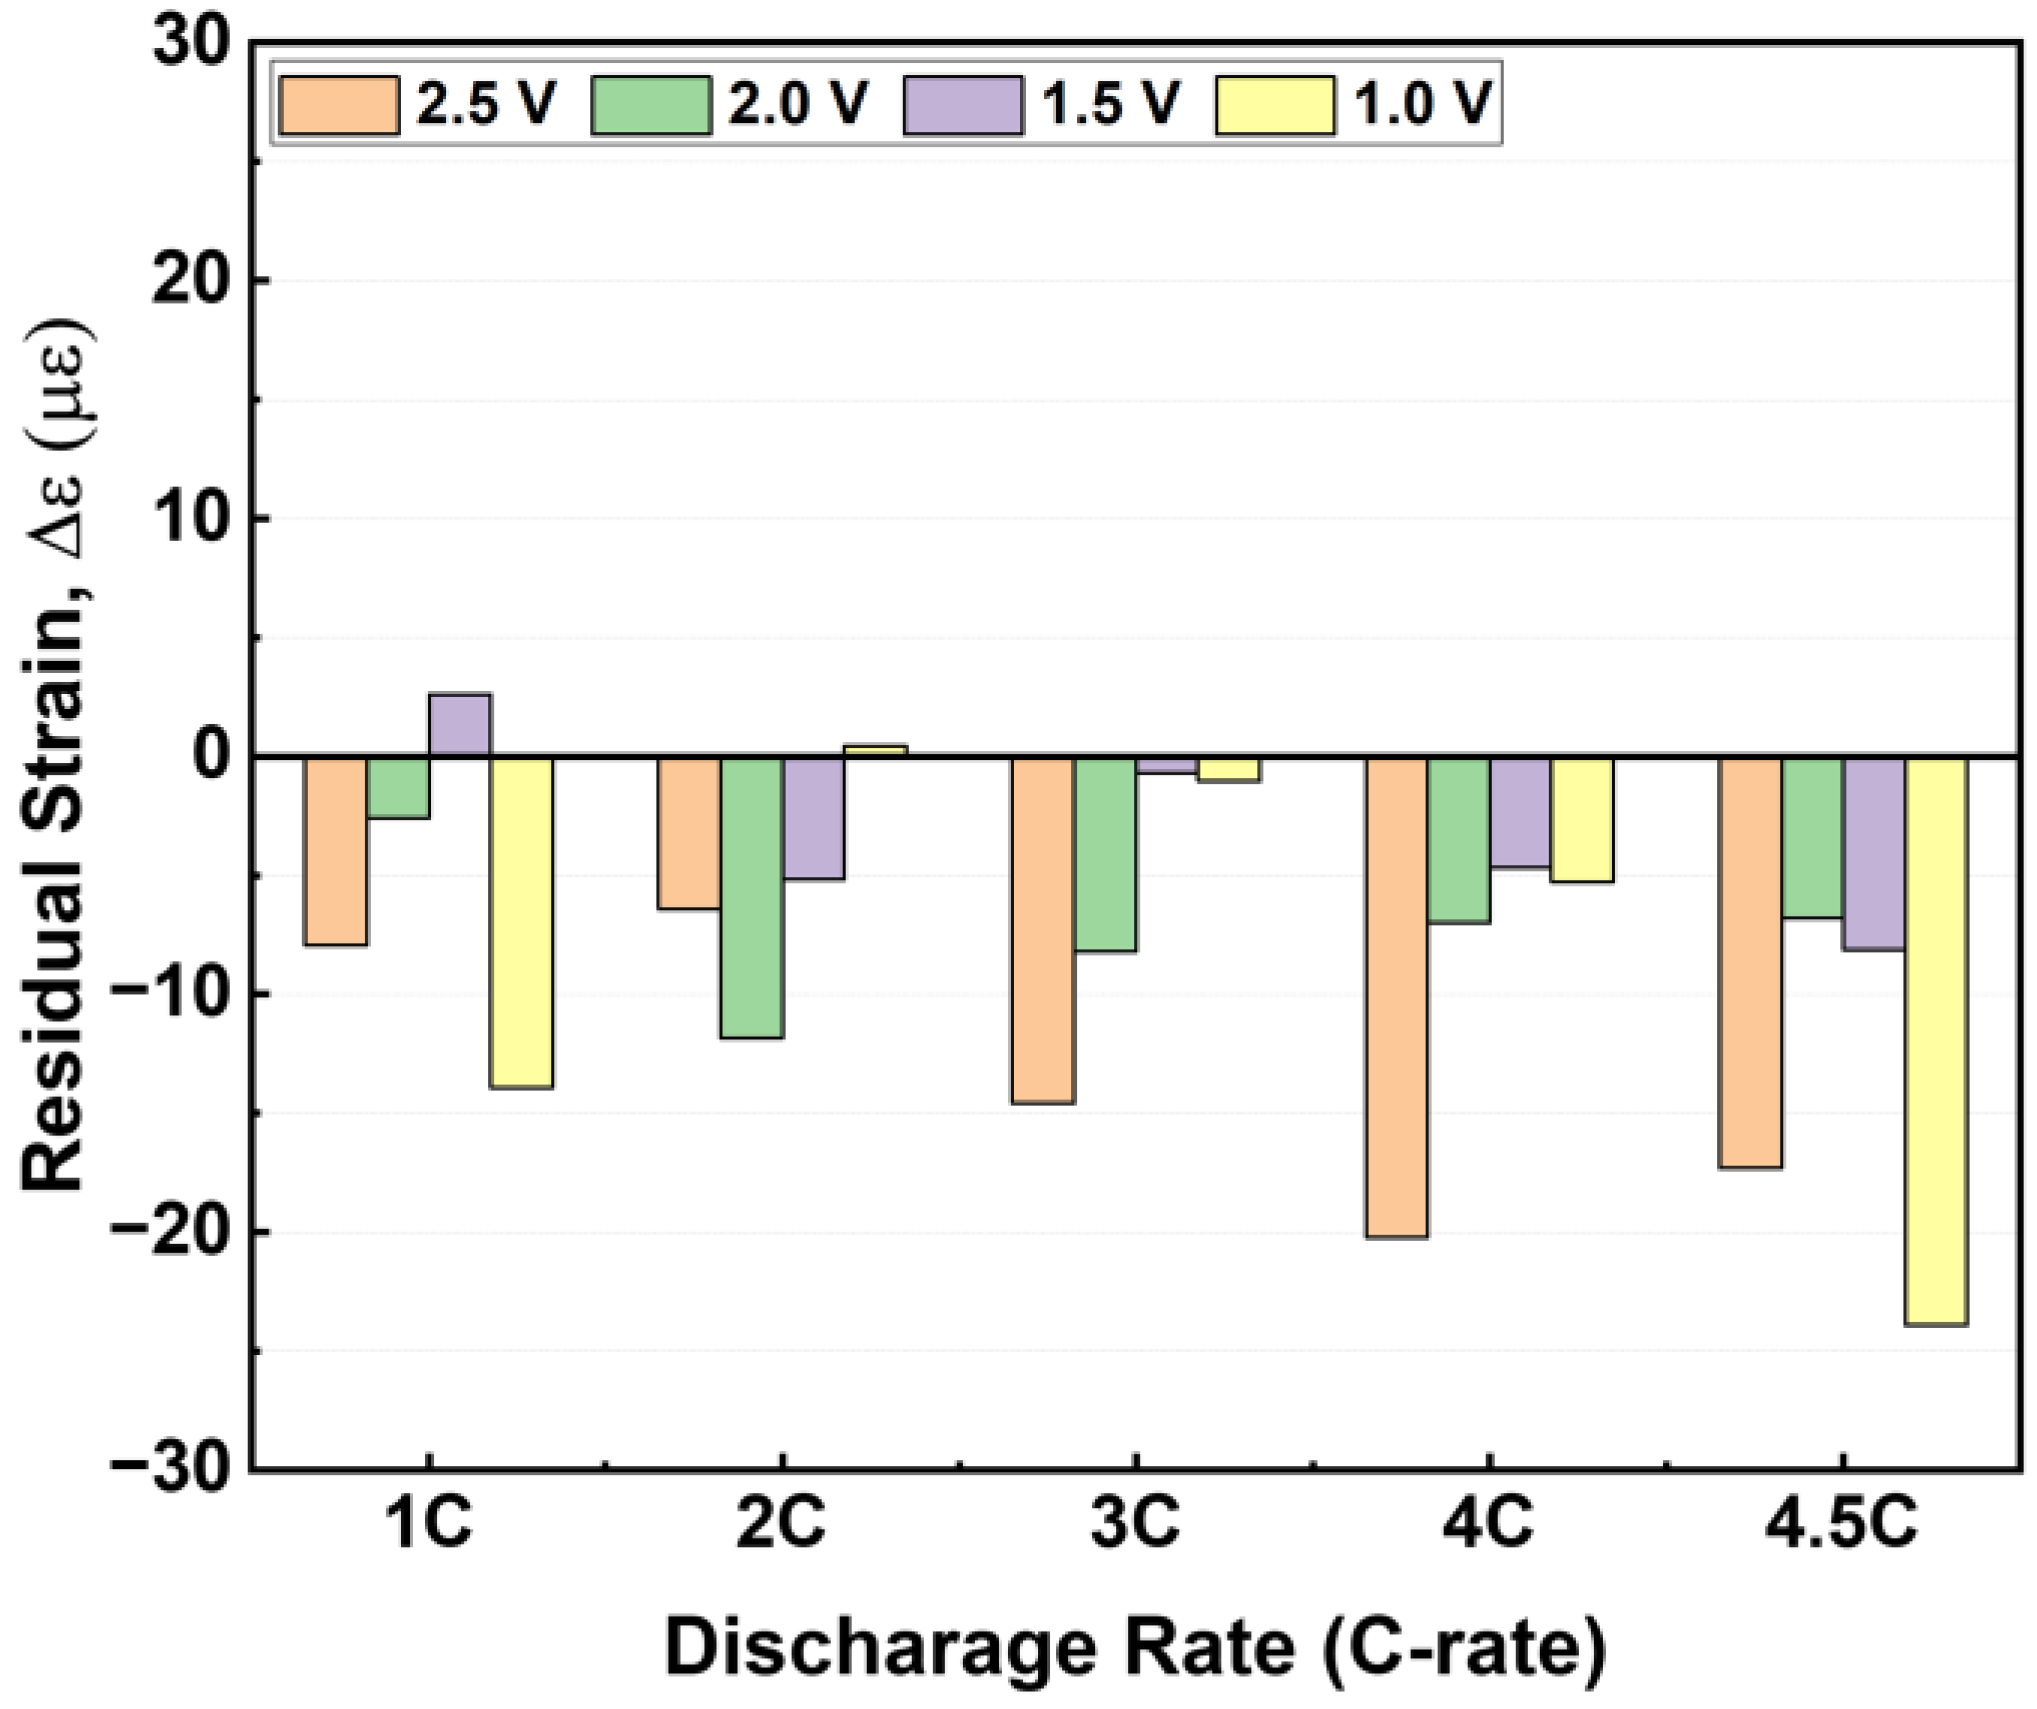
Figure 11 presents the residual strain measured after discharge, defined as the stabilized average strain between 420 min and 600 min following completion of discharge within the progressive single-cell test sequence. Unlike the tensile strain observed during charging and rest, high-rate and deep-discharge conditions exhibit a net compressive residual strain, indicating the presence of a persistent non-recoverable mechanical component following each operating condition.
At a low discharge rate (1 C), the residual strain remains small in magnitude and exhibits sensitivity to cutoff voltage. The 2.5 V case shows mild compression (≈−8 µε), while the 2.0 V case is closer to −2.6 µε and the 1.5 V condition even exhibits slight tensile retention. The deepest cutoff (1.0 V) produces more noticeable compression (≈−14 µε). These results suggest that under moderate electrochemical loading, most deformation remains partially recoverable, although a small mechanical offset persists.
As discharge rate increases, the magnitude of compressive residual strain generally increases, but the trend depends on both rate and cutoff voltage. At 3 C and 4 C, significant compression is observed particularly for the 2.5 V condition (≈−15 to −20 µε). The most severe condition (4.5 C, 1.0 V) reaches approximately −24 µε, representing the largest residual contraction among all tested cases. Within the sequential framework, this amplification reflects the combined influence of high current density and deeper delithiation on the evolving mechanical state of the tested cell.
Although the relationship is not strictly monotonic for every cutoff voltage, the overall pattern reveals a nonlinear coupling between discharge rate and depth-of-discharge. High current density intensifies electrochemical polarization and lithium concentration gradients, while deeper cutoff enforces greater lithium extraction. The combined effect enhances internal stress imbalance and promotes net macroscopic contraction of the constrained cylindrical structure.
The transition from tensile strain during charging to compressive residual strain after discharge reflects mechanical hysteresis and cumulative mechanochemical evolution within the same cell. The magnitude of residual strain therefore provides a quantitative indicator of operating severity and highlights conditions that intensify irreversible mechanical accommodation under aggressive discharge.
As a simple sanity check, the thermally induced casing strain was estimated using εth = αΔT, assuming a steel casing as a first-order approximation with a thermal expansion coefficient of α ≈ 12 × 10−6 °C−1. Representative’s end-of-discharge comparisons for the 1 C, 2.5 V and 4.5 C, 2.5 V conditions are summarized in Table 5. For the 1 C, 2.5 V condition, a temperature rise of 12.23 °C corresponds to an estimated thermal strain of approximately 146.7 µε, whereas the measured strain was 18.0 µε. For the 4.5 C, 2.5 V condition, a temperature rise of 62.49 °C corresponds to an estimated thermal strain of approximately 749.9 µε, whereas the measured strain was only 2.0 µε. These comparisons indicate that the observed strain response cannot be explained solely by simple thermal expansion of the casing.
For clarity, the principal temperature and strain metrics extracted for all 20 operating conditions are summarized in Table 6.
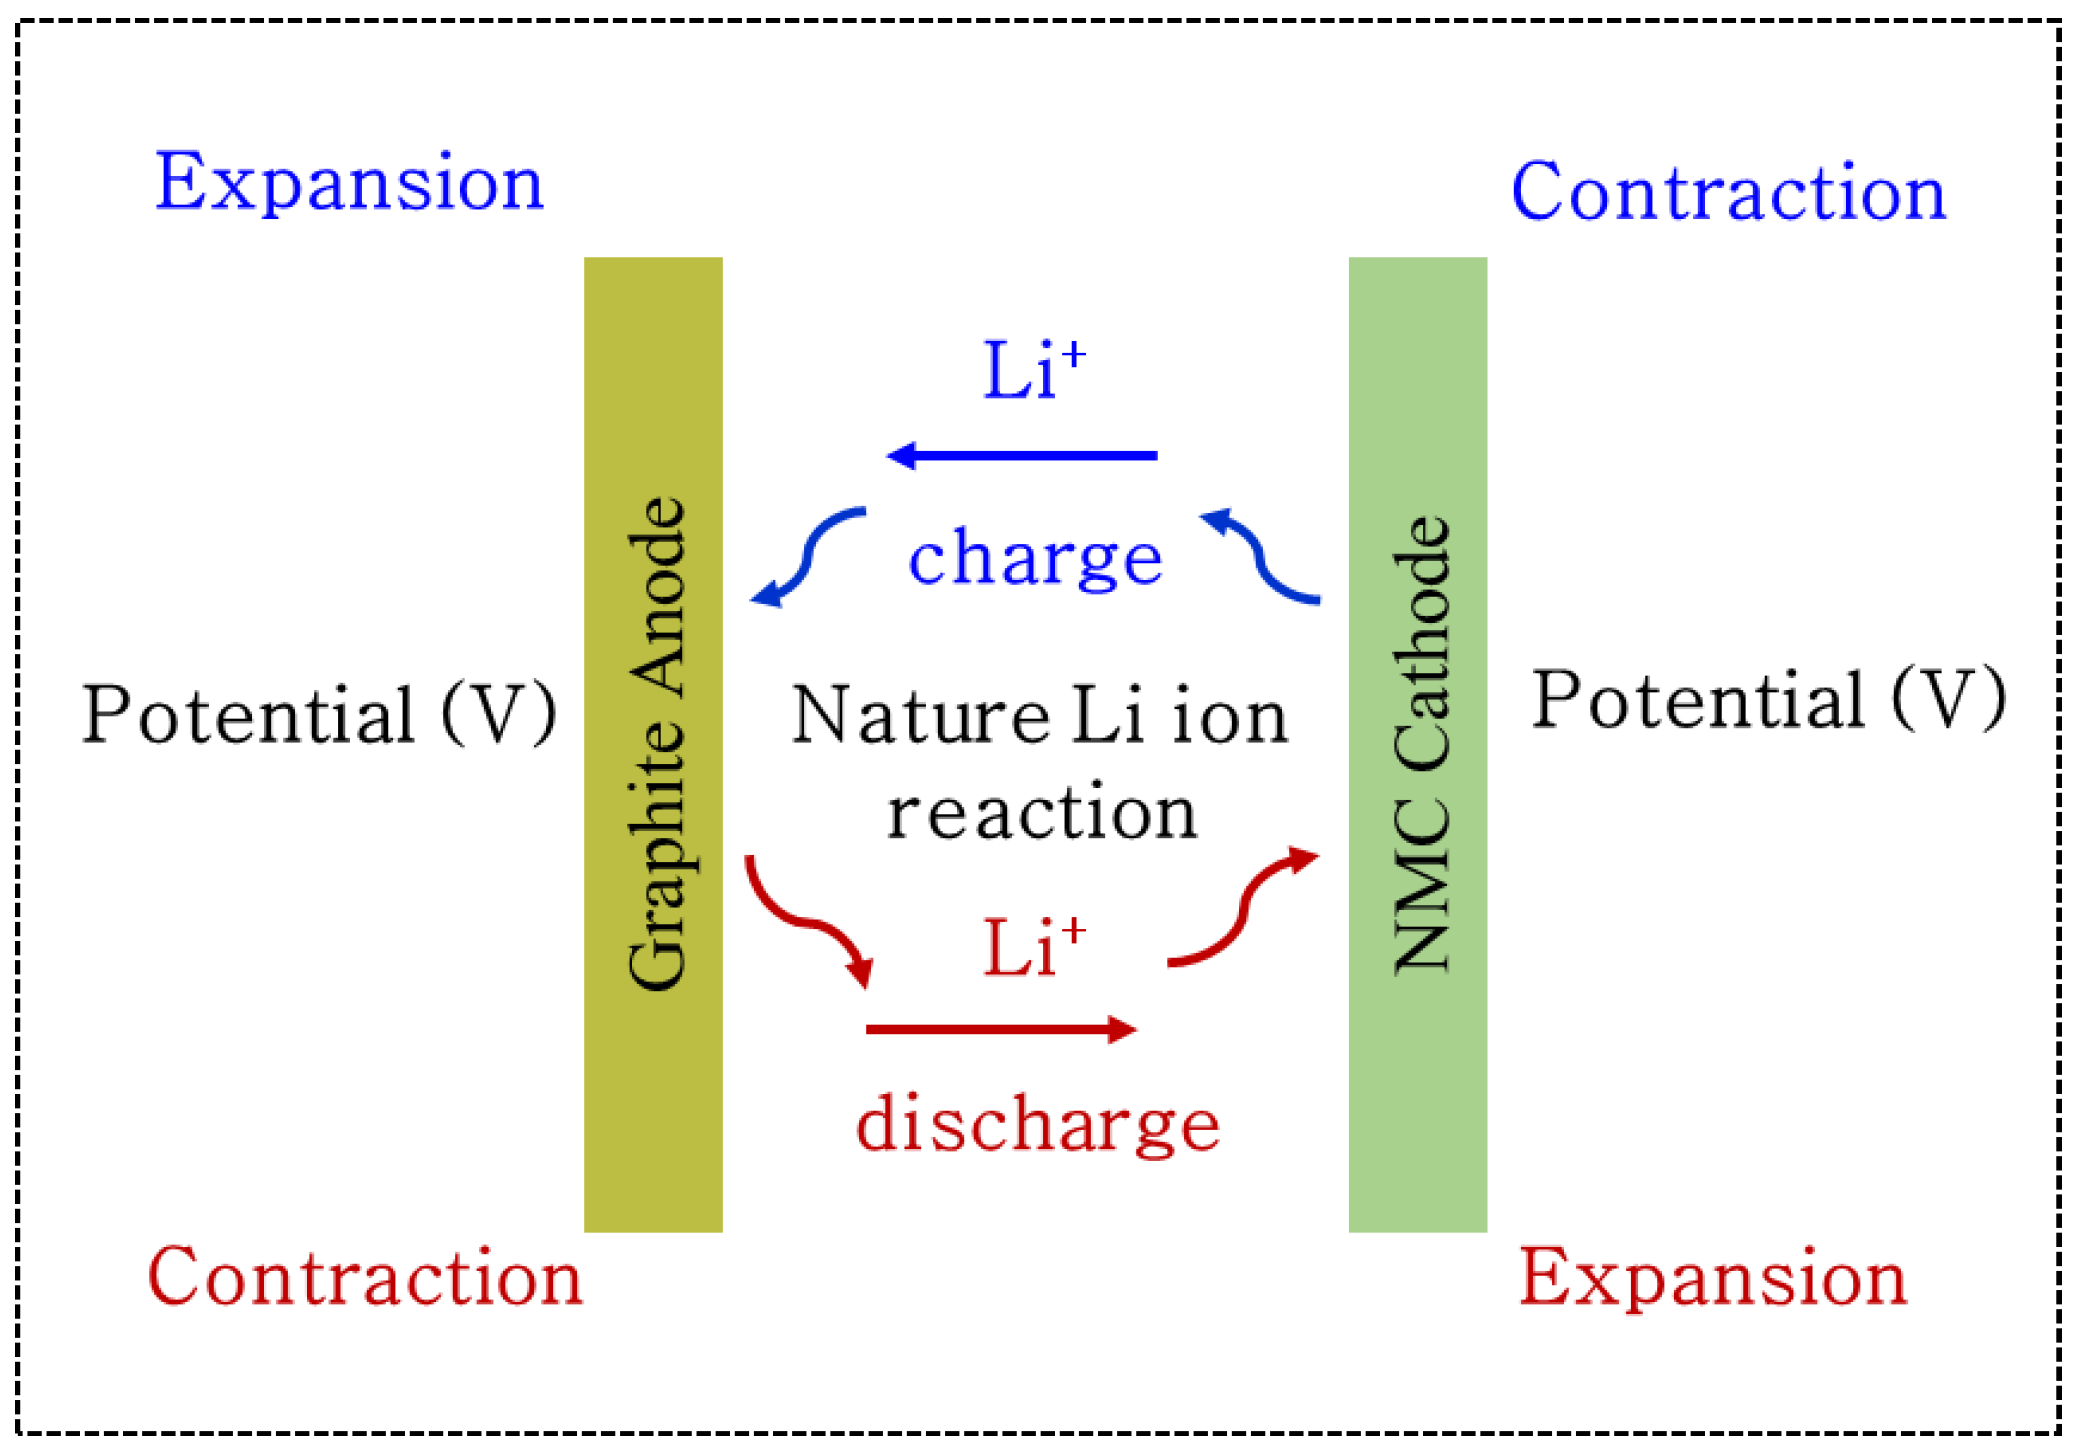
A schematic illustration of Li+ transport and electrode deformation during charge and discharge in the NMC/graphite full cell is shown in Figure 12 to clarify the electrode behavior discussed in Figure 9 and Figure 10.

3.6. Limitations of the Study

All experiments in this study were conducted sequentially on a single commercial 18650 NMC cell. The purpose of this design was to track mechanochemical evolution under progressively increasing electrochemical severity, rather than to evaluate statistical variability across multiple cells. Because discharge rate and cutoff voltage were varied sequentially within the same specimen, cumulative electrochemical history may have influenced the mechanical response at later operating conditions. Although identical CC-CV charging and rest protocols were applied before each discharge, the results should therefore be interpreted as mechanistic trends in a single cell rather than statistically independent comparisons. Possible contributions from ongoing SEI-related side reactions and from the fixed 2 h rest period were not independently resolved, because internal interfacial evolution was not directly monitored and the rest duration was not varied.
In addition, repeated tests were not performed because the deepest discharge conditions, particularly 1.5 V and 1.0 V cutoff, were intentionally severe and potentially destructive. Future studies using multiple cells and repeated measurements are needed to assess cell-to-cell variability and long-term degradation more quantitatively. Despite these limitations, the FBG-based operando strain measurements provide useful insight into electrochemical-mechanical behavior under aggressive discharge conditions.

4. Conclusions

This study investigated the electrochemical–mechanical response of a representative commercial 18650 NMC lithium-ion cell under progressively increasing discharge severity using operando fiber Bragg grating (FBG) strain sensing. Twenty sequential operating conditions combining five discharge rates (1–4.5 C) and four cutoff voltages (2.5–1.0 V) were applied following identical 0.5 C CC-CV charging and controlled rest protocols.
The results showed that temperature rise increased monotonically with discharge rate, consistent with Joule-heating-dominated thermal behavior. In contrast, strain evolution exhibited nonlinear and asymmetric behavior between lithiation and delithiation. While charging-induced tensile expansion remained relatively stable across conditions, discharge produced rate-dependent transient tensile spikes followed by pronounced peak compressive strain at high current density and deep cutoff voltage.
Quantitative strain analysis further showed that both peak compressive strain and residual compressive strain became more pronounced under combined high-rate and deep-discharge operation. The most severe condition (4.5 C, 1.0 V cutoff) produced a peak compressive strain of approximately −27 µε and the largest residual contraction after discharge relaxation. These results indicate that increasing discharge rate and decreasing cutoff voltage intensify mechanochemical loading within the constrained cylindrical structure.
The transition from tensile expansion during charging to compressive residual strain after discharge reflects mechanical hysteresis and cumulative mechanochemical evolution within the same cell. In this progressive single-cell framework, the magnitude of peak compressive strain and residual deformation serves as a useful indicator of discharge severity and helps identify operating conditions that intensify internal mechanical loading.
Overall, this work provides mechanistic insight into electrochemical–mechanical interactions in a commercial cylindrical lithium-ion cell under high-severity discharge conditions. The results show that operando surface-mounted FBG sensing can effectively track the evolution of transient and residual mechanical response and can provide useful experimental evidence for assessing mechanically severe operating conditions in cylindrical lithium-ion cells.


Supplementary Materials

The following supporting information can be downloaded at: https://www.mdpi.com/article/10.3390/batteries12050151/s1. Figure S1. Temperature-compensated strain evolution (Δε) under different cutoff voltages at fixed discharge rates. Figure S2. Complete temperature evolution profiles (ΔT) of the INR18650-25R cell during discharge at different C-rates under different cutoff voltages.

Author Contributions

Conceptualization, A.K.K. and Z.C.; methodology, Z.C.; software, A.K.K.; validation, A.K.K., Z.C. and J.L.; formal analysis, A.K.K.; investigation, Z.C.; resources, J.L.; data curation, A.K.K.; writing—original draft preparation, A.K.K.; writing—review and editing, A.K.K.; visualization, A.K.K.; supervision, Z.C.; project administration, J.L.; funding acquisition, J.L. All authors have read and agreed to the published version of the manuscript.

Funding

The research was supported by the Regional Innovation System and Education (RISE) program through the Gyeongbuk RISE CENTER, funded by the Ministry of Education (MOE) and the Gyeongsangbuk-do, Republic of Korea (B0080527002433).

Data Availability Statement

The original contributions presented in this study are included in the article. Further inquiries can be directed at the corresponding author.

Acknowledgments

The authors gratefully acknowledge the financial support provided by the Regional Innovation System and Education (RISE) program through the Gyeongbuk RISE CENTER, funded by the Ministry of Education (MOE) and Gyeongsangbuk-do, Republic of Korea, under grant/project numbers B0080527002433 and 2026-RISE-15-119.

Conflicts of Interest

The authors declare no conflicts of interest.

Abbreviations

The following abbreviations are used in this manuscript:
LiBsLithium-ion batteries
NMCLithium nickel manganese cobalt oxide
FBGFiber Bragg grating
CC-CVConstant-current constant-voltage
MOEMinistry of Education

References

  1. Tarascon, J.M.; Armand, M. Issues and challenges facing rechargeable lithium batteries. Nature 2001, 414, 359–367. [Google Scholar] [CrossRef] [Scilit] [PubMed]
  2. Goodenough, J.B.; Park, K.S. The Li-ion rechargeable battery: A perspective. J. Am. Chem. Soc. 2013, 135, 1167–1176. [Google Scholar] [CrossRef] [Scilit]
  3. Nitta, N.; Wu, F.; Lee, J.T.; Yushin, G. Li-ion battery materials: Present and future. Mater. Today 2015, 18, 252–264. [Google Scholar] [CrossRef] [Scilit]
  4. Wang, C.Y.; Liu, T.; Yang, X.G.; Ge, S.; Stanley, N.V.; Rountree, E.S.; Leng, Y.; McCarthy, B.D. Fast charging of energy-dense lithium-ion batteries. Nature 2022, 611, 485–490. [Google Scholar] [CrossRef] [Scilit]
  5. Mathieu, R.; Briat, O.; Gyan, P.; Vinassa, J.M. Comparison of the impact of fast charging on the cycle life of three lithium-ion cells under several parameters of charge protocol and temperatures. Appl. Energy 2021, 283, 116344. [Google Scholar] [CrossRef] [Scilit]
  6. Huang, P.; Liu, S.; Ma, J.; Zheng, G.; Li, E.; Wei, M.; Wang, Q.; Bai, Z. Comprehensive investigation on the durability and safety performances of lithium-ion batteries under slight mechanical deformation. J. Energy Storage 2023, 66, 107450. [Google Scholar] [CrossRef] [Scilit]
  7. Wu, S.; Chen, Y.; Luan, W.; Chen, H.; Huo, L. A review of multiscale mechanical failures in lithium-ion batteries: Implications for performance, lifetime and safety. Electrochem. Energy Rev. 2024, 7, 35. [Google Scholar] [CrossRef] [Scilit]
  8. Christensen, J.; Newman, J. Stress generation and fracture in lithium insertion materials. J. Solid State Electrochem. 2006, 10, 293–319. [Google Scholar] [CrossRef] [Scilit]
  9. Woodford, W.H.; Chiang, Y.M.; Carter, W.C. “Electrochemical shock” of intercalation electrodes: A fracture mechanics analysis. J. Electrochem. Soc. 2010, 157, A1052. [Google Scholar] [CrossRef] [Scilit]
  10. Zhang, X.; Shyy, W.; Sastry, A.M. Numerical simulation of intercalation-induced stress in Li-ion battery electrode particles. J. Electrochem. Soc. 2007, 154, A910–A916. [Google Scholar] [CrossRef] [Scilit]
  11. Laresgoiti, I.; Käbitz, S.; Ecker, M.; Sauer, D.U. Modeling mechanical degradation in lithium ion batteries during cycling: Solid electrolyte interphase fracture. J. Power Sources 2015, 300, 112–122. [Google Scholar] [CrossRef] [Scilit]
  12. Hu, J.; Li, L.; Hu, E.; Chae, S.; Jia, H.; Liu, T.; Wu, B.; Bi, Y.; Amine, K.; Wang, C.; et al. Mesoscale-architecture-based crack evolution dictating cycling stability of advanced lithium-ion batteries. Nano Energy 2021, 79, 105420. [Google Scholar] [CrossRef] [Scilit]
  13. Marin-Montin, J.; Zurita-Gotor, M.; Montero-Chacón, F. A numerical study of mechanical degradation of carbon-coated graphite active particles in Li-ion battery anodes. J. Electrochem. Soc. 2022, 169, 070528. [Google Scholar] [CrossRef] [Scilit]
  14. Zhao, K.; Pharr, M.; Vlassak, J.J.; Suo, Z. Fracture of electrodes in lithium-ion batteries caused by fast charging. J. Appl. Phys. 2010, 108, 073517. [Google Scholar] [CrossRef] [Scilit]
  15. Gauthier, R.; Luscombe, A.; Bond, T.; Bauer, M.; Johnson, M.; Harlow, J.; Louli, A.; Dahn, J.R. How do depth of discharge, C-rate and calendar age affect capacity retention, impedance growth, the electrodes, and the electrolyte in Li-ion cells? J. Electrochem. Soc. 2022, 169, 020518. [Google Scholar] [CrossRef] [Scilit]
  16. Zhu, J.; Su, P.; Darma, M.S.D.; Hua, W.; Mereacre, L.; Liu-Théato, X.; Heere, M.; Sørensen, D.R.; Dai, H.; Wei, X.; et al. Multiscale investigation of discharge rate dependence of capacity fade for lithium-ion battery. J. Power Sources 2022, 536, 231516. [Google Scholar] [CrossRef] [Scilit]
  17. Zhang, S.S. The effect of the charging protocol on the cycle life of a Li-ion battery. J. Power Sources 2006, 161, 1385–1391. [Google Scholar] [CrossRef] [Scilit]
  18. Santhanagopalan, S.; Guo, Q.; Ramadass, P.; White, R.E. Review of models for predicting the cycling performance of lithium ion batteries. J. Power Sources 2006, 156, 620–628. [Google Scholar] [CrossRef] [Scilit]
  19. Zhao, J.; Liu, M.; Zhang, B.; Wang, X.; Liu, D.; Wang, J.; Bai, P.; Liu, C.; Sun, Y.; Zhu, Y. Review of lithium-ion battery fault features, diagnosis methods, and diagnosis procedures. IEEE Internet Things J. 2023, 11, 18936–18950. [Google Scholar] [CrossRef] [Scilit]
  20. Xiao, F.; Xing, B.; Kong, L.; Xia, Y. Impedance-based diagnosis of internal mechanical damage for large-format lithium-ion batteries. Energy 2021, 230, 120855. [Google Scholar] [CrossRef] [Scilit]
  21. Gervillié-Mouravieff, C.; Bao, W.; Steingart, D.A.; Meng, Y.S. Non-destructive characterization techniques for battery performance and life-cycle assessment. Nat. Rev. Electr. Eng. 2024, 1, 547–558. [Google Scholar] [CrossRef] [Scilit]
  22. Yi, Z.; Chen, Z.; Yin, K.; Wang, L.; Wang, K. Sensing as the key to the safety and sustainability of new energy storage devices. Prot. Control Mod. Power Syst. 2023, 8, 27. [Google Scholar] [CrossRef] [Scilit]
  23. Wahl, M.S.; Spitthoff, L.; Muri, H.I.; Jinasena, A.; Burheim, O.S.; Lamb, J.J. The importance of optical fibres for internal temperature sensing in lithium-ion batteries during operation. Energies 2021, 14, 3617. [Google Scholar] [CrossRef] [Scilit]
  24. Yu, Y.; Vergori, E.; Maddar, F.; Guo, Y.; Greenwood, D.; Marco, J. Real-time monitoring of internal structural deformation and thermal events in lithium-ion cell via embedded distributed optical fibre. J. Power Sources 2022, 521, 230957. [Google Scholar] [CrossRef] [Scilit]
  25. Chen, D.; Zhao, Q.; Zheng, Y.; Xu, Y.; Chen, Y.; Ni, J.; Zhao, Y. Recent progress in lithium-ion battery safety monitoring based on fiber Bragg grating sensors. Sensors 2023, 23, 5609. [Google Scholar] [CrossRef] [Scilit]
  26. Krause, T.; Nusko, D.; Pitta Bauermann, L.; Vetter, M.; Schäfer, M.; Holly, C. Methods for Quantifying Expansion in Lithium-Ion Battery Cells Resulting from Cycling: A Review. Energies 2024, 17, 1566. [Google Scholar] [CrossRef] [Scilit]
  27. Peng, J.; Zhou, X.; Jia, S.; Jin, Y.; Xu, S.; Chen, J. High precision strain monitoring for lithium-ion batteries based on fiber Bragg grating sensors. J. Power Sources 2019, 433, 226692. [Google Scholar] [CrossRef] [Scilit]
  28. Matuck, L.; Pinto, J.L.; Marques, C.; Nascimento, M. Simultaneous strain and temperature discrimination in 18650 Li-ion batteries using polarization-maintaining fiber Bragg gratings. Batteries 2022, 8, 233. [Google Scholar] [CrossRef] [Scilit]
  29. Bonefacino, J.; Ghashghaie, S.; Zheng, T.; Lin, C.P.; Zheng, W.; Blanquer, L.A.; Huang, J.; Gervillié, C.; Tam, H.-Y.; Tarascon, J.-M.; et al. High-fidelity strain and temperature measurements of Li-ion batteries using polymer optical fiber sensors. J. Electrochem. Soc. 2022, 169, 100508. [Google Scholar] [CrossRef] [Scilit]
  30. Chen, J.; Thapa, A.K.; Berfield, T.A. In-situ characterization of strain in lithium battery working electrodes. J. Power Sources 2014, 271, 406–413. [Google Scholar] [CrossRef] [Scilit]
  31. Sethuraman, V.A.; Van Winkle, N.; Abraham, D.P.; Bower, A.F.; Guduru, P.R. Real-time stress measurements in lithium-ion battery negative-electrodes. J. Power Sources 2012, 206, 334–342. [Google Scholar] [CrossRef] [Scilit]
  32. Cannarella, J.; Arnold, C.B. Stress evolution and capacity fade in constrained lithium-ion pouch cells. J. Power Sources 2014, 245, 745–751. [Google Scholar] [CrossRef] [Scilit]
  33. Zhao, K.; Pharr, M.; Hartle, L.; Vlassak, J.J.; Suo, Z. Fracture and debonding in lithium-ion batteries with electrodes of hollow core–shell nanostructures. J. Power Sources 2012, 218, 6–14. [Google Scholar] [CrossRef] [Scilit]
  34. Bower, A.F.; Guduru, P.R.; Sethuraman, V.A. A finite strain model of stress, diffusion, plastic flow, and electrochemical reactions in a lithium-ion half-cell. J. Mech. Phys. Solids 2011, 59, 804–828. [Google Scholar] [CrossRef] [Scilit]
  35. Renganathan, S.; Sikha, G.; Santhanagopalan, S.; White, R.E. Theoretical analysis of stresses in a lithium ion cell. J. Electrochem. Soc. 2010, 157, A155–A163. [Google Scholar] [CrossRef] [Scilit]
  36. Zhao, K.; Wang, W.L.; Gregoire, J.; Pharr, M.; Suo, Z.; Vlassak, J.J.; Kaxiras, E. Lithium-assisted plastic deformation of silicon electrodes in lithium-ion batteries: A first-principles theoretical study. Nano Lett. 2011, 11, 2962–2967. [Google Scholar] [CrossRef] [Scilit]
  37. Sethuraman, V.A.; Chon, M.J.; Shimshak, M.; Srinivasan, V.; Guduru, P.R. In situ measurements of stress evolution in silicon thin films during electrochemical lithiation and delithiation. J. Power Sources 2010, 195, 5062–5066. [Google Scholar] [CrossRef] [Scilit]
  38. Tian, J.; Ren, Y. Characterization of electrode stress in lithium battery under different factors. Ionics 2025, 31, 319–328. [Google Scholar] [CrossRef] [Scilit]
  39. Deshpande, V.S.; McMeeking, R.M. Models for the interplay of mechanics, electrochemistry, thermodynamics, and kinetics in lithium-ion batteries. Appl. Mech. Rev. 2023, 75, 010801. [Google Scholar] [CrossRef] [Scilit]
  40. He, L.; Gu, Z.; Zhang, Y.; Jing, H.; Li, P. Review on thermal management of lithium-ion batteries for electric vehicles: Advances, challenges, and outlook. Energy Fuels 2023, 37, 4835–4857. [Google Scholar] [CrossRef] [Scilit]
  41. ChiuHuang, C.K.; Huang, H.Y.S. Critical lithiation for C-rate dependent mechanical stresses in LiFePO4. J. Solid State Electrochem. 2015, 19, 2245–2253. [Google Scholar] [CrossRef] [Scilit]
  42. Zhu, X.; Chen, Y.; Chen, H.; Luan, W. The diffusion induced stress and cracking behaviour of primary particle for Li-ion battery electrode. Int. J. Mech. Sci. 2020, 178, 105608. [Google Scholar] [CrossRef] [Scilit]
  43. Christensen, J. Modeling diffusion-induced stress in Li-ion cells with porous electrodes. J. Electrochem. Soc. 2010, 157, A366–A380. [Google Scholar] [CrossRef] [Scilit]
  44. Qu, D.; Guo, S.; Wang, C.; Wang, Y.; Zhao, L.; Jiang, Y.; Wang, Q.; Li, J.; Rong, C.; Wang, Z. A diagnostic model for lithium plating in lithium-ion batteries incorporating a simplified electrochemical-thermal coupling model. J. Solid State Electrochem. 2025, 29, 3811–3828. [Google Scholar] [CrossRef] [Scilit]
  45. Bryden, T.S.; Dimitrov, B.; Hilton, G.; de León, C.P.; Bugryniec, P.; Brown, S.; Cumming, D.; Cruden, A. Methodology to determine the heat capacity of lithium-ion cells. J. Power Sources 2018, 395, 369–378. [Google Scholar] [CrossRef] [Scilit]

  46. Tang, Y.; Li, T.; Cheng, X. Review of specific heat capacity determination of lithium-ion battery. Energy Procedia 2019, 158, 4967–4973. [Google Scholar] [CrossRef] [Scilit]
  47. Kantharaj, R.; Marconnet, A.M. Heat generation and thermal transport in lithium-ion batteries: A scale-bridging perspective. Nanoscale Microscale Thermophys. Eng. 2019, 23, 128–156. [Google Scholar] [CrossRef] [Scilit]
  48. Maher, K.; Boumaiza, A.; Amin, R. Understanding the heat generation mechanisms and the interplay between joule heat and entropy effects as a function of state of charge in lithium-ion batteries. J. Power Sources 2024, 623, 235504. [Google Scholar] [CrossRef] [Scilit]
Figure 1. Experimental configuration and cell used in this study. (a) Schematic of the FBG-based operando sensing system, including the battery cycler, optical interrogator, data acquisition system, cylindrical 18650 NMC cell, strain-sensing FBG, and temperature-reference FBG. (b) Photograph of the 18650 cell with the FBG sensor bonded along the axial direction using adhesive and secured with thermal tape. (c) Photograph of the commercial INR18650-25R NMC lithium-ion cell (2.5 Ah, 3.6 V nominal).
Batteries 12 00151 g001
Figure 2. Evolution of (a) voltage, (b) current, (c) temperature rise (ΔT), and (d) strain (Δε) of the INR18650-25R cell during a representative full charge-discharge cycle at a 1 C discharge rate with a 2.5 V cutoff voltage. The test sequence consisted of CC-CV charging at 0.5 C, followed by a 2 h open-circuit rest period and subsequent constant-current discharge. The measured charge and discharge capacities under this condition were 2373.37 mAh and 2383.08 mAh, respectively. Residual strain is defined as the stabilized strain measured after completion of discharge. Time was selected as the x-axis in Figure 2 to capture not only charge/discharge progression but also the rest-period and post-cycle thermal/mechanical relaxation, which are inherently time-dependent.
Batteries 12 00151 g002
Figure 3. Temperature rise (ΔT) of the INR18650-25R cell under different discharge rates (1–4.5 C) at a cutoff voltage of 2.5 V. All tests followed identical 0.5 C CC-CV charging and a 2 h open-circuit rest period prior to discharge. Peak temperature during discharge increases monotonically with C-rate, reaching 60.33 °C at 4.5 C.
Batteries 12 00151 g003
Figure 4. Strain evolution (Δε) of the 18650 NMC cell under different discharge rates (1–4.5 C) at a cutoff voltage of 2.5 V. All tests followed identical 0.5 C CC-CV charging and a 2 h open-circuit rest period prior to discharge. Tensile expansion during charging is followed by rate-dependent transient strain spike and peak compressive strain during discharge. Increasing discharge rate results in greater compressive deformation and more negative residual strain within the progressive test sequence.
Batteries 12 00151 g004
Figure 5. Schematic illustration of the proposed electrochemically induced stress mechanism corresponding to the strain behavior shown in Figure 4. During charging, Li+ moves from the NMC cathode to the graphite anode, leading to expansion of the graphite/electrode stack and increased tensile strain. During rest, partial mechanical relaxation occurs while tensile strain remains. During discharge, Li+ leaves the graphite anode and returns to the NMC cathode, causing contraction of the active materials/electrode stack and a rapid drop in strain under cylindrical constraint, resulting in compressive strain. During post-discharge relaxation, residual strain remains, and higher discharge rates lead to more negative residual strain.
Batteries 12 00151 g005
Figure 6. Discharge voltage profiles as a function of discharge capacity at five C-rates (1–4.5 C) under different cutoff voltages: (a) 2.5 V, (b) 2.0 V, (c) 1.5 V, and (d) 1.0 V. Increasing discharge rate enhances polarization, as indicated by a downward shift of the voltage plateau and a steeper voltage drop near the cutoff region. This effect becomes more pronounced at lower cutoff voltages.
Batteries 12 00151 g006aBatteries 12 00151 g006b
Figure 7. Maximum tensile strain (Δε) during 0.5 C CC-CV charging for different discharge rates (1–4.5 C) and cutoff voltages (2.5–1.0 V). Differences in peak strain, despite identical charging conditions, indicate cumulative mechanochemical effects associated with progressive discharge severity.
Batteries 12 00151 g007
Figure 8. Stabilized tensile strain measured after a 2 h open-circuit rest period following 0.5 C CC-CV charging, presented as a function of discharge rate (1–4.5 C) and cutoff voltage (2.5–1.0 V). The retained tensile strain defines the pre-discharge mechanical baseline for each operating condition.
Batteries 12 00151 g008
Figure 9. Maximum transient tensile strain measured immediately after discharge initiation as a function of discharge rate (1–4.5 C) and cutoff voltage (2.5–1.0 V). The transient strain increases with discharge rate and is consistent with enhanced electrochemical polarization and concentration-gradient-driven stress during early-stage delithiation.
Batteries 12 00151 g009
Figure 10. Peak compressive strain attained during discharge as a function of discharge rate (1–4.5 C) and cutoff voltage (2.5–1.0 V). Increasing discharge rate and deeper cutoff voltage promote a transition from tensile-dominated response at low electrochemical severity to pronounced compressive contraction under aggressive operating conditions.
Batteries 12 00151 g010
Figure 11. Residual strain measured after discharge (averaged over 420–600 min) as a function of discharge rate (1–4.5 C) and cutoff voltage (2.5–1.0 V). Higher discharge rates and deeper cutoff voltages result in increasingly compressive residual strain, indicating enhanced irreversible mechanochemical deformation under aggressive operating conditions.
Batteries 12 00151 g011
Figure 12. Schematic illustration of Li+ transport and electrode deformation during charge and discharge in the NMC/graphite full cell. During charging, Li+ moves from the NMC cathode to the graphite anode; the graphite anode expands, while the NMC cathode contracts. During discharging, Li+ returns from the graphite anode to the NMC cathode; the graphite anode contracts, while the NMC cathode expands.
Batteries 12 00151 g012
Table 1. Representative previous reports on measurement of mechanochemical degradation-related behavior in Li-ion batteries.
ReferenceMeasurement ApproachSystemMain Relevance
Chen et al. [24]In situ strain measurementBattery working electrodeDirect measurement of electrode strain during cycling
Sethuraman et al. [26]Real-time stress measurementLi-ion negative electrodeOperando stress evolution during lithiation/delithiation
Cannarella and Arnold [27]Stress measurement under mechanical constraintLi-ion pouch cellStress evolution linked to capacity fade
Yu et al. [28]Embedded optical-fiber sensingLi-ion cellInternal structural deformation and thermal-event monitoring
Peng et al. [29]FBG strain sensingLi-ion batteryHigh-precision external strain monitoring
Matuck et al. [30]PM-FBG sensing18650 cylindrical cellsSimultaneous strain and temperature discrimination
Bonefacino et al. [31]Optical-fiber strain/
temperature sensing
Li-ion batteryHigh-fidelity operando strain and temperature measurement
Krause et al. [32]Review of expansion-quantification methodsLi-ion cellsOverview of cell expansion/
deformation measurement
Table 2. Specifications of the INR18650-25R Li-ion cell.
ParametersValue
ManufacturerSamsung SDI
Cell modelINR18650-25R
Cell format18650 cylindrical
Cathode chemistryNMC (LiNiMnCoO2)
Nominal capacity2.5 Ah
Nominal voltage3.6 V
Maximum charge voltage4.2 V
Recommended discharge cutoff2.5 V
Maximum continuous discharge20 A
Diameter18.33 mm
Height64.85 mm
Mass~45 g
Operating temperature (charge)0–50 °C
Operating temperature (discharge)−20–75 °C
Table 3. Charge–discharge test matrix.
ParameterValue
Charge protocolCC-CV at 0.5 C to 4.2 V (cutoff current 125 mA)
Rest time2 h
Discharge C-rates1 C, 2 C, 3 C, 4 C, 4.5 C
Discharge cutoff voltages2.5 V, 2.0 V, 1.5 V, 1.0 V
Number of cycles20 (one cycle per operating condition)
Table 4. Exact sequential order of the 20 operating conditions applied to the single 18650 NMC cell, including discharge rate, discharge cutoff voltage, charge capacity, and delivered discharge capacity.
Sequence NumberDischarge Rate (C)Discharge Cutoff Voltage (V)Charge Capacity (mAh)Delivered Discharge Capacity (mAh)
112.52373.372383.08
222.52383.732374.46
332.52376.082352.02
442.52352.312298.89
54.52.52300.642262.51
612.02383.832401.12
722.02403.062398.35
832.02398.462393.35
942.02394.382385.58
104.52.02385.672378.77
1111.52380.042413.68
1221.52413.972408.63
1331.52409.842405.79
1441.52405.802400.01
154.51.52400.242397.15
1611.02398.252421.37
1721.02421.862415.59
1831.02416.322411.71
1941.02411.572407.78
204.51.02405.772410.29
Table 5. Estimated thermal strain and measured strain at the end of discharge for representative conditions.
ConditionRepresentative PointΔT (°C)Estimated Thermal Strain, αΔT (με)Measured Strain (με)
1 C, 2.5 VEnd of discharge12.23146.718.0
4.5 C, 2.5 VEnd of discharge62.49749.91.97
Table 6. Summary of peak temperature rise and strain metrics for all 20 operating conditions.
Discharge Rate (C)Cutoff Voltage (V)Peak ΔT (°C)εmax (με)εrest,end (με)εpc (με)εresidual (με)
1 C2.5 V13.8952.5133.7925.56−7.94
2 C2.5 V28.8854.1041.0515.86−6.42
3 C2.5 V43.1349.5446.684.96−14.59
4 C2.5 V55.6949.8053.32−6.92−20.21
4.5 C2.5 V62.9851.6857.80−7.43−17.31
1 C2.0 V14.5244.6626.7917.28−2.60
2 C2.0 V29.3051.8539.8622.86−11.87
3 C2.0 V44.0658.9956.8526.56−8.22
4 C2.0 V62.1757.8563.907.11−7.00
4.5 C2.0 V69.3455.7462.72−0.83−6.79
1 C1.5 V16.2554.2935.3027.282.61
2 C1.5 V31.0255.7741.1027.32−5.18
3 C1.5 V46.1456.6053.4621.34−0.72
4 C1.5 V62.5254.3259.215.32−4.67
4.5 C1.5 V72.1156.6763.25−6.45−8.12
1 C1.0 V17.9450.8432.5726.02−13.94
2 C1.0 V32.6757.4543.5131.550.44
3 C1.0 V48.4655.3255.2221.01−1.03
4 C1.0 V63.5656.5260.70−0.25−5.27
4.5 C1.0 V72.2848.3355.80−26.75−23.91
Disclaimer/Publisher’s Note: The statements, opinions and data contained in all publications are solely those of the individual author(s) and contributor(s) and not of MDPI and/or the editor(s). MDPI and/or the editor(s) disclaim responsibility for any injury to people or property resulting from any ideas, methods, instructions or products referred to in the content.