


Abstract
Reliable estimation of the State of Health (SOH) in lithium-ion batteries is critical to battery system security and dependability. However, existing Physics-Informed Neural Networks (PINNs) have drawbacks like single-feature physical constraints, rigid fixed-weight fusion of multi-feature constraints and insufficient time-series degradation modeling. To solve these problems, this study proposes an Adaptive-Weight PINN (AW-PINN) optimized by the Grey Wolf Optimizer (GWO) algorithm, which features a dual-LSTM parallel structure and takes incremental capacity peaks and charged capacity as dual physical constraints. A weight generator LSTM adaptively learns weights for monotonicity losses without manual intervention, and GWO globally optimizes physical loss weights to balance data fitting accuracy and prediction physical consistency. Validated on , NCA, and NCM batteries from CALCE and Tongji University datasets via comparative, ablation, and small-sample experiments, AW-PINN shows superior predictive performance (average RMSE = 0.0076; MAE = 0.0065; MAPE = 0.0072), robustness, and generalization. It integrates battery degradation physics with deep learning, retaining strong fitting capability while enabling physical interpretability.
1. Introduction
1.1. Background
With the rapid advancement of the new energy industry, lithium-ion batteries have been widely applied in key fields including electric vehicles and energy storage power stations [1]. As the charge–discharge cycling process proceeds, the batteries gradually age, and when their performance degrades to a certain level, they are no longer suitable for core application scenarios such as power systems and large-scale grid energy storage. State of Health (SOH) serves as a key indicator for characterizing the health condition of lithium-ion batteries, and accurate SOH evaluation plays a vital role in ensuring the stable functioning of battery systems, reducing maintenance costs, and avoiding safety accidents such as thermal runaway [2].
1.2. Literature Review
Battery evaluation methods can be roughly classified into two categories according to their prediction criteria. The first category is mechanism-based methods, which calculate and estimate the SOH by measuring real-time data such as current, voltage, and temperature, utilizing battery empirical formulas or constructed physicochemical models. Triawan et al. accurately estimated the SOH based on raw voltage and current data by adopting the coulomb counting method [3]. Iurilli et al. effectively estimated the SOH by applying electrochemical impedance spectroscopy (EIS) measurements, adopting a physics-based approach that involves deriving degradation mode indicators from the distribution of relaxation times (DRT) and employing a piecewise logarithmic model [4]. Rodriguez-Cea et al. adopted an equivalent circuit model (ECM) with internal resistance, simplifying the intricate internal dynamics of Li-ion batteries into manageable electrical components, which can directly map the measured constant voltage phase charging current data to key battery states for reliable estimation [5]. Park et al. proposed a practical semi-empirical model, which integrates core electrochemical mechanisms and data-driven fitting and innovatively introduces a short-term rest degradation model to adapt to dynamic conditions [6]. These methods achieve SOH prediction by focusing on the core physicochemical processes inside the battery, converting mechanistic laws into computable mathematical models, equivalent circuits, or mechanism–data fusion formulas, and establishing specific quantitative relationships between externally measurable parameters and the SOH. However, they may encounter difficulties, as the coupled multi-mechanism degradation processes inside the battery are difficult to characterize fully and accurately; such methods impose high requirements for electrochemical knowledge in mechanistic modeling, and their adaptability to complex operating conditions is insufficient.
The second category is data-driven methods, which mainly include traditional machine learning and deep learning approaches. They do not rely on the internal physical and chemical mechanisms of batteries but instead achieve SOH estimation by mining patterns from historical data, often requiring sufficient training data to ensure accuracy. Traditional machine learning methods excel in small-sample scenarios and nonlinear fitting. For instance, Wu et al. proposed a method based on Support Vector Regression (SVR), which integrates variational mode decomposition (VMD) to address the challenges of nonlinearity and noise in battery degradation data [7]. He et al. developed a Gaussian Process Regression (GPR) model to estimate the SOH, combining Particle Swarm Optimization (PSO) which achieved high accuracy [8]. However, traditional machine learning is highly dependent on feature engineering and data quality. In contrast, deep learning methods, with their powerful temporal feature extraction capabilities, are more suitable for learning complex degradation patterns. A Transformer-based framework was constructed by Park et al. for configuration-agnostic lithium-ion battery SOH estimation, whose effectiveness was validated across diverse battery configurations [9]. Cheng et al. proposed a Convolutional Neural Network (CNN)–Kolmogorov–Arnold Network (KAN) hybrid model that integrates the feature extraction ability of CNNs with the strong nonlinear fitting performance of KANs, achieving superior prediction performance [10]. Long Short-Term Memory (LSTM) is a classic model for time-series data processing. It can effectively capture long-term temporal dependencies in the battery capacity fading process, avoiding the gradient vanishing issue and adapting to the temporal characteristics of SOH prediction. Zhang et al. constructed a time-series model based on LSTM networks, capturing long-term degradation patterns and achieving reliable predictions [11]. Meanwhile, LSTM variants such as Bi-LSTM and fusion models based on LSTM such as CNN-LSTM and Transformer-LSTM have also demonstrated excellent performance [12,13,14]. However, the “black-box” nature of deep learning leads to poor interpretability, making it difficult to trace the physical causes of prediction results. Furthermore, it may produce unreasonable predictions that violate battery degradation mechanisms, reducing the model’s reliability under extreme operating conditions or cross-scenario applications. Therefore, Physics-Informed Neural Networks (PINNs), as an integration of data-driven and physical mechanism approaches, can embed the core physical laws of battery aging into the model training process [15]. Through physical loss terms, it regulates the rationality of prediction results, retaining the strong fitting ability of deep learning while endowing the model with clear physical logic, enabling prediction results to be traced through degradation mechanisms [16].
In the current application of physical constraints in PINN for battery SOH estimation, many studies focus on designing monotonicity constraints for a single key feature. Ye et al. proposed the PIFNN method, which enforces the monotonic decrease of IC curve peaks with the SOH through a fixed-weight loss term [17]. Luo et al. designed a single-feature monotonic loss for membrane resistance to ensure its positive correlation with capacity loss [18]. Although such methods can guarantee the physical rationality of individual features, they may overlook the dynamic coupling degradation characteristics among multiple features [19]. In addition, most applications of PINN in battery SOH estimation adopt basic network structures such as a Feedforward Neural Network (FNN), and less frequently introduce time-series networks like LSTM to adapt to the time-series characteristics of battery degradation [17,20]. Moreover, few studies in the battery SOH estimation domain have introduced optimization algorithms into PINNs to adaptively adjust the global physical loss weight coefficients. Some studies involve the fusion of multiple physical constraints, but most adopt linear superposition of manually set fixed weights or simple coefficient optimization algorithms, which are difficult to adapt to the dynamic differences in degradation rates of multiple features under different battery cycle stages and operating conditions [21,22,23]. In addition, manually setting weights relies heavily on extensive prior experience and lacks generalizability, making it difficult to adapt to the differences in feature degradation laws among batteries with different chemical systems.
1.3. Contributions
To overcome the limitations of existing PINNs in battery SOH estimation, including limitations of single-feature constraints, rigid fixed-weight fusion of multi-feature constraints, insufficient application of time-series networks, and the lack of optimization algorithms for adjusting global physical loss weights, this study proposes an adaptive-weight Physics-Informed Neural Network (AW-PINN) integrated with the Grey Wolf Optimizer (GWO) [24] to optimize the global physical loss weight. The core contributions are as follows:
- Unlike conventional PINNs that only use single physical constraints, this work breaks through the limitation of single-feature modeling by selecting two complementary physical features as dual monotonic constraints, which can comprehensively capture the dynamic coupled degradation characteristics of batteries.
- Different from traditional fixed-weight or manually-tuned PINNs, a dual-LSTM parallel architecture is designed, in which the weight generator LSTM branch dynamically learns adaptive weights for the monotonicity losses of the two features. This eliminates the need for manual weight tuning and enables adaptive adjustment to the battery’s real-time degradation stages and operating conditions.
- To address the research gap that few PINN studies introduce optimization algorithms in battery SOH estimation, the GWO algorithm is introduced to globally optimize the physical loss weight. Combined with LSTM’s time-series modeling capability, it balances data fitting accuracy and physical consistency, making up for the insufficient application of time-series degradation modeling in existing PINNs.
2. Data Analysis and Feature Extraction
2.1. Datasets
This study utilizes the battery datasets from the Center for Advanced Life Cycle Engineering (CALCE) [25] and Tongji University (TJU) [26]. Specifically, the CALCE dataset includes cells CS2_35, CS2_36, CS2_37, CX2_34, CX2_36, CX2_37, and CX2_38, while the TJU dataset comprises Cells 1–5 of NCA_CY25-0.5_1 and Cells 1–4 of NCM_CY35-0.5_1. A total of 16 batteries were employed for testing experiments, with the detailed battery parameters presented in Table 1 [27].
Table 1.
Battery parameters of CALCE and TJU datasets.
SOH is an essential indicator for evaluating the health of batteries. The calculation formula is as follows:
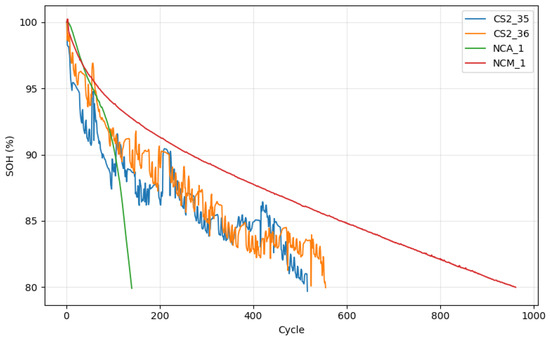
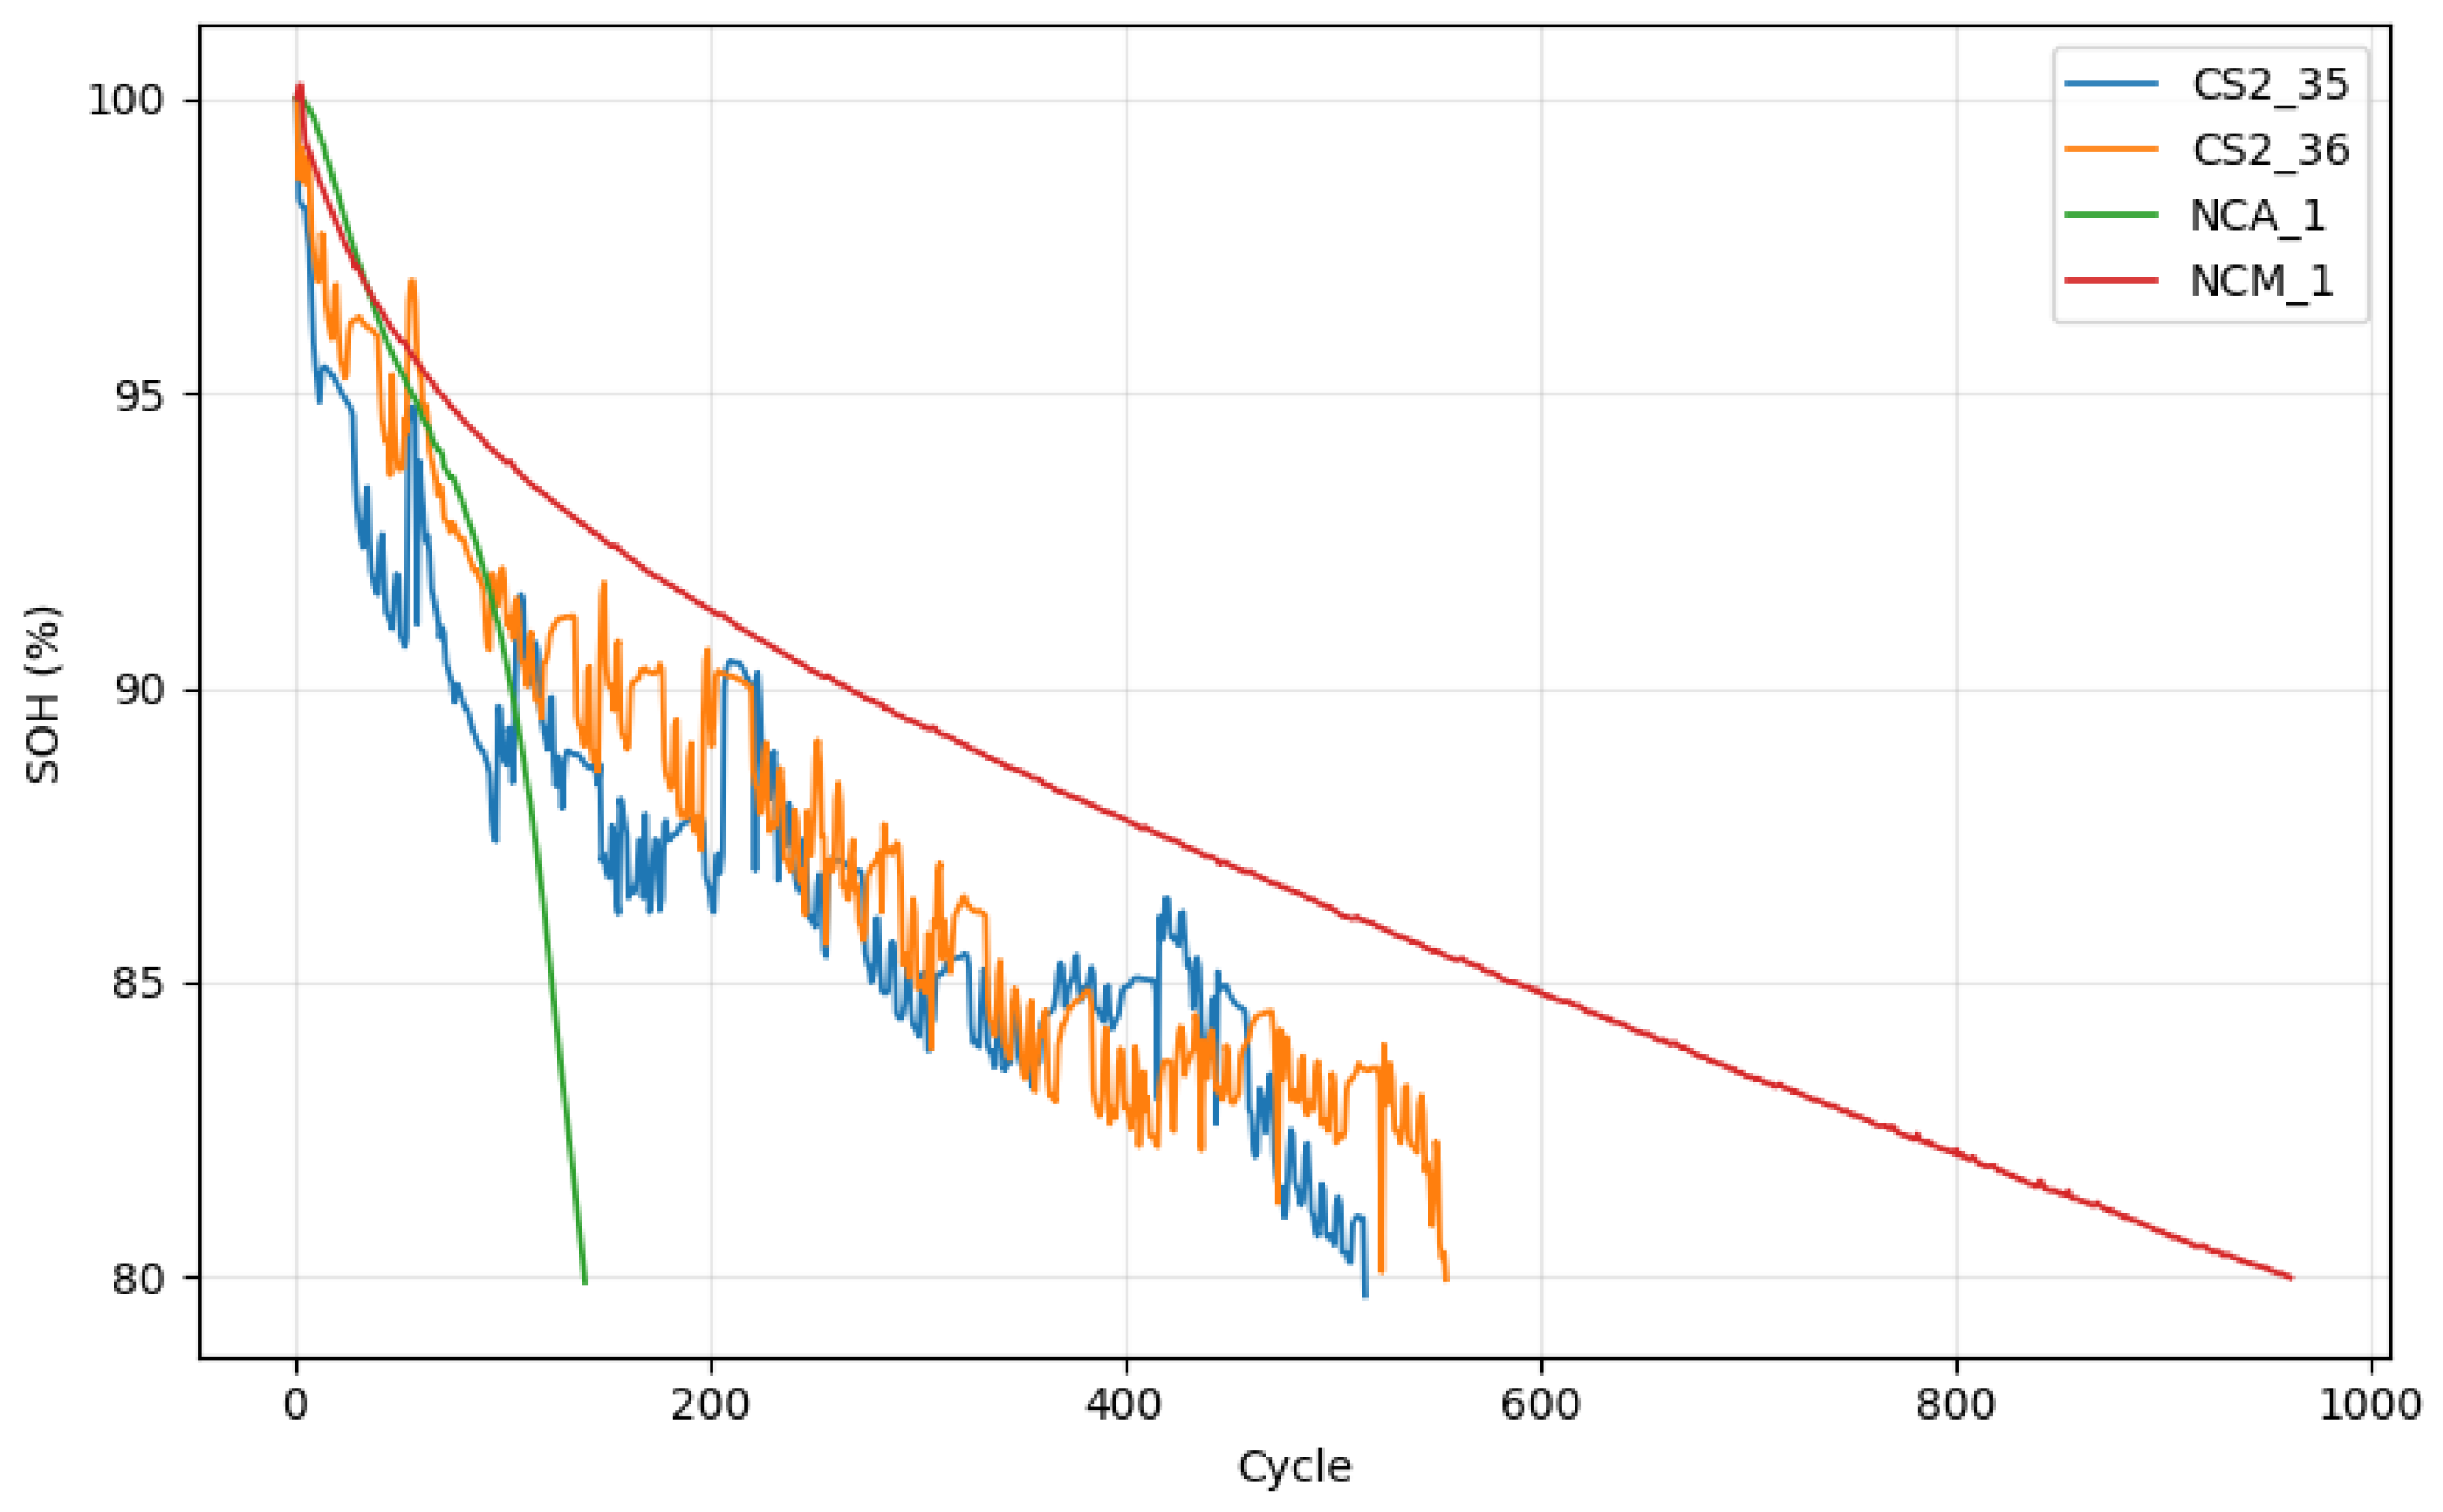
where is the current capacity, and is the nominal capacity. When the battery’s SOH drops below 80%, it is no longer suitable for critical applications such as electric vehicles [28]. Therefore, this study focuses on the aging process of batteries from the initial state to an SOH of 80%. The SOH degradation curves of the batteries in the two datasets are shown in the Figure 1.
Figure 1.
The SOH degradation curves of the representative batteries in the two datasets.
2.2. Feature Extraction
Incremental Capacity Analysis (ICA) is an essential characterization method in battery analysis, which converts the battery’s voltage–capacity curve into an incremental capacity () curve. The formula can be expressed as follows:
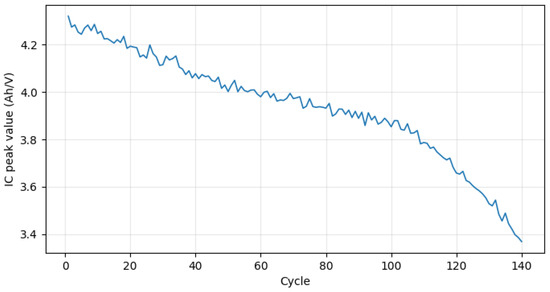
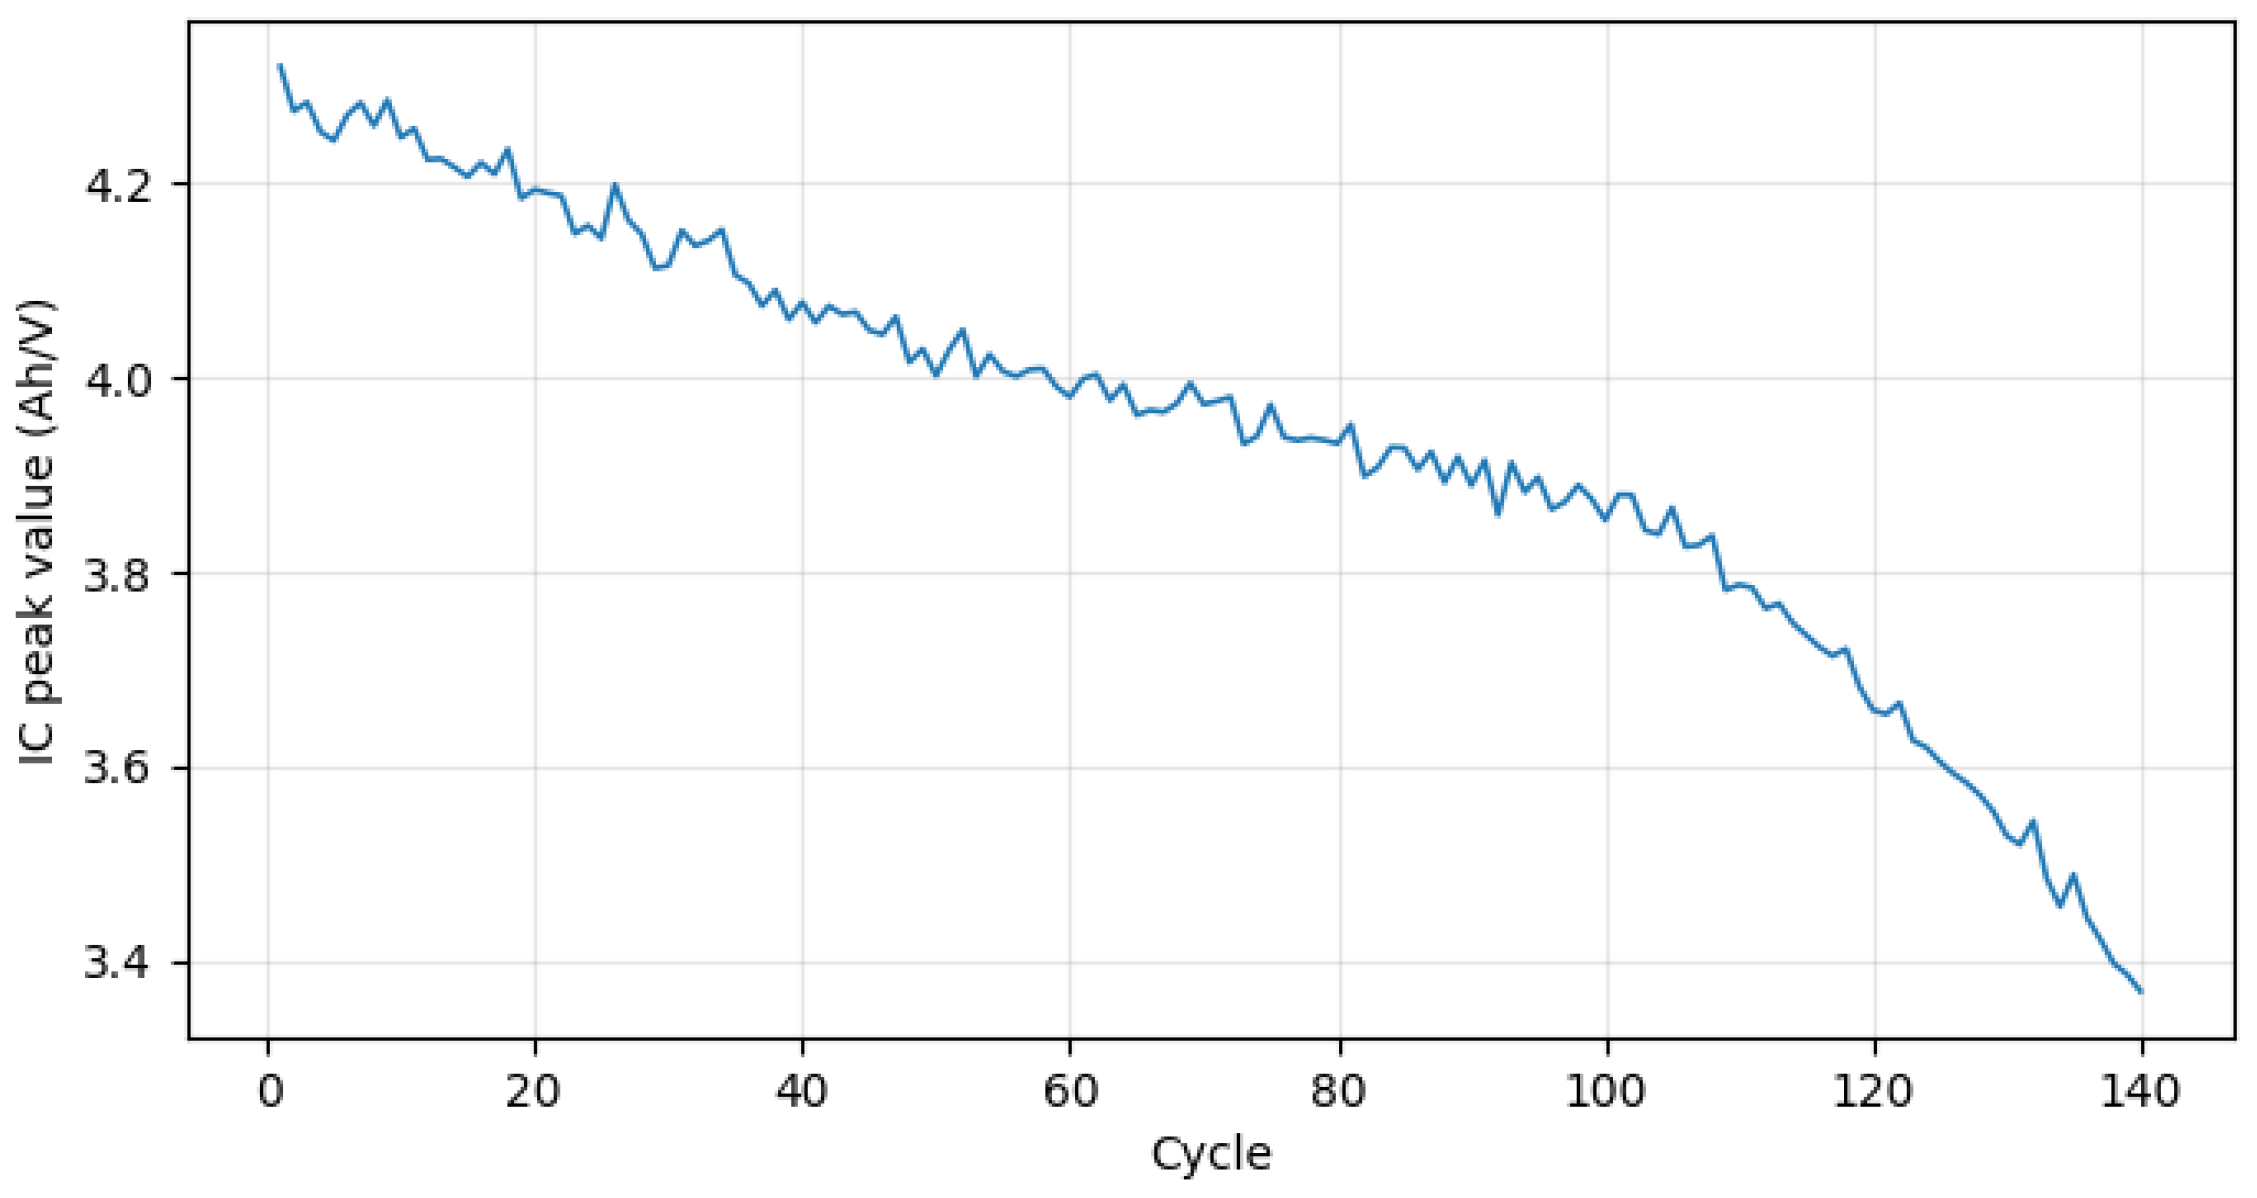
where Q, V, and t represent the charge, the charging voltage, and the time, respectively [29]. With the use of batteries, the active materials continuously degrade and lose the ability to intercalate lithium ions effectively, which directly leads to the gradual decrease of the IC curve peak value. The IC peak value curve is shown in the Figure 2.
Figure 2.
The IC peak value curve of battery NCA_1.
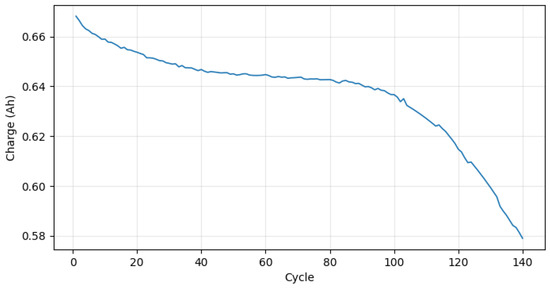
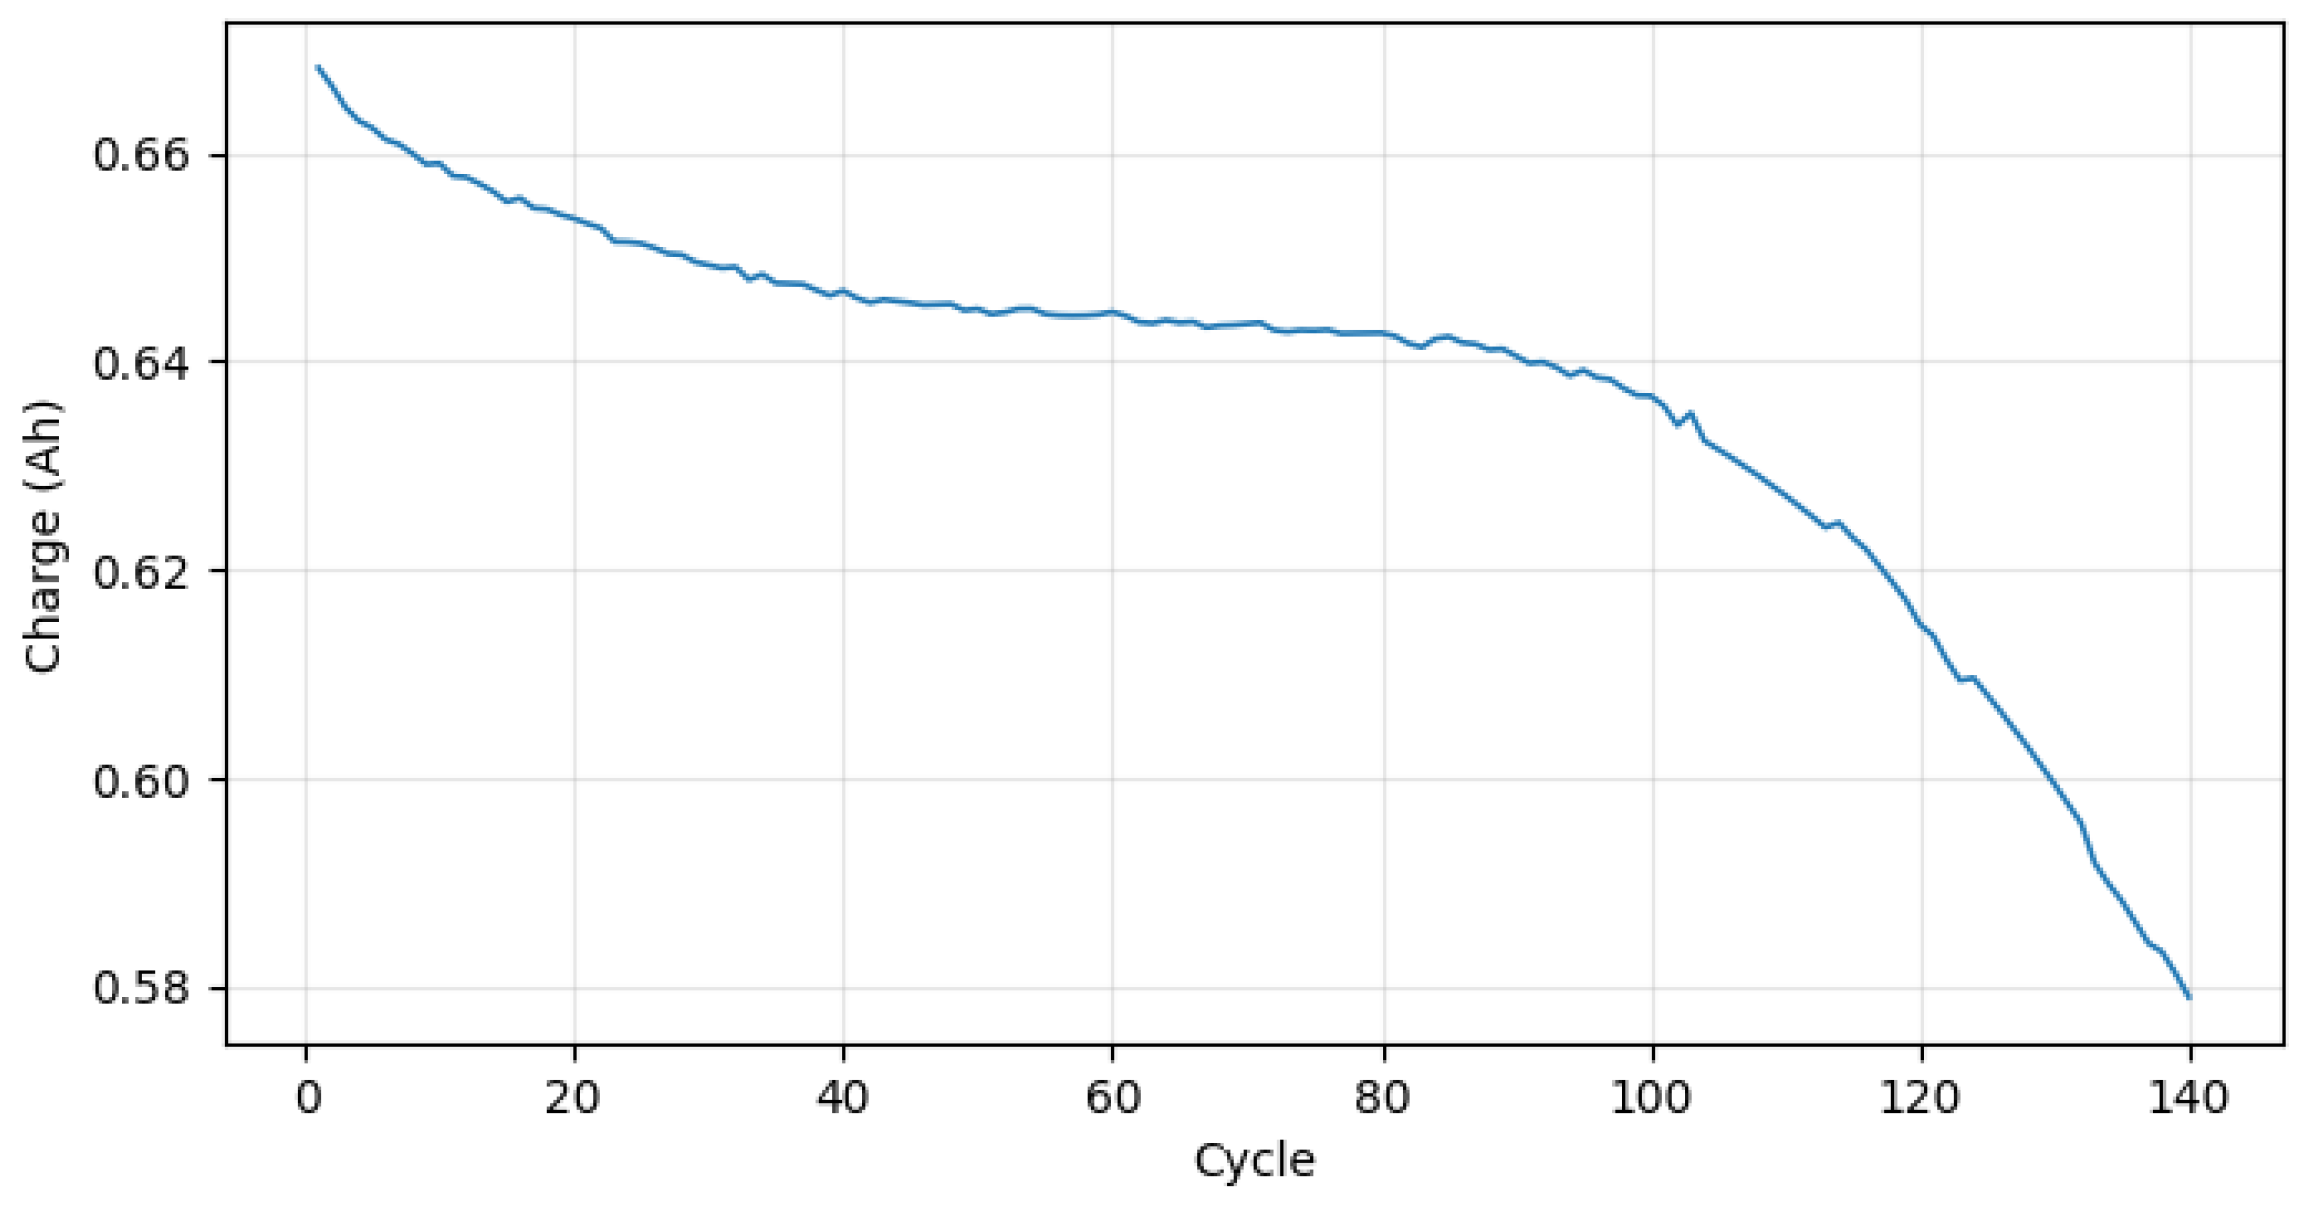
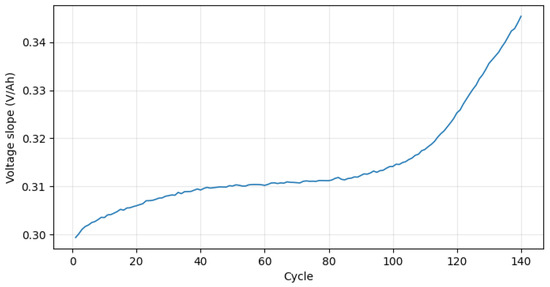
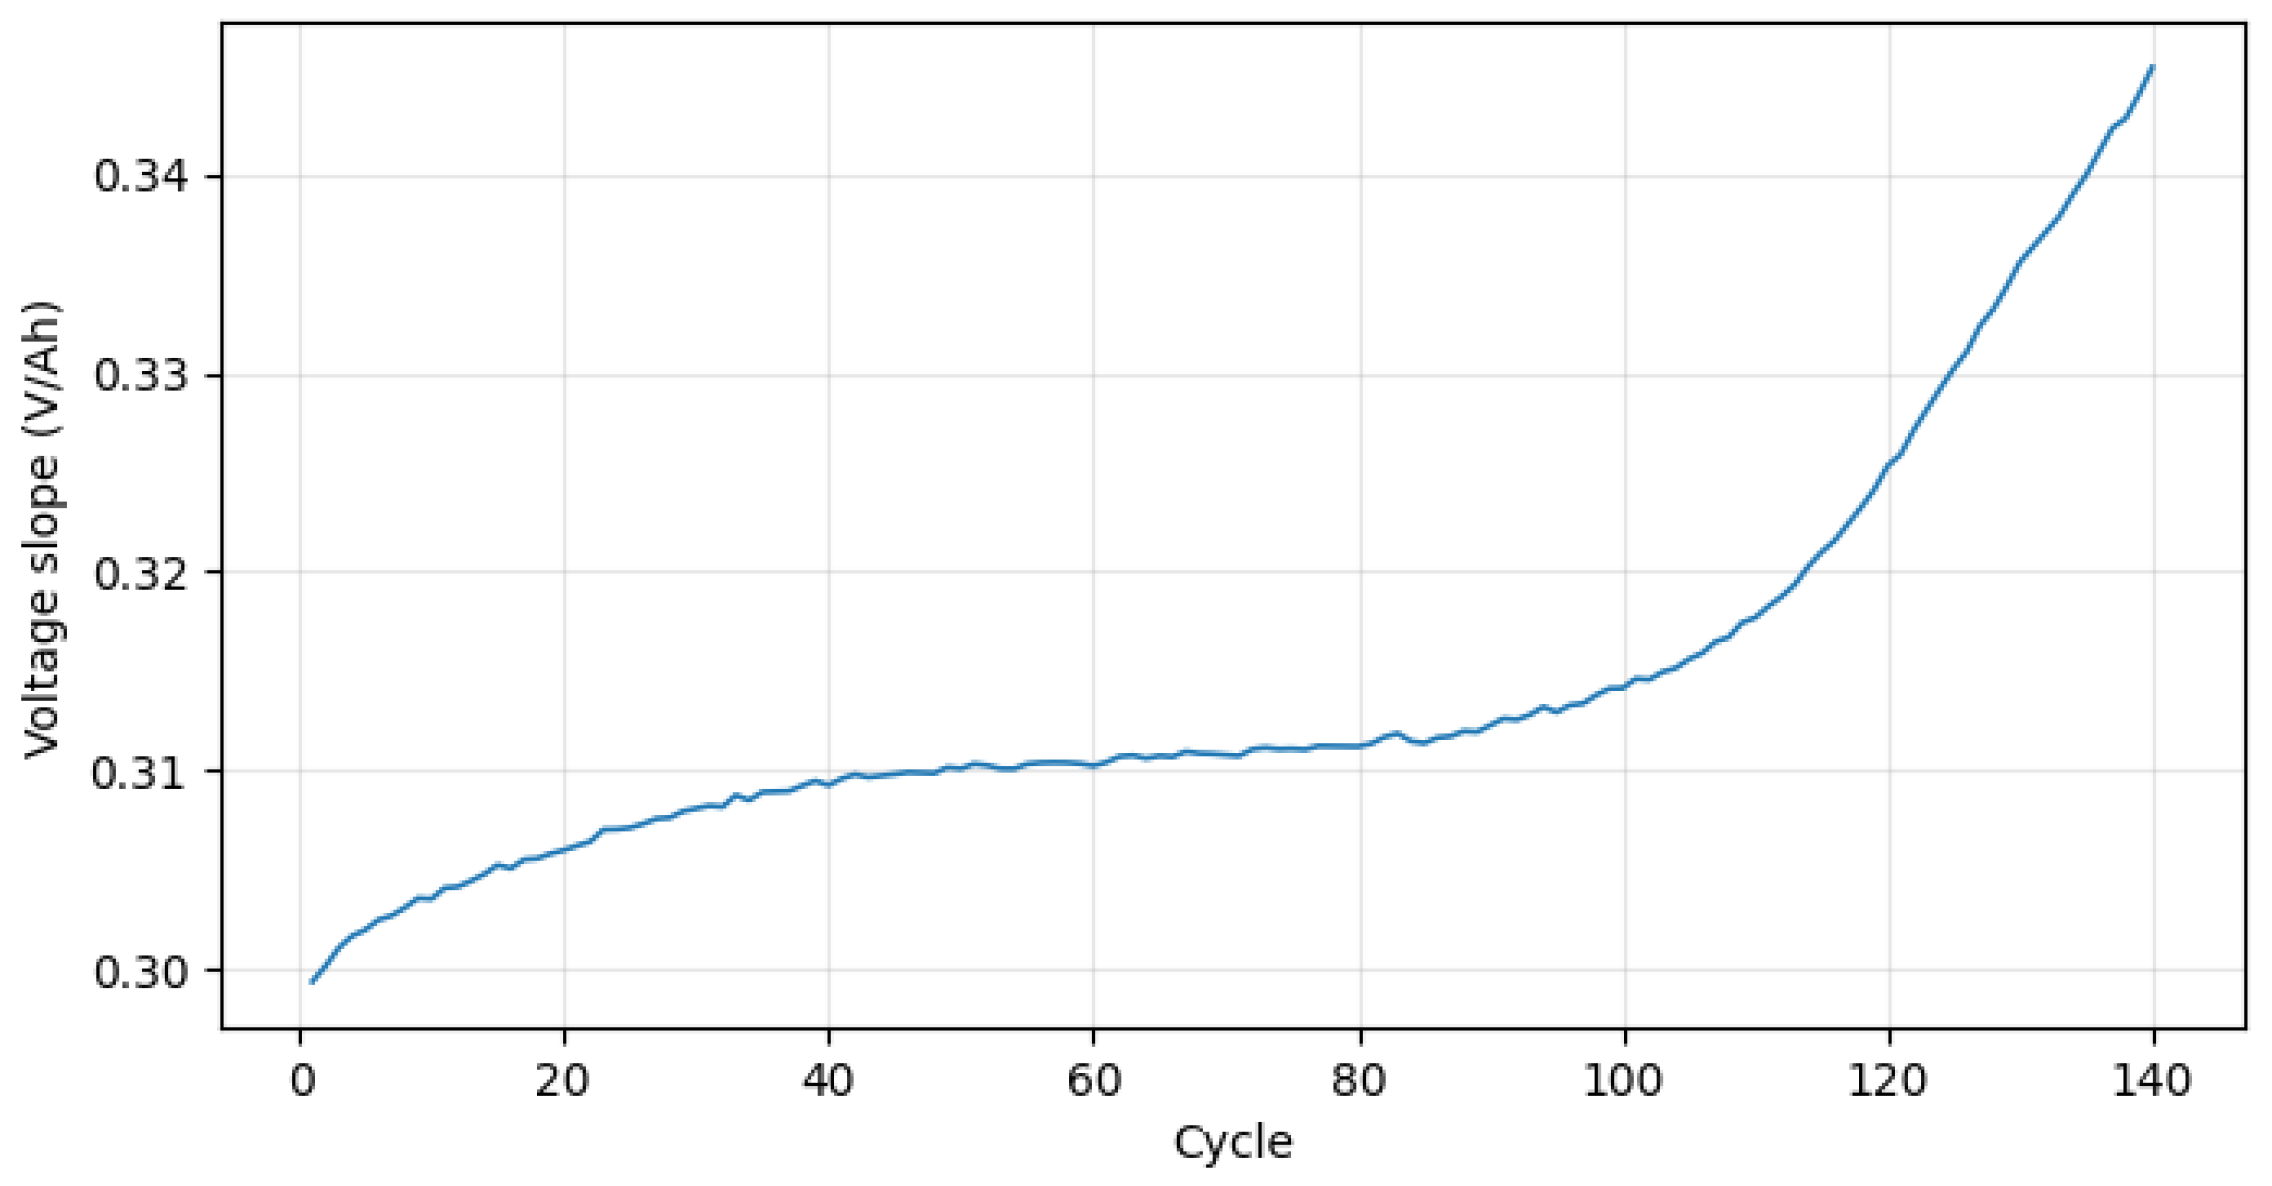
As the battery ages, the internal active materials are continuously consumed, and the efficiency of electrochemical reactions gradually decreases, leading to regular changes in charging characteristics. We select the charged capacity (Q) and voltage slope () within the voltage range of [ 0.4 V, 0.2 V] as features. The formula can be expressed as follows:
where I represents the charging current, t represents the charging time, and denote the upper bound of the voltage range and the corresponding charged capacity, respectively, and and denote the lower bound of the voltage range and the corresponding charged capacity, respectively [30]. With the continuous charge–discharge cycles of the battery, the charged capacity decreases and the voltage slope increases. The two features are shown in Figure 3 and Figure 4.
Figure 3.
The charge value curve of battery NCA_1.
Figure 4.
The voltage slope curve of battery NCA_1.
In the data preprocessing stage, obvious outliers are first eliminated. After obtaining the IC curves, this study performs Gaussian filtering with a sigma of 1 for smoothing to suppress high-frequency noise, thereby enhancing the stability of the IC curve peaks. Subsequently, abnormal points are identified through trend fitting and deviation degree analysis and corrected accordingly. Finally, the features are normalized to map them to a unified scale of [0, 1].
The IC peak value and charged capacity are specifically selected as physical constraints for the SOH estimation model due to their inherent monotonic correlation with SOH. The IC peak value is closely related to the reactivity of electrode active materials and the reversibility of lithium-ion intercalation and deintercalation. With the continuous consumption of active materials and irreversible loss of lithium inventory during cycling, the IC peak value exhibits a monotonically decreasing trend as SOH declines [31]. The charged capacity within a fixed voltage range directly reflects the battery’s available lithium inventory and active material utilization efficiency. As aging progresses, factors such as solid electrolyte interphase (SEI) layer growth and electrode structure degradation inevitably reduce the number of lithium ions that can participate in electrochemical reactions, resulting in a monotonically decreasing characteristic of charged capacity with SOH attenuation [32]. Incorporating these two features as physical constraints into the model can force the prediction results to follow the real aging kinetics, avoiding physically implausible phenomena such as abrupt SOH rebounds and non-monotonic fluctuations. This not only enhances the reliability and interpretability of SOH estimation, but also ensures that the model outputs conform to the intrinsic electrochemical degradation mechanisms of lithium-ion batteries [33].
The Pearson correlation coefficient r serves to quantify linear correlation, where values approaching 1 signify a stronger linear relationship [34]. Its calculation formula is as follows:
where and denote individual observation values of the two datasets, while and stand for the corresponding sample mean values of the datasets to which they belong. All three features extracted in this work demonstrate a strong correlation with battery SOH, thus serving as effective features for SOH prediction. The specific correlation coefficients are shown in the Table 2.
Table 2.
The Pearson correlation coefficient between the features and the SOH.
3. Methodology
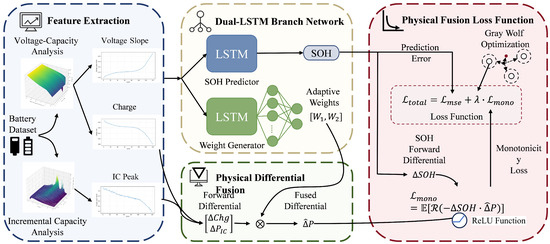
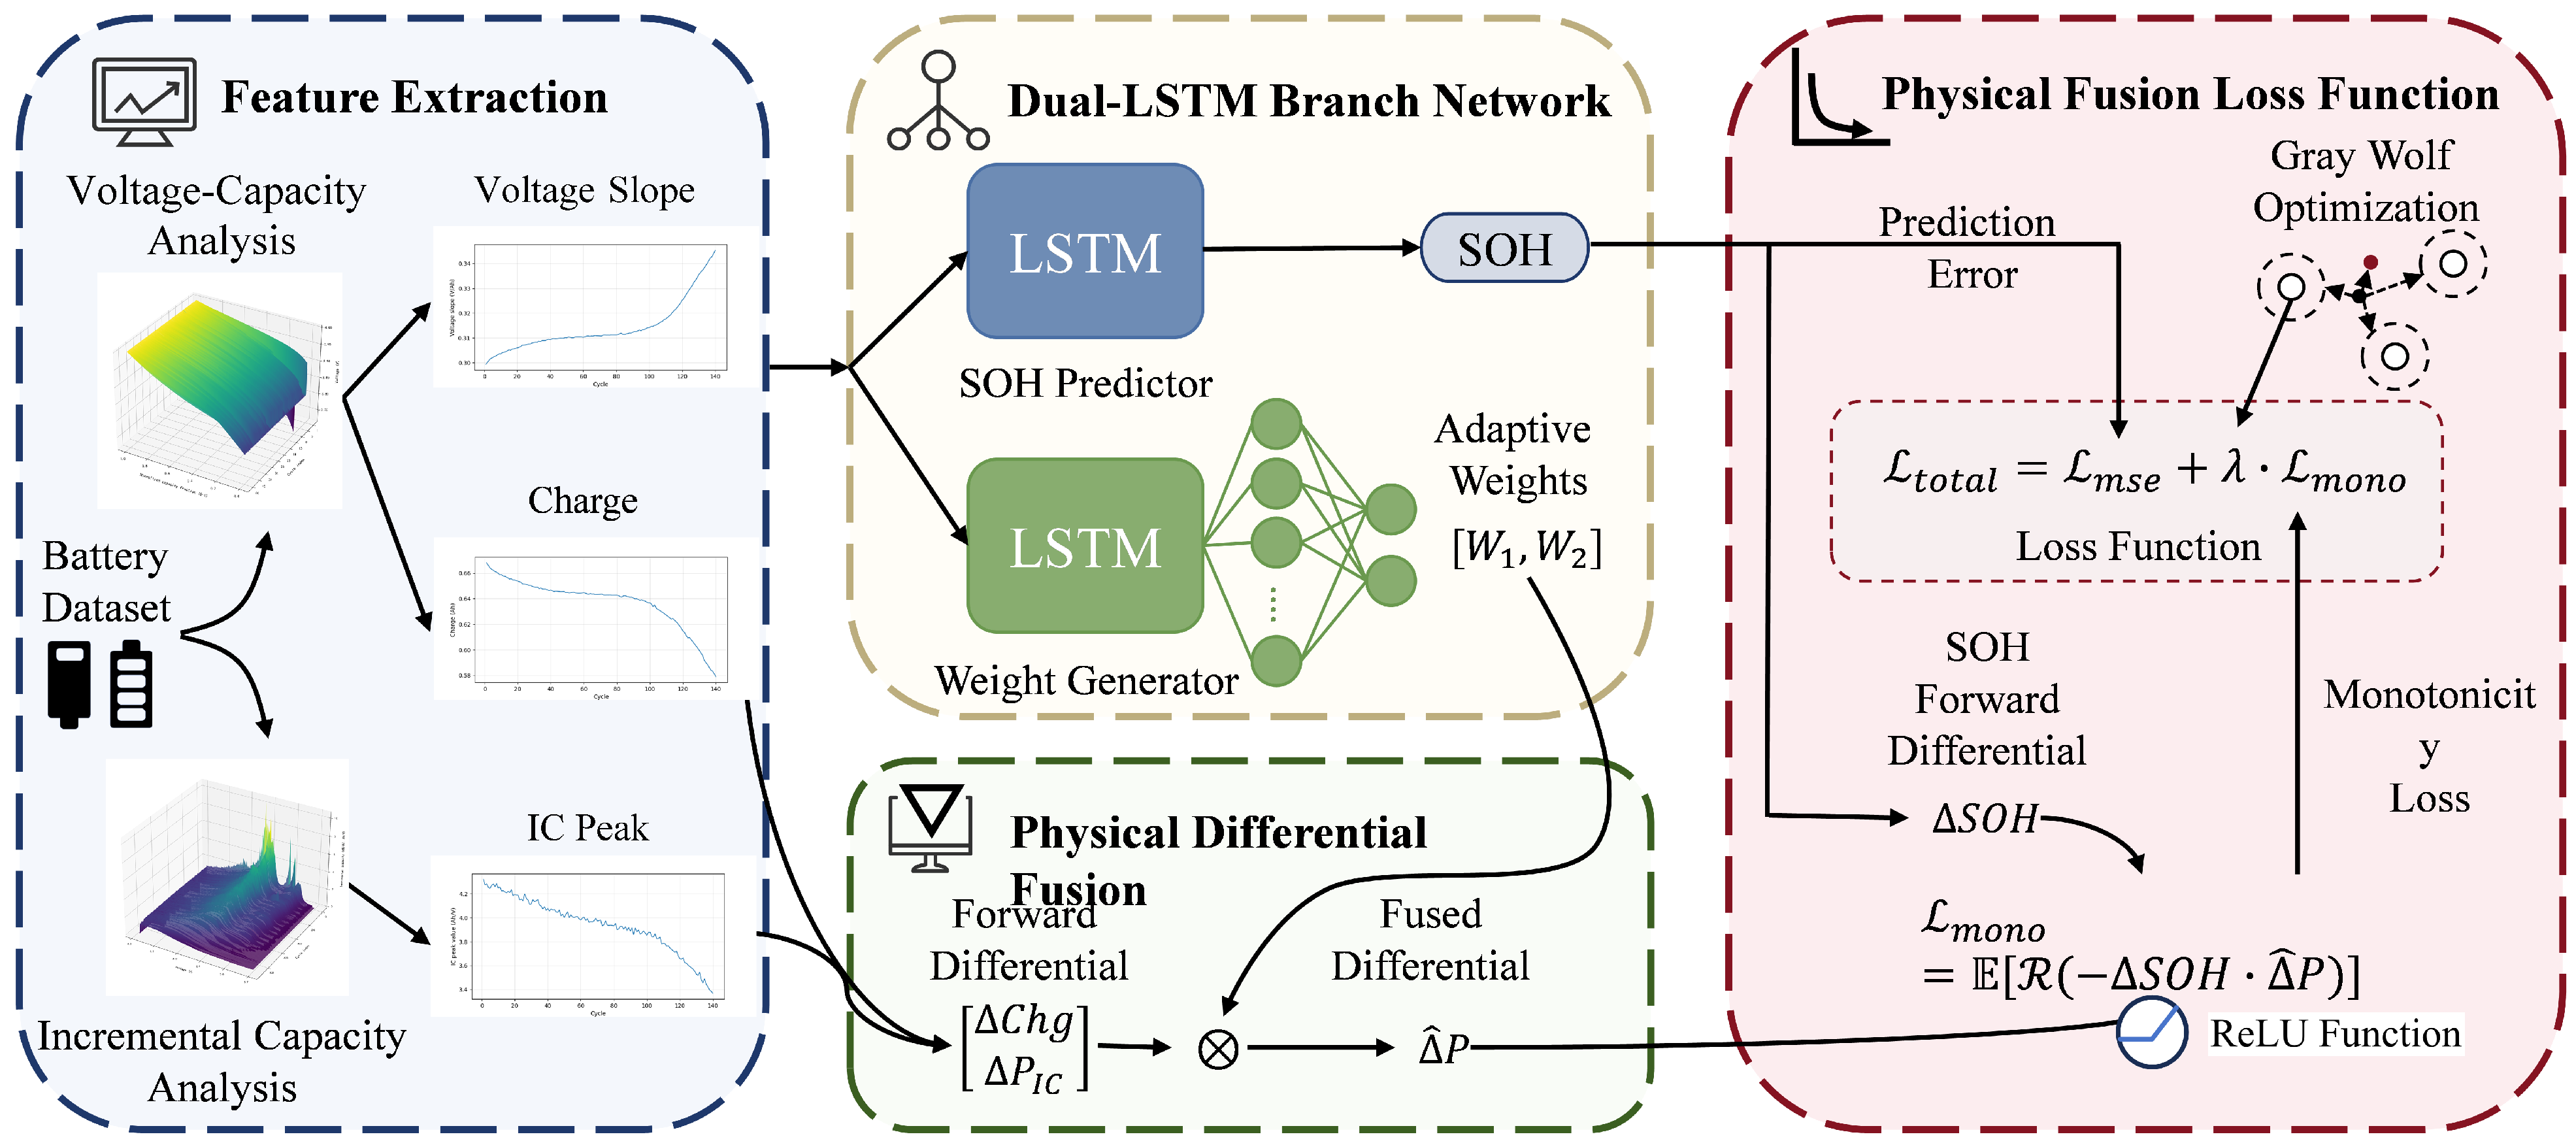
The AW-PINN model extracts three features from battery charge–discharge data for prediction: the peak of the Incremental Capacity (IC) curve, the charging capacity within the final charging interval, and the voltage slope. Among these, the IC curve peak reflects the loss of active materials, and the interval charging capacity indicates changes in lithium inventory. These two are selected as physical constraint objects to construct a dual-LSTM branch network. Specifically, the first “SOH predictor LSTM” is responsible for prediction and outputs the estimated SOH value; the second “Weight generator LSTM” dynamically learns adaptive weights for the monotonic physical losses of the two constraint objects, which are then combined to obtain a fused monotonic loss term. Meanwhile, the Grey Wolf Optimizer (GWO) algorithm is introduced to globally optimize the global physical loss weight. This weight is multiplied by the fused monotonic loss term and embedded into the total loss function, ultimately achieving joint optimization of the model.
This design eliminates the need for manual intervention in weight parameters. The weight generator LSTM can dynamically adjust the constraint intensity of the two features according to the battery’s degradation state and operating conditions, while the GWO algorithm globally optimizes the balance between physical constraints and data fitting. It not only ensures the core physical laws, namely that the IC curve peak decreases with the SOH and the interval charging capacity increases with cycle number [17,21], but also resolves the constraint imbalance caused by fixed-weight fusion through the dual regulation of adaptive weights and globally optimized weights. The overall framework is shown in Figure 5.
Figure 5.
Overall framework of AW-PINN model.
3.1. Dual-LSTM PINN Framwork
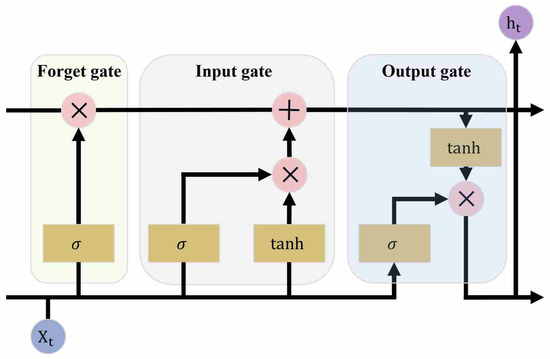
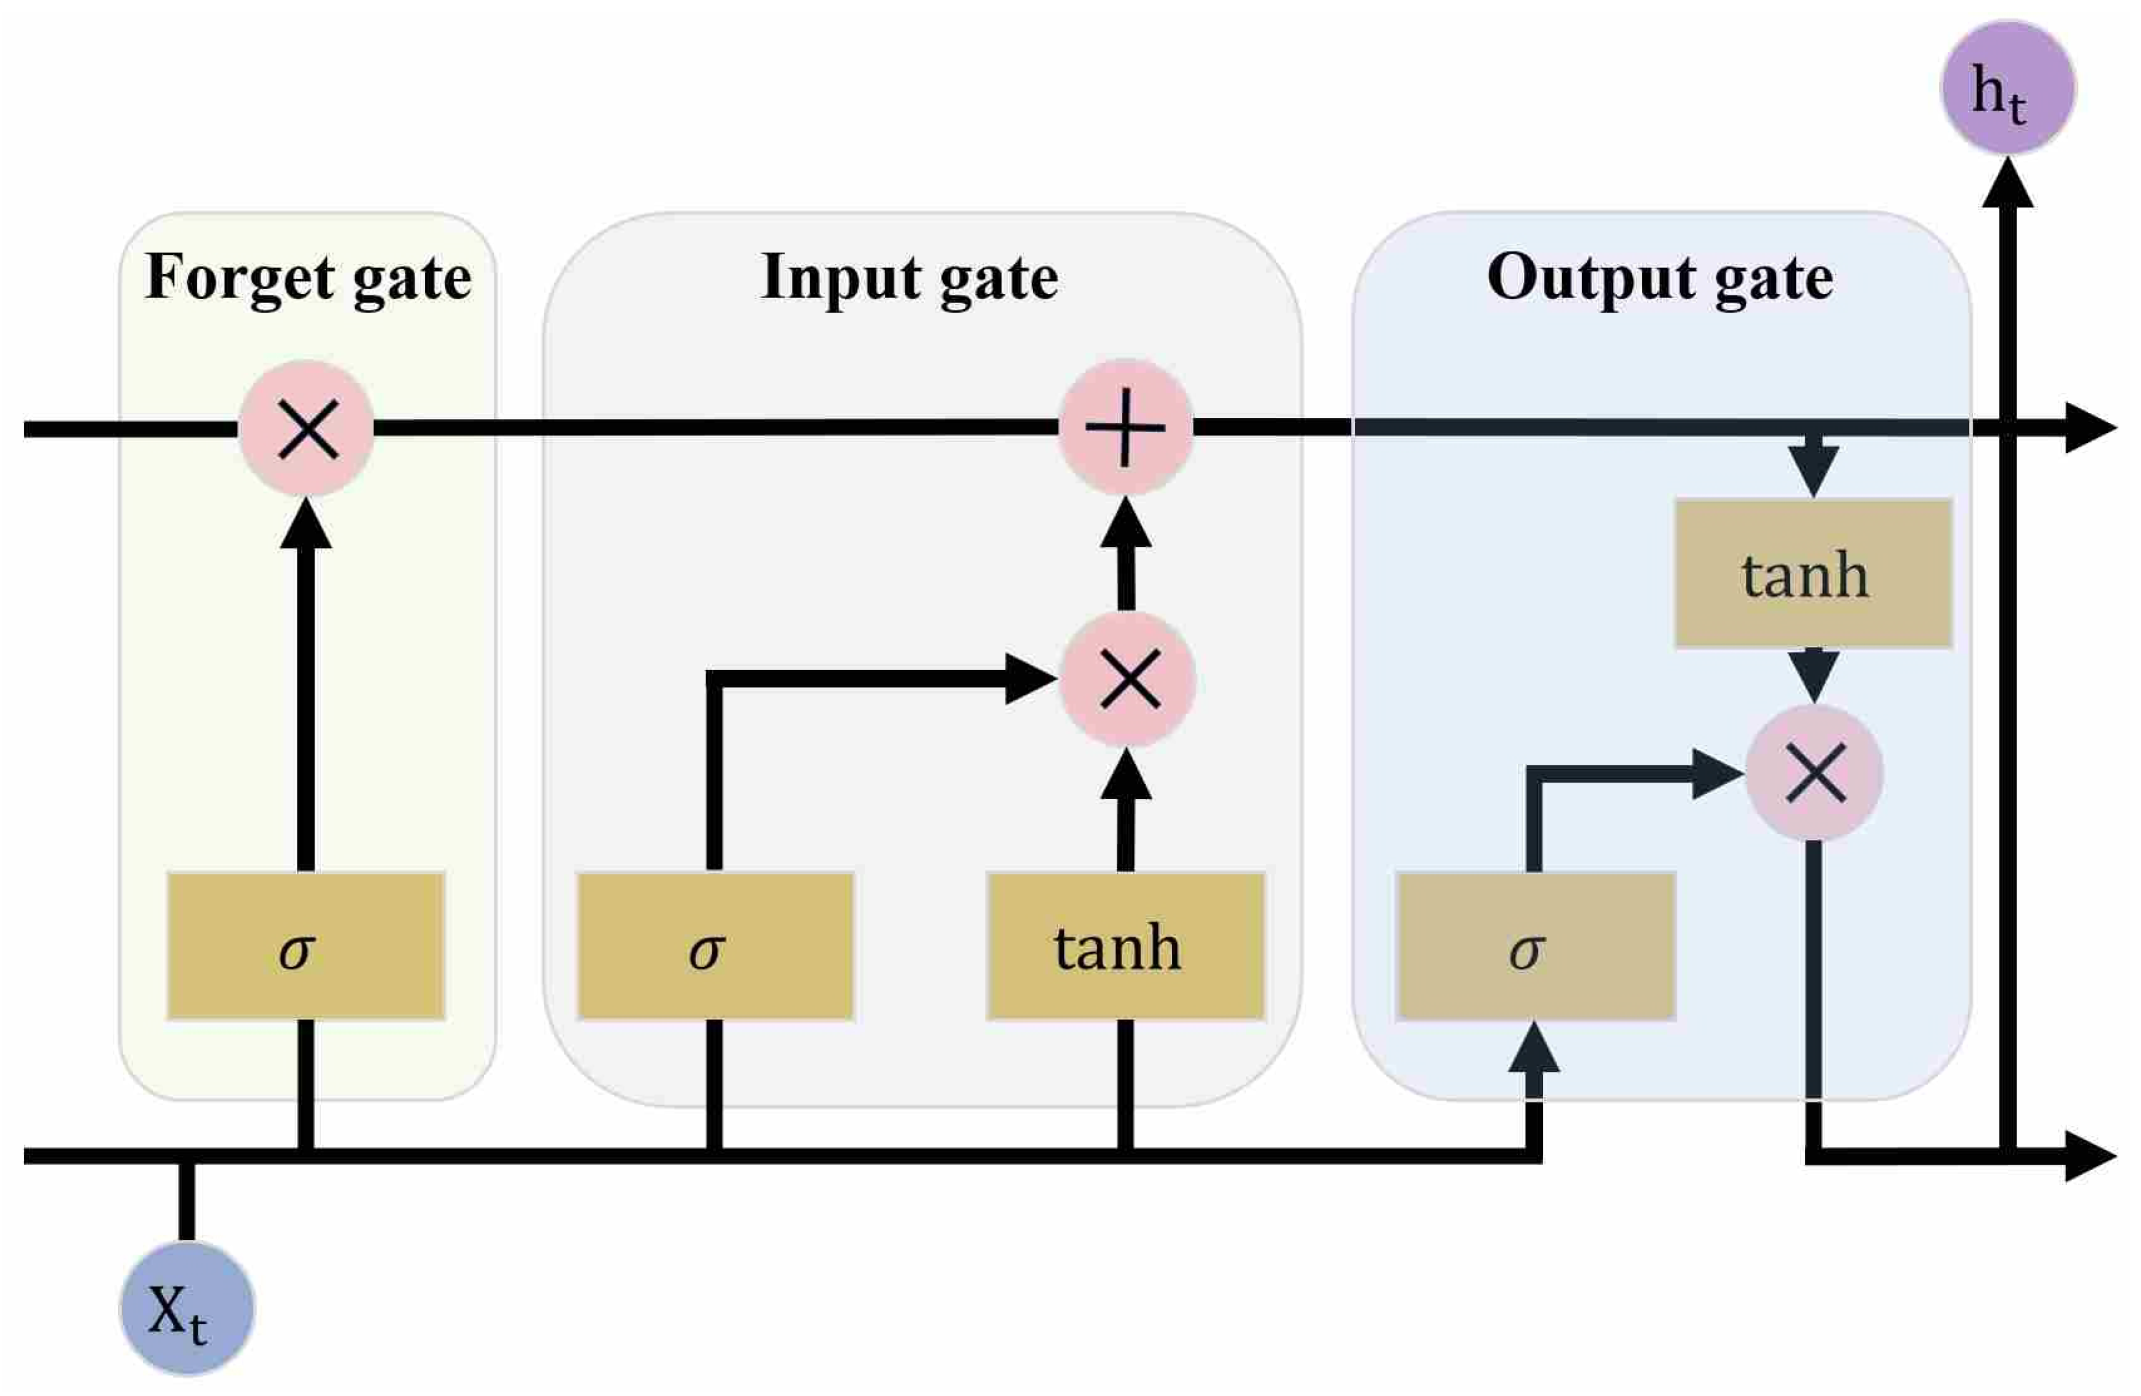
LSTM can capture long-term temporal dependencies in time-series data through its unique gating mechanism, while alleviating the vanishing gradient problem. Since battery SOH estimation is a typical time-series prediction task and the effectiveness of LSTM in such scenarios has been verified in numerous studies [35,36,37], it is selected as the backbone network for the proposed SOH prediction model. The internal mechanism of LSTM dynamically controls the inflow, retention, and outflow of information. Its internal structure is shown in the Figure 6.
Figure 6.
LSTM structure.
The forget gate regulates the information to be retained in the cell state from the preceding time step, while the input gate specifies the portion of the current input information that needs to be updated into the cell state. The cell state is then updated by integrating the outputs of the forget gate and input gate, and finally, information is transmitted via the output gate [38]. The specific formulas are as follows:
where t denotes the current time step; , , and are the outputs of the forget gate, input gate, and output gate at time t; and denote the current and previous cell states; and is the candidate cell state. Furthermore, represents the previous hidden state; denotes the current input feature vector; W and b are the weight matrices and bias terms for each gate and cell state; ⊙ denotes the element-wise Hadamard product; and is the final hidden state output for prediction [39].
After extracting three features from the battery data, they are input into the dual-LSTM branch network. During the training process, the SOH predictor LSTM receives the three features and outputs the predicted SOH values . First, the prediction error between the predicted and true values is computed as follows:
Subsequently, the forward difference is performed on the sequence of predicted SOH values to obtain the SOH difference term :
As physical constraints, the two features of IC peak value and charged capacity are not only input into the physical differential fusion module to generate two separate physical difference terms via forward difference but are also fed into the weight generator LSTM. The weight generator LSTM dynamically updates the constraint weights during training by capturing the long-range temporal dependencies of the features through its internal gating mechanism to produce time-aware hidden representations. These representations are then fed into a linear layer to generate raw weight coefficients, which are normalized to satisfy . The physical difference terms are multiplied by their respective adaptive weights and then summed to yield the fused physical difference term . This term is input into the ReLU function together with the SOH difference term to calculate the monotonicity loss with the formula given as follows:
The ReLU function ensures that no loss is incurred when the fused physical constraint term and the SOH term change in a consistent direction (i.e., ). In contrast, a loss is generated when their variation directions are opposite (i.e., ), and the loss magnitude increases with the deviation between the two terms. The monotonicity loss is then multiplied by a global physical loss weight , and the resulting term is combined with the prediction error loss to form the physical fusion loss function , which guides the training of the model. The formula is as follows:
The design of this Dual-LSTM PINN network enables the effective integration of data-driven prediction with physical constraint guidance, overcoming the limitations of traditional data-driven models that tend to violate the physical laws of battery aging and fixed-weight physical constraint models that fail to adapt to the dynamic aging states of batteries. The IC peak value and charged capacity form a complementary dual physical constraint system, which not only avoids the prediction bias of a single feature induced by noise interference but also mitigates the impact of abnormal data through the mutual verification of their variation trends, thereby improving the reliability and stability of SOH estimation at the feature level. Through the weight generator LSTM, the network can dynamically adjust the constraint intensity of the two physical features according to the battery’s aging state and operating conditions without manual intervention in weight parameter setting. In addition, the dual-LSTM branch structure can fully capture the temporal correlation of the sequential features of battery charge–discharge data, and the designed physical fusion loss function achieves the joint optimization of prediction accuracy and consistency with physical laws. The SOH values output by the model are not merely numerical fitting results, and their variation trends conform to the degradation mechanisms of active material loss characterized by the IC peak value and lithium inventory loss characterized by the charged capacity, thus establishing a direct correlation between the prediction results and the electrochemical aging process of the battery. The hyperparameters of the two LSTM networks are presented in Table 3.
Table 3.
The hyperparameters of the SOH predictor LSTM and weight generator LSTM.
3.2. Grey Wolf Optimizer
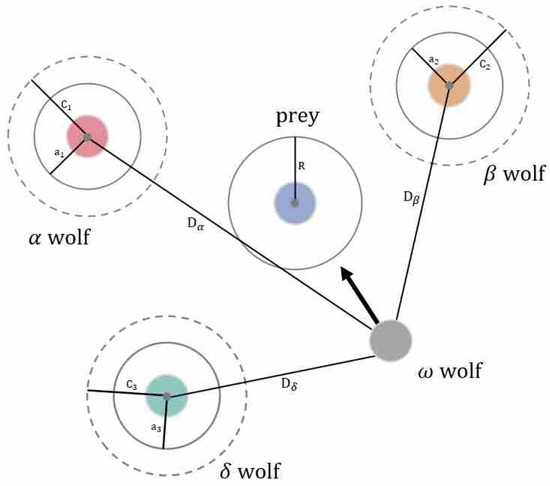
To address the problem that it is difficult to balance the adaptability of physical laws and data fitting accuracy in traditional fixed-weight physical constraint models, this study introduces the Grey Wolf Optimizer (GWO) for adaptive optimization of the global physical loss weight . Compared with traditional algorithms such as PSO [40,41,42], the proposed algorithm guides population search by simulating the three-level leadership mechanism of , , and , enabling more efficient avoidance of local optima. Characterized by concise parameters, fast convergence speed, and strong global optimization capability, it has been extensively verified in fields including neural network hyperparameter optimization [43,44].
The GWO algorithm mathematically models the hierarchical collaboration and hunting behavior of grey wolf packs, with three core processes: population initialization, prey encircling, and position update [45].
Step 1: Treat the candidate weights in the optimization process as grey wolf individuals and use the model’s validation set mean squared error (MSE) as the fitness value. Based on this criterion, sort and classify the individuals into four hierarchical levels: , , , and wolves. Among them, the wolf represents the candidate weight with the optimal fitness, corresponding to the value that minimizes the model’s prediction error; the wolf assists the wolf in guiding the population’s search direction and serves as the suboptimal weight candidate; the wolf executes hunting instructions and guides other individuals, acting as the third optimal weight candidate; the wolves refer to the remaining candidate weights, which update their positions following the guidance of the , , and wolves to gradually approach the optimal solution.
Step 2: The grey wolf pack achieves dynamic encircling of the optimal weight through coefficient vectors and , with the core formulas as follows:
where t represents the current iteration step, represents the current candidate weight vector , is the current optimal weight vector, and is the distance vector between the candidate weight and the optimal weight. The calculation formulas for coefficient vectors and are given as follows:
where and are random vectors within the interval [0, 1], and denotes a convergence factor decreasing linearly from 2 to 0 during the iterative process.
Step 3: The wolves update positional parameters according to the position information of the , , and wolves, simulating the cooperative hunting behavior of grey wolf packs. For the single-dimensional weight , the simplified update formulas are as follows:
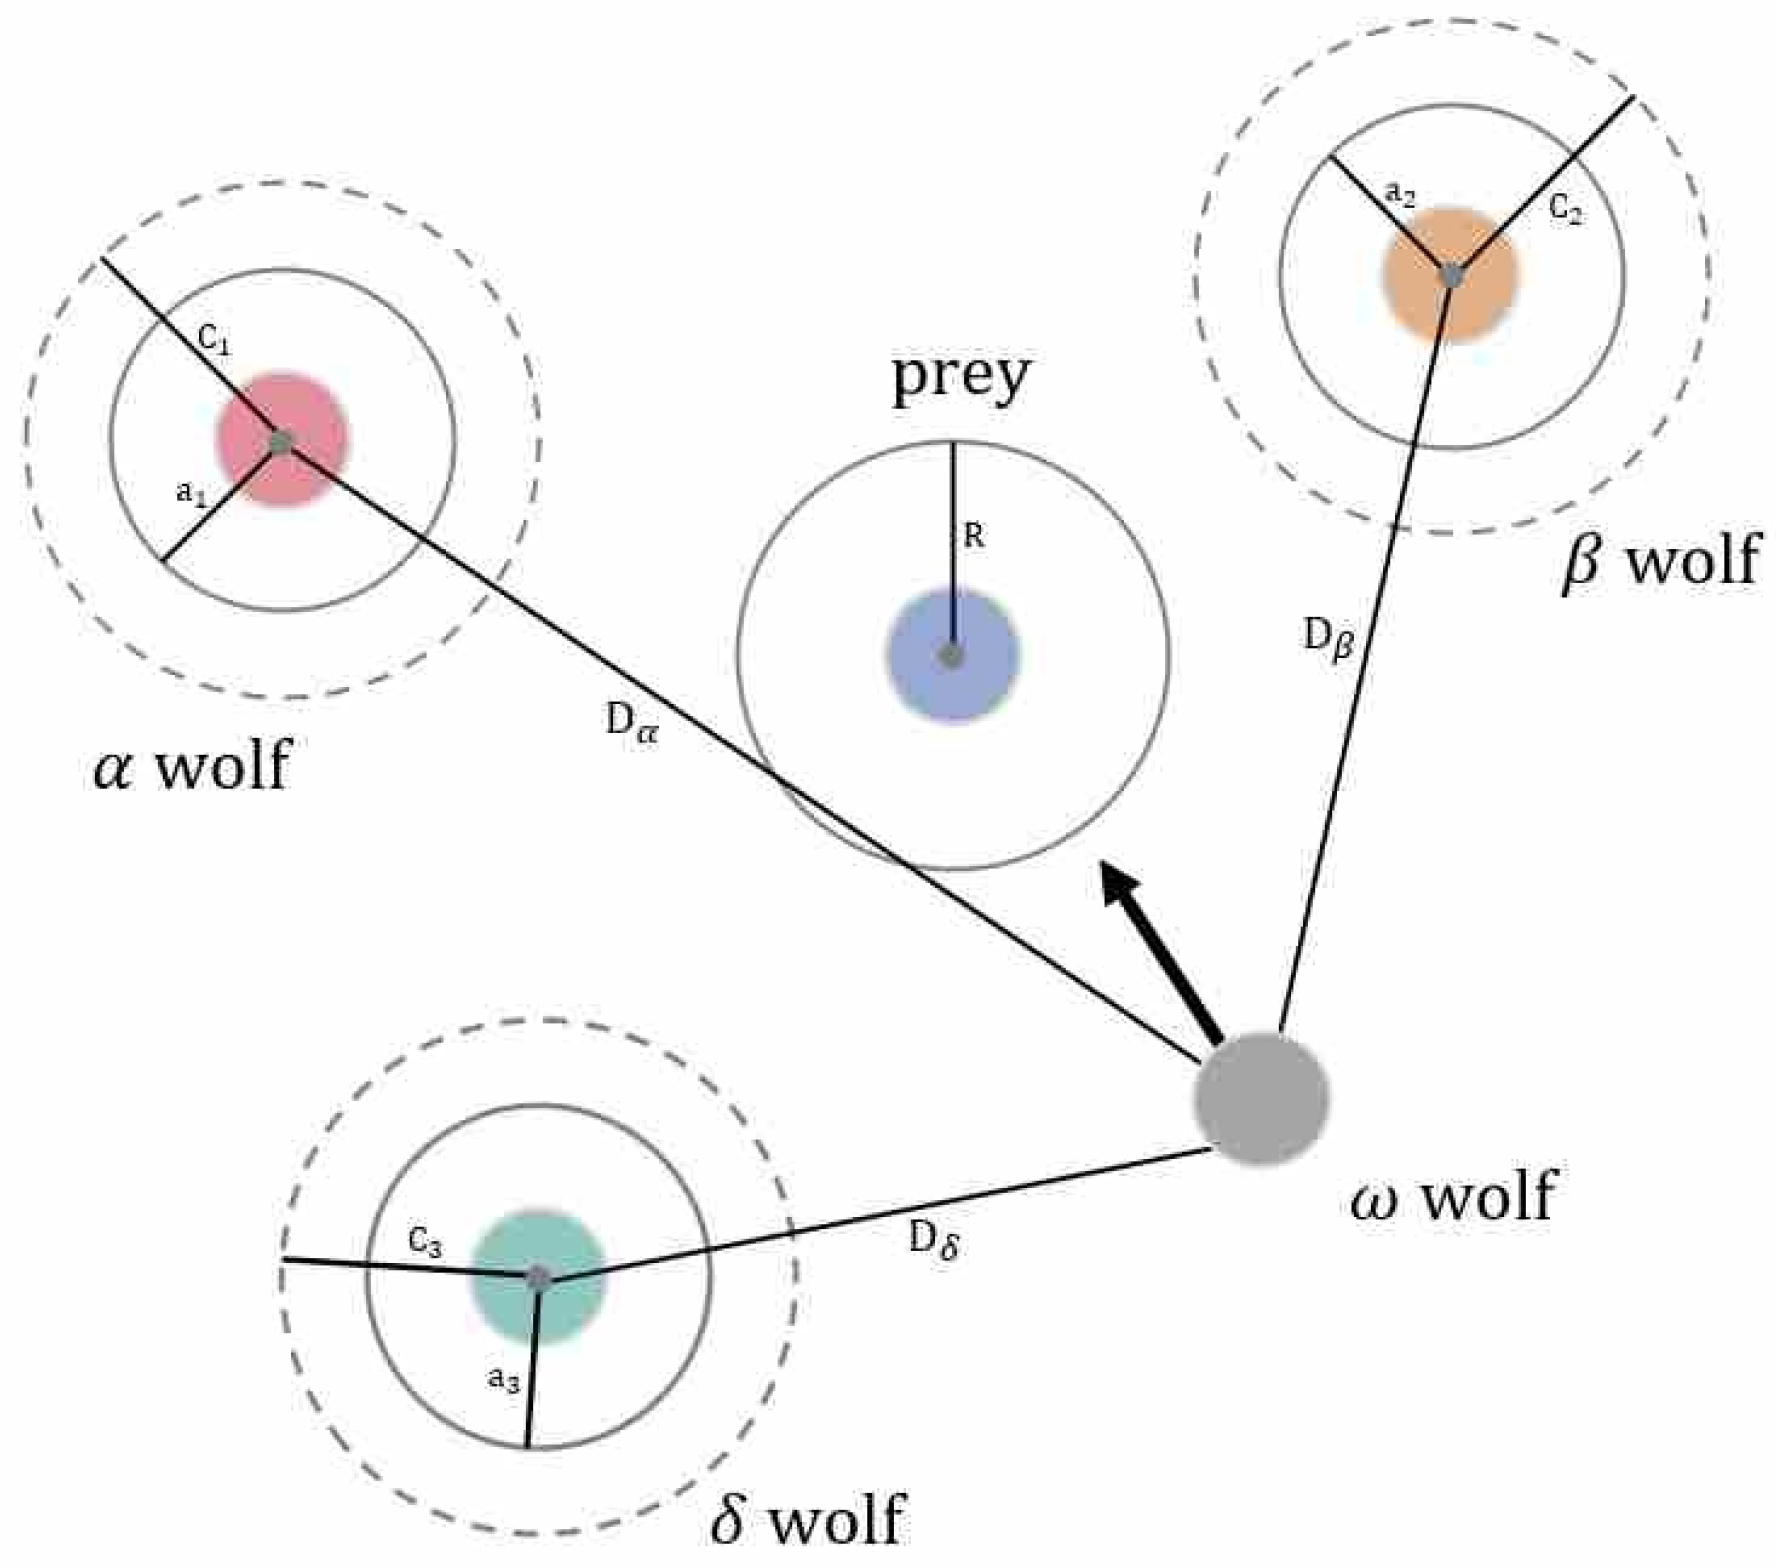
where , , and are the weight values corresponding to the , , and wolves, respectively, and is the updated candidate weight [24]. The population converges towards the optimal solution through the weighted average of the three, ensuring the stability and effectiveness of the search. A graphical diagram illustrating the GWO algorithm is presented in Figure 7.
Figure 7.
Schematic diagram of the GWO algorithm.
The GWO algorithm is employed to adaptively optimize the global physical loss weight , whose primary role is to automatically tune the contribution intensity of the physical constraint term in the loss function. GWO performs a heuristic search with the objective of minimizing the MSE on the validation set. By referring to other studies [43,44], comprehensively considering the model complexity and the low-dimensional property of the optimization task, and balancing the sufficiency of parameter optimization with time efficiency, we set the search space of as [0.0, 0.2] and set the population size to 8 and the maximum number of iterations to 6. When the algorithm reaches the maximum iteration limit, the optimal global physical loss weight corresponding to the wolf (0.12) is output and fixed in the model to complete the final training. This optimized weight is then embedded into the overall loss function during the formal training of the AW-PINN model. In this way, GWO determines the optimal value of through adaptive optimization, effectively balancing the intensity of physical constraints and data fitting accuracy, avoiding the subjectivity of manual parameter tuning, and enhancing the generalization ability and stability of the AW-PINN model in SOH estimation.
4. Results and Analysis
4.1. Model Validation
In this section, the effectiveness of the AW-PINN model is verified by comparison with six other models, including a Feedforward Neural Network (FNN), CNN, Gated Recurrent Unit (GRU), LSTM, Transformer, and Transformer-LSTM. As the most basic deep learning model, the FNN adopts a hierarchical propagation structure, which can realize a simple mapping between input features and output results but lacks the ability to model temporal features [46]. CNN has excellent local spatial feature extraction capabilities and can mine correlation patterns and subtle features in battery data [47]. As a lightweight variant of LSTM, GRU reduces model computational complexity and training time while still effectively capturing dependencies in temporal data. LSTM is selected as the core baseline model for battery time-series data, with a strong ability to capture long-term temporal dependencies. It has become a standard method for SOH estimation and has been validated in numerous studies for its effectiveness in time-series prediction [48]. Benefiting from the self-attention mechanism, the Transformer overcomes the limitations of recurrent structures and can simultaneously capture global dependencies in time-series data, showing significant advantages in various scenarios. The Transformer-LSTM hybrid model integrates the complementary advantages of both architectures, making it suitable for practical scenarios with complex and variable battery operating conditions [14]. Through direct comparison between the above six models and the AW-PINN model, the integration of physical constraints in the AW-PINN model can be verified.
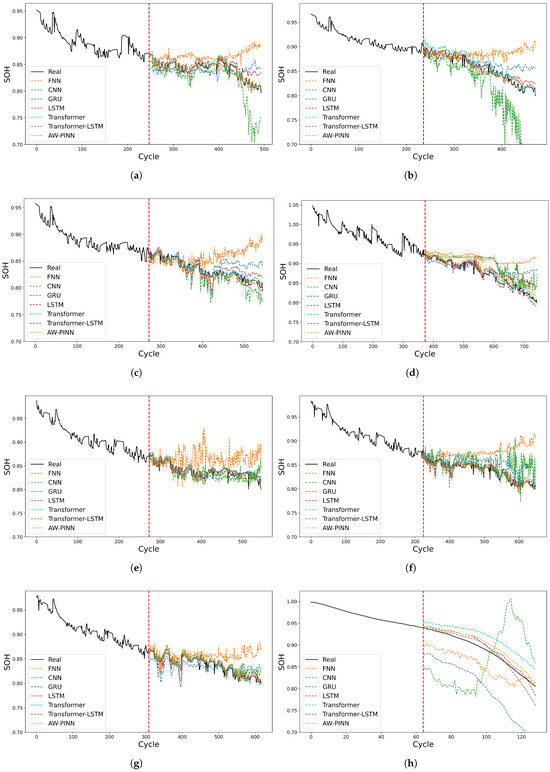
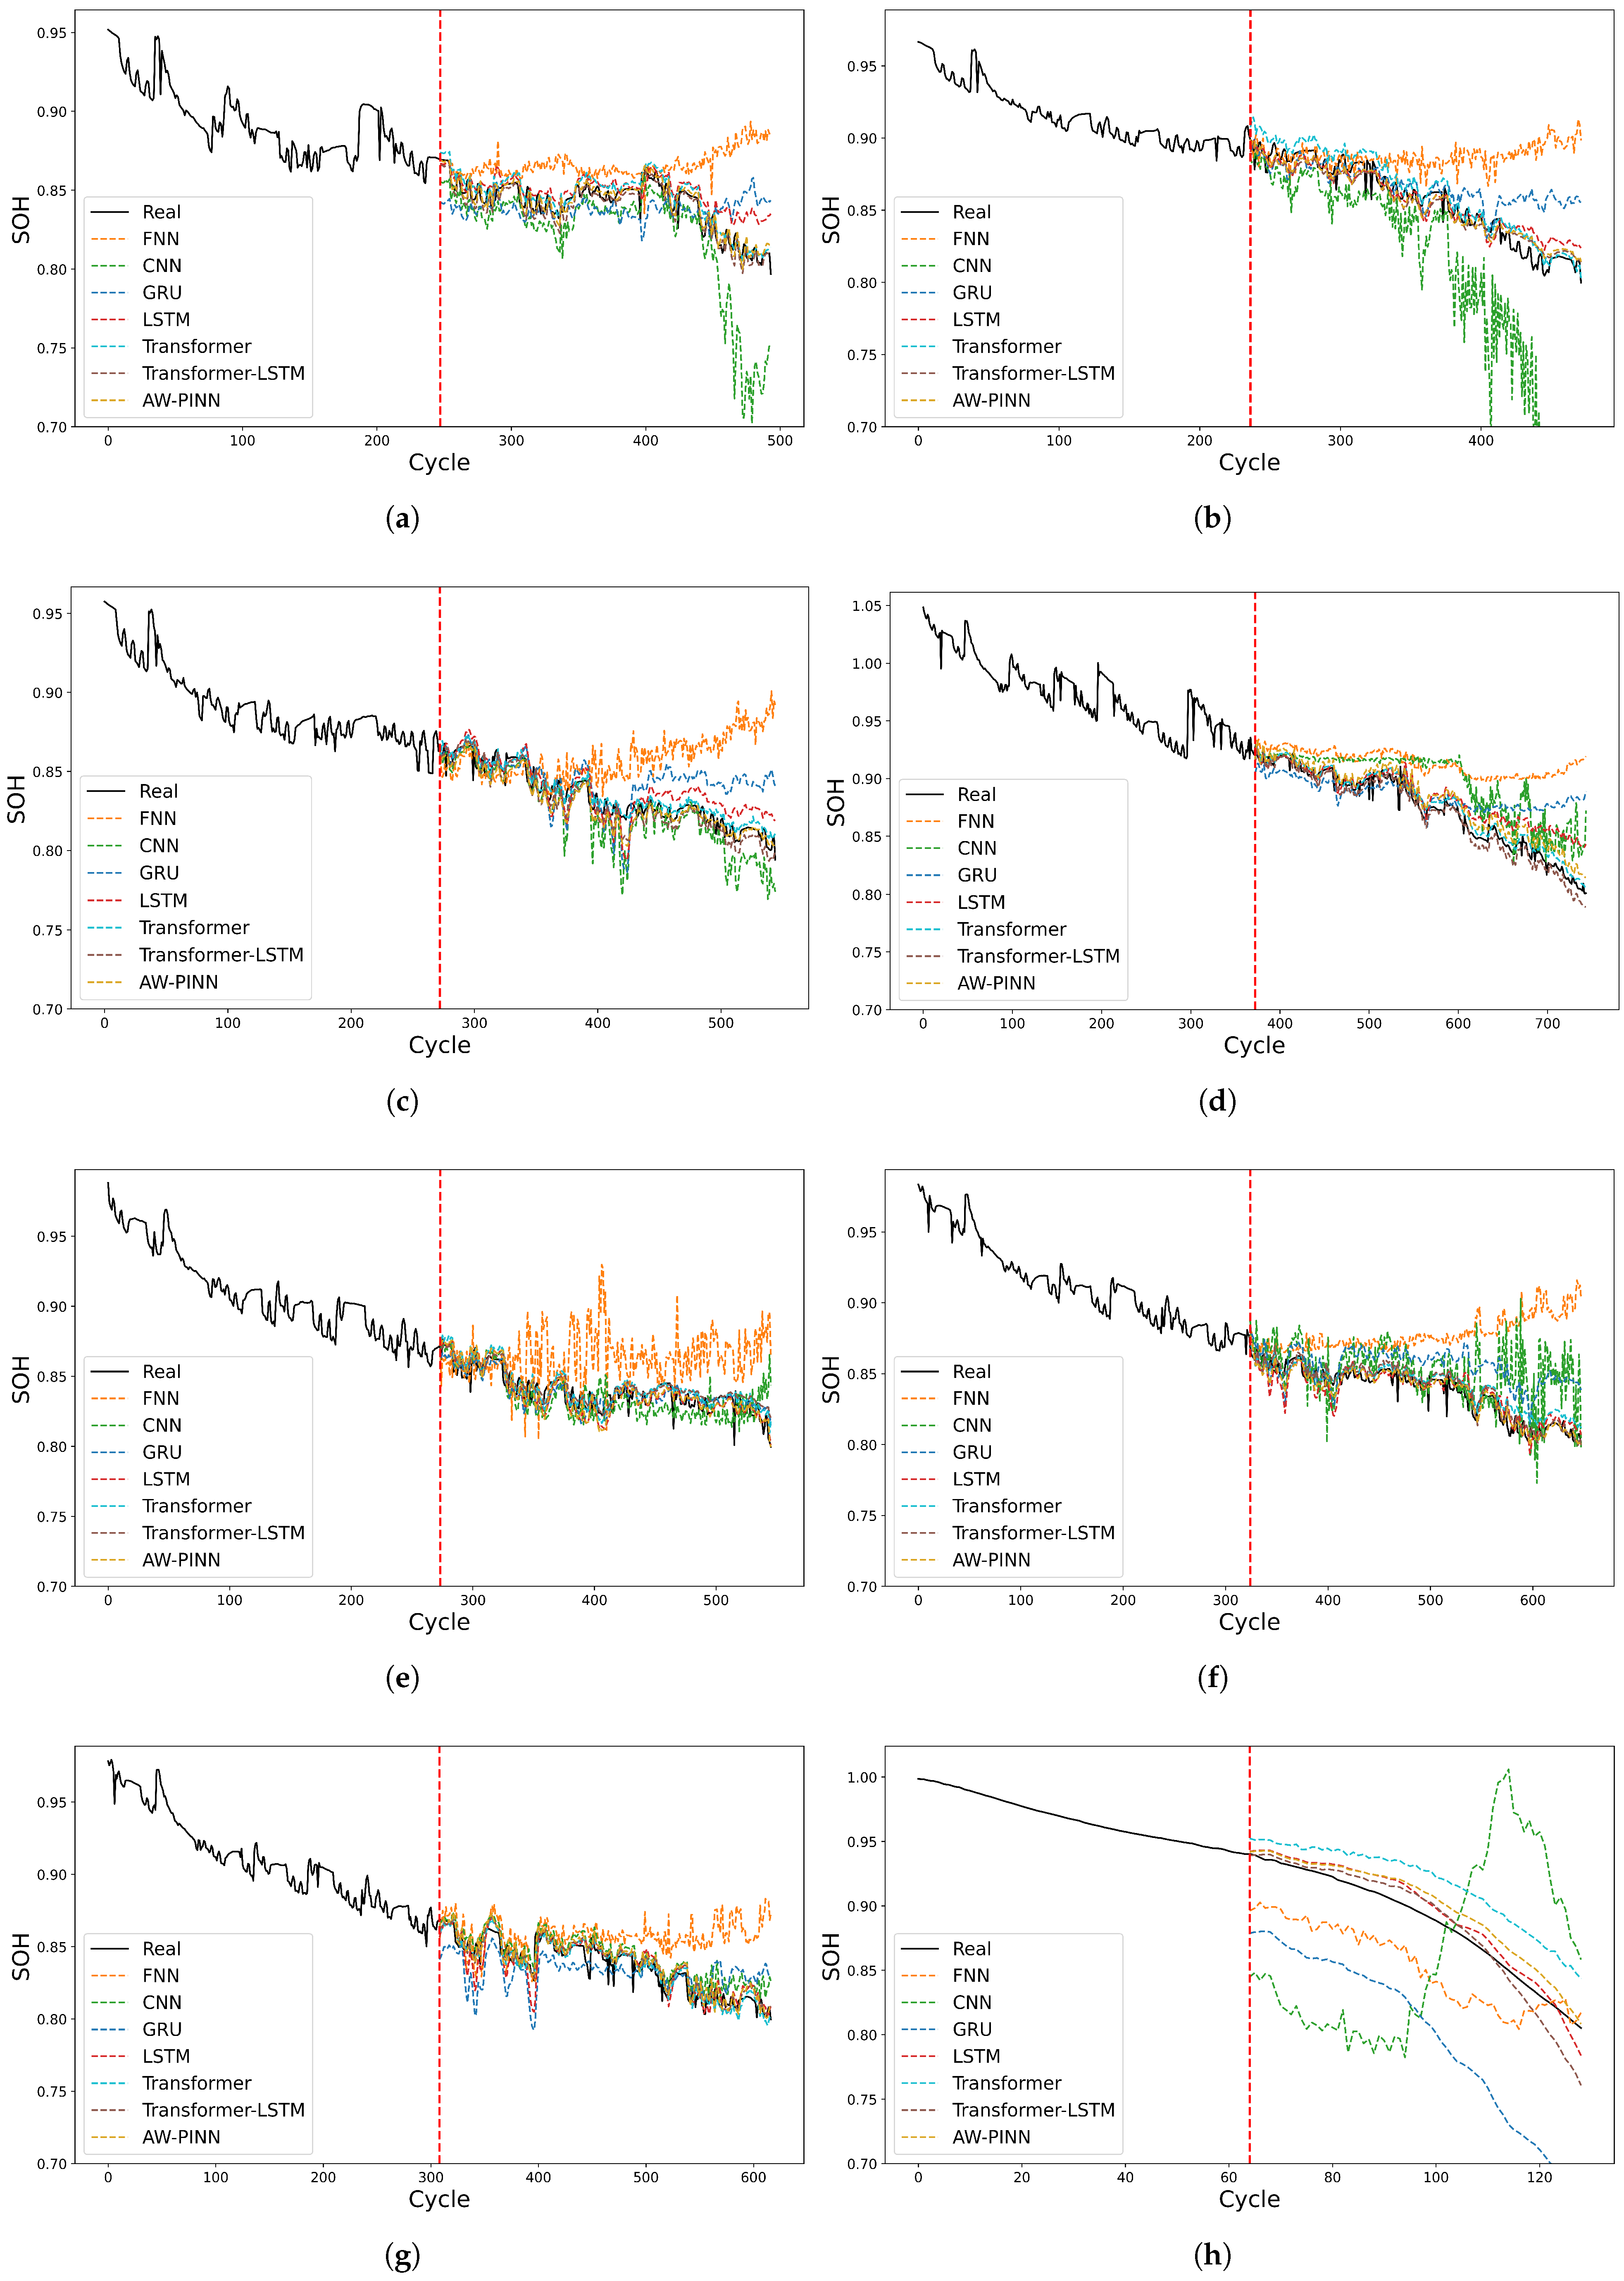
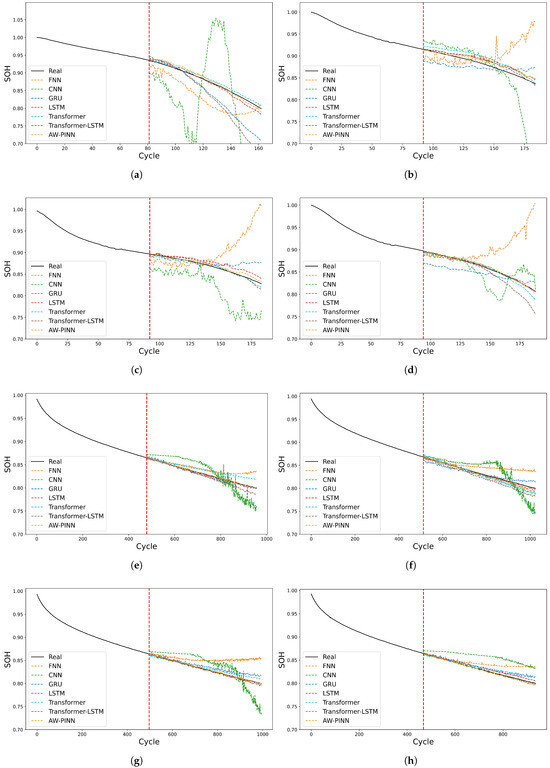
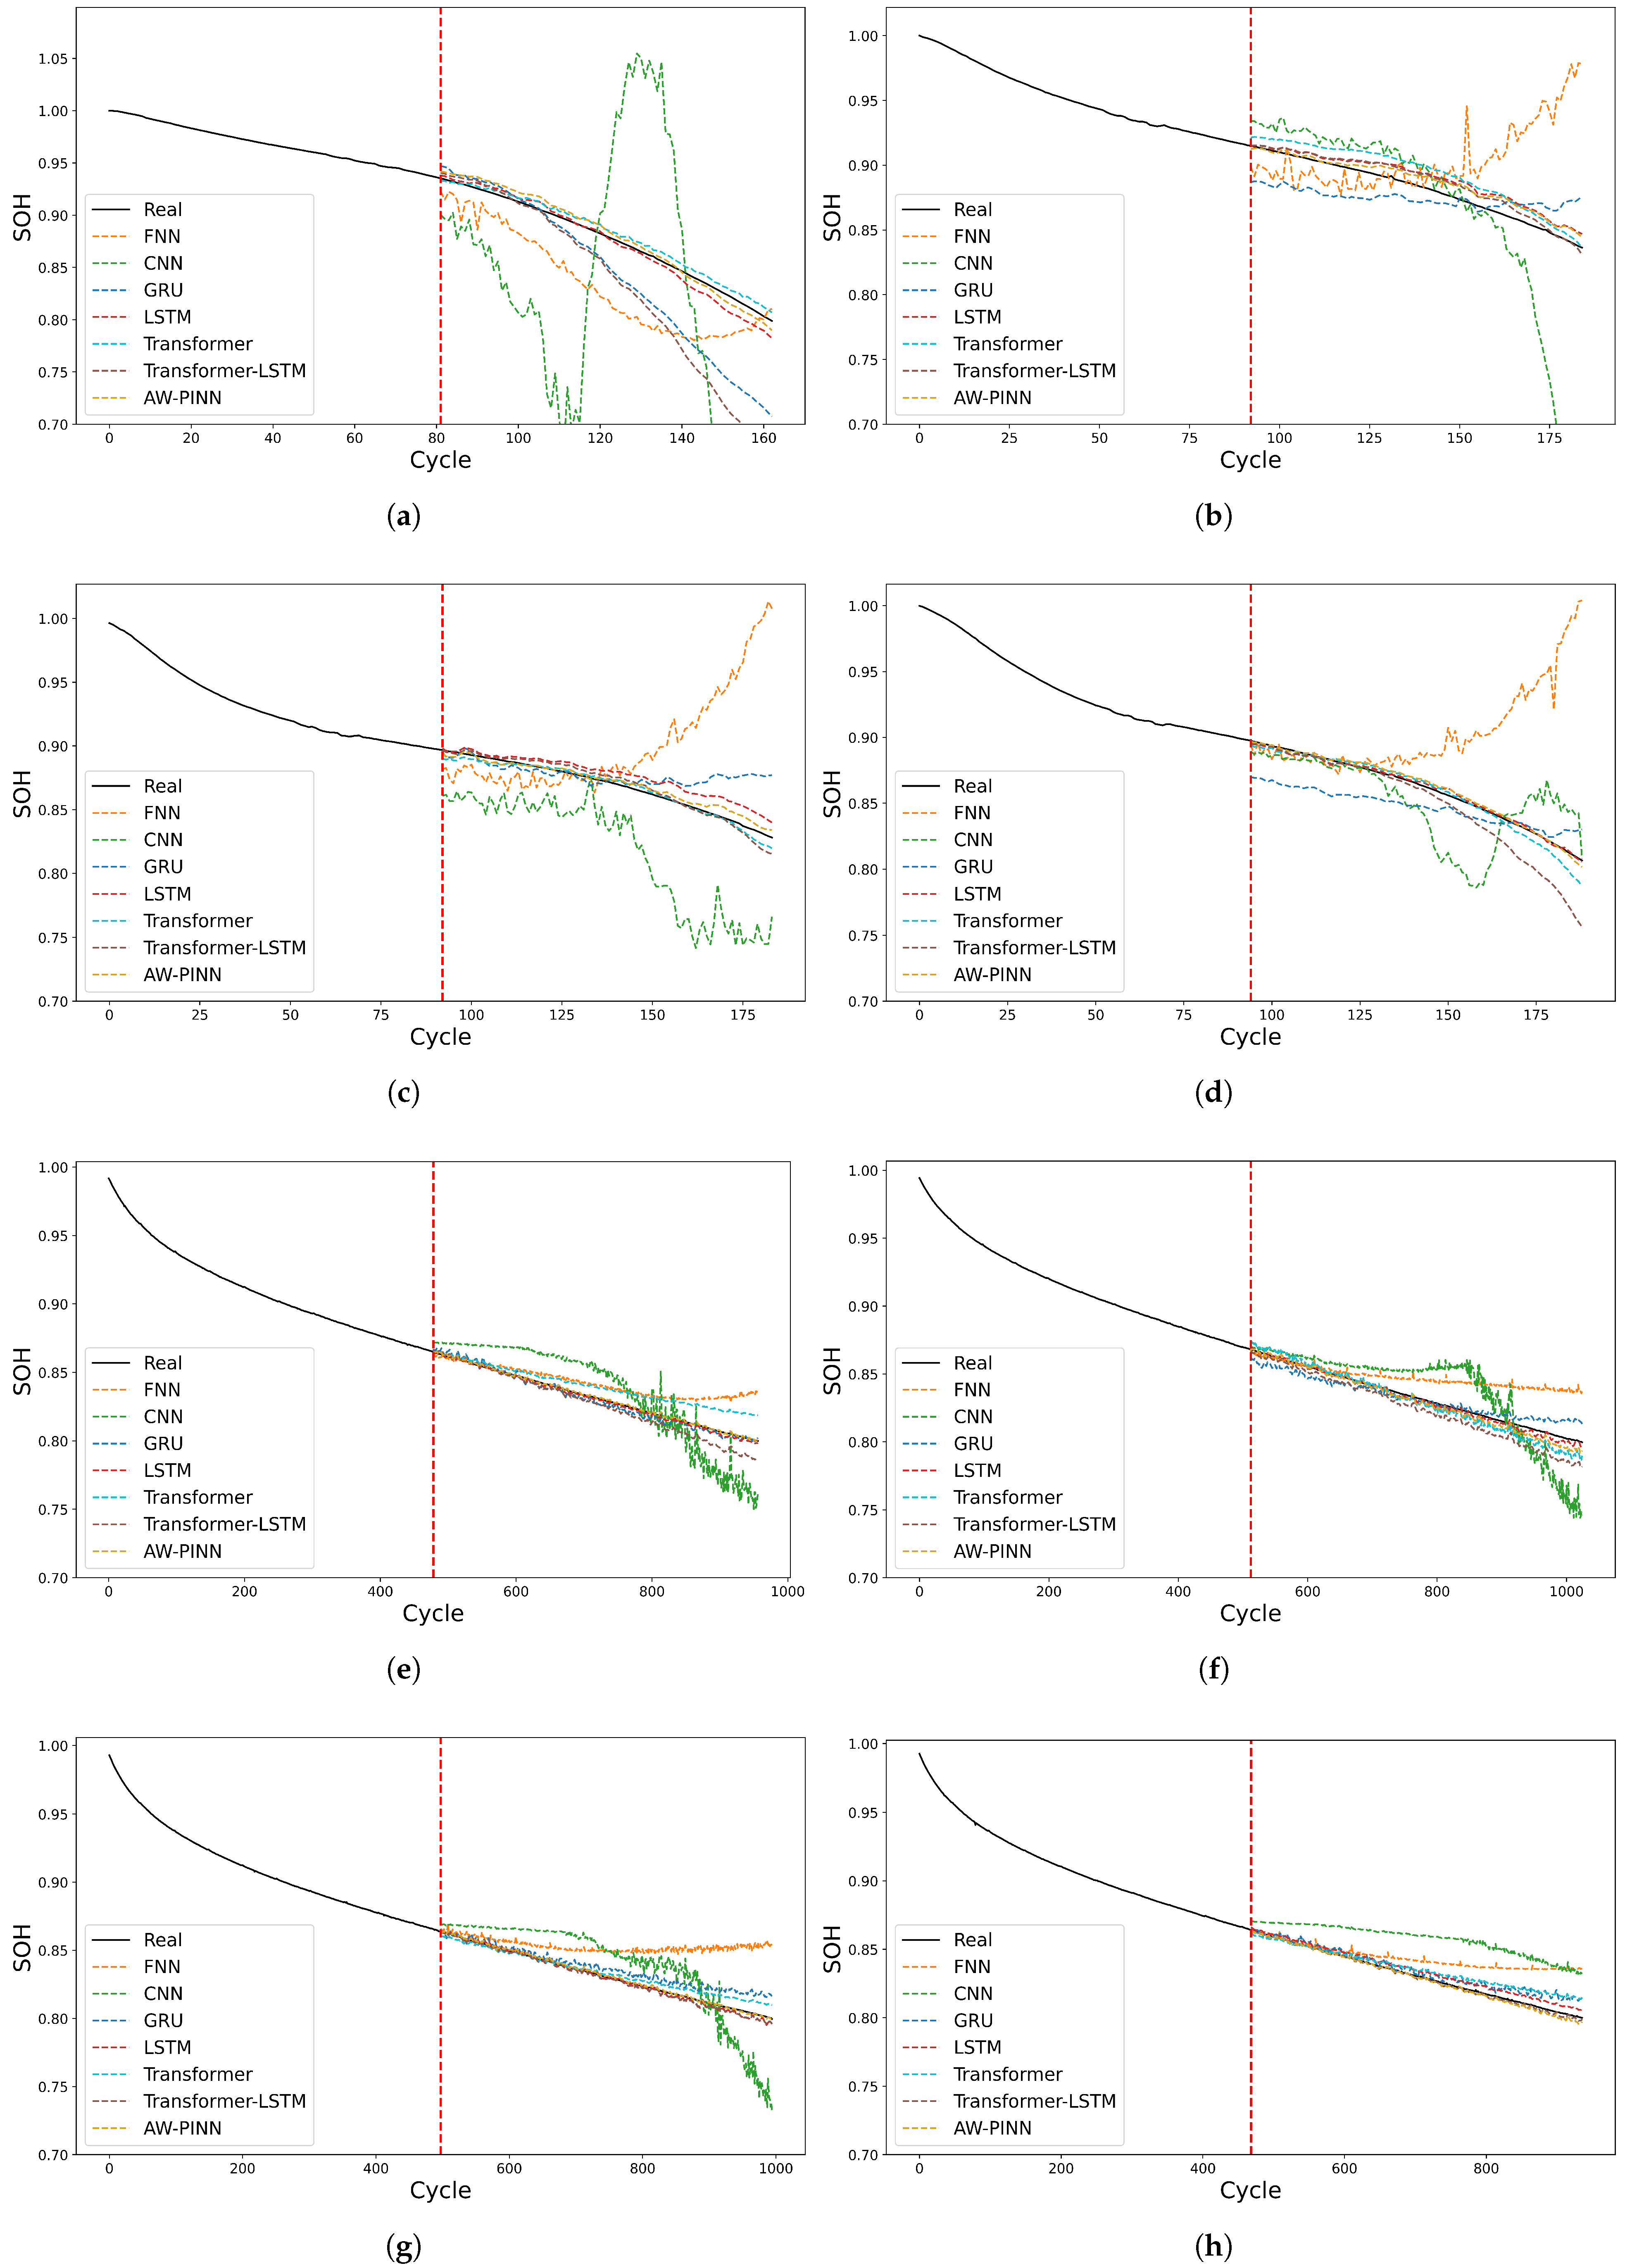
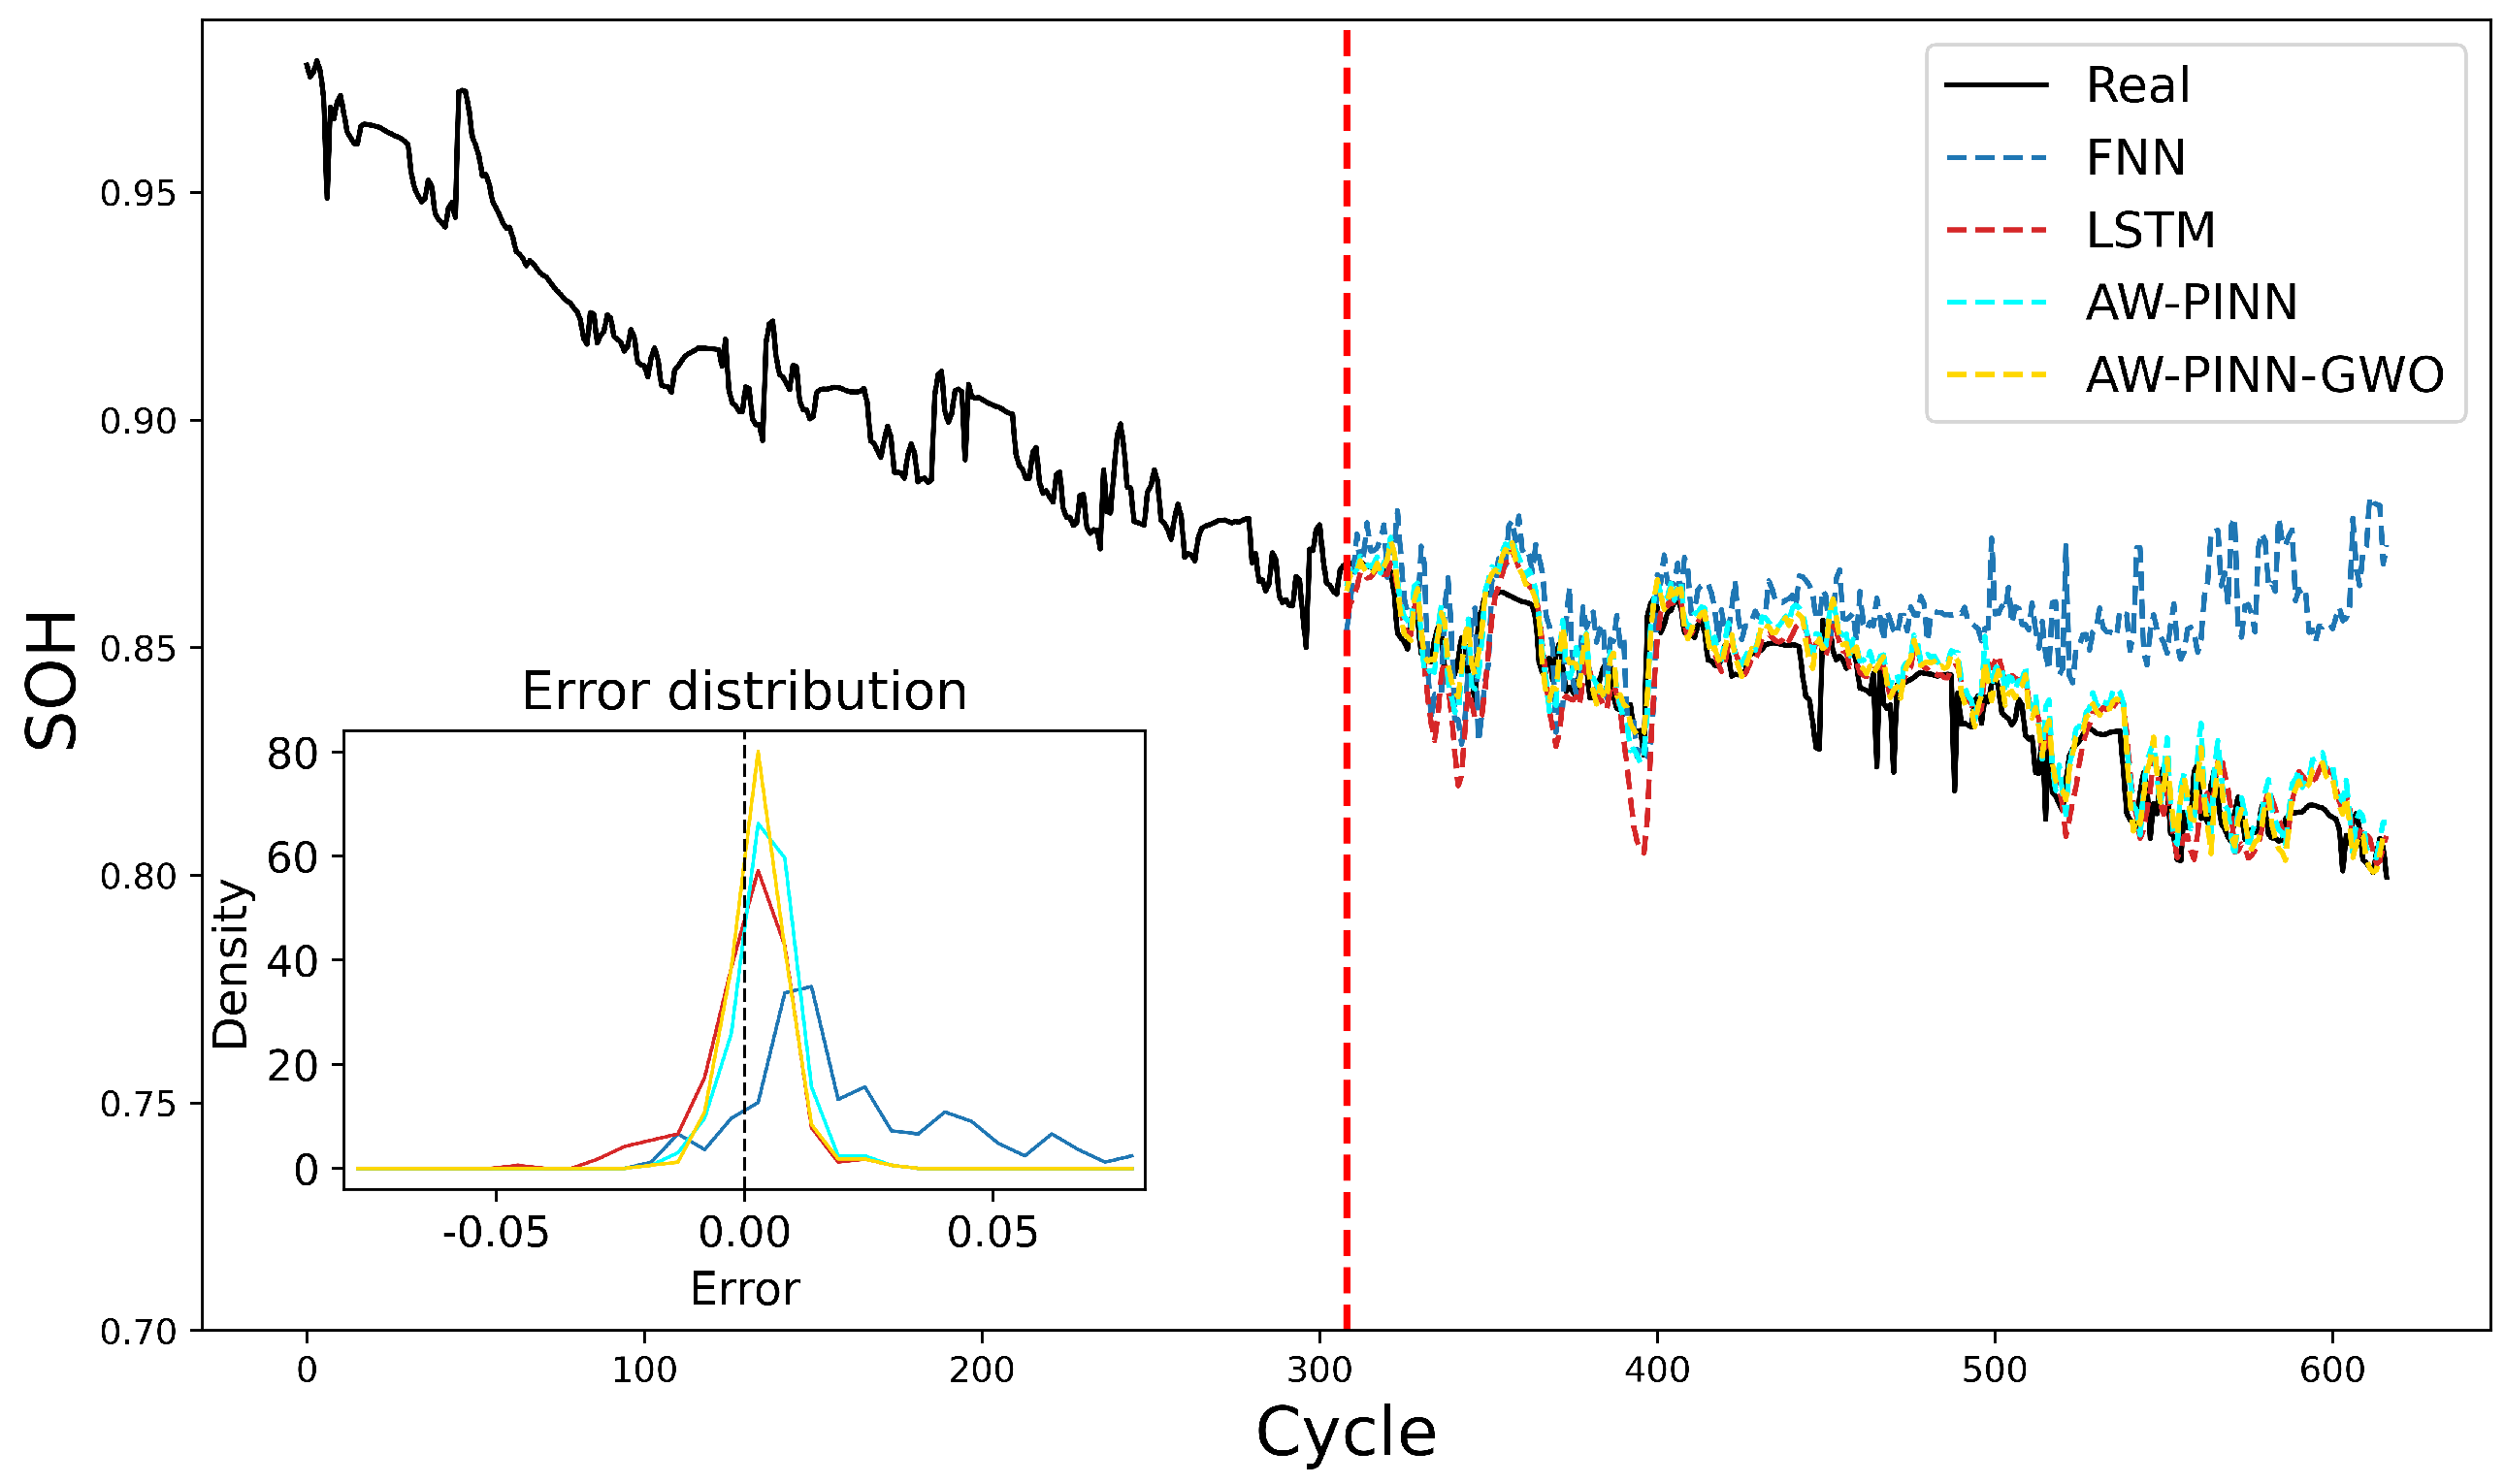
In the experiment, each battery dataset was partitioned into a training set and a test set with a 1:1 split ratio, where the first 50% of the data was used for model training, and the trained model was employed to predict the latter 50% of the data. Correspondingly, the red dashed lines in Figure 8, Figure 9 and Figure 10 serve as the boundary to separate the training data and test data in each sub-graph. All experiments were performed on a portable laptop equipped with an Intel 9-core CPU and an NVIDIA RTX 5070 Ti GPU, with the software environment configured as Python 3.9 and PyTorch 2.8.0 (CUDA 12.8). The GWO algorithm ran for approximately 90 min to optimize the global physical loss weight. To compare the advantages and disadvantages of these models, three metrics including Root Mean Squared Error (RMSE), Mean Squared Error (MSE), and Mean Absolute Percentage Error (MAPE) are adopted for quantitative comparison, and their calculation formulas are as follows:
where represents the true SOH value of a sample, with as its predicted value [49]. The results are presented in Figure 8 and Figure 9 and Table 4 and Table 5.
Figure 8.
The comparison of prediction curves of different models, where panels (a–h) correspond to CS_35, CS_36, CS_37, CX_34, CX_36, CX_37, CX_38, and NCA1, respectively.
Figure 9.
The comparison of prediction curves of different models, where panels (a–h) correspond to NCA2-5 and NCM1-4, respectively.
Figure 10.
Representative case of SOH prediction curves and error distribution on CX_38 battery.
Table 4.
Model performance comparison on batteries (CS_35∼CX_38).
Table 5.
Model performance comparison on batteries (NCA1∼NCM4).
As can be seen from the results, AW-PINN achieves the minimum values under most batteries and metrics and outperforms the comparison models comprehensively in terms of RMSE, MAE, and MAPE. AW-PINN not only has higher prediction accuracy but also exhibits stronger stability and reliability under different batteries and working conditions. FNN lacks temporal modeling ability and generally has high errors in SOH estimation. Although CNN is good at spatial feature extraction, it is prone to overfitting on time-series degradation data, resulting in large prediction errors and poor stability. As classic time-series networks, GRU and LSTM perform significantly better than FNN and CNN in SOH estimation. However, they are still pure data-driven models that can only learn statistical correlations in data and can hardly utilize the degradation mechanism of batteries. In contrast, AW-PINN achieves further significant reductions in RMSE, MAE, and MAPE on all datasets. For instance, on battery CS_36, the RMSE of LSTM is 0.0126, while that of AW-PINN is only 0.0079, representing an accuracy improvement of more than 37%. AW-PINN also consistently outperforms LSTM on NCA and NCM series batteries. This indicates that integrating physical information can further improve accuracy on the basis of strong time-series models, rather than simply replacing data-driven learning. The Transformer captures global dependencies through the self-attention mechanism, and the Transformer-LSTM further combines global attention and local time-series modeling capabilities, with overall performance slightly better than traditional recurrent networks. Nevertheless, they still rely excessively on data distribution and tend to suffer from insufficient generalization in noisy and cross-battery scenarios. AW-PINN still achieves lower errors on most batteries, showing that models incorporating physical constraints can surpass deep learning models that rely only on structural optimization in terms of prediction accuracy and reliability.
On CS and CX series batteries, AW-PINN maintains extremely low and stable errors, with all indicators significantly superior to other models. On NCA and NCM series batteries, which feature different material systems and degradation characteristics, AW-PINN remains comprehensively optimal without obvious failure or fluctuation. To verify the robustness of the proposed AW-PINN, 95% confidence intervals (CIs) were calculated for the RMSE, MAE, and MAPE metrics across all tested batteries. The AW-PINN exhibits the narrow 95% CIs: for the CS_35 CX_38 battery group, the 95% CIs of RMSE, MAE, and MAPE are [0.0070, 0.0092], [0.0053, 0.0073], and [0.0065, 0.0087], respectively; for the NCA1 NCM4 battery group, the corresponding 95% CIs are [0.0040, 0.0108], [0.0036, 0.0098], and [0.0041, 0.0113]. Such confidence intervals indicate that the predictive performance of the AW-PINN is highly stable and consistent across different battery chemistry profiles and datasets, with minimal fluctuations in estimation accuracy, thus confirming its strong robustness. This demonstrates that AW-PINN has strong cross-battery generalization ability, independent of specific datasets and battery types, with stronger robustness and generalization, making it more suitable for practical multi-type and variable operating conditions.
The core improvement of AW-PINN over all comparison models comes from the fusion of physical information and neural networks. Traditional deep learning only fits data, and the prediction results may exhibit anomalies such as SOH rebound and jump that violate the electrochemical degradation laws. In contrast, AW-PINN embeds physical prior knowledge such as battery monotonic degradation into the prediction process, enabling predictions to satisfy both data accuracy and physical rationality. In real battery data, physical constraints act as a strong regularization that not only reduces errors but also improves the reliability and interpretability of predictions. Consequently, the low-error and narrow confidence interval prediction results of the AW-PINN on different batteries are highly consistent with the aging behaviors of lithium-ion batteries with different chemistry profiles, as the model better adapts to the dynamic degradation laws of battery aging and thus achieves deep coupling between the prediction results and the actual aging characteristics of the battery.
4.2. Ablation Study
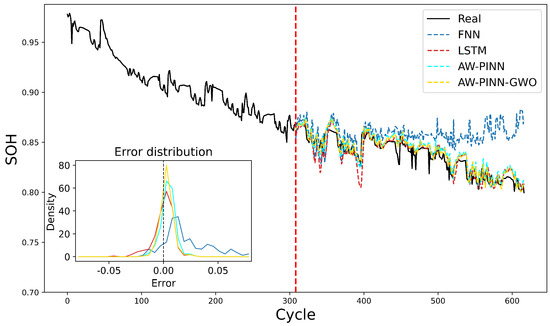
To verify the effectiveness of the key modules in the proposed model, including the LSTM structure, physical information fusion, and GWO-based weight optimization, we conduct experiments and quantitative comparisons on all batteries using four models: FNN, LSTM, AW-PINN without GWO, and AW-PINN-GWO. The average improvements among the three evaluation metrics are calculated. Among them, AW-PINN without GWO adopts the unoptimized default global physical loss weight (1), while AW-PINN-GWO employs the optimized weight value of 0.12. The experimental results are presented in Table 6, and the SOH prediction curves along with the error distribution for the CX_38 battery, as a representative case, are illustrated in Figure 10.
Table 6.
Performance comparison and improvement percentage of different models.
From the figure, it can be seen that FNN lacks effective modeling capability for time-series data, and its prediction curve deviates significantly from the real value. The prediction results of the LSTM model are closer to the real value compared to FNN, but there is still a certain prediction gap. The prediction curve of AW-PINN is much closer to the real curve, achieving a 33.8% average performance improvement compared to LSTM, and its error distribution is more concentrated around 0. This demonstrates that the physical information fusion module effectively reduces prediction deviation by embedding the physical mechanism of monotonic battery degradation. The prediction curve of AW-PINN-GWO has the highest overlap with the real curve, and its error distribution is the narrowest among all models, further improving the average performance by 4.1 percentage points compared to AW-PINN. This indicates that the GWO-based weight optimization strategy further balances the intensity of physical constraints and data fitting accuracy, enhances the prediction stability of the model, eliminates the subjectivity of manual parameter adjustment, and enables the model to adapt to the degradation characteristics of different types of batteries.
4.3. Small-Sample Verification
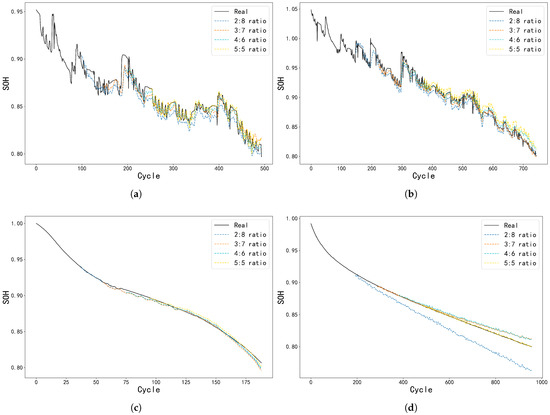
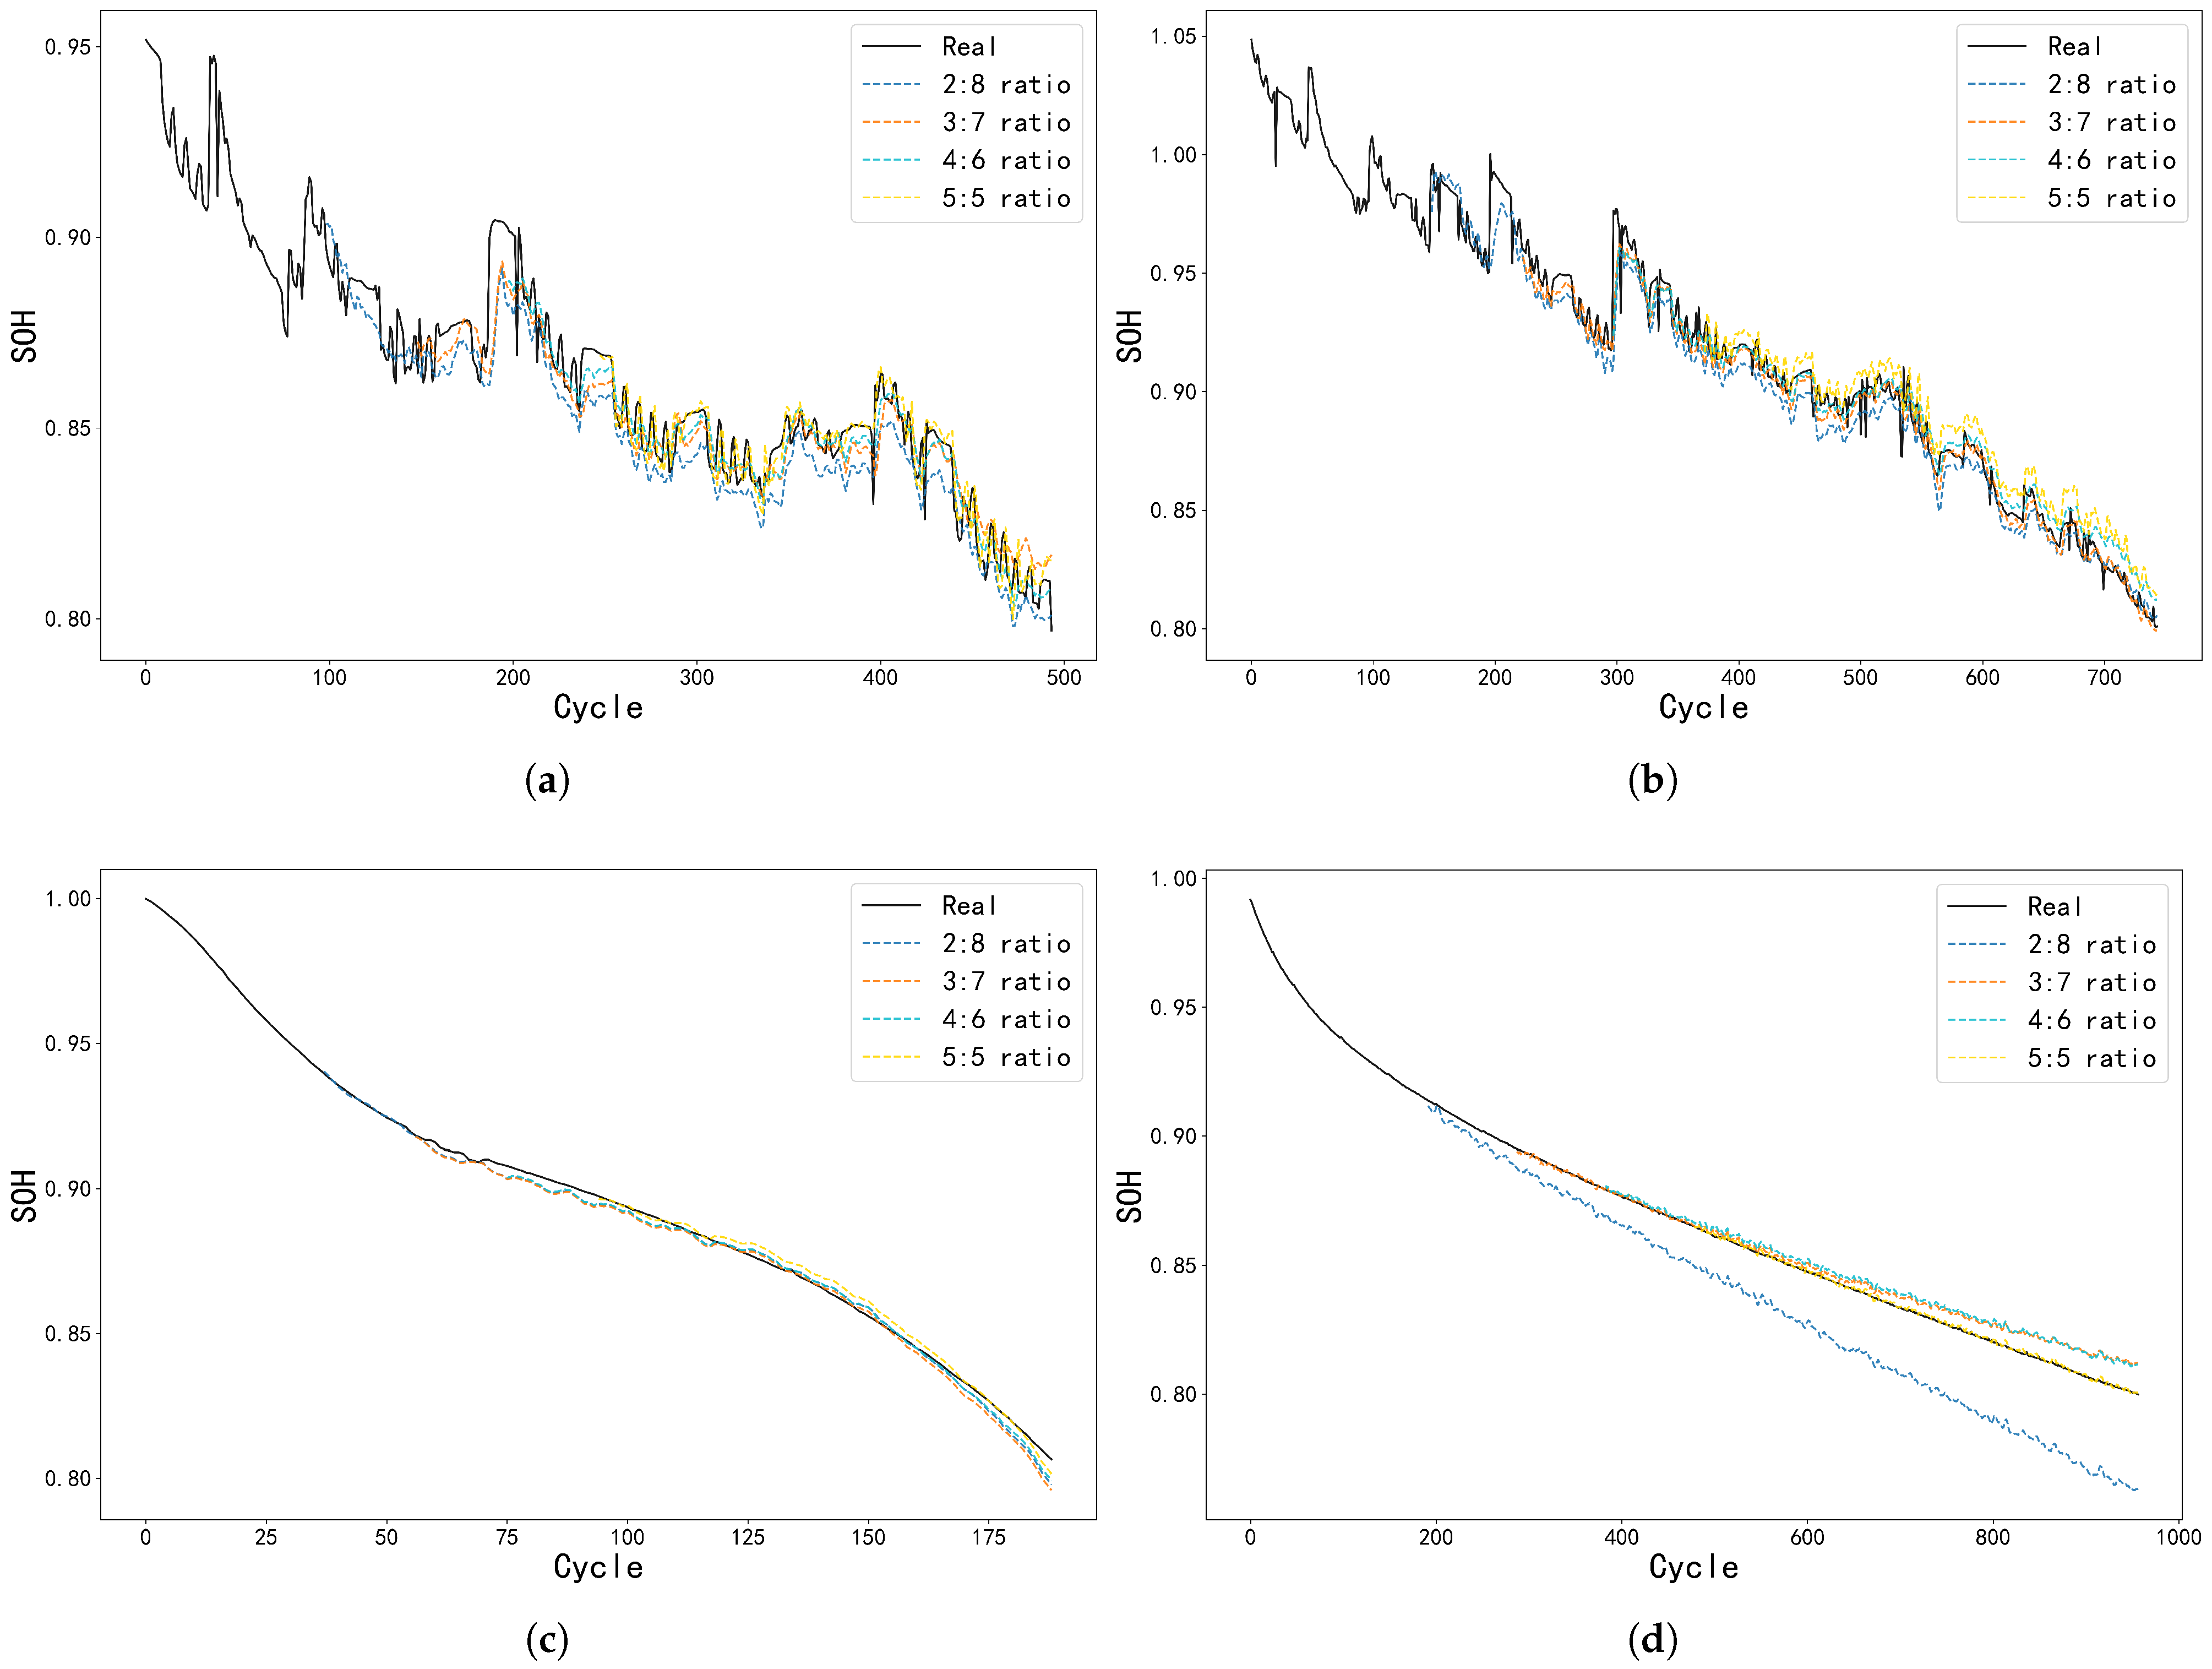
To further explore the model performance, we gradually reduced the training–test split ratio of each battery from 5:5 to 2:8. By decreasing the proportion of the training set, we simulated the prediction challenges in small-sample scenarios and compared the performance of the FNN, LSTM, LSTM-Transformer, and AW-PINN models under different data split ratios. The results are presented in Table 7, and the prediction curves of AW-PINN are specifically shown in Figure 11.
Table 7.
Performance of different models under different training–test split ratios.
Figure 11.
Prediction curves under different training–test split ratios, with the CS_35, CX_34, NCA5, and NCM1 batteries as representative cases shown in panels (a–d).
As can be seen from Table 7, AW-PINN outperforms FNN, LSTM, and LSTM-Transformer across all training–test split ratios, achieving the lowest RMSE, MAE, and MAPE values consistently. The AW-PINN model achieves the highest accuracy under the 5:5 split ratio. As the ratio of the training set is gradually reduced to 4:6 and then 3:7, the prediction curves show a slight deviation in the late stage of battery degradation, yet the deviation remains controllable. In the 2:8 small-sample scenario, the model’s prediction curves do not exhibit a significant deviation. Although its prediction error is the highest among all split ratios, it is still lower than that of many traditional data-driven models under the same scenario. This advantage is attributed to the monotonic degradation mechanism of batteries embedded in the physical information fusion module, which provides critical prior knowledge support for small-sample scenarios and effectively compensates for the deficiency of insufficient training data. The AW-PINN model maintains a high prediction accuracy throughout the process of reducing the training set proportion from 50% to 20%, which fully verifies its strong robustness and generalization ability in small-sample scenarios.
5. Conclusions
The AW-PINN model proposed in this study innovatively designs a dual-LSTM PINN network. It selects the IC peak value and charged capacity, which have a significant monotonic correlation with SOH, as the dual physical constraint features, breaking through the limitations of single-feature physical constraints and comprehensively capturing the dynamically coupled degradation characteristics of battery active material loss and lithium-ion depletion. The weight generator LSTM branch dynamically learns adaptive weights for the monotonicity losses of the two physical features without manual intervention, which solves the problem of constraint imbalance caused by fixed-weight fusion in traditional models. On this basis, the GWO algorithm is introduced to globally optimize the physical loss weight, which effectively balances the relationship between data fitting accuracy and the physical consistency of the predicted results, further improving the generalization ability and stability of the model. The validity and superiority of the model are verified on a variety of batteries from the CALCE and TJU datasets. The model realizes the organic integration of the physical mechanism of battery degradation and data-driven deep learning. It not only retains the strong fitting ability of deep learning for time-series data but also endows the model with clear physical interpretability through physical constraints. In conclusion, the model features high prediction accuracy, strong robustness, and excellent generalization ability.
However, like other PINN models, the proposed AW-PINN still has certain inherent constraints associated with the framework. It exhibits relatively high sensitivity to the quality of battery charging data, and extreme cases may lead to slight deviations of the model’s predictions from electrochemical laws. Meanwhile, when environmental conditions change, the influence degree of physical laws may undergo subtle adjustments, posing certain challenges to the model’s cross-scenario generalization performance under complex practical operating conditions. In future research, we will further expand the research scope to incorporate battery data under dynamic load and extreme temperature conditions and optimize the model structure to enhance its adaptability to complex real-world operating conditions. Meanwhile, we will explore the integration of more battery degradation mechanism features and multi-scale physical constraints to further improve the interpretability and predictive performance of the model.
Author Contributions
Conceptualization, methodology, software, validation, formal analysis, investigation, data curation, writing—original draft preparation, visualization, writing—review and editing: R.W.; supervision, resources, funding acquisition, project administration: H.R. (corresponding author, supervisor); validation, formal analysis, investigation: J.S.; investigation, data curation, visualization: S.L. All authors have read and agreed to the published version of this manuscript.
Funding
This paper is supported by the Shandong Provincial Key Research and Development Program (No. ZFJH202301) and the National Natural Science Foundation of China (No. 62133007).
Data Availability Statement
The original data presented in this study are openly available in CALCE Battery Research Center, accessed on 10 December 2025, at https://calce.umd.edu/battery-data and in Zenodo, accessed on 10 December 2025, at https://doi.org/10.5281/zenodo.6405084.
Conflicts of Interest
The authors declare no competing interests.
References
- Zhao, G.; Zhang, C.; Duan, B.; Shang, Y.; Kang, Y.; Zhu, R. State-of-Health Estimation with Anomalous Aging Indicator Detection of Lithium-Ion Batteries Using Regression Generative Adversarial Network. IEEE Trans. Ind. Electron. 2022, 70, 2685–2695. [Google Scholar] [CrossRef] [Scilit]
- Zhang, M.; Yang, D.; Du, J.; Sun, H.; Li, L.; Wang, L.; Wang, K. A Review of SOH Prediction of Li-Ion Batteries Based on Data-Driven Algorithms. Energies 2023, 16, 3167. [Google Scholar] [CrossRef] [Scilit]
- Triawan, M.A.; Yolanda, D.; Humam, F. Estimating SoC and SoH of Li-ion Battery Using Coulomb Counting Method in IoT Node Application. In Proceedings of the 2024 2nd International Symposium on Information Technology and Digital Innovation (ISITDI), Bukittinggi, West Sumatra, Indonesia, 24–25 July 2024; IEEE: Piscataway, NJ, USA, 2024; pp. 96–101. [Google Scholar] [CrossRef] [Scilit]
- Iurilli, P.; Brivio, C.; Carrillo, R.E.; Wood, V. Physics-Based SoH Estimation for Li-Ion Cells. Batteries 2022, 8, 204. [Google Scholar] [CrossRef] [Scilit]
- Rodriguez-Cea, A.I.; Morinigo-Sotelo, D.; Tinaut, F.V. A Procedure for Evaluating the SOH of Li-Ion Batteries from Data During the Constant Voltage Charge Phase and the Use of an ECM with Internal Resistance. J. Energy Storage 2025, 108, 115074. [Google Scholar] [CrossRef] [Scilit]
- Park, J.; Jin, Y.; Kam, W.; Han, S. A Practical Semi-Empirical Model for Predicting the SoH of Lithium-Ion Battery: A Novel Perspective on Short-Term Rest. J. Energy Storage 2024, 96, 112659. [Google Scholar] [CrossRef] [Scilit]
- Wu, C.; Fu, J.; Huang, X.; Xu, X.; Meng, J. Lithium-Ion Battery Health State Prediction Based on VMD and DBO-SVR. Energies 2023, 16, 3993. [Google Scholar] [CrossRef] [Scilit]
- He, Y.; Bai, W.; Wang, L.; Wu, H.; Ding, M. SOH estimation for lithium-ion batteries: An improved GPR optimization method based on the developed feature extraction. J. Energy Storage 2024, 83, 110678. [Google Scholar] [CrossRef] [Scilit]
- Park, S.; Kim, Y.; Yoo, R.; Choi, Y.; Kim, D. Transformer-Based Framework for Configuration-Agnostic Li-Ion Battery SoH Estimation by Exploring Novel Health Indicators. Chem. Eng. J. 2025, 172197. [Google Scholar] [CrossRef] [Scilit]
- Cheng, K.; Zhang, C.; Shao, K.; Tong, J.; Wang, A.; Zhou, Y.; Zhang, Z.; Zhang, Y. A SOH Estimation Method for Lithium-Ion Batteries Based on CPA and CNN-KAN. Batteries 2025, 11, 238. [Google Scholar] [CrossRef] [Scilit]
- Zhang, L.; Ji, T.; Yu, S.; Liu, G. Accurate Prediction Approach of SOH for Lithium-Ion Batteries Based on LSTM Method. Batteries 2023, 9, 177. [Google Scholar] [CrossRef] [Scilit]
- Li, S.; Jiang, Z.; Zhu, Z.; Jiang, W.; Ma, Y.; Sang, X.; Yang, S. A Framework of Joint SOC and SOH Estimation for Lithium-Ion Batteries: Using BiLSTM as a Battery Model. J. Power Sources 2025, 635, 236342. [Google Scholar] [CrossRef] [Scilit]
- Pei, Y.; Huo, H.; Guo, Y.; Kang, S.; Xu, J. IVCLNet: A Hybrid Deep Learning Framework Integrating Signal Decomposition and Attention-Enhanced CNN-LSTM for Lithium-Ion Battery SOH Prediction and RUL Estimation. Energies 2025, 18, 5677. [Google Scholar] [CrossRef] [Scilit]
- Wang, R.; Zhao, G.; Duan, B. Multi-Feature Fusion Li-Ion Battery State of Health Estimation Method Based on Transformer-LSTM Model. In Proceedings of the 2025 44th Chinese Control Conference (CCC), Hangzhou, China, 28–30 July 2025; IEEE: Piscataway, NJ, USA, 2025; pp. 6705–6710. [Google Scholar] [CrossRef] [Scilit]
- Kohtz, S.; Xu, Y.; Zheng, Z.; Wang, P. Physics-Informed Machine Learning Model for Battery State of Health Prognostics Using Partial Charging Segments. Mech. Syst. Signal Process. 2022, 172, 109002. [Google Scholar] [CrossRef] [Scilit]
- Zhu, R.; Hu, J.; Peng, W. Bayesian Calibrated Physics-Informed Neural Networks for Second-Life Battery SOH Estimation. Reliab. Eng. Syst. Saf. 2025, 264, 111432. [Google Scholar] [CrossRef] [Scilit]
- Ye, J.; Xie, Q.; Lin, M.; Wu, J. A Method for Estimating the State of Health of Lithium-Ion Batteries Based on Physics-Informed Neural Network. Energy 2024, 294, 130828. [Google Scholar] [CrossRef] [Scilit]
- Luo, Y.; Ju, S.; Li, P.; Zhang, H. A Method for Estimating Lithium-Ion Battery State of Health Based on Physics-Informed Hybrid Neural Network. Electrochim. Acta 2025, 525, 146110. [Google Scholar] [CrossRef] [Scilit]
- Manfo Theodore, A. Structural, Electrical, and Electrochemical Studies of the Olivine LiMPO4 (M = Fe, Co, Cr, Mn, V) as Cathode Materials for Lithium-Ion Rechargeable Batteries Based on the Intercalation Principle [version 1; peer review: 1 approved with reservations, 3 not approved]. Mater. Open Res. 2023, 2, 11. [Google Scholar] [CrossRef] [Scilit]
- Hu, Z.; Wu, Z.; Wang, X.; Song, J.; Lu, S. SOH Estimation and Prediction of Lithium-Ion Batteries Based on a Physically Constrained Hybrid Neural Network. J. Energy Storage 2026, 151, 120587. [Google Scholar] [CrossRef] [Scilit]
- Wang, F.; Zhai, Z.; Zhao, Z.; Di, Y.; Chen, X. Physics-Informed Neural Network for Lithium-Ion Battery Degradation Stable Modeling and Prognosis. Nat. Commun. 2024, 15, 4332. [Google Scholar] [CrossRef] [Scilit]
- Zhang, W.; Zhang, H.; Bi, Z. A Time Series Physics-Informed Neural Network Framework for the State of Health Estimation of Lithium-Ion Batteries. J. Energy Storage 2026, 142, 119549. [Google Scholar] [CrossRef] [Scilit]
- He, Z.; Wang, S.; Shi, J.; Liu, D.; Duan, X.; Shang, Y. Physics-Informed Neural Network Supported Wiener Process for Degradation Modeling and Reliability Prediction. Reliab. Eng. Syst. Saf. 2025, 258, 110906. [Google Scholar] [CrossRef] [Scilit]
- Mirjalili, S.; Mirjalili, S.M.; Lewis, A. Grey Wolf Optimizer. Adv. Eng. Softw. 2014, 69, 46–61. [Google Scholar] [CrossRef] [Scilit]
- Williard, N.; He, W.; Osterman, M.; Pecht, M. Comparative Analysis of Features for Determining State of Health in Lithium-Ion Batteries. Int. J. Progn. Health Manag. 2013, 4. [Google Scholar] [CrossRef] [Scilit]
- Zhu, J.; Wang, Y.; Huang, Y.; Gopaluni, R.B.; Cao, Y.; Heere, M.; Mühlbauer, M.J.; Mereacre, L.; Dai, H.; Liu, X.; et al. Data-Driven Capacity Estimation of Commercial Lithium-Ion Batteries from Voltage Relaxation. Nat. Commun. 2022, 13, 2261. [Google Scholar] [CrossRef] [Scilit]
- Qian, K.; Li, Y.; Zou, Q.; Cao, K.; Li, Z. SOH and RUL Estimation for Lithium-Ion Batteries Based on Partial Charging Curve Features. Energies 2025, 18, 3248. [Google Scholar] [CrossRef] [Scilit]
- Lu, L.; Han, X.; Li, J.; Hua, J.; Ouyang, M. A Review on the Key Issues for Lithium-Ion Battery Management in Electric Vehicles. J. Power Sources 2013, 226, 272–288. [Google Scholar] [CrossRef] [Scilit]
- Chen, B.; Liu, Y. Data Driven-Based Health Prognostics and Charge Estimation for Lithium-Ion Batteries under Varying Discharging Patterns. Energy 2025, 137918. [Google Scholar] [CrossRef] [Scilit]
- Kurzweil, P.; Scheuerpflug, W.; Frenzel, B.; Schell, C.; Schottenbauer, J. Differential Capacity as a Tool for SOC and SOH Estimation of Lithium Ion Batteries Using Charge/Discharge Curves, Cyclic Voltammetry, Impedance Spectroscopy, and Heat Events: A Tutorial. Energies 2022, 15, 4520. [Google Scholar] [CrossRef] [Scilit]
- Sepasi, S.; Roose, L.R.; Matsuura, M.M. Extended Kalman Filter with a Fuzzy Method for Accurate Battery Pack State of Charge Estimation. Energies 2015, 8, 5217–5233. [Google Scholar] [CrossRef] [Scilit]
- Armand, M.; Axmann, P.; Bresser, D.; Copley, M.; Edström, K.; Ekberg, C.; Guyomard, D.; Lestriez, B.; Novák, P.; Petranikova, M.; et al. Lithium-Ion Batteries—Current State of the Art and Anticipated Developments. J. Power Sources 2020, 479, 228708. [Google Scholar] [CrossRef] [Scilit]
- Tian, A.; He, L.; Ding, T.; Dong, K.; Wang, Y.; Jiang, J. A Generic Physics-Informed Neural Network Framework for Lithium-Ion Batteries State of Health Estimation. Energy 2025, 137215. [Google Scholar] [CrossRef] [Scilit]
- Benesty, J.; Chen, J.; Huang, Y.; Cohen, I. Pearson Correlation Coefficient. In Noise Reduction in Speech Processing; Springer: Berlin/Heidelberg, Germany, 2009; pp. 1–4. [Google Scholar]
- Wei, X.; Mo, M.; Peng, S. Lithium-Ion Battery Health State Prediction Based on Improved War Optimization Assisted-Long and Short-Term Memory Network. Energies 2025, 18, 2326. [Google Scholar] [CrossRef] [Scilit]
- Cho, S.; Han, D.; Kim, J.; Kim, J. State of Health Estimation Embedded with Hardware Accelerator Based on Long Short-Term Memory Combined with Bayesian Optimization Considering Extracted Health Indicator in Charging Conditions. J. Energy Storage 2024, 90, 111897. [Google Scholar] [CrossRef] [Scilit]
- Tan, Y.; Zhao, G. Transfer Learning with Long Short-Term Memory Network for State-of-Health Prediction of Lithium-Ion Batteries. IEEE Trans. Ind. Electron. 2019, 67, 8723–8731. [Google Scholar] [CrossRef] [Scilit]
- Li, W.; Lin, C.; Hosseininasab, S.; Bauer, L.; Pischinger, S. Lithium-Ion Battery SOH Estimation Based on a Long Short-Term Memory Model Using Short History Data. IEEE Trans. Power Electron. 2025, 40, 7370–7384. [Google Scholar] [CrossRef] [Scilit]
- Hochreiter, S.; Schmidhuber, J. Long Short-Term Memory. Neural Comput. 1997, 9, 1735–1780. [Google Scholar] [CrossRef] [Scilit]
- Hou, Z.; Xu, W.; Jia, G.; Wang, J.; Cai, M. Estimation of SOH of Lithium-Ion Batteries Based on PSO-Bi GRU-Attention Network. J. Electrochem. Soc. 2024, 171, 020550. [Google Scholar] [CrossRef] [Scilit]
- Marini, F.; Walczak, B. Particle Swarm Optimization (PSO). A Tutorial. Chemom. Intell. Lab. Syst. 2015, 149, 153–165. [Google Scholar] [CrossRef] [Scilit]
- Zheng, R.; Yang, B.; Qian, Y.; Li, H.; Gao, D.; Jiang, L. Joint SOH and RUL Estimation for Lithium-Ion Batteries via Optimal Deep Belief Network with Bayesian Algorithm. J. Energy Storage 2025, 114, 115891. [Google Scholar] [CrossRef] [Scilit]
- Zhang, X.; Hou, J.; Wang, Z.; Jiang, Y. Joint SOH-SOC Estimation Model for Lithium-Ion Batteries Based on GWO-BP Neural Network. Energies 2022, 16, 132. [Google Scholar] [CrossRef] [Scilit]
- Huang, C.; Li, N.; Zhu, J.; Shi, S. Battery Health Prediction with Singular Spectrum Analysis and Grey Wolf Optimized Long Short-Term Memory Networks. Energies 2025, 18, 2401. [Google Scholar] [CrossRef] [Scilit]
- Negi, G.; Kumar, A.; Pant, S.; Ram, M. GWO: A Review and Applications. Int. J. Syst. Assur. Eng. Manag. 2021, 12, 1–8. [Google Scholar] [CrossRef] [Scilit]
- Mawassi, H.; Hermann, G.; Abdeslam, D.O.; Idoumghar, L. Optimized FNN-Based SOH Estimation: Methodology and Performance Analysis. In International Colloquium on Methods and Tools for Decision Support; Springer: Berlin/Heidelberg, Germany, 2024; pp. 393–402. [Google Scholar] [CrossRef] [Scilit]
- Ke, L.; Lin, M.; Meng, J.; Wu, J.; Wang, W.; Wang, F. A Sparse SOH Estimation Framework Based on Clustered Voltage Segments and Multi-head CNN under Arbitrary Charging Condition. Energy 2026, 140057. [Google Scholar] [CrossRef] [Scilit]
- Avinash, R.; Manitha, P.V. Performance Analysis of Deep Neural Networks in Prediction of SoC and SoH of a Battery Using LSTM, GRU and RNN Networks. In Proceedings of the 2025 10th International Conference on Communication and Electronics Systems (ICCES), Coimbatore, India, 10–12 April 2025; IEEE: Piscataway, NJ, USA, 2025; pp. 462–468. [Google Scholar] [CrossRef] [Scilit]
- Chicco, D.; Warrens, M.J.; Jurman, G. The Coefficient of Determination R-Squared Is More Informative Than SMAPE, MAE, MAPE, MSE and RMSE in Regression Analysis Evaluation. PeerJ Comput. Sci. 2021, 7, e623. [Google Scholar] [CrossRef] [Scilit] [PubMed]

Disclaimer/Publisher’s Note: The statements, opinions and data contained in all publications are solely those of the individual author(s) and contributor(s) and not of MDPI and/or the editor(s). MDPI and/or the editor(s) disclaim responsibility for any injury to people or property resulting from any ideas, methods, instructions or products referred to in the content. |
© 2026 by the authors. Licensee MDPI, Basel, Switzerland. This article is an open access article distributed under the terms and conditions of the Creative Commons Attribution (CC BY) license.