


Abstract
Accurate state-of-charge (SOC) correction using open-circuit-voltage (OCV)–SOC tables is challenging under post-discharge small-charge conditions because the OCV characteristics of lithium-ion batteries depend on their charge–discharge history. This study proposes a regression-based method that predicts the SOC errors associated with the charging and discharging OCV–SOC tables and selects the table with the smaller predicted absolute error. Experiments at 25 °C used 21700 cells under 60 conditions varying preceding discharge C-rate, SOC, pre-charge rest time, and small-charge C-rate. Linear, reduced second-order polynomial, and SOC piecewise-linear models were compared; the piecewise-linear models were selected and integrated into a Coulomb-counting SOC correction algorithm. Independent validation comprised 15 new profiles: 13 at original factor levels and two under intermediate 0.35C discharge and 90 min pre-charge rest conditions. Predicted and measured selections agreed for all 15 profiles. For six profiles where the proposed and last-current-direction-based methods selected different tables, mean absolute SOC error decreased from 1.732% to 0.657% (62.1%); across all 15 profiles, it decreased from 1.169% to 0.739% (36.8%). Selections also agreed for all 10 dynamic discharge profiles. At 30–120 min post-charge rest, the proposed method yielded mean absolute errors of 0.648–0.662%, 45.3–45.8% below the last-current-direction baseline, demonstrating that performance was maintained with shorter rest.
1. Introduction
Lithium-ion batteries (LIBs) have been widely used in various applications, including electric vehicles (EVs), hybrid electric vehicles (HEVs), energy storage systems (ESSs), electric vessels, unmanned aerial vehicles, and portable electronic devices, owing to their high energy density and favorable charge–discharge characteristics [1,2]. Recently, with the increasing deployment of ESSs for renewable energy integration and reliable power supply to data centers, ensuring the safety and reliability of lithium-ion batteries has become increasingly important [3]. In such battery systems, a battery management system (BMS) continuously monitors cell voltage, current, and temperature and performs essential functions such as state-of-charge (SOC) estimation, state-of-health (SOH) estimation, cell balancing, and fault diagnosis [4,5].
Among the key functions of a BMS, SOC estimation is essential for determining the available energy of a battery and ensuring safe charge–discharge operation. An increase in SOC estimation error can lead to inaccurate assessment of the available battery capacity and may increase the risk of overcharge or overdischarge under certain operating conditions. Coulomb counting, one of the most widely used SOC estimation methods, calculates SOC by integrating the battery charge–discharge current over time. Owing to its simple structure and ease of real-time implementation, Coulomb counting has been widely adopted [6]. However, measurement errors in the current sensor and errors in the initial SOC can accumulate over time, resulting in degraded SOC estimation accuracy during long-term operation.
To compensate for such accumulated errors, OCV–SOC-based correction methods utilizing the relationship between the open-circuit voltage (OCV) and SOC of a battery have been widely investigated [7,8]. Model-based SOC estimation methods combining an equivalent circuit model (ECM) with Kalman filtering techniques have also been extensively studied [9,10,11]. These approaches improve SOC estimation accuracy by modeling the dynamic characteristics of a battery using an equivalent circuit and applying state estimation algorithms. However, the OCV–SOC characteristics of lithium-ion batteries exhibit hysteresis depending on the charge–discharge history, such that different OCV values may be observed at the same SOC depending on whether the battery has undergone charging or discharging [12,13]. Furthermore, hysteresis characteristics can be affected not only by SOC but also by the charge–discharge path and current conditions [13]. Therefore, when SOC is corrected using OCV, the operating history and hysteresis characteristics of the battery should be taken into account [12,13,14].
For OCV-based SOC estimation, it is necessary to obtain a sufficiently stabilized cell voltage or estimate the OCV by considering the voltage relaxation behavior after load removal [15,16]. During the operation of actual EVs and stationary battery systems, small partial charge and discharge events may occur even within the primary charge–discharge process, resulting in micro-cycles [17]. In EVs and HEVs, for example, temporary charging may occur when energy recovered through regenerative braking during deceleration is supplied to the battery [18]. Similarly, in ESS applications, the battery operating state may alternate between charging and discharging in response to variations in photovoltaic power generation and load demand [19].
In conventional OCV correction based on the direction of the most recent current, the charging OCV–SOC table is applied when the most recent current corresponds to charging, whereas the discharging OCV–SOC table is applied when it corresponds to discharging [20,21]. However, this approach may have limitations under post-discharge small-charge conditions. Although a small charge changes the most recent current direction from discharge to charge, this does not necessarily imply that the OCV characteristics of the battery immediately become closer to the charging OCV characteristics. In particular, in SOC regions where the difference between the charging and discharging OCV characteristics is significant, selecting an inappropriate OCV–SOC table may increase the SOC correction error. Therefore, under post-discharge small-charge conditions, an appropriate OCV–SOC table should be selected by considering not only the most recent current direction but also the SOC, preceding discharge conditions, small-charge conditions, and rest time.
Previous research investigated the opposite transient condition, namely, a small discharge following charging, and proposed an SOC-dependent criterion for selecting between the charging and discharging OCV–SOC tables [20]. A subsequent study addressed the limitations of most-recent-current-direction-based OCV–SOC table selection under post-discharge small-charge conditions and proposed a bilinear-interpolation-based selection method that accounts for operating conditions [21]. However, these methods were derived from a limited set of operating points and relied on either a fixed SOC criterion or interpolation among predetermined operating conditions, limiting their ability to continuously account for diverse operating conditions. Therefore, a method is required that can quantitatively predict the SOC errors associated with the charging and discharging OCV–SOC tables over an expanded operating range and select the appropriate table accordingly.
To address these limitations, this study proposes a regression-based OCV–SOC table selection method to minimize SOC correction errors under conditions in which a 2% small charge occurs after discharge. The preceding discharge C-rate, SOC, pre-charge rest time, and small-charge C-rate were selected as the primary operating variables, and the SOC errors resulting from the application of the charging and discharging OCV–SOC tables were experimentally analyzed under a total of 60 conditions over an expanded operating range. The performances of linear regression models, reduced second-order polynomial regression models without interaction terms, and SOC piecewise-linear regression models were compared, and the SOC piecewise-linear regression models were selected as the final models to separately predict the SOC errors associated with the charging and discharging OCV–SOC tables. The absolute values of the two predicted errors were compared, and the OCV–SOC table expected to yield the smaller absolute SOC error was selected. Finally, the proposed method was incorporated into a Coulomb-counting-based SOC correction algorithm, and experiments were separately conducted using 15 operating profiles that were not used for model development. The independently acquired experimental data were used to evaluate the consistency of OCV–SOC table selection under repeated-test conditions at the original factor levels and its applicability to intermediate operating conditions not included in model development. In addition, the applicability of the proposed method was evaluated using 10 dynamic discharge profiles, and the effect of the post-charge rest time was analyzed using cell voltages measured at 30, 60, 90, and 120 min. The measured SOC errors were compared with those obtained using the last-current-direction-based method [21] to quantitatively evaluate the reduction in SOC correction error achieved by the proposed method.
2. Materials and Methods
2.1. OCV–SOC Table Construction
In this study, experiments were conducted using eight Samsung SDI INR21700-50E cylindrical lithium-ion battery cells (Samsung SDI Co., Ltd., Yongin-si, Republic of Korea) Five of the eight cells were used to characterize the charging and discharging OCV–SOC relationships and construct the reference OCV–SOC tables. According to the manufacturer’s specifications, the standard discharge capacity is at least 4900 mAh under a 0.2C discharge condition, whereas the rated discharge capacity is at least 4753 mAh under a 1C discharge condition. The nominal voltage, charge upper-limit voltage, and discharge cutoff voltage are 3.6, 4.2, and 2.5 V, respectively. Based on the manufacturer’s specifications, 1C was defined as 4900 mA. All experiments were conducted at 25 °C. To investigate the OCV–SOC characteristics associated with the charge–discharge history of the battery and to establish reference OCV–SOC tables for subsequent SOC correction, charging and discharging OCV tests were separately performed.
Stepwise OCV tests were conducted in both the charging and discharging directions to characterize the OCV–SOC relationship. In a stepwise OCV test, the terminal voltage gradually relaxes over time after each charge or discharge step owing to polarization effects; therefore, a sufficient rest period is required to obtain a stabilized OCV. In a previous study, incremental OCV tests with 5% SOC intervals were conducted using a relaxation time of 2 h after each step to characterize the OCV behavior [22]. Based on this approach, a rest period of 2 h after each SOC step was also applied in this study.
To construct the charging OCV–SOC table, the cell was first fully discharged and then rested for at least 2 h to allow the cell voltage to stabilize. The cell was subsequently charged stepwise by increasing the SOC in 5% increments, with a 2 h rest period applied after each charging step. The stabilized cell voltage measured at the end of each rest period was defined as the charging OCV at the corresponding SOC. This procedure was repeated until the cell reached the fully charged state.
The discharging OCV–SOC table was constructed using the reverse procedure. The cell was first fully charged and then rested for at least 2 h, after which it was discharged stepwise by decreasing the SOC in 5% increments. A 2 h rest period was similarly applied after each discharging step. The stabilized cell voltage measured at the end of each rest period was defined as the discharging OCV at the corresponding SOC, and the procedure was repeated until the cell reached the fully discharged state.
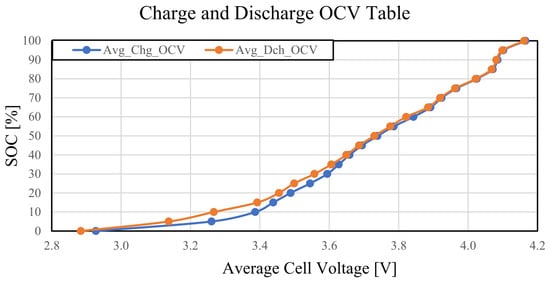
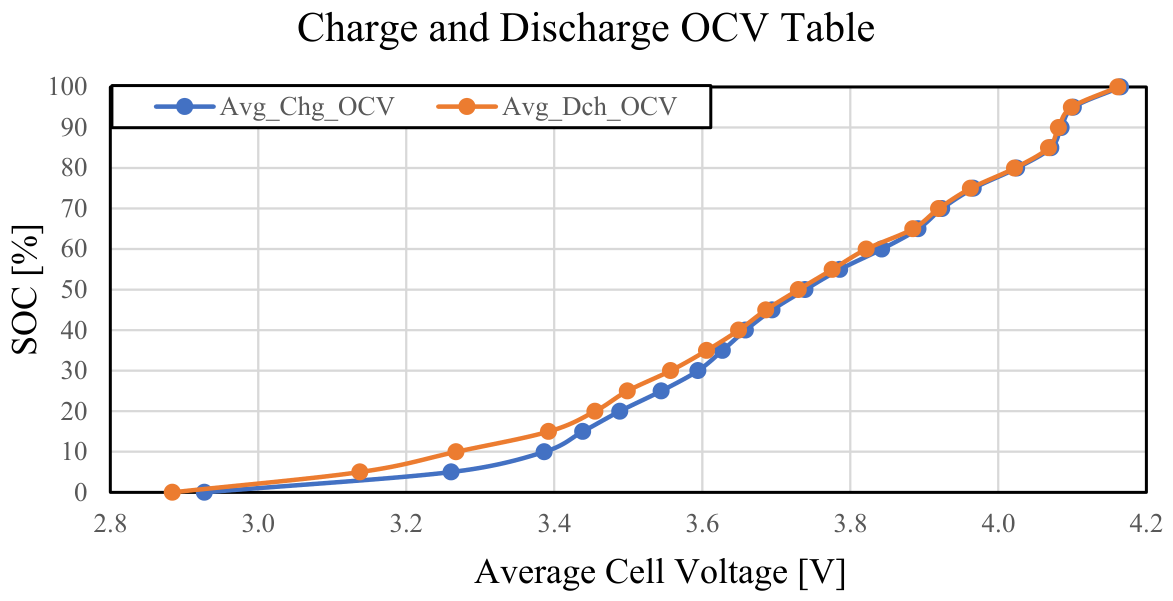
The OCV–SOC characterization consisted of one charging-direction test and one discharging-direction test for each of the five cells. At each SOC step, the stabilized voltages measured from the five cells at the end of the 2 h rest period were arithmetically averaged to define the representative charging and discharging OCV values at the corresponding SOC. Therefore, the charging and discharging OCV–SOC curves presented in Figure 1 represent the mean values obtained from five cells rather than the results of a single cell.
Figure 1.
Charging and discharging OCV–SOC curves at 25 °C.
Figure 1 shows the charging and discharging OCV–SOC curves obtained from the above tests at 25 °C. The difference between the charging and discharging OCVs became more pronounced in the low-SOC region below 40% SOC, with a maximum difference of 124 mV observed at 5% SOC. Owing to this OCV hysteresis, applying different charging or discharging OCV–SOC tables to the same cell voltage can result in different SOC estimates. In particular, in the low-SOC region where the OCV difference is relatively large, the SOC correction error associated with the selection of the OCV–SOC table may increase. Therefore, for accurate OCV-based SOC correction, it is important to select the charging or discharging OCV–SOC table that appropriately reflects the battery operating state.
2.2. Small-Charge Tests During Rest After Discharge
When a small charge occurs while a battery is at rest after discharge, the most recent current direction changes from discharge to charge owing to the charging current; however, the OCV characteristics of the battery do not necessarily shift toward the charging OCV–SOC curve. Therefore, in this study, experiments were conducted under conditions involving a 2% small charge during the rest period after discharge to investigate the effects of battery operating conditions on the SOC correction errors obtained using the charging and discharging OCV–SOC tables.
The SOC at which the small charge was applied, the preceding discharge C-rate, the pre-charge rest time, and the small-charge C-rate were selected as the experimental variables. To investigate the effect of SOC, five SOC levels of 90%, 70%, 50%, 30%, and 10% were selected to cover the range from high to low SOC. To investigate the effect of the preceding discharge condition, discharge C-rates of 0.2C and 0.5C were employed. In addition, to evaluate the effect of the pre-charge rest time, rest periods of 1 h and 2 h were applied after the completion of discharge. Subsequently, under each condition, a small charge corresponding to 2% SOC was applied at C-rates of 0.2C, 0.5C, and 1C.
The eight cells described above were used across the different operating conditions of the small-charge experiments. Each operating condition was tested once using one of the cells. The SOC-error values presented in the corresponding tables were calculated from the individual experiment conducted under each condition and therefore do not represent averages across multiple cells or repeated tests.
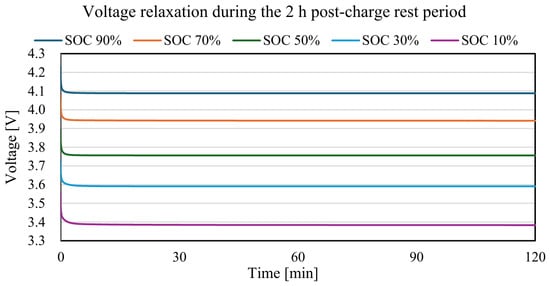
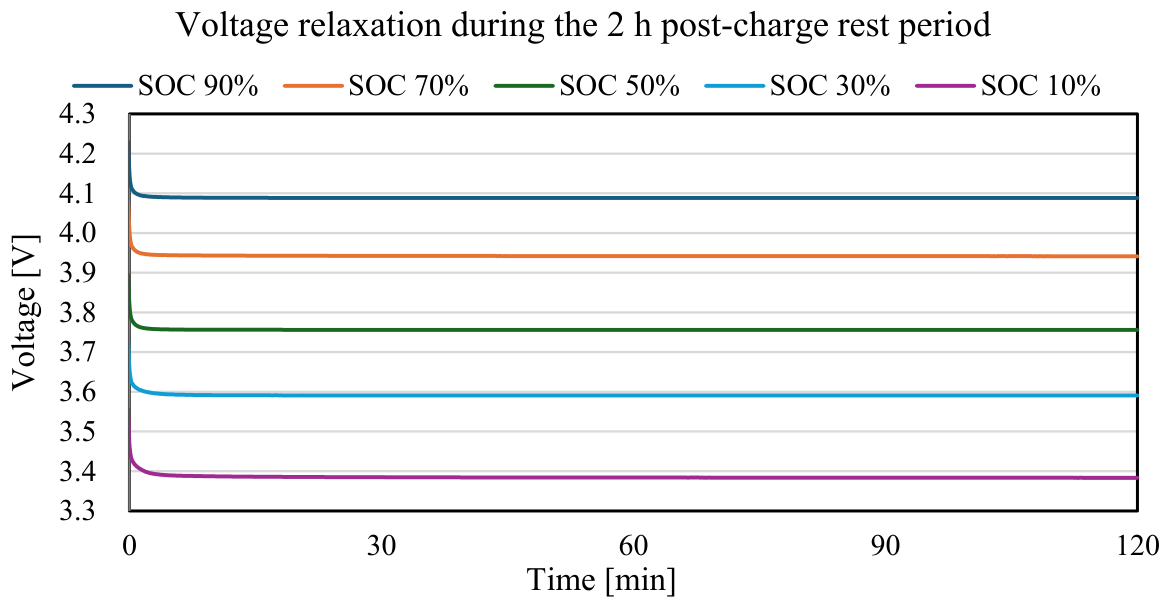
After completion of the 2% small charge, an identical rest period of 2 h was applied under all test conditions to allow voltage relaxation and stabilization. To assess the adequacy of the 2 h post-charge rest period used in this study, the voltage relaxation behavior during the rest period was analyzed. Among the investigated conditions, a preceding discharge C-rate of 0.5C, a pre-charge rest time of 1 h, and a small-charge C-rate of 1C were selected as a representative condition under which relatively pronounced polarization effects could occur. To examine the effect of SOC, the voltage relaxation curves measured at SOC levels of 90%, 70%, 50%, 30%, and 10% were compared. Figure 2 shows the cell voltages measured over the 2 h rest period, with t = 0 defined as the time at which the 2% small charge was completed. Under all SOC conditions, the cell voltage decreased rapidly immediately after completion of the small charge. Thereafter, the voltage change rate decreased substantially from that in the initial period and remained at a low level.
Figure 2.
Voltage relaxation during the 2 h post-charge rest period after a 2% small charge at different SOC levels.
Table 1 quantitatively compares the voltage changes and average voltage change rates over different intervals of the rest period. During the initial 0–30 min interval, the voltage changes ranged from 61.4 to 81.5 mV, and the average voltage change rates ranged from 2.0467 to 2.7167 mV/min. In contrast, the maximum average voltage change rate during the 30–90 min interval decreased to 0.0167 mV/min. During the 90–120 min interval, the maximum voltage change and average voltage change rate were only 0.3 mV and 0.0100 mV/min, respectively. By 90 min after the start of the rest period, at least 99.5% of the total voltage change observed over the full 120 min period had occurred. Therefore, under the selected representative condition and investigated SOC range, the 2 h rest period provided a sufficiently stabilized voltage for SOC determination using the OCV–SOC tables. However, the 2 h post-charge rest period used in this study was established as a common experimental condition for regression-model development and independent validation and does not represent the minimum rest time required for practical applications. The SOC correction performance with shorter post-charge rest periods is evaluated separately in Section 3.1.
Table 1.
Quantitative voltage relaxation characteristics during the 2 h post-charge rest period at different SOC levels.
The stabilized cell voltage measured at the end of the rest period was then converted to SOC using the charging and discharging OCV–SOC tables, respectively. The SOC correction error associated with each OCV–SOC table was evaluated by calculating the difference between the SOC obtained from each table and the reference SOC.
2.2.1. Discharge Tests to 90% SOC
Prior to the main tests, a preliminary capacity test was conducted on Cell 1 of the eight cells. The measured discharge capacity of 4768.05 mAh was used as the common reference capacity, Qref, for setting the test profiles. Based on this capacity, the discharge capacity corresponding to each target SOC and the small-charge capacity corresponding to 2% SOC were calculated and rounded to determine the test settings. The same settings were applied to all eight cells. This reference capacity was used solely to establish identical test conditions. To account for differences in the actual capacities among the cells, the reference SOC for each test i, SOCref,i, was calculated using the measured capacity of the corresponding cell, Qcell,i, the actual discharge capacity, Qdis,i, and the actual small-charge capacity, Qchg,i, as expressed in Equation (1):
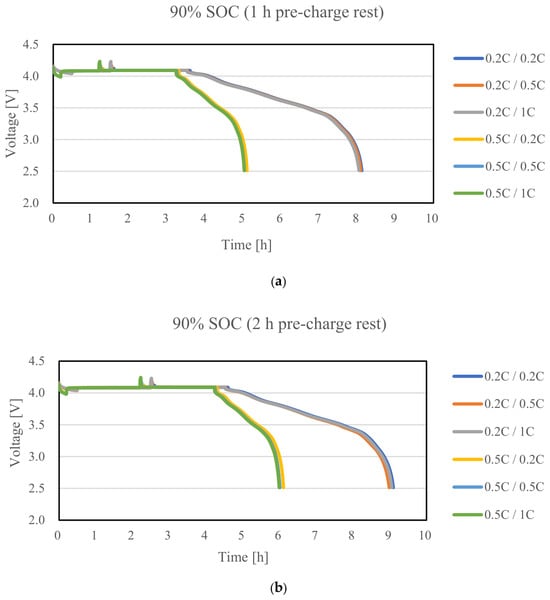
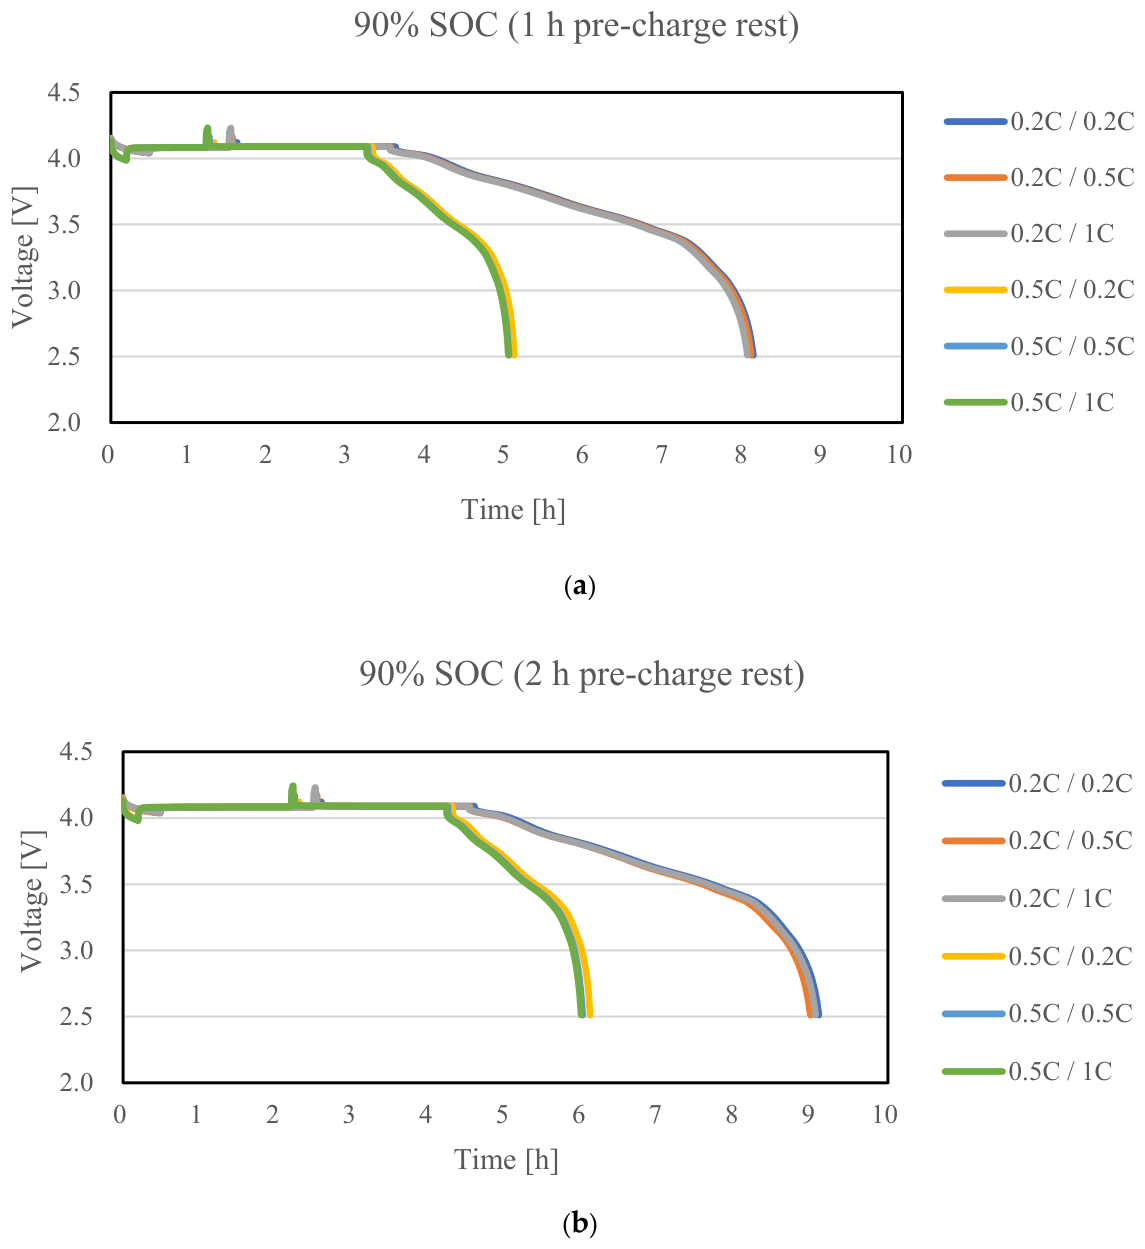
Figure 3 shows the voltage profiles obtained by discharging the cells to 90% SOC at discharge C-rates of 0.2C and 0.5C, followed by pre-charge rest periods of either 1 h or 2 h, and subsequently applying a small charge corresponding to 2% SOC at 0.2C, 0.5C, or 1C. Figure 3a shows the results for a pre-charge rest time of 1 h, whereas Figure 3b shows those for a pre-charge rest time of 2 h. Under all test conditions, a 2 h rest period was applied after completion of the 2% small charge to allow the cell voltage to stabilize. As the discharge C-rate increased from 0.2C to 0.5C, the time required to reach the target SOC decreased. Similarly, increasing the small-charge C-rate reduced the time required to deliver the charge corresponding to 2% SOC.
Figure 3.
Voltage profiles during the post-discharge 2% small-charge tests at 90% SOC: (a) 1 h pre-charge rest; (b) 2 h pre-charge rest. The first and second C-rates in each legend entry denote the preceding discharge and subsequent small-charge C-rates, respectively.
Table 2 presents the SOC values obtained by applying the charging and discharging OCV–SOC tables under the test conditions shown in Figure 3, together with the corresponding SOC errors. The reference SOC, SOCref, was calculated using Equation (1), with the fully charged state defined as 100%, based on the measured capacity of the corresponding test cell, Qcell, the actual discharge capacity, Qdis, and the actual small-charge capacity, Qchg. Here, 90% SOC refers to the target SOC immediately before the small charge. After the 2% small charge, the reference SOC was approximately 92%, with slight variations resulting from differences in the actual capacities among the cells. After completion of the small charge, the cell was rested for 2 h, and the stabilized voltage measured at the end of this rest period was converted to SOCOCV,chg and SOCOCV,dis using the charging and discharging OCV–SOC tables, respectively. The SOC errors associated with the charging and discharging OCV–SOC tables were defined by Equations (2) and (3), respectively:
where Errorchg and Errordis denote the SOC errors obtained using the charging and discharging OCV–SOC tables, respectively. SOCref denotes the reference SOC after the small charge, calculated using the fully charged state as 100%, the measured capacity of the corresponding test cell, Qcell, the actual discharge capacity, Qdis, and the actual small-charge capacity, Qchg. SOCOCV,chg and SOCOCV,dis denote the SOC values obtained by applying the charging and discharging OCV–SOC tables, respectively, to the stabilized cell voltage measured after the 2 h post-charge rest period. All SOC errors were calculated using the unrounded reference, charging, and discharging SOC values, whereas the corresponding SOC values are presented to two decimal places in the tables.
Table 2.
SOC errors obtained using the charging and discharging OCV–SOC tables after a 2% small charge at 90% SOC: (a) 1 h pre-charge rest; (b) 2 h pre-charge rest.
For the 90% SOC condition, the absolute SOC error obtained using the discharging OCV–SOC table was smaller than that obtained using the charging OCV–SOC table under all test conditions, regardless of the discharge C-rate, pre-charge rest time, and small-charge C-rate. The SOC errors obtained using the charging OCV–SOC table ranged from 0.68% to 1.00%. In contrast, the SOC errors obtained using the discharging OCV–SOC table ranged from −0.30% to 0.00%, corresponding to absolute errors of 0.00–0.30%. These results demonstrate that, for a pre-charge SOC of 90%, applying the discharging OCV–SOC table provides more accurate SOC correction, even though the 2% small charge following discharge changed the most recent current direction to charging.
2.2.2. Discharge Tests to 70% SOC
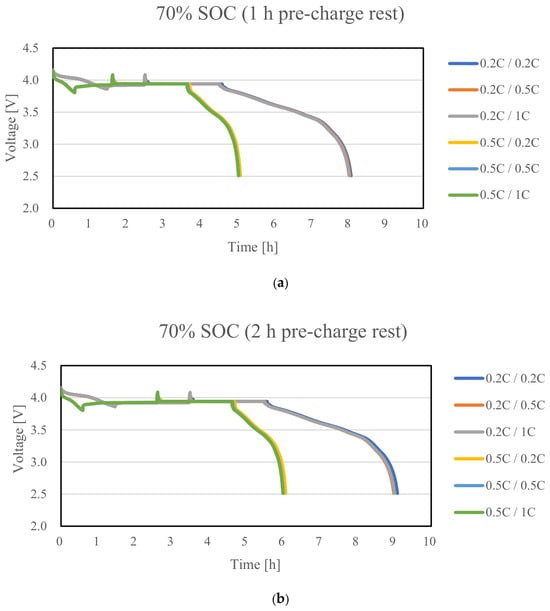
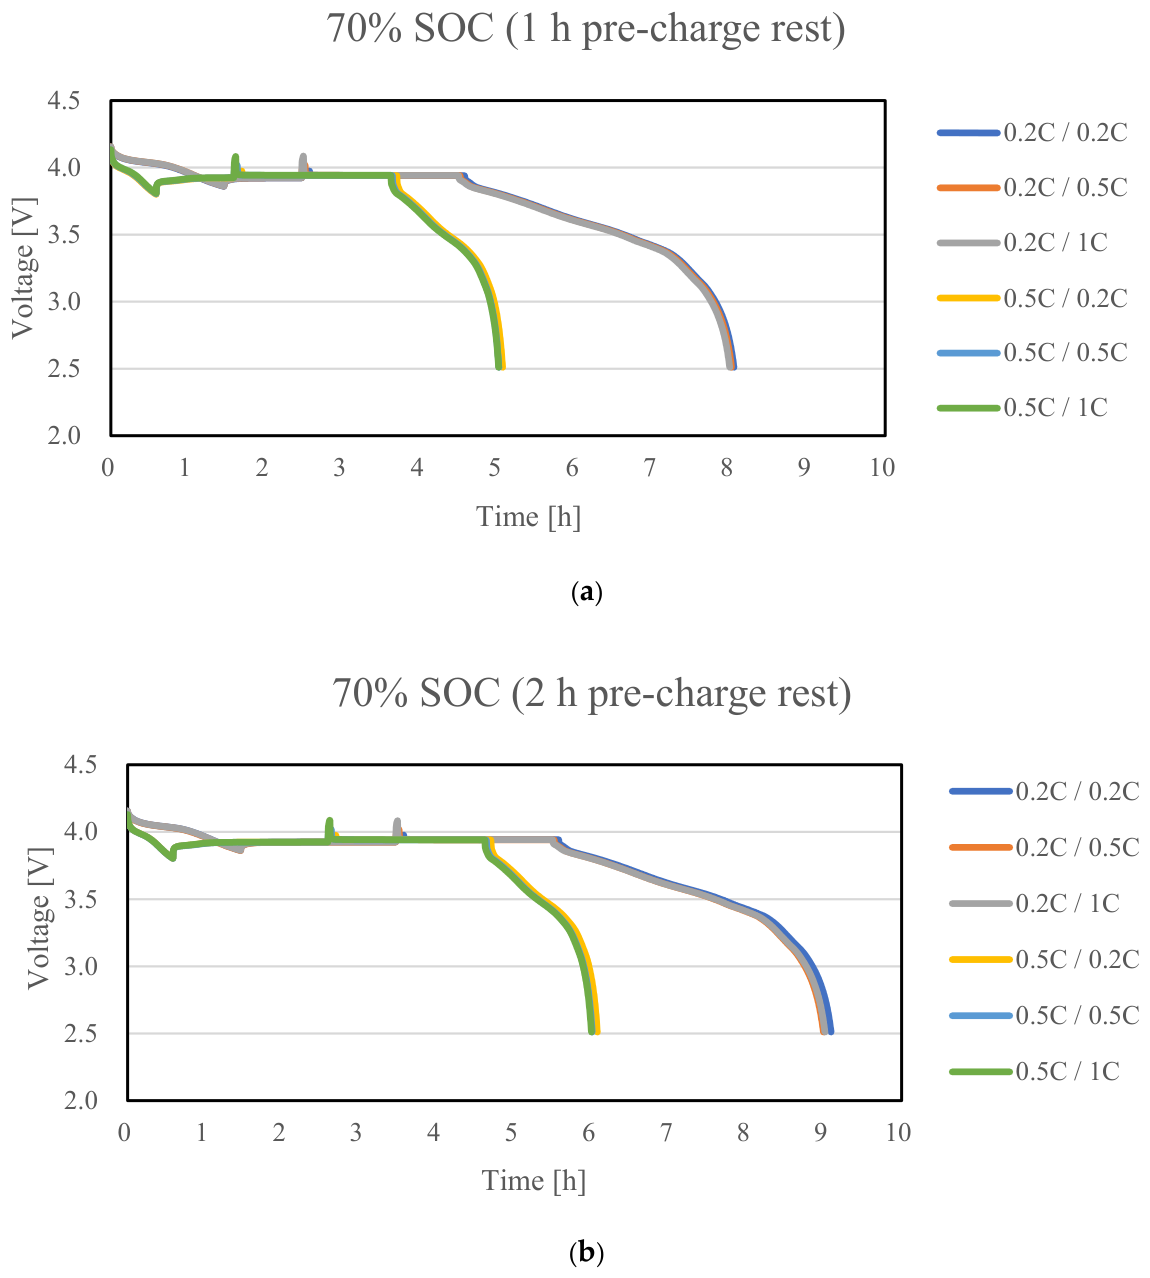
Figure 4 shows the voltage profiles obtained by discharging the cells to 70% SOC at discharge C-rates of 0.2C and 0.5C, followed by pre-charge rest periods of either 1 h or 2 h, and subsequently applying a small charge corresponding to 2% SOC at 0.2C, 0.5C, or 1C. Figure 4a shows the results for a pre-charge rest time of 1 h, whereas Figure 4b shows those for a pre-charge rest time of 2 h. Under all test conditions, a 2 h rest period was applied after completion of the 2% small charge to allow the cell voltage to stabilize. The test procedure and SOC error calculation method were the same as those applied to the 90% SOC condition.
Figure 4.
Voltage profiles during the post-discharge 2% small-charge tests at 70% SOC: (a) 1 h pre-charge rest; (b) 2 h pre-charge rest. The first and second C-rates in each legend entry denote the preceding discharge and subsequent small-charge C-rates, respectively.
Table 3 presents the SOC values obtained by applying the charging and discharging OCV–SOC tables under the test conditions shown in Figure 4, together with the corresponding SOC errors. The reference SOC was calculated using Equation (1), and the SOC errors associated with the charging and discharging OCV–SOC tables were calculated using Equations (2) and (3), respectively. Here, 70% SOC refers to the target SOC immediately before the small charge. After the 2% small charge, the reference SOC was approximately 72%, with slight variations resulting from differences in the actual capacities among the cells.
Table 3.
SOC errors obtained using the charging and discharging OCV–SOC tables after a 2% small charge at 70% SOC: (a) 1 h pre-charge rest; (b) 2 h pre-charge rest.
For the 70% SOC condition, the SOC errors obtained using the charging OCV–SOC table ranged from −0.07% to 0.10%, corresponding to absolute errors of 0.00–0.10%. The SOC errors obtained using the discharging OCV–SOC table ranged from −0.55% to −0.38%, corresponding to absolute errors of 0.38–0.55%. A comparison of the absolute SOC errors showed that the charging OCV–SOC table produced smaller absolute errors under all 12 test conditions, regardless of the discharge C-rate, pre-charge rest time, and small-charge C-rate. These results indicate that, for a pre-charge SOC of 70%, the stabilized voltage characteristics of the cells after the 2% small charge were closer to the charging OCV–SOC curve than to the discharging OCV–SOC curve. Accordingly, applying the charging OCV–SOC table provided more accurate SOC correction.
2.2.3. Discharge Tests to 50% SOC
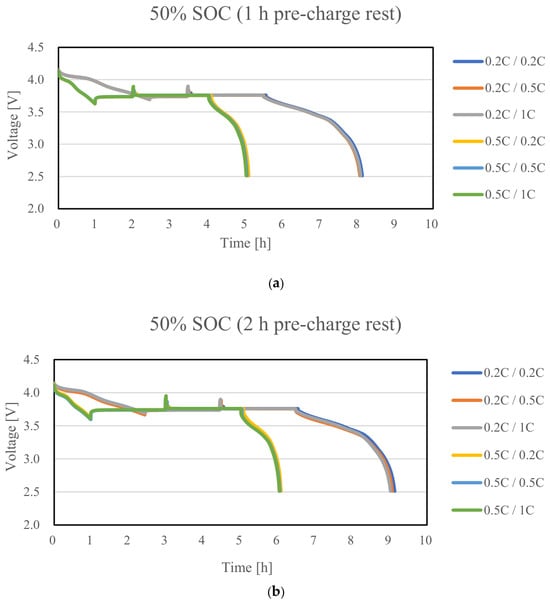
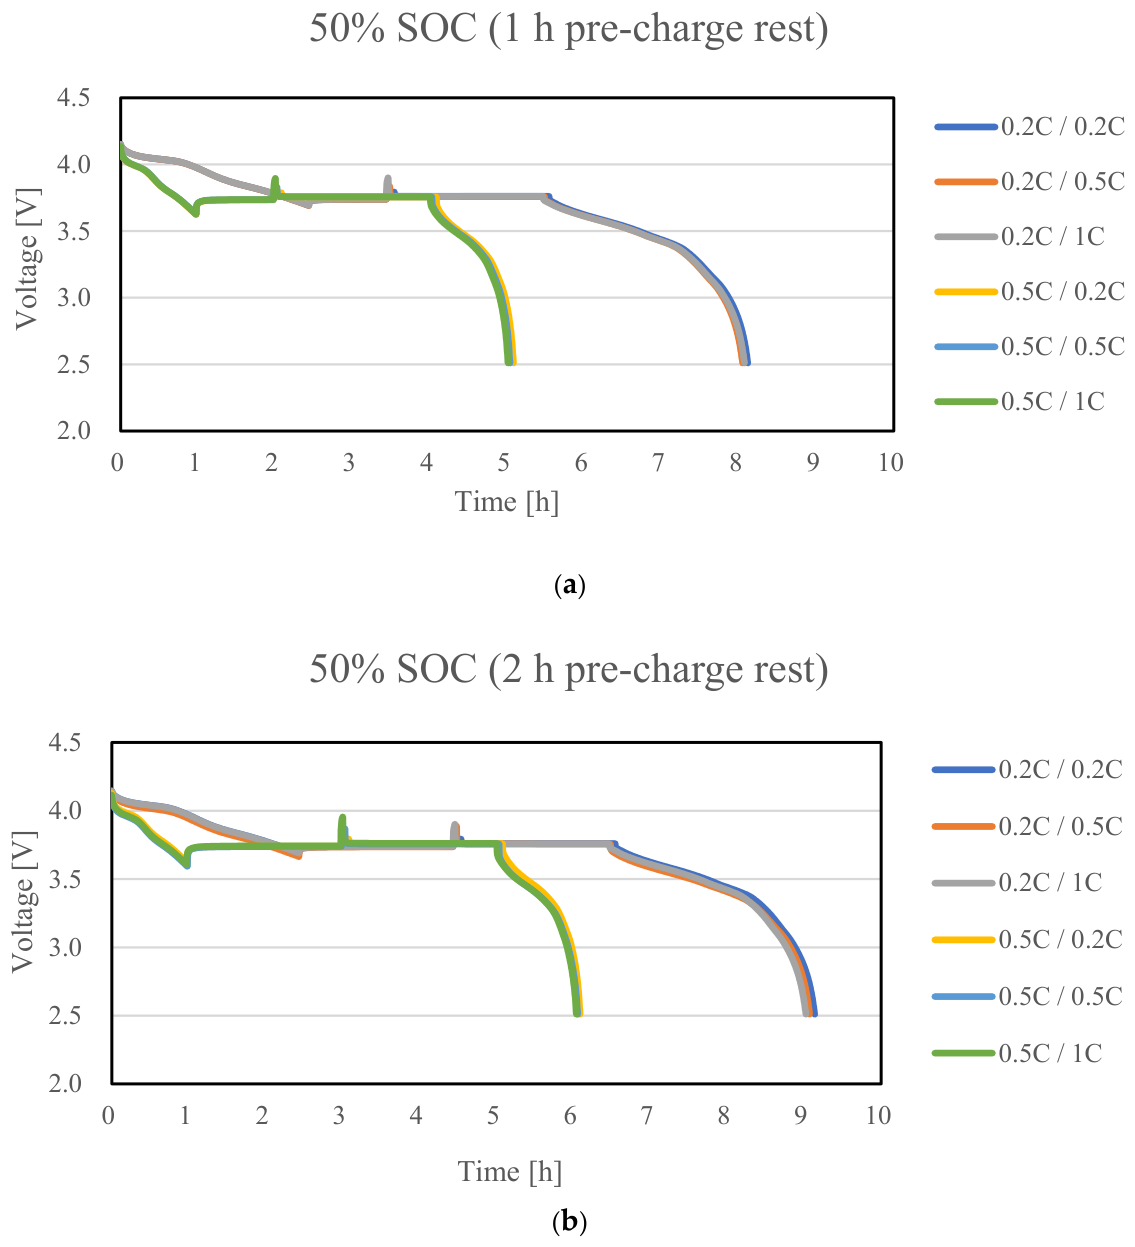
Figure 5 shows the voltage profiles obtained by discharging the cells to 50% SOC at discharge C-rates of 0.2C and 0.5C, followed by pre-charge rest periods of either 1 h or 2 h, and subsequently applying a small charge corresponding to 2% SOC at 0.2C, 0.5C, or 1C. Figure 5a shows the results for a pre-charge rest time of 1 h, whereas Figure 5b shows those for a pre-charge rest time of 2 h. Under all test conditions, a 2 h rest period was applied after completion of the 2% small charge to allow the cell voltage to stabilize. The test procedure and the method used to calculate the SOC errors were identical to those used for the 90% and 70% SOC conditions.
Figure 5.
Voltage profiles during the post-discharge 2% small-charge tests at 50% SOC: (a) 1 h pre-charge rest; (b) 2 h pre-charge rest. The first and second C-rates in each legend entry denote the preceding discharge and subsequent small-charge C-rates, respectively.
Table 4 presents the SOC values and corresponding SOC errors obtained by applying the charging and discharging OCV–SOC tables under the test conditions shown in Figure 5. The reference SOC was calculated using Equation (1), and the SOC errors associated with the charging and discharging OCV–SOC tables were calculated using Equations (2) and (3), respectively. Here, 50% SOC refers to the target SOC immediately before the small charge. After the 2% small charge, the reference SOC was approximately 52%, with slight variations resulting from differences in the actual capacities among the cells.
Table 4.
SOC errors obtained using the charging and discharging OCV–SOC tables after a 2% small charge at 50% SOC: (a) 1 h pre-charge rest; (b) 2 h pre-charge rest.
At 50% SOC, the SOC errors obtained using the charging OCV–SOC table ranged from −0.22% to 0.47%, and their absolute values ranged from 0.01% to 0.47%, whereas those obtained using the discharging OCV–SOC table ranged from −1.26% to −0.55%, and their absolute values ranged from 0.55% to 1.26%. To compare the SOC correction performance associated with the selection of the OCV–SOC table, the absolute values of the SOC errors were compared. The absolute SOC error obtained using the charging OCV–SOC table was smaller under all 12 test conditions, regardless of the discharge C-rate, pre-charge rest time, and small-charge C-rate. These results indicate that, for a pre-charge SOC of 50%, the stabilized voltage characteristics of the cells after the 2% small charge were closer to the charging OCV–SOC curve than to the discharging OCV–SOC curve. Accordingly, applying the charging OCV–SOC table provided more accurate SOC correction.
2.2.4. Discharge Tests to 30% SOC
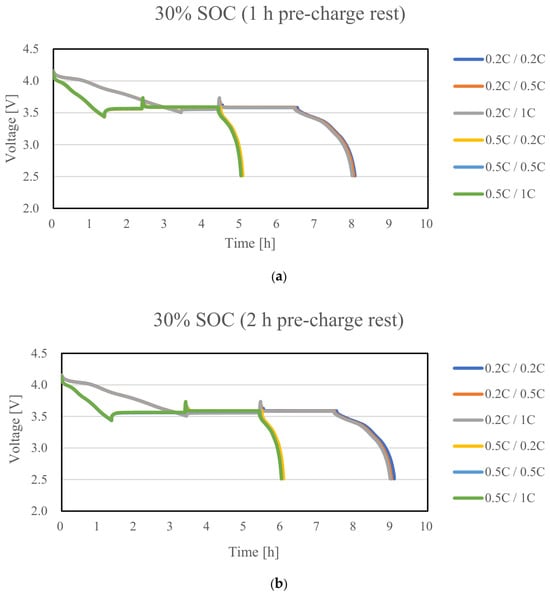
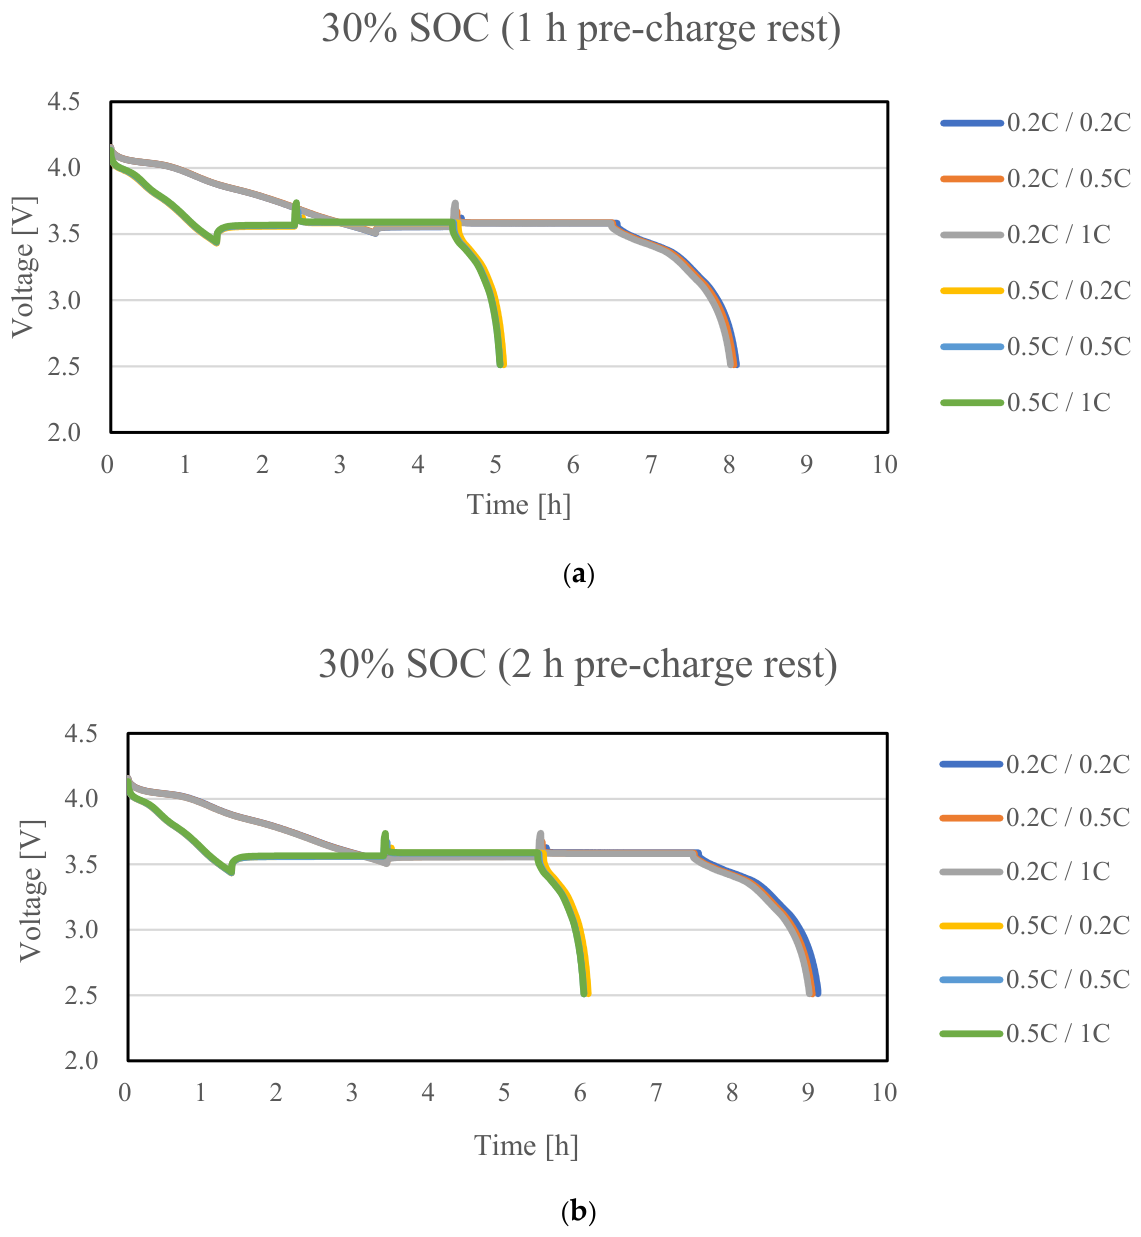
Figure 6 shows the voltage profiles obtained by discharging the cells to 30% SOC at discharge C-rates of 0.2C and 0.5C, followed by pre-charge rest periods of either 1 h or 2 h, and subsequently applying a small charge corresponding to 2% SOC at 0.2C, 0.5C, or 1C. Figure 6a shows the results for a pre-charge rest time of 1 h, whereas Figure 6b shows those for a pre-charge rest time of 2 h. Under all test conditions, a 2 h rest period was applied after completion of the 2% small charge to allow the cell voltage to stabilize. The test procedure and SOC error calculation method were the same as those applied to the 90%, 70%, and 50% SOC conditions.
Figure 6.
Voltage profiles during the post-discharge 2% small-charge tests at 30% SOC: (a) 1 h pre-charge rest; (b) 2 h pre-charge rest. The first and second C-rates in each legend entry denote the preceding discharge and subsequent small-charge C-rates, respectively.
Table 5 presents the SOC values and corresponding SOC errors obtained by applying the charging and discharging OCV–SOC tables under the test conditions shown in Figure 6. The reference SOC was calculated using Equation (1), and the SOC errors associated with the charging and discharging OCV–SOC tables were calculated using Equations (2) and (3), respectively. Here, 30% SOC refers to the target SOC immediately before the small charge. After the 2% small charge, the reference SOC was approximately 32%, with slight variations resulting from differences in the actual capacities among the cells.
Table 5.
SOC errors obtained using the charging and discharging OCV–SOC tables after a 2% small charge at 30% SOC: (a) 1 h pre-charge rest; (b) 2 h pre-charge rest.
For the 30% SOC condition, the SOC errors obtained using the charging OCV–SOC table ranged from 2.67% to 3.12%, corresponding to absolute errors of 2.67–3.12%. The SOC errors obtained using the discharging OCV–SOC table ranged from −1.12% to −0.66%, corresponding to absolute errors of 0.66–1.12%. A comparison of the absolute SOC errors showed that the discharging OCV–SOC table produced smaller absolute errors under all 12 test conditions, regardless of the discharge C-rate, pre-charge rest time, and small-charge C-rate. These results indicate that, for a pre-charge SOC of 30%, the stabilized voltage characteristics of the cells after the 2% small charge were closer to the discharging OCV–SOC curve than to the charging OCV–SOC curve. Accordingly, applying the discharging OCV–SOC table provided more accurate SOC correction.
2.2.5. Discharge Tests to 10% SOC
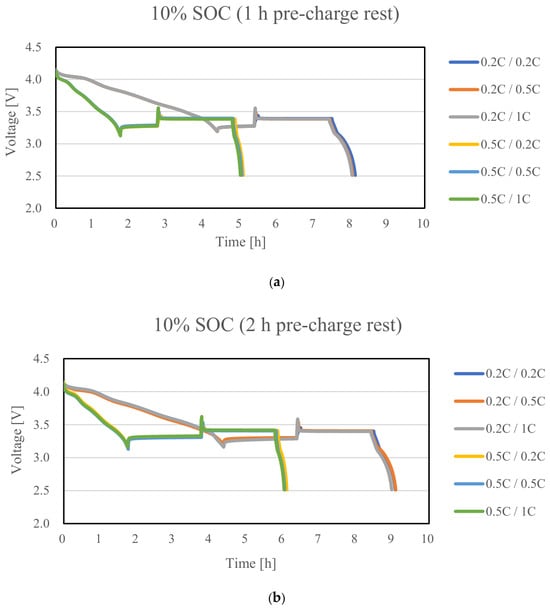
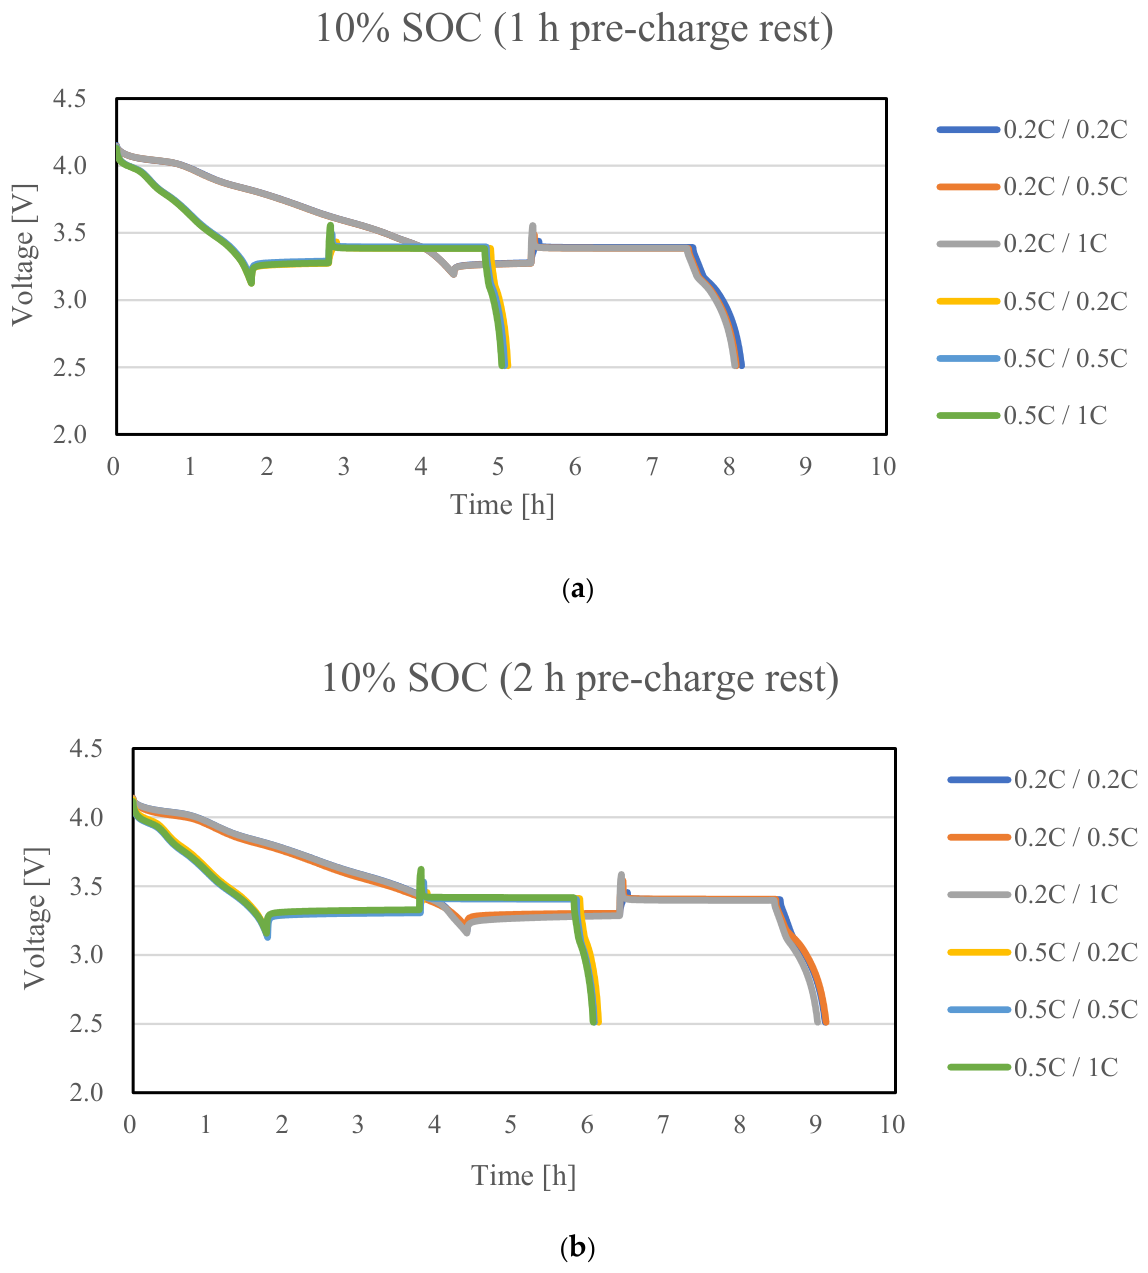
Figure 7 shows the voltage profiles obtained by discharging the cells to 10% SOC at discharge C-rates of 0.2C and 0.5C, followed by pre-charge rest periods of either 1 h or 2 h, and subsequently applying a small charge corresponding to 2% SOC at 0.2C, 0.5C, or 1C. Figure 7a shows the results for a pre-charge rest time of 1 h, whereas Figure 7b shows those for a pre-charge rest time of 2 h. Under all test conditions, a 2 h rest period was applied after completion of the 2% small charge to allow the cell voltage to stabilize. The test procedure and the method used to calculate the SOC errors were identical to those used for the 90%, 70%, 50%, and 30% SOC conditions.
Figure 7.
Voltage profiles during the post-discharge 2% small-charge tests at 10% SOC: (a) 1 h pre-charge rest; (b) 2 h pre-charge rest. The first and second C-rates in each legend entry denote the preceding discharge and subsequent small-charge C-rates, respectively.
Table 6 presents the SOC values and corresponding SOC errors obtained by applying the charging and discharging OCV–SOC tables under the test conditions shown in Figure 7. The reference SOC was calculated using Equation (1), and the SOC errors associated with the charging and discharging OCV–SOC tables were calculated using Equations (2) and (3), respectively. Here, 10% SOC refers to the target SOC immediately before the small charge. After the 2% small charge, the reference SOC was approximately 12–13%, with slight variations resulting from differences in the actual capacities among the cells.
Table 6.
SOC errors obtained using the charging and discharging OCV–SOC tables after a 2% small charge at 10% SOC: (a) 1 h pre-charge rest; (b) 2 h pre-charge rest.
For the 10% SOC condition, the SOC errors obtained using the charging OCV–SOC table ranged from 0.05% to 2.12%, corresponding to absolute errors of 0.05–2.12%. The SOC errors obtained using the discharging OCV–SOC table ranged from −3.98% to −2.51%, corresponding to absolute errors of 2.51–3.98%. A comparison of the absolute SOC errors showed that the charging OCV–SOC table produced smaller absolute errors under all 12 test conditions, regardless of the discharge C-rate, pre-charge rest time, and small-charge C-rate. These results indicate that, for a pre-charge SOC of 10%, the stabilized voltage characteristics of the cells after the 2% small charge were closer to the charging OCV–SOC curve than to the discharging OCV–SOC curve. Accordingly, applying the charging OCV–SOC table provided more accurate SOC correction.
Therefore, at 10% SOC, as in the 70% and 50% SOC conditions, the charging OCV–SOC table resulted in smaller absolute SOC errors under all 12 test conditions. In contrast, at 90% and 30% SOC, the discharging OCV–SOC table resulted in smaller absolute SOC errors under all test conditions. These results indicate that even when the same 2% small charge is applied after discharge, the appropriate OCV–SOC table may vary depending on the SOC region and operating conditions.
Therefore, to minimize the SOC correction error under post-discharge small-charge conditions, an appropriate OCV–SOC table should be selected by considering the SOC and operating conditions rather than uniformly applying a specific OCV–SOC table. In this study, regression analysis was subsequently performed to quantitatively model the relationship between these operating conditions and the resulting SOC errors.
2.3. Regression Models for SOC Error-Based OCV–SOC Table Selection
The experimental results presented in Section 2.2 showed that, even when the same 2% small charge was applied after discharge, the SOC errors obtained using the charging and discharging OCV–SOC tables varied depending on the SOC and operating conditions. Therefore, in this study, regression models were developed to predict the SOC errors associated with each OCV–SOC table based on the operating conditions, with the aim of selecting an appropriate OCV–SOC table for SOC correction after a small charge.
The independent variables of the regression models were defined as the preceding discharge C-rate (Dis_C_rate), SOC before the small charge (SOC), pre-charge rest time (Rest), and small-charge C-rate (Chg_C_rate). The dependent variables were defined as the SOC errors obtained using the charging and discharging OCV–SOC tables, denoted by Errorchg and Errordis, respectively. The experimental results obtained at SOC levels of 90%, 70%, 50%, 30%, and 10% in Section 2.2 were used for the regression analysis.
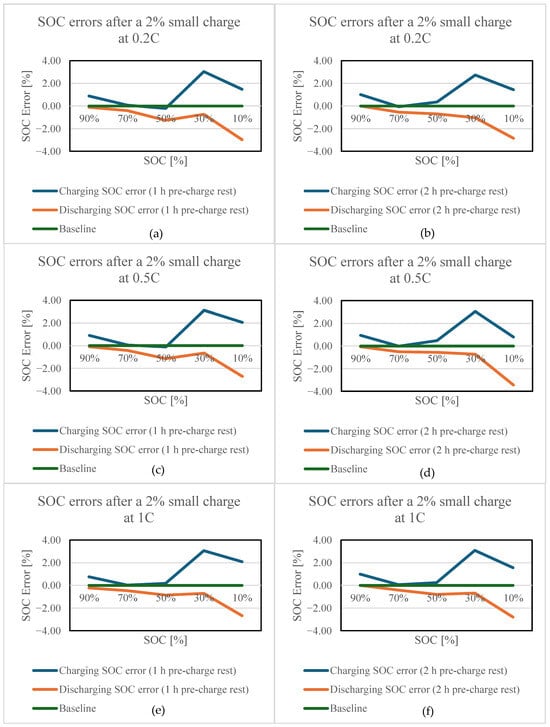
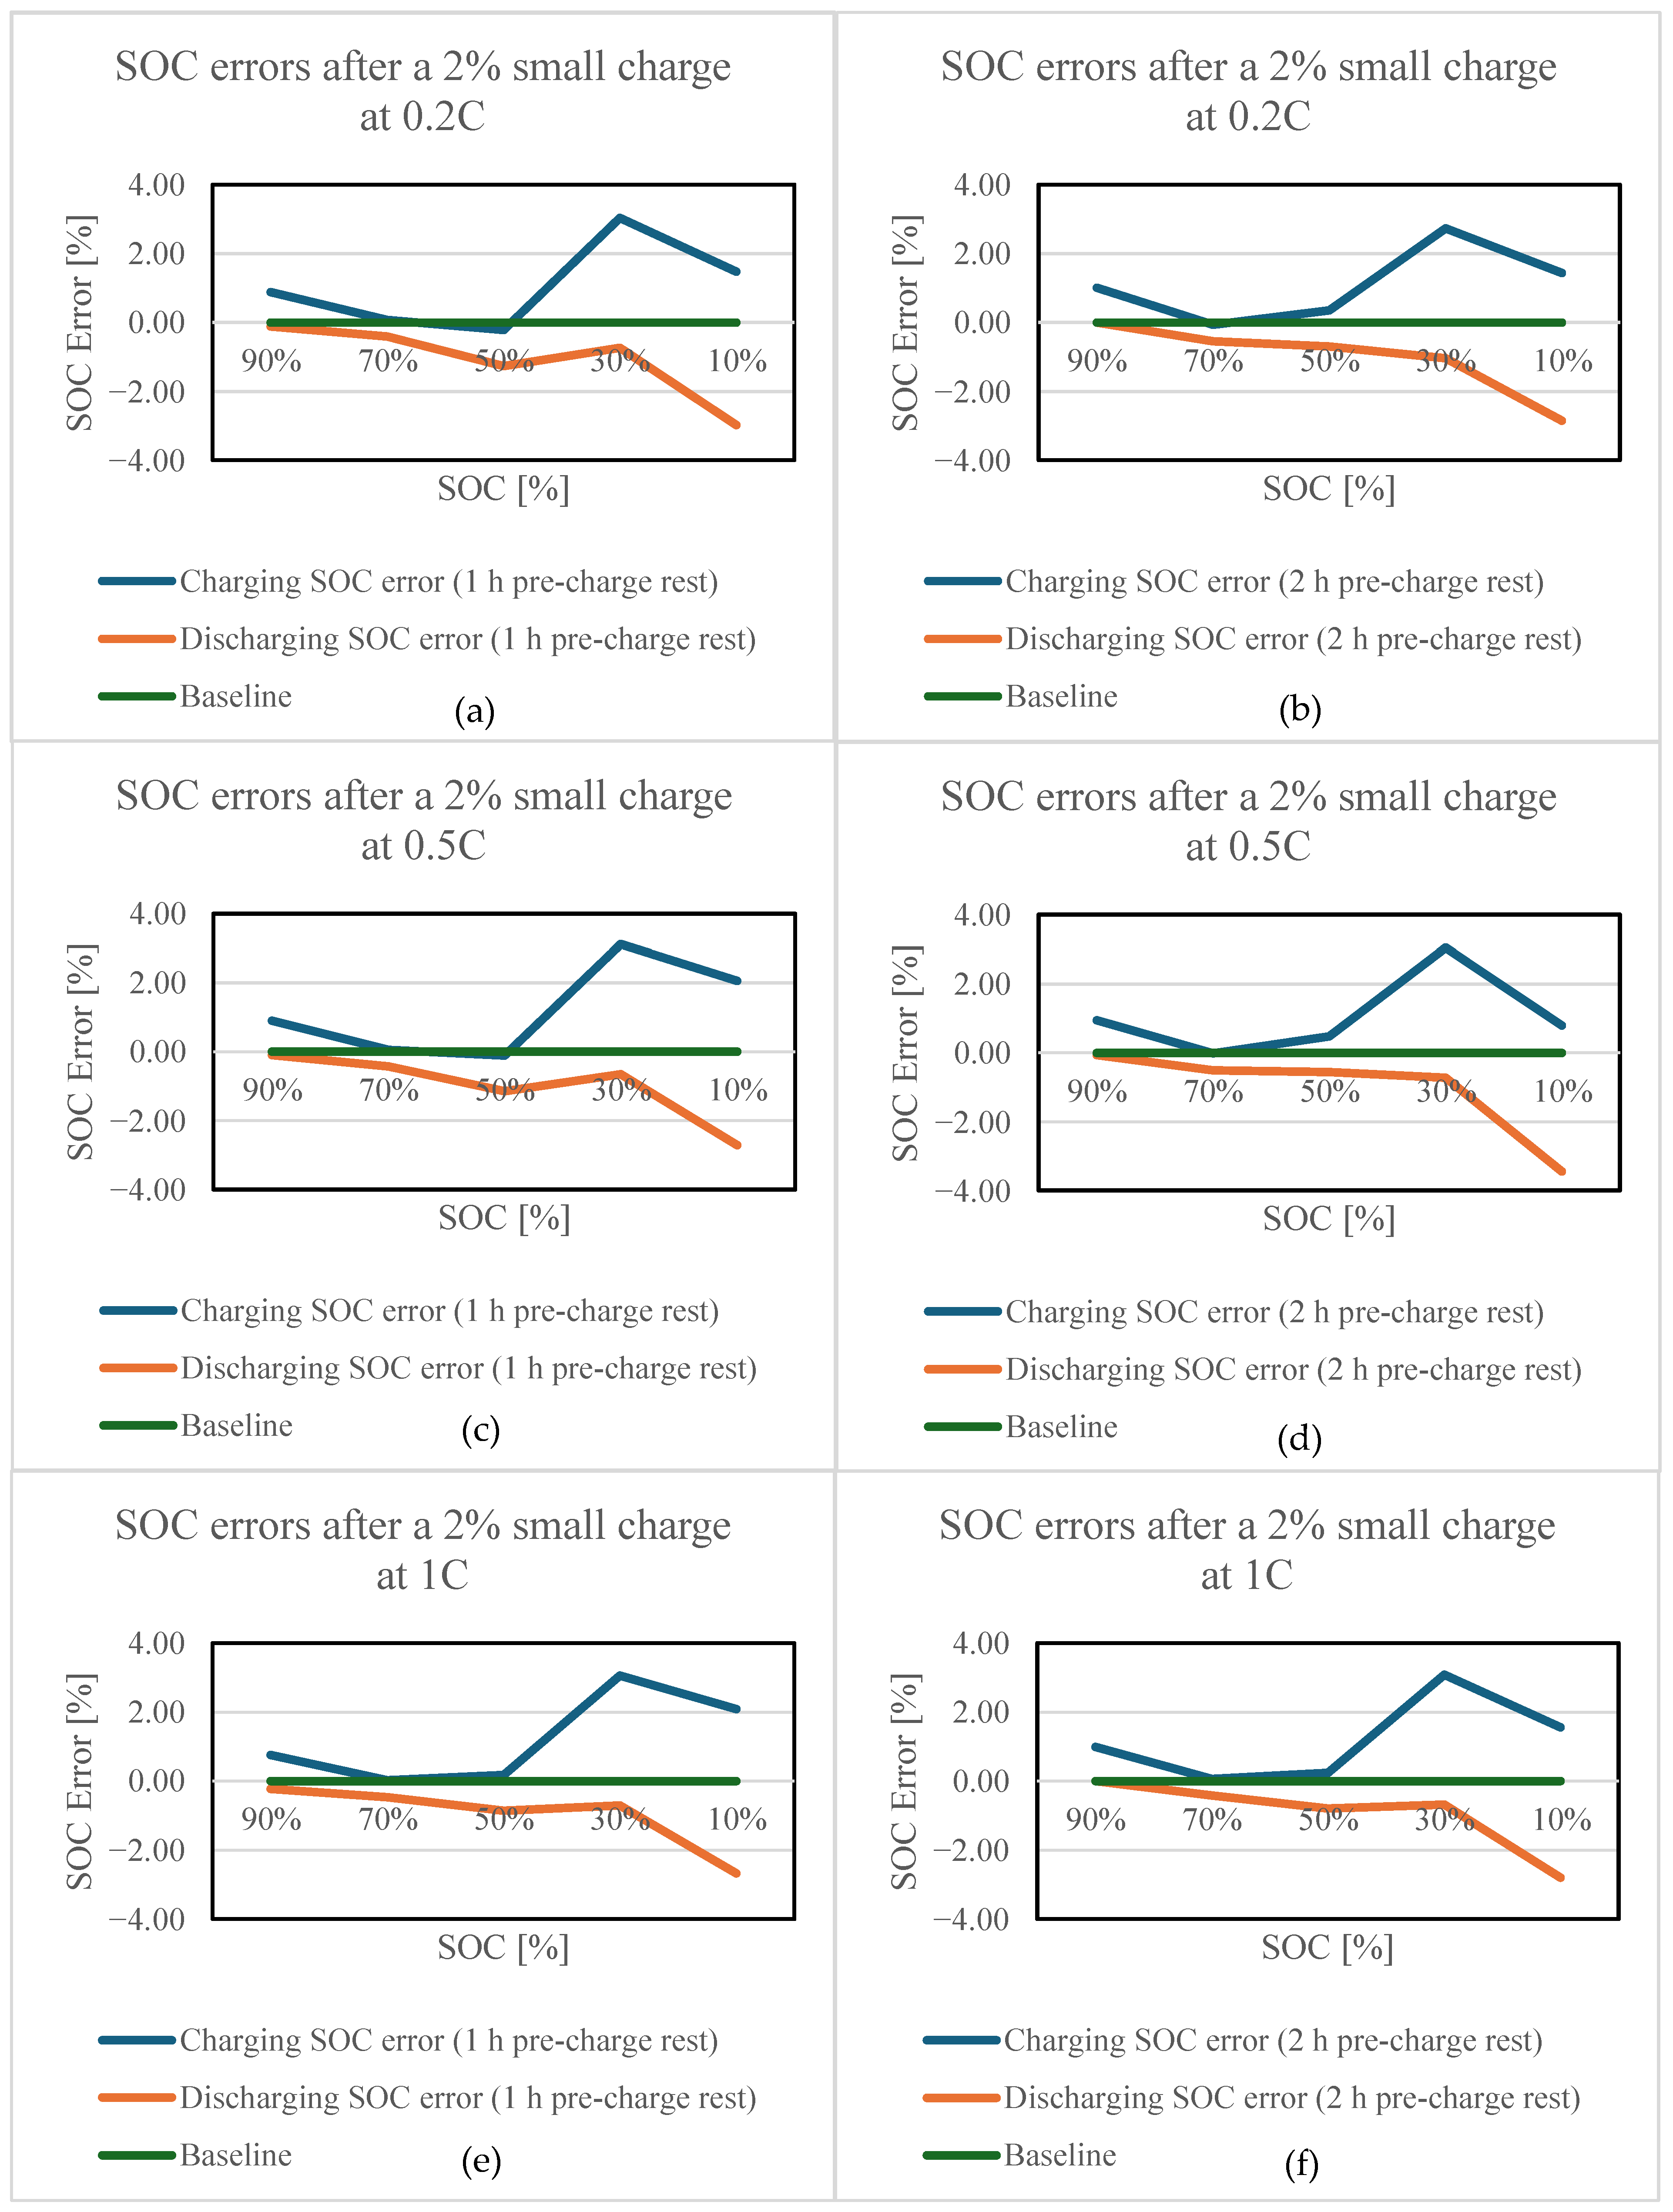
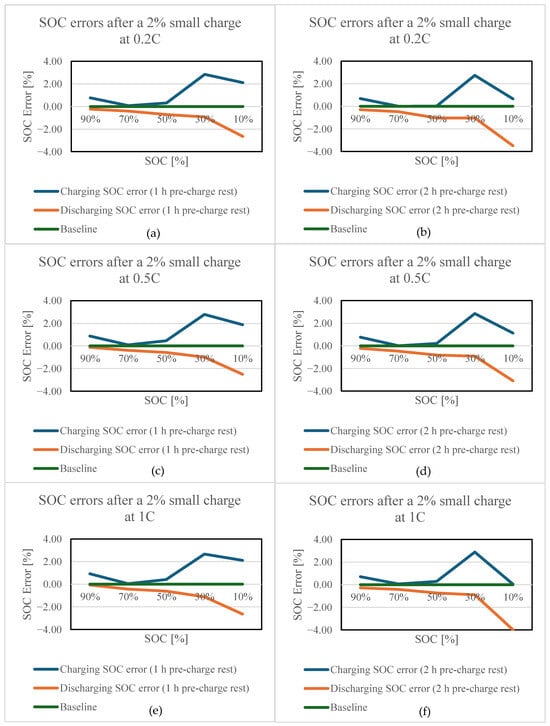
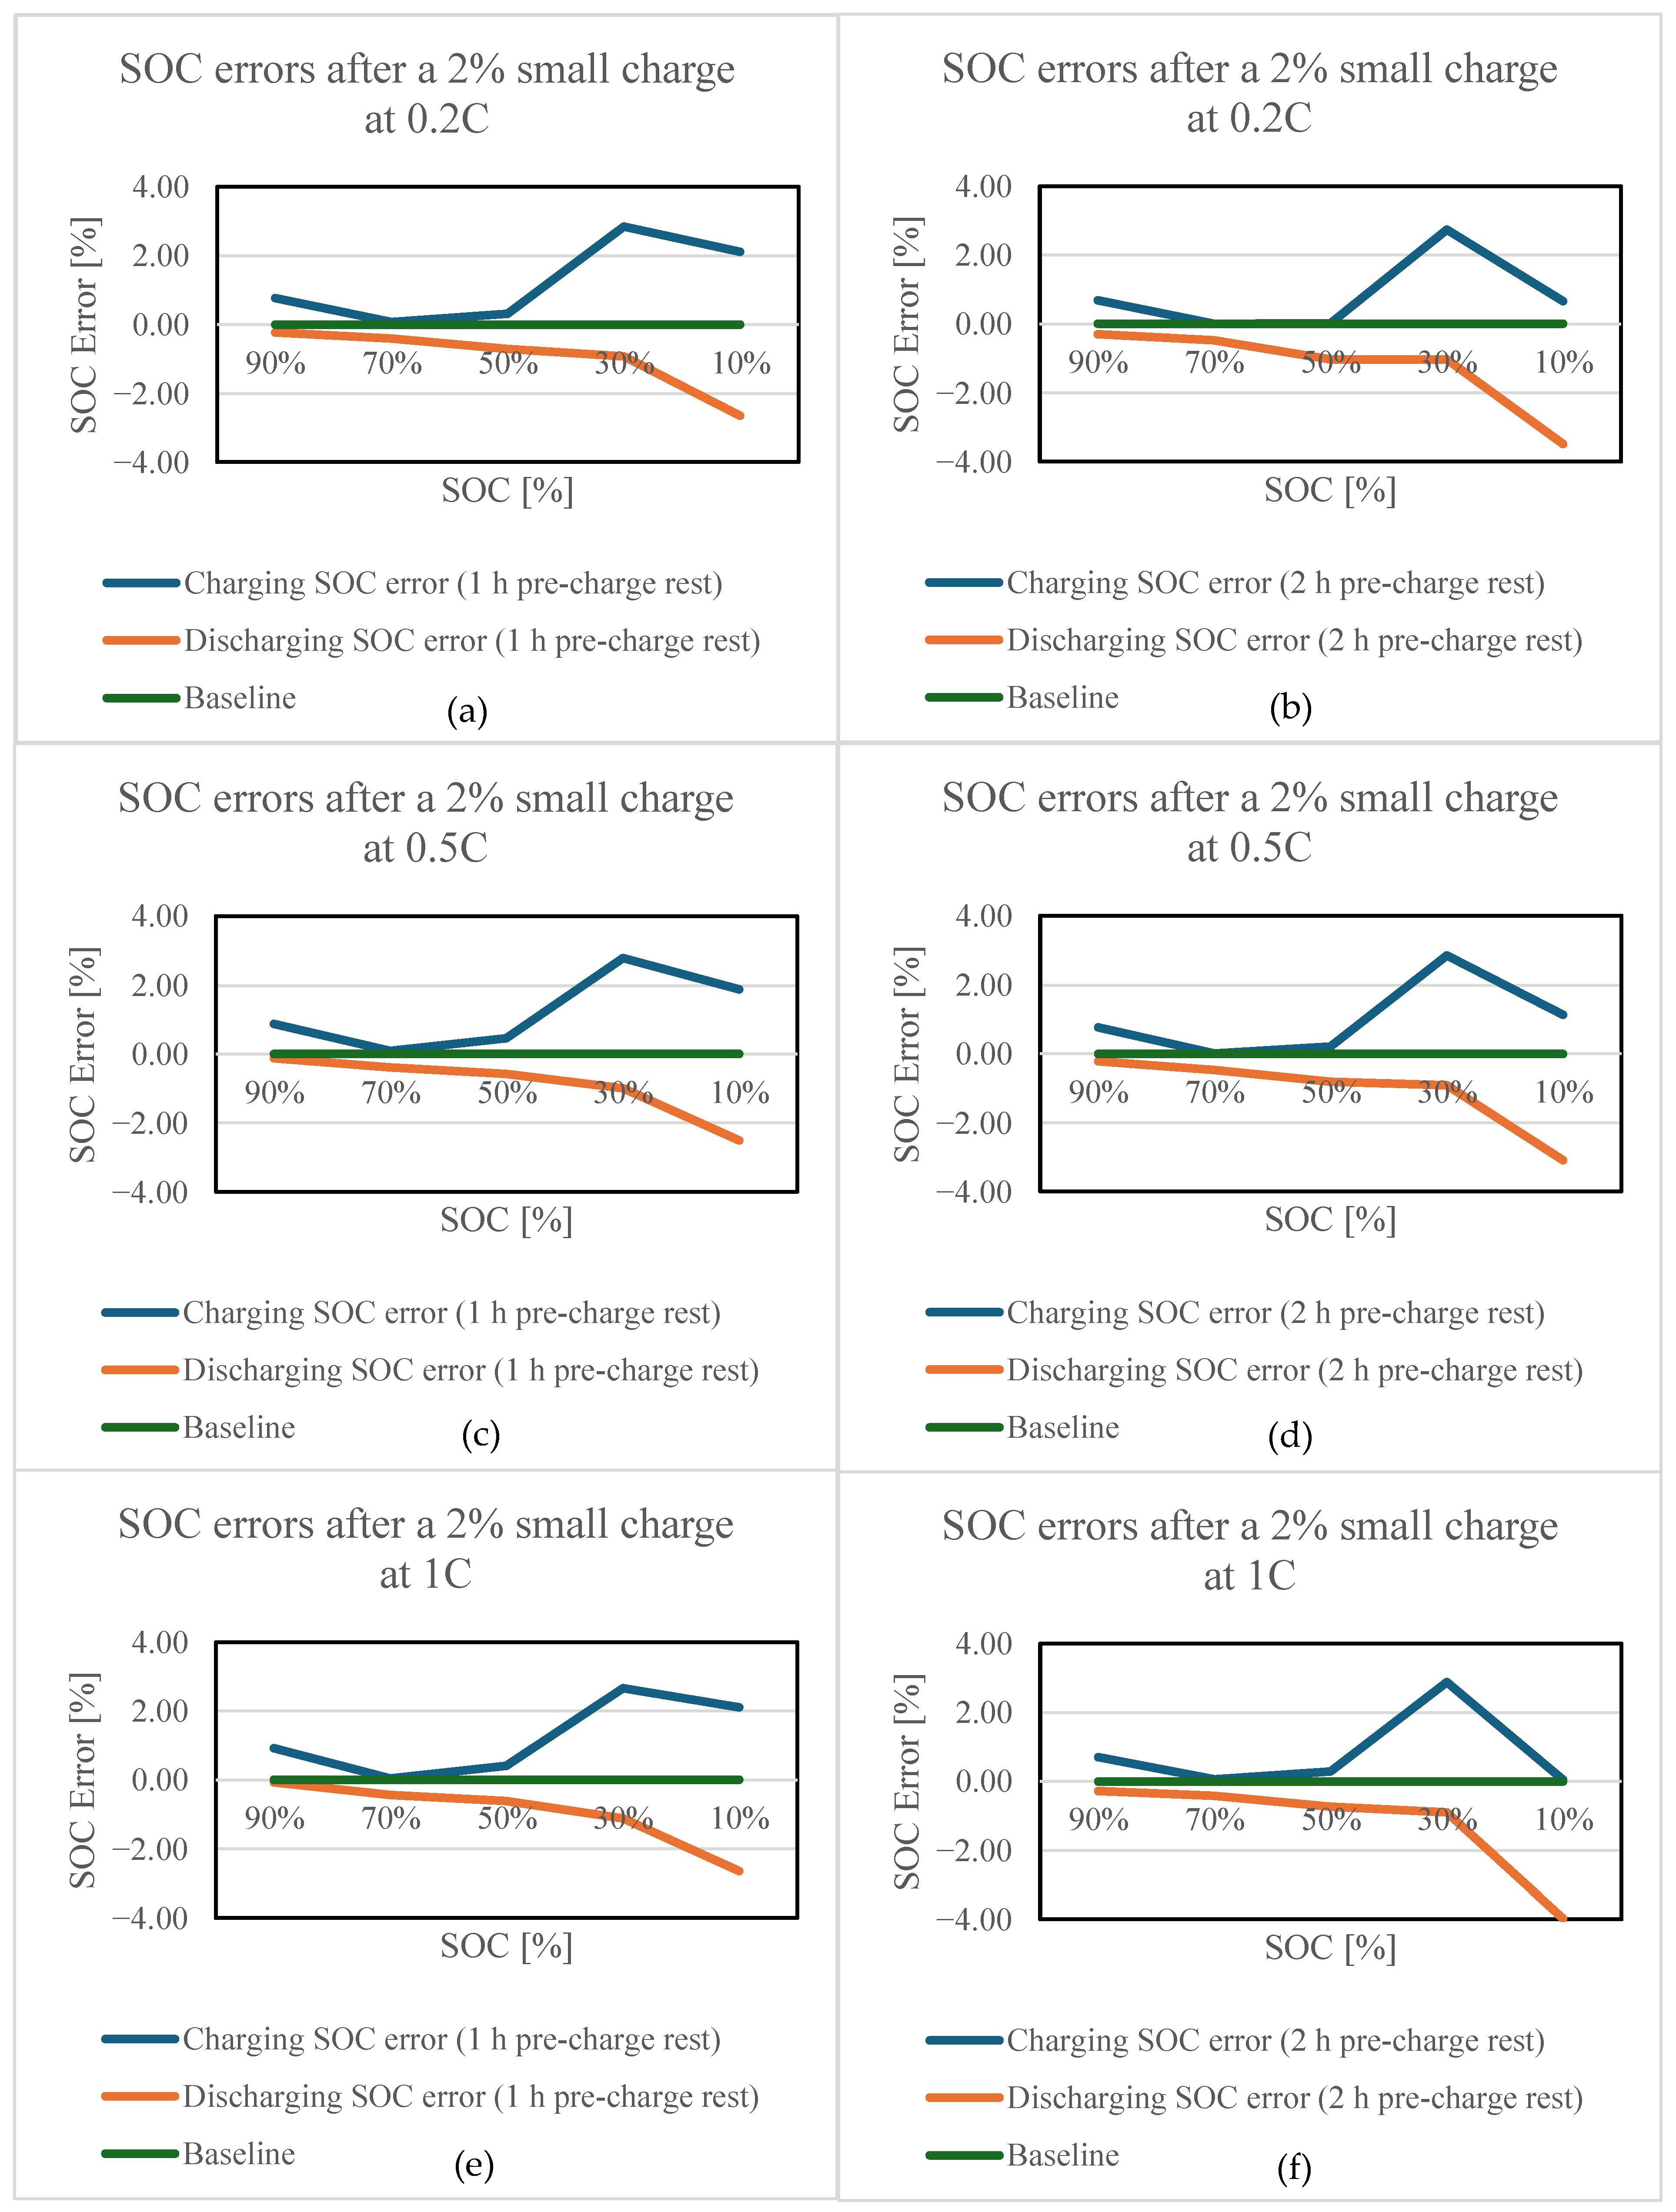
Figure 8 and Figure 9 show the SOC errors obtained using the charging and discharging OCV–SOC tables under the conditions in which the cells were discharged at 0.2C and 0.5C, followed by pre-charge rest periods of 1 h and 2 h, and subsequently subjected to a 2% small charge at 0.2C, 0.5C, and 1C. Figure 8 presents the results for a preceding discharge C-rate of 0.2C, whereas Figure 9 presents those for a preceding discharge C-rate of 0.5C.
Figure 8.
SOC errors after a 2% small charge following 0.2C discharge at small-charge C-rates of (a,b) 0.2C, (c,d) 0.5C, and (e,f) 1C, with pre-charge rest periods of (a,c,e) 1 h and (b,d,f) 2 h.
Figure 9.
SOC errors after a 2% small charge following 0.5C discharge at small-charge C-rates of (a,b) 0.2C, (c,d) 0.5C, and (e,f) 1C, with pre-charge rest periods of (a,c,e) 1 h and (b,d,f) 2 h.
The experimental results showed a clear dependence of the SOC error on the SOC level. At 90% and 30% SOC, the absolute SOC errors obtained using the discharging OCV–SOC table were smaller than those obtained using the charging OCV–SOC table. In contrast, at 70%, 50%, and 10% SOC, the charging OCV–SOC table resulted in smaller absolute SOC errors under all test conditions. Furthermore, even at the same SOC, the SOC errors varied depending on the preceding discharge C-rate, pre-charge rest time, and small-charge C-rate. Therefore, regression analysis was performed to quantitatively model the SOC errors associated with the charging and discharging OCV–SOC tables as functions of the operating conditions.
Table 7 and Table 8 present the SOC errors obtained using the charging and discharging OCV–SOC tables, respectively, together with the corresponding operating conditions. A total of 60 experimental conditions were used for the regression analysis, consisting of five SOC levels (90%, 70%, 50%, 30%, and 10%), two discharge C-rates (0.2C and 0.5C), two pre-charge rest times (60 and 120 min), and three small-charge C-rates (0.2C, 0.5C, and 1C). Two SOC error prediction models were constructed by using Error_chg and Error_dis obtained under each condition as the respective dependent variables. The regression coefficients were estimated by ordinary least squares with an intercept using the unrounded SOC error values.
Table 7.
SOC errors obtained using the charge OCV–SOC table under various operating conditions.
Table 8.
SOC errors obtained using the discharge OCV–SOC table under various operating conditions.
Equations (4)–(6) represent the regression models used to predict the SOC errors associated with the charging and discharging OCV–SOC tables. Equation (4) is a linear regression model with the preceding discharge C-rate, SOC before the small charge, pre-charge rest time, and small-charge C-rate as independent variables. Equation (5) is a reduced second-order polynomial regression model without interaction terms and includes the SOC2 and (Chg_C_rate)2 terms to account for the nonlinear effects of SOC and the small-charge C-rate.
The discharge C-rate consisted of two levels, 0.2C and 0.5C, and the pre-charge rest time also consisted of two levels, 60 and 120 min. Consequently, the Dis_C_rate2 and Rest2 terms are perfectly linearly dependent on their respective original variables and the intercept and were therefore excluded from Equation (5). In contrast, SOC and the small-charge C-rate consisted of five and three levels, respectively; therefore, the SOC2 and (Chg_C_rate)2 terms were retained.
As Figure 8 and Figure 9 showed that the slopes of the SOC-error variation differed across the SOC intervals, the SOC piecewise-linear regression model in Equation (6) was constructed to represent this behavior. The SOC levels of 30%, 50%, and 70% used in the experiments were prespecified as internal knots, and the hinge function, defined as (SOC − k)+=max(SOC − k,0), was employed as a truncated linear spline basis [23]. This function is equal to 0 when SOC ≤ k and to SOC − k when SOC > k. Accordingly, the slopes of the SOC error were allowed to differ across the intervals of 10–30%, 30–50%, 50–70%, and 70–90%, while the predicted SOC error remained continuous at each knot. Each hinge term was calculated as max(SOC − k,0), and all regression coefficients were estimated by ordinary least squares with an intercept using the LINEST function in Microsoft Excel for Microsoft 365 (Microsoft Corporation, Redmond, WA, USA). Rather than fitting each SOC interval separately, one regression model for each dependent variable was fitted simultaneously using all 60 experimental conditions.
The regression equations obtained for the SOC errors associated with the charging OCV–SOC table are given by Equations (7)–(9):
Similarly, the regression equations obtained for the SOC errors associated with the discharging OCV–SOC table are given by Equations (10)–(12):
Equations (7)–(9) are the regression models used to predict the SOC error (Errorchg) associated with the charging OCV–SOC table, whereas Equations (10)–(12) are those used to predict the SOC error (Errordis) associated with the discharging OCV–SOC table. Equations (7) and (10) correspond to the linear regression models, Equations (8) and (11) correspond to the reduced second-order polynomial regression models, and Equations (9) and (12) correspond to the SOC piecewise-linear regression models. All 60 experimental conditions were used to fit the regression models. The input variables were not normalized; instead, the actual values of the discharge and charge C-rates, SOC [%], and rest time [min] were used.
Here, Dis_C_rate denotes the discharge C-rate preceding the small charge, SOC denotes the target SOC [%] immediately before the 2% small charge, Rest denotes the pre-charge rest time [min], and Chg_C_rate denotes the C-rate of the 2% small charge. Because the post-charge rest time was fixed at 120 min under all test conditions, it was not included as an independent variable in the regression models.
The performance of the regression models was evaluated using the coefficient of determination (R2) and root mean square error (RMSE). For the SOC piecewise-linear regression model predicting the SOC error associated with the charging OCV–SOC table, the R2 and RMSE were 0.9267 and 0.2932%, respectively. For the SOC piecewise-linear regression model predicting the SOC error associated with the discharging OCV–SOC table, the corresponding R2 and RMSE were 0.9558 and 0.2164%, respectively. The SOC piecewise-linear regression models exhibited higher R2 values and lower RMSE values for the SOC errors associated with both the charging and discharging OCV–SOC tables than the linear regression models and reduced second-order polynomial regression models. Therefore, the SOC piecewise-linear regression models given by Equations (9) and (12) were selected as the final SOC error prediction models in this study.
Using the final regression models given by Equations (9) and (12), the SOC errors associated with the charging and discharging OCV–SOC tables were predicted for a given set of operating conditions. The absolute values of the two predicted SOC errors were then compared, and the OCV–SOC table with the smaller predicted absolute SOC error was selected for SOC correction. Specifically, the charging OCV–SOC table was selected when ∣Errorchg∣ < ∣Errordis∣, whereas the discharging OCV–SOC table was selected when ∣Errorchg∣ ≥ ∣Errordis∣.
The regression models were developed over the following ranges: a preceding discharge C-rate of 0.2–0.5C, a pre-charge SOC of 10–90%, a pre-charge rest time of 60–120 min, and a small-charge C-rate of 0.2–1C. The test temperature, small-charge amount, and post-charge rest time were fixed at 25 °C, 2% SOC, and 120 min, respectively. Therefore, the application of the proposed models was restricted to interpolation within the tested ranges of the regression-model input variables. The extrapolation performance of the regression models beyond these ranges was not evaluated in this study. The linear interpolation equation used for the OCV–SOC conversion is given by Equation (13):
Here, V is the cell voltage measured after the 120 min rest period following the 2% small charge. Vi and Vi+1 are two adjacent voltage values in the OCV–SOC table satisfying Vi ≤ V ≤ Vi+1, and SOCi and SOCi+1 are the SOC values corresponding to Vi and Vi+1, respectively. The linear interpolation in Equation (13) was applied independently to the charging and discharging OCV–SOC tables to obtain SOCOCV,chg and SOCOCV,dis, respectively. All stabilized voltage values analyzed in this study were within the voltage ranges of the corresponding OCV–SOC tables; therefore, SOC extrapolation was not required.
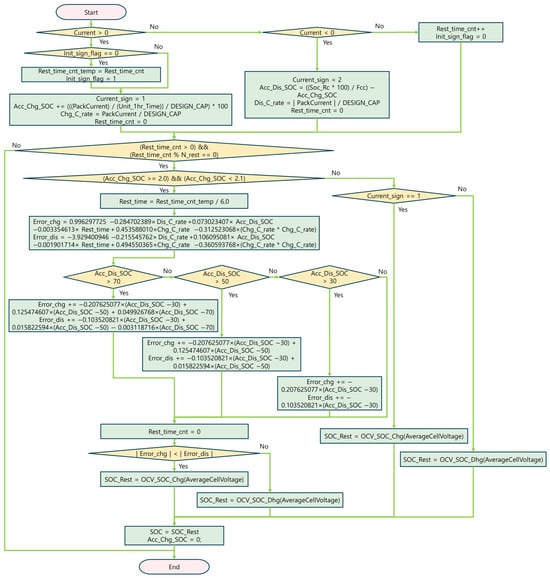
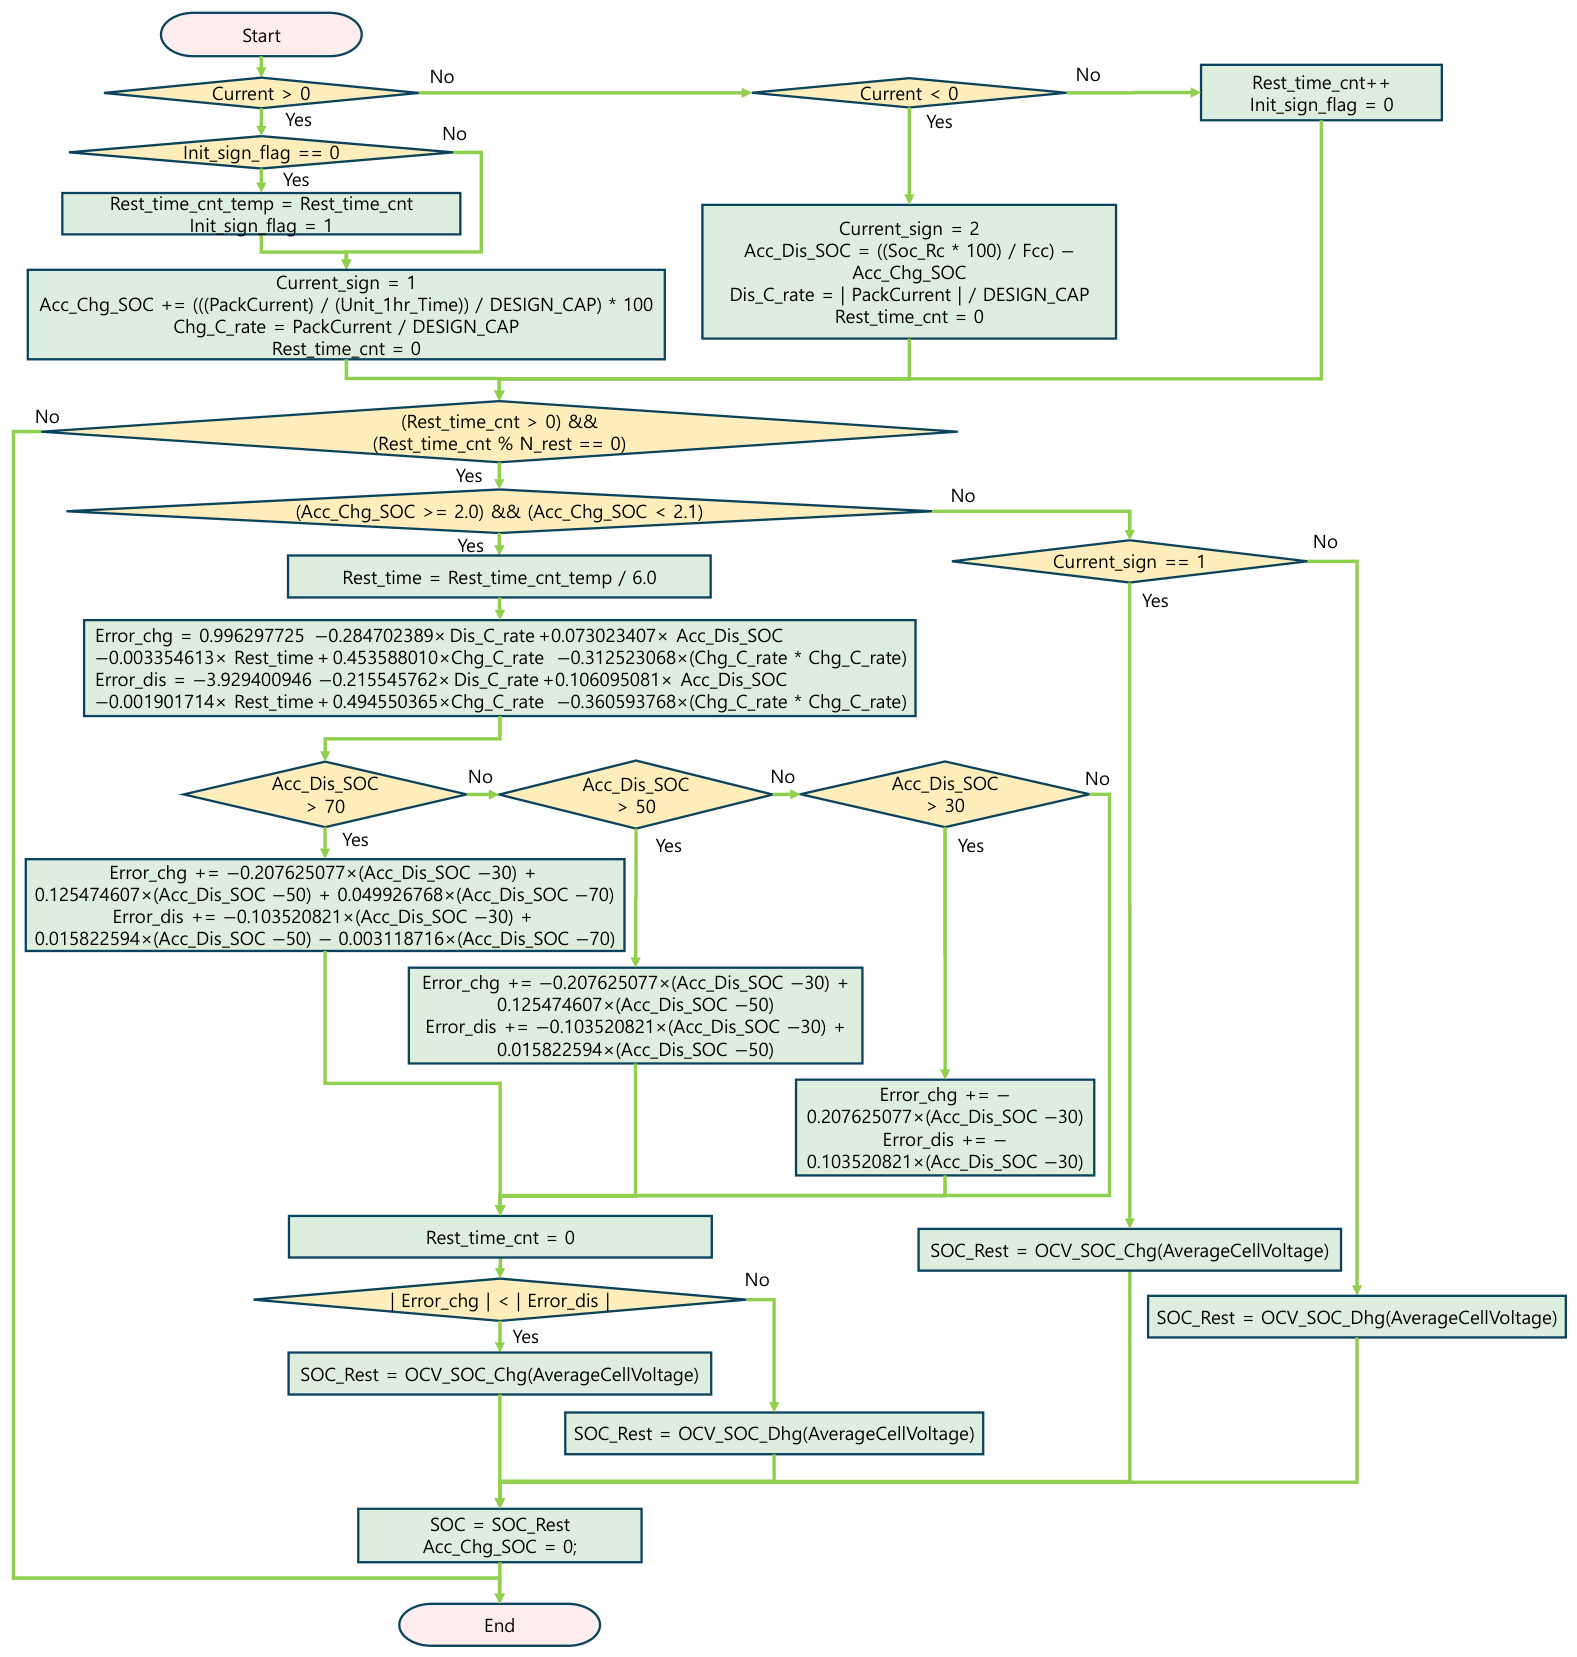
Figure 10 illustrates the flowchart of the proposed algorithm, which predicts the SOC errors associated with the charging and discharging OCV–SOC tables using the SOC piecewise-linear regression models and selects the appropriate OCV–SOC table for SOC correction by comparing the absolute values of the predicted SOC errors. The SOC based on Coulomb counting was calculated using Equation (14) as the ratio of the remaining capacity (Qremain) to the full charge capacity (QFCC). Here, Q_FCC represents the full charge capacity reflecting the current aging state of the battery rather than its nominal design capacity and may vary with battery degradation. Q_remain was updated by integrating the measured charge and discharge currents over time.
Figure 10.
Flowchart of the proposed OCV-based SOC correction algorithm using piecewise-linear regression models for SOC error prediction.
The algorithm shown in Figure 10 was designed to correct the SOC estimated by Coulomb counting using the stabilized cell voltage during rest periods. First, the battery operating state was classified as charging, discharging, or resting according to the direction of the measured current. A negative current was defined as the discharging state, a positive current as the charging state, and zero current as the resting state. During the resting state, the elapsed rest time was accumulated. The algorithm was executed at 10 s intervals, and Rest_time_cnt was incremented by one at each interval during the resting state. The count Nrest corresponding to the specified post-charge rest time Tpost [min] was calculated as Nrest = Tpost × 60/10. Therefore, Nrest = 720 for a rest time of 120 min, whereas Nrest = 180 for a rest time of 30 min. In addition, Rest_time_cnt_temp/6.0 in Figure 10 converts the count at 10 s intervals into the pre-charge rest time in minutes.
When a charging current occurred during a rest period following discharge, the accumulated rest time prior to the small charge was stored. During the subsequent charging process, the accumulated charged SOC (Acc_Chg_SOC) and the small-charge C-rate were calculated using Coulomb counting. When the charging process was completed and the battery re-entered the resting state, the post-charge rest time was accumulated.
When Rest_time_cnt reached Nrest, corresponding to the specified SOC correction time after the small charge, the accumulated charge was evaluated to determine whether it satisfied the 2% SOC small-charge condition defined in this study. For model development and independent validation, Nrest = 720, corresponding to 120 min, was used, whereas the values corresponding to 30, 60, 90, and 120 min were applied in the post-charge rest-time performance analysis. If the 2% small-charge condition was satisfied, the previous discharge C-rate, SOC before the small charge, pre-charge rest time, and small-charge C-rate were used as inputs to the SOC piecewise-linear regression models in Equations (9) and (12) to predict Errorchg and Errordis, respectively. At this stage, the hinge terms associated with the knots at 30%, 50%, and 70% were sequentially applied according to the SOC before the small charge to calculate the corresponding SOC errors. The absolute values of the two predicted errors were then compared, and the OCV–SOC table corresponding to the smaller predicted absolute SOC error was selected.
The stabilized cell voltage at the end of the post-charge rest period was then applied to the selected OCV–SOC table to determine the OCV-based SOC (SOCOCV). The current SOC was subsequently updated using SOCOCV, thereby compensating for the SOC error accumulated during Coulomb counting. In contrast, if the accumulated charge did not satisfy the 2% small-charge condition, either the charging or discharging OCV–SOC table was selected according to the direction of the most recent current, and the SOC was corrected accordingly.
3. Results and Discussion
3.1. Independent Validation Results
To independently validate the OCV–SOC table selection performance of the proposed algorithm, 15 new operating-profile experiments were conducted separately from the experiments used to develop the regression models. The newly acquired experimental data were used exclusively for validation and were not used for regression coefficient estimation, model structure determination, or model fitting. Of these, 13 profiles were designed to assess the consistency of the OCV–SOC table selection results in repeated tests using newly acquired data at the same factor levels as those used for regression-model development. The remaining Profiles 5 and 11 incorporated the intermediate conditions of a preceding discharge C-rate of 0.35C and a pre-charge rest time of 90 min, which were not used for model development. Thus, the independent validation profiles were designed to evaluate both the consistency of the selection results for newly acquired data from repeated tests at the original factor levels and the applicability of the model to intermediate operating conditions not included in model development.
For each validation profile, the SOC errors associated with the charging and discharging OCV–SOC tables were separately predicted using the SOC piecewise-linear regression models in Equations (9) and (12), respectively. The absolute values of the two predicted SOC errors were then compared to select the OCV–SOC table expected to produce the smaller absolute SOC error. This predicted selection was compared with the table selection determined from the absolute SOC errors measured in the newly conducted experiments.
Additionally, for comparison with the bilinear interpolation method reported in a previous study [21], the SOC errors associated with the charging and discharging OCV–SOC tables were calculated using the bilinear-interpolation equations, Equations (15)–(18), derived in [21] and presented in Table 9. Here, x denotes the pre-charge rest time [min], SOC denotes the target SOC [%] immediately before the 2% small charge, and y denotes the calculated SOC error [%]. For 50% ≤ SOC ≤ 100%, Equations (15) and (16) were applied, whereas for 0% ≤ SOC < 50%, Equations (17) and (18) were applied. The absolute values of the resulting two SOC errors were then compared, and the OCV–SOC table yielding the smaller absolute SOC error was selected.
Table 9.
Bilinear interpolation equations used to calculate the SOC errors associated with the charging and discharging OCV–SOC tables.
Table 10 presents the experimental conditions and measured results for the 15 operating profiles newly tested for independent validation. The reference SOC (SOCref) for each profile was calculated by Coulomb counting according to Equation (1), using the cell-specific capacity (Qcell), accumulated discharge capacity (Qdis), and small-charge capacity (Qchg). Following completion of the small charge, the cells were rested for 2 h, and the stabilized voltage measured at the end of the rest period was applied separately to the charging and discharging OCV–SOC tables to calculate the corresponding SOC values. The measured SOC error associated with each OCV–SOC table was calculated according to Equations (2) and (3) as the difference between SOCref and the SOC obtained from the corresponding table. The SOC errors were calculated using the unrounded SOC values and subsequently rounded for presentation.
Table 10.
Experimental conditions and measured results for the independent validation profiles.
Table 11 presents the measured SOC errors, the SOC errors predicted using the SOC piecewise-linear regression models, the SOC errors calculated using the bilinear interpolation method, and the OCV–SOC table selection results obtained using the proposed model for the 15 independent validation profiles. For Profiles 1–3 at 90% SOC and Profiles 10–12 at 30% SOC, both the measured results and the predictions of the proposed model showed that the absolute SOC error was smaller when the discharging OCV–SOC table was applied. By contrast, for Profiles 4–9 at 70% and 50% SOC and Profiles 13–15 at 10% SOC, both the measured and predicted results showed that the absolute SOC error was smaller when the charging OCV–SOC table was applied. Therefore, the proposed model selected the same OCV–SOC table as that indicated by the measured results for all 15 validation profiles.
Table 11.
Comparison of measured and predicted SOC errors and OCV–SOC table selection results for the independent validation profiles (boldface values indicate the smaller absolute SOC error).
The bilinear interpolation method selected the same OCV–SOC table as that indicated by the measured results for 10 profiles—Profiles 1–3, 6–9, and 13–15—whereas it selected a different table for five profiles—Profiles 4, 5, and 10–12. Accordingly, the agreement rates of the OCV–SOC table selection results were 100% (15/15) for the proposed model and 66.7% (10/15) for the bilinear interpolation method.
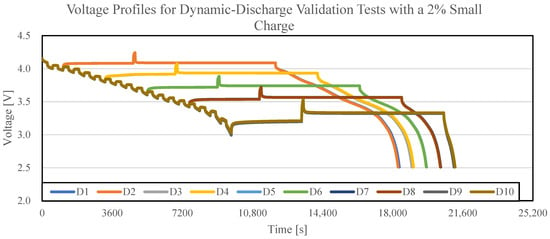
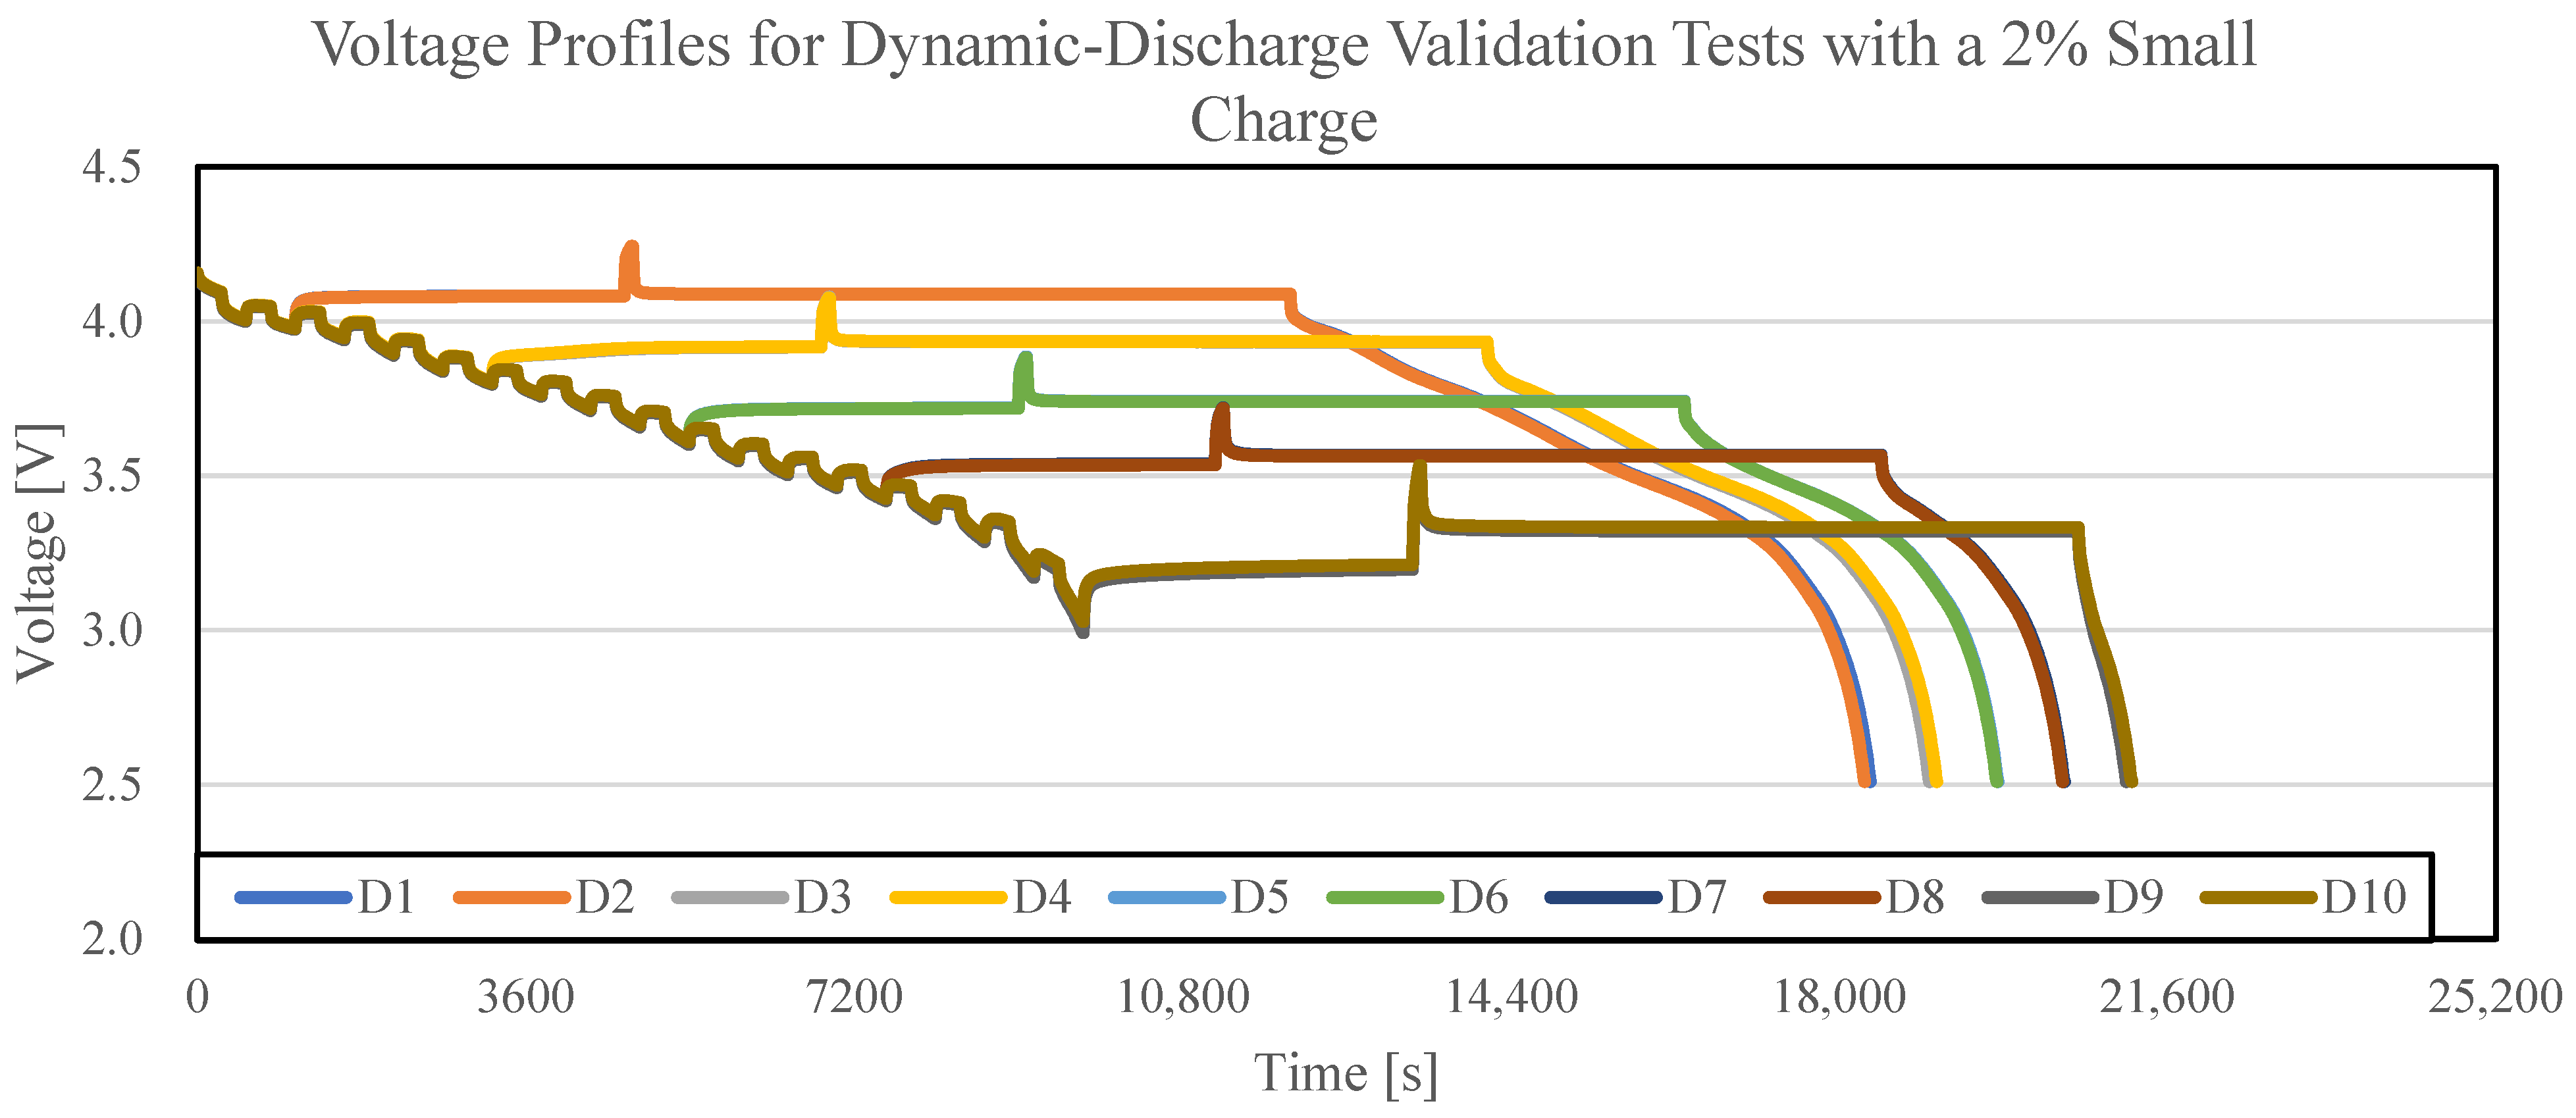
Figure 11 shows the cell-voltage profiles of the dynamic discharge validation profiles D1–D10. The dynamic discharge profiles were constructed by alternately applying constant-current discharge segments of 0.2C and 0.5C for equal durations, and the cells were discharged to nominal target SOC levels of 90%, 70%, 50%, 30%, and 10%. These nominal target SOC levels were defined based on the design capacity of 4900 mAh, which was also used to define 1C as 4900 mA. Two cells were tested at each SOC level. The pre-charge rest time, small-charge C-rate, small-charge amount, and post-charge rest time were set to 60 min, 1C, 95.36 mAh (corresponding to 2% of the common reference capacity of 4768.05 mAh), and 120 min, respectively. Because the 0.2C and 0.5C discharge segments were applied alternately for equal durations, the time-weighted average discharge C-rate was 0.35C. The time-weighted average discharge C-rate and the nominal target SOC were used as the Dis_C_rate and SOC inputs, respectively, to the SOC piecewise-linear regression models in Equations (9) and (12). The cell-specific reference SOC (SOCref) was calculated separately using Equation (1) and was used only to determine the measured SOC errors.
Figure 11.
Cell-voltage profiles for the dynamic-discharge validation tests with a 2% small charge.
Table 12 presents the experimental conditions and measured results for the 10 dynamic discharge validation profiles shown in Figure 11. As in Table 10, the reference SOC (SOCref) for each profile was calculated by Coulomb counting according to Equation (1), using the cell-specific capacity (Qcell), accumulated discharge capacity (Qdis), and small-charge capacity (Qchg). Following completion of the small charge, the cells were rested for 2 h, and the stabilized voltage measured at the end of the rest period was applied separately to the charging and discharging OCV–SOC tables to calculate the corresponding SOC values. The measured SOC error associated with each OCV–SOC table was calculated according to Equations (2) and (3) as the difference between SOCref and the SOC obtained from the corresponding table. The SOC errors were calculated using the unrounded SOC values and subsequently rounded for presentation.
Table 12.
Experimental conditions and measured results for the dynamic discharge validation profiles.
Table 13 presents the measured SOC errors, the SOC errors predicted using the SOC piecewise-linear regression models, the SOC errors calculated using the bilinear interpolation method, and the OCV–SOC table selection results obtained using the proposed model for the 10 dynamic validation profiles. For Profiles D1–D2 at 90% SOC and Profiles D7–D8 at 30% SOC, both the measured results and the predictions of the proposed model showed that the absolute SOC error was smaller when the discharging OCV–SOC table was applied. By contrast, for Profiles D3–D6 at 70% and 50% SOC and Profiles D9–D10 at 10% SOC, both the measured and predicted results showed that the absolute SOC error was smaller when the charging OCV–SOC table was applied. Therefore, the proposed model selected the same OCV–SOC table as that indicated by the measured results for all 10 dynamic validation profiles.
Table 13.
Comparison of measured and predicted SOC errors and OCV–SOC table selection results for the dynamic discharge validation profiles (boldface values indicate the smaller absolute SOC error).
The bilinear interpolation method selected the same OCV–SOC table as that indicated by the measured results for eight profiles—Profiles D1–D6 and D9–D10—whereas it selected a different table for Profiles D7 and D8. Accordingly, the agreement rates of the OCV–SOC table selection results were 100% (10/10) for the proposed model and 80% (8/10) for the bilinear interpolation method.
Table 14 compares the absolute SOC errors of the proposed and baseline methods at different post-charge rest times under the dynamic discharge conditions. In the proposed method, the OCV–SOC table to be applied to each profile was selected by comparing the absolute values of the charging and discharging SOC errors predicted using Equations (9) and (12). Because the post-charge rest time was not included as an input variable in the regression models, the OCV–SOC table selected for each profile did not change with the rest time. However, the cell voltages measured at 30, 60, 90, and 120 min were separately applied to the selected OCV–SOC table to calculate the actual SOC correction error at each rest time. The baseline method selected the OCV–SOC table based on the direction of the most recent current before the rest period. Because a 2% small charge was applied immediately before the rest period in all dynamic validation profiles, the charging OCV–SOC table was applied in the baseline method.
Table 14.
Comparison of absolute SOC errors and MAEs between the proposed method and the current-direction-based baseline method at different post-charge rest times under dynamic discharge conditions.
The mean absolute errors (MAEs) of the proposed method were 0.648%, 0.659%, 0.660%, and 0.662% at post-charge rest times of 30, 60, 90, and 120 min, respectively. In contrast, the corresponding MAEs of the baseline method were 1.195%, 1.210%, 1.209%, and 1.211%, respectively. Thus, the proposed method reduced the MAE by 0.547%, 0.551%, 0.549%, and 0.549%, respectively, compared with the baseline method, corresponding to relative reductions of 45.8%, 45.5%, 45.4%, and 45.3%, respectively.
The MAE of the proposed method ranged from 0.648% to 0.662% over the post-charge rest-time range of 30–120 min, with a maximum difference of only 0.014%. In addition, at each rest time, the OCV–SOC table selected by the proposed model agreed with the table yielding the smaller measured absolute SOC error for all 10 dynamic validation profiles. The MAE at 30 min was 0.014% lower than that at 120 min; however, this difference was very small and indicates that the performance remained practically comparable over the 30–120 min range rather than that the accuracy at 30 min was intrinsically superior. Therefore, under the dynamic discharge validation conditions used in this study, a 2 h post-charge rest period was not necessary, and both the OCV–SOC table selection results and SOC correction accuracy were maintained even when SOC correction was performed at 30 min. However, these results are limited to the cells, temperature, and dynamic operating conditions considered in this study, and the performance at rest times shorter than 30 min requires further validation.
3.2. Comparison with the Baseline Method
To quantify the reduction in SOC correction error achieved by the proposed OCV–SOC table selection method, its performance was compared with that of the last-current-direction-based method used as the baseline in a previous study [21], hereafter referred to as the baseline method. In the baseline method, the charging OCV–SOC table is applied when the most recent current corresponds to charging, whereas the discharging OCV–SOC table is applied when it corresponds to discharging. Because a small charge was applied immediately before the rest period in all 15 independent validation profiles, the baseline method selected the charging OCV–SOC table for all profiles. In contrast, the proposed method selected the discharging OCV–SOC table for Profiles 1–3 and Profiles 10–12 and the charging OCV–SOC table for Profiles 4–9 and Profiles 13–15.
For the six profiles (Profiles 1–3 and 10–12) in which the proposed method selected a different OCV–SOC table from the baseline method, the measured SOC errors in Table 11 were compared. The mean absolute SOC error obtained using the charging OCV–SOC table selected by the baseline method was 1.732%, whereas that obtained using the discharging OCV–SOC table selected by the proposed method was 0.657%. This represents an absolute reduction of 1.075% and a relative reduction of approximately 62.1% compared with the baseline method.
For Profiles 4–9 and Profiles 13–15, both the baseline and proposed methods selected the charging OCV–SOC table; therefore, no reduction in SOC error resulted from a change in table selection. Nevertheless, these results demonstrate that the proposed method appropriately retained the charging OCV–SOC table under these conditions without unnecessarily changing to the discharging OCV–SOC table. In particular, the charging OCV–SOC table was retained for Profiles 13–15 at 10% SOC. When all 15 independent validation profiles were considered, the mean absolute SOC error decreased from 1.169% with the baseline method to 0.739% with the proposed method. This corresponds to an absolute reduction of 0.430% and a relative reduction of approximately 36.8%. In addition, in the dynamic discharge validation presented in Table 14, the proposed method achieved relative reductions in MAE of 45.3–45.8% compared with the baseline method over the post-charge rest-time range of 30–120 min.
Although some quantitative differences were observed between the predicted and measured SOC errors, the OCV–SOC table selections based on the relative magnitudes of the absolute SOC errors were consistent for all 15 independent validation profiles. At the SOC levels of 70% and 30%, the predicted and measured table selections also agreed for the newly acquired validation data. In addition, the same selection results were obtained for Profiles 5 and 11 under the intermediate conditions of a 0.35C discharge rate and a 90 min pre-charge rest period. These results demonstrate that, within the investigated experimental range, the proposed model provides consistent OCV–SOC table selection for newly acquired repeated data and is applicable through interpolation to intermediate operating conditions not included in model development. However, for Profile 15, the difference between the measured absolute SOC errors obtained using the charging and discharging OCV–SOC tables was 0.23%, which was the smallest among all validation profiles. Therefore, this profile should be interpreted as being relatively closer to the table-selection boundary than the other conditions.
4. Conclusions
This study proposed a regression-based OCV–SOC table selection method to minimize OCV-based SOC correction errors under conditions in which a 2% small charge occurs during a rest period following discharge. Analysis of the charging and discharging OCV–SOC characteristics showed that the OCV hysteresis varied with SOC, with a particularly pronounced difference between the charging and discharging OCVs in the low-SOC region. Furthermore, even when the same 2% small charge was applied after discharge, the SOC errors resulting from the application of the charging and discharging OCV–SOC tables varied depending on the SOC and operating conditions.
Regression analysis was performed using a total of 60 experimental conditions, with the preceding discharge C-rate, SOC, pre-charge rest time, and small-charge C-rate as independent variables and the SOC errors obtained using the charging and discharging OCV–SOC tables as the respective dependent variables. The performances of the linear regression models, reduced second-order polynomial regression models without interaction terms, and SOC piecewise-linear regression models were compared. To represent the interval-dependent changes in the slope of the SOC error with SOC, hinge functions with internal knots at SOC levels of 30%, 50%, and 70% were incorporated. The SOC piecewise-linear regression models achieved the highest R2 values and the lowest RMSE values. For the final models, the R2 and RMSE were 0.9267 and 0.2932%, respectively, for predicting the SOC error associated with the charging OCV–SOC table, and 0.9558 and 0.2164%, respectively, for predicting the SOC error associated with the discharging OCV–SOC table.
In the proposed method, the SOC errors associated with the charging and discharging OCV–SOC tables were independently predicted using the SOC piecewise-linear regression models in Equations (9) and (12). The absolute values of the two predicted errors were then compared, and the OCV–SOC table expected to produce the smaller absolute SOC error was selected for SOC correction. To independently validate the performance of the proposed method, 15 operating profiles consisting of newly acquired experimental data that were not used for regression coefficient estimation, model structure determination, or model fitting were evaluated. Of these, 13 profiles used newly acquired data under the same factor-level conditions as those used for model development, whereas Profiles 5 and 11 incorporated the intermediate conditions of a 0.35C discharge rate and a 90 min pre-charge rest period, which were not used for model development.
The OCV–SOC table selected based on the predicted absolute SOC errors agreed with that selected based on the measured absolute SOC errors for all 15 independent validation profiles. The discharging OCV–SOC table was selected for Profiles 1–3 at 90% SOC and Profiles 10–12 at 30% SOC, whereas the charging OCV–SOC table was selected for Profiles 4–9 at 70% and 50% SOC and Profiles 13–15 at 10% SOC. In contrast, the bilinear interpolation method selected the same OCV–SOC table as that indicated by the measured results for 10 of the 15 profiles, corresponding to an agreement rate of 66.7%.
The applicability of the proposed method under dynamic discharge conditions was also evaluated using 10 profiles in which 0.2C and 0.5C discharge segments were applied alternately. The proposed model selected the OCV–SOC table yielding the smaller measured absolute SOC error for all 10 dynamic validation profiles, resulting in an agreement rate of 100%, whereas the agreement rate of the bilinear interpolation method was 80% (8/10). In the dynamic validation, the discharging OCV–SOC table was selected for Profiles D1–D2 and D7–D8, whereas the charging OCV–SOC table was selected for Profiles D3–D6 and D9–D10.
Compared with the baseline method, which selects the OCV–SOC table based on the direction of the most recent current, the mean absolute SOC error for the six independent validation profiles (Profiles 1–3 and Profiles 10–12) in which the two methods selected different tables decreased from 1.732% with the baseline method to 0.657% with the proposed method. This represents an absolute reduction of 1.075% and a relative reduction of approximately 62.1%. Across all 15 independent validation profiles, the mean absolute SOC error decreased from 1.169% with the baseline method to 0.739% with the proposed method, corresponding to an absolute reduction of 0.430% and a relative reduction of approximately 36.8%.
The effect of the post-charge rest time was also evaluated under the dynamic discharge validation conditions. At post-charge rest times of 30, 60, 90, and 120 min, the MAEs of the proposed method were 0.648%, 0.659%, 0.660%, and 0.662%, respectively, whereas those of the baseline method were 1.195%, 1.210%, 1.209%, and 1.211%, respectively. The proposed method achieved relative reductions of 45.3–45.8% compared with the baseline method, and the maximum difference in the MAE of the proposed method over the 30–120 min range was only 0.014%. Therefore, under the dynamic discharge validation conditions used in this study, a 2 h post-charge rest period was not necessary, and both the OCV–SOC table selection results and SOC correction accuracy were maintained even when SOC correction was performed at 30 min.
Therefore, under post-discharge small-charge conditions, selecting an OCV–SOC table by considering the SOC, preceding discharge C-rate, pre-charge rest time, and small-charge C-rate, rather than relying solely on the direction of the most recent current, can effectively reduce the SOC correction error. The independent and dynamic validation results demonstrate that, within the investigated cells and experimental ranges, the proposed OCV–SOC table selection method provides consistent selection performance for newly acquired repeated-test data and intermediate operating conditions. Further independent validation using different battery cells, temperatures, aging states, small-charge amounts, and dynamic load conditions is required to evaluate the applicability range and generalization capability of the proposed model.
Funding
This work was supported by the 2026 Far East University Research Grant (FEU2026S05).
Institutional Review Board Statement
Not applicable.
Informed Consent Statement
Not applicable.
Data Availability Statement
The original contributions presented in this study are included in the article. Further inquiries can be directed to the corresponding author.
Acknowledgments
During the preparation of this manuscript, the author used ChatGPT based on the GPT-5 model (OpenAI, San Francisco, CA, USA) solely for English translation and language editing. The author independently conducted the research and verified all scientific content, data analyses, and conclusions. The author takes full responsibility for the content of this publication.
Conflicts of Interest
The author declares no conflicts of interest. The funder had no role in the design of the study; in the collection, analyses, or interpretation of data; in the writing of the manuscript; or in the decision to publish the results.
Abbreviations
The following abbreviations are used in this manuscript:
| BMS | Battery Management System |
| CC | Constant Current |
| ECM | Equivalent Circuit Model |
| ESS | Energy Storage System |
| EV | Electric Vehicle |
| HEV | Hybrid Electric Vehicle |
| LIB | Lithium-Ion Battery |
| OCV | Open-Circuit Voltage |
| RMSE | Root Mean Square Error |
| SOC | State of Charge |
| SOH | State of Health |
References
- Khan, F.M.N.U.; Rasul, M.G.; Sayem, A.S.M.; Mandal, N.K. Design and optimization of lithium-ion battery as an efficient energy storage device for electric vehicles: A comprehensive review. J. Energy Storage 2023, 71, 108033. [Google Scholar] [CrossRef] [Scilit]
- Lucà Trombetta, G.; Leonardi, S.G.; Aloisio, D.; Andaloro, L.; Sergi, F. Lithium-ion batteries on board: A review on their integration for enabling the energy transition in shipping industry. Energies 2024, 17, 1019. [Google Scholar] [CrossRef] [Scilit]
- Figini, E.; Paolone, M. Achieving dispatchability in data centers: Carbon and cost-aware sizing of energy storage and local photovoltaic generation. Sustain. Energy Grids Netw. 2025, 43, 101920. [Google Scholar] [CrossRef] [Scilit]
- Lelie, M.; Braun, T.; Knips, M.; Nordmann, H.; Ringbeck, F.; Zappen, H.; Sauer, D.U. Battery management system hardware concepts: An overview. Appl. Sci. 2018, 8, 534. [Google Scholar] [CrossRef] [Scilit]
- Waseem, M.; Ahmad, M.; Parveen, A.; Suhaib, M. Battery technologies and functionality of battery management system for EVs: Current status, key challenges, and future prospectives. J. Power Sources 2023, 580, 233349. [Google Scholar] [CrossRef] [Scilit]
- Ng, K.S.; Moo, C.-S.; Chen, Y.-P.; Hsieh, Y.-C. Enhanced Coulomb counting method for estimating state-of-charge and state-of-health of lithium-ion batteries. Appl. Energy 2009, 86, 1506–1511. [Google Scholar] [CrossRef] [Scilit]
- Zhang, C.; Jiang, J.; Zhang, L.; Liu, S.; Wang, L.; Loh, P.C. A generalized SOC-OCV model for lithium-ion batteries and the SOC estimation for LNMCO battery. Energies 2016, 9, 900. [Google Scholar] [CrossRef] [Scilit]
- Lee, S.J.; Kim, J.H.; Lee, J.M.; Cho, B.H. The state and parameter estimation of an Li-ion battery using a new OCV-SOC concept. In Proceedings of the 2007 IEEE Power Electronics Specialists Conference (PESC 2007), Orlando, FL, USA, 17–21 June 2007; pp. 2799–2803. [Google Scholar] [CrossRef] [Scilit]
- Tao, Z.; Zhao, Z.; Wang, C.; Huang, L.; Jie, H.; Li, H.; Hao, Q.; Zhou, Y.; See, K.Y. State of charge estimation of lithium batteries: Review for equivalent circuit model methods. Measurement 2024, 236, 115148. [Google Scholar] [CrossRef] [Scilit]
- Hossain, M.; Haque, M.E.; Arif, M.T. Kalman filtering techniques for the online model parameters and state of charge estimation of the Li-ion batteries: A comparative analysis. J. Energy Storage 2022, 51, 104174. [Google Scholar] [CrossRef] [Scilit]
- Shrivastava, P.; Soon, T.K.; Idris, M.Y.I.B.; Mekhilef, S. Overview of model-based online state-of-charge estimation using Kalman filter family for lithium-ion batteries. Renew. Sustain. Energy Rev. 2019, 113, 109233. [Google Scholar] [CrossRef] [Scilit]
- Waag, M.A.; Fleischer, C.; Sauer, D.U. A study of the open circuit voltage characterization technique and hysteresis assessment of lithium-ion cells. J. Power Sources 2015, 295, 99–107. [Google Scholar] [CrossRef] [Scilit]
- Yu, P.; Wang, S.; Yu, C.; Shi, W.; Li, B. Study of hysteresis voltage state dependence in lithium-ion battery and a novel asymmetric hysteresis modeling. J. Energy Storage 2022, 51, 104492. [Google Scholar] [CrossRef] [Scilit]
- Antonucci, V.; Artale, G.; Brunaccini, G.; Caravello, G.; Cataliotti, A.; Cosentino, V.; Di Cara, D.; Ferraro, M.; Guaiana, S.; Panzavecchia, N.; et al. Li-ion battery modeling and state of charge estimation method including the hysteresis effect. Electronics 2019, 8, 1324. [Google Scholar] [CrossRef] [Scilit]
- Zhou, Z.; Cui, Y.; Kong, X.; Li, J.; Zheng, Y. A fast capacity estimation method based on open circuit voltage estimation for LiNixCoyMn1-x-y battery assessing in electric vehicles. J. Energy Storage 2020, 32, 101830. [Google Scholar] [CrossRef] [Scilit]
- Ko, C.-J.; Chen, K.-C. Using tens of seconds of relaxation voltage to estimate open circuit voltage and state of health of lithium ion batteries. Appl. Energy 2024, 357, 122488. [Google Scholar] [CrossRef] [Scilit]
- Soto, A.; Berrueta, A.; Mateos, M.; Sanchis, P.; Ursúa, A. Impact of micro-cycles on the lifetime of lithium-ion batteries: An experimental study. J. Energy Storage 2022, 55, 105343. [Google Scholar] [CrossRef] [Scilit]
- Chidambaram, R.K.; Chatterjee, D.; Barman, B.; Das, P.P.; Taler, D.; Taler, J.; Sobota, T. Effect of regenerative braking on battery life. Energies 2023, 16, 5303. [Google Scholar] [CrossRef] [Scilit]
- Liu, J.; Liu, Z.; Wu, Y.; Chen, X.; Xiao, H.; Zhang, L. Impact of climate on photovoltaic battery energy storage system optimization. Renew. Energy 2022, 191, 625–638. [Google Scholar] [CrossRef] [Scilit]
- Song, H.; Kim, J. Method for applying OCV tables to enhance SOC accuracy after small discharges. Front. Energy Res. 2026, 13, 1724766. [Google Scholar] [CrossRef] [Scilit]
- Song, H. OCV SOC application and correction method after small charge to improve lithium-ion battery system SOC accuracy. J. Energy Eng. 2026, 35, 12–28. [Google Scholar] [CrossRef] [Scilit]
- Wang, Y.; Zhao, L.; Cheng, J.; Zhou, J.; Wang, S. A state of charge estimation method of lithium-ion battery based on fused open circuit voltage curve. Appl. Sci. 2020, 10, 1264. [Google Scholar] [CrossRef] [Scilit]
- Hastie, T.; Tibshirani, R.; Friedman, J. The Elements of Statistical Learning: Data Mining, Inference, and Prediction, 2nd ed.; Springer: New York, NY, USA, 2009. [Google Scholar] [CrossRef]

Disclaimer/Publisher’s Note: The statements, opinions and data contained in all publications are solely those of the individual author(s) and contributor(s) and not of MDPI and/or the editor(s). MDPI and/or the editor(s) disclaim responsibility for any injury to people or property resulting from any ideas, methods, instructions or products referred to in the content. |
© 2026 by the author. Licensee MDPI, Basel, Switzerland. This article is an open access article distributed under the terms and conditions of the Creative Commons Attribution (CC BY) license.