


Abstract
Lithium-ion batteries (LIBs) can undergo thermal runaway (TR) under thermal abuse, and high-nickel LIBs face more severe safety challenges. Therefore, early warning of TR is crucial for the safe operation of LIBs. Overheating-induced TR experiments were conducted on 15 Ah NCM811 LIBs at different states of charge (SOCs, 10–100%), with synchronous monitoring of expansion force, temperature, voltage, and characteristic gases (CO, CO2, HF, and H2). Based on signals variations, five characteristic moments were defined, dividing TR into five stages: abnormal expansion-force increase (tabn), cell venting (tV), first gas detection (tG), internal short circuit (tISC), and TR (tTR). As SOC increased, deeper cathode delithiation and anode lithiation accelerated internal reactions, shifting all moments earlier. The expansion-force signal enabled the earliest anomaly identification, up to 1275 s before TR onset, while CO detection within 30 s after venting provided chemical confirmation. Voltage signals accurately indicated ISC, and temperature signals directly reflected the essence of TR. Consequently, a three-level early-warning strategy was proposed: Level 1 (dF/dt > 1 N/s), Level 2 (sequential force–gas confirmation), and Level 3 (“voltage + temperature” with duration constraints). The thresholds are SOC-independent, offering a reference for engineering deployment in high-nickel pouch LIBs.
1. Introduction
Lithium-ion batteries (LIBs) have been widely used in electric vehicles and energy-storage systems due to their high energy density, long cycle life, and low self-discharge rate [1,2]. However, under thermal, electrical or mechanical abuse conditions, intense exothermic chain reactions can be triggered inside the cell [3,4], leading to irreversible thermal runaway (TR), which may result in severe incidents such as fire and explosions [5,6]. To address these safety concerns, three main technological approaches have been proposed, including developing pre-TR early-warning technologies [7], enhancing the intrinsic resistance of LIBs to TR [8] and improving mitigation after TR [9]. Among these, early-warning technologies play a critical role in identifying and responding to abnormal signals prior to the onset of TR, thereby providing a crucial time window for protective actions and ensuring personnel evacuation [10,11].
TR is a chain-reaction process involving accumulated exothermic side reactions and accelerating heat release [12], typically accompanied by multidimensional signal variations [13,14,15] such as voltage, temperature, gas emissions, expansion force and impedance. Monitoring the evolution of these characteristic signals and constructing corresponding early-warning models have become the mainstream approach to early-warning systems for TR. According to the number of signals employed, early-warning studies can be classified into two main categories: warning strategies based on a single signal and those based on multidimensional signals. Zhong et al. [16] conducted TR experiments on 18,650 LIBs, observing distinct voltage drops occurring 127–409 s prior to the onset of TR. Jin et al. [17] reported a technique for detecting micrometer-scale lithium dendrites based on H2 monitoring, which achieved an early-warning response 834 s prior to TR in LFP pouch cells. By using data obtained from embedded thermocouples, Jia et al. [18] established an empirical correlation between the cell surface temperature and the internal temperature, and further developed an external temperature-based warning method by setting 80 °C for electrolyte evaporation and 100 °C for solid electrolyte interphase (SEI) decomposition as two-level warning thresholds. In the thermal-abuse studies of LFP prismatic cells, Li et al. [19] found that irreversible side reactions had already commenced inside the cell when the change rate of expansion force reached 5 N/s, enabling an early warning approximately 11 min before TR and demonstrating its potential for very-early-stage warning. Although warning methods based on single signals possess advantages such as rapid response and simple system architecture, their practical application is often constrained by factors such as signal noise and variations in operating conditions, leading to limitations in accuracy, robustness and generalizability. Consequently, recent research has gradually shifted toward multidimensional signal warning strategy to improve reliability and adaptability. Yang et al. [20] conducted overheating experiments on LIBs for aviation applications and proposed a two-level warning strategy based on voltage plunge and characteristic gas concentration surge, achieving warning times of 357 s and 132 s at 90% state of charge (SOC). Meanwhile, Huang et al. [21] developed a physical correlation model between gas generation behavior and battery strain, revealing the deformation evolution of cells under different SOCs. Based on this, they further proposed a three-level warning strategy that integrates strain, expansion-force and temperature signals.
However, existing multi-signal warning studies have been conducted predominantly on cells with low- and medium-energy-density cathodes, such as LFP and NCM111. For example, refs. [19,21] established force- or strain-based warning methods without gas monitoring, whereas ref. [22] incorporated gas as one of several parallel Level 2 triggering conditions rather than as chemical confirmation of venting. High-nickel ternary cells such as LiNi0.8Co0.1Mn0.1O2 (NCM811) exhibit markedly different TR behaviors from LFP cells, including more violent lattice oxygen release from the cathode, distinct gas-generation pathways, and more violent venting and combustion, which may reshape both the evolution and the detectability of the characteristic signals. Nevertheless, for such cells, the synchronous evolution of multidimensional signals—particularly the coupling between expansion force and multi-component gas emissions (e.g., H2, CO, CO2, and HF)—has not been systematically characterized, and the intrinsic relationships between these signals and the underlying reaction mechanisms remain unclear. Moreover, most reported warning criteria are calibrated at a single SOC, leaving their applicability across the full SOC range unverified, and hierarchical warning strategies integrating mechanical and gas signals tailored to high-nickel systems are still lacking. These gaps hinder the development of reliable early-warning systems for high-energy-density LIBs.
Therefore, this study systematically conducted overheating-induced TR tests on NCM811 pouch cells at six SOCs (10%, 30%, 50%, 70%, 90%, and 100%) using a custom-built TR test platform. Simultaneously, multidimensional signals, including voltage, temperature, gas emissions (H2, CO, CO2 and HF) and expansion force, were collected in real time. Through signal analysis and feature extraction, the evolution patterns and correlation characteristics of these signals under different SOCs were identified, and the parameters and thresholds suitable for early warning were determined. Furthermore, relationships between the multidimensional signals and side-reaction mechanisms were established to elucidate the physicochemical nature of signal anomalies. On this basis, a hierarchical warning strategy suitable for NCM811 pouch LIBs, verified across a wide SOC range from 10% to 100%, was developed, accompanied by recommendations for warning response and intervention measures, thereby promoting the transition of battery safety management from passive protection to early warning.
2. Materials and Methods
2.1. Battery Samples
NCM811 pouch cells with a nominal capacity of 15 Ah were used in this study, and their detailed specifications are listed in Table 1. To ensure consistency, freshly manufactured cells underwent the same preconditioning procedure on a battery cycler. Three complete charge–discharge cycles were conducted in constant current-constant voltage (CC–CV) mode. The cells were charged at a constant current of 1 C until reaching the cut-off voltage of 4.2 V, followed by constant voltage charging at 4.2 V until the current decreased to 0.05 C. After a resting period of 5 min, the cells were discharged at a constant current of 1 C until reaching the cut-off voltage of 3.0 V. Upon completion of the preconditioning cycles, the cells were fully charged to 100% SOC at 1 C in CC–CV mode and then discharged at 1 C to the target SOCs of 10%, 30%, 50%, 70%, and 90%, respectively. Subsequently, all cells were allowed to rest for at least 24 h before testing to stabilize their voltage and internal state [20].
Table 1.
Detailed specifications of NCM811 pouch LIBs.
2.2. Experimental Apparatus and Procedures
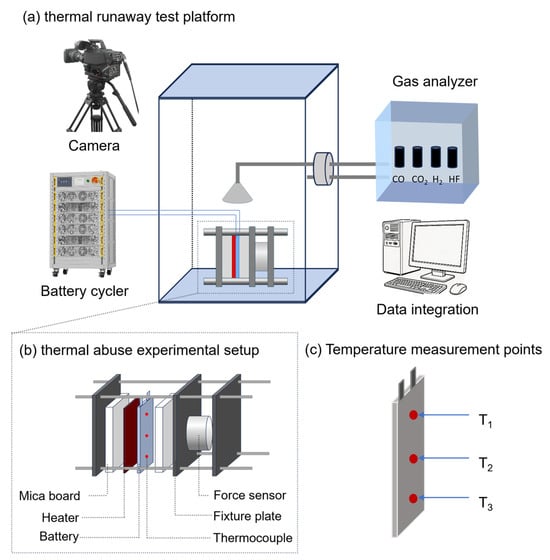
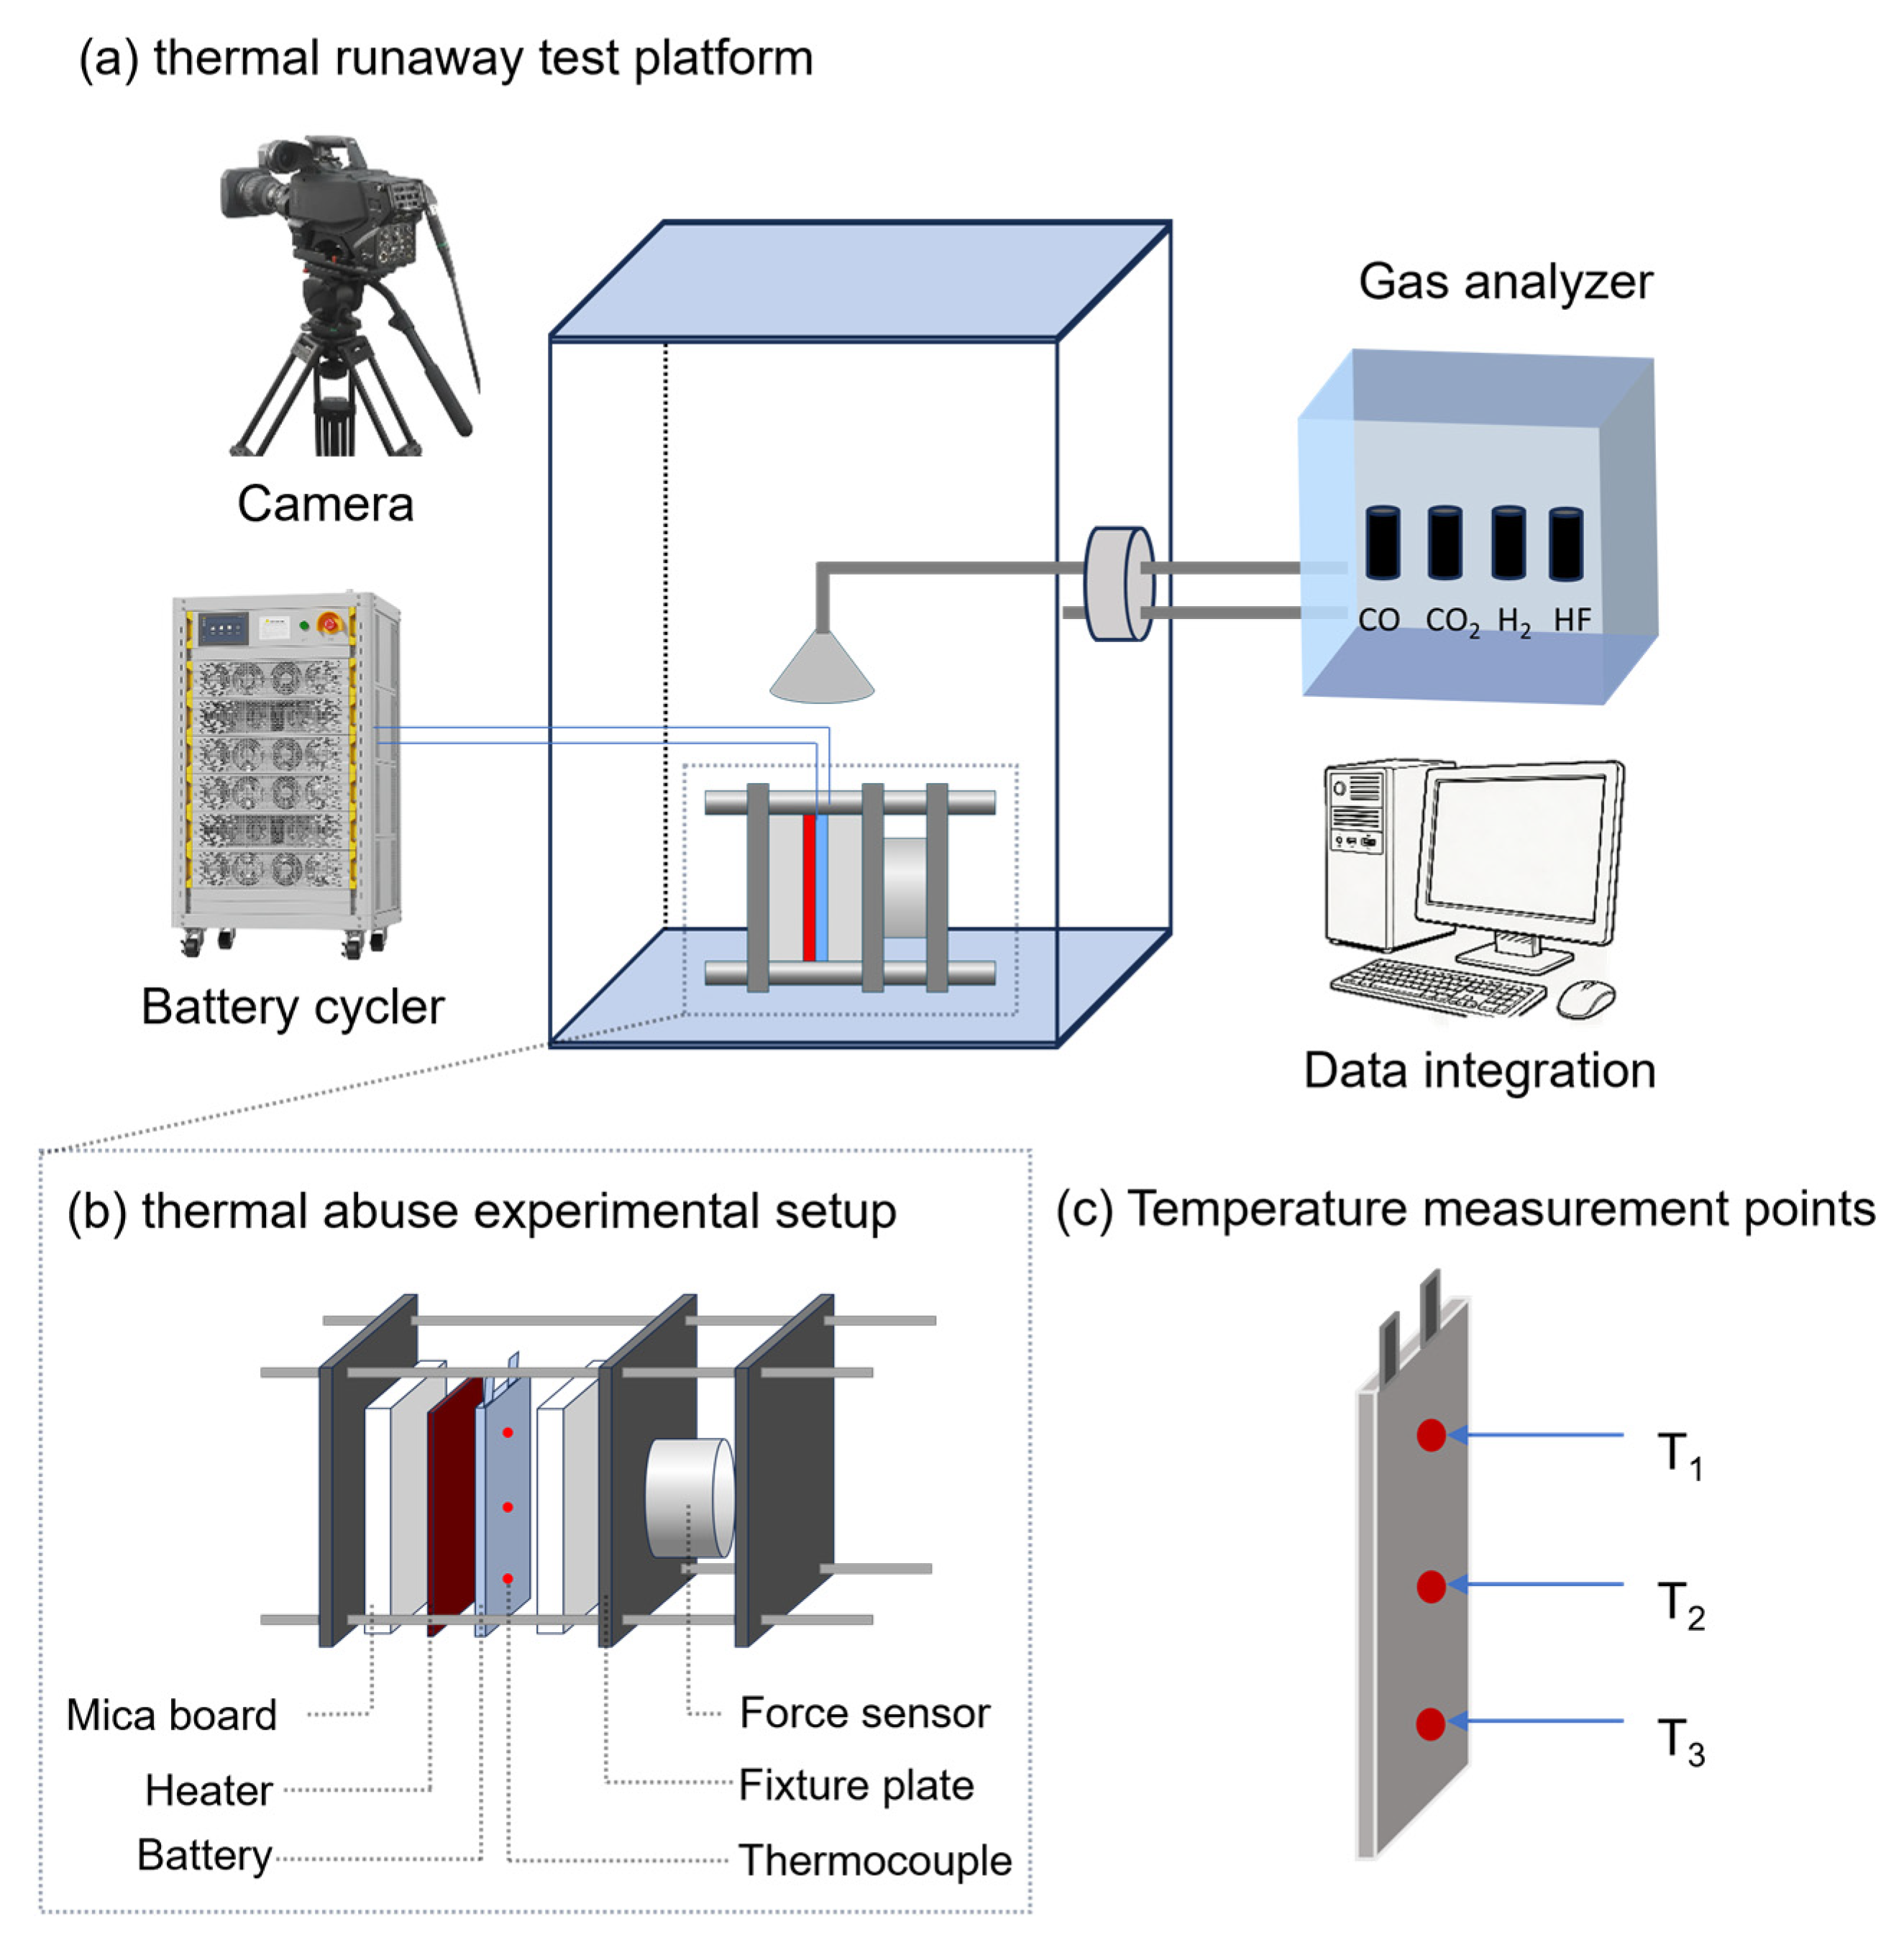
To ensure experimental safety and data accuracy, a TR test platform integrating external heating and synchronous multi-signal acquisition was designed and constructed, as shown in Figure 1. The pouch cell was clamped in a fixture consisting of three steel plates using M12 bolts, with a preload force of 200 N applied by tightening nuts to simulate the mechanical constraints in actual battery modules. This preload corresponds to an initial stack pressure of approximately 12.5 kPa over the cell surface, which falls within the range of initial stack pressures reported for pouch cells under foam-based or fixture clamping; in particular, an optimal initial external pressure of 12.5 kPa has been identified for commercial pouch cells clamped with foam pads [23]. The thermal-abuse experimental setup is depicted in Figure 1b. After the preload operation was applied, the cell was allowed to rest for 1 h to stabilize the expansion force reading before starting the overheating tests [22]. The heating plate, with dimensions of 200 mm × 85 mm × 3 mm and a constant power of 300 W, was switched off once TR was triggered. The heating plate was attached to one side of the cell, and 20 mm thick mica plates were placed between the heating plate and the fixture and between the cell and the opposite fixture plate to minimize heat dissipation. Three K-type thermocouples were attached to the surface of the pouch cell at the tab area (T1), the geometric center (T2), and the far end (T3), to monitor the local surface temperature evolution during TR, as indicated in Figure 1c. A flat-plate force sensor was mounted between the second and third steel fixture plates to monitor the dynamic variation in the cell’s expansion force. Voltage signals were acquired in real time through the battery cycler connected to the positive and negative terminals. Two gas-analysis systems were employed: an ACS multi-gas analyzer equipped with sensors for H2, CO, CO2, and HF, and a low-range, high-resolution DF gas analyzer used to accurately capture the first-detection sequence of the characteristic gases. During testing, gases generated from the TR process were introduced into the detection apparatus through an inlet located 5 cm above the cell and then returned to the test chamber. Additionally, a video recording device was installed inside the top of the chamber to document the entire evolution of TR. Using the above experimental platform, thermal-abuse experiments induced by overheating were conducted on pouch cells at six SOCs ranging from 10% to 100%, enabling synchronous real-time acquisition of multidimensional signals including temperature, expansion force, voltage and gas concentration.
Figure 1.
Schematic of experimental setup: (a) TR test platform; (b) thermal-abuse experimental setup; (c) temperature measurement points.
2.3. Error Analysis
The measurement system of the TR test platform used in this study primarily consists of a battery cycler and multidimensional sensors. Measuring accuracy is limited by the inherent precision of each individual device, which may introduce certain errors in measurement results. Table 2 lists the specific models and key performance parameters of the main equipment and sensors employed. Moreover, it should be noted that cell-to-cell variations arising from the manufacturing process of LIBs are unavoidable, leading to inevitable discrepancies in thermal and deformation behaviors among individual cells. To minimize the influence of measurement location on the recorded data, the placement of all sensors was kept consistent throughout the experiments.
Table 2.
Equipment and sensor models and parameters utilized in the experiment.
3. Results and Discussion
3.1. The Variations in Multidimensional Signals During the TR Process
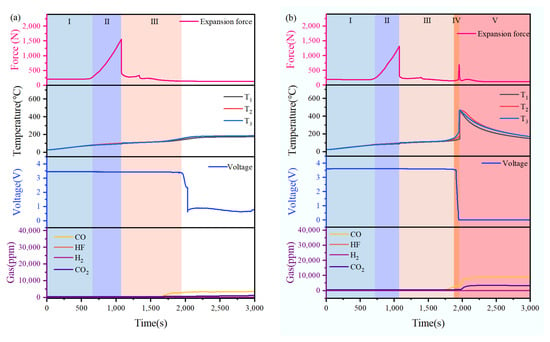
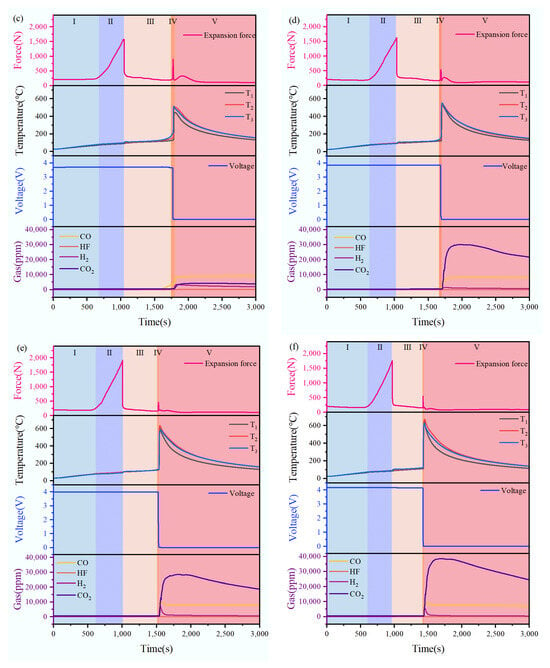
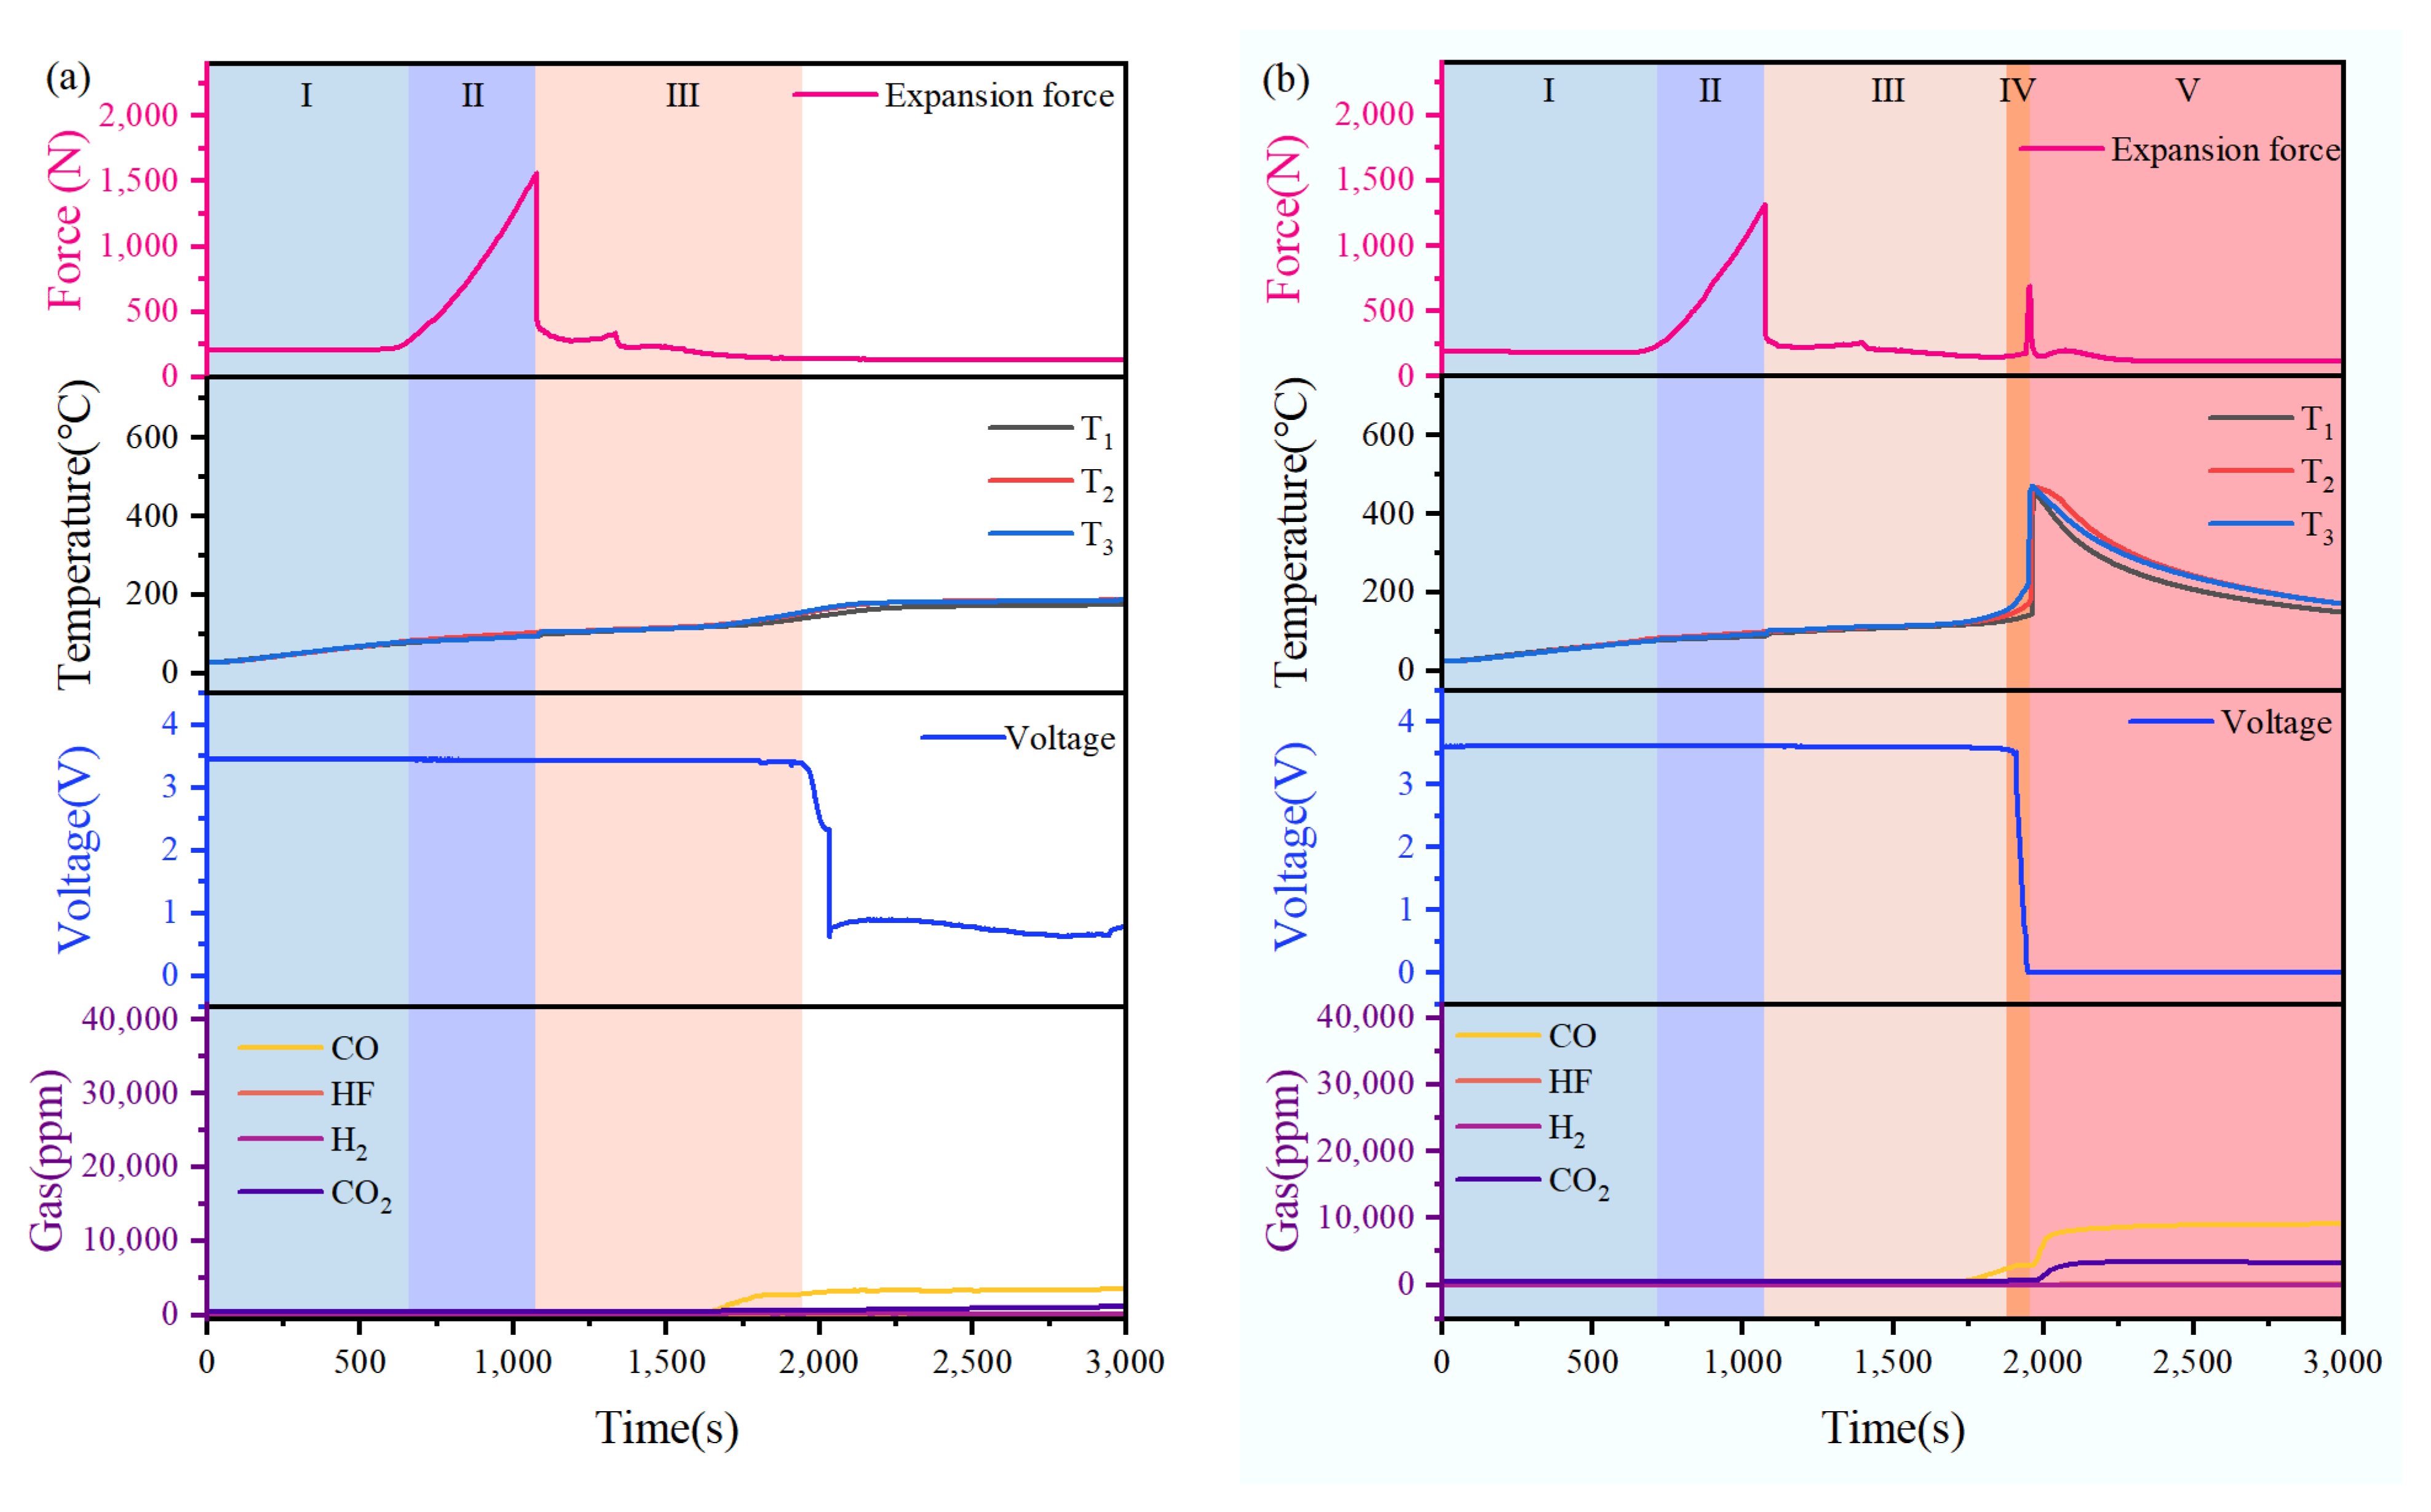
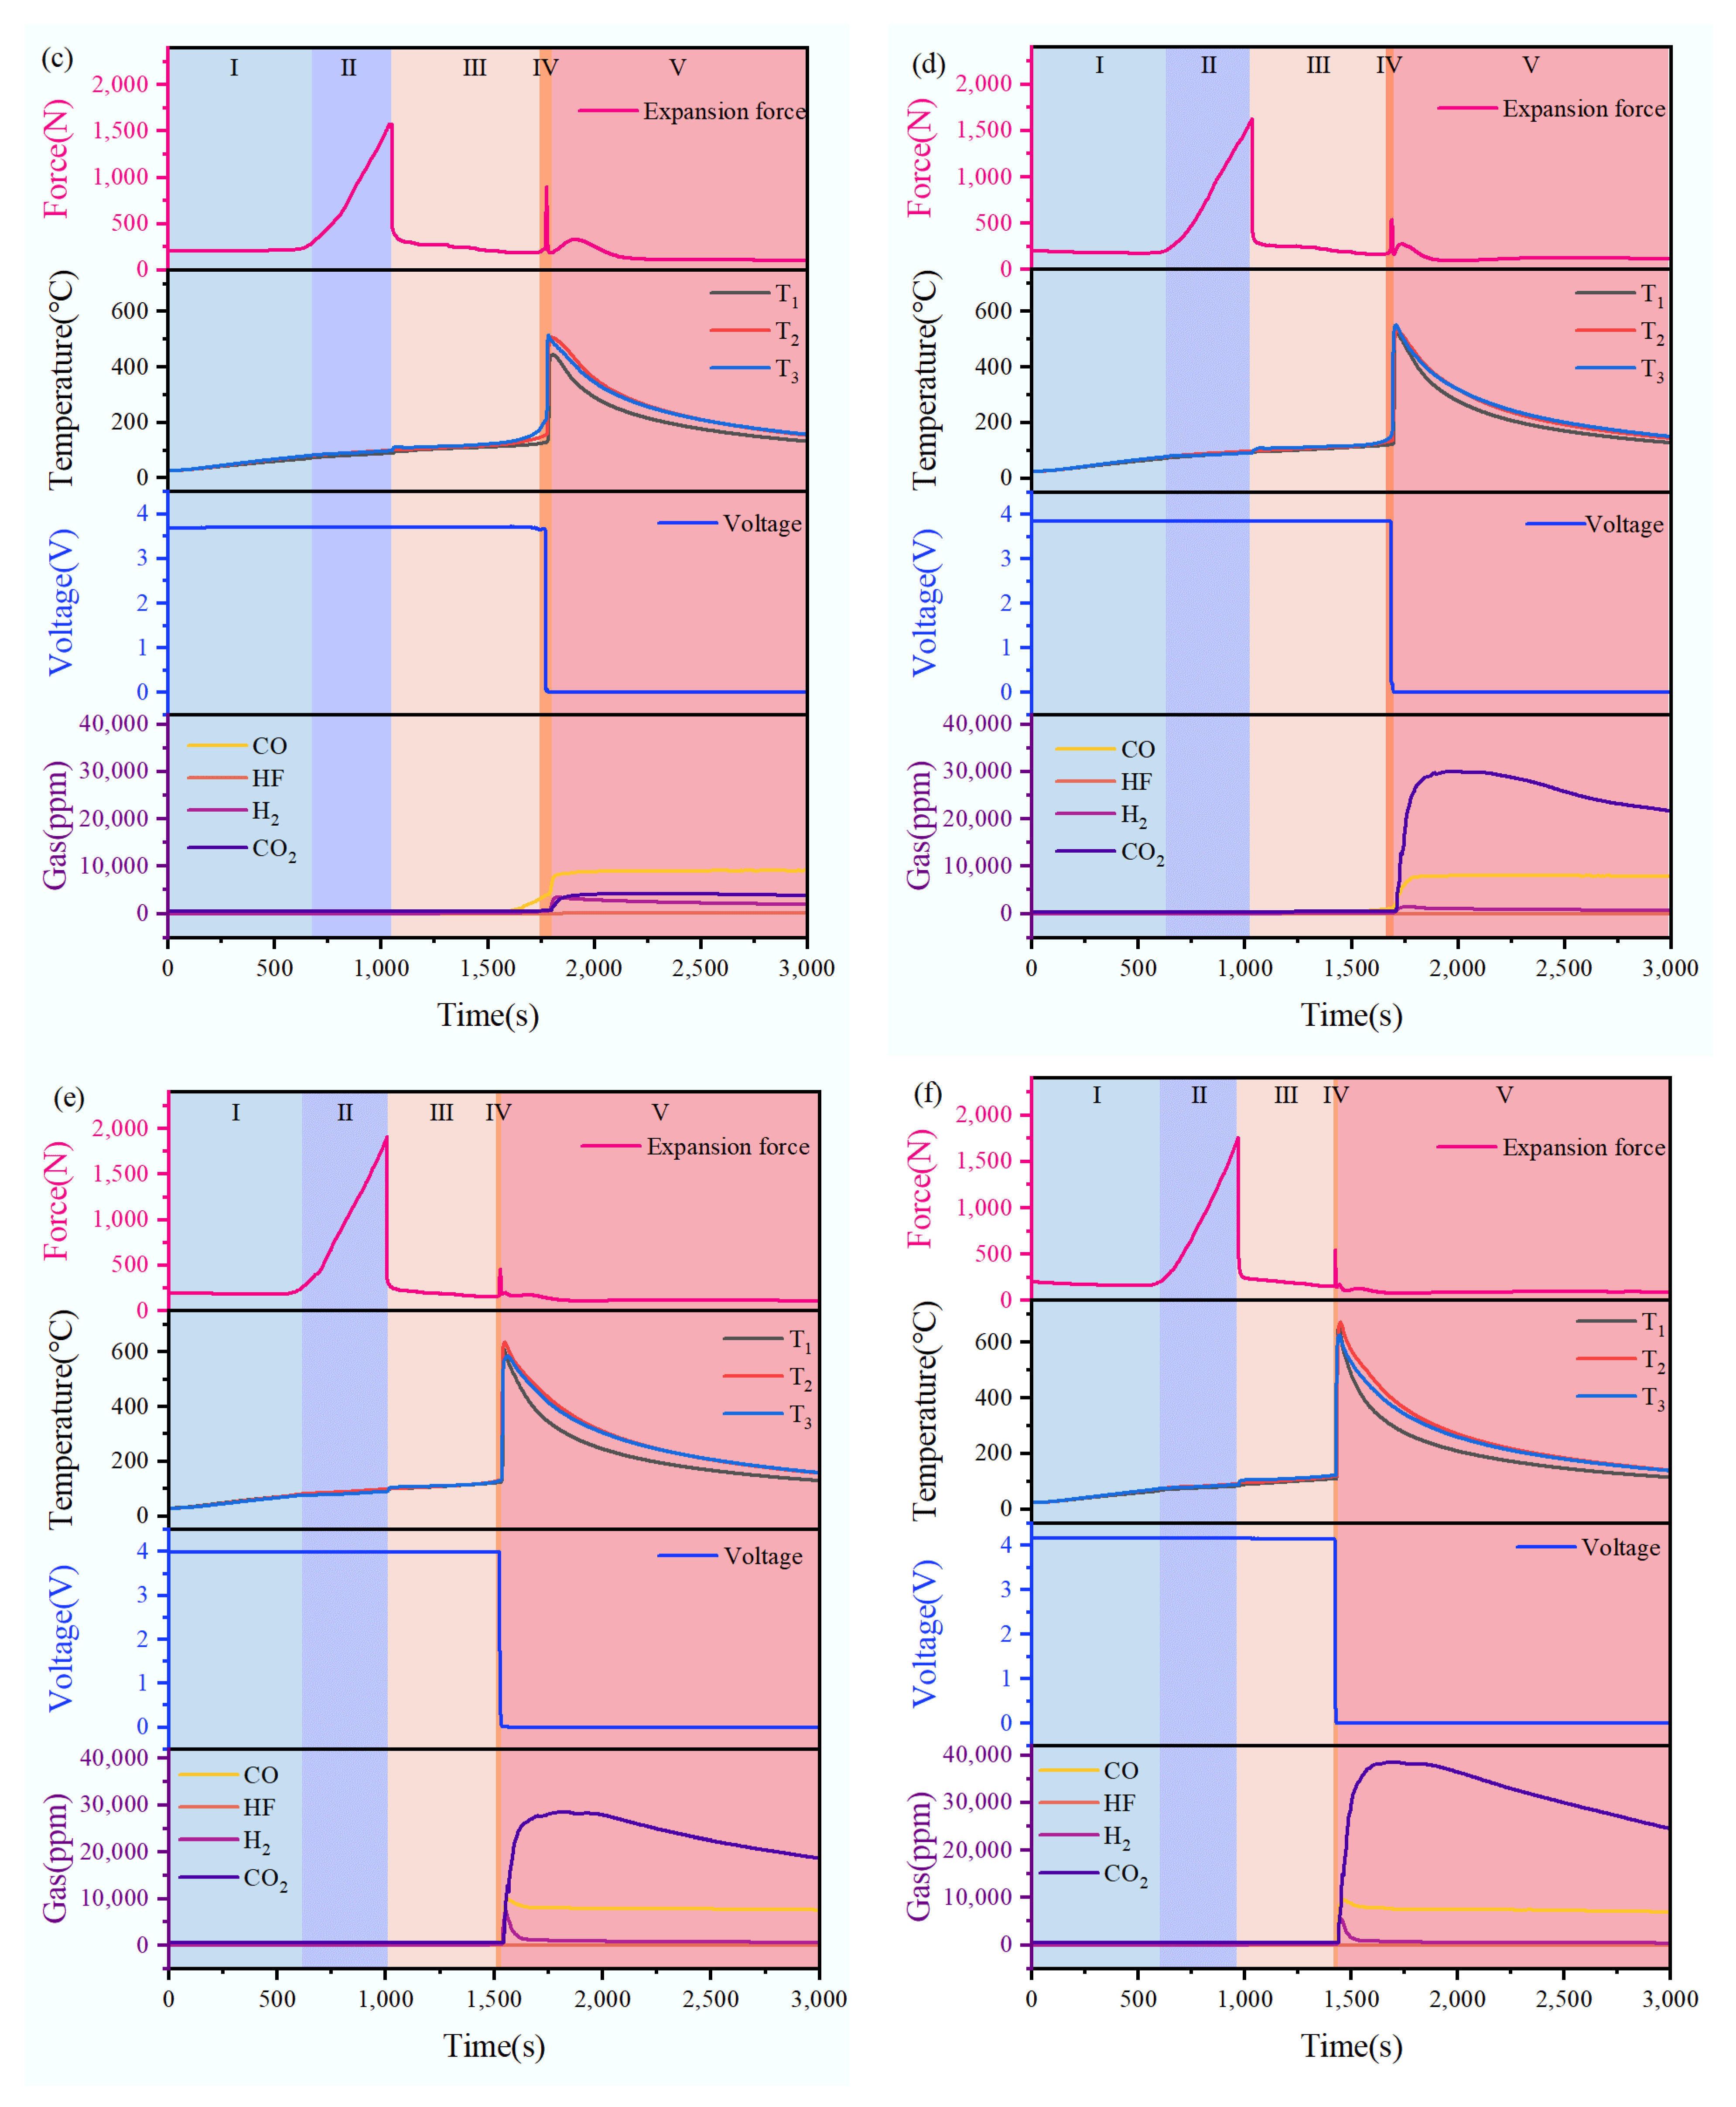
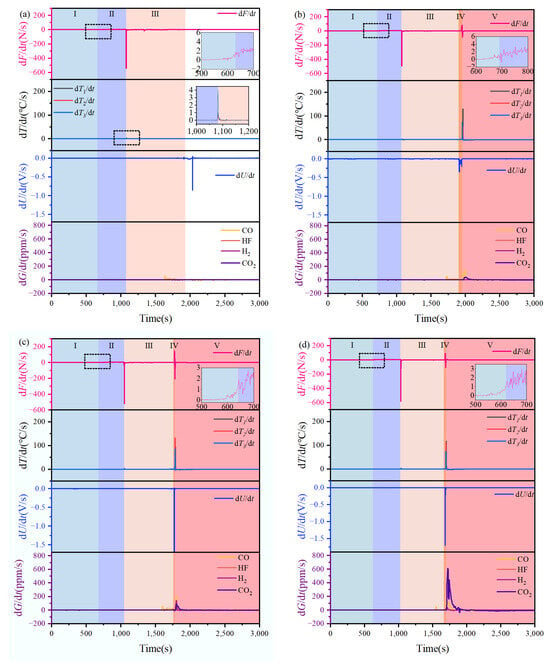
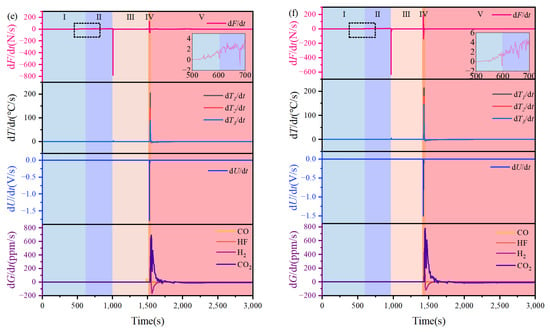
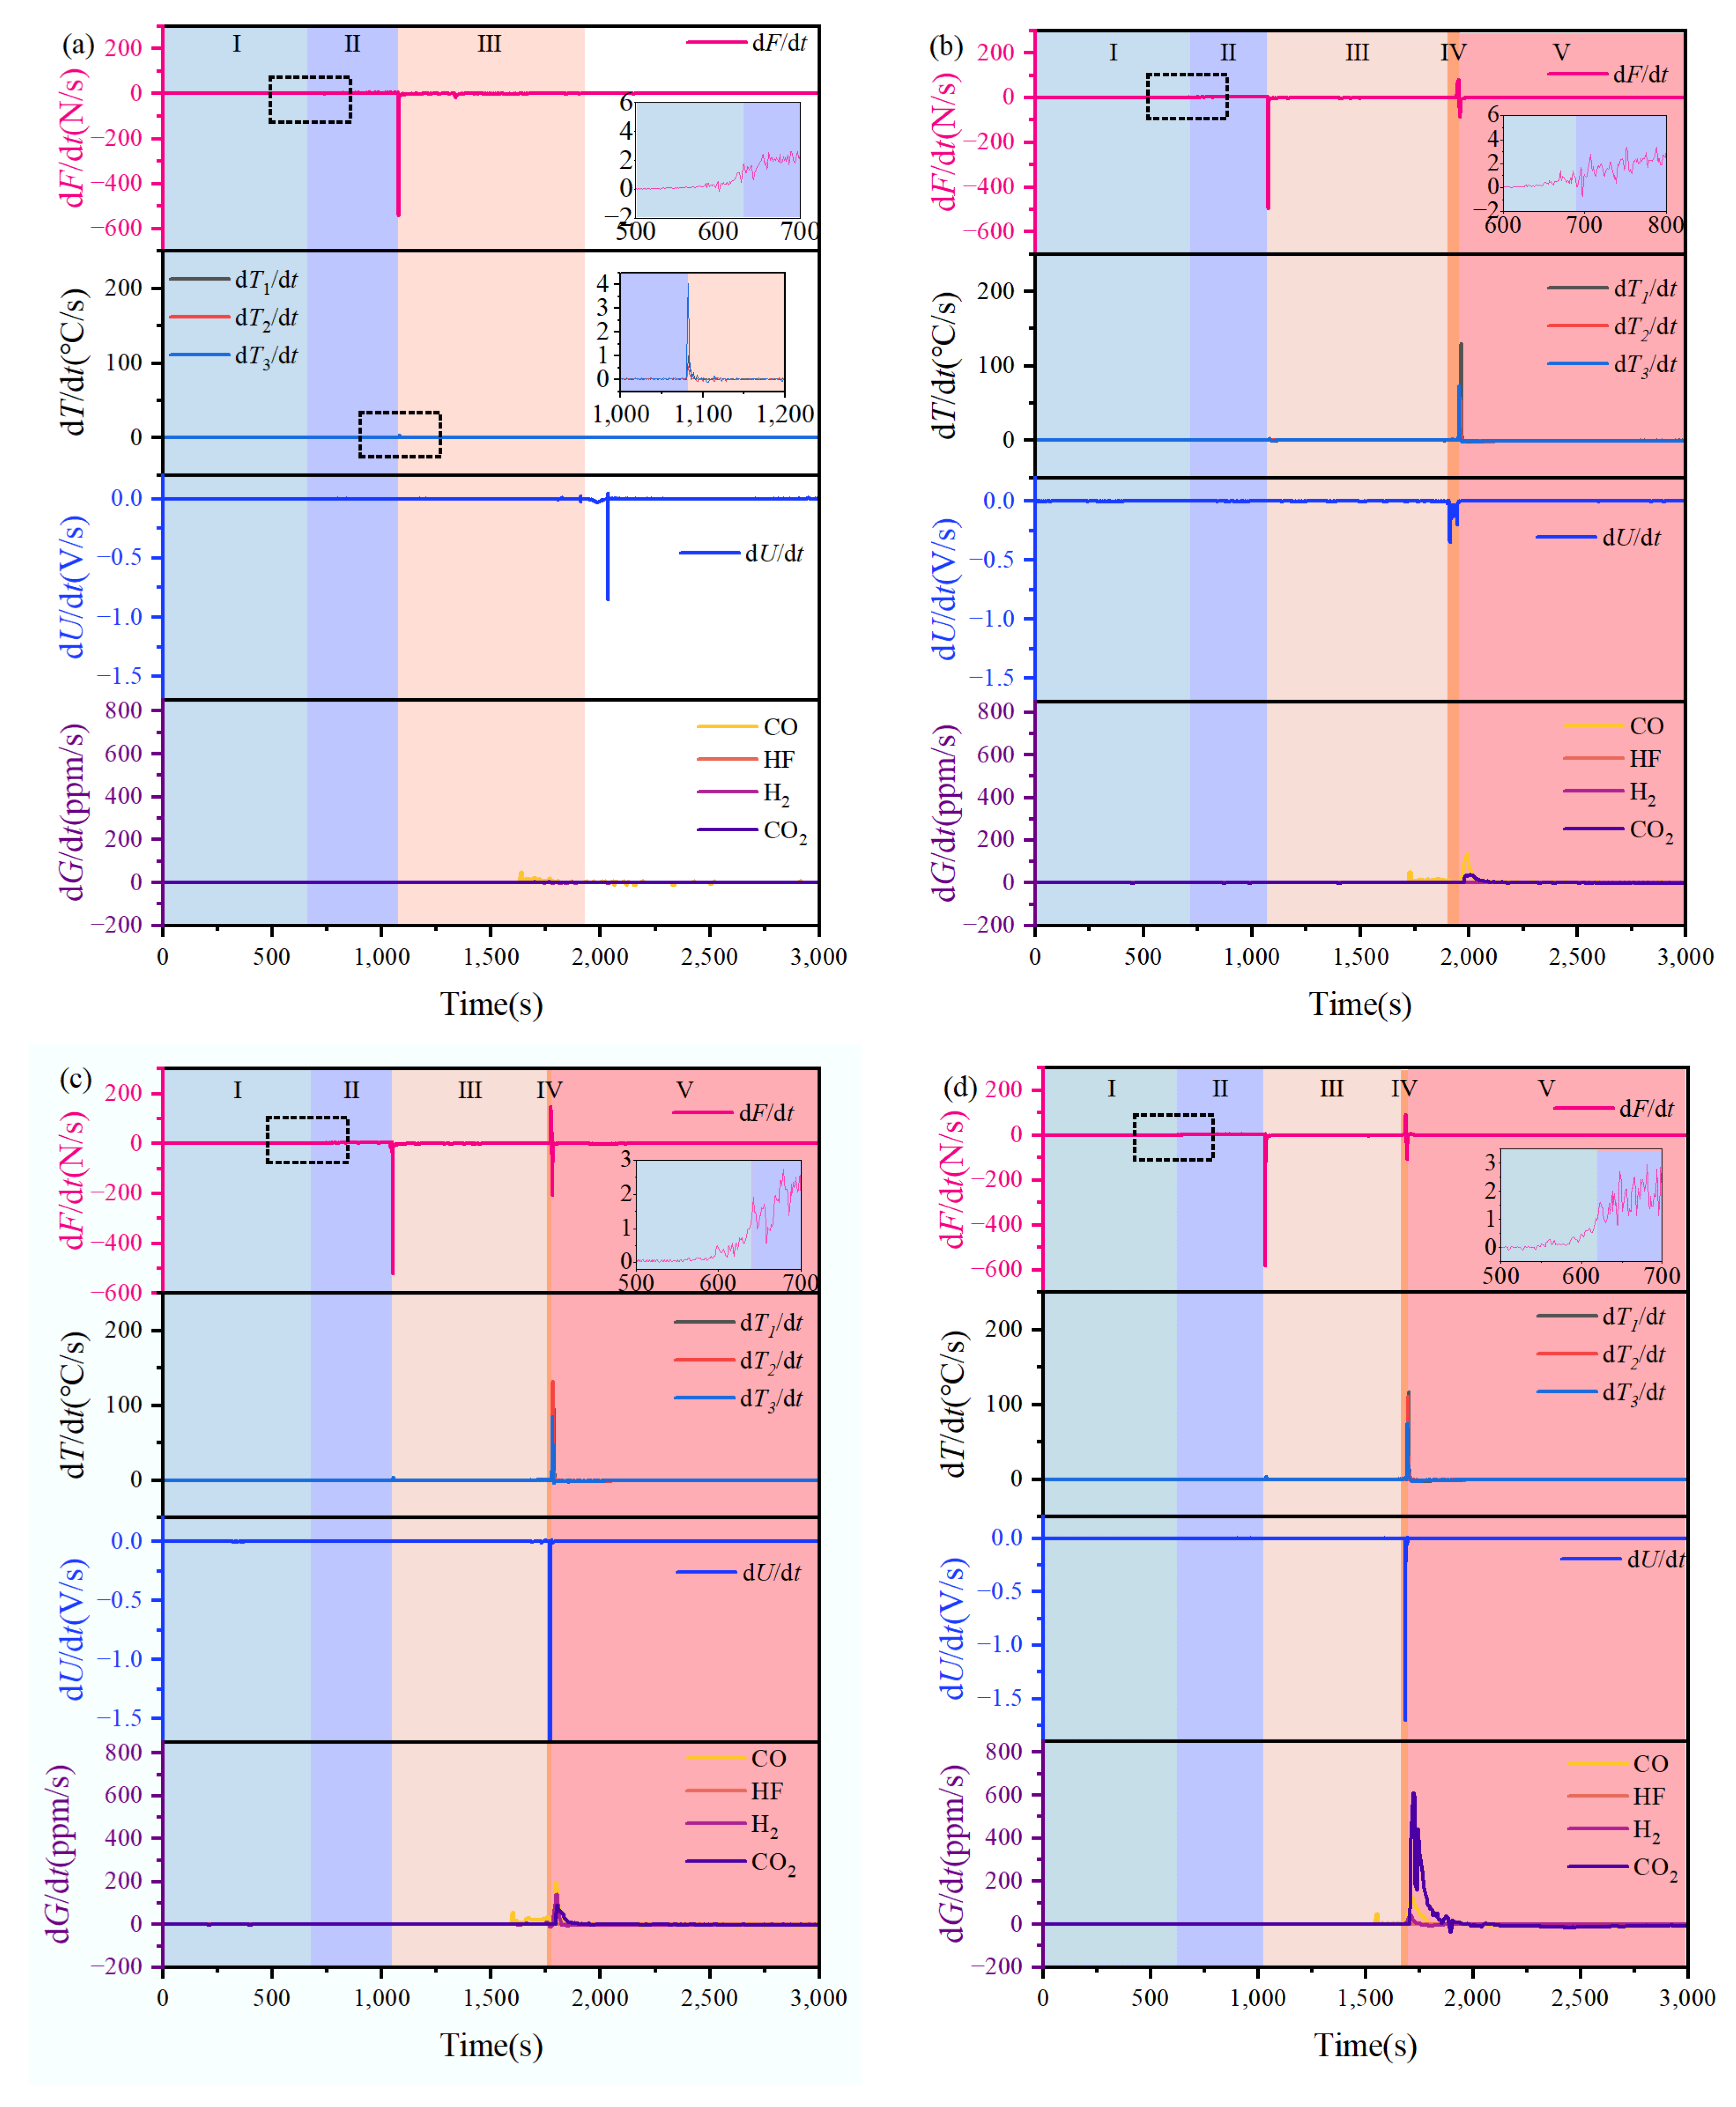
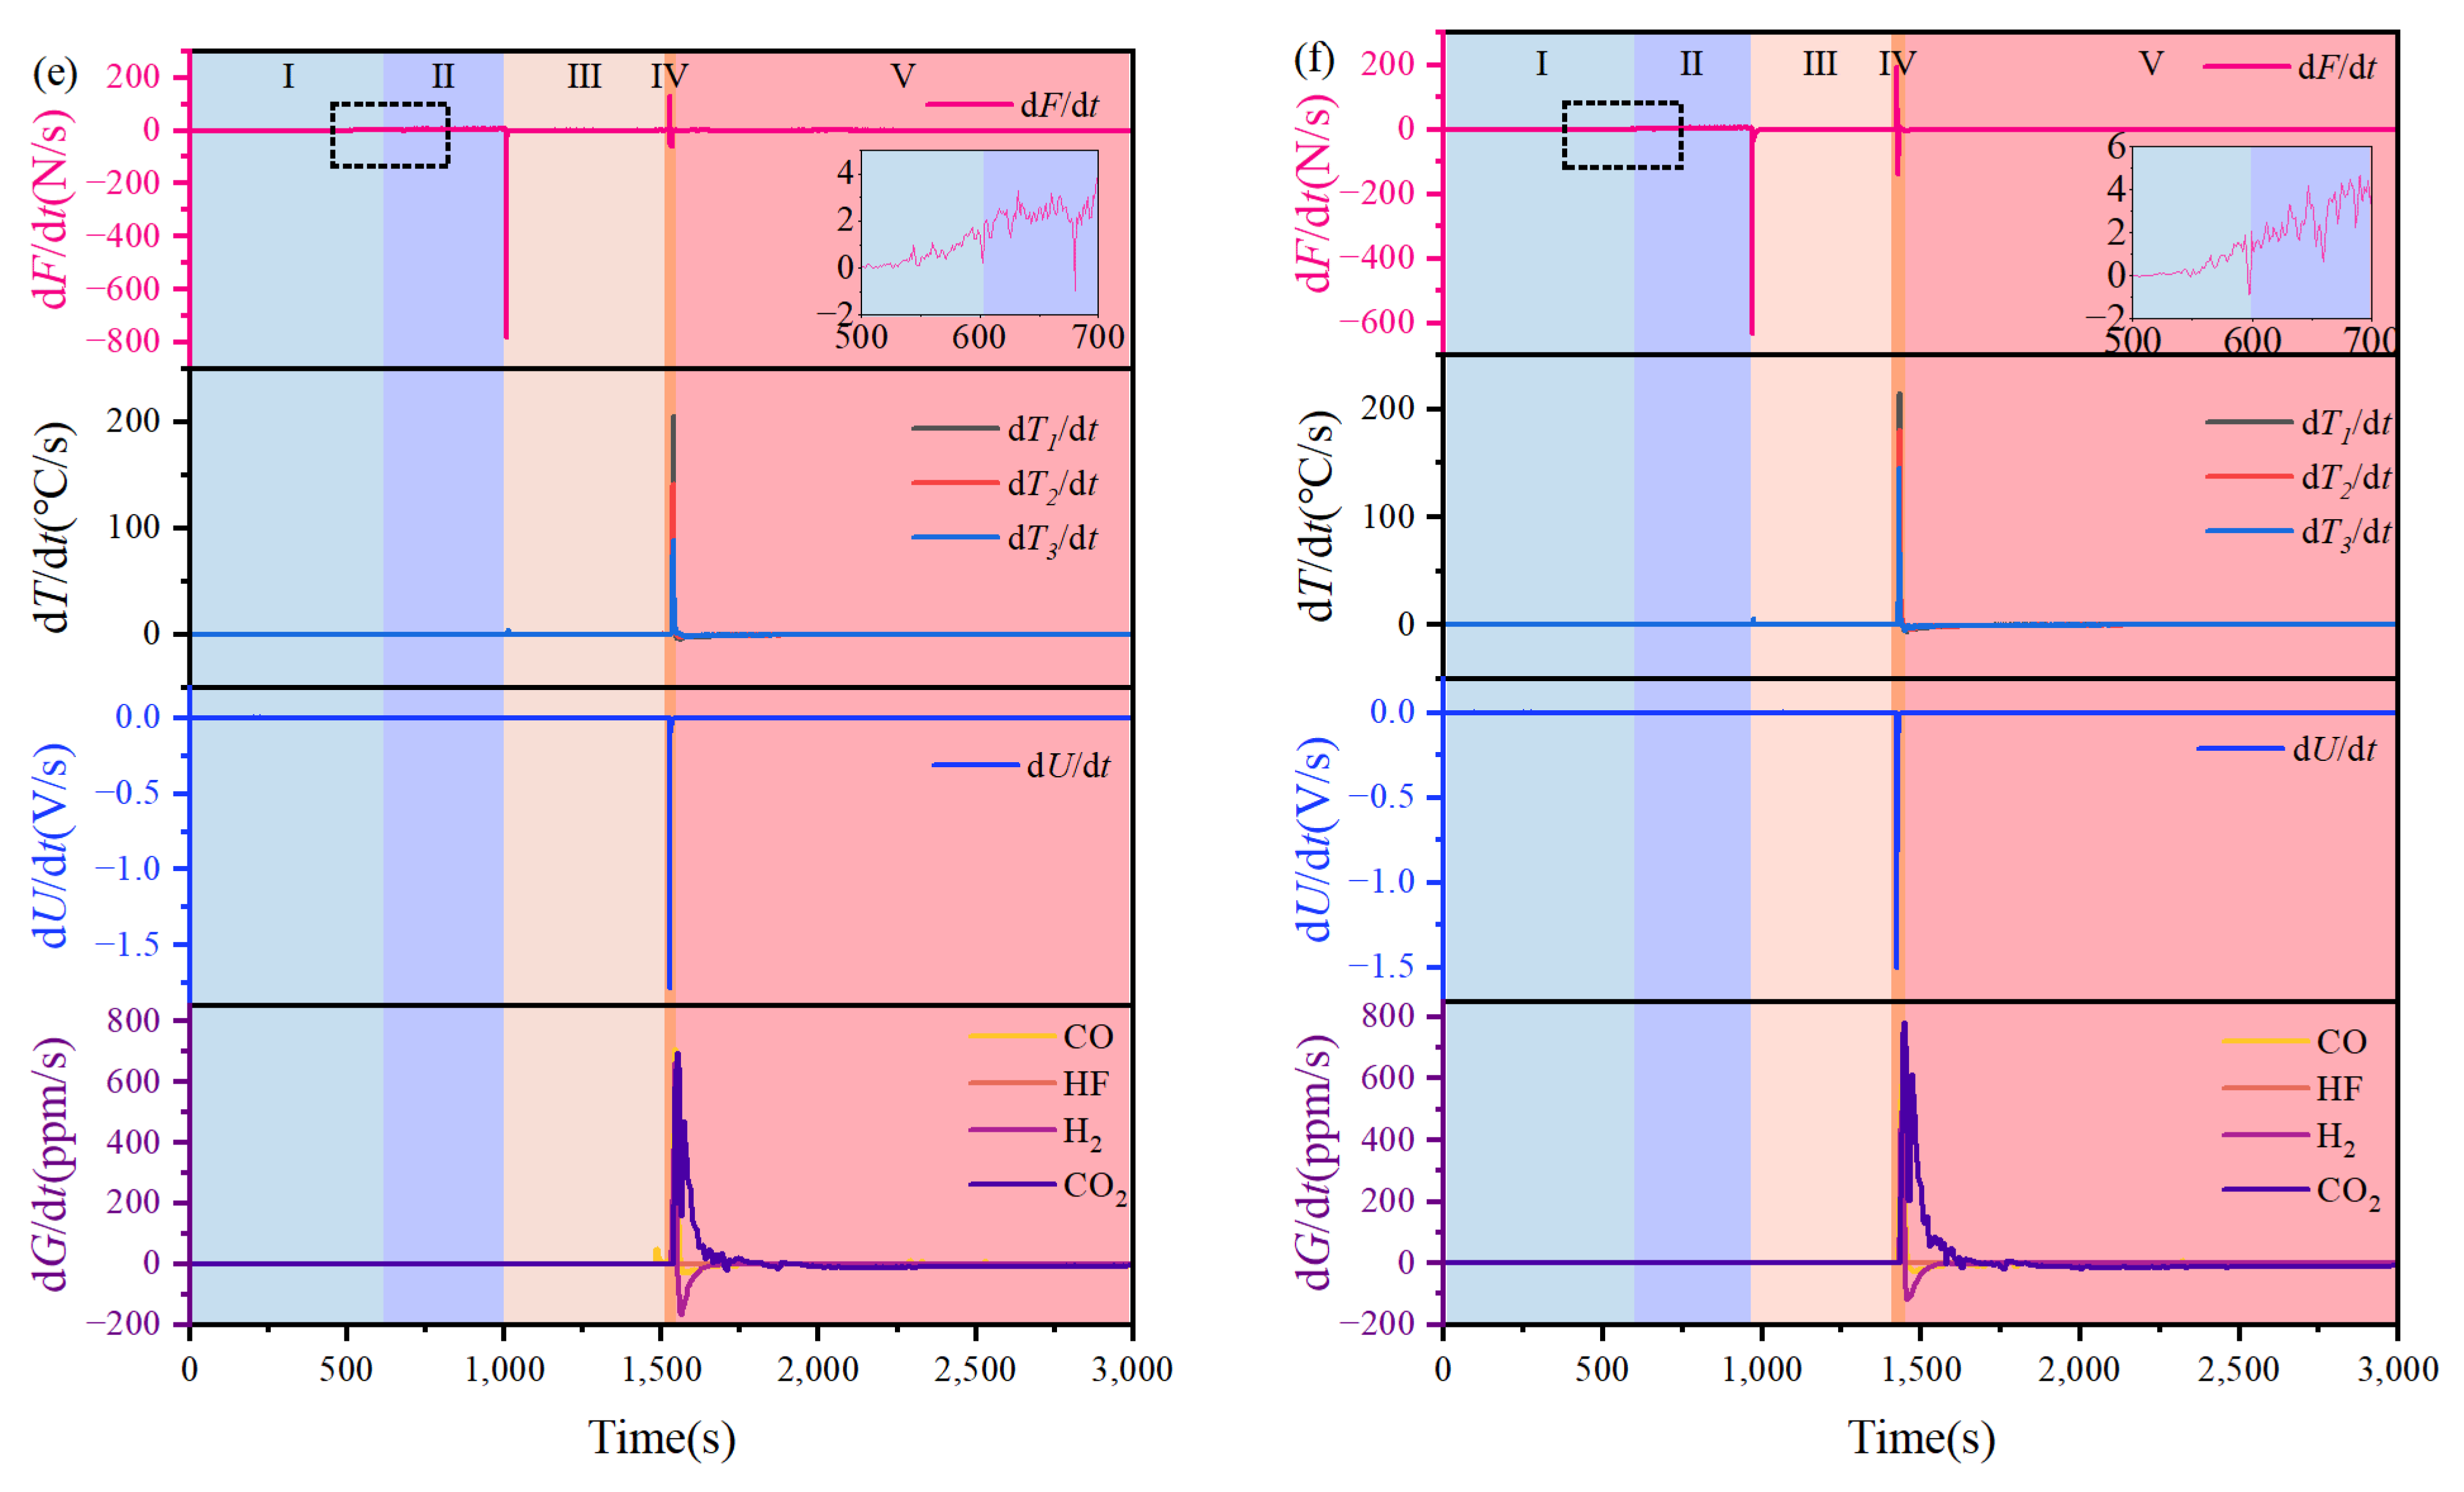
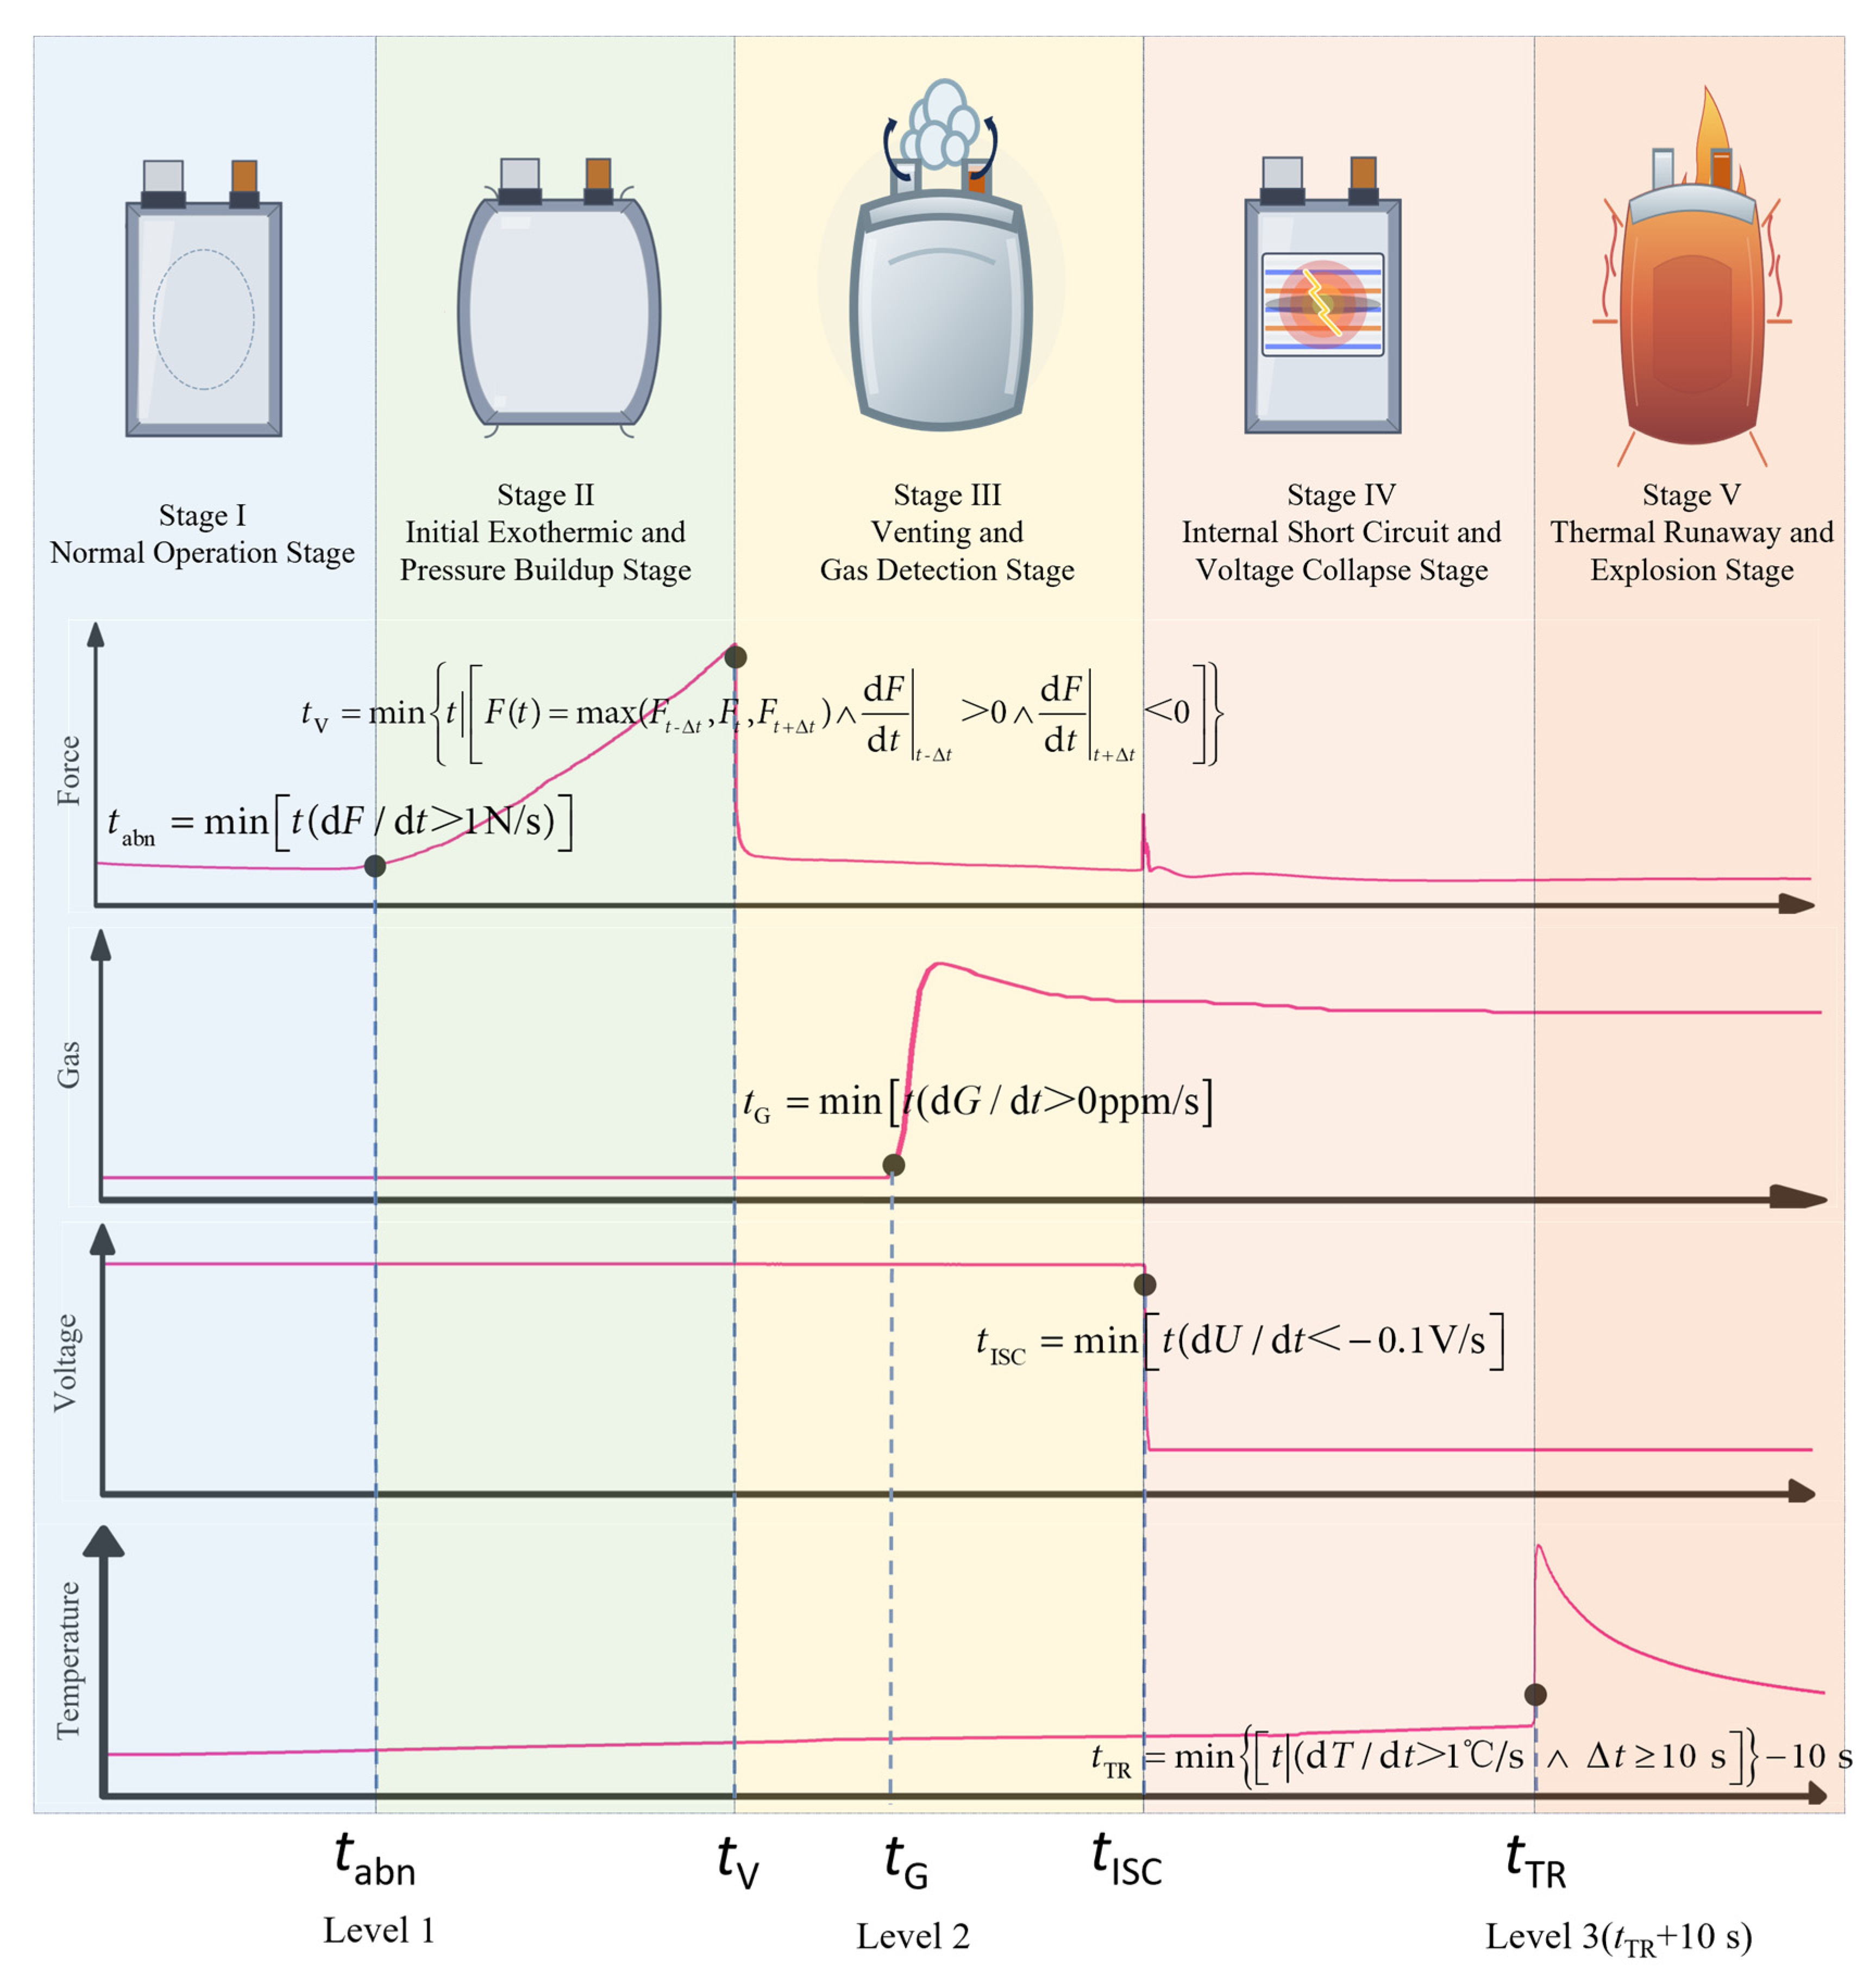
During the TR process of cells with SOCs ranging from 10% to 100%, the variations in expansion force, voltage, temperature, and gas concentrations were synchronously monitored in real time, as shown in Figure 2 and Figure 3. Based on the variations in multidimensional signals, five characteristic moments were defined: the moment of abnormal expansion-force increase (tabn), the moment of cell venting (tV), the moment of first detection of characteristic gases (H2 or CO) (tG), the moment of internal short circuit (tISC), and the moment of TR (tTR). When the rate of change in the expansion force exceeded 1 N/s, the force began to rise rapidly, and the earliest moment satisfying this criterion was defined as tabn. The value of 1 N/s was selected as the lower boundary of the sustained rapid force-growth stage based on the common transition behavior observed at different SOCs. The moment of cell venting was characterized by the expansion force reaching a local maximum, at which point its first derivative transitioned from positive to negative, indicating that the internal pressure had reached the structural limit of the casing, followed by structural failure and venting behavior. The first detection of characteristic gases was defined as the moment when the concentration of CO or H2 showed a sustained increase from the sensor baseline. The occurrence of ISC was defined as the earliest moment when dU/dt fell below −0.1 V/s. Meanwhile, tTR was defined as the first time at which dT/dt at any one of the three surface temperature measurement points exceeded 1 °C/s and subsequently remained above this threshold for more than 10 s. This onset-based definition uses the 10 s duration requirement to distinguish self-sustaining TR from the transient surface thermal shock caused by cell venting. The specific definitions are provided in Equations (1)–(5).
Figure 2.
Expansion force, temperature, voltage, and characteristic gas during the thermal-abuse process. (a) 10% SOC, (b) 30% SOC, (c) 50% SOC, (d) 70% SOC, (e) 90% SOC, and (f) 100% SOC.
Figure 3.
Change rates of expansion force, temperature, voltage, and characteristic gas during the thermal-abuse process. (a) 10% SOC, (b) 30% SOC, (c) 50% SOC, (d) 70% SOC, (e) 90% SOC, and (f) 100% SOC.
The TR process at different SOCs can be divided into five distinct stages, determined by four characteristic moments tabn, tV, tISC, and tTR.
Stage I: Normal Operation Stage. This stage spans from the start of the experiment until the moment of abnormal increase in expansion force. During the initial heating phase, the expansion force exhibits a decreasing trend, possibly due to slight deformation of the cell casing and internal structure caused by heating. It then increases slowly (dF/dt < 1 N/s), which is mainly attributed to the gradual vaporization of the low-boiling-point electrolyte solvent. Concurrently, the surface temperature of the cell gradually rises due to heat conduction, although at a low rate. No significant anomalies are observed in voltage, and no characteristic gases are detected.
Stage II: Initial Exothermic and Pressure-Buildup Stage. This stage spans from the abnormal increase in expansion force (tabn) to cell venting (tV). An abnormal increase in expansion force is noted once dF/dt > 1 N/s, a signal that emerges much earlier than any characteristic change in the cell surface temperature. In addition to the continuous volatilization of the electrolyte, this stage corresponds predominantly to the decomposition of the SEI on the anode [24] and the interfacial reactions between the cathode and the electrolyte [25], signaling the onset of irreversible internal exothermic reactions. With continuous heat supply from the heating plate, the internal temperature gradually increases, accelerating side reactions and gas generation, which leads to a sustained and rapid increase in expansion force.
Stage III: Venting and Gas-Detection Stage. This stage spans from cell venting (tV) to the occurrence of ISC (tISC). When the internal pressure, reflected by the expansion force, reaches the mechanical limit of the cell casing, the casing ruptures and vents gas, accompanied by a sharp drop in expansion force, an audible sound, and the ejection of a substantial gas-liquid mixture. Following the leakage of high-temperature materials from the cell, a significant temperature spike is observed on the cell surface within 3–5 s after venting, marked by dT/dt > 1 °C/s at one or more temperature measurement point. Thereafter, the temperature returns to a relatively stable upward trend, with dT/dt below 1 °C/s. Because this response lasts only approximately 2–6 s, it does not satisfy the 10 s persistence requirement and is therefore not regarded as the onset of TR. After venting, the released internal gas leads to the rapid detection of CO and H2 within approximately 30 s, while the detection of gases such as HF and CO2 is delayed. Sustained heating from the heating plate drives a series of side reactions within the cell, releasing characteristic gases originating mainly from oxidation reactions between the active oxygen species released from the cathode and the electrolyte [26], reactions between the lithiated anode and the electrolyte [27], as well as electrolyte decomposition and volatilization [28]. Throughout this stage, the voltage remains stable.
Stage IV: Internal Short Circuit and Voltage Collapse Stage. This stage spans from the initiation of ISC (tISC) to TR (tTR). As heating continues, internal exothermic reactions intensify sharply, further increasing the internal temperature until reaching the melting temperature of the PE separator, resulting in its shrinkage, melting, and collapse. Direct contact between the anode and cathode triggers large-scale ISC, causing a sharp drop in voltage, with dU/dt falling below −0.1 V/s. Except for the 10% SOC cell, the voltage of all other cells dropped to 0 V. Meanwhile, the expansion-force trends differ among SOCs. For 70–100% SOC cells, the expansion force rises abnormally again at this stage and exhibits a second peak. The second peak is attributed to the Joule heating from the ISC, which drives the internal reactions into a self-accelerating stage [29]. In contrast, for 30–50% SOC cells, the second peak of expansion force appears after TR.
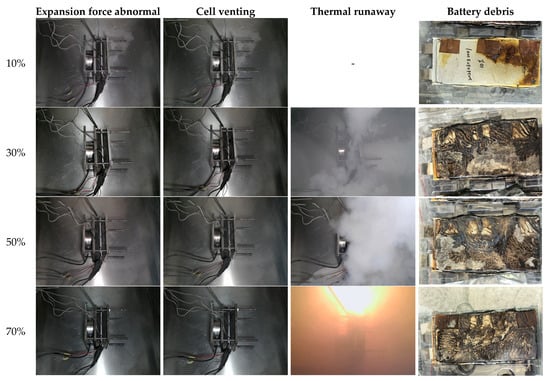
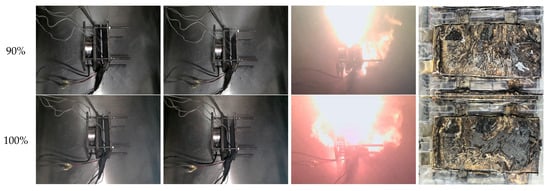
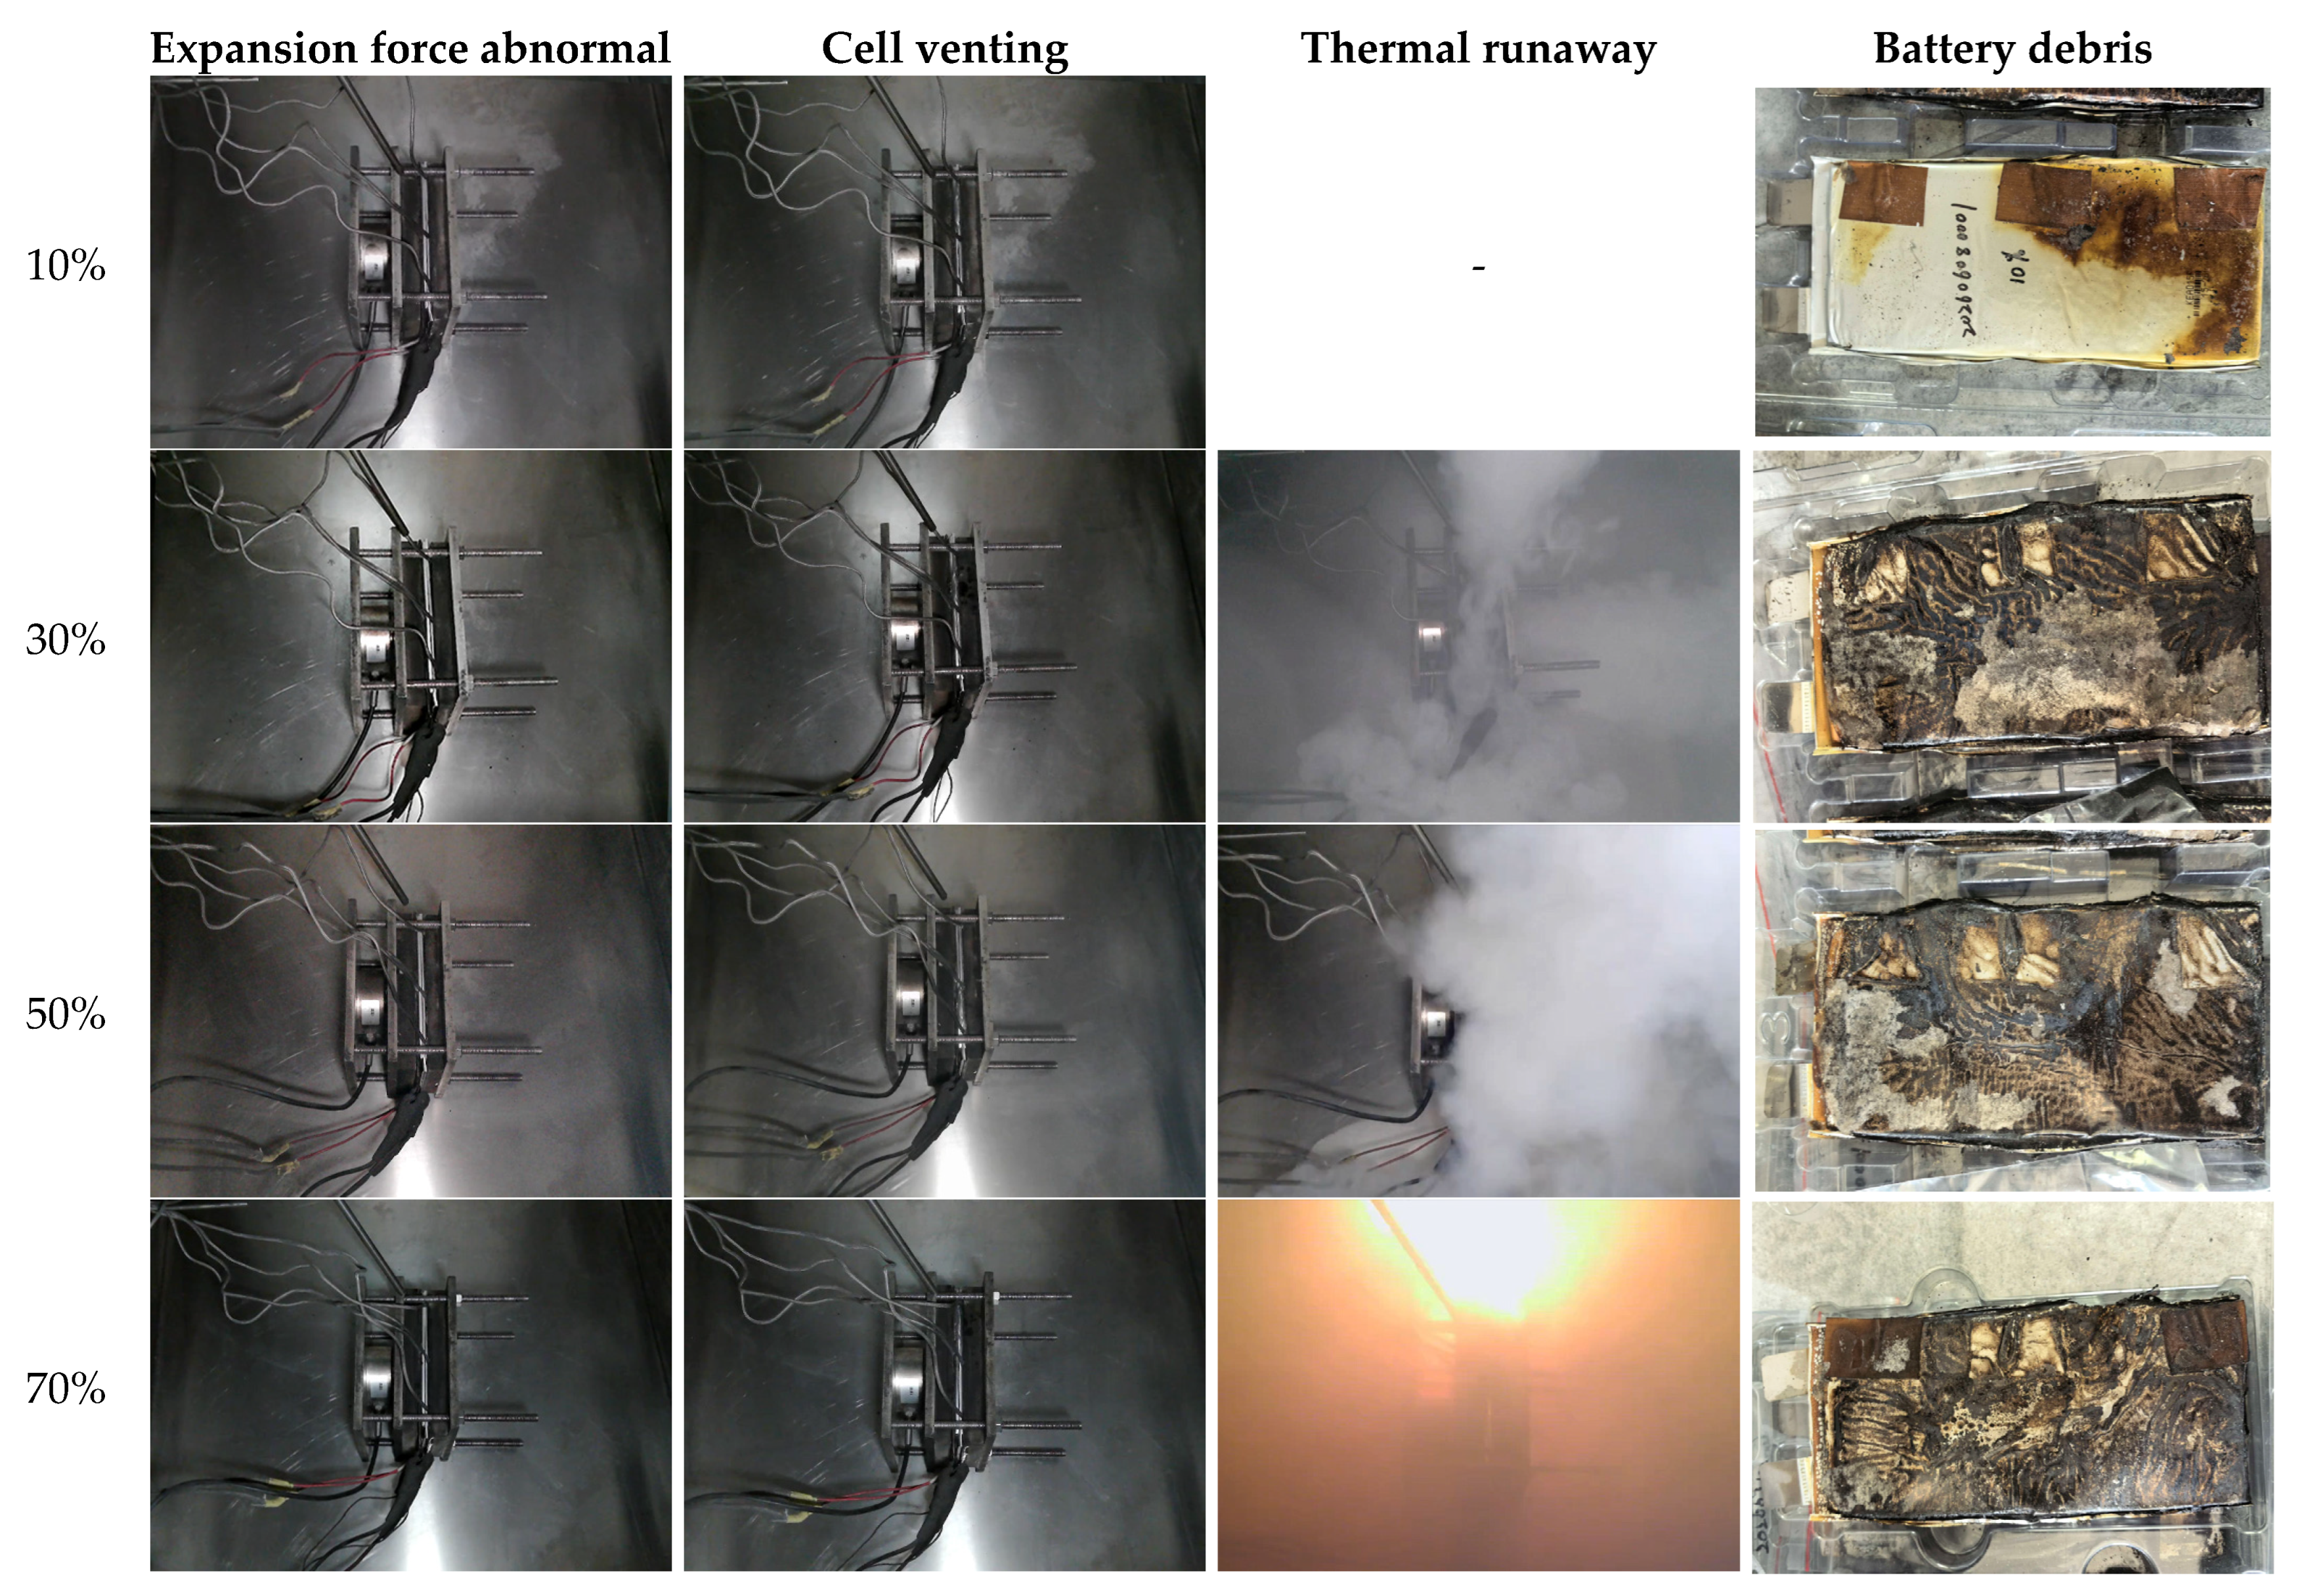
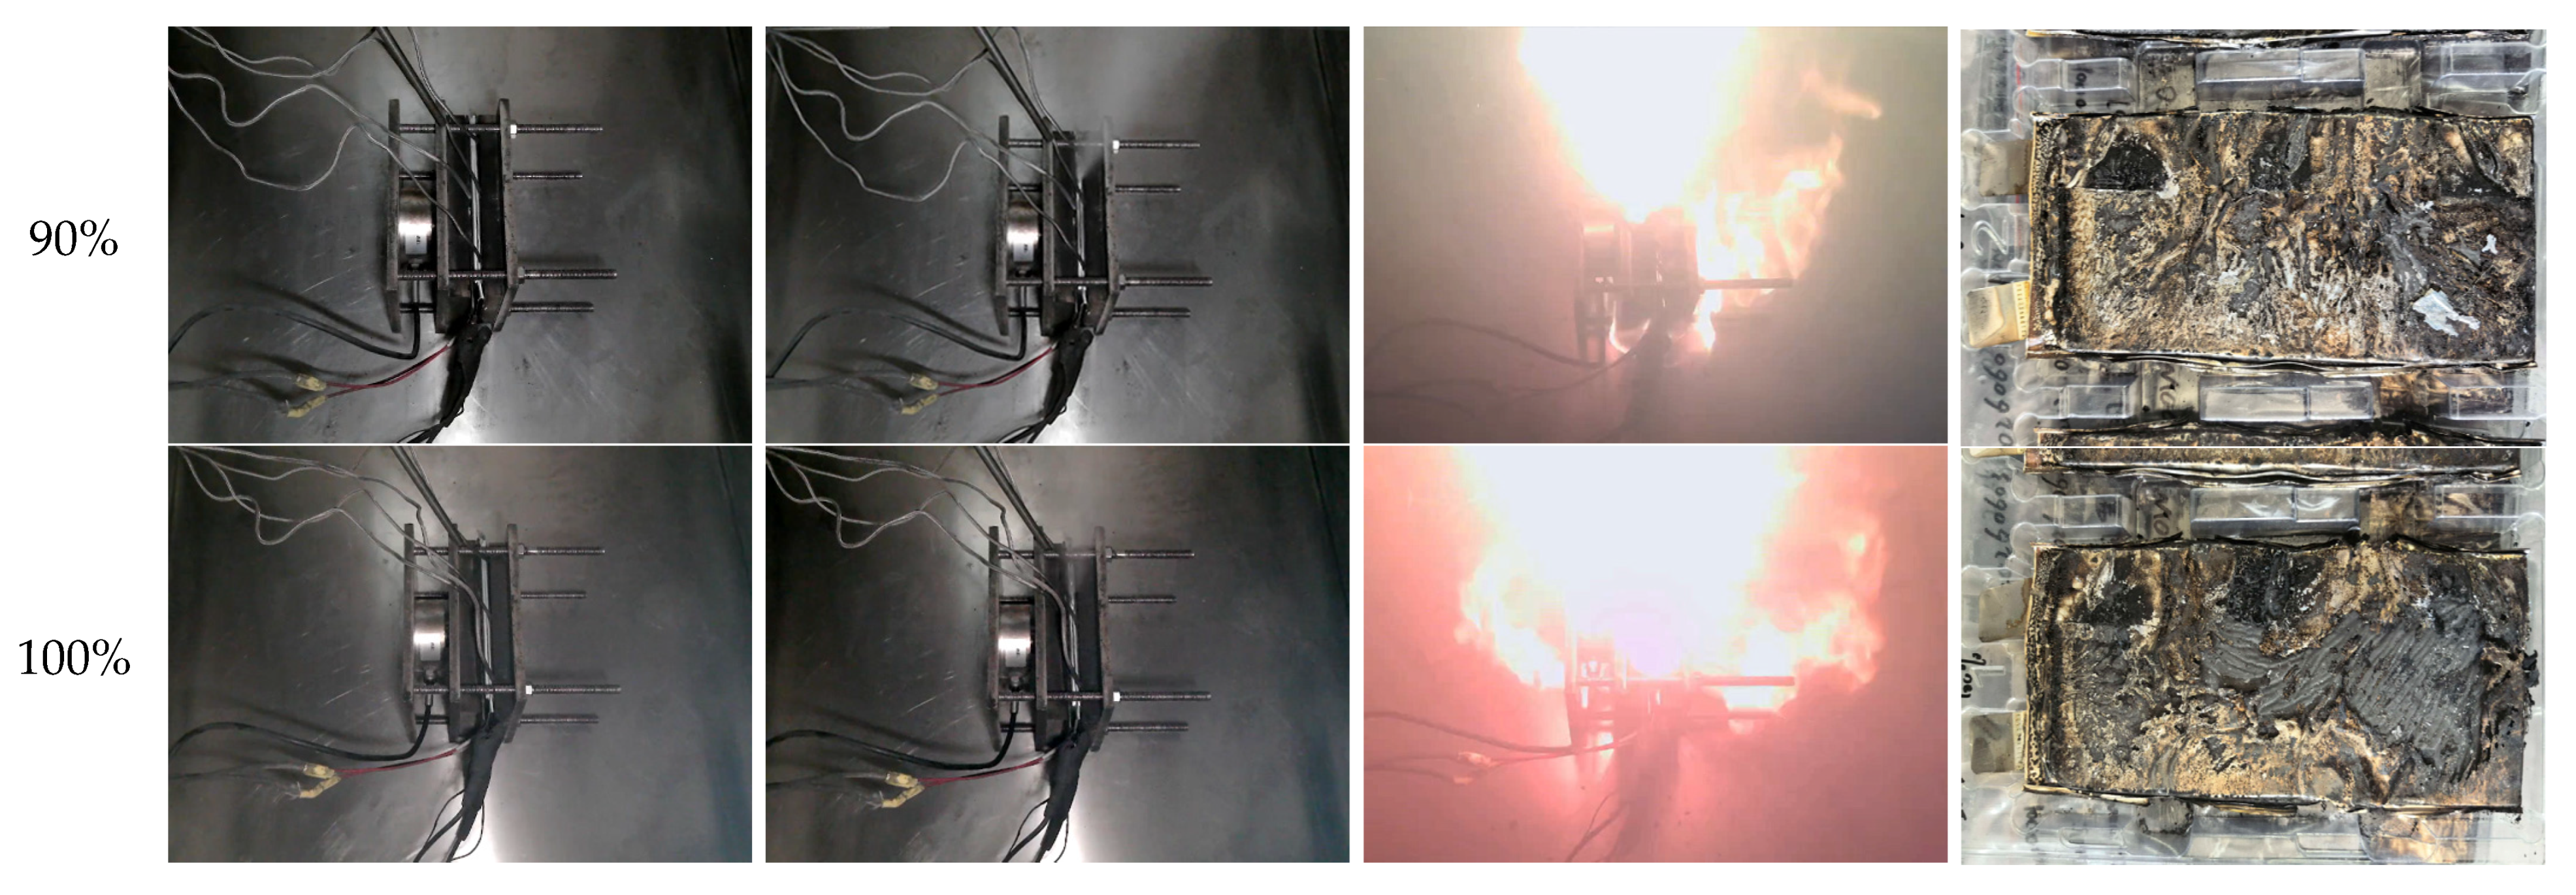
Stage V: Thermal Runaway and Explosion Stage. This stage spans from the onset of TR (tTR) until the end of the experiment. The 10% SOC cell does not undergo TR owing to its higher safety margin, while cells at other SOCs experience TR, with dT/dt again exceeding 1 °C/s for more than 10 s. Due to the large amount of gas generated by the 70–100% SOC cells, the combustible gas mixture in the chamber is ignited, causing explosive combustion, whereas 30–50% SOC cells eject a large amount of white smoke but do not ignite (Figure 4). Once TR is triggered, the cell surface temperature reaches its maximum within a short time, while gas generation and heat release increase sharply. Gas monitoring results indicate that the characteristic gases reached peak concentrations within approximately 60 s.
Figure 4.
TR phenomena of cells with different SOCs.
3.2. The Influence of SOCs on the Evolution Behavior of Multidimensional Signals
3.2.1. Expansion Force
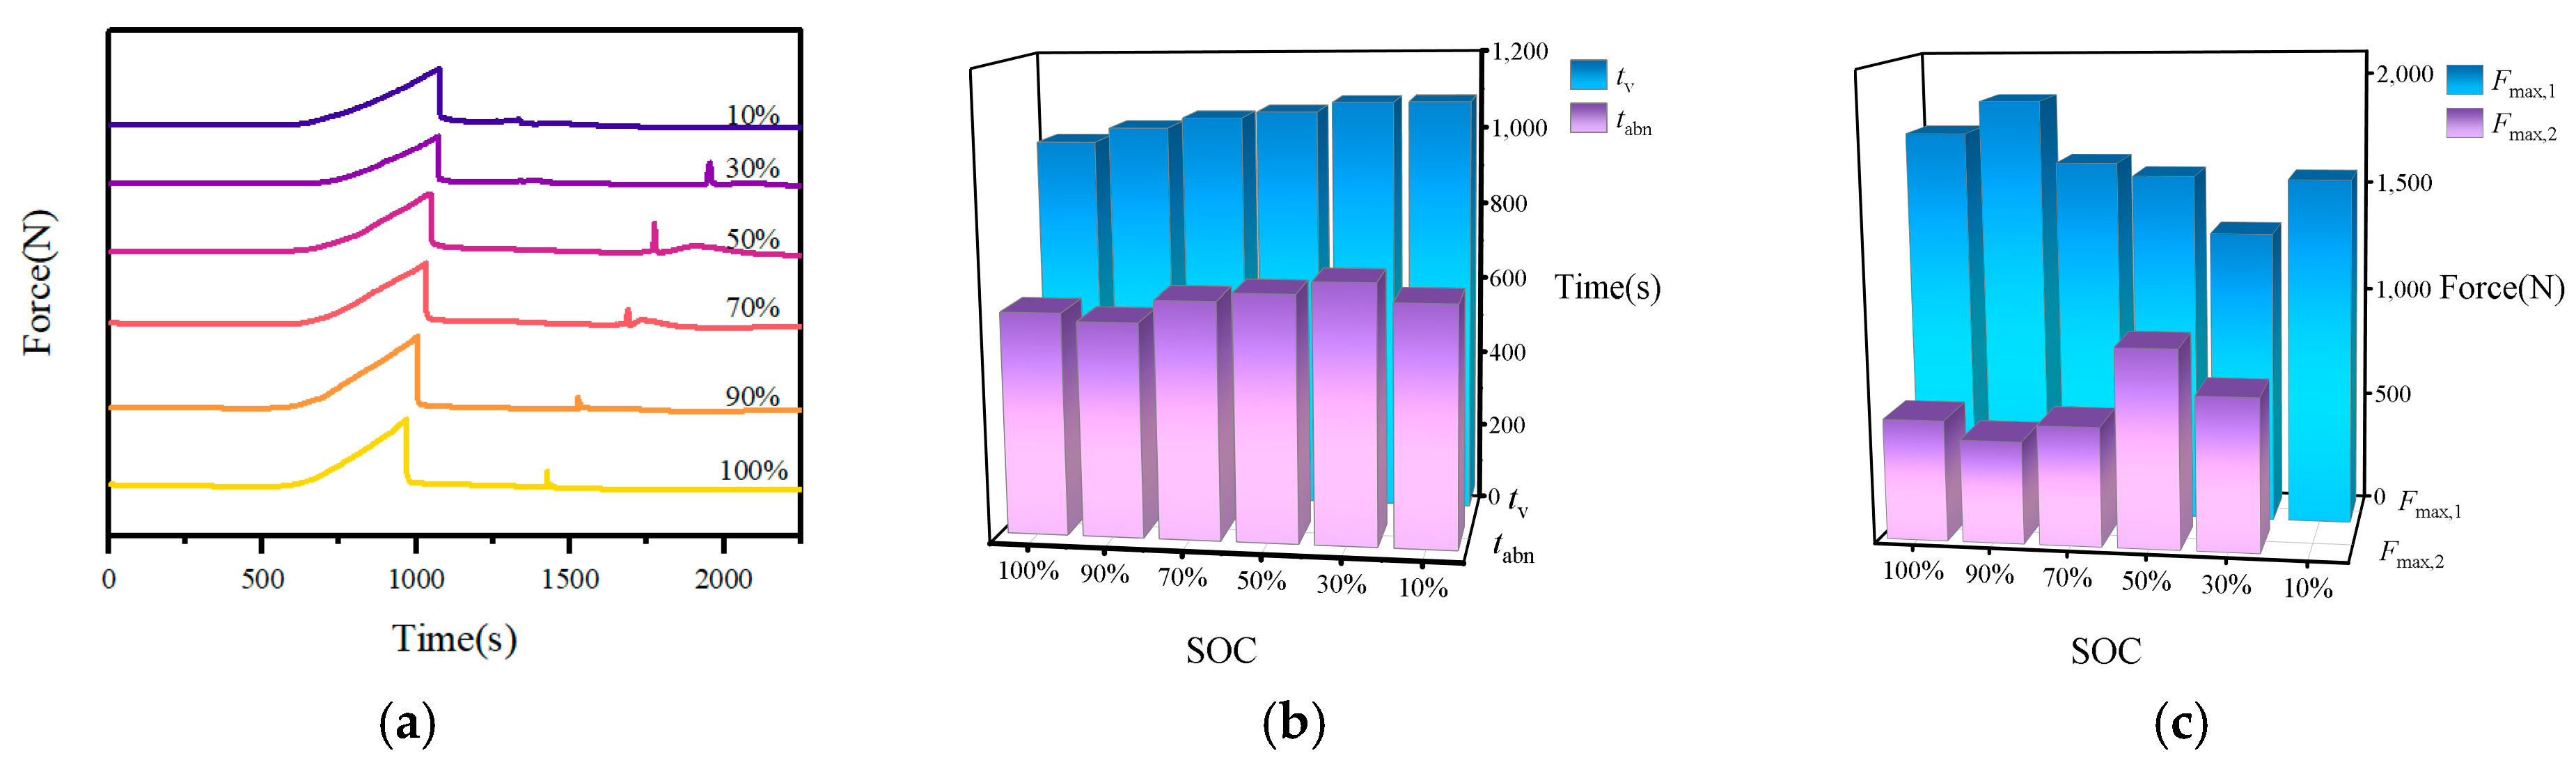
The expansion-force curves during thermal-abuse process at different SOCs are shown in Figure 5a. Except for the 10% SOC cell, which does not undergo TR due to insufficient lithium intercalation, the remaining five SOC cells exhibit a two-peak evolution characterized by two sharp increases in expansion force, each followed by a rapid decline. These increases correspond to the accumulation of internal pressure before the venting (first peak) and the transient impact accompanying the onset of TR (second peak).
Figure 5.
Variation curves and characteristic parameters of expansion force during thermal-abuse process at different SOCs: (a) variation curve, (b) characteristic time parameters, (c) characteristic expansion-force parameters.
The characteristic time parameters and force parameters at different SOCs are shown in Figure 5b and Figure 5c, respectively. The time at which the cell expansion force becomes abnormal (tabn) and the time when the expansion force reaches the first peak (tV) both generally decrease as SOC increases. This is attributed to the increased lithium intercalation in the anode with rising SOC, which intensifies irreversible side reactions, and thus initiates gas generation earlier within the cell. Consequently, the time to reach the mechanical limit of the cell casing becomes shorter.
The first expansion-force peak (Fmax,1) increases with SOC and reaches its highest value at 90% SOC. In comparison, the 100% SOC cell reacts more violently, impacting the casing and making it more prone to rupture and pressure relief. The casing undergoes large-area cracking before the force sensor can register the complete signal, so the theoretical maximum expansion force is not fully captured. Notably, the second expansion-force peak (Fmax,2) of cells at 30–50% SOC appears after TR, with the peak at 50% SOC being the highest. In contrast, for cells at 70–100% SOC, Fmax,2 occurs prior to TR and remains relatively small. This phenomenon is highly correlated with the TR behavior at different SOC levels. For the low- and medium-SOC cells (30% and 50%), venting is dominated by the ejection of gaseous products and electrolyte, which has limited impact on the casing and produces only small localized cracks; meanwhile, TR proceeds without ignition but with abundant white smoke, allowing the internal pressure to reaccumulate and thus form a relatively large Fmax,2. Conversely, high-SOC cells (70–100%) exhibit higher and higher internal temperatures and stronger reactivity, leading to more severe casing cracking during venting, so the internal pressure is largely released before TR; moreover, the ensuing fire and explosion rupture the casing entirely, resulting in instantaneous pressure release and further reducing the value of Fmax,2.
The determination of the 1 N/s threshold is further explained as follows. During the initial heating stage, dF/dt fluctuated around zero, whereas the onset of Stage II was characterized by a rapid increase in dF/dt to approximately 1 N/s or higher. Candidate thresholds of 0.5, 0.75, 1.0, 1.25, and 1.5 N/s were further compared. The corresponding tabn varied by only 17–51 s, indicating that the triggering time of tabn was not highly sensitive to the threshold within this range. Repeated expansion-force tests were also conducted at 30%, 50%, 70%, and 100% SOC to further examine the threshold-triggering behavior. In addition, three 1C charge–discharge cycles were conducted at 50 °C using the same battery model, fixture, preload force, and sensor arrangement as the TR tests. The maximum absolute value of dF/dt during the cycles was approximately 0.010 N/s. Meanwhile, it should be noted that the 1 N/s threshold is an empirical value determined for the present battery, preload condition, and fixture system. Local recalibration is required before applying the same threshold to other battery systems.
3.2.2. Temperature
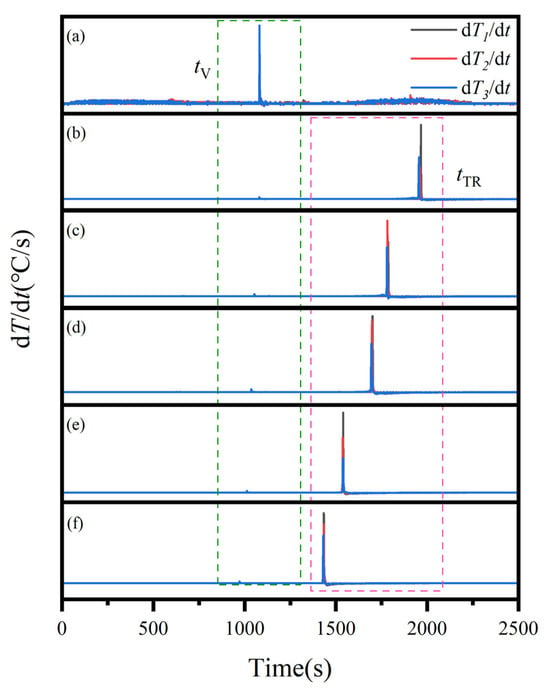
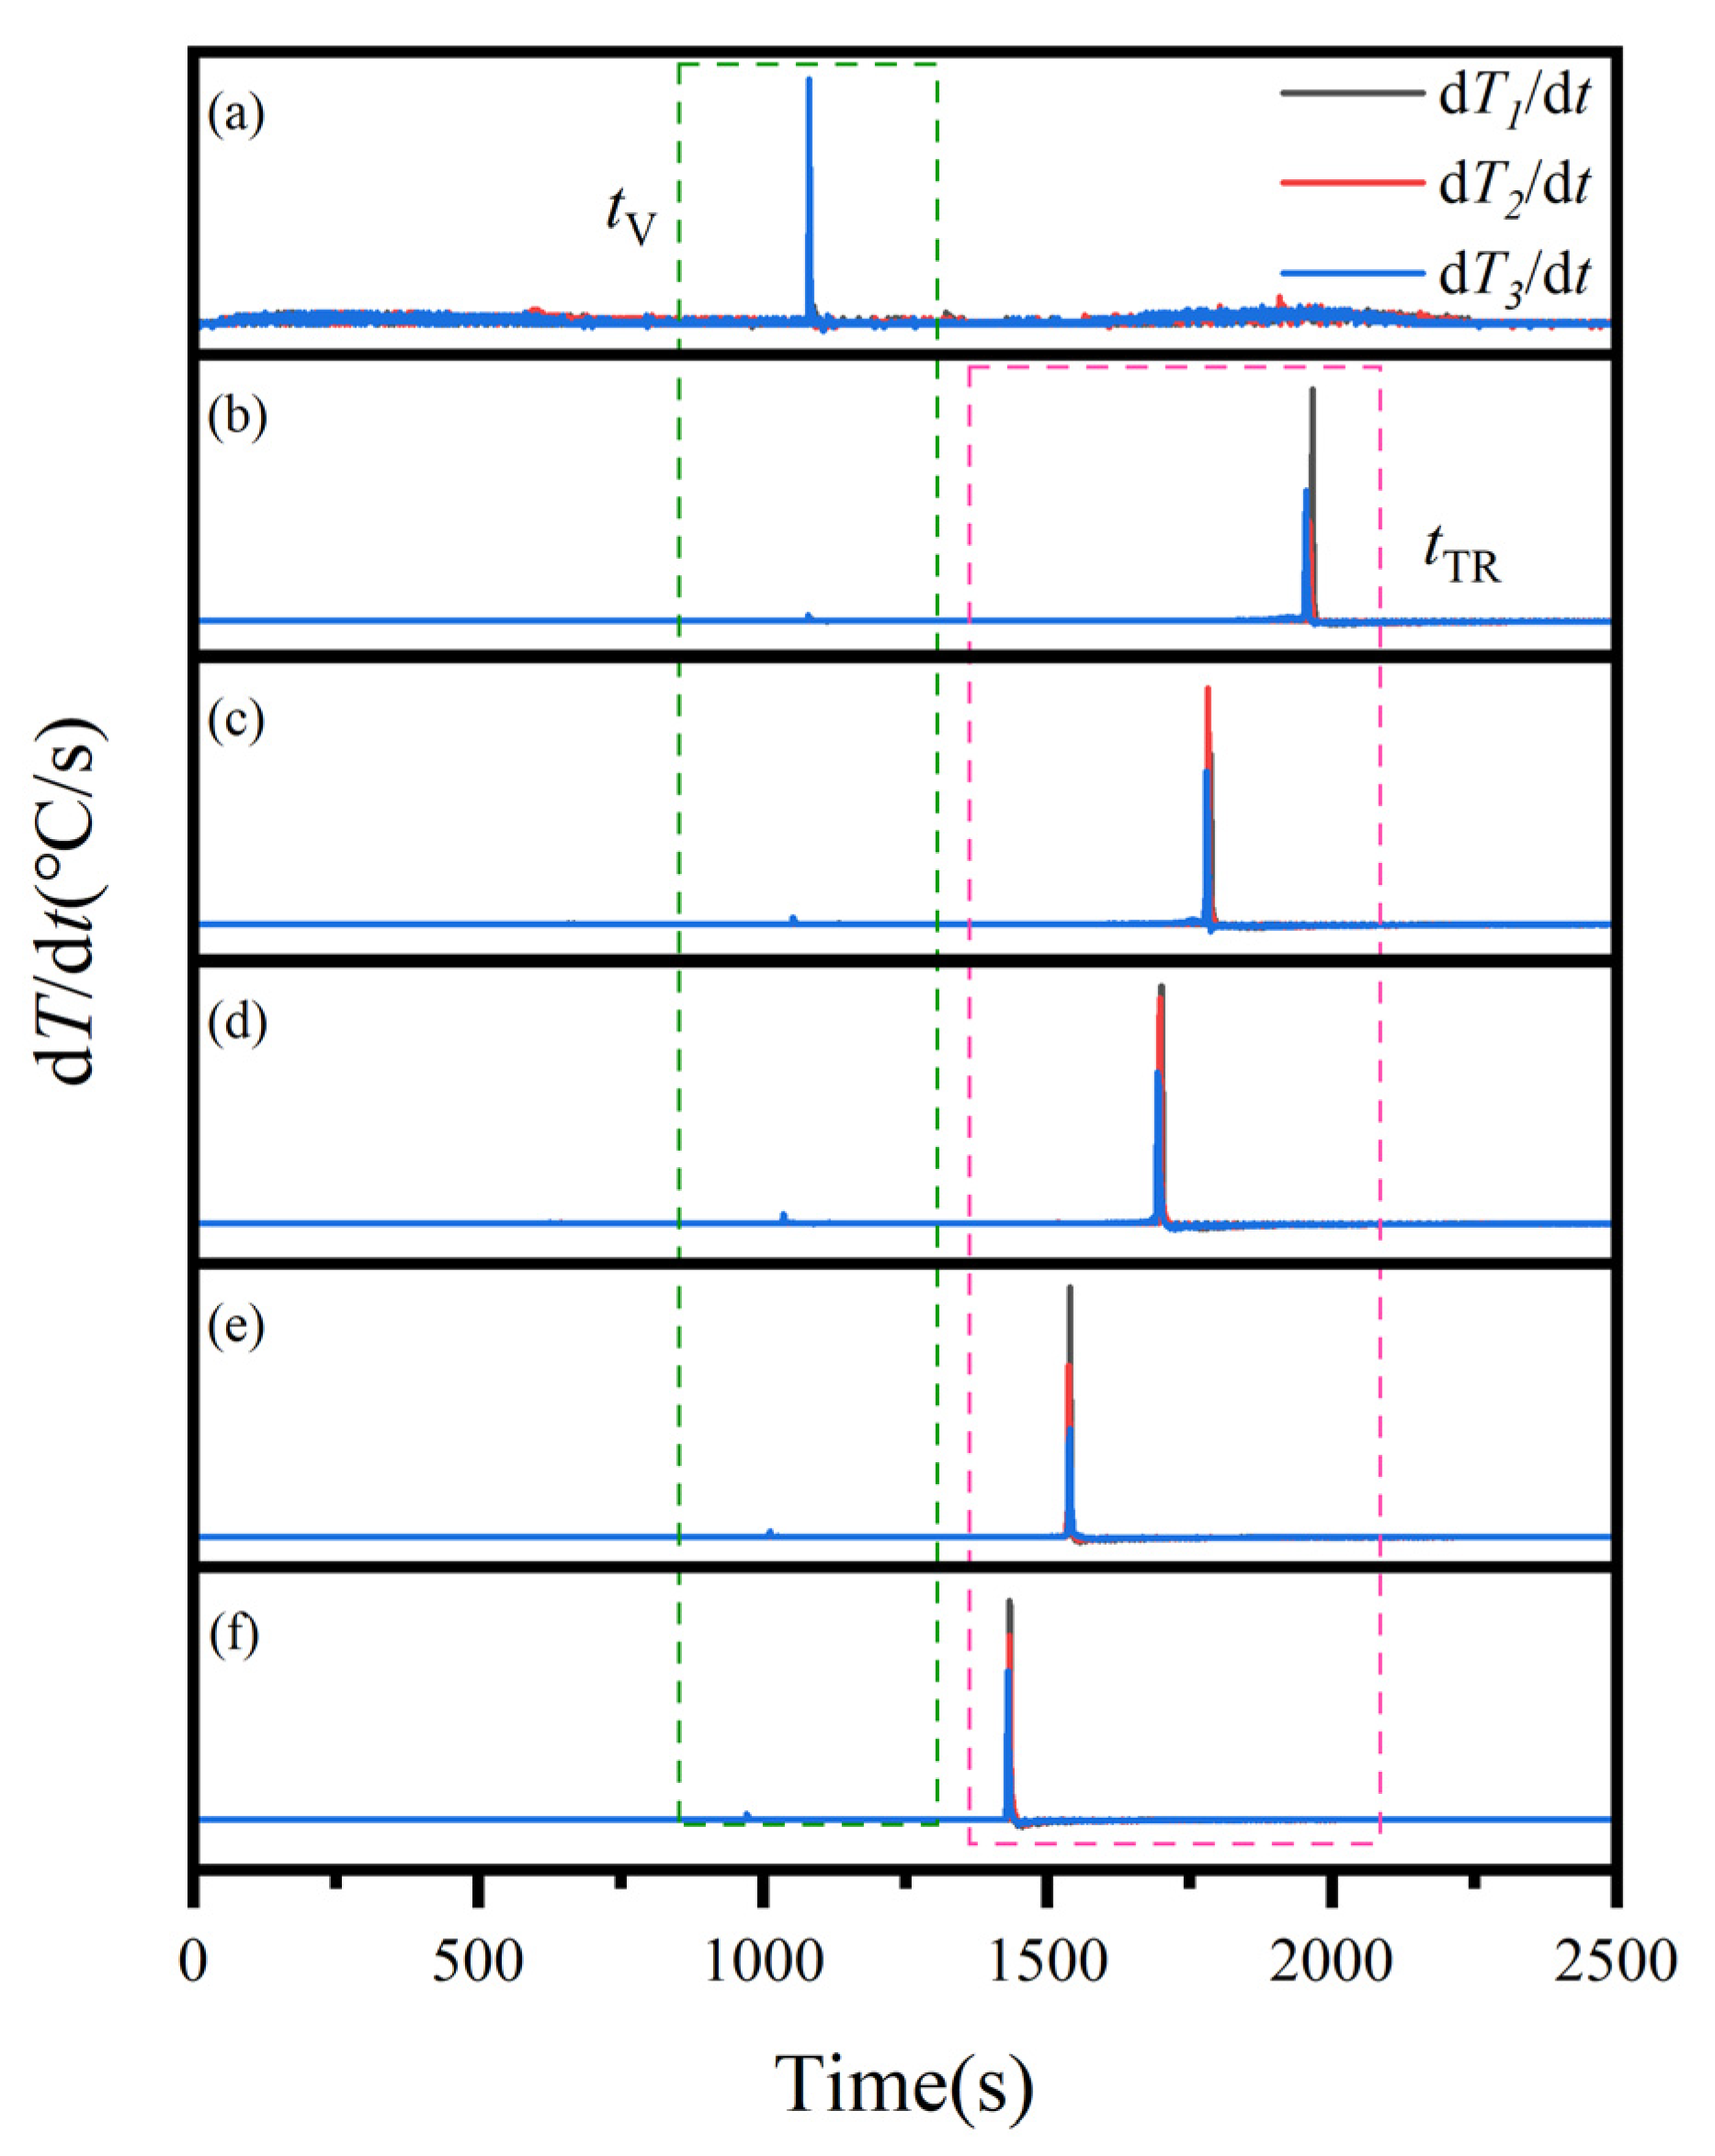
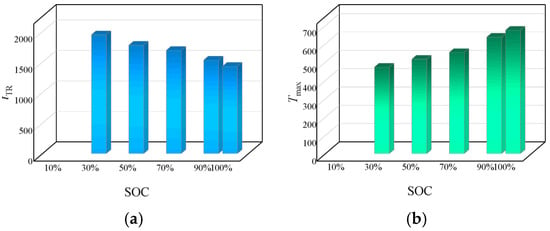
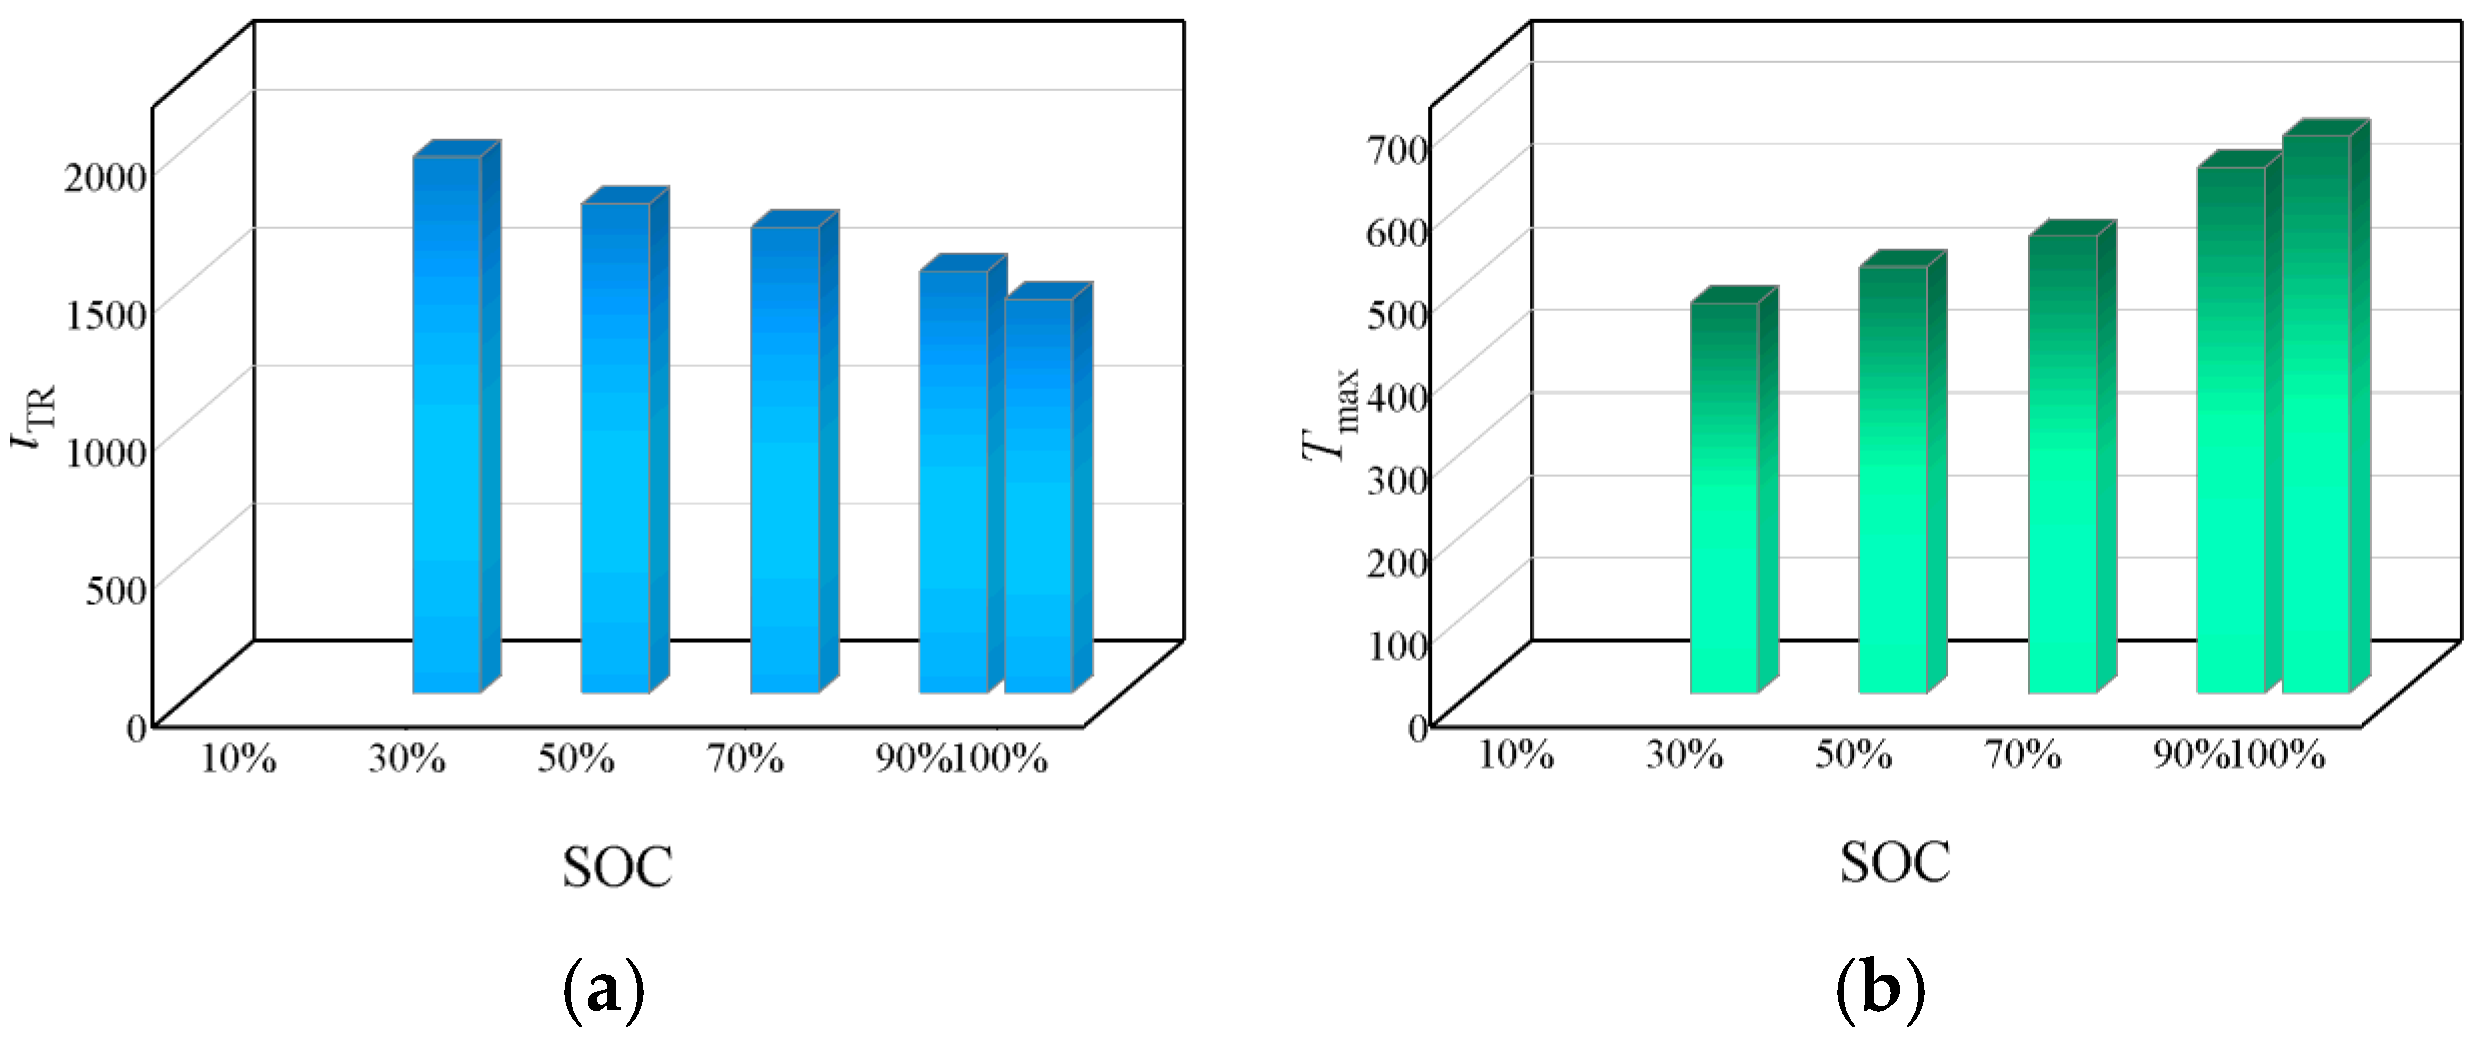
The temperature variation curves at three measurement points on the cell surface at different SOCs exhibit distinct evolution trends, as shown in Figure 6. After venting, a transient surge in the temperature-rise rate (dT/dt > 1 °C/s) lasting approximately 2–6 s is observed, mainly due to the instantaneous thermal shock of high-temperature and high-pressure ejecta on the cell surface. During the TR process, for low- and medium-SOC cells (30–70%), the rear measurement point is the first to exceed 1 °C/s, with subsequent fluctuations around this threshold for several tens of seconds before a sustained and stable increase is achieved. In contrast, for high SOC (90% and 100%) cells, the three measurement points reached 1 °C/s almost synchronously, with no threshold-oscillation stage. Consistent with the definition in Section 3.1, tTR represents the onset of the qualified sustained temperature-rise episode, rather than the completion time of the 10 s validation window. The characteristic time and temperature parameters at different SOCs are shown in Figure 7a and Figure 7b, respectively. The tTR decreases as SOC increases, while the maximum surface temperature of the cell (Tmax) rises with increasing SOC. However, the location of Tmax on the cell surface shifts with SOC. For low- and medium-SOC cells (30–70%), the highest surface temperature occurs at the rear of the cell, whereas for high-SOC cells (90% and 100%), it is found in the middle section. This shift results from differences in the dominant heat sources and heat-transfer pathways during TR at different SOCs. At high SOCs, extensive delithiation of the cathode triggers intense lattice oxygen release and electrolyte oxidation reactions, generating heat at a rate that significantly exceeds the rate of heat diffusion, causing the central region of the cell to become the hottest point. In contrast, at low and medium SOCs, the degree of cathode delithiation is low and the chain exothermic reactions are relatively mild, and TR appears to be more strongly associated with localized ISC and the resulting ohmic heating. Since the rear region lacks the heat-conduction path provided by the metallic tabs, localized heat accumulates at the rear, forming the highest temperature.
Figure 6.
Temperature-rise rate variation at three measurement points under different SOCs: (a) 10% SOC, (b) 30% SOC, (c) 50% SOC, (d) 70% SOC, (e) 90% SOC, and (f) 100% SOC.
Figure 7.
Characteristic time parameters and temperature parameters during thermal-abuse process at different SOCs: (a) tTR; (b) Tmax.
3.2.3. Voltage
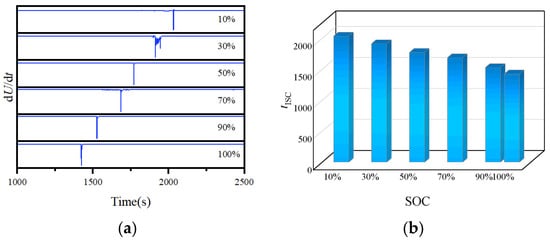
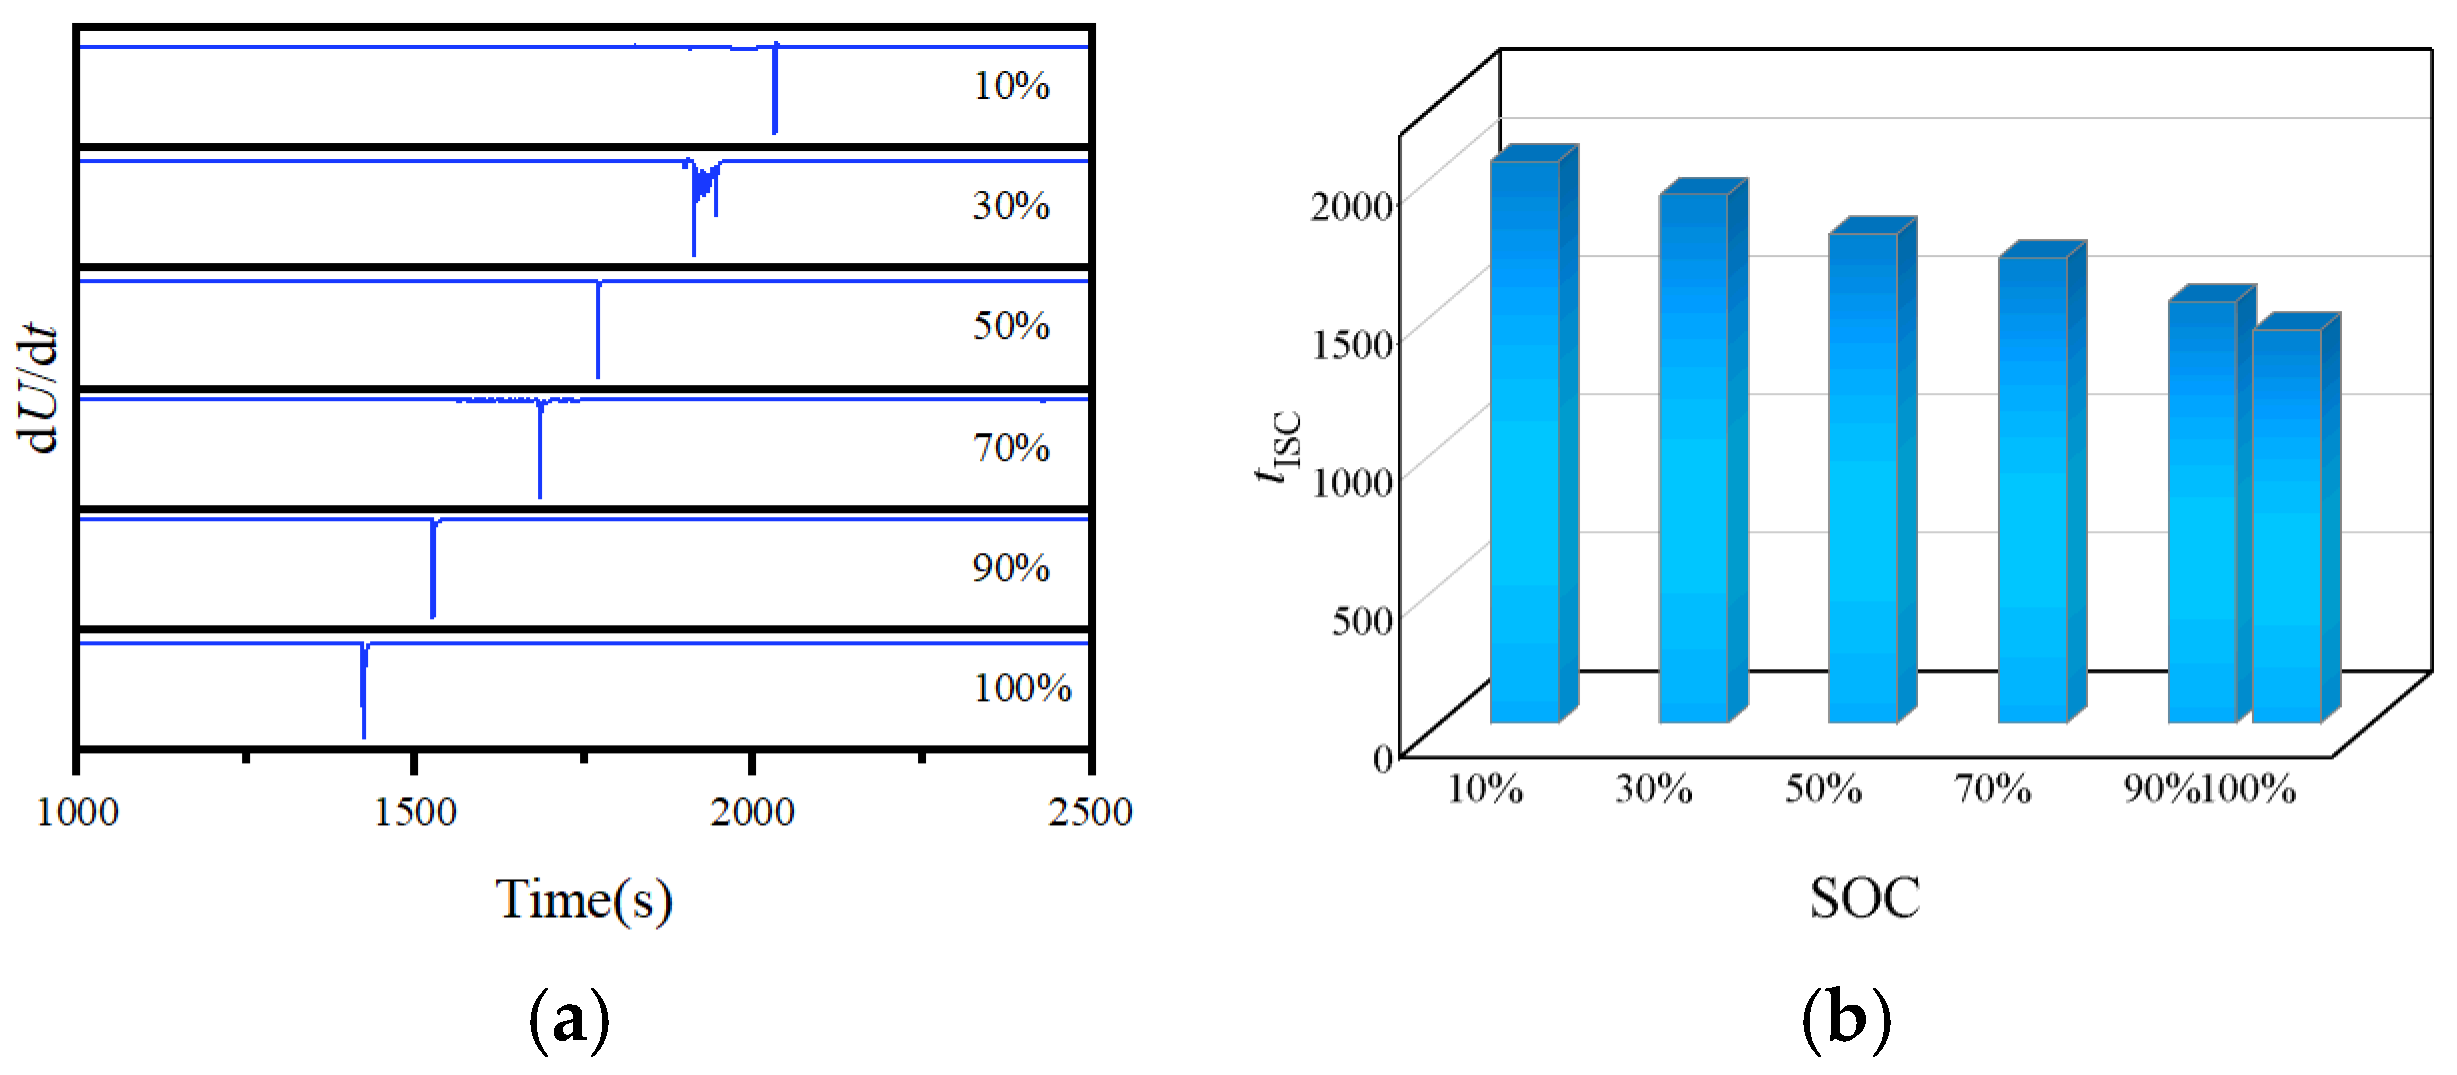
The voltage variation curves at different SOCs during the thermal-abuse process are illustrated in Figure 8a. For all SOCs, the cell voltage remains essentially stable for a prolonged period during the initial heating stage. Once the internal temperature of the cell reaches the melting point of the separator, the localized melting of the separator causes direct contact between the cathode and anode, thereby triggering ISC, which manifests as a rapid voltage drop. In this study, tISC is defined as the moment when the rate of voltage change first drops below −0.1 V/s (dU/dt < −0.1 V/s), a threshold commonly employed for identifying ISC [30]. The ISC moments at different SOCs are presented in Figure 8b. The tISC is clearly correlated with SOC; that is, the higher the SOC, the shorter the time to ISC. This indicates that at higher SOC, the degrees of cathode delithiation and anode lithiation are higher, which intensifies the exothermic reactions within the cell under external heating conditions. Consequently, the temperature reaches the melting point of the separator more rapidly, thereby triggering ISC. Moreover, the occurrence of ISC does not necessarily lead to TR. As depicted in Figure 8a, the 10% SOC cell exhibits a pronounced voltage drop at 2033 s (dU/dt = −0.852 V/s); however, its drop rate is significantly lower than those at other SOCs and the voltage does not drop to 0 V, and no self-heating-driven TR is triggered. In contrast, for the other SOCs, ISC occurs 4–33 s before TR. Based on thermal analysis of NCM batteries, Feng et al. [31] pointed out that ISC is not the main heat source during the TR process. Instead, TR is predominantly driven by redox reactions between the anode and cathode, with the heat generated from internal short circuits contributing only 9% of the total heat released during TR. This indicates that whether a cell undergoes TR mainly depends on the intensity of the internal chain exothermic reactions, while ISC provides only part of the heat.
Figure 8.
Voltage variation curves and characteristic parameters during thermal-abuse process at different SOCs: (a) voltage variation curves; (b) tISC.
3.2.4. Characteristic Gases
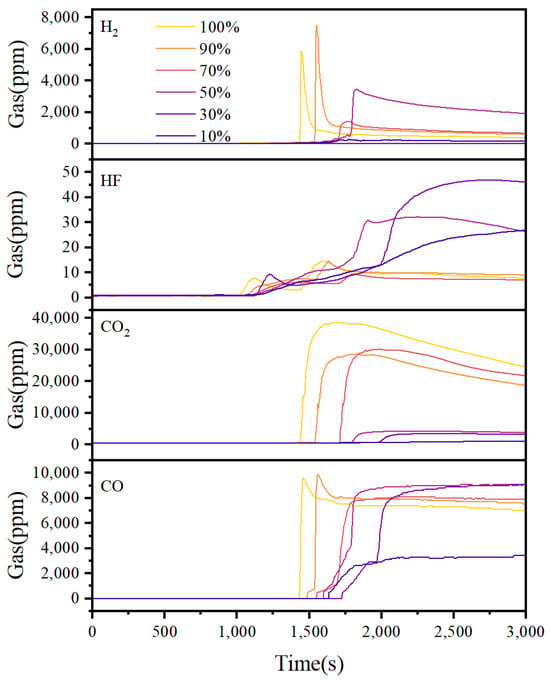
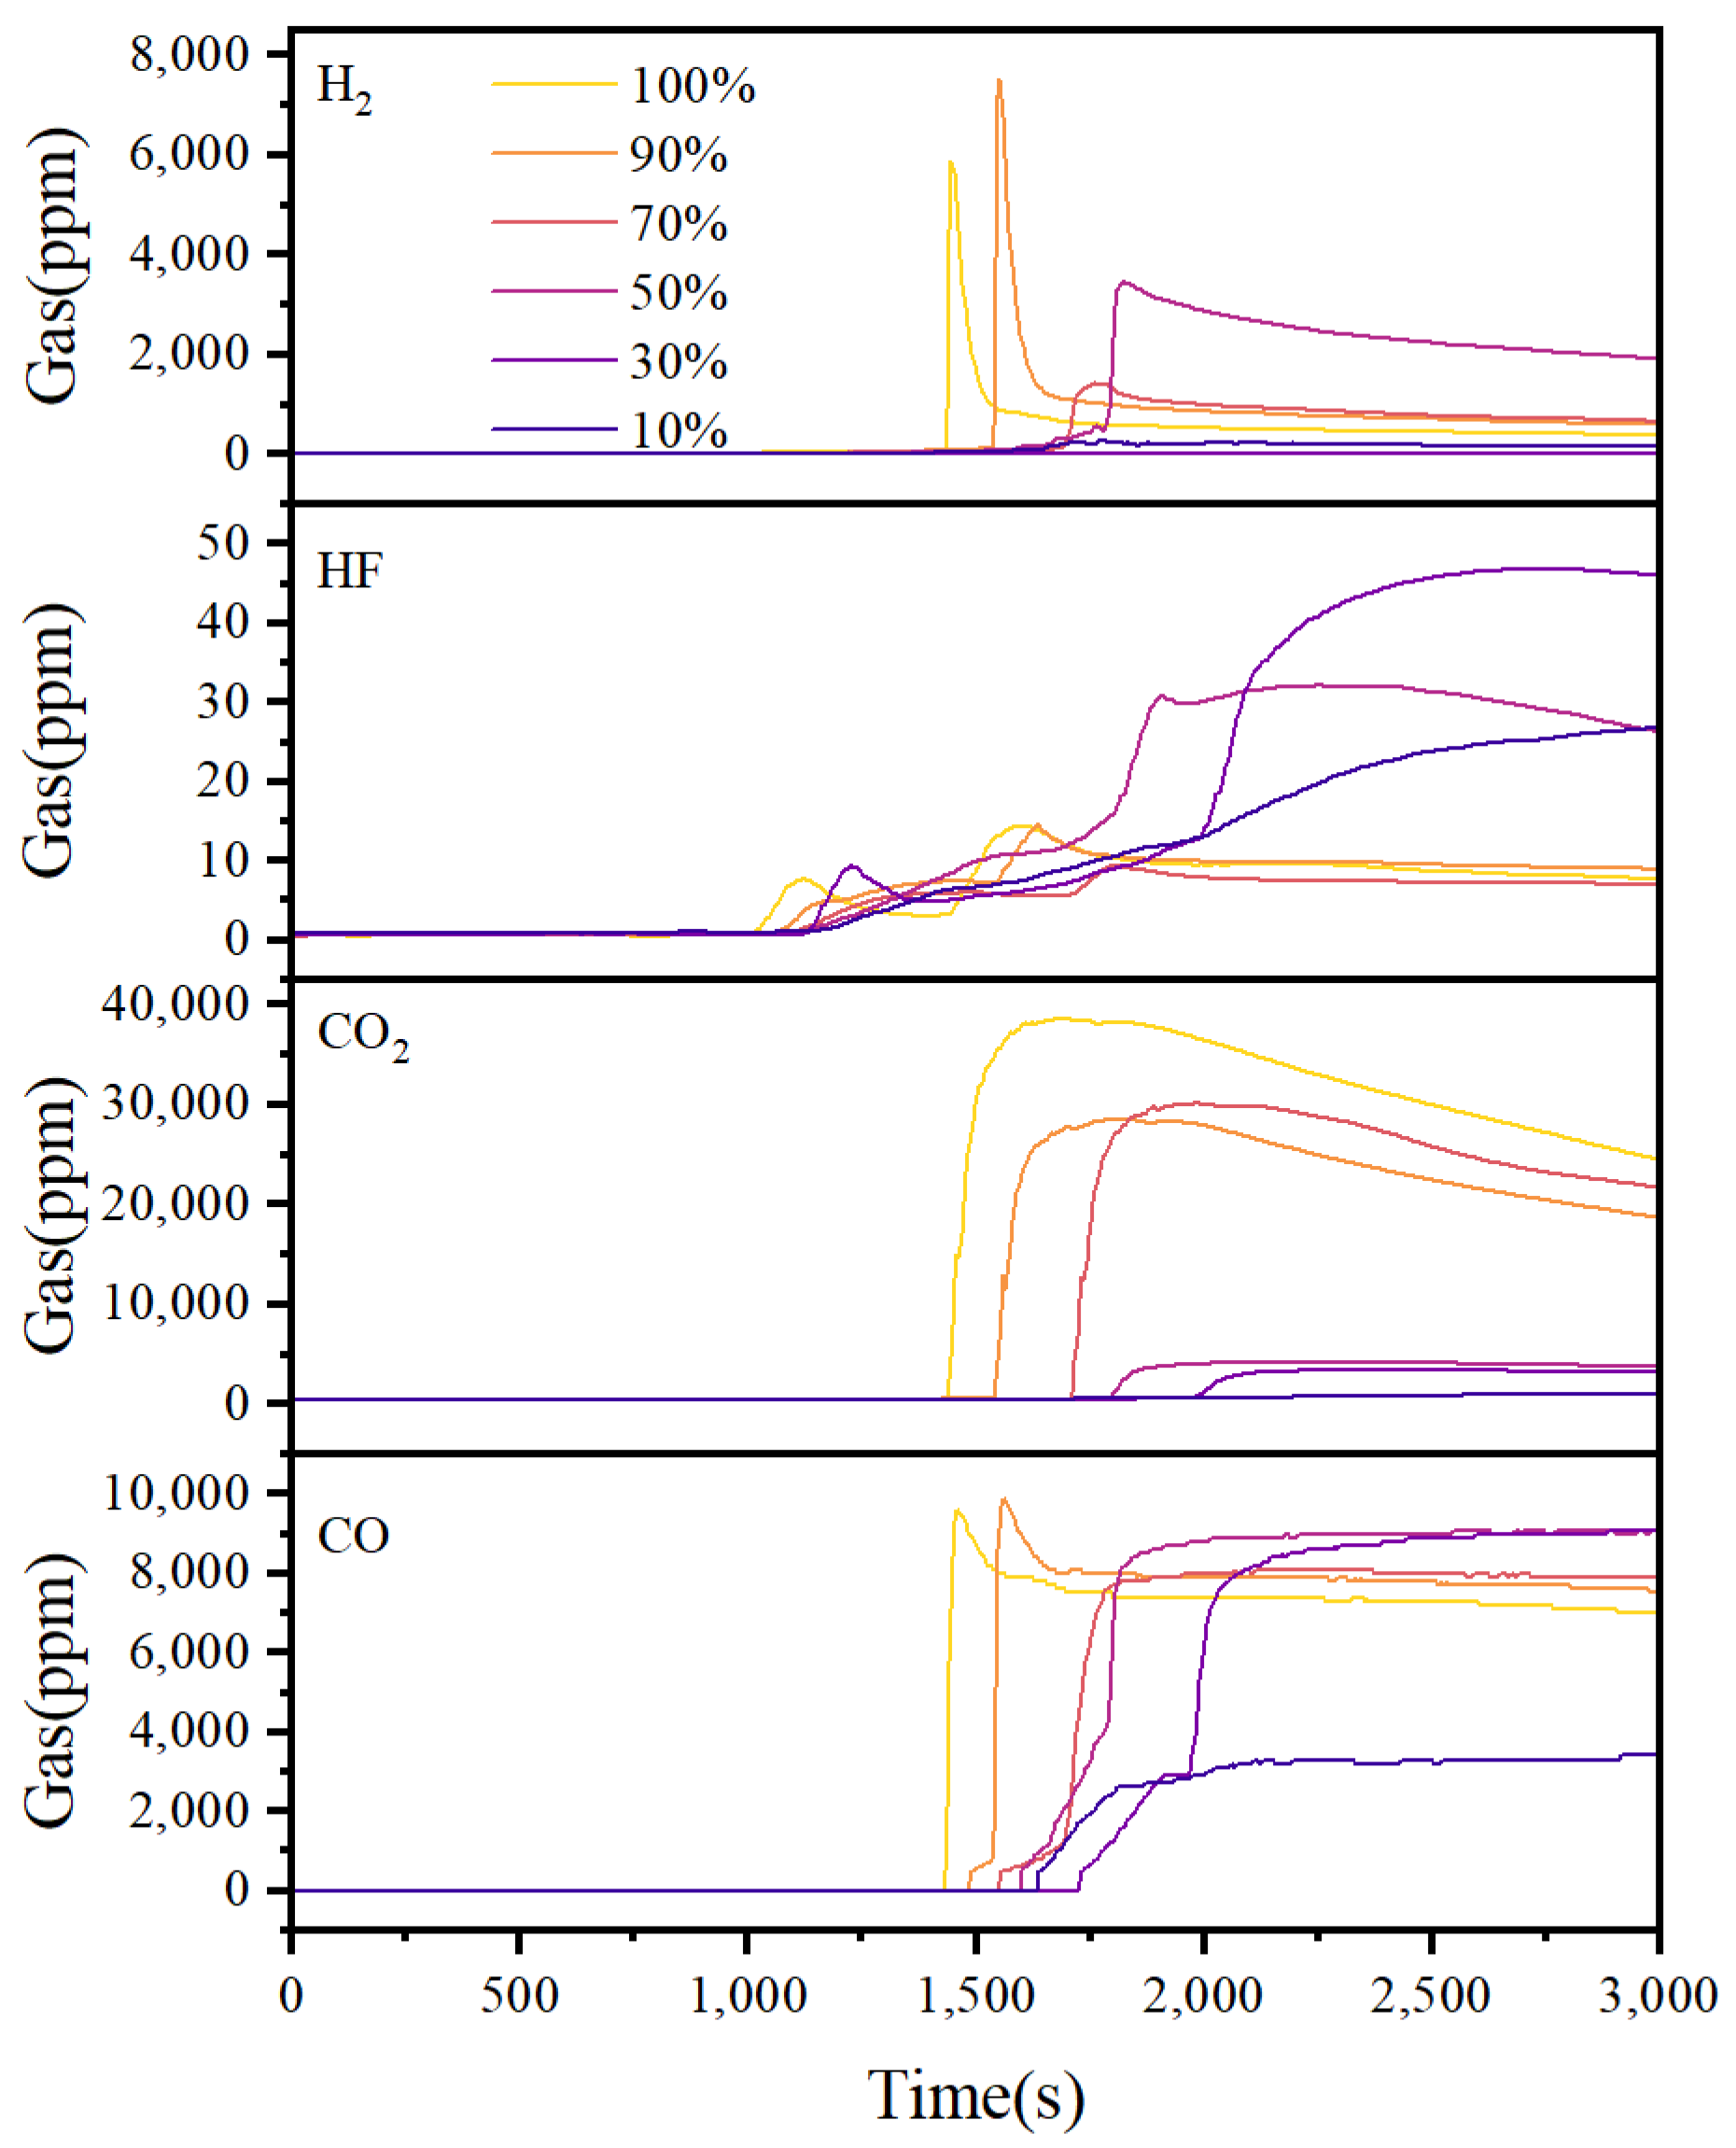
The concentration variation curves of characteristic gases (CO, CO2, H2, and HF) during the thermal-abuse process at different SOCs are illustrated in Figure 9, as recorded by the ACS gas analyzer. Before venting, both electrolyte volatiles and reaction-generated gases remain inside the cell, and the gas sensors exhibit no response. As heating continues and the mechanical limit of the cell casing is reached, the battery ruptures and releases gases, which prompts a gradual response from the gas sensors. This response intensifies until approximately 60 s after TR, when the gas concentration peaks.
Figure 9.
Variation curves of characteristic gas concentrations during the thermal-abuse process at different SOCs.
To accurately monitor the sequence of gas emissions, a low-range, high-resolution DF gas analyzer was employed. The initial detection times of characteristic gases at different SOCs are presented in Table 3. The initial detection times of the characteristic gases exhibit an overall decreasing trend with increasing SOC, with minor local fluctuations observed for CO2 and HF that fall within the range of cell-to-cell variation; CO and H2 are generally the first to be detected. The initial detection times of CO and H2 closely align with tV, exhibiting a time difference of less than 30 s.
Table 3.
Initial detection times of characteristic gases at different SOCs.
The peak concentrations of characteristic gases show a significant dependence on SOC (Table 4), with distinct evolution patterns among different species. Specifically, the CO2 concentration exhibits a stepwise increase: the peak concentrations are below 5000 ppm at low SOCs (30% and 50%) but rise sharply to approximately 30,000 ppm at medium–high SOCs (70%, 90%, and 100%). This correlates closely with the TR phenomena observed at different SOCs: cells at 70% SOC and above exhibit fire and explosive combustion, leading to the extensive oxidation of the electrolyte and anode materials, thus generating substantial amount of CO2. In contrast, the peak concentration of CO remains relatively high at all SOCs, with relatively small fluctuations. The main sources of CO are attributed to the incomplete oxidation of electrolyte solvents and reduction reactions between the anode and electrolyte. Even when TR manifested as smoke ejection without ignition, the CO generation pathway remained prevalent. HF mainly originates from the hydrolysis of the LiPF6 salt and the decomposition of the PVDF binder. The relatively high HF detection values at low SOC may be related to two factors: (i) under flameless TR conditions, localized overheating areas experience prolonged heat accumulation, which may promote more complete decomposition reactions of binders; (ii) at a high SOC, the higher reaction temperature may cause the generated HF to react with other products, thereby reducing the detectable HF concentration.
Table 4.
Peak concentrations of characteristic gases at different SOCs.
3.2.5. Warning Signal Applicability
The expansion force, temperature, voltage, and characteristic gas exhibit distinct evolution sequences and SOC dependencies during the thermal-abuse process. The occurrence times and lead times of each characteristic signal, referenced to tTR, are presented in Table 5 and Table 6, respectively. The tabn appears first, with a lead time of 847–1275 s; this is followed by tV and tG, with lead times of 449–871 s. The tISC occurs last, with a lead time of only 4–33 s. This sequence remains consistent across all TR-triggered SOCs, indicating that the expansion-force signal provides the longest early-warning lead time and can serve as the earliest warning indicator. This is because the internal pressure rise caused by electrolyte volatilization and gas generation from internal side reactions is a cumulative process, which can be captured by the force sensor before visible casing deformation or significant temperature increase occurs. Among the gas signals, the initial detection times of CO remained below 30 s after venting in all tests, while H2 was generally detected within 30 s after venting in the TR-triggered cells, and thus can serve as a chemical confirmation of the venting event and, together with tV, constitutes the trigger basis for Level 2 warning. The rapid voltage drop at the tISC occurs 4–33 s before TR, enabling accurate indication of ISC. However, since the 10% SOC cell experienced ISC without ultimately undergoing TR, the voltage signal alone cannot predict whether TR will occur. After cell venting, the surface temperature-rise rate exceeds 1 °C/s and persists for 2–6 s. Therefore, exceedance at a single measurement point may be a spurious signal caused by cell rupture and venting. In contrast, during TR, the cell surface temperature-rise rate exceeds 1 °C/s for more than 10 s, necessitating the introduction of a one-point temperature-rise-rate criterion combined with a duration requirement to distinguish thermal shock from self-sustaining exothermic reactions.
Table 5.
Timing of characteristic signal emergence.
Table 6.
Lead times of characteristic signal emergence.
In summary, the four types of signals have distinct roles in the early-warning system. The expansion-force signal provides the largest lead time and is triggered consistently across all tested SOCs, making it suitable for the earliest anomaly identification. The gas signal closely follows the venting event and provides chemical confirmation. The voltage signal accurately identifies ISC indicating that TR is imminent. The temperature signal, when combined with a duration requirement, provides the final confirmation of self-sustaining TR. Therefore, no single signal is sufficient on its own, and a multi-parameter hierarchical early-warning strategy is necessary.
3.3. Hierarchical Early-Warning Strategy for TR Induced by Thermal Abuse
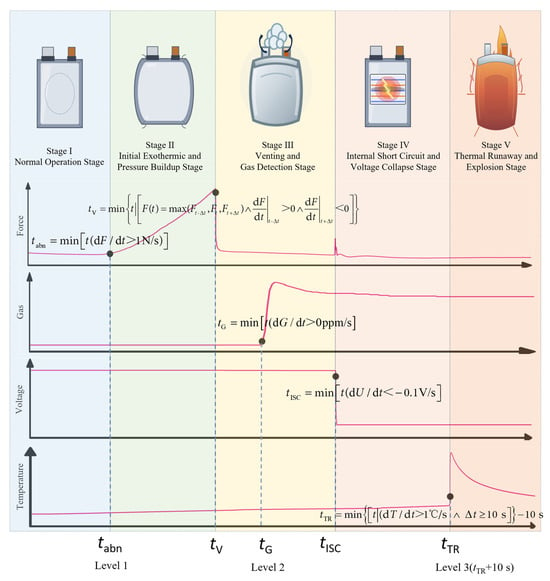
Based on the five characteristic moments defined in Section 3.1 (tabn, tV, tG, tISC, and tTR) and the evolution of the four characteristic signals analyzed in Section 3.2 (expansion force, gas, voltage, and temperature), a three-level early-warning strategy for thermal-abuse-induced TR is established (Figure 10). The triggering criteria, physical significance, and response measures for each level are described below.
Figure 10.
Three-level early-warning strategy for thermal-abuse-induced TR.
Level 1 is triggered when dF/dt > 1 N/s (tabn), corresponding to the onset of Stage II. The abnormal increase in expansion force is the earliest measurable signal of the entire TR process, occurring more than 847 s prior to TR onset. This signal can therefore serve as an independent triggering condition for Level 1, maximizing the available warning time. At this stage, irreversible reactions initiate inside the cell, resulting in accelerated gas generation. The recommended countermeasures are to enhance monitoring, disconnect the charge–discharge circuit, and prepare for isolation.
Level 2 relies on a two-step, sequential force–gas confirmation criterion. The positive-to-negative transition of dF/dt at tV is first used to identify the venting event and initiates a 30 s gas-validation window. Level 2 is formally issued when either CO or H2 shows a sustained departure from its baseline within this window. As the force signal may be affected by fixture loosening or other mechanical disturbances, the earliest characteristic gas response is introduced as chemical confirmation. Unlike the strategy in ref. [22], where gas detection acts as one of multiple independent parallel Level 2 triggers, the proposed criterion requires the gas response to occur within a 30 s validation window following force-based venting identification. As shown in Table 3 and Table 5, CO was detected within 8–25 s after venting in all tests, whereas H2 was detected within 11–28 s after venting in the TR-triggered cells. Therefore, the actual Level 2 triggering time corresponds to the first detection time of CO in the present experiments. At this point, the cell has begun venting, and the internal side-reaction products have been released and become detectable. The recommended countermeasures include cutting off power, shutting down the system, isolating the module, and activating smoke exhaust and ventilation.
Level 3 is the final emergency-confirmation level based on a temporal voltage–temperature criterion. When dU/dt falls below −0.1 V/s, a voltage-event flag corresponding to the development of an internal short circuit is recorded. Level 3 is issued when dT/dt at any one temperature measurement point has remained above 1 °C/s for more than 10 s within the same thermal-runaway episode. Thus, the voltage and temperature anomalies are not required to begin at the same sampling instant. The voltage signal provides the electrical event marker, while the sustained temperature-rise condition confirms that self-accelerating heat generation has been established. The rationale for using a combined criterion is twofold. First, the 10% SOC cell exhibits a sudden voltage drop at 2033 s (dU/dt = −0.852 V/s) without undergoing TR, indicating that a voltage-only criterion would cause false alarms. Second, venting-induced thermal shock can cause dT/dt to exceed 1 °C/s instantaneously for only 2–6 s; therefore, an instantaneous temperature-rise-rate threshold alone is also insufficient. The 10 s duration requirement excludes this transient venting-induced thermal shock.
In the present experiments, tTR denotes the onset of the qualified sustained temperature-rise episode, whereas Level 3 is issued when the temperature-duration condition is completed, namely 10 s after tTR. In strict real-time implementation, the alarm is issued at the first sampling point after the duration has exceeded 10 s. Since the voltage event occurs 4–33 s before tTR, while Level 3 is issued 10 s after tTR, Level 3 has no positive lead time relative to the physical onset of TR. Its role is the final confirmation of TR and the activation of emergency measures, whereas the primary early-warning capability is provided by Levels 1 and 2. At this point, ISC has occurred inside the cell and self-accelerating heat generation is in progress. It is recommended to initiate fire-suppression and explosion-mitigation measures, along with the emergency evacuation of personnel.
To further clarify the temporal relationship among the three warning levels, the triggering times corresponding to the proposed warning criteria are defined by Equations (6)–(8), and the resulting trigger times are summarized in Table 7. Herein, tL1, tL2, and tL3 denote the triggering times of the three warning levels, respectively, and the lead time of each warning level is defined relative to tTR.
Table 7.
Triggering times and lead times of the three-level early-warning strategy under different SOC levels.
All the criteria are based on rates of change and characteristic events, and do not require SOC-dependent correction within the tested SOC range of 10–100%. Although tabn, tV, tG, tISC, and tTR generally shift to earlier times as SOC increases, the thresholds for each warning level require no SOC correction. The warning system can thus be deployed without prior knowledge of the SOC, which makes it highly practical for engineering applications. It should also be noted that the 10% SOC cell would trigger Level 2 warning (venting with gas detection) but not Level 3. Given that venting itself implies the release of electrolyte vapor and other flammable gases, the Level 2 trigger is by no means a false alarm—the target of this strategy is the evolution of the TR risk, not merely the moment of TR onset.
4. Conclusions
In this study, 15 Ah NCM811 pouch LIBs were selected as the research object. The evolution of expansion force, temperature, voltage, and characteristic gases during TR under overheating abuse conditions at different SOCs (10–100%) were systematically investigated, and a multi-parameter hierarchical early-warning strategy was proposed. The main conclusions are as follows.
(1) The TR process can be divided into five stages: normal operation stage (Stage I), initial exothermic and pressure-buildup stage (Stage II), venting and gas-detection stage (Stage III), internal short circuit and voltage collapse stage (Stage IV), and thermal runaway stage (Stage V). Before TR occurs, characteristics such as abnormal expansion-force increase, cell venting, voltage drop, and sharp increase in temperature-rise rate can be observed. Therefore, the transitions between these stages are determined by the moment of abnormal expansion-force growth, cell venting, ISC, and TR initiation.
(2) The evolution of multidimensional signals with SOC and the determination of the warning parameters are examined. As SOC increases, the degrees of cathode delithiation and anode lithiation deepen, leading to accelerated internal reaction rates, and thus resulting in earlier occurrences of tabn, tV, tG, tISC, and tTR. Among these signals, the expansion-force signal is suitable for earliest abnormal identification, while the gas signal synchronizes with venting events for chemical confirmation. Voltage signals accurately indicate ISC, and the sustained temperature-rise signal confirms the establishment of self-accelerating TR. Each individual signal has inherent limitations, making the establishment of a multi-parameter hierarchical early-warning strategy essential.
(3) A three-level early-warning strategy was proposed. Level 1 is triggered by dF/dt exceeding 1 N/s, with recommended actions including enhanced monitoring, interruption of charge and discharge circuits, and preparation for isolation. Level 2, based on sequential force–gas confirmation, is triggered when dF/dt changes from positive to negative, and characteristic gas CO or H2 is detected within 30 s, with recommended actions including power shutdown, module isolation, and initiation of smoke ventilation. Level 3, based on voltage–temperature confirmation, is triggered when dU/dt falls below −0.1 V/s and dT/dt at any one measurement point exceeds 1 °C/s for more than 10 s, with recommended actions including the activation of fire suppression and explosion-prevention measures, alongside the emergency evacuation of personnel. The thresholds for the warning parameters are determined based on rates of change and characteristic events, eliminating the need for SOC corrections and demonstrating strong engineering applicability.
Author Contributions
Conceptualization, J.S.; data curation, J.C. and F.Z.; investigation, J.C., F.Z., J.S., T.Z., J.L., Y.X. and S.W.; methodology, J.C., F.Z. and J.S.; project administration, T.Z. and J.L.; writing—original draft preparation, J.C. and F.Z.; writing—review and editing, J.S.; validation, Y.X. and S.W.; visualization, J.C. and F.Z.; supervision, J.S.; funding acquisition, J.S.; resources, J.S. All authors have read and agreed to the published version of the manuscript.
Funding
This research received no external funding.
Data Availability Statement
All data needed to support the conclusions in the paper are presented in the manuscript. Additional data related to this paper may be requested from the corresponding author upon request.
Conflicts of Interest
The authors declare no conflicts of interest.
References
- Feng, X.N.; Ren, D.S.; He, X.M.; Ouyang, M.G. Mitigating Thermal Runaway of Lithium-Ion Batteries. Joule 2020, 4, 743–770. [Google Scholar] [CrossRef] [Scilit]
- Gong, X.; Wong, S.K.; Ye, H.Q.; Qing, Y.M.; Zhou, Q.R.; Liu, Z.Y.; Guo, H.T.; Wu, T.T.; Jin, C.Y.; Wang, Q.Z.; et al. Traced state of charge for lithium-ion battery thermal runaway accidents. J. Energy Storage 2026, 148, 120133. [Google Scholar] [CrossRef] [Scilit]
- Liu, J.L.; Zhang, Y.; Zhou, L.F.; Han, C.L.; He, T.F.; Wang, Z.R. Influencing factors of lithium-ion battery thermal runaway in confined space. J. Energy Storage 2023, 73, 109125. [Google Scholar] [CrossRef] [Scilit]
- Wang, Q.S.; Mao, B.B.; Stoliarov, S.I.; Sun, J.H. A review of lithium ion battery failure mechanisms and fire prevention strategies. Prog. Energy Combust. Sci. 2019, 73, 95–131. [Google Scholar] [CrossRef] [Scilit]
- Liu, Z.; Guo, X.R.; Meng, N.; Yu, Z.L.; Yang, H. Study of thermal runaway and the combustion behavior of lithium-ion batteries overcharged with high current rates. Thermochim. Acta 2022, 715, 179276. [Google Scholar] [CrossRef] [Scilit]
- Sun, J.; Li, J.G.; Zhou, T.; Yang, K.; Wei, S.P.; Tang, N.; Dang, N.N.; Li, H.; Qiu, X.P.; Chen, L.Q. Toxicity, a serious concern of thermal runaway from commercial Li-ion battery. Nano Energy 2016, 27, 313–319. [Google Scholar] [CrossRef] [Scilit]
- Wang, J.F.; Chen, B.W.; Li, Y.H.; Hu, T.; Liu, F.; Shi, M.Y.; Ren, X.T.; Jia, Y.K.; Li, W.H. Multiparameter warning of lithium-ion battery overcharge-thermal runaway. J. Energy Storage 2024, 78, 110088. [Google Scholar] [CrossRef] [Scilit]
- Yang, J.H.; Sung, J.Y.; Kweon, H.; Kim, S.; Kim, B.; Kim, J.; Mun, J.; Kim, J.H.; Kim, K.J. A Review of Failure Modes and Safety Strategies of Lithium-Ion Batteries from Materials to Systems. Adv. Sci. 2026, 13, e76228. [Google Scholar] [CrossRef] [Scilit]
- Mei, J.; Shi, G.Q.; Liu, H.; Wang, Z.; Chen, M.Y. Experimental study on the effect of passive retardation method for thermal runaway mitigation of lithium-ion battery. Appl. Therm. Eng. 2023, 230, 120861. [Google Scholar] [CrossRef] [Scilit]
- Zhang, X.; Chen, S.; Zhu, J.Z.; Gao, Y.Z. A Critical Review of Thermal Runaway Prediction and Early-Warning Methods for Lithium-Ion Batteries. Energy Mater. Adv. 2023, 4, 0008. [Google Scholar] [CrossRef] [Scilit]
- Cheng, Z.X.; Ju, L.R.; Li, J.Y.; Qin, P.; Zhao, Z.W.; Mei, W.X.; Bao, H.H.; Jin, K.Q.; Meng, X.D.; Wang, Q.S. Early warning of thermal runaway for larger-format lithium iron-phosphate battery by coupling internal pressure and temperature. Appl. Energy 2025, 383, 125396. [Google Scholar] [CrossRef] [Scilit]
- Wang, Q.S.; Ping, P.; Zhao, X.J.; Chu, G.Q.; Sun, J.H.; Chen, C.H. Thermal runaway caused fire and explosion of lithium-ion battery. J. Power Sources 2012, 208, 210–224. [Google Scholar] [CrossRef] [Scilit]
- Wu, X.Y.; Li, K.Y.; Wang, H.; Liu, W.L.; Mao, B.B.; Zhang, Y. An electricity-gas-temperature multi-parameter fusion based early warning strategy for thermal runaway of large format lithium iron phosphate batteries. Process Saf. Environ. Prot. 2025, 200, 107320. [Google Scholar] [CrossRef] [Scilit]
- Lin, C.J.; Mao, J.B.; Zhang, X.T.; Yan, T.; Qi, C.; Yang, J.; Feng, X.N. A study of expansion force propagation characteristics and early warning feasibility for the thermal diffusion process of lithium-ion battery modules. J. Energy Storage 2024, 98, 113076. [Google Scholar] [CrossRef] [Scilit]
- Qian, G.J.; Zhu, Z.C.; Sun, Y.D.; Zheng, Y.J.; Han, X.B.; Ouyang, M.G. Cross-capacity internal temperature estimation in lithium-ion batteries using multiple impedance features from the negative electrode. Appl. Energy 2025, 396, 126259. [Google Scholar] [CrossRef] [Scilit]
- Zhong, G.B.; Mao, B.B.; Wang, C.; Jiang, L.; Xu, K.Q.; Sun, J.H.; Wang, Q.S. Thermal runaway and fire behavior investigation of lithium-ion batteries using modified cone calorimeter. J. Therm. Anal. Calorim. 2019, 135, 2879–2889. [Google Scholar] [CrossRef] [Scilit]
- Jin, Y.; Zheng, Z.K.; Wei, D.H.; Jiang, X.; Lu, H.F.; Sun, L.; Tao, F.B.; Guo, D.L.; Liu, Y.; Gao, J.F.; et al. Detection of Micro-Scale Li Dendrite via H2 Gas Capture for Early Safety Warning. Joule 2020, 4, 1714–1729. [Google Scholar] [CrossRef] [Scilit]
- Jia, T.; Zhang, Y.; Ma, C.Y.; Yu, H.; Hu, S.H. The early warning for thermal runaway of lithium-ion batteries based on internal and external temperature model. J. Energy Storage 2024, 83, 110690. [Google Scholar] [CrossRef] [Scilit]
- Li, K.J.; Chen, L.; Gao, X.L.; Lu, Y.; Wang, D.P.; Zhang, W.X.; Wu, W.X.; Han, X.B.; Cao, Y.C.; Wen, J.Y.; et al. Implementing expansion force-based early warning in LiFePO4 batteries with various states of charge under thermal abuse scenarios. Appl. Energy 2024, 362, 122998. [Google Scholar] [CrossRef] [Scilit]
- Yang, J.; Yang, Y.; Deng, W.; Liu, T.T.; Chen, D.; Wang, M.; Xie, J.; Zhang, Q.S. Early warning strategy of thermal runaway for aviation lithium-ion batteries from operando parameters evaluation. Chem. Eng. J. 2026, 529, 172781. [Google Scholar] [CrossRef] [Scilit]
- Huang, J.H.; Zhu, G.Q.; Guo, D.L.; Huang, J.; Xiao, P.; Liu, T. Study on the extreme early warning method of thermal runaway utilizing li-ion battery strain. Appl. Energy 2025, 384, 125494. [Google Scholar] [CrossRef] [Scilit]
- Chen, L.; Li, K.J.; Cao, Y.C.; Feng, X.N.; Wu, W.X. Multidimensional signal fusion strategy for battery thermal runaway warning towards multiple application scenarios. Appl. Energy 2025, 377, 124512. [Google Scholar] [CrossRef] [Scilit]
- Chen, K.X.; Xu, Y.H.; Wu, H.; Zhu, J.G.; Wang, X.Y.; Chen, S.Q.; Wei, X.Z.; Dai, H.F. Degradation mechanism and assessment for different cathode based commercial pouch cells under different pressure boundary conditions. Energy Storage Mater. 2024, 73, 103793, Correction in Energy Storage Mater. 2024, 73, 103811. https://doi.org/10.1016/j.ensm.2024.103811. [Google Scholar] [CrossRef] [Scilit]
- Xu, K.; Zhuang, G.V.; Allen, J.L.; Lee, U.; Zhang, S.S.; Ross, P.N., Jr.; Jow, T.R. Syntheses and Characterization of Lithium Alkyl Mono- and Dicarbonates as Components of Surface Films in Li-Ion Batteries. J. Phys. Chem. B 2006, 110, 7708–7719. [Google Scholar] [CrossRef] [Scilit]
- Jiang, Z.X.; Liu, C.G.; Huang, L.; Zhu, S.S.; Zhang, X.H.; Wu, R.X.; Gong, T.Y.; Wu, Y.H.; Guo, L.X.; Han, P.X.; et al. Interfacial reactions take the lead: Elucidating the dominant role of cathode–electrolyte interactions in triggering thermal runaway of high-nickel lithium-ion batteries. Energy Environ. Sci. 2025, 18, 8232–8243. [Google Scholar] [CrossRef] [Scilit]
- Galushkin, N.E.; Yazvinskaya, N.N.; Galushkin, D.N. Causes and mechanism of thermal runaway in lithium-ion batteries, contradictions in the generally accepted mechanism. J. Energy Storage 2024, 86, 111372. [Google Scholar] [CrossRef] [Scilit]
- Yu, S.Y.; Mao, Y.; Xie, J.Y.; Xu, C.; Lu, T.L. Thermal runaway chain reaction determination and mechanism model establishment of NCA-graphite battery based on the internal temperature. Appl. Energy 2024, 353, 122097. [Google Scholar] [CrossRef] [Scilit]
- Lamb, J.; Orendorff, C.J.; Roth, E.P.; Langendorf, J. Studies on the Thermal Breakdown of Common Li-Ion Battery Electrolyte Components. J. Electrochem. Soc. 2015, 162, A2131. [Google Scholar] [CrossRef] [Scilit]
- Zhou, H.W.; Parmananda, M.; Crompton, K.R.; Hladky, M.P.; Dann, M.A.; Ostanek, J.K.; Mukherjee, P.P. Effect of electrode crosstalk on heat release in lithium-ion batteries under thermal abuse scenarios. Energy Storage Mater. 2022, 44, 326–341. [Google Scholar] [CrossRef] [Scilit]
- Li, K.J.; Gao, X.L.; Wang, S.S.; Peng, S.J.; Zhang, W.X.; Wu, W.X.; Wang, H.Z.; Liu, P.; Han, X.B.; Cao, Y.C.; et al. Comparative analysis of multidimensional signals evolution in prismatic and pouch LiFePO4 batteries under thermal abuse. Appl. Energy 2024, 372, 123818. [Google Scholar] [CrossRef] [Scilit]
- Feng, X.N.; Zheng, S.Q.; Ren, D.S.; He, X.M.; Wang, L.; Cui, H.; Liu, X.; Jin, C.Y.; Zhang, F.S.; Xu, C.S.; et al. Investigating the thermal runaway mechanisms of lithium-ion batteries based on thermal analysis database. Appl. Energy 2019, 246, 53–64. [Google Scholar] [CrossRef] [Scilit]

Disclaimer/Publisher’s Note: The statements, opinions and data contained in all publications are solely those of the individual author(s) and contributor(s) and not of MDPI and/or the editor(s). MDPI and/or the editor(s) disclaim responsibility for any injury to people or property resulting from any ideas, methods, instructions or products referred to in the content. |
© 2026 by the authors. Licensee MDPI, Basel, Switzerland. This article is an open access article distributed under the terms and conditions of the Creative Commons Attribution (CC BY) license.