


Abstract
This paper presents HAC-DBAT, a normal-data-only dual-branch Transformer framework for record-level fault recognition and faulty-cell localization in heterogeneous electric-vehicle battery packs. The dataset comprises 88 vehicle records, including 34 normal training records and a held-out test partition of 50 records containing seven labeled faults and 13 labeled faulty cells. On the test partition, the record-level F1-score is 0.9333, the conditional faulty-cell F1-score is 0.8889, and the end-to-end faulty-cell F1-score is 0.8276. The framework integrates validity-masked pack alignment, residual-conditioned dual-branch reconstruction, normal-reference thresholding and hotspot-aware cell ranking. Its evaluation concerns fault-record identification and faulty-cell localization, rather than verified thermal-runaway lead time.
1. Introduction
Faults in electric-vehicle (EV) battery systems pose operational and safety risks [1,2,3]. The data provider labeled the affected records as thermal-runaway-related faults in ternary lithium-ion batteries; these labels do not independently confirm that thermal runaway occurred. Identifying an abnormal operating record also does not establish advanced prediction of thermal runaway. A verified warning lead time requires event-onset and corresponding alarm timestamps, which are not established here. Accordingly, this study evaluates record-level fault detection and faulty-cell localization, rather than the pre-event warning capability investigated in related work [4,5].
Battery fault-diagnosis methods include engineering thresholds, physics-informed models and data-driven approaches [6,7,8]. Studies of thermal runaway also highlight the complexity of battery failure mechanisms [9,10]. Fixed thresholds can be sensitive to operating conditions, detailed mechanism-based models can be difficult to calibrate across vehicle fleets, and supervised classifiers require representative labeled fault examples. Normal-data-only anomaly reconstruction instead learns regular behavior and identifies deviations during inference.
Recurrent sequence models and dropout-based uncertainty estimation provide foundations for multivariate time-series analysis [11,12,13]. Attention and reconstruction methods offer further foundations for anomaly detection [14,15,16]. Stochastic recurrent models and Transformer anomaly detectors, including Anomaly Transformer and TranAD, provide related methods [17,18,19]. USAD and DCdetector illustrate additional unsupervised and attention-based approaches [20,21]. One-class and local-outlier methods offer complementary strategies [22,23]. Nonparametric dynamic thresholding informs alarm calibration [24]. Other attention-based temporal modeling methods also provide relevant context [25,26,27]. HAC-DBAT does not claim novelty in attention itself; it combines validity-masked battery layouts, residual-conditioned reconstruction, normal-calibrated record decisions and hotspot-aware cell ranking. Recent studies of elevator, aircraft fuel-system and railway-actuator diagnosis offer cross-domain methodological context [28,29,30]. Work on nuclear-plant sensor reconstruction, recurrence-based fault diagnosis and marine-engine thermal-fault diagnosis provides additional context [31,32,33]. These studies are not presented as directly comparable EV battery benchmarks.
The dataset includes heterogeneous U95_T34 and U96_T32 pack structures. Naive padding of missing channels can create artificial reconstruction discrepancies; isolated voltage spikes and recurrent high-response channels can also confound localization. HAC-DBAT addresses these concerns by masking structurally absent channels, aggregating window-level evidence, using uncertainty and alarm consistency in record scoring, and suppressing normal-state hotspots during the ranking of eligible voltage-cell channels.
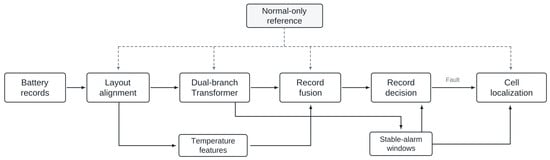
The main contributions are: (i) validity-masked mapping and normal-reference layout compensation for the two observed voltage/temperature configurations; (ii) residual-conditioned dual-branch reconstruction with masked losses, alternating parameter updates and count-independent record decisions; and (iii) record-level fault detection and conditional/end-to-end faulty-cell localization with baseline, ablation and sensitivity comparisons. Both favorable and unfavorable changes are included in the analysis. Figure 1 summarizes these paths: the normal-only reference supports layout alignment, model training, record scoring and cell localization. Voltage windows are reconstructed by the dual-branch Transformer, while the temperature descriptor contributes at record level; stable-alarm windows feed the record decision and, for records classified as faulty, inform faulty-cell localization.
Figure 1.
Overall workflow of the normal-data-only HAC-DBAT framework for record-level fault detection and faulty-cell localization. Solid arrows indicate data and alarm-window pathways; dashed arrows indicate normal-reference-dependent operations.
2. Materials and Methods
2.1. Dataset, Labels, and Train–Test Independence
The dataset contains 88 de-identified operating records from 88 distinct vehicles and battery packs. The authors confirmed from acquisition-batch records that training and test partitions contain no shared vehicle, battery-pack or acquisition-batch identifiers. The original training-side partition comprised 34 normal and four fault-associated records; the latter were excluded from model fitting, parameter selection and normal-reference calibration. Testing used 50 held-out records (43 normal; seven provider-annotated fault records containing 13 annotated faulty cells) (Table 1).
Table 1.
Dataset composition and pack-layout distribution.
The data provider labeled the affected records as thermal-runaway-related faults in ternary lithium-ion batteries and supplied the associated faulty-cell indices. These annotations do not independently confirm that thermal runaway occurred. The provider-supplied record labels and cell list form the reference annotations for evaluation; faulty-cell labels are not derived from model predictions. The source records contain acquisition timestamps, and the observed duration of each record is defined by its last timestamp minus its first timestamp; durations are thus record-specific rather than assumed constant. The nominal sampling interval is 10 s. Although fault-category and faulty-cell labels were provided, independently verifiable thermal-runaway onset timestamps and detailed failure-mechanism labels are not available for this analysis. No alarm-to-thermal-runaway lead time or mechanism-specific classification accuracy is claimed.
2.2. Alignment, Temperature Roles and Dual-Branch Architecture
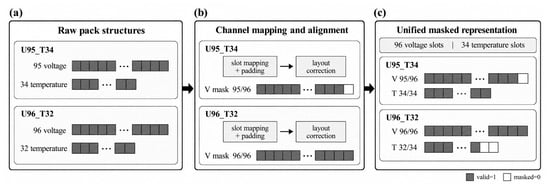
For U95_T34 and U96_T32 layouts, 95/96 voltage channels are mapped to 96 slots with validity mask mv; 32/34 temperature channels are separately mapped to 34 slots with mask mt. The Transformer receives voltage windows only; valid temperatures contribute to a record-level concordance descriptor, not cell-level temperature mapping. Layout offsets are estimated from observed channels of the 34 normal-reference records, grouped by structure, in Equations (1) and (2). Figure 2 illustrates the channel mapping, validity masks and layout compensation for the two pack structures.
Figure 2.
Unified channel mapping, validity-mask construction, and layout compensation for heterogeneous EV battery packs: (a) original U95_T34 and U96_T32 pack structures; (b) channel mapping, padding and layout correction; and (c) unified masked representation. Gray-filled slots indicate valid channels (mask = 1), whereas white slots indicate masked or structurally absent channels (mask = 0).
The layout compensation in Equation (2), with η_DA = 0.60, masks absent slots after the normal-reference offset correction. Padded channels are excluded from both reconstruction loss and cell ranking.
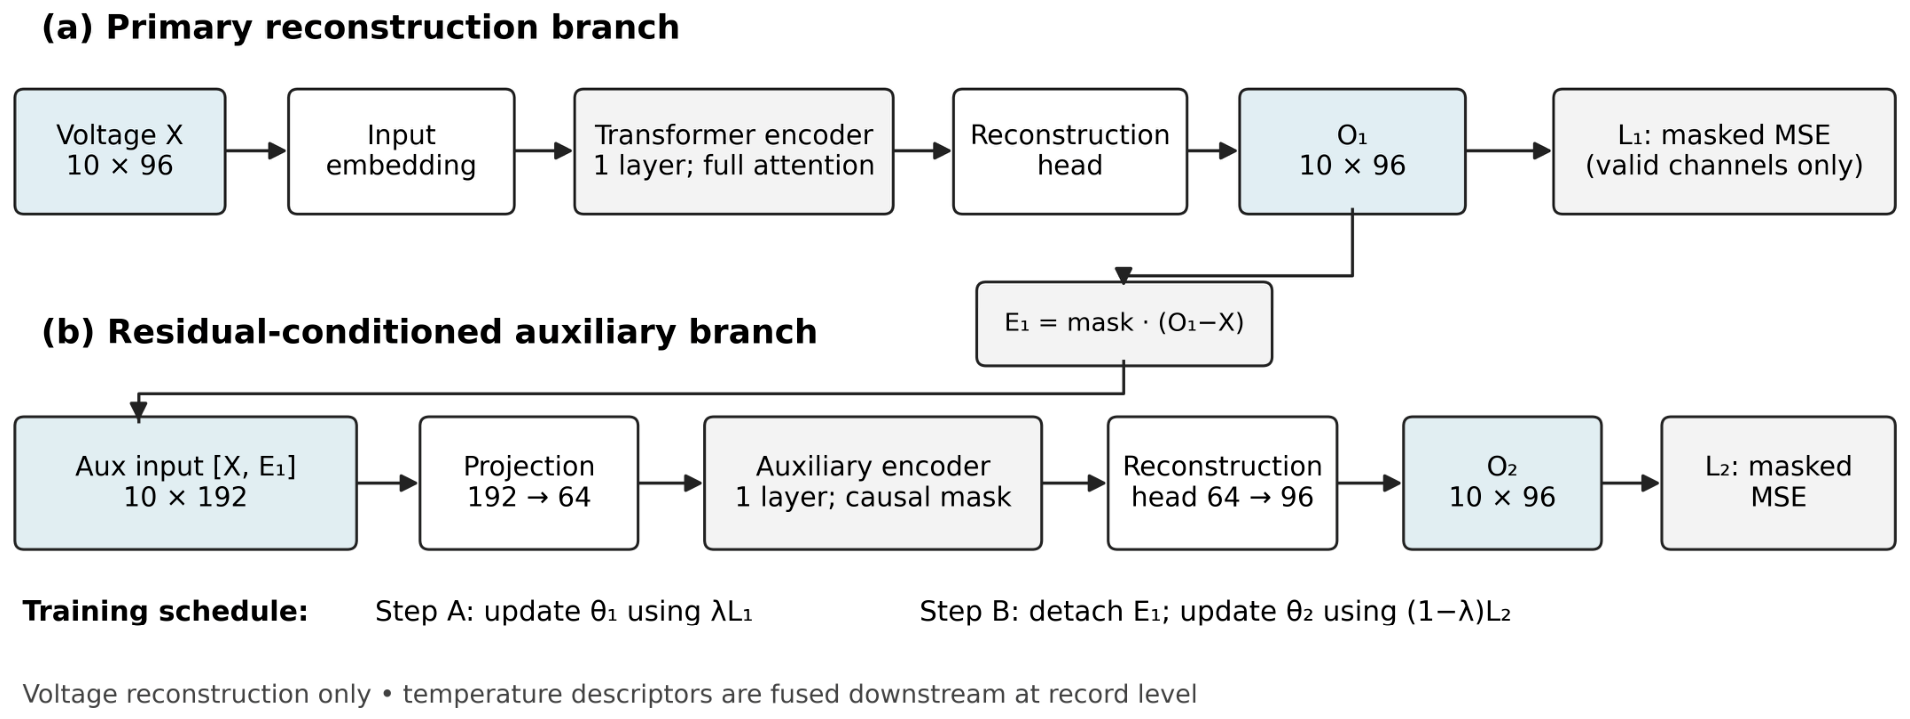
For each voltage window X ∈ ℝ(L × 96), the primary branch reconstructs O1 and forms a masked residual E1 = mv⊙(O1 − X). The auxiliary branch receives the projected concatenation [X, E1] ∈ ℝ(L × 192). Its lower-triangular attention mask prevents direct future-position access within that layer; because E1 comes from a full-window primary branch, this does not establish battery-variable causation or a globally causal network (Figure 3). The symbol ⊙ denotes element-wise (Hadamard) multiplication.
Figure 3.
Residual-conditioned dual-branch voltage-reconstruction architecture with a temporally masked auxiliary attention operation. Panel (a) shows the primary reconstruction branch, and panel (b) shows the residual-conditioned auxiliary branch. Pale-blue boxes indicate voltage inputs and reconstruction outputs; light-gray boxes indicate masked loss operations.
For minibatch size B and valid-slot count M_i = Σ_j mv_i,j, Equations (3) and (4) define the two masked reconstruction losses and their weighted objective.
rec = λ1 + (1 − λ)2, λ = 0.60
The objective uses λ = 0.60 (1 − λ = 0.40). Alternating updates train the primary branch with the auxiliary branch frozen, then train the auxiliary branch using detached E1 with the primary branch frozen. The hidden size is 64 with four heads and one encoder layer.
2.3. Window Alarms and Count-Independent Record Decision
Sampling occurs nominally every 10 s; a 10-sample window spans 90 s between its first and last observations. Training and inference strides are eight (80 s) and four (40 s) samples. Three consecutive window alarms are required; in the uninterrupted case the third window ends 170 s after the first window starts. These intervals describe detection timing, not lead time before thermal runaway.
For record i and window h, a_i,h and u_i,h are the mean and standard deviation of the masked absolute voltage-reconstruction score over four MC Dropout passes. A provisional alarm uses the normal-window q99 threshold. Table 2 defines six record-level features f1–f6, including voltage–temperature concordance at record level. Each feature is standardized using normal-reference median/MAD statistics (Equation (5)), not cell-level [0, 1] scaling.
Table 2.
Operational definitions of the six record-level fusion features.
With w = (0.40, 0.18, 0.12, 0.15, 0.08, 0.07), the fused record score is S_i = Σ_k w_k z_i,k. Normal-reference q99 calibrates the record threshold τ_record; Equation (6) jointly requires threshold exceedance and a three-consecutive-window gate, independently for each record. Standardized features are clipped to [−8, 8], so τ_record can exceed one. Neither the number of faulty test records nor their labels enter calibration.
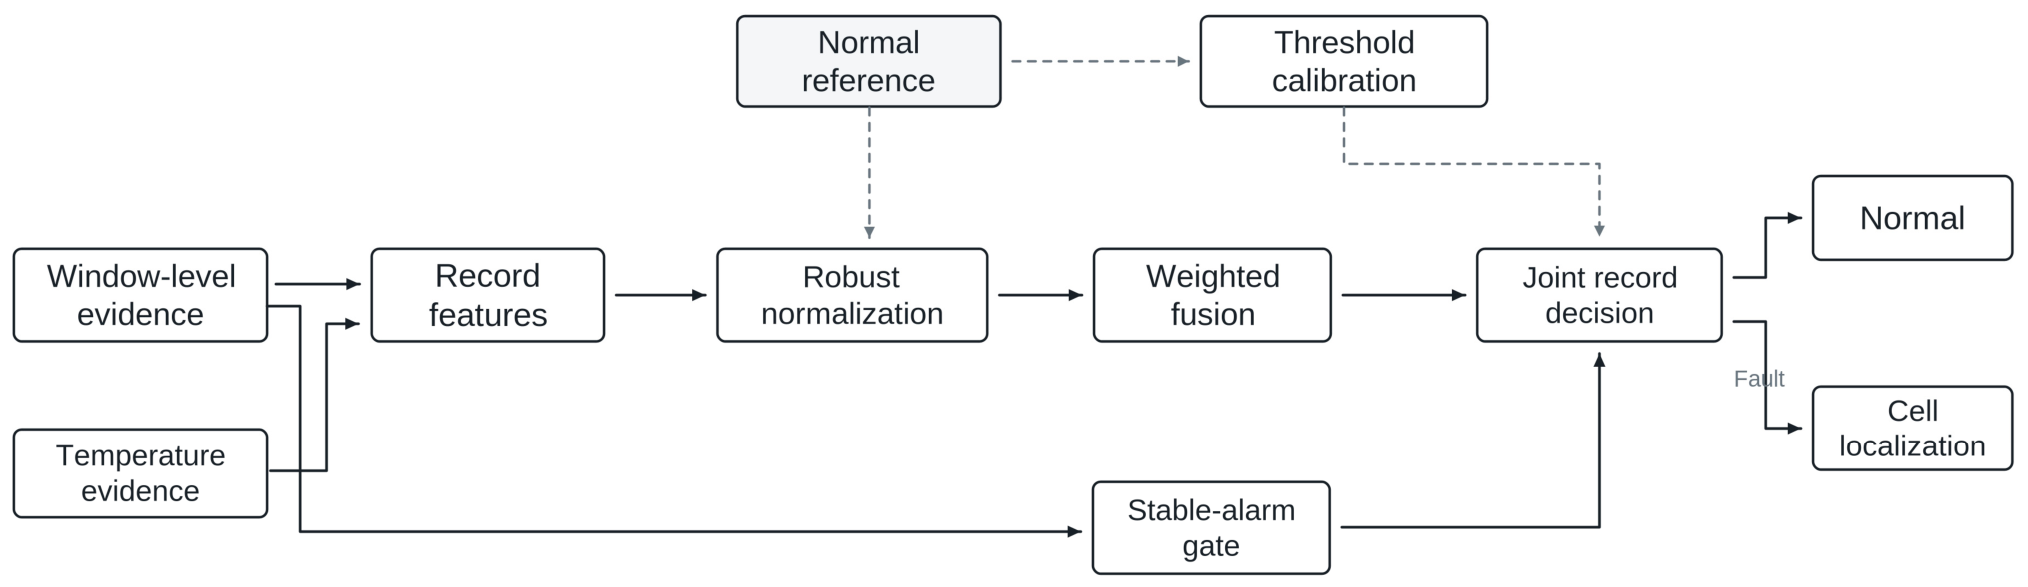
Equation (6) defines the final count-independent record decision. As shown in Figure 4, normal-only reference statistics calibrate the robust feature normalization and decision threshold. The fused record severity must exceed that threshold, while a separate stable-three-window alarm gate must also hold. These are parallel requirements of the joint record decision, not sequential re-scoring stages. Only fault-positive records proceed to faulty-cell localization. No test-set ranking, fixed fault count, or top-seven selection is used.
Figure 4.
Multi-source anomaly fusion and count-independent record-level fault decision. Fused-severity thresholding and the stable-alarm gate are parallel conditions of the joint decision; fault-positive records are forwarded to faulty-cell localization. Solid arrows indicate evidence and decision pathways; dashed arrows indicate normal-reference calibration; light-gray shading highlights normal-reference and normalization operations.
2.4. Cell Fusion, Settings and Evaluation
For eligible voltage cells, Equation (7) combines five support terms g1–g5 defined in Table 3, with weights α = (0.42, 0.21, 0.14, 0.10, 0.13) and normal-state hotspot penalty β = 0.28. Only valid cells exceeding τ_cell = 0.30 are ranked; at most K_cell = 5 are reported. Voltage-index neighbors do not necessarily represent physical cell adjacency.
Table 3.
Operational definitions of five cell-level evidence groups and hotspot penalty.
The record-level temperature descriptor is excluded from cell ranking. Continuous cell features g1 and g4 use normal-reference 5th/95th percentile scaling within each layout; g2 and g5 are window proportions and g3 is the valid-neighbor mean of normalized g1. Hotspot frequency is the normal-reference proportion of windows where a voltage index enters the preliminary top-five set.
For the unscaled continuous evidence u_r(i,j), r ∈ {1, 4}, the normal-only layout-specific bounds L_(r,g) and U_(r,g) are the 5th and 95th percentiles. The clipped [0, 1] mapping is given below.
For g2 and g5 an empty applicable-window set produces zero; g3 averages existing valid adjacent-index evidence, or zero when neither neighbor exists. Invalid slots are excluded throughout. All percentile bounds and hotspot frequencies come only from the normal reference.
The cell threshold is applied before descending ranking and the K_cell = 5 inspection-list cap; fewer than five cells may be output. Sensitivity to β, K_cell and q is reported in Section 3.3. Table 4 summarizes the evaluation parameters and their interpretation in actual sampling time.
Table 4.
Evaluation parameters and actual-time interpretation.
Training used 16 epochs, a batch size of 256, a learning rate of 0.001 and a dropout of 0.1. Conditional localization evaluates each true fault record independently of the record decision; end-to-end localization emits candidates only for records flagged faulty and counts cells on false-positive records as false positives. Both definitions are applied consistently to compared methods. The computational environment used Python 3.10.19, PyTorch 2.9.1+cu128 (CUDA 12.8), NumPy 2.1.2, pandas 2.3.3, scikit-learn 1.7.1, SciPy 1.15.3, Matplotlib 3.10.6 and tqdm 4.67.3 on an NVIDIA GeForce RTX 5060 GPU (NVIDIA Corporation, Santa Clara, CA, USA).
Parameter Selection and Pre-Test Configuration Control
The authors verified from retained code configurations and run records that w, α, λ, β = 0.28, τ_cell = 0.30, K_cell = 5 and q = 0.99 were fixed before held-out test evaluation. Each model obtained its own window and record thresholds from normal-only reference scores. K_cell = 5 limits inspection workload rather than presuming a true fault count. Later β/K/q sweeps are descriptive sensitivity checks, not retrospective selection evidence; detailed control procedures are in Supplementary Tables S1 and S2.
3. Results
3.1. Record-Level and Cell-Level Evaluation Results
Table 5 and Table 6 report the main counts and record-wise predictions under the count-independent revised evaluation.
Table 5.
Corrected fixed-partition record-level and cell-level outcomes.
Table 6.
Record-level and cell-level outcomes for the revised evaluation.
On the 50-record test partition, the model detected all seven fault records with one false alarm (TP/FP/FN/TN = 7/1/0/42). Conditional cell localization yielded 12/2/1 TP/FP/FN and end-to-end localization 12/4/1; the two extra end-to-end false positives arise from the falsely flagged normal record.
3.2. Baselines and One-Factor Ablations
Table 7 compares models under the revised protocol. HAC-DBAT gives record F1 = 0.9333 and conditional cell F1 = 0.8889, against 0.8750/0.8462 for DBAT and 0.8750/0.8571 for Anomaly Transformer. Historical GRU-AE results are not included as revised-protocol runs.
Table 7.
Comparison of record-level detection and faulty-cell localization across methods.
For fairness, all revised baselines use the same normal training/test records, validity masking, window/stride settings, model-specific normal q99 thresholds, three-alarm gate and cell-selection rule. Each architecture retains its native anomaly score; unavailable fusion features are omitted and the remaining weights renormalized. Protocol controls and the separately retained historical GRU-AE result are documented in Supplementary Table S3.
Table 8 summarizes six single-factor ablations. In particular, removing hotspot suppression (β = 0) reduces conditional cell F1 from 0.8889 to 0.7273; removing cell-level alarm consistency lowers it to 0.8571 without changing record F1. The cell-level consistency feature is distinct from the record-level three-window decision gate.
Table 8.
Single-factor ablation results for record-level detection and faulty-cell localization.
All ablations keep the same cohort, metrics and validity policy. Disabled fusion terms are omitted with remaining weights renormalized; affected record thresholds are recalibrated from normal records at q = 0.99.
The six changes are: w/o DA, η_DA = 0 while retaining masks; w/o UQ, deterministic scoring without f3; w/o EW, removal of f2 and g2 while retaining the record alarm gate; w/o HS, β = 0; w/o AC, removal of g5 while retaining the record gate and f6; and w/o CF, cell support g1−βP_hot instead of five-term fusion. All use the same τ_cell and K_cell.
For additional count checks, DBAT and Anomaly Transformer each yield record TP/FP/FN/TN = 7/2/0/41; their conditional cell counts are 11/2/2 and 12/3/1, respectively. Cell-level end-to-end metrics additionally penalize candidates from false-positive records.
3.3. Sensitivity and Statistical Uncertainty
Table 9 shows that the conditional cell F1 changes from 0.7273 to 0.8889 to 0.8800 for β = 0, 0.28 and 0.35, respectively. Varying K_cell and the normal-reference q quantile also changes performance; these retrospective sensitivity checks cannot establish when parameters were chosen.
Table 9.
Parameter sensitivity and statistical uncertainty summaries.
Across eight within-cohort normal-record re-partitionings, record, conditional cell and end-to-end F1 were 0.9249 ± 0.0753, 0.8881 ± 0.0533 and 0.8441 ± 0.0917 (mean ± sample SD). The seven fault test records remained fixed; these are not eight independent fault-cohort validations. Record sensitivity 7/7 has an exact 95% binomial interval of approximately [0.590, 1.000]. The individual seeds, confusion counts and q99 thresholds are provided in Supplementary Tables S4 and S5.
3.4. Training-Data-Size Sensitivity
Training-size sensitivity used N = 9, 17, 26 and 34 normal records, with eight runs per size and the same held-out 50-record test cohort. Smaller training sets varied vehicle membership; full-size runs varied initialization and window sampling. Other reported training settings were held constant.
Table 10 summarizes mean ± sample SD for record, conditional cell and end-to-end F1 across the four training sizes. Performance generally improved with more normal records; all 32 run-level confusion counts and F1 values are retained in Supplementary Table S6. Supplementary Information contains the unchanged detailed tables relocated from the expanded revision.
Table 10.
Training-data-size sensitivity (eight runs per size; mean ± sample SD).
4. Discussion
The revised protocol produces record F1 = 0.9333 and conditional cell F1 = 0.8889; the baseline and ablation comparisons suggest a contribution from layout compensation, residual reconstruction and hotspot-aware cell fusion in this cohort. Results from related sensor-diagnosis fields [29,31,33] are contextual rather than EV-pack benchmarks.
Unlike the earlier evaluation, which contained an expected_fault_files = 7 count-prior setting, the revised procedure makes independent normal-threshold and stable-alarm decisions for every record. The old count-prior setting was removed before the revised evaluation; the two procedures are therefore not presented as a matched comparison.
Limitations include only seven annotated fault records and reuse of these fault records across the eight normal-data re-partitionings. Although the provider labeled the records as thermal-runaway-related faults in ternary lithium-ion batteries and supplied faulty-cell labels, the available evidence does not independently establish whether thermal runaway occurred, its onset time, or the detailed electrochemical failure mechanism; hence, a pre-event warning lead time cannot be evaluated. Individual record durations are defined by source-file timestamp spans but are not numerically tabulated here. Pre-test parameter settings were checked by the authors against retained run artifacts; independent reproduction would require access to these artifacts. Larger independent fault cohorts and external-source validation are still needed.
5. Conclusions
HAC-DBAT provides a validity-masked, normal-data-only reconstruction and cell-ranking framework for heterogeneous EV battery-pack monitoring. On the held-out partition, record F1 = 0.9333, conditional cell F1 = 0.8889 and end-to-end cell F1 = 0.8276. The baseline comparisons, one-factor ablations and sensitivity analyses characterize performance at the record and faulty-cell levels. Because the test set includes only seven positive records, broader generalization and verified lead time to thermal-runaway onset remain outside the conclusions of this study.
Supplementary Materials
The following supporting information can be downloaded at https://www.mdpi.com/article/10.3390/batteries12110441/s1. Table S1: Parameter-selection rationale and configuration control; Table S2: Development, calibration, evaluation and sensitivity-analysis stages; Table S3: Common baseline evaluation controls and the status of the historical GRU-AE baseline; Table S4: Eight partition-level record counts and evaluation statistics; Table S5: Eight partition-level cell localization outcomes and normal-reference thresholds; Table S6: Individual training-size runs (TP/FP/FN triplets and corresponding F1 values).
Author Contributions
Conceptualization, X.W. and X.F.; methodology, X.W.; software, X.W.; validation, X.W. and X.F.; formal analysis, X.W.; investigation, X.W.; resources, X.F.; data curation, X.W.; writing—original draft preparation, X.W.; writing—review and editing, X.W. and X.F.; visualization, X.W.; supervision, X.F.; project administration, X.F. All authors have read and agreed to the published version of the manuscript.
Funding
This research received no external funding.
Data Availability Statement
The JBGS study-record identifiers reported in Table 6 are permitted for public disclosure. The underlying vehicle telemetry and direct vehicle identifiers remain confidential under the data provider’s access requirements. Aggregate metrics and methodological definitions are reported here; sharing of additional per-record predictions or split identifiers remains subject to the provider’s access requirements.
Acknowledgments
The authors acknowledge the National New Energy Vehicle Technology Innovation Center as the provider identified in the original study.
Conflicts of Interest
The authors declare no conflicts of interest.
Abbreviations
The following abbreviations are used in this manuscript:
| EV | Electric Vehicle |
| ID | Identifier |
| SOC | State of Charge |
| AE | Autoencoder |
| LSTM | Long Short-Term Memory |
| GRU | Gated Recurrent Unit |
| LSTM-AE | Long Short-Term Memory Autoencoder |
| GRU-AE | Gated Recurrent Unit Autoencoder |
| Transformer-AE | Transformer Autoencoder |
| MC | Monte Carlo |
| DBAT | Dual-Branch Attention Transformer |
| HAC-DBAT | Hotspot-Suppressed and Alarm-Consistent Dual-Branch Attention Transformer |
| UQ | Uncertainty Quantification |
| DA | Domain Alignment |
| EW | Early Warning |
| TP | True Positive |
| FP | False Positive |
| FN | False Negative |
| TN | True Negative |
| P | Precision |
| R | Recall |
| Acc. | Accuracy |
| U95_T34 | Battery-Pack Structure with 95 Voltage-Cell Channels and 34 Temperature Channels |
| U96_T32 | Battery-Pack Structure with 96 Voltage-Cell Channels and 32 Temperature Channels |
References
- Xiong, R.; Sun, W.; Yu, Q.; Sun, F. Research progress, challenges and prospects of fault diagnosis on battery system of electric vehicles. Appl. Energy 2020, 279, 115855. [Google Scholar] [CrossRef] [Scilit]
- Yu, Q.; Wang, C.; Li, J.; Xiong, R.; Pecht, M. Challenges and outlook for lithium-ion battery fault diagnosis methods from the laboratory to real world applications. eTransportation 2023, 17, 100254. [Google Scholar] [CrossRef] [Scilit]
- Liu, X.; Wang, M.; Cao, R.; Lyu, M.; Zhang, C.; Li, S.; Guo, B.; Zhang, L.; Zhang, Z.; Gao, X.; et al. Review of abnormality detection and fault diagnosis methods for lithium-ion batteries. Automot. Innov. 2023, 6, 256–267. [Google Scholar] [CrossRef] [Scilit]
- Jiang, L.; Deng, Z.; Tang, X.; Hu, L.; Lin, X.; Hu, X. Data-driven fault diagnosis and thermal runaway warning for battery packs using real-world vehicle data. Energy 2021, 234, 121266. [Google Scholar] [CrossRef] [Scilit]
- Sun, Z.; Wang, Z.; Liu, P.; Qin, Z.; Chen, Y.; Han, Y.; Wang, P.; Bauer, P. An online data-driven fault diagnosis and thermal runaway early warning for electric vehicle batteries. IEEE Trans. Power Electron. 2022, 37, 12636–12646. [Google Scholar] [CrossRef] [Scilit]
- Li, S.; Zhang, C.; Du, J.; Cong, X.; Zhang, L.; Jiang, Y.; Wang, L. Fault diagnosis for lithium-ion batteries in electric vehicles based on signal decomposition and two-dimensional feature clustering. Green Energy Intell. Transp. 2022, 1, 100009. [Google Scholar] [CrossRef] [Scilit]
- Jia, Y.; Li, J.; Yuan, C.; Gao, X.; Yao, W.; Lee, M.; Xu, J. Data-driven safety risk prediction of lithium-ion battery. Adv. Energy Mater. 2021, 11, 2003868. [Google Scholar] [CrossRef] [Scilit]
- Wang, G.; Ping, P.; Kong, D.; Peng, R.; He, X.; Zhang, Y.; Dai, X.; Wen, J. Advances and challenges in thermal runaway modeling of lithium-ion batteries. Innovation 2024, 5, 100624. [Google Scholar] [CrossRef] [Scilit] [PubMed]
- Feng, X.; Ouyang, M.; Liu, X.; Lu, L.; Xia, Y.; He, X. Thermal runaway mechanism of lithium ion battery for electric vehicles: A review. Energy Storage Mater. 2018, 10, 246–267. [Google Scholar] [CrossRef] [Scilit]
- Finegan, D.P.; Darcy, E.; Keyser, M.; Tjaden, B.; Heenan, T.M.M.; Jervis, R.; Bailey, J.J.; Vo, N.T.; Magdysyuk, O.V.; Drakopoulos, M.; et al. Identifying the cause of rupture of Li-ion batteries during thermal runaway. Adv. Sci. 2018, 5, 1700369. [Google Scholar] [CrossRef] [Scilit] [PubMed]
- Hochreiter, S.; Schmidhuber, J. Long short-term memory. Neural Comput. 1997, 9, 1735–1780. [Google Scholar] [CrossRef] [Scilit] [PubMed]
- Cho, K.; van Merriënboer, B.; Gulcehre, C.; Bahdanau, D.; Bougares, F.; Schwenk, H.; Bengio, Y. Learning phrase representations using RNN encoder-decoder for statistical machine translation. In Conference on Empirical Methods in Natural Language Processing; Association for Computational Linguistics: Stroudsburg, PA, USA, 2014; pp. 1724–1734. [Google Scholar]
- Gal, Y.; Ghahramani, Z. Dropout as a Bayesian approximation: Representing model uncertainty in deep learning. Proc. ICML 2016, 48, 1050–1059. [Google Scholar]
- Vaswani, A.; Shazeer, N.; Parmar, N.; Uszkoreit, J.; Jones, L.; Gomez, A.N.; Kaiser, L.; Polosukhin, I. Attention is all you need. In Advances in Neural Information Processing Systems 30; Curran Associates Inc.: Red Hook, NY, USA, 2017. [Google Scholar]
- Sakurada, M.; Yairi, T. Anomaly detection using autoencoders with nonlinear dimensionality reduction. In Proceedings of the MLSDA 2014 2nd Workshop on Machine Learning for Sensory Data Analysis; Association for Computing Machinery: New York, NY, USA, 2014. [Google Scholar]
- Malhotra, P.; Ramakrishnan, A.; Anand, G.; Vig, L.; Agarwal, P.; Shroff, G. LSTM-based encoder-decoder for multi-sensor anomaly detection. In Proceedings of the ICML Anomaly Detection Workshop 2016, New York, NY, USA, 24 June 2016. [Google Scholar]
- Su, Y.; Zhao, Y.; Niu, C.; Liu, R.; Sun, W.; Pei, D. Robust anomaly detection for multivariate time series through stochastic recurrent neural network. In Proceedings of the 25th ACM SIGKDD International Conference on Knowledge Discovery & Data Mining; Association for Computing Machinery: New York, NY, USA, 2019. [Google Scholar]
- Xu, J.; Wu, H.; Wang, J.; Long, M. Anomaly Transformer: Time series anomaly detection with association discrepancy. In Proceedings of the International Conference on Learning Representations 2022, Virtual, 25–29 April 2022. [Google Scholar]
- Tuli, S.; Casale, G.; Jennings, N.R. Tranad: Deep Transformer networks for anomaly detection in multivariate time series data. Proc. VLDB 2022, 15, 1201–1214. [Google Scholar]
- Audibert, J.; Michiardi, P.; Guyard, F.; Marti, S.; Zuluaga, M.A. USAD: UnSupervised Anomaly Detection on multivariate time series. In Proceedings of the 26th ACM SIGKDD International Conference on Knowledge Discovery & Data Mining; Association for Computing Machinery: New York, NY, USA, 2020. [Google Scholar]
- Yang, Y.; Zhang, C.; Zhou, T.; Wen, Q.; Sun, L. DCdetector: Dual Attention Contrastive Representation Learning for Time Series Anomaly Detection. In Proceedings of the 29th ACM SIGKDD Conference on Knowledge Discovery and Data Mining (KDD 2023), Long Beach, CA, USA, 6–10 August 2023; pp. 3033–3045. [Google Scholar] [CrossRef] [Scilit]
- Ruff, L.; Vandermeulen, R.; Goernitz, N.; Deecke, L.; Siddiqui, S.A.; Binder, A.; Muller, E.; Kloft, M. Deep one-class classification. In Proceedings of the 35th International Conference on Machine Learning; PMLR: New York, NY,USA, 2018. [Google Scholar]
- Breunig, M.M.; Kriegel, H.P.; Ng, R.T.; Sander, J. LOF: Identifying density-based local outliers. In Proceedings of the 2000 ACM SIGMOD International Conference on Management of Data; Association for Computing Machinery: New York, NY, USA, 2000. [Google Scholar]
- Hundman, K.; Constantinou, V.; Laporte, C.; Colwell, I.; Soderstrom, T. Detecting spacecraft anomalies using LSTMs and nonparametric dynamic thresholding. In Proceedings of the 24th ACM SIGKDD International Conference on Knowledge Discovery & Data Mining; Association for Computing Machinery: New York, NY, USA, 2018. [Google Scholar]
- Zhou, H.; Zhang, S.; Peng, J.; Zhang, S.; Li, J.; Xiong, H.; Zhang, W. Informer: Beyond efficient Transformer for long sequence time-series forecasting. Proc. AAAI Conf. Artif. Intell. 2021, 35, 11106–11115. [Google Scholar] [CrossRef] [Scilit]
- Lim, B.; Arik, S.O.; Loeff, N.; Pfister, T. Temporal Fusion Transformers for interpretable multi-horizon time series forecasting. Int. J. Forecast. 2021, 37, 1748–1764. [Google Scholar] [CrossRef] [Scilit]
- Kim, J.; Kang, H.; Kang, P. Time-series anomaly detection with stacked Transformer representations and 1D convolutional network. Eng. Appl. Artif. Intell. 2023, 120, 105964. [Google Scholar] [CrossRef] [Scilit]
- Wang, Z.; Zhang, H.; Qiu, L.; Zhang, S.; Qian, J.; Xiang, F.; Pan, Z.; Tan, J. Towards high-speed elevator fault diagnosis: A ParallelGraphNet driven multi-sensor optimization selection method. Mech. Syst. Signal Process. 2025, 228, 112450. [Google Scholar] [CrossRef] [Scilit]
- Ouyang, X.; Zhang, Y.; Hua, L.; Yin, Y. AF-TAD: Transformer-Based Anomaly Detection for Aircraft Fuel Systems. Aerospace 2025, 12, 1066. [Google Scholar] [CrossRef] [Scilit]
- Huang, Y.; Hu, X.; Chen, F.; Cao, J.; He, Y.; Ming, Q.; Wang, H.; Wang, J.; Tang, T. Dynamic graph meta-learning with multi-sensor spatial dependencies for cross-category small-sample fault diagnosis in ZDJ9-RTAs. Adv. Eng. Inform. 2026, 70, 104132. [Google Scholar] [CrossRef] [Scilit]
- Wang, H.; Chen, H.; Yu, F.; Xu, Z.; Peng, M. Anomaly detection and reconstruction of sensors in nuclear power plants based on principal component analysis and improved deep neural networks. Prog. Nucl. Energy 2026, 191, 106088. [Google Scholar] [CrossRef] [Scilit]
- Wang, J.; Tian, R.; Xiao, Q.; Xue, Q.; Zhang, X. An optimized recurrence plot method for intelligent diagnosis of early weak faults. Struct. Health Monit. 2026, Epub ahead of printing. [Google Scholar] [CrossRef] [Scilit]
- Xie, Z.; Mo, C.; Jia, B. CDAF: A co-evolutionary decoupled attention framework for explainable weak thermal fault diagnosis of marine diesel engines. Sci. Rep. 2026, 16, 17459. [Google Scholar] [CrossRef] [Scilit] [PubMed]

Disclaimer/Publisher’s Note: The statements, opinions and data contained in all publications are solely those of the individual author(s) and contributor(s) and not of MDPI and/or the editor(s). MDPI and/or the editor(s) disclaim responsibility for any injury to people or property resulting from any ideas, methods, instructions or products referred to in the content. |
© 2026 by the authors. Licensee MDPI, Basel, Switzerland. This article is an open access article distributed under the terms and conditions of the Creative Commons Attribution (CC BY) license.