


Abstract
Aiming to mitigate the issues of heat buildup and excessive flow resistance in traditional cold plates applied to lithium-ion batteries, this work develops a topology optimization framework and produces two optimized layouts (Case III and Case IV) with differentiated multi-objective weight assignments. Their thermo-hydraulic performances were systematically evaluated against parallel (Case I) and serpentine (Case II) channels under various inlet velocities, coolant temperatures, and discharge rates. The results indicate that biomimetic bifurcations in topological channels effectively significantly reduce the extent of low-velocity regions and equalize flow distribution. Among all configurations, Case IV demonstrates the best overall performance: under a 1C discharging rate with an inlet flow velocity of 0.2 m/s, it achieves the lowest maximum temperature (28.97 °C), minimal temperature differential (3.97 °C), and lowest equivalent thermal resistance (0.305 °C/W), while reducing the hydraulic pressure drop by approximately 79.3% (from 436.83 Pa to 90.57 Pa) compared to serpentine channels (Case II). The analyses reveal that increasing inlet velocity beyond 0.3 m/s yields diminishing cooling returns due to internal conductive bottlenecks. Variations in inlet temperature exert negligible impacts on thermal resistance, whereas resistance across discharge rates follows Rth,2C > Rth,3C > Rth,1C > Rth,0.5C, governing transient thermal transport characteristics during high-rate discharge.
1. Introduction
Driven by the fast advancement of new energy automobile and energy storage industries, lithium-ion batteries have emerged as the mainstream power supply and energy storage carrier, benefiting from their outstanding energy density and extended service life [1]. Nevertheless, the operational performance of lithium-ion batteries is strongly temperature-dependent. During charge and discharge processes, considerable heat is generated by electrochemical reactions and internal ohmic resistance; failure to dissipate this heat promptly will not only expedite capacity fade and reduce cycle life, but also may give rise to critical safety incidents including thermal runaway [2,3]. Under normal conditions, lithium-ion batteries perform best within a temperature window of 20 °C to 40 °C, and the maximum temperature variation across the battery module needs to be strictly limited to below 5 °C [4]. Among available thermal management strategies, liquid-cooled cold plates have become the mainstream choice for traction battery packs, thanks to their superior heat transfer efficiency and flexible spatial arrangement. Furthermore, the geometry of internal flow channels directly determines the flow distribution of coolant and the overall heat transfer efficiency, which is therefore a critical factor for improving the thermal performance of batteries [5,6].
Substantial efforts have been devoted to improving the cooling capacity and temperature uniformity of microchannel liquid cold plates, most of which focus on conventional geometric structures including parallel straight channels, serpentine channels and manifold microchannels [7]. As a representative example, Yang et al. [8] put forward an innovative serpentine cooling plate (NSCP), and implemented multi-objective optimization of channel geometric parameters by integrating response surface methodology (RSM) with the NSGA-II algorithm, which lowered the maximum battery temperature and temperature difference by 2.1 °C and 1.2 °C respectively. Zhu et al. [9] devised an improved S-shaped side cooling structure, and performed parametric optimization of flow rate and geometric sizes through orthogonal tests, realizing a 59.20% reduction in battery temperature difference under a low pressure drop of 1.44 kPa. Chen et al. [10] designed an oblique-channel cooling plate (OCCP), which exhibited superior cooling efficiency and lower pressure drop while maintaining excellent thermal control performance even under an ultra-high discharge rate of 10C. However, conventional microchannel design approaches still suffer from prominent limitations: on the one hand, such optimizations are confined to shape refinement within fixed topologies, offering extremely limited geometric freedom and making it difficult to push the structural performance limit; on the other hand, conventional channels tend to induce thermal accumulation along extended flow paths, causing severe temperature gradients across the battery surface, whereas artificially raising the flow velocity generally results in a sharp rise in flow resistance and pumping power consumption [11].
Topology optimization (TO), as an innovative design method without predefined geometric configurations, provides a powerful approach to breaking through the design bottlenecks of conventional microchannels [12]. By freely distributing fluid and solid media within a given design domain, this method can automatically generate irregular, low-resistance, and high-heat-transfer configurations that conform to intrinsic fluid flow physics, demonstrating immense application potential in electronic chip cooling [13,14]. For instance, Han et al. [15] implemented topology optimization for a bionic heat sink, which decreased the temperature difference across flow channels by 57.35% in comparison with the conventional spider-web configuration. Wang et al. [16] presented an innovative heat sink that merges topology optimization with straight microchannels, which achieved a 4.28 K temperature decrease together with a 319.42 Pa reduction in pressure drop, striking a balance between thermal and hydraulic performance. Xiong et al. [17] developed a multiphysics topology optimization methodology for multilayer composite chip microchannels; the results indicated that this approach reduced thermal stress by 48.86% while optimizing heat dissipation, significantly enhancing structural reliability. Nevertheless, introducing topology optimization into lithium-ion battery thermal management still faces critical bottlenecks. Distinct from the small footprint and high heat flux density characteristic of electronic chips, lithium-ion batteries feature large heat dissipation surface areas, intense dynamic heat generation during high-rate charging and discharging, and extremely strict global temperature difference constraints [18]. Most existing research on microchannel topology optimization focuses primarily on enhancing local heat dissipation performance; however, there remains a lack of systematic investigation and mechanistic understanding regarding the coordinated optimization of multiple objectives—such as maintaining a uniform temperature distribution on the battery surface, limiting system-wide pressure loss, and ensuring the practical manufacturability of sophisticated 3D flow channels.
To address these specific gaps, this work presents a fluid-thermal coupled multi-objective topology optimization framework for liquid cooling plates applied to lithium-ion batteries. By formulating weighted multi-objective compromise programming optimization scheme that simultaneously suppresses the mean cell temperature and the required pumping power, two differentiated topological channel layouts (Case III and Case IV) associated with distinct objective weight combinations were obtained. On this foundation, a three-dimensional conjugate heat transfer numerical model is built to systematically compare the thermal and hydraulic properties of the optimized topological channels with those of conventional parallel (Case I) and serpentine channels (Case II) under different flow velocities, inlet temperatures and discharge rates. Furthermore, the unsteady heat transfer mechanism under high-rate discharge conditions was thoroughly revealed, which offers valuable theoretical references and practical design principles for the development of high-performance, low-pressure-drop battery thermal management architectures.
2. Topological Configuration Design of Liquid Cold Plate
2.1. Physical Model Simplification and Material Parameters
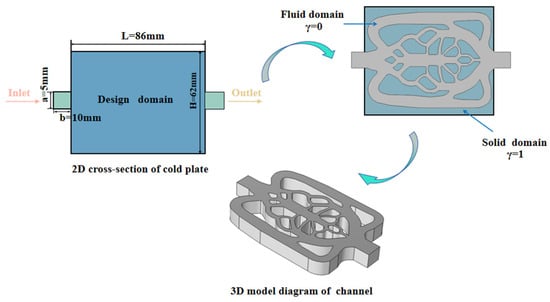
Given the geometric symmetry of the cooling plate, a two-dimensional (2D) model is adopted for topology optimization analysis to improve computational efficiency and cut down calculation time [19]. The design domain of the cold plate is depicted in Figure 1, with the fluid inlet and outlet centrally arranged on the two sides along the symmetry plane. Specifically, the 2D topology optimization model adopts a pressure-driven flow formulation. A constant static pressure of Pin = 20 Pa is applied at the inlet, and the outlet pressure is set to Pout = 0 Pa, yielding a baseline pressure drop of △P2D = 20 Pa. This pressure-driven setup provides stable hydrodynamic force for iterative material distribution, and effectively eliminates severe numerical convergence issues with velocity inlet conditions in rapidly evolving channel topologies. In contrast, the subsequent 3D conjugate heat transfer simulation employs a velocity-controlled inlet with Vin ranging from 0.1 to 0.5 m/s and a pressure outlet of 0 Pa. This configuration enables a rigorous and consistent performance comparison across all channel design cases under identical mass and volumetric flow rates.
Figure 1.
Microchannel cold plate geometric model and schematic configuration.
The solid domain is defined as an aluminum alloy substrate with a uniform internal heat source. All outer boundaries of the design domain are set as insulated no-slip walls, excluding the fluid inlet, outlet and symmetry boundaries. For the initial topology optimization setup, a uniform volumetric heat generation rate of Q = 9.8 × 10⁴ W/m3 is applied to the domain, which precisely characterizes the heat generation intensity of battery cells under 1C discharge conditions. The inlet coolant temperature is fixed at 298.15 K. The Method of Moving Asymptotes (MMA) algorithm is utilized to iteratively update the design variables during the optimization process [20]. A bi-objective optimization function is established to minimize the average temperature of the cooling plate and reduce fluid power loss, achieving a balanced optimization between improved heat transfer performance and reduced pumping power consumption. The thermophysical properties of the solid substrate and cooling fluid used for both topology optimization and subsequent 3D numerical simulations are summarized in Table 1.
Table 1.
Thermophysical parameter specifications for distinct materials.
2.2. Topology Optimization
2.2.1. Governing Equations
The physical model in this work is built upon the Navier–Stokes equations and the energy conservation equation. To achieve a compromise between computational cost and physical accuracy, the following basic assumptions are made for the design domain:
- (1)
- Fluid flow properties: The fluid is treated as a two-dimensional, steady, viscous and incompressible medium, and the influence of gravity is ignored [11]. Throughout the topology optimization process, it is assumed that the coolant flow remains in a laminar state at all times. The governing equations consist of the continuity equation, the momentum conservation equation incorporating a Darcy–Brinkmann penalty term, and the energy equation.
- (2)
- Material Distribution Representation: The material distribution within the design domain is parameterized by the design variable γ. Element thermophysical properties are determined via density interpolation schemes and are assumed to be temperature-independent [21,22].
- (3)
- Heat Transport Mechanisms: Heat dissipation throughout the system is jointly governed by thermal conduction and fluid convection [23].
- (4)
- 3D Effect Equivalence: To consider the viscous drag and thermal resistance caused by the top and bottom walls of the cold plate in the out-of-plane direction, a Darcy–Brinkman friction penalty term is added to the momentum equation.
Following the above simplification assumptions, the fundamental governing equations for the computational domain can be written in the following form:
Continuity Equation:
Momentum Conservation Equation:
Heat Transfer Equation:
In these equations, U denotes the fluid velocity vector (m/s), ρ(γ) is the equivalent density of the computational domain, h represents the characteristic channel height (m), Q denotes the volumetric heat-generation rate, T is the temperature (K), and F is the volumetric force term. The corresponding parameters are defined consistently according to their physical dimensions.
2.2.2. Material Interpolation Scheme
In this work, the Solid Isotropic Material with Penalization (SIMP) density-based approach is adopted to address the topology optimization problem in the computational domain. To simplify the calculation process, the whole design region is treated as a homogeneous porous medium, where a continuous optimization variable γ is introduced. An artificial body force term F is applied to constrain fluid motion and distinguish between solid and fluid regions [24]. Throughout the iterative optimization procedure, the value of γ is adjusted step by step within the range [0, 1]: when γ = 0, F approaches infinity, fully blocking fluid flow inside the element to denote a fully solid region; when γ = 1, F vanishes to zero, allowing unimpeded fluid flow without additional resistance, which corresponds to a pure fluid domain [25]. The quantitative mathematical formulation governing this relationship is expressed in Equation (4):
In which α stands for the inverse permeability coefficient and u denotes the velocity vector of the fluid.
In the density-based topology optimization framework, a Darcy interpolation scheme is adopted to perform material interpolation for the fluid damping coefficient αf and solid inverse permeability αs using the design variable γ [26], thus realizing a continuous variation across the fluid-solid boundary. The relevant interpolation formula is written as follows:
In this expression, q serves as the penalization factor used to adjust the topological structure of the fluid region and the gradient of the interpolation curve. An excessively small value of q leads to insufficient penalization, resulting in blurred channel boundaries and inaccurate performance evaluations; conversely, an overly large value of q induces over-penalization, triggering numerical instabilities and premature convergence to local optimal solutions.
The solid inverse permeability αs is computed using the equation shown as follows:
where μin refers to the fluid’s dynamic viscosity coefficient, Da stands for the Darcy number, and Lin corresponds to the characteristic length of the inlet. The initial design field is set as a homogeneous distribution where the design variable equals the target volume fraction, γ(x) = Vf = 0.6 across the entire domain. For the solid domain, a Darcy number of Da = 10−4 is applied, and the solid inverse permeability is defined as Equation (6).
Regarding the thermophysical properties of the medium (including equivalent thermal conductivity k(γ), mass density ρ(γ), and constant-pressure specific heat Cp(γ)), the present work likewise adopts a Darcy-type interpolation scheme dependent on the optimization variable γ to achieve continuous property description [15], the specific computational expression is as follows:
Here, the subscripts s and f indicate the solid phase and fluid phase regions respectively, while γk, γc and γρ correspond to the penalization coefficients for thermal conductivity, specific heat capacity and mass density.
2.2.3. Density Filtering and Projection Processing
To eliminate checkerboard-type numerical anomalies in the topology optimization procedure, weaken the reliance of optimization outcomes on mesh discretization, and improve the convergence robustness of the solving process, a Helmholtz filter is adopted in this work to smooth the optimization variable γ [27]. To strike a balance between filtering performance and convergence efficiency, the characteristic filter radius r is defined as 1.5 times the element size; the associated filter governing equation is given by:
In which r stands for the filter radius, corresponds to the post-filtering optimization variable, and γ refers to the initial design variable before filtering.
After Helmholtz filtering processing, the material density distribution often contains a large number of intermediate-density elements, which tends to yield blurred boundaries in the topological configuration. To overcome this limitation, a hyperbolic tangent projection function is implemented in this study to perform non-linear mapping on the filtered design variable , as defined by the following projection formulation [28]:
In which β and θβ denote the projection gradient coefficient and the projection threshold parameter, respectively, which are assigned values of 8 and 0.5.
2.2.4. Optimization Objectives and Constraint Conditions
For liquid-cooled plates, the heat transfer capability and pumping power consumption are critical factors determining the overall operational performance of the system. Peak temperature and temperature non-uniformity are key indicators for assessing the thermal safety of batteries; however, direct optimization using the Tmax formulation can introduce severe numerical instability. To address this issue, this study employs the average temperature integral as the objective function. From a physical standpoint, when volumetric heat generation within the battery region is uniformly distributed, minimizing Tavg this objective function can effectively mitigate localized high-temperature regions. This principle drives the optimization process to extend fluid microchannel branches directly into potential hot-spot areas, thereby increasing the local heat exchange area and optimizing the overall temperature distribution profile. Consequently, minimizing the average temperature can effectively suppress localized overheating while maximizing surface temperature uniformity. Accordingly, this study develops a dual-objective topological optimization model, with dual objectives: minimizing the average temperature and reducing flow-induced power dissipation. The mathematical formulations of these two objectives are presented in Equations (12) and (13), respectively.
Because Tavg and Emin possess different physical dimensions and orders of magnitude, direct linear summation is inappropriate. To resolve this, the compromise programming method is employed to achieve normalization of both objective functions [29]. Specifically, two single-objective optimization problems—minimizing average temperature and minimizing power dissipation individually—are solved first to establish baseline reference values for normalization. To implement compromise programming for multi-objective normalization, the single-objective reference extremes were obtained prior to multi-objective coupling, yielding baseline values of Tavg,0 = 297.15 K for average temperature and Emin,0 = 0.85 × 10⁻⁴ W for fluid power dissipation. Subsequently, the normalized objectives are coupled into a unified target function via a thermal weighting factor and an energy consumption weighting factor, under the restriction that the two weighting coefficients add up to unity. The complete formulation of the optimization objective function is expressed in Equations (14) and (15):
Optimization updates were performed using the Method of Moving Asymptotes (MMA) algorithm. The asymptote adaptation parameters were configured with an initial factor of 0.5, an expansion factor of 1.2, a contraction factor of 0.7, and a maximum move limit of move = 0.2 per iteration. Iterative optimization terminates when the objective function relative change falls below 10−4 for 5 consecutive iterations.
Based on the aforementioned settings, the mathematical expression for this study is as follows:
In which ω1 represents the weighting coefficient for thermal performance, ω2 stands for the weighting coefficient for flow energy loss, and Vf refers to the volume fraction occupied by the fluid domain. The detailed parameters configured in COMSOL 6.1 Multiphysics are listed in Table 2.
Table 2.
Parameters for geometric and topological optimization.
2.2.5. Grid Independence Analysis
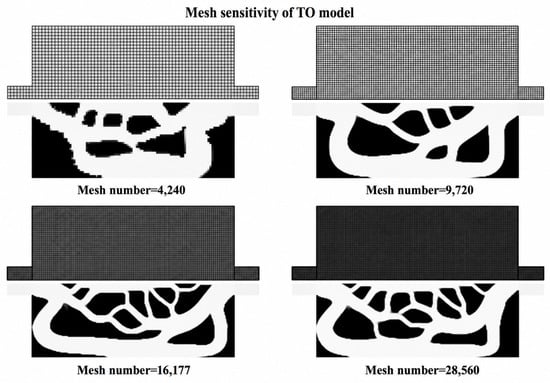
Mesh density plays a decisive role in governing the structural morphology resulting from topology optimization. To systematically investigate the evolution of channel configurations across varying mesh resolutions, four candidate mesh density configurations were evaluated; the optimized topological structures are compared in Figure 2 and Table 3.
Figure 2.
Evolution of topology optimization flow structures under different grid density configurations.
Table 3.
The values of the optimized objective function for different numbers of grids.
As shown in Figure 2 and Table 3, after refining the mesh from 4240 to 16,177 elements, the channel boundaries became progressively clearer, and the objective function values (J) gradually decreased. When the mesh was further refined to 28,560 elements, the J-value exhibited only a 0.20% variation, while both the channel topology and branch characteristics remained unchanged. Although the two-dimensional numerical results can provide preliminary convergence guidance, the actual thermal-hydraulic performance still requires evaluation through three-dimensional conjugate heat transfer simulations. Therefore, adopting the mesh configuration comprising 16,177 elements during the two-dimensional optimization process ensures structural clarity while maintaining relatively high computational efficiency.
2.3. Optimization Results
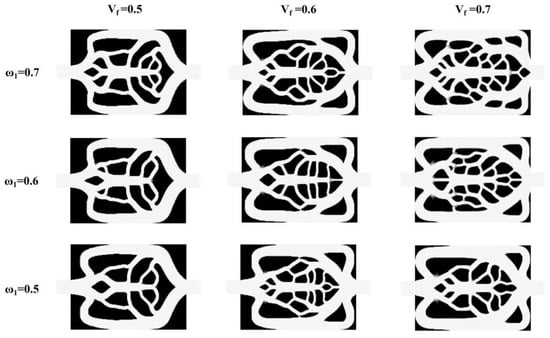
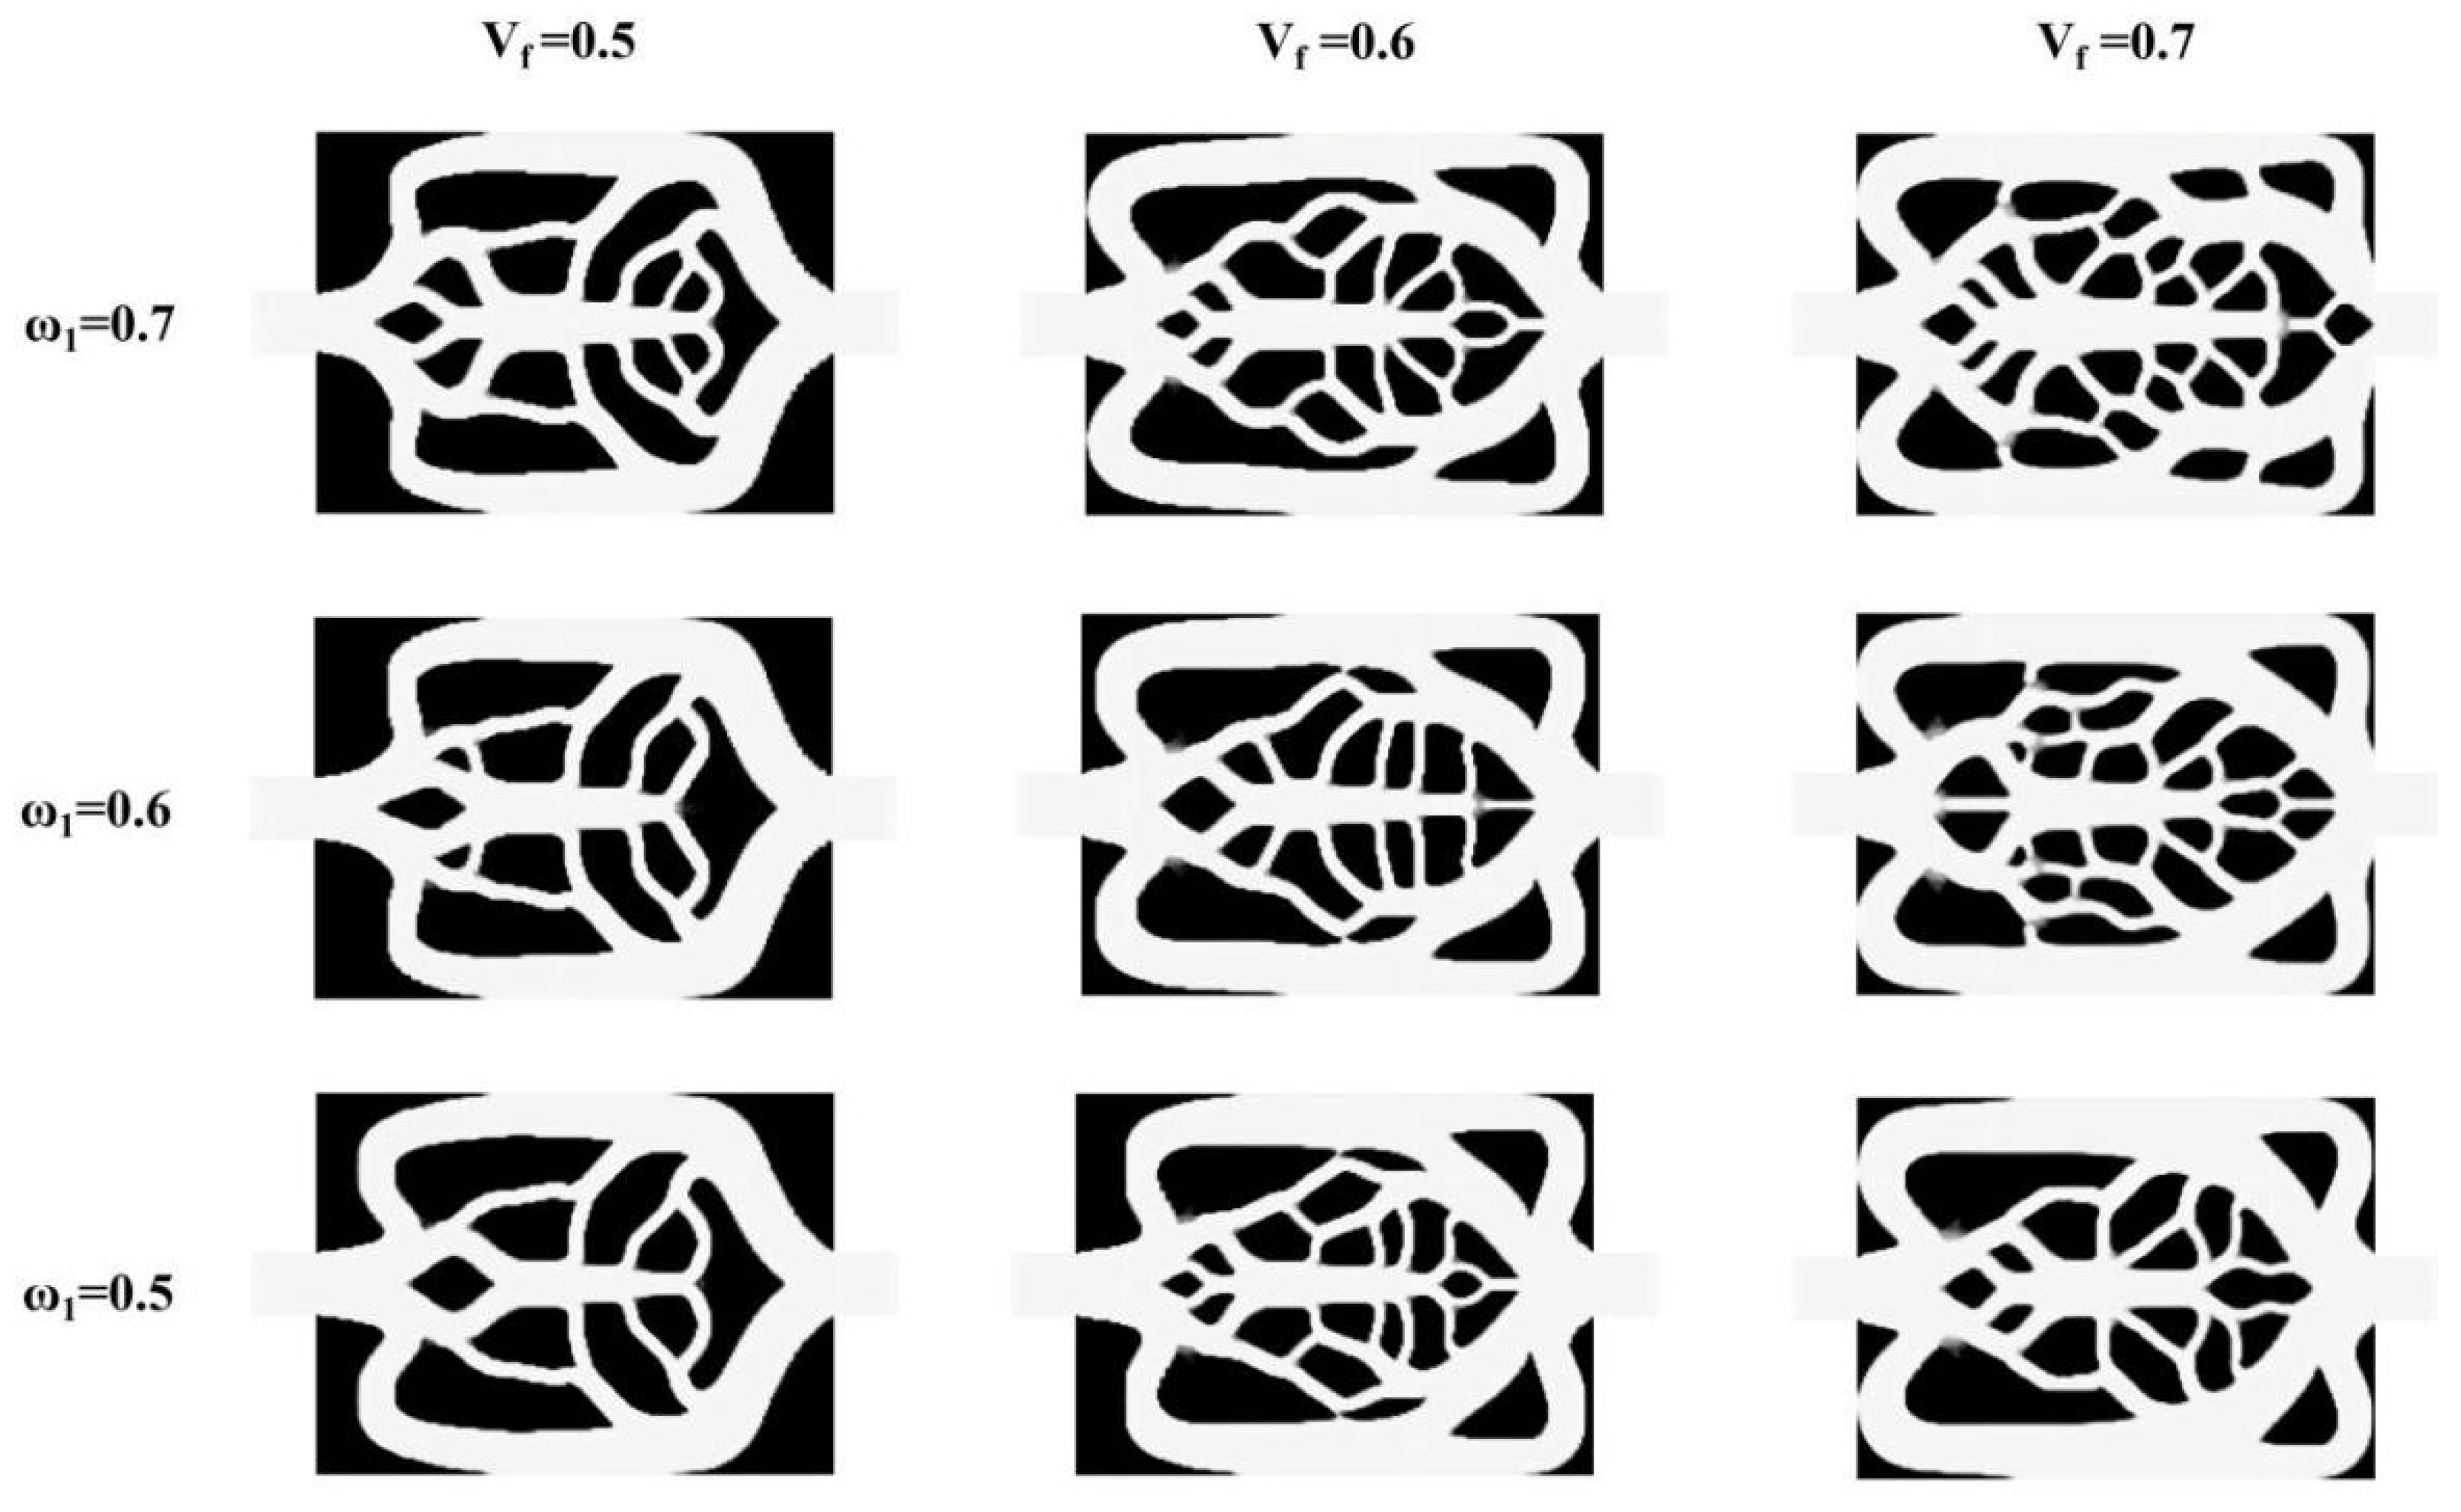
For bi-objective topological optimization designs of liquid cold plates, the target weight coefficients ω1 (weight allocated to minimizing the average temperature), ω2 (weight assigned to minimizing energy dissipation), and the fluid volume fraction Vf serve as the core parameters governing the resulting structural morphology. This work systematically investigates how different parameter combinations influence the topological development process of flow channels, where ω1 is set to 0.5, 0.6 and 0.7, and Vf is assigned values of 0.5, 0.6 and 0.7. The corresponding optimized topological configurations are illustrated in Figure 3.
Figure 3.
Topological cold plate configurations under varying parameter conditions.
It can be observed that at a constant ω1, increasing Vf significantly expands the proportion of the fluid domain. Consequently, both the primary trunks and secondary branches of the flow channels widen progressively, accompanied by the generation of more intricate micro-branches. Although a higher Vf improves the overall heat dissipation capacity, it reduces the solid substrate volume available for structural support; furthermore, excessively wide channels reduce the core fluid velocity, inducing local flow stagnation zones. Conversely, when Vf is fixed, increasing ω1 leads to a denser and more complex channel distribution, enhancing heat transfer through wider branched networks. When ω1 is reduced, the optimization priority shifts toward minimizing flow resistance and pumping power, yielding a simplified channel layout.
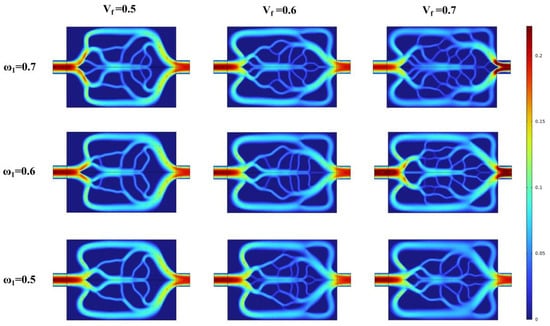
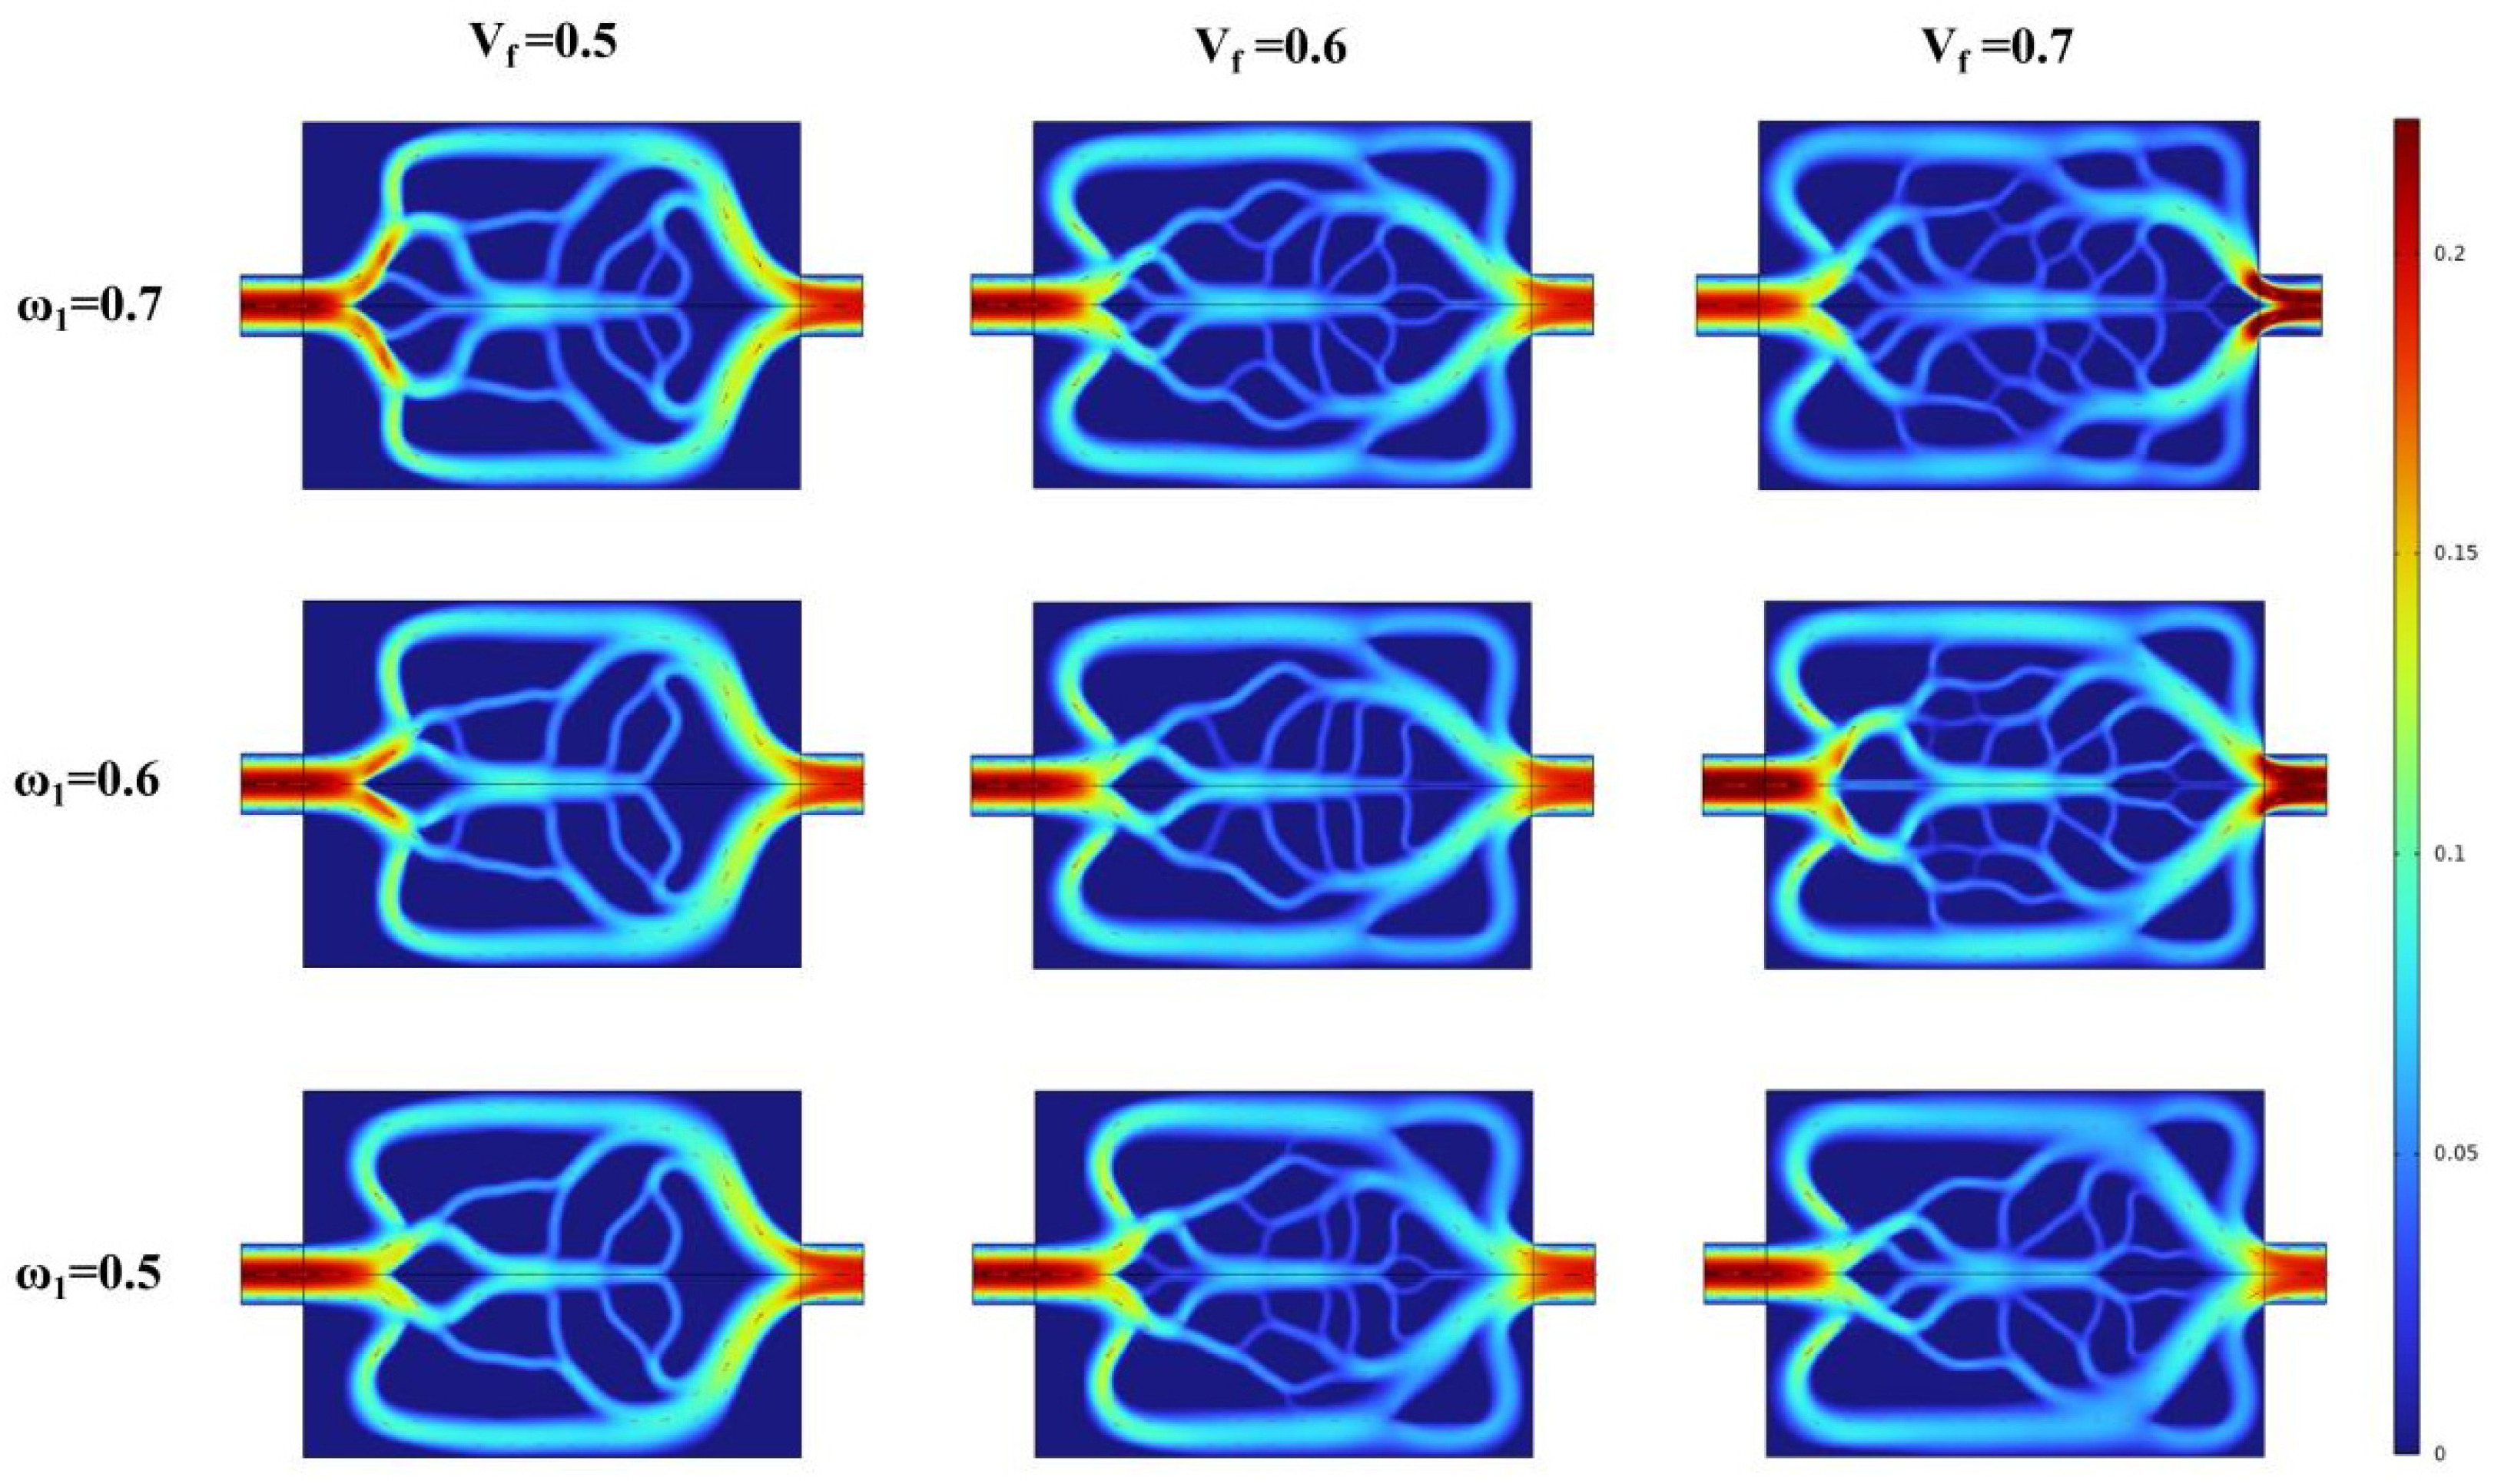
The velocity distributions within the dual-objective topology-optimized liquid cold plates under different Vf and ω1 are illustrated in Figure 4.
Figure 4.
Flow velocity distribution clouds for topological cold plates under varying parameters.
Analyzing the velocity gradient variations and flow path topologies reveals that, at a constant ω1, increasing Vf enlarges the total flow area of the channel network, which leads to a general reduction in the mean flow velocity of the fluid. Concurrently, high-velocity regions gradually spread and redistribute from the primary inlet/outlet trunks toward the terminal branch channels. Raising Vf effectively enhances the evenness of flow allocation throughout various zones of the cold plate; however, an excessive Vf reduces fluid velocity in the peripheral terminal branches, elevating the risk of local fluid stagnation and heat accumulation.
When Vf is held constant, increasing ω1 significantly enhances fluid distribution performance. At ω1 = 0.5, fluid velocity remains concentrated and elevated along the primary flow paths, minimizing frictional hydraulic losses along the stream and resulting in low flow resistance. As ω1 increases to 0.7, in order to achieve higher overall heat transfer uniformity, the topology gives rise to a complex mesh-based multi-stage flow diversion configuration, resulting in a more intricate velocity distribution. This multi-stage flow diversion structure significantly perturbs the fluid interface layer, enhances the detachment and reconfiguration of the thermal boundary layer, but also induces a dramatic change in the velocity gradient, thereby increasing the local hydraulic frictional resistance. Therefore, this study selects cases with Vf = 0.6 and ω1 set to 0.6 and 0.7 for investigation.
To quantitatively justify the selection of Vf = 0.6, ω1 = 0.6 and Vf = 0.6, ω1 = 0.7, Table 4 compiles the objective function values (J), mean temperatures (Tavg) and power dissipation (Emin) for all nine parametric combinations.
Table 4.
Quantitative performance metrics of topological configurations across all tested multi-objective ω1 and Vf.
As shown in Table 4, when Vf = 0.5, excessive energy loss occurs; whereas when Vf = 0.7, the flow channel becomes wider—although the temperature is slightly lower—the over-expansion of the flow channel reduces the core fluid velocity, thereby increasing the risk of local fluid stagnation. A volume fraction of Vf = 0.6, however, provides the optimal physical compromise. Furthermore, within the Vf = 0.6 regime, when ω1 = 0.5, the insufficient thermal weighting results in a relatively high average temperature (299.80 K). In contrast, configurations with ω1 = 0.6 and ω1 = 0.7 achieve superior cooling performance while keeping fluid energy dissipation within engineering tolerances. Consequently, the combinations (Vf = 0.6, ω1 = 0.6) and (Vf = 0.6, ω1 = 0.7) are selected as the optimal representative compromise designs for comprehensive three-dimensional numerical evaluation.
3. Numerical Analysis and Discussion
3.1. 3D Numerical Geometric Description
To convert the two-dimensional topological optimization results into physical three-dimensional liquid cooling plates (Cases III and IV), we employed a straightforward geometric reconstruction workflow. First, after iterative convergence, the fluid-solid interface was extracted, and spline curves from CAD 2019 software were used for smoothing to eliminate the stair-step features along the mesh edges, thereby preventing flow separation. Subsequently, the smoothed two-dimensional channel contours were extruded vertically by 5.0 mm to generate the three-dimensional cooling plate domain. Throughout this feature reconstruction process, we strictly adhered to a minimum channel branch width of 1.2 mm and a minimum solid wall thickness of 1.5 mm as essential manufacturing constraints to ensure fluid flow stability and 3D printability.
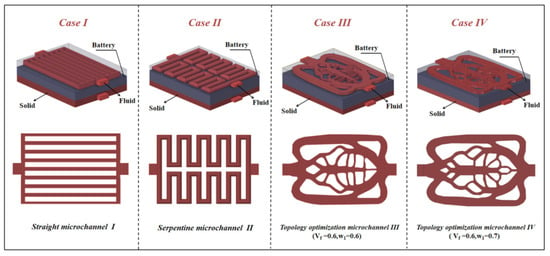
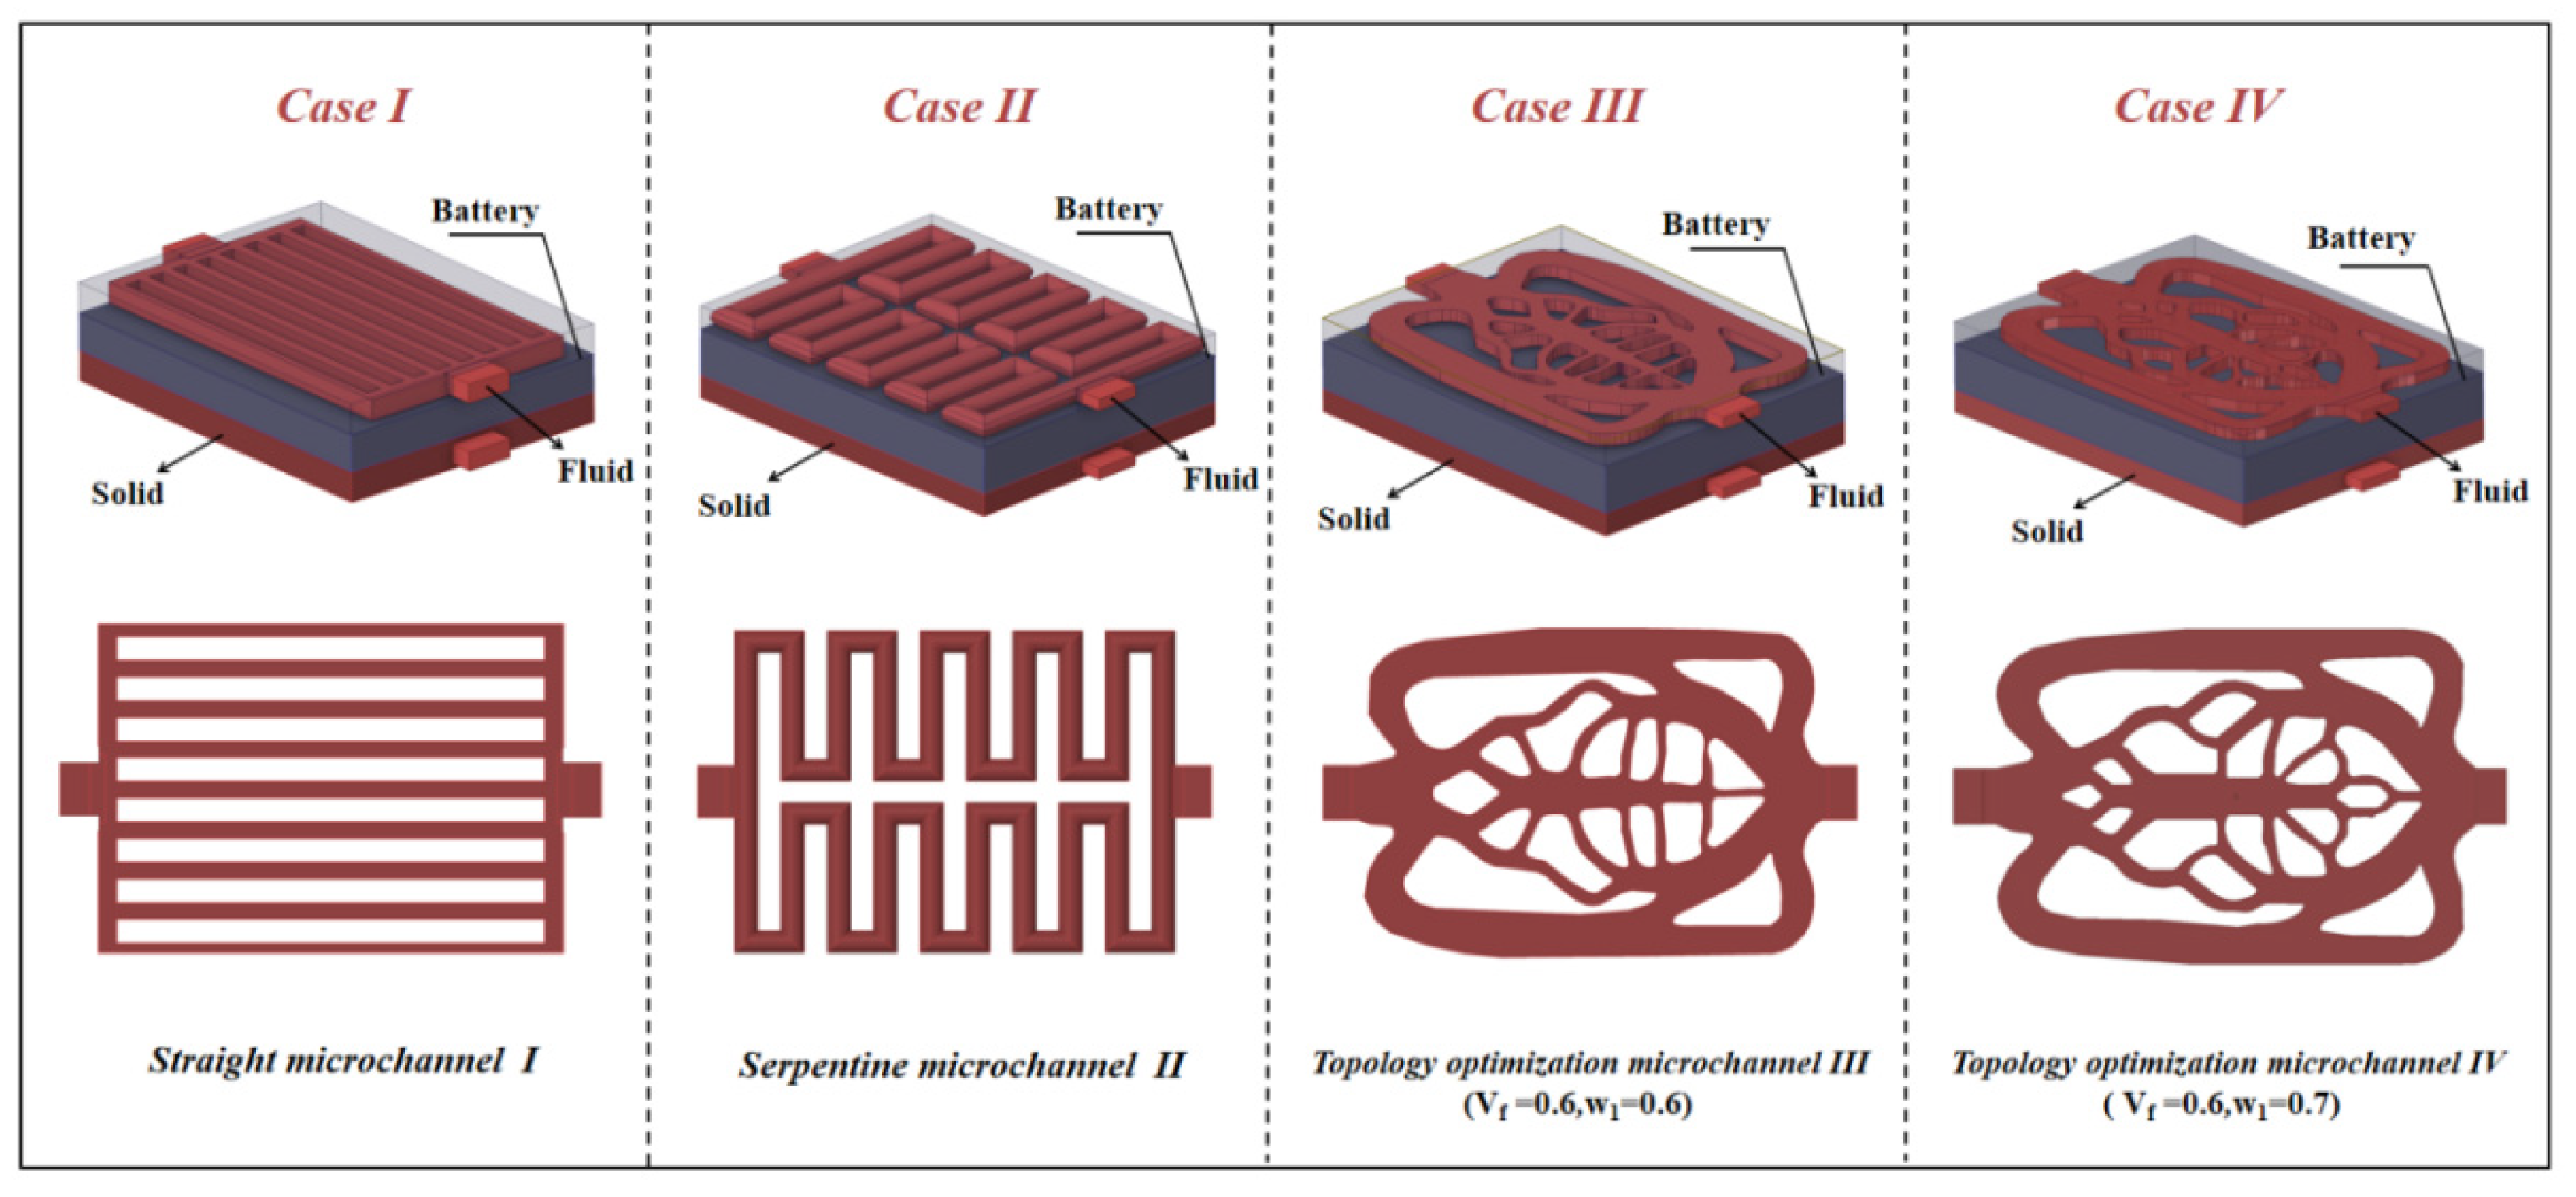
To assess the three-dimensional thermal regulation capability and flow characteristics of various channel layouts in real-world battery thermal management systems, four three-dimensional liquid cold plate models (Cases I–IV) were developed for comparative investigation. A typical bilateral symmetrical arrangement was adopted, as illustrated in Figure 5, where liquid cold plates were symmetrically attached to both sides of the battery cell. To eliminate entrance or exit boundary effects and accurately simulate the fully developed flow field characteristic of multi-cold-plate series piping systems in actual battery packs, the fluid domain inlets and outlets for all cases were extended outward by 10 mm. A pouch lithium-ion battery (Model L106480) was selected as the cell model, its detailed electrical and thermophysical properties are summarized in Table 5.
Figure 5.
Schematic of the battery assembly integrated with various cold plate layouts. Case I (straight flow channel), Case II (snake-shaped flow channel), Case III (Vf = 0.6, ω1 = 0.6), Case IV (Vf = 0.6, ω1 = 0.7).
Table 5.
Thermophysical and electrochemical properties of the battery components.
The four channel layouts comprise both conventional and topology-optimized configurations. Case I features a parallel straight-channel structure, serving as the baseline for performance comparison. Case II employs a serpentine channel that promotes heat transfer through extended fluid paths and bend-induced flow mixing. Cases III and IV represent topology-optimized structures with objective weighting factors of ω1 = 0.6 and ω1 = 0.7, respectively. In these optimized designs, the fluid volume fraction of Vf = 0.6 balances thermal coverage area with geometric design constraints. Furthermore, the tailored weighting factors enable targeted optimization of battery surface temperature uniformity while achieving a favorable trade-off between heat rejection capacity and hydraulic pressure drop.
To ensure a strictly fair baseline for comparative evaluation among Cases I–IV, all four cold plate configurations are constrained within identical outer dimensions and fluid volume budgets (Vf = 0.6). Furthermore, all designs share identical inlet/outlet duct cross-sectional areas (Ain). Consequently, testing under equal inlet velocities (Vin) directly guarantees identical volumetric flow rates (Q = Ain· Vin) and mass flow rates (m = ρ·Ain· Vin) across all cases. Under these uniform volume and flow constraints, observed thermal-hydraulic performance variations arise intrinsically from channel spatial topology and interfacial heat-transfer boundary evolution.
3.2. Model Validation
To evaluate the heat generation mechanism and thermal characteristics of the L106480 pouch-type lithium-ion cell, the classical Bernardi uniform volumetric heat source model is adopted. The volumetric heat generation rate within the cell is determined using the internal-resistance-based Bernardi formulation, as expressed by Equation (17) [30]:
Herein, I refers to the magnitude of discharge current, r0 and rp correspond to the ohmic internal impedance and polarization internal impedance respectively, T stands for the working temperature of the battery cell, and dU/dT corresponds to the open-circuit voltage temperature coefficient.
Studies have demonstrated that under constant-current discharge conditions at room temperature (20–40 °C), irreversible internal resistance Joule heating accounts for over 90% of the overall heat produced within the battery cell. Furthermore, the reversible entropic heat alternates between endothermic and exothermic states with variations in state of charge, exerting a minimal overall effect. Therefore, to enhance computational efficiency while maintaining high accuracy, the reversible entropic heat term is neglected in the present work. The battery’s volumetric heat production rate is simplified to a form driven solely by internal resistance Joule heating:
Combining the electrical relationship between the open-circuit voltage and operating voltage, the above equation can be equivalently expressed as:
By integrating the electrical correlation linking the open-circuit voltage to the terminal operating voltage, the foregoing expression can be rearranged equivalently as:
In this formulation, Eb denotes the open-circuit potential of the battery cell, and Ub represents the terminal voltage of the battery.
The thermophysical properties of the battery stay consistent with those specified in the previous section. Soft-pack batteries exhibit strong anisotropy in thermal conductivity, In the in-plane direction (X/Y directions), thermal conduction is dominated by the metallic current collector, resulting in a high thermal conductivity (kx = ky = 20 W/(m·k)), whereas along the thickness direction (Z direction), heat transfer must traverse the separator and the multi-layer interface impedance, leading to a lower thermal conductivity (kz = 1.5 W/(m·k)). Through this arrangement, the primary heat flux rejected into the flat cold plates strictly flows through the low-conductivity Z-axis, ensuring realistic capture of internal thermal resistance and localized hot spots without artificial thermal smoothing. The partial differential equation governing the three-dimensional anisotropic heat transfer inside the battery is formulated in reference [31]:
In the expression above, ρc, Cp,c, and kc represent the mass density, constant-pressure specific heat capacity, and thermal conductivity tensor of a unit battery cell, sequentially.
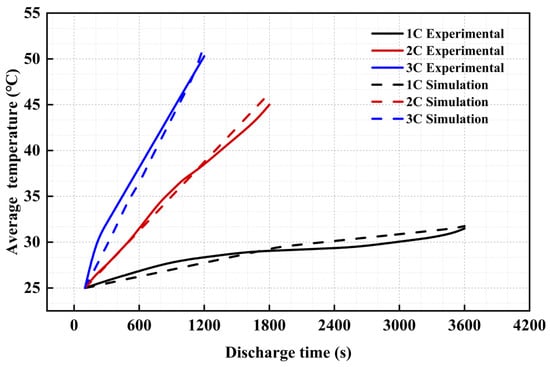
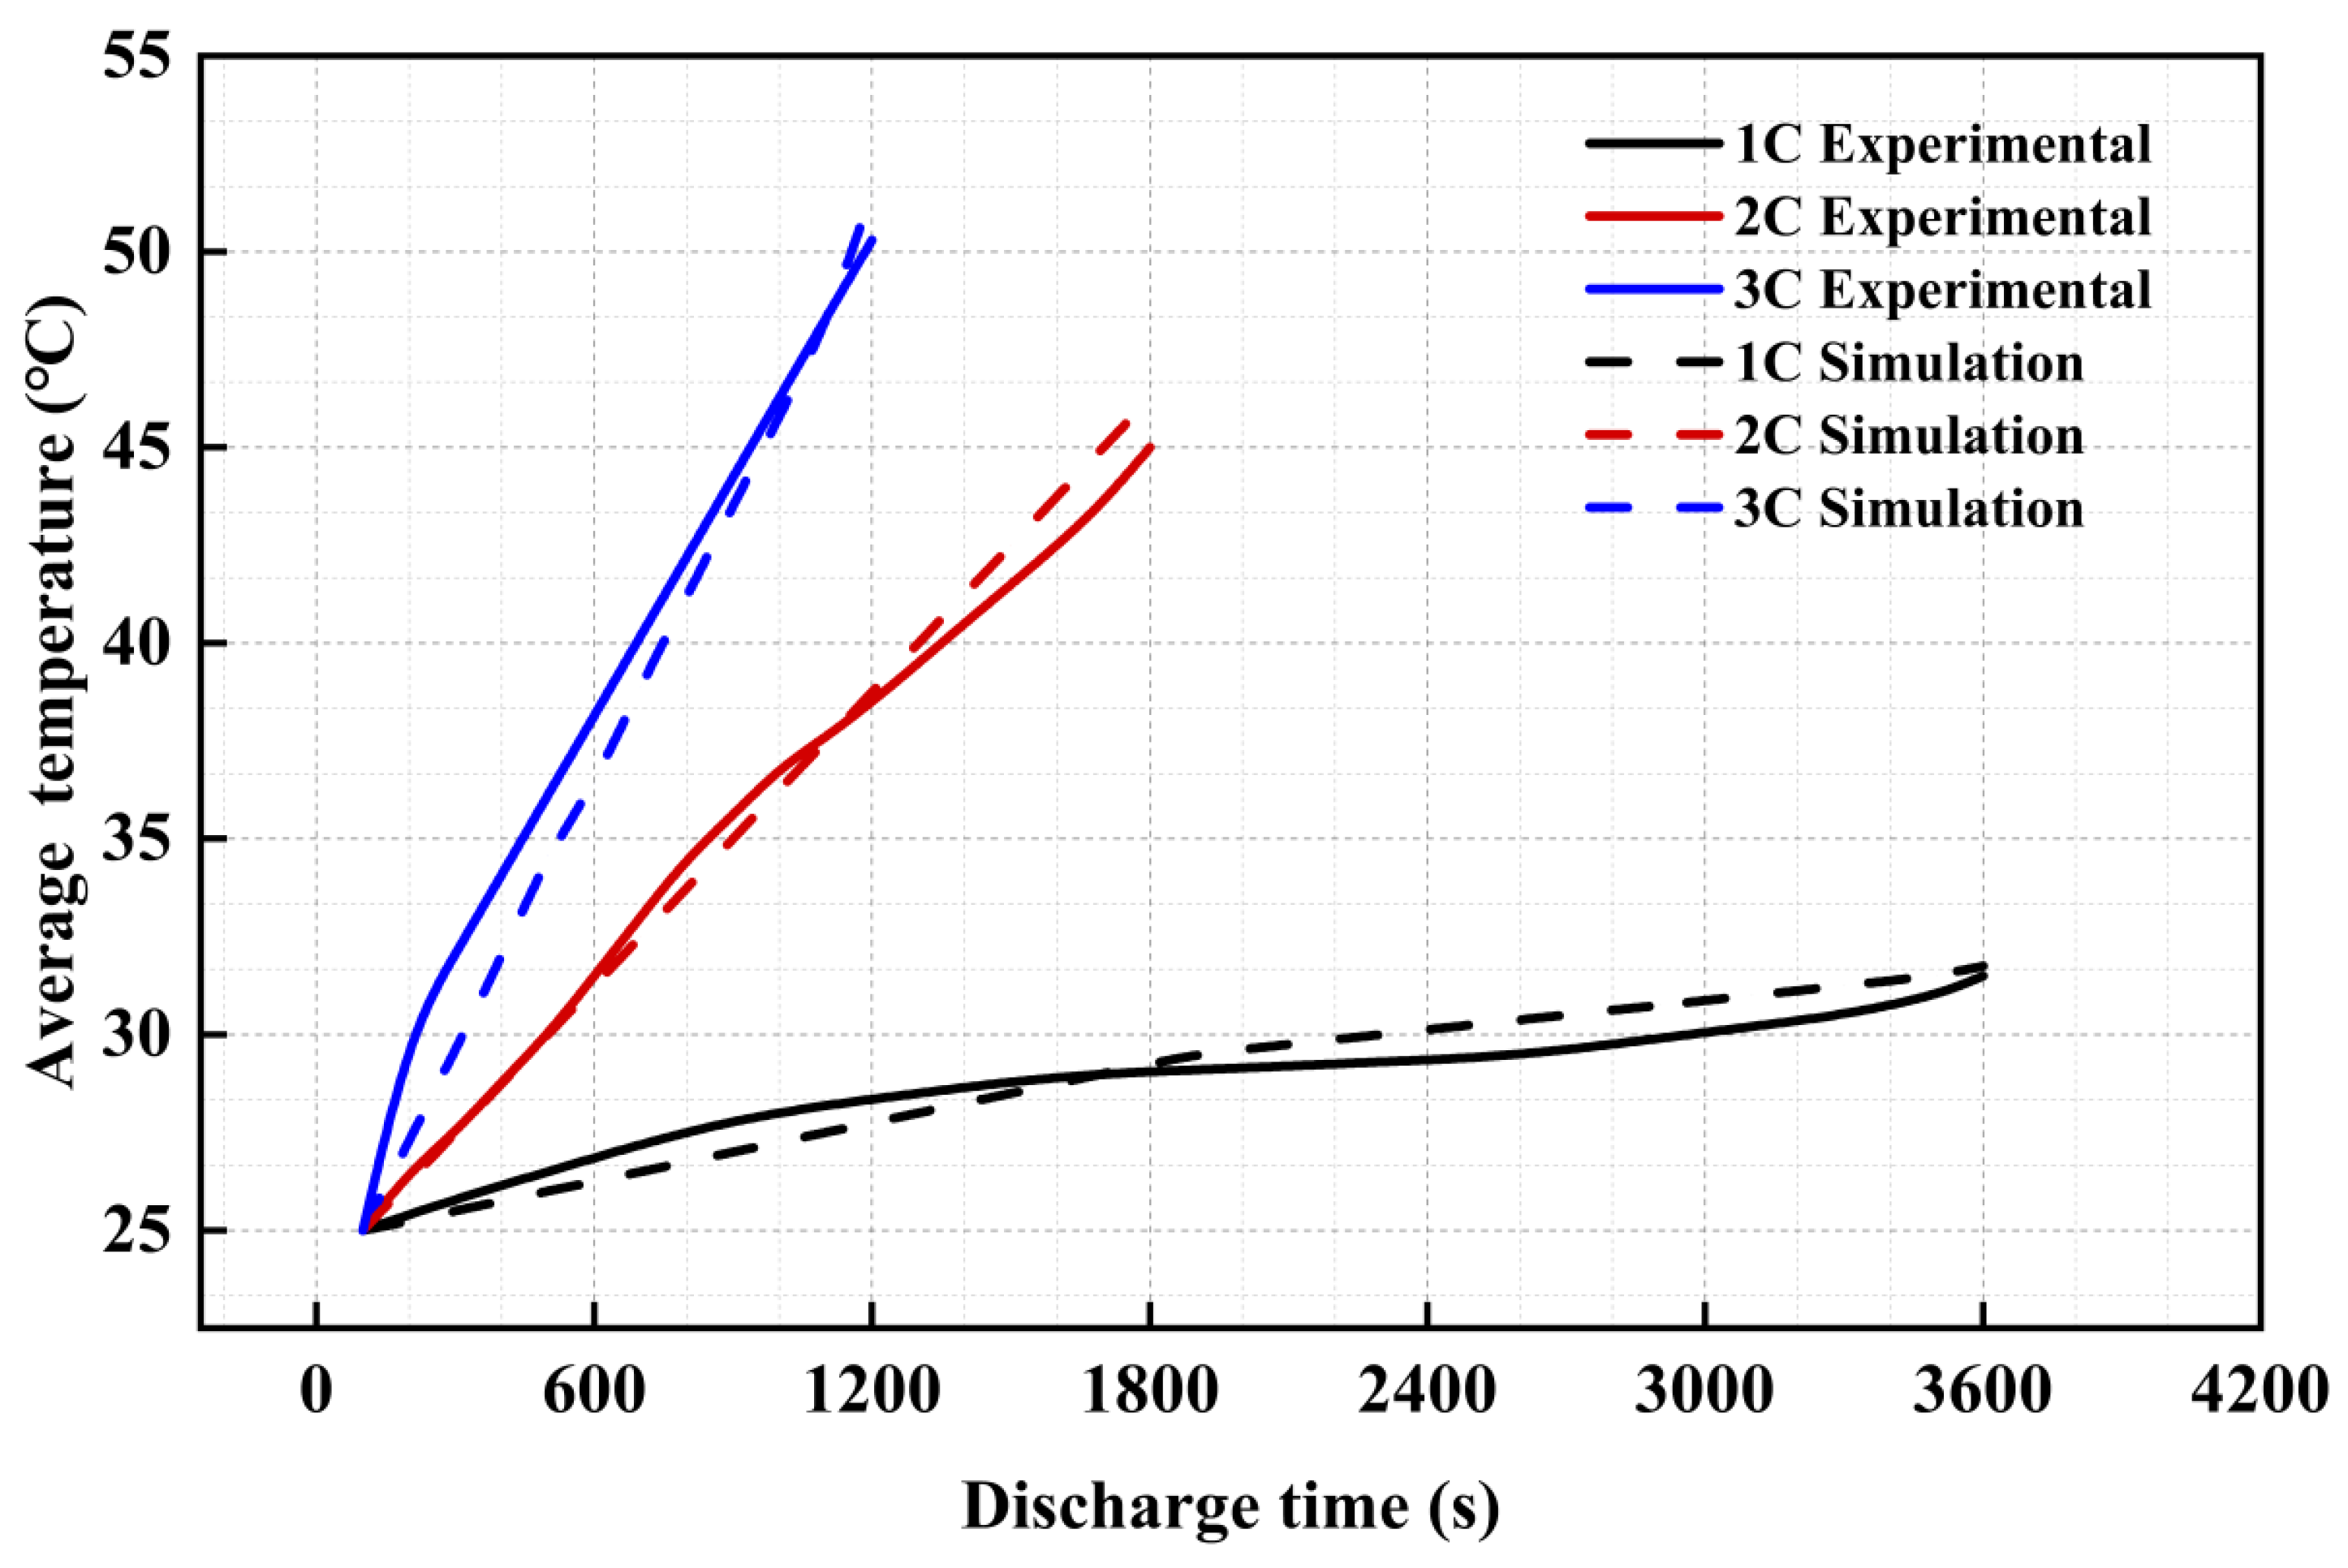
To verify the computational precision and fidelity of the thermal simulation, model validation was conducted under three representative constant-current discharge conditions (1C, 2C, and 3C) at an ambient temperature of 25 °C. As depicted in Figure 6, the numerical predictions were benchmarked against the experimental measurements reported by Wang et al. [32]. Although the batteries employed by the two systems exhibit minor differences in specific capacity and dimensions, both systems share the same pouch cell architecture, anisotropic thermal properties, and standardized constant-current discharge protocols (1C–3C). This ensures physical compatibility between the two systems, thereby enabling their use to validate the correctness of the constructed Bernardi heat-generation model and the anisotropic thermal conduction framework. The two sets of results demonstrate excellent agreement, with low relative errors of 2.3%, 1.5%, and 2.8% at 1C, 2C, and 3C, respectively. This close consistency confirms the reliability of the heat generation model, thereby establishing a robust foundation for subsequent evaluations of liquid cold plate thermal performance across various channel topologies.
Figure 6.
Comparison of results between model simulation and experimental data.
To quantify the thermal loading, an effective lumped internal resistance of Rint = 2.5 mΩ is assigned to the L106480 pouch cell. Based on the irreversible Joule heating formulation, the resulting volumetric heat generation rates (Q) evaluated across the four constant-current discharge rates are: 2.45 × 10⁴ W/m3 for 0.5C, 9.80 × 10⁴ W/m3 for 1.0C, 3.92 × 10⁵ W/m3 for 2.0C and 8.82 × 10⁵ W/m3 for 3C.
It should be noted that employing a constant internal resistance introduces certain limitations by neglecting its dynamic dependence on the state of charge (SOC) and operating temperature. In practical operations, internal resistance varies non-linearly across the discharge profile—typically rising at low SOC levels—and decreases at elevated temperatures due to enhanced ionic kinetics. Although this constant-resistance assumption serves as a robust and computationally efficient first-order approximation for comparative thermal evaluations of various cold plate layouts, it smooths out localized transient fluctuations. To address this limitation, our future research will focus on developing a fully coupled electro-chemo-thermal model that explicitly incorporates temperature- and SOC-dependent internal resistance functions, enabling more granular investigations into localized thermal behaviors under dynamic operating profiles.
3.3. Boundary Setting Specifications and Grid Convergence Verification
To evaluate the thermal dissipation performance under different channel layouts, we conducted three-dimensional conjugate numerical simulations using the ANSYS Fluent 2022 platform. The flow regime was evaluated using the inlet Reynolds number, defined as (Re = ),where ρf = 997 kg/m3 and μf = 0.797 mPa·s are the density and dynamic viscosity of water, and (Dh) is the hydraulic diameter of the inlet cross-section.
For the investigated inlet velocity range of 0.1–0.5 m/s, the inlet Reynolds numbers are precisely calculated to range from 625 to 3127. To verify the validity of the laminar-flow assumption across configurations: At lower inlet velocities (0.1–0.3 m/s), the Reynolds number remains strictly below the critical transition threshold (Re < 2300). At higher inlet velocities (0.4–0.5 m/s), the inlet trunk Reynolds number slightly exceeds 2300. However, upon entering the multi-stage branching network (Cases III and IV) or parallel micro-passages (Cases I and II), the flow splits into numerous parallel branches, causing local velocities and characteristic dimensions to drop significantly. Therefore, the assumption of laminar flow throughout the heat transfer channels is physically justified and robust.
A comparative analysis was performed at a constant-current discharge rate of 1 C, with consistent boundary conditions: inlet temperature (Tin) set to 25 °C, and outlet gauge pressure (Pout) set to 0 Pa. The detailed boundary conditions and operating parameters are summarized in Table 6.
Table 6.
Settings of boundary parameters and simulation operating conditions.
Regarding the numerical scheme, a fixed time step size of Δt = 1.0 s was employed for all simulations, with the pressure–velocity coupling handled via the coupled algorithm in the ANSYS Fluent pressure-based solver. Furthermore, zero thermal contact resistance was assumed at the interface between the battery and the aluminum cold plate, representing an ideal bonding condition. Standard conjugate heat transfer conditions ensuring full continuity of temperature and local heat flux were applied at all internal solid–fluid and battery–plate interfaces. With the exception of the fluid inlet, outlet, and bilateral symmetry planes, all external bounding walls of the assembly were modeled as adiabatic and no-slip walls. A second-order implicit scheme was employed for temporal discretization, while the spatial and temporal discretization of the momentum and energy equations utilized the second-order scheme to minimize numerical diffusion. Within each time step, iterative convergence was enforced by setting the scaling residual threshold for the energy equation to 10−6, and the continuity and momentum component thresholds to 10−4; the maximum number of iterations per time step was limited to 30.
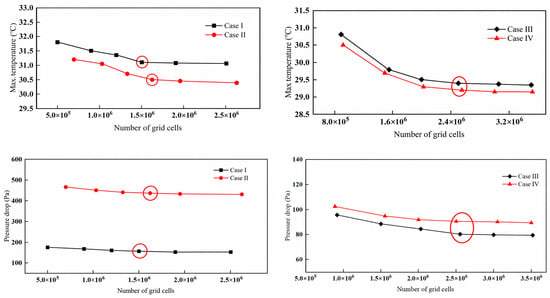
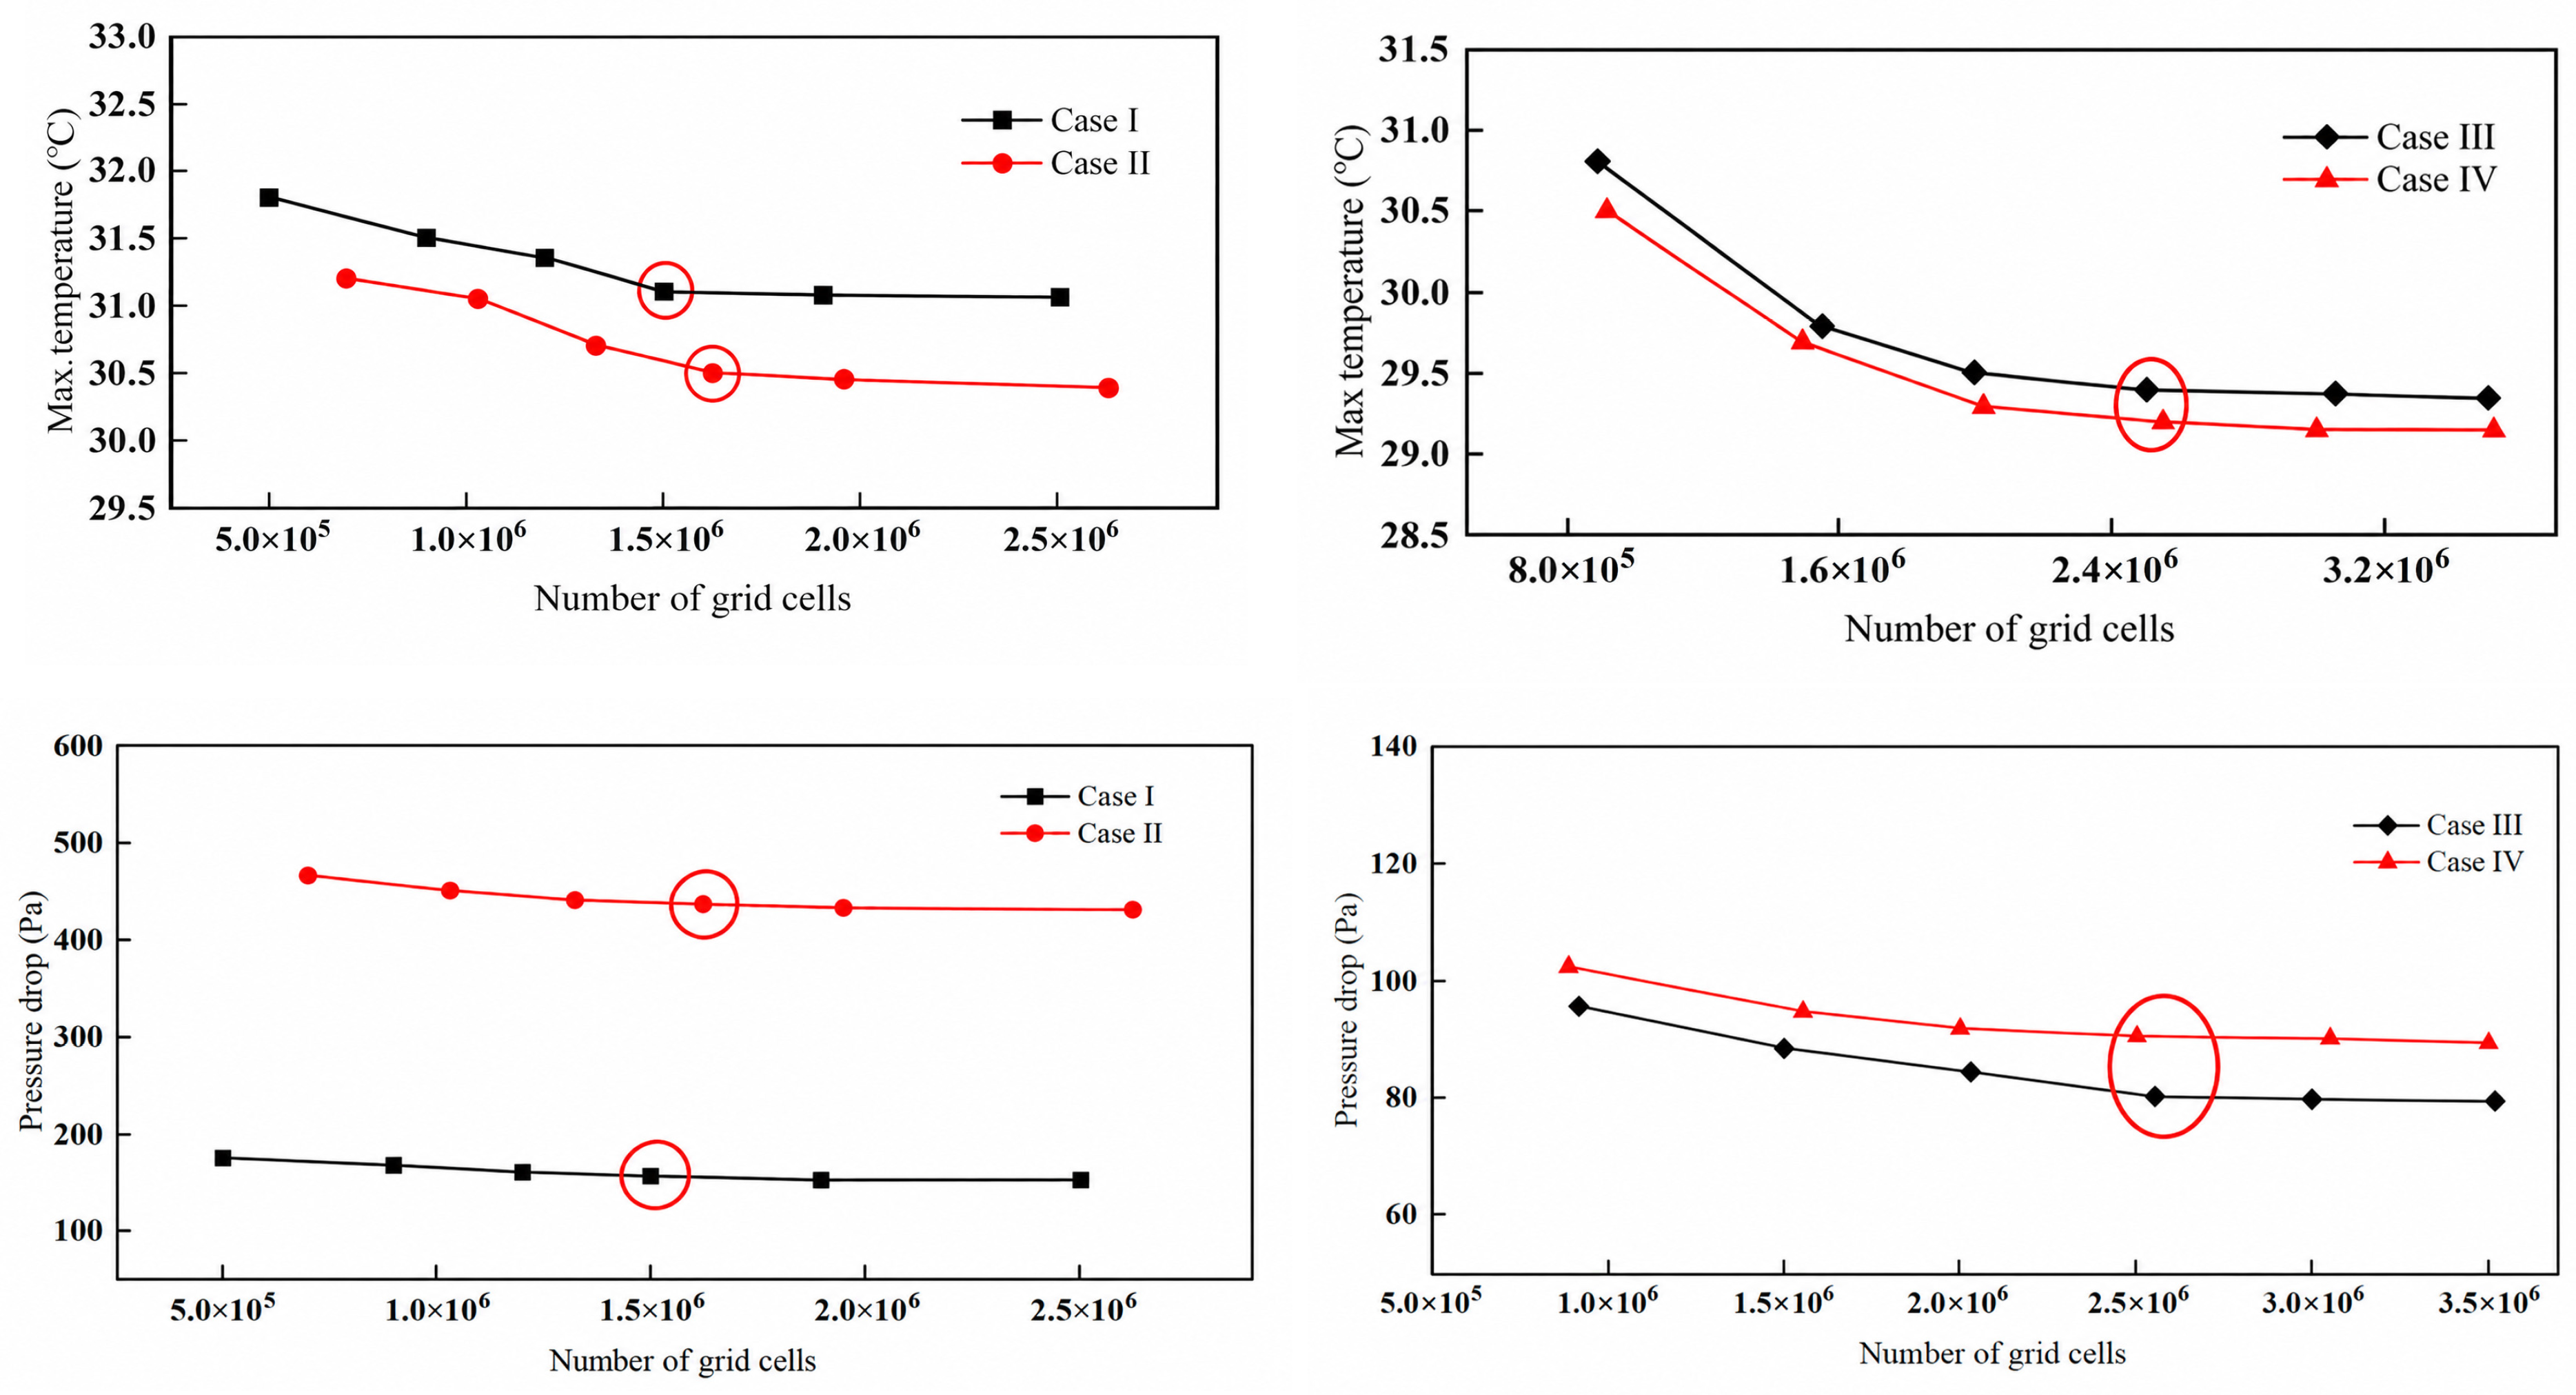
To validate the reliability and computational accuracy of the simulation results, hexahedral grids were generated for all four liquid cooling channel schemes via the Fluent Meshing module. A mesh independence verification was performed, taking the maximum battery temperature and pressure drop as the evaluation criterion. Among these configurations, Case I and Case II represent conventional flow channel designs, whereas Case III and Case IV feature complex topology-optimized channel configurations.
As illustrated in Figure 7, multiple mesh resolution schemes were tested for the conventional and topology-optimized layouts. To provide a rigorous quantitative evaluation beyond graphical trends, the specific numerical values of element counts, peak temperature (Tmax), and pressure drop (ΔP) at each refinement level are reported as follows.
Figure 7.
Grid independence verification for traditional channels (Case I and Case II) and topology-optimized channels (Case III and Case IV).
For the conventional layouts (Case I and Case II), five mesh levels were evaluated. For Case I, the element count increased from 5.2 × 10⁵ (coarse) to 2.5 × 10⁶ (fine), while Tmax decreased from 31.90 °C to 31.06 °C and ΔP from 175.2 Pa to 151.5 Pa. For Case II, the element count ranged from 6.8 × 10⁵ to 2.2 × 10⁶, with Tmax falling from 31.20 °C to 29.69 °C and ΔP from 465.0 Pa to 430.0 Pa. During the mesh refinement process, when the total element count exceeded 1.5 × 10⁶ (the selected baseline), the relative variation in Tmax stayed within 2%, and the pressure drop variation was kept below 5%. This indicates that further mesh densification has negligible impact on the calculation results, satisfying the mesh independence criterion.
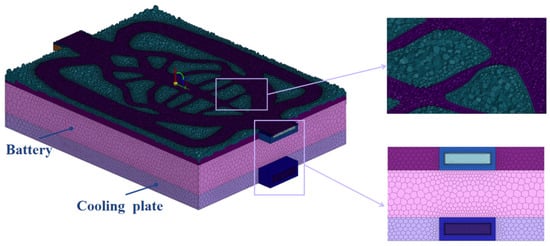
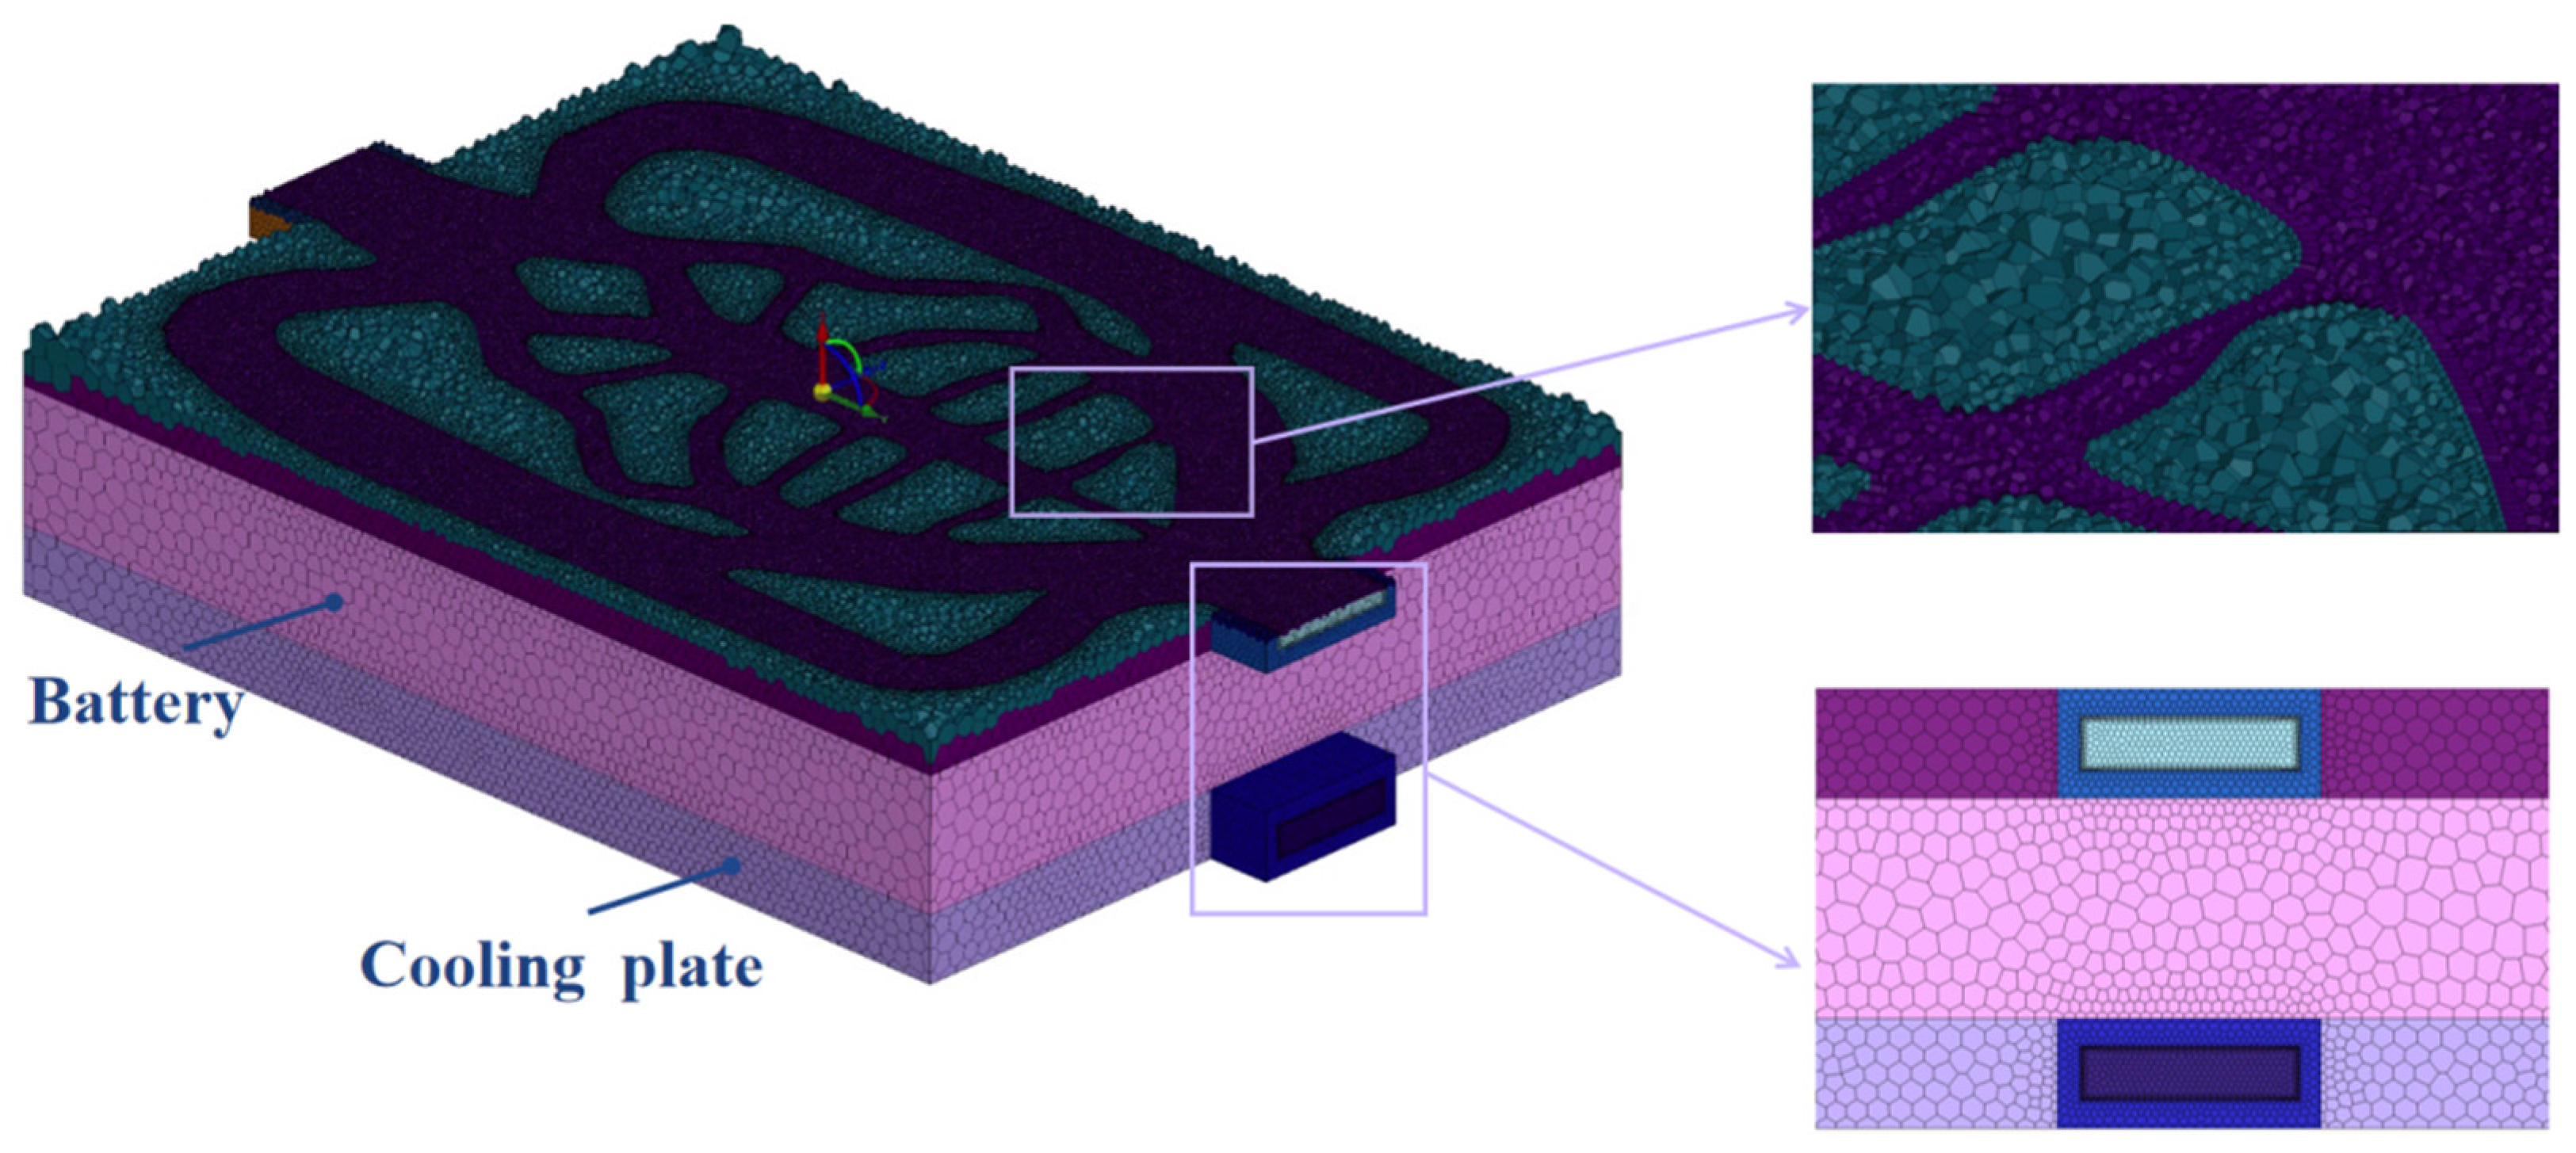
For the more sophisticated topology-optimized channels (Case III and Case IV), five successive refinement levels were tested in the same manner. For Case III, the element count rose from 8.5 × 10⁵ to 3.5 × 10⁶, corresponding to a Tmax reduction from 30.80 °C to 29.01 °C and a ΔP decrease from 95.5 Pa to 84.98 Pa, the detailed view of the grid is shown in Figure 8. For Case IV, the element count varied from 9.2 × 10⁵ to 3.5 × 10⁶, with Tmax dropping from 30.50 °C to 28.90 °C and ΔP from 103.5 Pa to 89.87 Pa. During the mesh refinement process, mesh convergence was achieved at an element count of 2.5 × 10⁶ (the selected level), beyond which further refinement produced relative deviations of less than 1% for both Tmax and ΔP.
Figure 8.
Case III—3D battery pack assembly mesh model.
Considering both computational accuracy and economic efficiency, the finalized mesh schemes selected for subsequent analyses were: 1,503,251 and 1,614,785 hexahedral elements for Case I and Case II, respectively, and 2,504,562 and 2,540,678 hexahedral elements for Case III and Case IV, respectively.
3.4. Analysis and Discussion of Simulation Outcomes
3.4.1. Influence of Cold-Plate Geometries
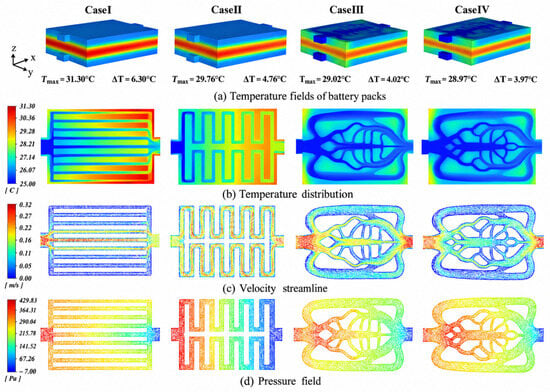
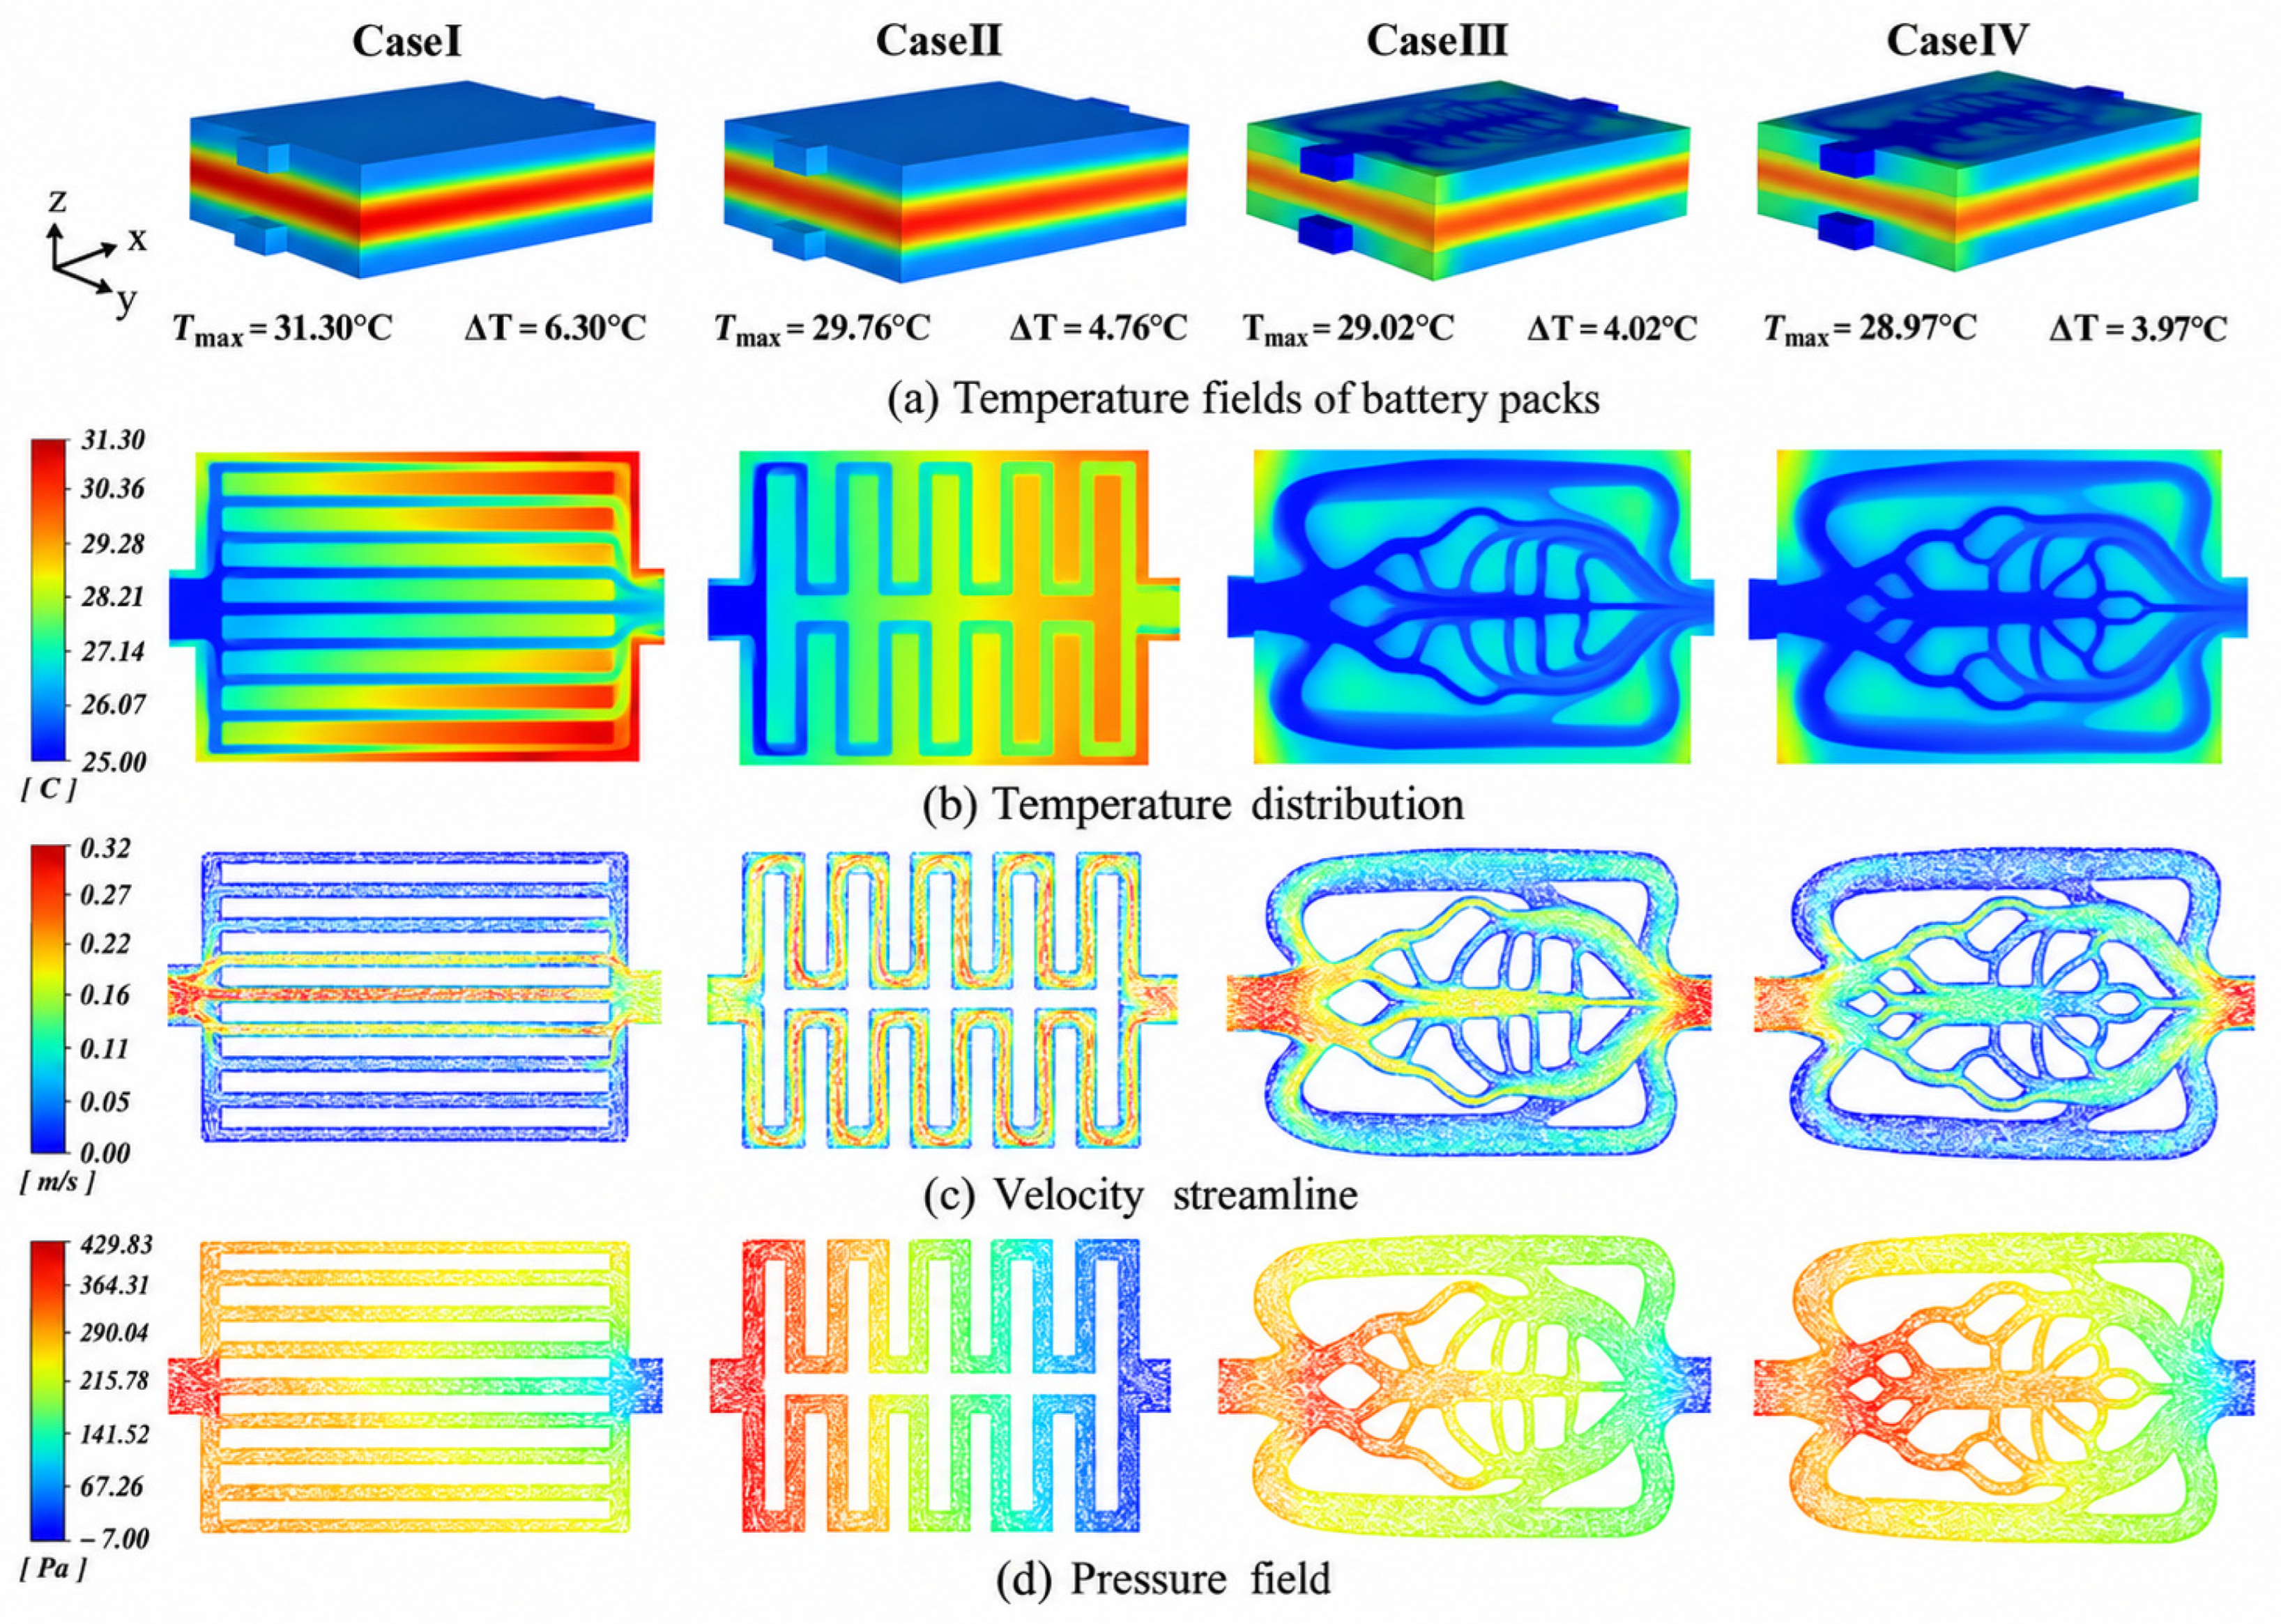
To conduct a comprehensive performance evaluation of the four channel configurations, Figure 9 illustrates the distribution characteristics and comparative performance metrics for Case I–IV at Vin = 0.2 m/s, T0 = 25 °C. Including the maximum battery temperature, thermal contours across the cold plate, fluid velocity streamlines, and pressure drops. Regarding maximum temperature and thermal gradient control (Figure 9a), the topology-optimized channels (Case III and Case IV) exhibit distinct heat dissipation advantages. In particular, Case IV achieves both the lowest peak battery temperature and the smallest temperature span, delivering better cooling performance than the baseline parallel channel structure (Case I). As observed from the thermal distributions on the cold plate (Figure 9b), substantial heat accumulation occurs along the lateral margins and peripheral regions of Case I. In contrast, Case III and Case IV leverage uniformly distributed topological networks to maintain a highly uniform thermal field across the cold plate surface.
Figure 9.
Performance comparison among Case I to Case IV: (a) peak temperature and temperature difference in the battery, (b) temperature distribution of the cold plate, (c) streamline velocity distributions, (d) pressure cloud maps.
In terms of velocity fields (Figure 9c), structural constraints in Case I induce severe flow maldistribution, where fluid velocities in several branch channels drop close to zero, giving rise to pronounced flow stagnation zones. In Case II, excessive path lengths generate high cumulative frictional resistance, while sharp right-angle bends trigger localized flow separation and recirculation pockets. Conversely, the topological architecture achieves efficient velocity allocation via a multi-level branched network, maintaining moderate and stable flow velocities across both primary trunks and secondary branches. Finally, regarding static pressure distributions (Figure 9d), Case I and Case II suffer from elevated pressure drops between the inlet and outlet due to significant local losses at right-angle elbows and channel junctions. In contrast, the topological structures adhere to natural flow bifurcation principles, featuring smooth streamline transitions that effectively reduce hydraulic resistance and pumping power consumption, thus attaining a desirable compromise that balances heat dissipation capability against pressure drop penalties.
To conduct a quantitative evaluation of the overall performance of the battery cold plate system, six key indicators are introduced in this study to conduct a systematic analysis across three dimensions: thermal regulation capacity, heat transfer efficiency, and fluid pumping dissipation. Among these, the peak temperature (Tmax) and mean temperature (Tavg) are defined by Equation (21), serving to measure the extreme temperature control limits and the global cooling effectiveness of the system, respectively:
In the expression, Vb stands for the effective volume of a single battery cell, and Tb refers to the temperature value at each local position inside the cell.
The temperature difference (ΔT) is expressed by Equation (22) to characterize the thermal field uniformity across the battery.
To quantify the heat dissipation effectiveness under dynamic battery discharge conditions, the apparent transient thermal resistance (Rth)is introduced, which is defined by Equation (23) to quantify the global thermal transport resistance from the heat-generating source to the coolant:
where Tin represents the coolant temperature at the channel inlet, and Q refers to the overall thermal yield per unit time in the cell across the energy output stage.
The total pressure drop (ΔP) and friction factor (f) are defined by Equation (24) and Equation (25), respectively, to reflect the fluid energy losses incurred as the cooling medium traverses the cold plate:
where Dh represents the hydraulic diameter, ρ corresponds to the fluid density, v stands for the average flow velocity, and L indicates the characteristic length of the channel.
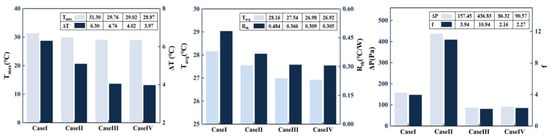
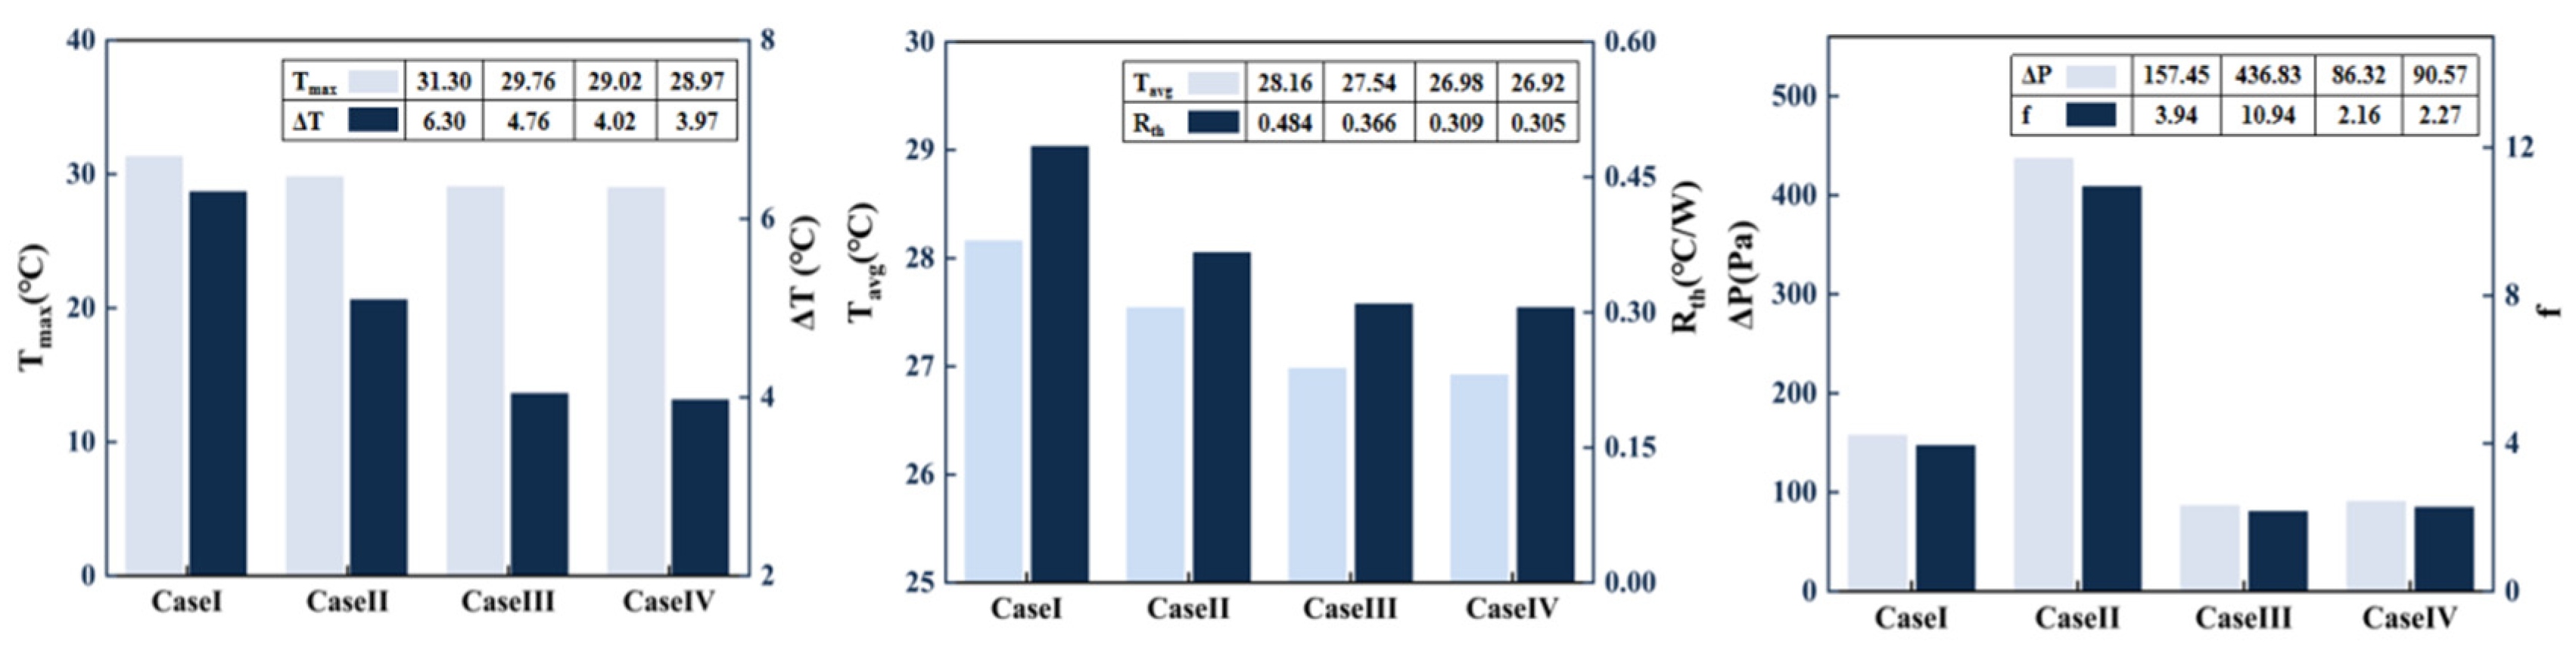
A quantitative comparison of the full set of performance metrics is presented in Figure 10. In terms of thermal regulation capability, considerable differences can be identified among the four channel configurations. Case I exhibits the poorest thermal performance Tmax = 31.3 °C, ΔT = 6.30 °C, Tavg = 28.16 °C, yielding a high thermal resistance of 0.484 °C/W; Case II offers a modest improvement over Case I. Conversely, the topology-optimized designs (Case III and Case IV) demonstrate superior thermal control capability, with Case IV achieving the lowest maximum temperature (28.97 °C), the smallest temperature differential (3.97 °C), and the lowest thermal resistance (0.305 °C/W). The fundamental origin of these thermal differences lies in the severe flow maldistribution of conventional channels, which induces low peripheral fluid velocities and localized thermal accumulation. In contrast, the biomimetic bifurcated arrangement in the topological configuration disrupts thermal boundary layer growth, significantly extends the effective heat transfer area, and improves flow distribution uniformity, thus substantially reducing the overall thermal resistance.
Figure 10.
Quantitative comparison histogram of thermal and hydraulic parameters across Case I to Case IV.
Regarding hydraulic performance, ΔP and f exhibit even greater variations across configurations. The serpentine layout (Case II) incurs extremely high ΔP and f due to its extended flow path and sharp 180° bends, which induce severe frictional drag and local pressure losses. Parallel channels (Case I) experience extra energy dissipation caused by sudden expansion or contraction near the inlet and outlet sections. Conversely, the topological channels (Cases III and IV) dramatically reduce ΔP to 86.32Pa and 90.57 Pa (f = 2.16 and 2.27), respectively. Specifically, Case IV achieves a 79.3% reduction in pressure drop compared to Case II, with their smoothly contoured, variable-section branches substantially suppressing flow separation and reducing the extent of low-velocity regions to significantly cut pumping power consumption.
To quantitatively evaluate the hydraulic transport behavior across all optimized configurations, Table 7 reports the complete set of hydraulic performance metrics—including mass flow rate (m), average velocity (Vavg), hydraulic diameter (Dh), pressure drop (ΔP), pumping power (Ppump) for Case I through Case IV alongside the baseline parallel microchannel design under the benchmark operating condition (m = 4.985 ×10⁻³ kg/s).
Table 7.
Comprehensive hydraulic performance metrics for conventional designs (Case I & Case II) and topology-optimized designs (Case III & Case IV).
As presented in Table 7, all configurations are tested under identical flow conditions for a strictly fair hydraulic comparison. Both topology-optimized designs markedly outperform conventional channels in hydraulic efficiency. Case III yields the lowest pumping power of 0.432 mW, a 45.1% reduction compared with the conventional parallel Case I. Case IV, assigned a higher weight to thermal performance, shows a slightly higher pumping power of 0.453 mW, yet still achieves a 79.3% pressure drop reduction relative to the serpentine Case II. This improvement stems from smooth bifurcated flow paths that suppress flow separation and stagnation, confirming the efficacy of the fluid-thermal coupled topology optimization in reducing pumping power while preserving uniform flow distribution.
3.4.2. Effects of Coolant Inlet Temperature
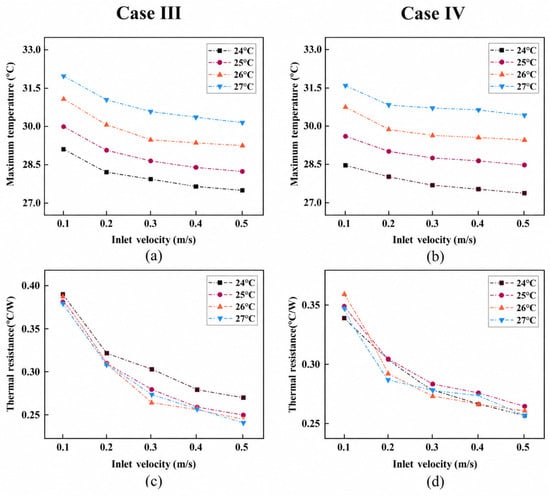
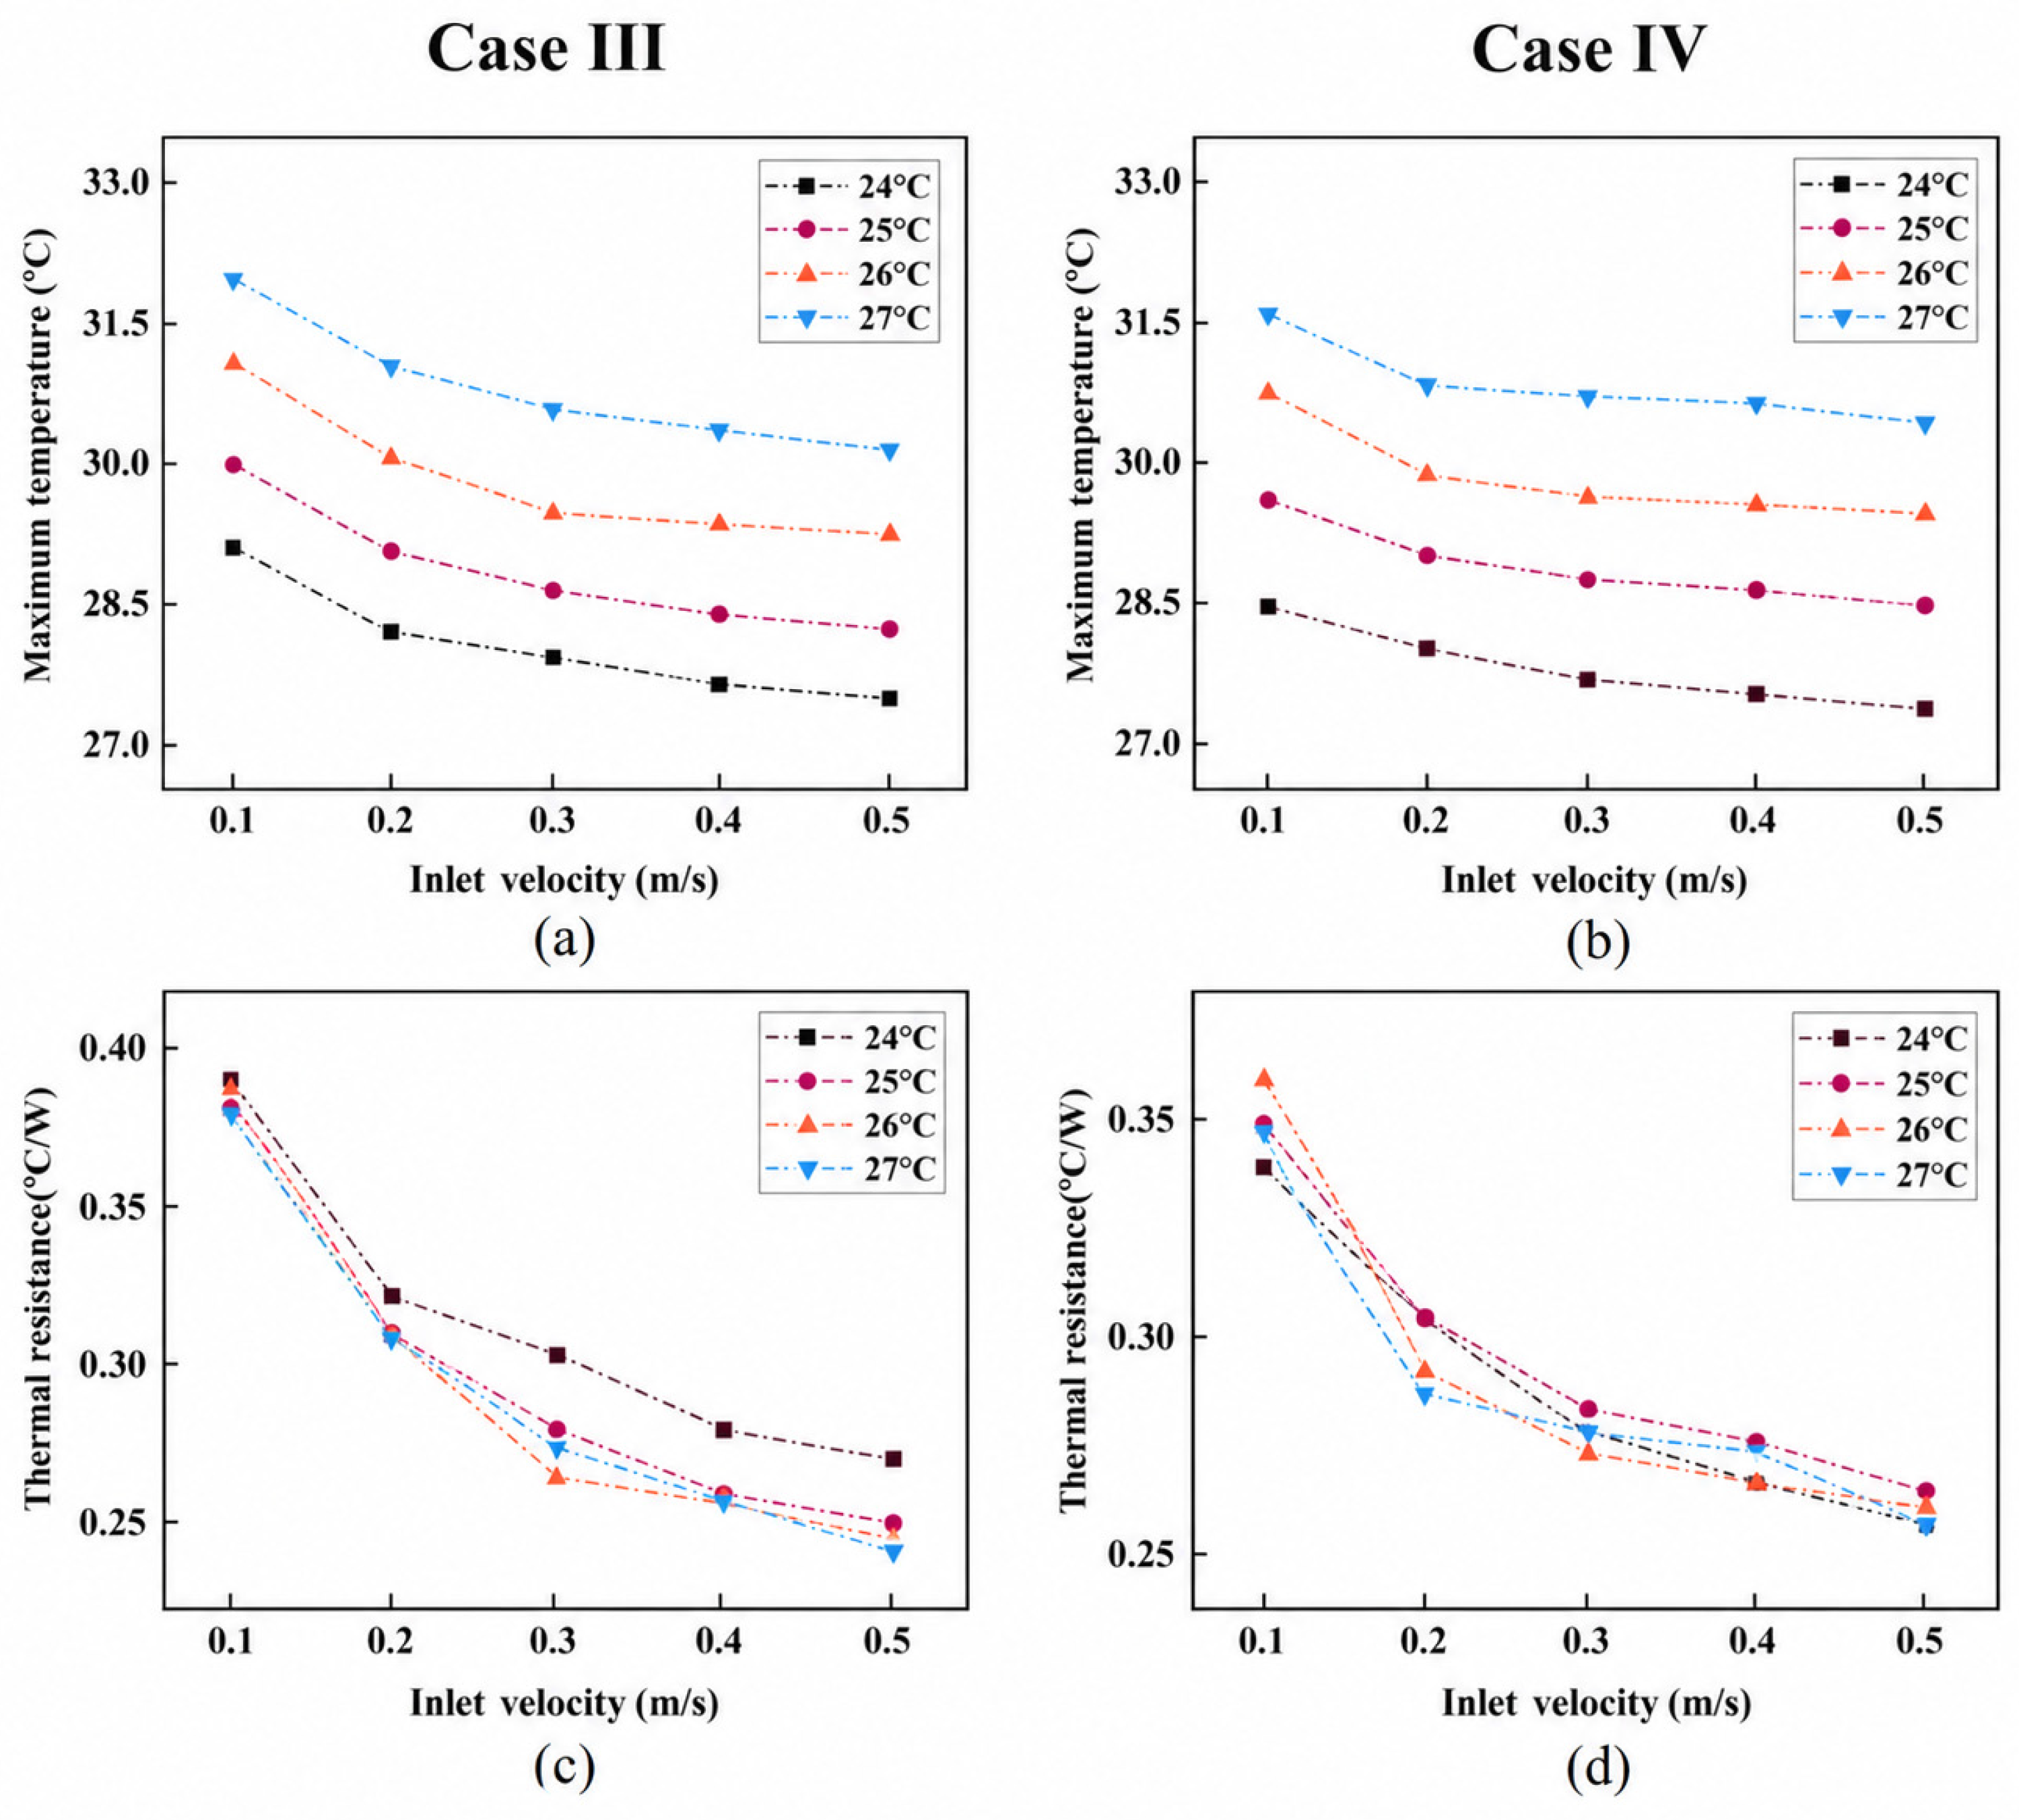
To comprehensively assess the heat dissipation capability of the topology-optimized fluidic channels, Figure 11 depicts the variation profiles of peak cell temperature (Tmax) and corresponding thermal resistance (Rth) for Case III and Case IV over a range of coolant inlet temperatures (24–27 °C) and incoming flow speeds (0.1 m/s–0.5 m/s). As presented in Figure 11a,b, elevating the incoming flow speed or lowering the coolant inlet temperature effectively suppresses the peak cell temperature. For both topological configurations, as the inlet velocity increases from 0.1 m/s to 0.5 m/s, Tmax exhibits a non-linear drop—decreasing sharply initially before leveling off beyond 0.3 m/s.
Figure 11.
Effects of coolant inlet temperature and flow speed on thermal behavior: (a,b) peak cell temperature (Tmax), (c,d) apparent transient thermal resistance (Rth).
This diminishing cooling return beyond 0.3 m/s is dictated by the inherent anisotropic thermal conductivity of the battery cell. While the in-plane thermal conductivity (kx = ky = 20W/(m·k)) is high due to continuous metallic current collectors, the out-of-plane thermal conductivity along the Z-axis (kz = 1.5W/(m·k)) is severely restricted by multi-layer separator interfaces and contact resistances. Once the convective heat transfer is substantially intensified by increasing coolant velocity beyond 0.3 m/s, the internal Z-axis conductive thermal resistance becomes the primary rate-limiting bottleneck, preventing internal Joule heat from conducting rapidly to the cooling surface. Furthermore, Case IV consistently maintains a lower Tmax than Case III across all operating conditions, demonstrating superior thermal mitigation capability—particularly at lower flow rates—owing to its optimization weighting factor favoring average temperature minimization.
Regarding the apparent transient thermal resistance, Rth decreases substantially with increasing inlet velocity. For instance, for Case III at 24 °C, Rth falls noticeably from 0.39 °C/W at 0.1 m/s down to 0.27 °C/W at 0.5 m/s, verifying the effectiveness of elevated flow rates in lowering convective thermal resistance. Crucially, unlike the temperature profiles, the thermal resistance curves at various inlet temperatures are virtually superimposed, except for minor deviations at 24 °C under low flow rates. This suggests that Rth is primarily determined by passage configuration, flow speed, and the thermophysical characteristics of the working fluid. Within a limited range of incoming fluid temperatures, the fluid’s thermophysical properties stay mostly consistent, exerting minimal impact on the total thermal resistance of the entire set up.
3.4.3. Impact Under Different Discharge Rates
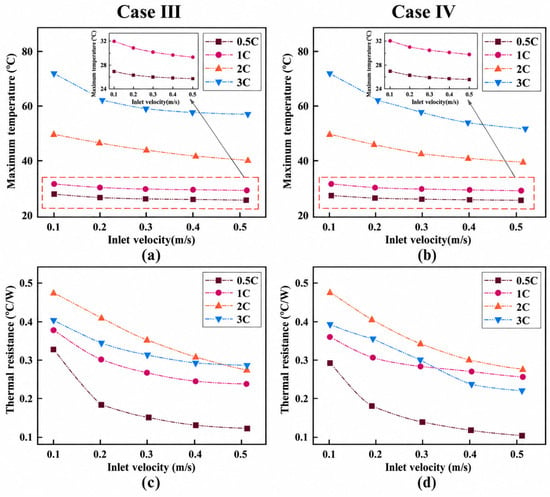
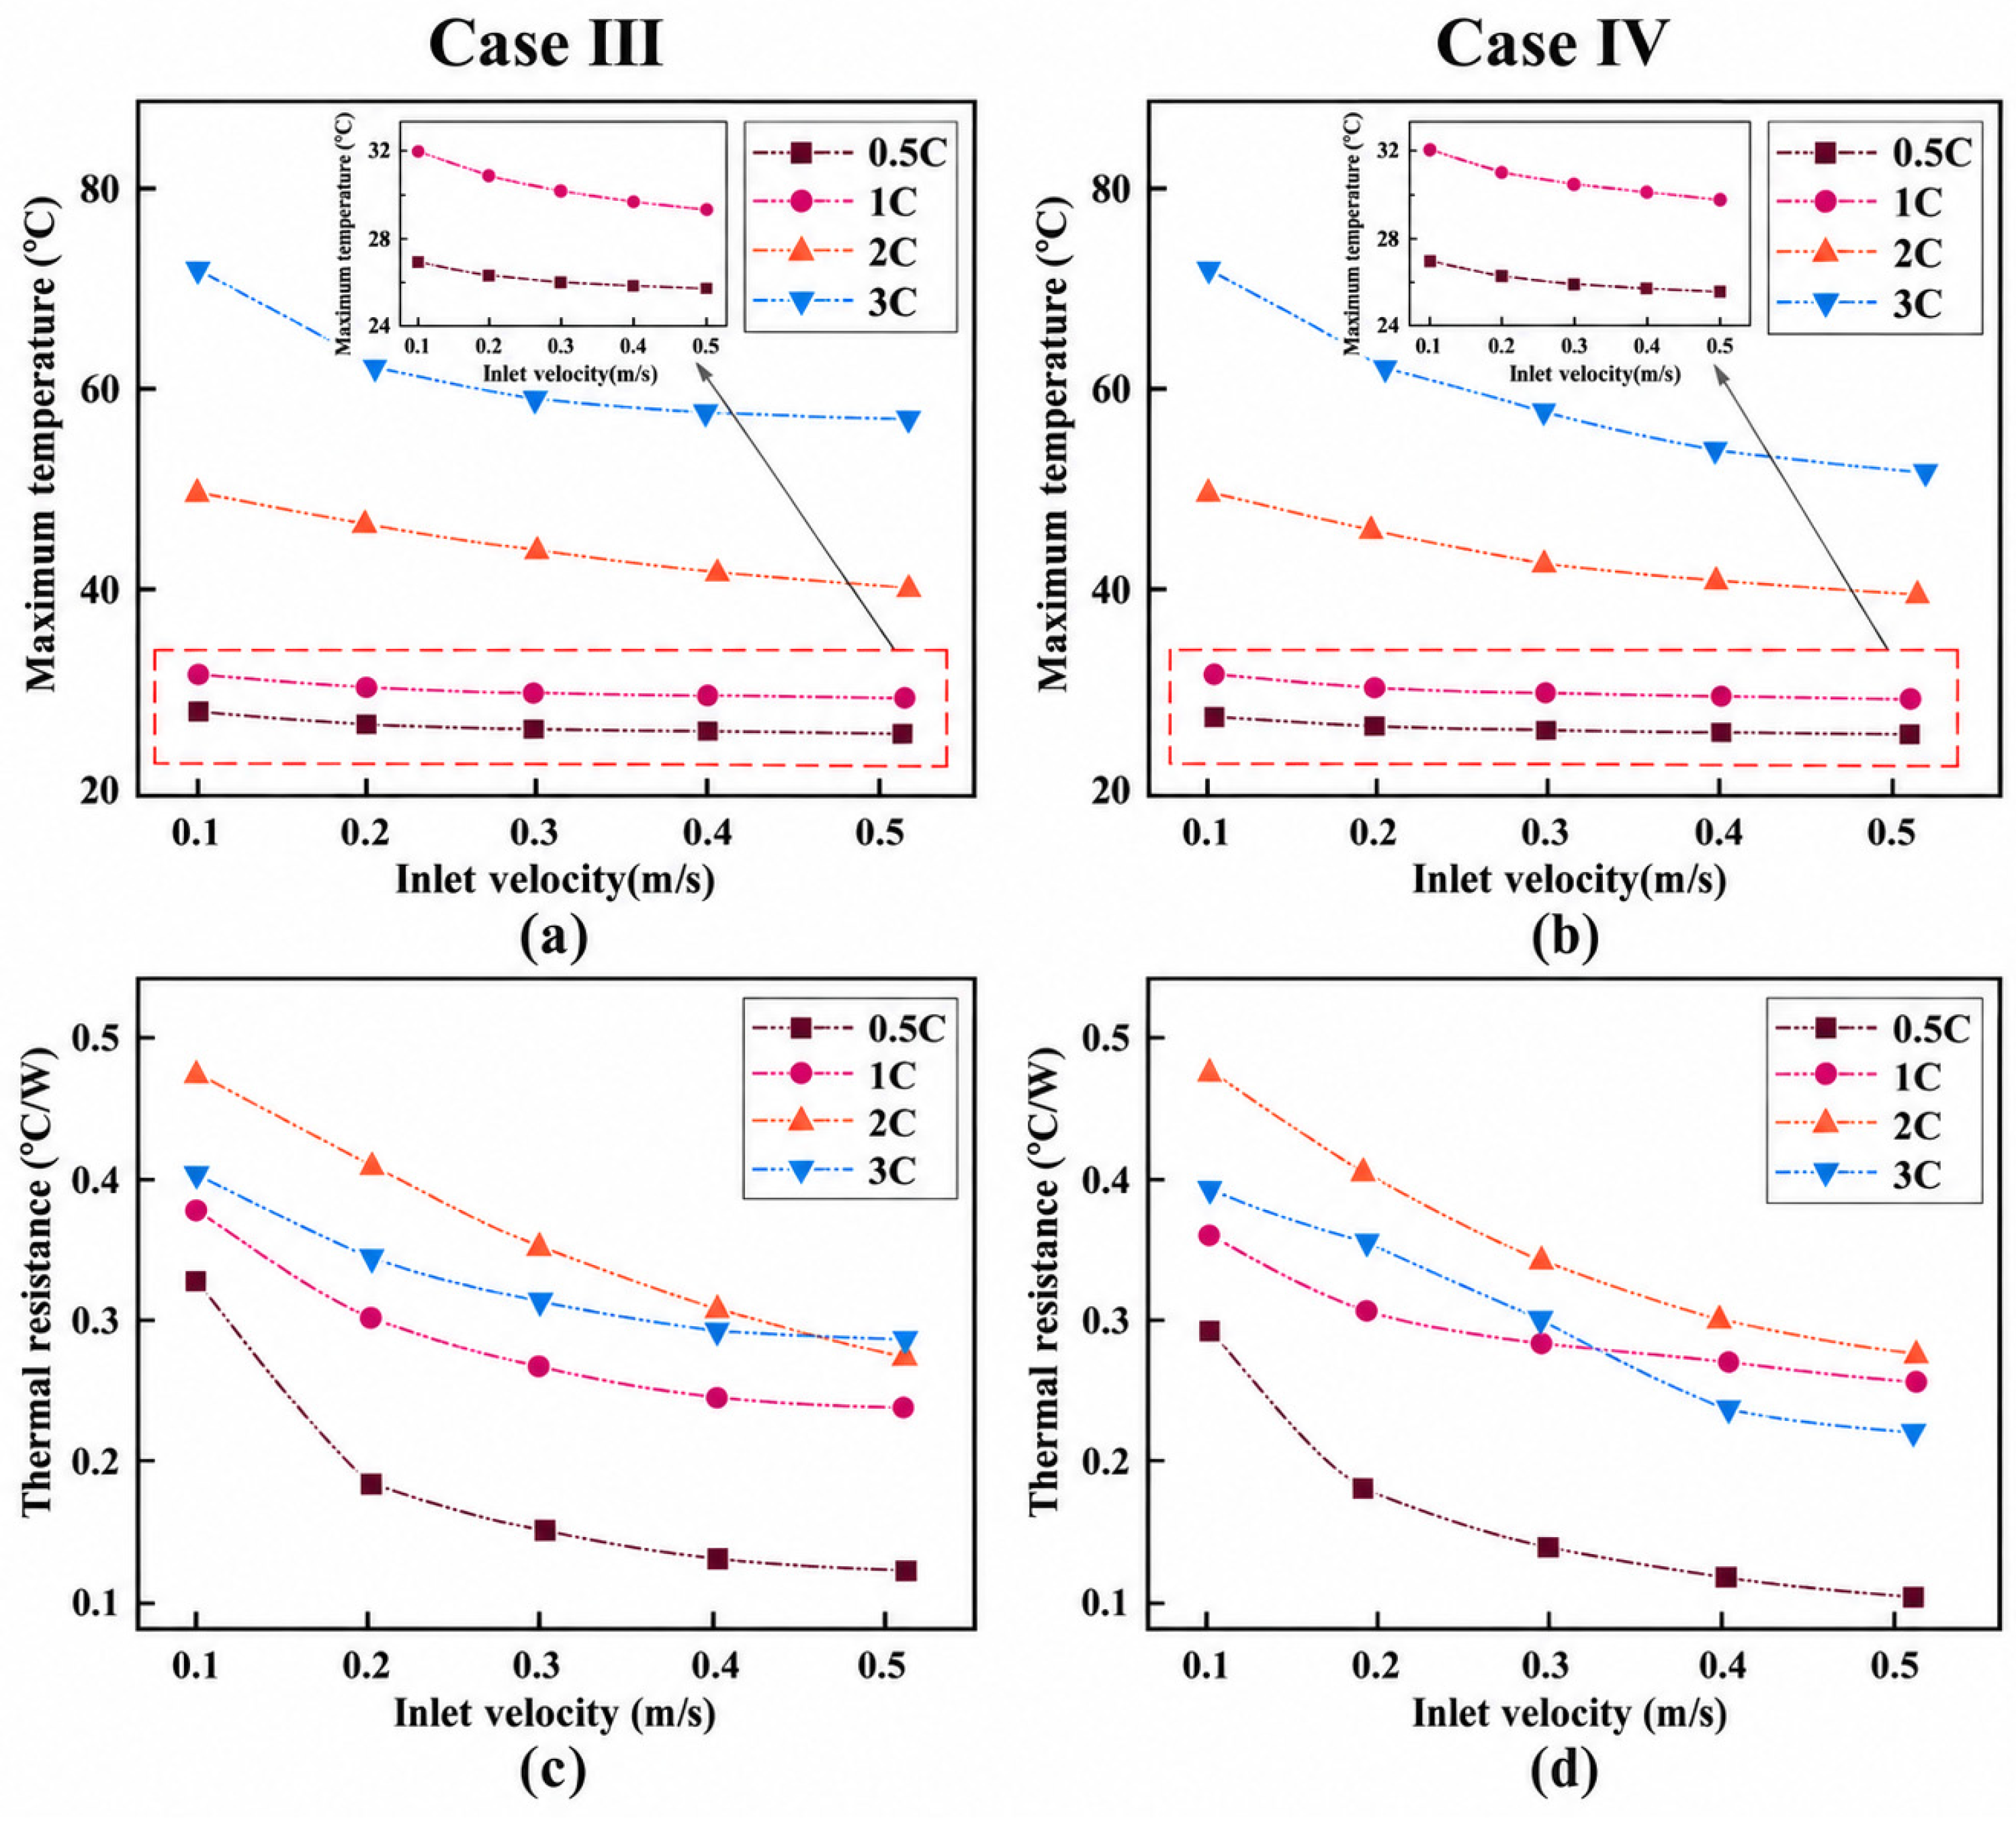
Figure 12 illustrates the evolution of Tmax and Rth for the two topology-optimized channels under various discharge rates and inlet velocities. Owing to the wide Y-axis range required to encompass high-rate (3C) temperature rises, the temperature variations at 0.5C and 1C appear visually modest. To clearly illustrate these variations, an inset zoom-in view with an enlarged temperature scale is provided in Figure 12a,b. As observed in Figure 12a,b, elevated discharge rates trigger a substantial rise in Tmax, while the cooling effect of raising the inlet flow speed grows more evident. At low discharge rates, increasing inlet velocity yields marginal reductions in Tmax due to low heat generation. At high discharge rates, however, where Joule heating surges, coolant velocity strongly suppresses peak temperatures, exhibiting a sharp non-linear drop within 0.1~0.3 m/s. Under extreme 3C discharge conditions at low velocities, Case IV maintains a markedly lower Tmax than Case III. Increasing velocity to 0.5 m/s further lowers Case IV’s Tmax to 51.5 °C, demonstrating superior thermal mitigation capabilities under extreme limits.
Figure 12.
Thermal response under various discharge rates (0.5C to 3C): (a,b) maximum battery temperature (Tmax), (c,d) apparent transient thermal resistance (Rth).
Regarding the apparent transient thermal resistance (Figure 12c,d), Rth exhibits a non-linear evolution with respect to the discharge rate, following the overall sequence of Rth,2C > Rth,3C > Rth,1C > Rth,0.5C. This behavior is governed by the interplay between localized heat accumulation and transient thermal transport. As the discharge rate climbs from 0.5C to 2C, the sharp increase in Joule heating intensifies internal thermal non-uniformity; the resulting localized heat accumulation near peak temperature zones drives up the evaluated thermal resistance. However, when the discharge rate escalates to 3C, the discharge duration is shortened drastically (to only 1200 s). Consequently, the battery fails to attain thermal equilibrium before the end of discharge, leaving the actual peak temperature rise below its steady-state theoretical value and causing the apparent thermal resistance at 3C to drop below that at 2C.
4. Conclusions
In this study, an efficient dual-objective conjugate fluid-thermal topology optimization model was established for lithium-ion battery thermal management. Two microchannel configurations, Case III and Case IV, were designed and compared with conventional parallel channels (Case I) and serpentine channels (Case II). The effects of inlet velocity (0.1–0.5 m/s), incoming coolant temperature (24–27 °C), and discharge rate (0.5C–3C) on peak cell temperature (Tmax), maximum temperature span (ΔT), flow pressure drop (ΔP), and equivalent system thermal resistance (Rth) were systematically analyzed. The primary findings are summarized below:
- (1)
- The comprehensive performance of the topology-tailored fluidic channels is superior to that of conventional flow channels. The branched network structure of the topology-optimized channels improves flow distribution within the cold plate and significantly reduces the extent of low-velocity and stagnation regions. At a 1C discharge rate and an incoming flow speed of 0.2 m/s, Case IV achieves the minimum peak temperature (28.97 °C), minimal temperature difference (3.97 °C), and equivalent thermal resistance (0.305 °C/W) among all four configurations. Meanwhile, due to the smooth cross-sectional transitions in the topology-optimized channels, the pressure drop of Case IV is reduced by 79.3% compared with the conventional serpentine channel (Case II), achieving a synergistic optimization of heat dissipation efficiency and low pumping power loss.
- (2)
- Increasing the inlet velocity effectively reduces the convective thermal resistance and suppresses the battery temperature rise. For Case III at 24 °C, the apparent thermal resistance decreases from 0.39 °C/W at 0.1 m/s to 0.27 °C/W at 0.5 m/s, corresponding to a reduction of approximately 30.8%. Nevertheless, the marginal reduction in peak temperature becomes less pronounced above approximately 0.3 m/s. This trend is consistent with the strongly anisotropic thermal conductivity of the pouch cell, for which the in-plane conductivity is approximately 13.3 times higher than the through-thickness conductivity, suggesting that internal through-thickness heat conduction may increasingly constrain the benefit of further increasing coolant velocity.
- (3)
- Unique temperature control characteristics and apparent transient thermal resistance variations are exhibited under high discharge rates. Higher discharge rates result in a more pronounced regulation impact of rising flow speed on peak cell temperature. At a 3C discharge rate with an inlet flow speed of 0.5 m/s, Case IV effectively maintains the peak cell temperature at 51.5 °C. Furthermore, the apparent transient thermal resistance exhibits a non-linear sequence with discharge rate satisfying Rth,2C > Rth,3C > Rth,1C > Rth,0.5C, this is attributed to the local heat accumulation driven by increased Joule heating at lower discharge rates, whereas under the 3C high discharge rate, the discharge period is insufficient for the cell to attain thermal equilibrium before discharge terminates.
- (4)
- Unlike conventional CNC milling or stamping processes, channels with complex topologies are difficult to fabricate using subtractive manufacturing techniques. However, the use of specialized materials, such as AlSi10Mg alloy, enables 3D printing via laser powder bed fusion technology. During the optimization process, maintaining the channel overhang angle above 45° allows the elimination of internal support structures. Regarding surface roughness, the inner walls of 3D-printed channels exhibit higher roughness compared to those machined via CNC milling; while this results in a slight increase in pressure drop, the modest roughness can moderately enhance local heat transfer efficiency. For applications requiring strict pressure bounds, post-processing techniques such as abrasive flow machining (AFM) or chemical polishing can effectively smooth internal passages. From the perspective of commercial scalability, in Case IV, the pressure drop was reduced by 79.3%, significantly lowering long-term pumping energy consumption, this demonstrates the practical feasibility of the optimized cold plate in high-performance battery cooling applications.
Author Contributions
Conceptualization, X.Z.; software, X.Z. and J.M.; validation, J.L.; data curation, X.Z. and J.M.; writing—original draft preparation, X.Z. and J.M.; writing—review and editing, J.L. All authors have read and agreed to the published version of the manuscript.
Funding
This research received no external funding.
Data Availability Statement
The data presented in this study are available on request from the corresponding author. The data are not publicly available due to privacy concerns.
Conflicts of Interest
The authors declare no conflicts of interest.
Nomenclature
| Symbol order alphabetically | |
| A | Surface area, mm2 |
| a | Cold plate dimension, mm |
| b | Cold plate dimension, mm |
| L | Cold plate length, mm |
| H | Cold plate width, mm |
| Cp | Specific heat, J/(kg·K) |
| k | Thermal conductivity, W/(m·K) |
| μ | Dynamic viscosity, mPa·s |
| ρ | Density, kg/m3 |
| φ | Volume Percentage, % |
| F | Volumetric body force, N |
| f | Friction factor |
| m | Mass flow rates |
| γ | Design variable |
| α | Inverse permeability |
| U,Vin | Velocity vector, m/s |
| Ub | Battery terminal voltage |
| ∇ | Gradient operator |
| P | Pressure, Pa |
| Q | Heat generation, W |
| r | Filter radius |
| Rth | Equivalent thermal resistance, °C/W |
| T | Temperature |
| t | Discharge time, s |
| E | Energy, W/m2 |
| Vf | Volume of the fluid domain |
| Vb | Volume of the battery |
| β | Projection slope |
| θβ | Projection point |
| Ω | Domain |
| Σ | Adiabatic boundary |
| ω | Weight coefficient |
| Da | Darcy number |
| q | Penalty factor |
| Abbreviations (order alphabetically) | |
| BTMS | Battery thermal management systems |
| Case I | Straight flow channel |
| Case II | Snake-shaped flow channel |
| Case III | Topological Optimization Flow Channel III |
| Case IV | Topological Optimization Flow Channel IV |
| LIBs | Lithium-ion batteries |
| Subscripts | |
| avg | Average |
| f | Fluid |
| s | Solid |
| min | Minimum |
| max | Maximum |
| in | Inlet |
| out | Outlet |
References
- Al-Zareer, M.; Dincer, I.; Rosen, M. A review of novel thermal management systems for batteries. Int. J. Energy Res. 2018, 42, 3182–3205. [Google Scholar] [CrossRef] [Scilit]
- Madani, S.; Shabeer, Y.; Allard, F.; Fowler, M.; Ziebert, C.; Wang, Z.; Panchal, S.; Chaoui, H.; Mekhilef, S.; Dou, S.; et al. A Comprehensive Review on Lithium-Ion Battery Lifetime Prediction and Aging Mechanism Analysis. Batteries 2025, 11, 127. [Google Scholar] [CrossRef] [Scilit]
- Zhai, M.; Wu, Y.; Tian, S.; Yuan, H.; Li, B.; Luo, X.; Huang, G.; Fu, Y.; Zhu, M.; Gu, Y.; et al. A circular economy approach for the global lithium-ion battery supply chain. Nature 2025, 646, 1114–1121. [Google Scholar] [CrossRef] [Scilit]
- Shao, X.; Zhang, D.; Zhou, L.; Ding, Z.; Xiong, H.; Zhang, H.; Jia, P.; Zhai, J.; Jiao, G. Recent advances in semiconductor gas sensors for thermal runaway early-warning monitoring of lithium-ion batteries. Coord. Chem. Rev. 2025, 535, 216624. [Google Scholar] [CrossRef] [Scilit]
- Fu, Z.; Zuo, W.; Li, Q.; Zhou, K.; Huang, Y.; Li, Y. Performance enhancement studies on the liquid cooling plate fully filled with porous medium for thermal management of lithium-ion battery pack. J. Energy Storage 2025, 116, 116072. [Google Scholar] [CrossRef] [Scilit]
- Nasiri, M.; Hadim, H. Thermal management of Li-ion batteries using phase change materials: Recent advances and future challenges. J. Energy Storage 2025, 111, 115440. [Google Scholar] [CrossRef] [Scilit]
- Wang, N.; Li, C.; Li, W.; Chen, X.; Li, Y.; Qi, D. Heat dissipation optimization for a serpentine liquid cooling battery thermal management system: An application of surrogate assisted approach. J. Energy Storage 2021, 40, 102771. [Google Scholar] [CrossRef] [Scilit]
- Yang, H.; Liu, N.; Gu, M.; Gao, Q.; Yang, G. Optimized design of novel serpentine channel liquid cooling plate structure for lithium-ion battery based on discrete continuous variables. Appl. Therm. Eng. 2025, 264, 125502. [Google Scholar] [CrossRef] [Scilit]
- Zhu, K.; Liu, G.; Liang, Y. Orthogonal Optimization and Numerical Simulation Study of Battery Module Thermal Management System Based on S-Shaped Side-Cooling Structure. J. Therm. Sci. Eng. Appl. 2026, 18, 041009. [Google Scholar] [CrossRef] [Scilit]
- Chen, C.; Qian, Y.; Xu, G.; Zhang, Q.; Lu, P. Numerical investigation on thermal management performance of soft packing Li-ion batteries with oblique multi-channel cold plates. Renew. Energy 2024, 234, 121250. [Google Scholar] [CrossRef] [Scilit]
- Liu, Z.; Zhao, H.; Qiu, Y.; Zeng, H.; Dong, X. Numerical analysis of topology-optimized cold plates for thermal management of battery packs. Appl. Therm. Eng. 2024, 238, 121983. [Google Scholar] [CrossRef] [Scilit]
- Xie, J.; Ge, Z.; Zang, M.; Wang, S. Structural optimization of lithium-ion battery pack with forced air cooling system. Appl. Therm. Eng. 2017, 126, 583–593. [Google Scholar] [CrossRef] [Scilit]
- Wang, Z.; Geng, X.; Zhou, Y.; Mao, N.; Sun, Y.; Huang, X.; Huang, A.; Hao, M.; Zhong, W. Experimental study of a turbulent topology-optimized cold plate for battery thermal management system. J. Energy Storage 2025, 130, 117426. [Google Scholar] [CrossRef] [Scilit]
- Xiang, X.; Yang, R.; Tehrani, N.; Sun, H. Advanced topology design of cold plate for battery operating under dynamic conditions. Int. J. Heat Mass Transf. 2026, 256, 128054. [Google Scholar] [CrossRef] [Scilit]
- Han, X.; Liu, H.; Xie, G.; Sang, L.; Zhou, J. Topology optimization for spider web heat sinks for electronic cooling. Appl. Therm. Eng. 2021, 195, 117154. [Google Scholar] [CrossRef] [Scilit]
- Wang, N.; Tian, B.; Guo, Y.; Li, J.; Shao, S. Investigation on liquid-cooled heat sink integrating topology optimization and microchannel design for high heat flux chip cooling. Appl. Therm. Eng. 2025, 281, 128740. [Google Scholar] [CrossRef] [Scilit]
- Xiong, Y.; Gao, L.; Sha, W.; Gao, J. Multi-objective designs of microchannel heat sink for multilayer composite chip heat transfer systems using topology optimization. Appl. Therm. Eng. 2025, 279, 127876. [Google Scholar] [CrossRef] [Scilit]
- Li, Q.; Song, R.; Wei, Y. A review of state-of-health estimation for lithium-ion battery packs. J. Energy Storage 2025, 118, 116078. [Google Scholar] [CrossRef] [Scilit]
- Zhou, J.; Lu, M.; Zhao, Q.; Hu, D.; Qin, H.; Chen, X. Thermal design of microchannel heat sinks using a contour extraction based on topology optimization (CEBTO) method. Int. J. Heat Mass Transf. 2022, 189, 122703. [Google Scholar] [CrossRef] [Scilit]
- Martínez-Maradiaga, D.; Damonte, A.; Manzo, A.; Haertel, J.; Engelbrecht, K. Design and testing of topology optimized heat sinks for a tablet. Int. J. Heat Mass Transf. 2019, 142, 118429. [Google Scholar] [CrossRef] [Scilit]
- Amalesh, T.; Narasimhan, N. Introducing new designs of minichannel cold plates for the cooling of Lithium-ion batteries. J. Power Sources 2020, 479, 228775. [Google Scholar] [CrossRef] [Scilit]
- Matsumori, T.; Kondoh, T.; Kawamoto, A.; Nomura, T. Topology optimization for fluid-thermal interaction problems under constant input power. Struct. Multidiscip. Optim. 2013, 47, 571–581. [Google Scholar] [CrossRef] [Scilit]
- Lin, X.; Shi, M.; Zhou, Z.; Chen, B.; Lu, Y.; Jing, D. Multi-objective topology optimization design of liquid-based cooling plate for 280 Ah prismatic energy storage battery thermal management. Energy Convers. Manag. 2025, 325, 119440. [Google Scholar] [CrossRef] [Scilit]
- Guo, C.; Liu, H.; Shao, X.; Zhu, M. Investigations on a novel cold plate achieved by topology optimization for lithium-ion batteries. Energy 2022, 261, 125097. [Google Scholar] [CrossRef] [Scilit]
- Zuliani, J.; Cohen, M.; Guimaraes, F.; Severiano, C.J. A multi-objective approach for multi-material topology and shape optimization. Eng. Optim. 2019, 51, 915–940. [Google Scholar] [CrossRef] [Scilit]
- Qian, S.; Wang, W.; Ge, C.; Lou, S.; Miao, E.; Tang, B. Topology optimization of fluid flow channel in cold plate for active phased array antenna. Struct. Multidiscip. Optim. 2018, 57, 2223–2232. [Google Scholar] [CrossRef] [Scilit]
- Wang, J.; Liu, X.; Wang, Y. Topology optimization of micro-channel reactors using an improved multi-objective algorithm. Chem. Eng. J. 2023, 458, 141420. [Google Scholar] [CrossRef] [Scilit]
- Wang, J.; Liu, X.; Desideri, U. Performance improvement evaluation of latent heat energy storage units using improved bi-objective topology optimization method. Appl. Energy 2024, 364, 123131. [Google Scholar] [CrossRef] [Scilit]
- Tian, Y.; Zhu, Z.; Zhao, X.; Chen, X.; Huang, W.; Zhang, X. A Dynamic and Heterogeneous Representation for Topology Optimization Using Evolutionary Algorithms. IEEE Comput. Intell. Mag. 2025, 20, 71–82. [Google Scholar] [CrossRef] [Scilit]
- Gozdur, R.; Guzowski, B.; Dimitrova, Z.; Noury, A.; Mitukiewicz, G.; Batory, D. An energy balance evaluation in lithium-ion battery module under high temperature operation. Energy Convers. Manag. 2021, 227, 113565. [Google Scholar] [CrossRef] [Scilit]
- Smith, K.; Wang, C. Power and thermal characterization of a lithium-ion battery pack for hybrid-electric vehicles. J. Power Sources 2006, 160, 662–673. [Google Scholar] [CrossRef] [Scilit]
- Wang, T.; Tseng, K.; Zhao, J.; Wei, Z. Thermal investigation of lithium-ion battery module with different cell arrangement structures and forced air-cooling strategies. Appl. Energy 2014, 134, 229–238. [Google Scholar] [CrossRef] [Scilit]

Disclaimer/Publisher’s Note: The statements, opinions and data contained in all publications are solely those of the individual author(s) and contributor(s) and not of MDPI and/or the editor(s). MDPI and/or the editor(s) disclaim responsibility for any injury to people or property resulting from any ideas, methods, instructions or products referred to in the content. |
© 2026 by the authors. Licensee MDPI, Basel, Switzerland. This article is an open access article distributed under the terms and conditions of the Creative Commons Attribution (CC BY) license.