


Abstract
Lithium-ion batteries are increasingly used in stationary energy storage and electric mobility, making reliable degradation assessment essential for improving lifetime, safety, and performance. Since aging is governed by coupled electrochemical processes influenced by temperature, state of charge (SOC), and cycling conditions, this work investigates the diagnostic information that can be extracted directly from experimental data without relying on predefined battery model fitting. A structured testing campaign was conducted on a commercial lithium nickel cobalt aluminum oxide cell at different temperature, SOC, and aging conditions. Charge/discharge voltage curve analysis, incremental capacity analysis (ICA), differential voltage analysis (DVA), electrochemical impedance spectroscopy (EIS) analysis, distribution of relaxation times (DRT) analysis, and voltage relaxation analysis were comparatively evaluated. The results show that charge/discharge voltage curve analysis provides global indicators of degradation, while ICA and DVA highlight aging-related changes in characteristic voltage features. EIS, DRT, and voltage relaxation analyses provide complementary information on resistive, interfacial, transport, and relaxation processes. Overall, the different techniques exhibit consistent aging trends and, when considered jointly, support the qualitative interpretation of degradation modes and aging mechanisms. The combined diagnostic approach provides complementary insights into battery aging directly from experimentally observable features while avoiding the uncertainties associated with predefined battery model fitting.
1. Introduction
The energy transition requires reliable energy storage systems to support the large-scale integration of renewable energy sources and the electrification of transport. In Europe, initiatives such as the European Green Deal highlight the strategic importance of sustainable technologies, among which lithium-ion batteries (LiBs) play a key role due to their good energy and power density [1]. They enable the integration of intermittent renewable energy sources by stabilizing the grid and improving power quality, while also supporting the electrification of the transport sector through the widespread adoption of electric mobility, thereby reducing greenhouse gas emissions. Within this context, despite their performance improvements and market growth, the demand for lower costs, higher energy density, and longer lifetimes continues to increase [2,3]. Therefore, understanding battery degradation is essential to optimize performance and reliability.
Battery aging can be classified into calendar aging, occurring during storage and mainly influenced by temperature and state of charge (SOC), and cycle aging, driven by operational conditions such as temperature, SOC range, voltage limits, and current rate (C-rate). The combined influence of these stress factors makes degradation strongly dependent on operating conditions and battery chemistry, leading to different aging pathways within the battery [4]. At the material level, LiB degradation results from multiple interdependent aging mechanisms, such as solid electrolyte interphase (SEI) growth, lithium plating, particle cracking, metal dissolution, and structural disordering. Although these mechanisms occur in different regions of the battery, their effects can be grouped into four main degradation modes: loss of lithium inventory (LLI), loss of active material (LAM), loss of electrolyte (LE), and conductivity loss (CL) [4]. LLI refers to the irreversible consumption of lithium ions, which are no longer available for intercalation and de-intercalation. LAM describes the fraction of electrode material that becomes electrochemically inactive due to structural damage or mechanical degradation. LE and CL generally occur alongside LLI and LAM. Specifically, LE is mainly associated with electrolyte consumption processes, whereas CL is related to the loss of electrical contact between the active material and current collectors [5,6]. These degradation modes ultimately result in energy fade, defined as a reduction in the amount of energy that can be stored and reflected by a decrease in battery capacity, and power fade, which refers to a loss of power delivery capability and is reflected by an increase in internal resistance. Capacity fade is primarily associated with LLI, but may also arise from LAM and LE, whereas internal resistance increase is mainly driven by CL and LAM, with additional contributions from LE. For this reason, capacity fade and internal resistance increase are the primary indicators of battery state of health (SOH) [4]. At the anode, the dominant aging mechanisms include continuous growth and instability of the SEI, lithium plating at low temperatures or high C-rates, and mechanical degradation caused by repeated volume changes [1,2,7,8,9,10]. At the cathode, degradation involves cathode electrolyte interphase (CEI) formation, metal dissolution, and structural cracking [2]. Inactive components, such as current collectors and binders, may also degrade, contributing primarily to CL [8,11].
In the literature, degradation assessment is often addressed through battery model-based approaches, which are particularly suitable for implementation in battery management systems (BMSs). In this framework, the electrical response of the battery is described through equivalent circuit models, physics-based models, and empirical formulations, and aging is inferred indirectly from the evolution of identified parameters, typically related to capacity fade or impedance growth [12,13]. In [14], a fractional-order equivalent circuit model was fitted to electrochemical impedance spectroscopy (EIS) measurements acquired during the aging of commercial lithium nickel cobalt aluminum oxide (NCA) 18650 cylindrical cells. The evolution of the fitted parameters was used to associate changes in ohmic, SEI-related, charge-transfer, and diffusion-related contributions with CL, LLI, and LAM. Similarly, in [15], an equivalent circuit model-based SOH diagnostic model was developed by tracking impedance and open-circuit voltage (OCV) parameters during aging, with EIS measurements supporting the interpretation of the identified impedance parameters. In [16], a first-order Thevenin equivalent circuit model was combined with an incremental capacity analysis (ICA)-based capacity model, and the evolution of the identified electrical and ICA features during aging was used to estimate the maximum battery capacity and SOH. On the other hand, the authors in [17] proposed a physics-based single-particle degradation model that incorporates SEI formation and crack propagation to estimate SOH, relating the evolution of degradation-related parameters to capacity fade and power loss. In [18], a hybrid diagnostic framework combining equivalent circuit and physics-based models was developed to infer aging mechanisms from EIS measurements. By linking impedance features to physically meaningful parameters, the approach provides insight into degradation phenomena such as LAM, LLI, and CL without requiring destructive post-mortem analysis.
Overall, these studies assess battery aging by monitoring the evolution of battery model parameters as a function of SOH, cycle number, temperature, or operating conditions. Depending on the adopted battery model, these parameters may represent electrical contributions, such as ohmic, interfacial, charge transfer, or diffusion-related processes, or physical degradation phenomena, such as SEI growth and lithium plating. Their evolution can therefore provide insight into the dominant aging mechanisms. On the other hand, the accuracy and type of information that can be extracted from the analysis inherently depend on the chosen battery model, its structure, order, and underlying assumptions. This may limit the ability to capture complex and coupled degradation phenomena. In contrast, the present work compares different diagnostic methods without explicitly fitting predefined battery models such as equivalent circuit models and physical models (for simplicity referred to as a model-free approach), investigating whether similar information on degradation trends and underlying mechanisms can be extracted directly from experimental features. By avoiding model fitting, the proposed approach reduces the influence of model assumptions, mitigates uncertainties associated with parameter identification, and avoids the computational burden of solving complex optimization problems. The authors in [19] systematically evaluated 31 health indicators (such as constant current charge time, constant voltage charge time, coulomb efficiency…) derived from conventional charge/discharge measurements on commercial second-life nickel manganese cobalt oxide (NMC) pouch cells, assessing their repeatability and sensitivity to aging. Their results showed that different indicators exhibit different levels of sensitivity to the aging state, and only 13 have a good sensitivity to aging, highlighting the potential benefits of considering multiple health indicators rather than relying on a single one. The authors in [20] recently proposed a correlation-based statistical workflow for battery lifetime datasets to identify and rank degradation-relevant health indicators. Their analysis on NMC prismatic cells jointly considered operational descriptors, such as temperature, mean SOC, and depth of discharges, and aging metrics derived from reference performance tests, including capacity, internal resistance, and differential voltage analysis (DVA)-based features. The correlation analysis was used to identify strongly coupled indicators, quantify redundancy, and support feature reduction. However, the study focused on NMC/graphite prismatic cells and considered a comparatively limited set of diagnostic descriptors. The authors of [21] investigated lithium plating on lithium iron phosphate (LFP) and NMC cells through EIS measurements performed during post-charge relaxation and showed that the charge-transfer relaxation time constant obtained through distribution of relaxation times (DRT) analysis can provide a sensitive indicator of lithium plating. The proposed interpretation was supported by electrochemical modelling and post-mortem characterization, demonstrating the potential of physically interpretable impedance descriptors for detecting specific degradation modes. In [22], health indicators derived from EIS, incremental capacity (IC), and differential voltage (DV) measurements are compared to identify and quantify the effects of different degradation modes on NCA–carbon cells, demonstrating that the two techniques can provide correlated and complementary information. However, their analysis was limited to these two diagnostic methods, without considering health indicators obtained from a broader set of electrochemical characterization techniques.
Existing comparative studies have also investigated different battery diagnostic methods from a methodological perspective. The authors in [23] conducted a critical and systematic review of non-invasive diagnostic methods for degradation-mode identification and quantification, evaluating their strengths and limitations for automotive applications. More recently, in [6] an updated review of battery aging mechanisms and non-invasive diagnostic approaches is provided, with particular emphasis on differential-curve-based methods such as IC and DV analysis. Nevertheless, these studies are primarily literature-based assessments of diagnostic methodologies and do not provide a systematic experimental comparison of heterogeneous health indicators obtained from the same cell under controlled aging and characterization conditions. Finally, in [24], the authors reviewed advanced EIS analysis techniques, with particular emphasis on DRT analysis. They concluded that these methods have significant potential to improve battery characterization, elucidate aging mechanisms, and support the development of next-generation battery technologies.
In light of the above, numerous health indicators have been proposed and analyzed in the literature using different battery characterization techniques. However, as reported in [19], only a subset of these indicators is suitable for aging assessment. Furthermore, some health indicators can be extracted from different diagnostic methods. For example, the internal resistance can be estimated from both partial charge/discharge tests and EIS measurements. This may lead to ambiguous interpretations because the internal resistance is not a unique quantity but rather a combination of several electrochemical contributions whose relative importance depends on the estimation method. Consequently, measurements obtained from different diagnostic methods may reflect different underlying degradation phenomena despite being reported under the same indicator name.
In this work, based on the literature review, the main diagnostic methods are categorized into charge/discharge voltage curve analysis, ICA/DVA, EIS analysis, DRT analysis, and voltage relaxation analysis. Although these techniques have been extensively investigated, experimental studies typically focus on individual techniques or compare only a subset of them on specific cells, whereas broader comparisons encompassing most or all of these techniques are generally provided in review studies based on results from different experimental investigations.
Consequently, comprehensive experimental comparisons of all these techniques performed on the same battery under identical operating conditions remain scarce. Motivated by these considerations, this work presents a comparative assessment of these diagnostic methods under different characterization temperature, SOC, and aging conditions. The objective is to evaluate their ability to extract meaningful health indicators and provide qualitative insights into the underlying aging mechanisms without relying on predefined battery models. The comparison focuses on the aging evolution, sensitivity, and complementarity of experimentally observable features derived from the different electrochemical characterization techniques.
2. Diagnostic Methods
This section describes the diagnostic methods adopted in this work to investigate the aging behavior of LiB cells. For each technique, the underlying measurement principle and the corresponding data-processing procedure are presented. The focus is on non-destructive, in-situ methods that characterize the battery response through measurable quantities, such as voltage and current, making them suitable for practical implementation and potential integration into BMSs. These techniques provide complementary insights into the internal state and degradation of the battery.
Specifically, charge/discharge voltage curve analysis describes the overall evolution of battery performance; ICA and DVA highlight characteristic features of the voltage curves; EIS investigates the frequency-domain response; DRT separates impedance contributions according to their characteristic time constants; and voltage relaxation analysis evaluates the battery response following current perturbations. The methodological details of each analysis are reported in the following subsections.
2.1. Charge/Discharge Voltage Curve Analysis
From the charge/discharge voltage curve analysis, the battery capacity evaluation is one of the most important health indicators for assessing the overall aging state of an LiB cell, as capacity fade reflects the reduction in the amount of charge that can be reversibly stored and delivered. Capacity can be estimated by Coulomb counting, which consists of integrating the battery current during a fully controlled charge or discharge process [25]. Accordingly, the absolute SOC, q(t), can be defined as
where I(t) is the measured battery current, defined as positive during charging and negative during discharging, and q(t0) is the initial absolute SOC. By considering a complete charge or discharge, the actual battery capacity, Ca, can be estimated, and the SOC can be evaluated as follows:
Specifically, low-rate charge and discharge tests can be used to derive the OCV response of the battery. In fact, OCV can be measured at the battery terminals only when the battery is at electrochemical equilibrium, allowing the battery voltage, VB, to be approximated as the OCV. The latter is represented as a function of the absolute SOC, q(t), for the charge curve, and the absolute state of discharge (SOD), qd, for the discharge curve. The latter can be defined as
These curves provide information on the evolution of the battery response with operating conditions and aging. In particular, changes in available capacity, voltage shifts, and variations in curve shape can be used as global indicators of degradation, although they do not directly reveal the underlying aging mechanisms.
2.2. Incremental Capacity and Differential Voltage Analyses
ICA is a curve-based diagnostic method derived from low-C-rate charge or discharge tests. It enhances the information contained in the battery voltage profile by evaluating the variation in incremental capacity (IC) with respect to voltage. The IC curve is defined as
where Δq is the charge variation associated with a battery voltage interval ΔVB.
Low-current measurements are generally preferred because increasing the current rate reduces the resolution of IC curves, as stronger polarization effects and measurement noise can introduce distortions [26]. However, degradation-related features can still be identified at moderately higher rates, up to C/6, when appropriate diagnostic procedures are applied [27]. This enables the potential application of ICA under realistic charging conditions, such as overnight or workplace charging, for SOH assessment in LiBs. Moreover, reliable ICA requires adequate preprocessing of voltage data, including filtering, resampling, and smoothing, to reduce noise while preserving the position and intensity of characteristic peaks. Since the measured battery voltage results from the combined response of both electrodes, each IC feature represents the superposition of positive and negative electrode contributions. Therefore, the evolution of peak position, intensity, and shape during aging can provide valuable insights into changes in the internal electrochemical behavior of the battery [28].
DVA is closely related to ICA and is based on the differential voltage curve, defined as
Because of this inverse relationship, peaks in the IC curve generally correspond to valleys in the DV curve, and vice versa. DVA provides information similar to ICA but is often particularly useful for highlighting capacity-related shifts in the voltage relationship. For this reason, ICA and DVA are commonly used as complementary diagnostic tools.
The interpretation of IC and DV features can support the qualitative identification of degradation modes. In general, in IC curves, LLI is associated with horizontal shifts in characteristic features and a reduction in peak height, while in DV curves it appears as a shift toward lower capacities. LAM is typically reflected by a decrease in peak intensity at nearly constant voltage in IC curves and a reduction in valley depth at approximately constant capacity in DV curves. CL may instead appear as peak shifts toward lower voltages, with no significant effect on DV features [29]. However, the attribution of individual features to specific degradation modes is not always unique, as multiple aging mechanisms can occur simultaneously and produce overlapping effects. Therefore, ICA and DVA are particularly effective for monitoring the overall evolution of battery behavior during aging, especially when comparing curves acquired at different stages of battery life.
2.3. Electrochemical Impedance Spectroscopy Analysis
EIS analysis is a frequency-domain diagnostic method widely used to characterize the electrochemical response of LiB cells. The method consists of applying a small sinusoidal current (voltage) perturbation to the battery and measuring the corresponding voltage (current) response. The resulting impedance is defined in the frequency domain as the ratio between voltage and current. The impedance response can be represented through Nyquist plots, where the real and imaginary components of impedance are plotted against each other. These plots are widely used in LiB studies because they allow the main impedance features, such as semicircles and low-frequency branches, to be directly associated with resistive, capacitive, and diffusive processes.
In LiB cells, impedance results from the superposition of several electrochemical and physical phenomena, including electronic and ionic transport, interfacial effects, charge-transfer reactions, and diffusion. Since these phenomena occur over different characteristic time scales, they affect distinct frequency regions of the impedance spectrum and can be identified through the main features of the Nyquist plot. Although EIS data are often interpreted using equivalent circuit models, relevant diagnostic information can also be obtained through the qualitative, quantitative, and comparative analysis of impedance spectra. The high-frequency intercept with the real axis represents the battery ohmic resistance, including contributions from the electrolyte, electrodes, and electrical contacts. The two semicircular regions at intermediate frequencies are generally associated with the SEI layer (medium-high frequencies) and with interfacial and charge-transfer processes (medium-low frequencies). Finally, the low-frequency branch is generally associated with lithium-ion diffusion processes [30].
A correlation between impedance variations and aging mechanisms can be established. In the high-frequency region, impedance growth is generally associated with increased resistive contributions, such as current collector corrosion or contact degradation, and can be mainly related to LLI and CL. In the mid-frequency region, particularly for NCA-based cells, impedance variations are commonly linked to interfacial phenomena, including SEI growth or decomposition, lithium plating, and electrolyte degradation, which are primarily associated with LLI. When two semicircles can be distinguished, the first is typically attributed to SEI-related processes, while the second reflects slower interfacial kinetics, including cathode charge-transfer limitations, SEI decomposition, and CEI formation, with possible contributions from LAM. Finally, variations in the low-frequency region are generally associated with diffusion limitations and structural degradation, such as particle cracking, and are therefore mainly related to LAM [31].
2.4. Distribution of Relaxation Times Analysis
DRT analysis is used to deconvolute EIS spectra and represent the impedance response of an LiB cell in the time domain. While different electrochemical processes may overlap in a Nyquist plot, DRT enables the overall impedance response to be separated into a distribution of relaxation processes, each associated with a characteristic time constant, τ, and a polarization contribution, g(τ), thereby avoiding the need to assume a specific battery model [32,33]. In a DRT plot, the distribution function is represented as a function of relaxation time, τ. Each peak can be associated with a specific process occurring within the battery: the peak position identifies the characteristic time constant, while its magnitude reflects the corresponding polarization contribution. In general, fast processes (τ < 10−3 s) are related to high-frequency phenomena, intermediate time constants (10−3 s < τ < 101 s) are associated with interfacial and charge-transfer processes, and long time constants (τ > 101 s) are mainly linked to diffusion-related phenomena [34].
The DRT is mathematically expressed as a Fredholm integral of the first kind [35]:
where Z(ω) is the measured complex impedance at a given angular frequency ω. The extraction of g(τ) from experimental impedance data requires the inversion of this integral equation. During this process, small uncertainties in the measured impedance can lead to significant oscillations or non-physical features in the reconstructed distribution. Therefore, regularization techniques are commonly introduced in DRT analysis to stabilize the solution. Regularization provides a trade-off between the agreement with experimental impedance data and the smoothness of the reconstructed distribution. The regularization level plays a critical role: insufficient regularization may amplify noise and generate spurious peaks, whereas excessive regularization may over-smooth the distribution and reduce the ability to distinguish closely spaced relaxation processes. Consequently, the selected regularization strategy and parameters strongly influence the resolution and reliability of the extracted DRT.
Once obtained, the DRT can be used to monitor the evolution of peak position and amplitude under different operating conditions and during aging, providing additional insight into the processes responsible for degradation. The peak position indicates the characteristic time constant, while the peak height reflects the corresponding polarization contribution, enabling the identification of aging effects associated with specific electrodes or electrochemical processes.
2.5. Voltage Relaxation Analysis
Voltage relaxation analysis evaluates the battery response after a current perturbation. The initial voltage jump after current interruption is mainly associated with ohmic resistance, while the subsequent relaxation reflects slower electrochemical, kinetic, and diffusion processes. By analyzing the relaxation behavior, it is possible to extract health indicators related to internal resistance and voltage stabilization dynamics.
3. Test Procedure and Experimental Setup
The tested battery was a Samsung INR18650-35E cylindrical cell manufactured by Samsung SDI Co., Ltd (Cheonan-si, South Korea). The cell is based on NCA chemistry and has a nominal capacity of 3.5 Ah. The main battery parameters are reported in Table 1. The experimental campaign was carried out at the Battery Laboratory of Ricerca sul Sistema Energetico S.p.A. (RSE).
Table 1.
Battery characteristics [36].
3.1. Experimental Setup
Two main workstations were used to perform the tests. The first setup consisted of a bidirectional regenerative cycler (Chroma 17011, Chroma ATE Inc., Taoyuan City, Taiwan), shown in Figure 1a, and a climatic chamber (FDM T140BGX, F.lli Della Marca S.r.l., Pomezia, Italy). The second setup included a potentiostat (Gamry Reference 3000) combined with a booster (Gamry Reference 30k), both from Gamry Instruments (Warminster, PA, USA) as illustrated in Figure 1b, and a climatic chamber (Weiss Technik LABEVENT T/40/40/5, Weiss Technik GmbH, Reiskirchen, Germany). The specifications of those instruments are listed in Table 2. In addition, the battery temperature was monitored during each test using thermocouples.
Figure 1.
Experimental setup: (a) Chroma 17011; (b) Gamry system.
Table 2.
Chroma and Gamry system characteristics.
3.2. Test Procedure
The campaign consisted of three check-up (CU) phases, CU0, CU1, and CU2, interspersed with two aging phases.
3.2.1. Check-Up Phase
First, charge and discharge curve tests were conducted. During these tests, the battery underwent constant current–constant voltage (CC–CV) discharge and charge cycles using the Chroma cycler at low current rates of –C/6 and C/6, respectively, between 4.2 V and 2.65 V. During the CV phase, the current cut-off was set to −0.075 A for discharge and 0.075 A for charge. After a full CC–CV charge, the following sequence was applied using the Gamry instrument:
- Rest phase—The battery was left at rest for 1 h to allow it to approach electrochemical equilibrium and to monitor slower relaxation processes.
- EIS measurement—EIS was performed by applying a 0.1 A (0.03C) sinusoidal current perturbation over a logarithmically spaced frequency range from 50 kHz down to 10 mHz, with 10 points per decade. This provided the impedance spectrum of the battery at the selected SOC.
- Partial SOC step discharge—The battery was discharged at a C/2 rate by 10% of its actual capacity, corresponding to a controlled SOC decrease. The actual capacity was estimated from the C/6 characterization tests described previously, ensuring accurate SOC tracking.
The sequence (steps 1–3) was repeated progressively down to SOC = 0%, after which steps 1–2 were conducted. This procedure enabled the acquisition of relaxation and impedance data at different SOC levels. The entire procedure was repeated at each investigated temperature: 10 °C, 25 °C, and 40 °C.
3.2.2. Aging Phase
Between CU phases, the battery underwent approximately 100 charge–discharge cycles at 25 °C performed at 3 A (0.86C) using the Chroma cycler. The operating SOC window was defined between 80% and 20%, with upper and lower voltage limits of 4.2 V and 2.65 V, respectively.
Before evaluating the health indicators, the aging progression of the battery was quantified through the charge throughput exchanged during cycling. For this purpose, the moved charge, Q, was calculated from the current data recorded during the aging phase as
from which it is possible to extract the number of equivalent cycles (Ncyc) defined as
where Cn is the nominal capacity of the battery. Ncyc provides a normalized aging metric that can be used to compare the evolution of health indicators at different stages of battery life.
4. Analysis of the Results
This section presents the results obtained from the diagnostic analyses applied to the experimental data described in Section 3. The objective is to evaluate the evolution of the battery response during aging and to assess the influence of characterization temperature and SOC on the extracted health indicators. As mentioned in the introduction, the analysis was performed directly on the measured data, without battery model fitting, to compare the diagnostic information provided by each technique from a model-free perspective.
4.1. Charge/Discharge Voltage Curve Analysis Results
Firstly, Q and Ncyc were estimated for each aging phase according to (7) and (8). The results are provided in Table 3.
Table 3.
Q and Ncyc results.
Battery capacity was evaluated from the slow charge and discharge tests using the Coulomb counting method (1). Since the values obtained from charge and discharge data showed only minor differences, their average value was considered representative of the actual battery capacity for subsequent analyses. The average actual capacity, Ca, was plotted as a function of Ncyc to relate the available capacity to the cycling level. The results, depicted in Figure 2a, show that the actual capacity increases with temperature due to improved ionic mobility and reduced polarization effects, while it progressively decreases with aging as a consequence of aging mechanisms responsible for capacity fade [25]. The capacity reduction is more evident between CU1 and CU2, consistently with the higher moved charge accumulated after the second aging phase. Capacity analysis provides a straightforward global indicator of aging, highlighting capacity fade without identifying the specific aging mechanisms involved. Figure 2b shows the actual capacity at different temperatures, expressed in per unit (p.u.) with respect to the initial value at each temperature. The capacity decreases more significantly at lower temperatures, indicating that the effect of aging on capacity becomes more pronounced when the cell is characterized under low-temperature conditions.
Figure 2.
Battery capacity as a function of Ncyc at all tested temperatures: (a) expressed in Ah; (b) expressed in p.u. with respect to the initial value at each temperature.
In addition to capacity evaluation, OCV curve analysis was performed to assess the evolution of the discharge and charge curves with temperature and aging. The effect of temperature on the OCV curves is shown in Figure 3 for the fresh battery condition, CU0. Figure 3a, 3b report the discharge and charge curves, respectively, obtained at the three characterization temperatures. The same qualitative behavior was observed at the subsequent aging levels, CU1 and CU2. As temperature decreases, the discharge curves shift toward lower voltages and reduced capacities, whereas the charge curves shift toward higher voltages and reduced capacities. This behavior is consistent with the capacity trend previously discussed and can be attributed to reduced ionic mobility and slower diffusion at low temperatures, which increase polarization effects. Consequently, the voltage limits are reached earlier during both charge and discharge, leading to a reduction in the available capacity.
Figure 3.
OCV curves of CU0 for all tested temperatures: (a) discharge; (b) charge.
Regarding the aging effect, the OCV evolution is shown in Figure 4 at the temperature of 25 °C. Figure 4a, 4b report the discharge and charge curves, respectively, obtained at the three CU phases. The same qualitative behavior was observed at 10 °C and 40 °C. With aging, the discharge curves progressively shift toward lower voltages, resulting in a lower discharged capacity at the same voltage level. Conversely, the charge curves shift toward higher voltages, reducing the charged capacity available at a given voltage. This behavior reflects the progressive degradation of the battery, which reduces the amount of reversible charge and increases polarization effects. The separation between the curves is more evident from CU1 to CU2, consistently with the higher Q during the second aging phase.
Figure 4.
OCV curves at 25 °C for all CU phases: (a) discharge; (b) charge.
Therefore, OCV curve analysis provides a qualitative but immediate indication of the overall SOH of the battery, complementing capacity evaluation. However, similarly to capacity analysis, it does not allow the underlying degradation modes to be directly distinguished and requires low-current measurements to approach near-equilibrium conditions, increasing the experimental time. For this reason, these analyses mainly provide a baseline for the more detailed diagnostic methods discussed in the following sections.
4.2. Incremental Capacity and Differential Voltage Analyses Results
ICA and DVA were performed using the same slow charge and discharge data used in the previous analyses. Only the CC region of the charge and discharge profiles was considered, while the CV region was excluded because it is not suitable for curve derivation. The voltage and charge data were first extracted. For ICA, the data were interpolated onto a uniformly spaced voltage grid with a step of 10−4 V. Specifically, the data were interpolated using linear interpolation, since the voltage sampling interval was sufficiently small compared with the characteristic scale of variation in the IC curves, resulting in negligible interpolation errors while preserving the original shape of the measured data. The IC curves were then obtained by numerical differentiation as in (4) and smoothed using a moving average filter with a 50-point window, selected as a trade-off between noise reduction and preservation of the main peak features. Smaller windows were less effective in reducing the numerical noise introduced by differentiation, whereas larger windows resulted in smoother profiles but could attenuate narrow peaks, merge adjacent features, and alter peak amplitudes or locations, which are used in the subsequent analysis. Similarly, for DVA, the data were linearly interpolated onto uniformly spaced absolute SOD, qd, and absolute SOC, q, grids with a step of 10−3 Ah. The DV curves were then computed as in (5) and smoothed using the same 50-point moving average.
The temperature effect on the IC and DV curves is shown in Figure 5 for the fresh battery condition, CU0. Figure 5a, 5b report the IC curves, obtained from the discharge and the charge data, respectively, at the three tested temperatures, while Figure 5c,d report the corresponding DV curves. The same qualitative behavior was observed at the subsequent aging levels, CU1 and CU2. The discharge IC curves show a slight dependence on temperature. At higher temperatures, the main peak becomes more pronounced, and secondary peaks are better resolved, whereas at lower temperatures, the features tend to broaden and partially merge. This behavior can be attributed to slower lithium transport at low temperatures, which increases polarization and concentration gradients within the active material. The DV curves show a consistent trend, becoming flatter as temperature decreases, with less pronounced characteristic valleys. Similar qualitative effects were also observed during charging, with temperature mainly affecting the definition and intensity of the IC and DV features.
Figure 5.
IC and DV curves at CU0 for all tested temperatures: (a) IC discharge curve; (b) IC charge curve; (c) DV discharge curve; (d) DV charge curve.
The aging effect on the IC and DV curves is shown in Figure 6 at a temperature of 25 °C. Figure 6a, 6b report the IC curves obtained from discharge and charge data, respectively, comparing CU0, CU1, and CU2. Figure 6c,d show the corresponding DV curves under the same conditions. The same qualitative behavior was observed at 10 °C and 40 °C. Considering the IC curves, a consistent evolution with aging can be observed. During discharge, the main peaks progressively decrease in amplitude and shift toward lower voltages, while during charge a similar peak attenuation is observed together with a shift toward higher voltages. The DV curves also show a progressive evolution with aging. For both discharge and charge conditions, the valleys become flatter and shift toward lower values of the absolute SOD, qd, and the absolute SOC, q, respectively, indicating a reduction in the accessible battery capacity. In the discharge curves, the features at higher qd tend to merge as aging progresses, whereas in the charge curve the merging mainly affects the valleys at lower q.
Figure 6.
IC and DV curves at 25 °C for all CU phases: (a) IC discharge curve; (b) IC charge curve; (c) DV discharge curve; (d) DV charge curve.
To support the qualitative interpretation and quantify the observed trends, the main IC peaks were identified using the MATLAB (2023b) function findpeaks, which detects the peak position and intensity along the curves. This procedure enabled a systematic comparison of peak evolution across the different CU phases. The identified IC peaks are highlighted in Figure 7 for the battery tested at 25 °C. Figure 7a, 7b report the discharge and charge IC curves, respectively. This representation provides a clearer visualization of the peak features considered in the analysis and allows the progressive variation in peak position and amplitude during aging to be observed more directly.
Figure 7.
IC curves at CU0 at 25 °C highlighting the identified peaks: (a) discharge; (b) charge.
To better visualize the aging evolution of the identified IC peaks, both peak amplitude and peak location were analyzed in normalized form, as reported in Figure 8. Figure 8a, 8e, 8i show the normalized peak amplitudes of the IC curves (NPAIC) obtained from discharge data, while Figure 8c, 8g, 8k present the corresponding normalized peak locations (NPLIC) at 10 °C, 25 °C, and 40 °C, respectively. Similarly, Figure 8b, 8f, 8j show the NPAIC obtained from charge data, while Figure 8d, 8h, 8l present the corresponding NPLIC at 10 °C, 25 °C and 40 °C, respectively. The normalization was performed with respect to the CU0 condition, allowing the relative variation in each peak to be compared more clearly across the different CU phases.
Figure 8.
Normalized evolution of IC peak amplitudes and locations as a function of aging: (a–d) 10 °C; (e–g) 25 °C; (h–l) 40 °C.
The NPAIC trends confirm a general reduction in peak amplitude with aging for both discharge and charge data at all tested temperatures. The most intense peaks generally exhibit the clearest attenuation, whereas less pronounced features tend to become less distinguishable with aging and may disappear due to peak overlap or reduced resolution. This effect is particularly relevant at low temperatures, where peak identification is more challenging due to broader and less resolved IC features. The NPLIC trends confirm the voltage shifts previously observed in the IC curves. During discharge, the peaks generally shift slightly toward lower voltages with aging, whereas during charge they show a small shift toward higher voltages. No clear temperature-dependent trend can be identified. Overall, the combined decrease in NPAIC and variation in NPLIC supports the qualitative interpretation discussed above, indicating a progressive modification of the electrochemical response of the battery during aging.
Since half-cell data were not available, the contributions of the positive and negative electrodes cannot be quantitatively separated, and the observed peak evolution cannot be uniquely attributed to a single degradation mode. Nevertheless, according to the criteria introduced in Section 2.2, LLI is typically associated with a reduction in IC peak intensity combined with voltage shifts, whereas LAM is mainly reflected by a decrease in peak height at nearly constant voltage. In the present results, the progressive attenuation of the peaks, together with the limited voltage displacement, is therefore mainly consistent with LAM-related effects. A possible contribution from LLI cannot be excluded; however, it can be further investigated through the complementary analysis of the DV curves discussed below [22].
The same identification procedure adopted for the IC peaks was applied to the DV curves, using the MATLAB (2023b) function findpeaks on the negative DV signal to detect the main valleys. An example is shown in Figure 9 for the fresh battery condition at 25 °C, where the identified valleys are highlighted for both discharge (a) and charge (b) data.
Figure 9.
DV curves at CU0 at 25 °C highlighting the identified peaks: (a) discharge; (b) charge.
Similarly to the IC peak analysis, the aging evolution of the identified DV valleys was evaluated in normalized form, as reported in Figure 10. Figure 10a, 10e, 10i show the normalized valley depths of the DV curves (NVDDV) obtained from discharge data, while Figure 10c, 10g, 10k present the corresponding normalized valley locations (NVLDV) at 10 °C, 25 °C, and 40 °C, respectively. Similarly, Figure 10b, 10f, 10j show the NVDDV obtained from charge data, while Figure 10d, 10h, 10l present the corresponding NVLDV at 10 °C, 25 °C and 40 °C, respectively. The normalization was performed with respect to the CU0 condition, allowing the relative variation in each valley to be compared across the different CU phases.
Figure 10.
Normalized evolution of DV valley depths and locations as a function of aging: (a–d) 10 °C; (e–g) 25 °C; (h–l) 40 °C.
The NVDDV trends confirm the progressive flattening of the DV curves with aging for both discharge and charge data. The valley depth generally decreases as aging progresses, with the most pronounced variation occurring between CU1 and CU2. Less pronounced valleys tend to become less distinguishable with aging and may disappear due to merging with adjacent features. This behavior is observed for the shallowest valley, identified by the triangle marker, which is visible at CU0 but cannot be reliably detected at the subsequent CU phases for all the tested temperatures. The NVLDV trends confirm the capacity shift previously observed from the DV curves. In both discharge and charge conditions, the valleys progressively move toward lower values of the absolute SOD, qd, and the absolute SOC, q, respectively, with aging, indicating a reduction in the accessible capacity associated with the characteristic DV features. As for the IC peaks, no clear temperature-dependent trend can be identified.
According to the criteria introduced in Section 2.2, a displacement of DV valleys along the absolute SOC/SOD axis is mainly associated with LLI, whereas a reduction in valley depth at nearly constant absolute SOC/SOD is more indicative of LAM. In the present results, both attenuation and displacement are observed; however, the progressive shift toward lower absolute SOC/SOD values provides a clearer indication of LLI [22]. Therefore, while ICA mainly highlights peak attenuation, suggesting LAM-related effects, DVA supports the identification of LLI, confirming the complementary nature of the two analyses.
Overall, ICA and DVA provide more detailed diagnostic information than charge/discharge voltage curve analysis, as variations in peak and valley positions, shapes, and intensities reflect changes in the electrochemical response of the battery. However, similar to charge/discharge voltage curve analysis, these methods require lengthy low-rate measurements and careful data preprocessing. In this study, the C/6 charge and discharge tests lasted approximately 12 h per temperature condition. Moreover, peak and valley identification for ICA and DVA requires manual supervision, especially at low temperatures, where feature merging may reduce the reliability of automatic detection. Despite these limitations, ICA and DVA provide consistent and complementary qualitative insights into the aging behavior of the battery.
4.3. Electrochemical Impedance Spectroscopy Analysis Results
EIS measurements were performed during the CU phase to investigate the evolution of battery impedance as a function of SOC, temperature, and aging. The analysis presented in this section is based on the direct interpretation of Nyquist plots, following the framework introduced in Section 2.3.
The effect of SOC on the impedance response is shown in Figure 11 for measurements performed at 25 °C and CU0. From a qualitative standpoint, the spectra exhibit a clear dependence on SOC. At low SOC levels, particularly at 0% and 10%, two semicircular features can be distinguished in the Nyquist plots, whereas at intermediate and high SOC levels, the spectra are generally characterized by a single dominant semicircle.
Figure 11.
Nyquist plots at different SOC levels at 25 °C and CU0.
To isolate the effect of temperature on the impedance response, a direct comparison was performed at a fixed SOC. Figure 12 reports the Nyquist plots obtained at SOC = 50% for the three characterization temperatures. Figure 12a, 12b, 12c correspond to CU0, CU1, and CU2, respectively. The spectra were first qualitatively analyzed, leading to the following observations. The results show a clear temperature dependence of the impedance response. As temperature decreases, both the real and imaginary components of the impedance increase, leading to an expansion of the Nyquist spectra along both axes. Conversely, at higher temperatures, the spectra appear more compressed and closer to the origin. This behavior is consistent across the three aging levels and can be attributed to slower ionic transport and increased charge-transfer resistance at lower temperatures [37].
Figure 12.
Nyquist plots at SOC = 50% for all tested temperatures: (a) CU0; (b) CU1; (c) CU2.
Finally, the effect of aging on the impedance response was evaluated for a determined SOC. Figure 13 reports the Nyquist plots obtained at SOC = 50% for the three CU phases. Figure 13a, 13b, 13c correspond to 10 °C, 25 °C, and 40 °C, respectively. The results show a progressive increase in impedance with aging. From CU0 to CU2, the Nyquist spectra shift toward higher real impedance values and expand along the imaginary axis, indicating an increase in the overall resistance and a slower dynamic response of the battery. This trend is observed at all tested temperatures, although the impedance increase is more pronounced at lower temperatures. Moreover, the separation between the two semicircles becomes increasingly evident with aging, particularly at CU2, suggesting a progressive modification of the interfacial and charge-transfer response of the battery. This behavior is further accentuated at low and high SOC levels, as shown in the following analysis.
Figure 13.
Nyquist plots at SOC = 50% for all CU phases: (a) 10 °C; (b) 25 °C; (c) 40 °C.
Following the qualitative discussion of the Nyquist plots, selected health indicators were extracted to quantitatively characterize the battery response. The analysis focused on the following characteristic quantities: the high-frequency resistance, RHF, identified as the high-frequency intercept of the Nyquist curve with the real axis; low-frequency resistance, RLF, defined as the real part of the low-frequency impedance, ZLF, located at the transition between the second semicircular region and the diffusion branch; and the characteristic time constants, τI, τII, extracted from the frequencies corresponding to the maxima of the semicircular features, ZI, ZII. Once the corresponding frequency was retrieved from the EIS data, the time constant was calculated as
When a single semicircle was observed, the two values coincide, whereas when two semicircles were distinguishable, τI was associated with the higher-frequency semicircle and τII with the lower-frequency one. These characteristic points are highlighted in Figure 14 for a representative Nyquist plot obtained at CU1, 10 °C, and SOC = 100%.
Figure 14.
Nyquist plot at CU1, 10 °C, and SOC = 100% highlighting the selected health indicators.
The first indicator considered is the high-frequency resistance, RHF. Figure 15 reports its evolution as a function of Ncyc at the three investigated temperatures. The results are reported in p.u. with respect to the value at CU0 in each condition. Results are shown at each SOC to highlight the evolution of RHF with aging across the entire SOC range. The results show that RHF progressively increases from CU0 to CU2, in agreement with the qualitative evolution observed in the Nyquist plots. According to the frequency-region interpretation introduced in Section 2.3, this trend can be associated with aging phenomena affecting the ohmic region of the impedance spectrum. In particular, it may be related to phenomena such as current collector corrosion and binder decomposition, which mainly contribute to CL and LLI as degradation modes [22]. Regarding the effect of SOC, similar values are observed across the investigated SOC range for a given temperature and CU phase, with only a slightly larger increase at high SOC levels, indicating a weak SOC dependence. Conversely, a clear temperature effect is observed, with the relative increase becoming more pronounced at lower temperatures. This indicates that the effect of aging on RHF is more evident when measurements are performed at low temperatures, consistent with the trend previously observed for capacity.
Figure 15.
RHF as a function of Ncyc for all SOC levels: (a) 10 °C; (b) 25 °C; (c) 40 °C.
The second indicator considered is the low-frequency resistance, RLF. This indicator was identified as the local minimum of the Nyquist curve using the MATLAB (2023b) function islocalmin. For very low SOC values, especially 0% and 10%, the transition between the semicircle and the diffusion branch was not clearly distinguishable; therefore, these SOC levels were excluded from the following analysis.
Figure 16 reports the evolution of RLF as a function of Ncyc at the three investigated temperatures. Similarly to RHF, each panel shows the values in p.u. with respect to the value at CU0 obtained at different SOC levels to highlight the aging evolution. Regarding aging, RLF progressively increases from CU0 to CU2 for all investigated temperatures and SOC levels. Since RLF is extracted close to the transition between the mid-frequency region and the diffusion branch, its increase may reflect the evolution of interfacial and transport-related processes, such as SEI growth and dissolution, CEI evolution, lithium plating, and electrolyte degradation phenomena [31]. In terms of degradation modes, these effects can be associated with possible contributions from both LLI and LAM. Unlike RHF, RLF shows a more evident dependence on SOC. The highest increase in p.u. is generally observed at SOC = 100%. This suggests that the low-frequency impedance contribution is more sensitive to SOC-dependent processes. From a temperature perspective, coherently with RHF and with the literature [37], the increase in RLF with aging is more pronounced at low temperature.
Figure 16.
RLF as a function of Ncyc for all SOC levels: (a) 10 °C; (b) 25 °C; (c) 40 °C.
Finally, the characteristic time constants associated with the semicircular regions of the Nyquist plots were evaluated. The characteristic impedance points were identified as the maxima of the semicircles using the MATLAB (2023b) function islocalmax. Similarly to RLF, the identification was not reliable at very low SOC values, namely 0% and 10%, where the transition between the health indicators was not clearly distinguishable. Therefore, these SOC levels were excluded from the analysis. When two semicircles were present, two time constants were extracted. In some cases, the first semicircle did not appear as a clear local maximum but rather as an inflection region. In these cases, the characteristic point was identified from the change in sign of the second derivative of the Nyquist curve.
Figure 17 shows the evolution of τI and τII as a function of Ncyc, expressed in p.u. with respect to their corresponding values at CU0. Under some conditions, τII could not be identified because only a single semicircle was observed in the impedance spectrum; therefore, no τII value is reported for these cases.
Figure 17.
Characteristic time constants as a function of Ncyc for all SOC levels: (a–c) τI; (d–f) τII.
The separation between τI and τII is strongly temperature-dependent. At 10 °C, two distinct semicircles become increasingly evident with aging for most SOC levels, allowing two clearly separated time constants to be identified. Under these conditions, τII progressively increases and diverges from τI as aging progresses. At 40 °C, in contrast, only one dominant semicircle is observed across all tested SOC and aging levels. The behavior at 25 °C is intermediate, with two semicircles mainly visible at SOC = 100%, becoming more evident with aging. Both τI and τII increase with aging in all conditions. The increase in τI appears to be more pronounced at 40 °C, probably because, at this temperature, the two semicircular contributions are merged, whereas at 10 °C τI represents, in most cases, only the high-frequency process. When two semicircles are distinguishable, their interpretation can be related to the frequency-region framework introduced in Section 2.3. The first semicircle, associated with τI, can be mainly linked to SEI growth. The second semicircle, associated with τII and characterized by slower dynamics, can instead reflect slower interfacial phenomena, including cathode charge-transfer slowdown, SEI decomposition, and CEI formation [31]. The progressive increase in τII with aging suggests that these slower processes become increasingly relevant, particularly at low temperatures, where kinetic limitations are amplified. Regarding the SOC dependence, τI exhibits a larger increase at high SOC levels at 40 °C, whereas this dependence is less evident at the other temperatures. A similar behavior is observed for τII at 10 °C, with a more pronounced increase at high SOC levels, while at 25 °C the second semicircle is identifiable only at high SOC. It is worth highlighting that, at high SOC levels (90% and 100%), the increase is often more pronounced between CU0 and CU1 than between CU1 and CU2. This suggests that the processes affecting the characteristic time constants develop more rapidly during the initial stage of aging.
Overall, EIS provided diagnostic information directly from Nyquist plots without battery model fitting. The qualitative evolution of the spectra was complemented by the extraction of the characteristic points, enabling a more structured comparison of aging, temperature, and SOC effects. RHF was the most straightforward indicator to identify, whereas RLF, τI, and τII required more careful evaluation and could not be reliably extracted at very low SOC levels. Each EIS test lasted approximately 25 min and was repeated over ten SOC levels, resulting in approximately 4 h of testing per temperature.
4.4. Distribution of Relaxation Times Analysis Results
In this work, DRT extraction was performed using the MATLAB (2023b) graphical user interface DRTtools [38], with first-order derivative regularization and a regularization parameter of 1 × 10⁻⁴. This value was selected based on preliminary sensitivity analyses performed on representative impedance spectra. Lower regularization parameters resulted in less stable DRT distributions, characterized by stronger oscillations and the appearance of additional minor peaks, whereas higher values led to excessive smoothing and reduced separation between neighboring relaxation processes. Therefore, 1 × 10⁻⁴ was chosen as a compromise between stability and resolution, enabling the main DRT peaks to be preserved and consistently identified throughout the experimental campaign. The tool uses a reformulation of Equation (6) as
with γ(lnτ) = τg(τ), so that all results refer to γ(lnτ). The analysis was performed by directly comparing the DRT curves under different SOC, temperature, and aging conditions.
In Figure 18, the DRT curves at 25 °C and CU0 for all SOC levels are reported. SOC appears to influence the peak at high τ, whose magnitude increases at lower SOC levels. Conversely, no clear effect of SOC is observed on the other peaks, as can be seen in the zoomed-in view.
Figure 18.
DRT curves for all SOC levels at 25 °C and CU0.
The temperature effect on the DRT response was evaluated considering three representative SOC levels: 0%, 50%, and 100%. These values were selected to include the two extreme SOC conditions and an intermediate state. The results are reported in Figure 19, where panels (a), (b), and (c) show the full DRT spectra at CU0 and SOC = 100%, 50%, and 0%, respectively, together with the corresponding zoomed views, which allow a clearer comparison of the main features in the selected characteristic time range. Overall, the DRT spectra show a clear temperature dependence. For a given SOC and aging phase, lower temperatures generally lead to higher values of the relaxation strength γ, indicating larger polarization contributions, consistently with the literature [39]. This effect is particularly evident at SOC = 50% and SOC = 100%, where the DRT curves increase in magnitude as temperature decreases. At SOC = 0%, instead, the trend is less regular: the dominant peak does not always follow the same temperature dependence, and in some cases the curves obtained at different temperatures show comparable amplitudes. Regarding the peak position along the horizontal axis, the dominant peak remains approximately located in the same characteristic time range for the investigated temperatures, suggesting that its characteristic time is only weakly affected by temperature. Conversely, the secondary peaks at higher characteristic times show a more evident temperature dependence, generally shifting toward lower τ values as temperature increases. The lowest-time peak shows the opposite tendency, with a slight displacement toward higher τ values at higher temperatures. In general, at higher temperatures, intermediate DRT peaks tend to merge, resulting in smoother spectra.
Figure 19.
DRT curves at CU0 for all tested temperatures: (a) SOC = 100%; (b) SOC = 50%; (c) SOC = 0%.
The aging effect on the DRT response was investigated at SOC = 50% and the results are reported in Figure 20. Overall, aging leads to an increase in the DRT magnitude, indicating higher relaxation strength and larger polarization contributions. This trend is generally observed across all investigated temperatures. In addition, the DRT spectra become more structured with aging: new features appear, and adjacent peaks become more distinguishable, especially in the intermediate characteristic time range, consistently with the literature [34]. At SOC = 50%, the aging trend is clearly visible at all temperatures, with a progressive increase in peak amplitude from CU0 to CU2. Regarding peak position, the highest-τ peak remains approximately aligned across the different CU phases. Intermediate relaxation processes show a more complex evolution: peaks in the intermediate-to-high τ range tend to shift toward higher characteristic times with aging, whereas features at lower τ may shift slightly toward lower values. Overall, the increase in amplitude and the greater separation of DRT peaks indicate a progressive modification of the battery relaxation dynamics during aging.
Figure 20.
DRT curves at SOC = 50% for all CU phases: (a) 10 °C; (b) 25 °C; (c) 40 °C.
To further quantify the DRT evolution, the main peaks were identified using the MATLAB (2023b) function findpeaks. As for ICA and DVA, the peak amplitudes were then analyzed as a function of Ncyc through a normalized parameter, NPADRT, defined with respect to the corresponding peak amplitude at CU0. This normalization highlights the relative aging-induced variation in each relaxation process. Peaks not detectable at CU0 were not included in the normalized representation, since no reference value was available. An example of the peak identification procedure is reported in Figure 21 for a representative DRT curve, where the detected peaks are highlighted for the condition of 25 °C and SOC = 100%.
Figure 21.
DRT curve at CU2, 25 °C, and SOC = 100% highlighting the identified peaks.
The resulting NPADRT trends are shown in Figure 22. Figure 22a–c, 22d–f, and 22g–i correspond to 10 °C, 25 °C, and 40 °C, respectively, while the three subplots in each row refer to SOC = 100%, 50%, and 0%. For most SOC and temperature conditions, the peaks located at higher characteristic times (circle, square, and diamond markers) consistently increase with aging, particularly for CU2, suggesting an increasing contribution of slower relaxation processes. The peak at the highest characteristic time, around 100 s (circle marker), can be associated with diffusion-controlled processes. Its progressive increase in NPADRT with aging suggests increasing mass-transport limitations and a general slowdown of battery kinetics and of lithium-ion diffusion within the battery [34]. The peaks located at medium-high characteristic times, approximately in the range of 1–10 s (square and diamond markers), are generally related to charge-transfer processes at the electrode–electrolyte interfaces [40]. Their increase with aging may therefore indicate a progressive rise in charge-transfer resistance and a slowdown of interfacial kinetics. The remaining peaks show a less regular evolution, with smaller variations compared to the high-τ features. Nevertheless, most peaks exhibit an overall increase in NPADRT at CU2 compared with CU0. Peaks located at low-medium characteristic times, typically between 10−3 and 10−1 s, can be related to SEI/CEI processes [41]. Their more moderate evolution suggests that these phenomena contribute to aging, although less prominently than diffusion- and charge-transfer-related processes. An exception is observed for the intermediate peak identified by the five-point star marker at SOC = 100% and 0% at 10 °C and at SOC = 0% at 40 °C. Under these conditions, the peak shows a markedly larger increase with aging, highlighting the stronger impact of degradation on the associated relaxation process. Consistent with the trends observed for capacity and resistance-related indicators, the increase in peak magnitude is more pronounced at lower temperatures, indicating that aging effects are more clearly revealed under low-temperature measurement conditions.
Figure 22.
NPADRT as a function of Ncyc at selected SOC levels: (a–c) 10 °C; (d–f) 25 °C; (g–i) 40 °C.
Overall, DRT analysis enhances the interpretation of EIS data by separating impedance contributions in the time domain. The evolution of the identified peaks provides useful indications of aging-related changes affecting different electrochemical processes. However, similarly to ICA and DVA, peak identification requires careful supervision to ensure a reliable interpretation of the extracted features.
4.5. Voltage Relaxation Analysis Results
Voltage relaxation analysis was performed on the voltage response measured after the discharge pulses during the CU procedure, focusing on the data collected during the rest phase. The analysis focused on the instantaneous ohmic drop and the time required for the battery voltage to reach equilibrium after current interruption. Two health indicators were therefore considered: the instantaneous ohmic resistance, Ro, and the relaxation time to equilibrium, τr.
The first indicator, Ro, was calculated as
where VB,0 is the battery voltage at the end of the discharge pulse, VB,1 is the battery voltage at the beginning of the relaxation phase, and ∆I is the current pulse. This metric provides an estimate of the resistive components that respond to current interruption within a time scale shorter than 0.1 s. The second indicator, τr, was defined as the time required for the relaxation voltage to differ from its final value by less than 1 mV, which corresponds to VB,2. This indicator provides an indication of slower transport-related relaxation processes and depends on variations in transport phenomena and electrochemical behavior. A threshold of 1 mV was selected because it represents a negligible variation relative to the battery operating voltage range and is comparable to the experimental uncertainty, such that any residual voltage variation can be considered physically insignificant. An example of the extraction procedure of the points used in the analysis is shown in Figure 23 for CU0 at 25 °C and SOC = 50%. These health indicators were evaluated over the available SOC range, excluding SOC = 100%, where no discharge pulse was applied and relaxation data were therefore unavailable.
Figure 23.
Battery voltage during pulse and relaxation at CU0, 25 °C, and SOC = 50%.
To compare its evolution with aging at the three characterization temperatures, Ro was plotted as a function of Ncyc and expressed in p.u. with respect to its corresponding value at CU0 for each condition. Figure 24 reports the results at 10 °C, 25 °C, and 40 °C, with each curve corresponding to a fixed SOC level. The Ro trends show an overall increase with aging, indicating a progressive growth of the internal resistance and degradation of the ohmic components of the battery. This increase is observed for most SOC levels and temperatures, with only minor deviations during the first aging phase at low SOC. Overall, the increase in Ro with aging exhibits only a weak dependence on SOC. The effect of the Ro increase becomes more evident at lower temperatures, where resistive phenomena are amplified. Ro is generally considered as the pure ohmic resistance of the battery, including the electronic resistance of electrodes and the ionic resistance of the bulk electrolyte [42]. Therefore, its increase with aging can be associated with phenomena affecting these resistance contributions, such as current collector corrosion, binder degradation, and electrolyte conductivity reduction. However, Ro should not be considered directly equivalent to RHF, which represents the instantaneous ohmic resistance obtained from EIS measurements. Since Ro is extracted from voltage data acquired with the battery cycler, its time resolution is lower than that of high-frequency impedance measurements. Therefore, Ro may also include fast kinetic contributions, explaining why its values are systematically higher than RHF [42].
Figure 24.
Ro as a function of Ncyc for all SOC levels: (a) 10 °C; (b) 25 °C; (c) 40 °C.
Figure 25 reports the evolution of the second indicator, τr, as a function of Ncyc. This indicator is expressed in p.u. with respect to its corresponding value at CU0 under each condition, allowing a direct comparison of its evolution with aging at the three characterization temperatures. The results show a general increase in τr with aging, indicating that the voltage relaxation process becomes progressively slower as degradation advances. Minor deviations are observed in some conditions during the first aging phase; however, the overall trend confirms an increase in the time required for the battery voltage to stabilize after current interruption. Unlike Ro, this parameter exhibits a larger increase at higher temperatures than at lower temperatures, particularly at high SOC levels, consistent with the trend observed for τI.
Figure 25.
τr as a function of Ncyc for all SOC levels: (a) 10 °C; (b) 25 °C; (c) 40 °C.
Overall, relaxation analysis allowed both Ro and τr to be extracted from the same pulse-rest test, providing complementary information on fast resistive effects and slower voltage stabilization dynamics. However, the analysis could not be performed at SOC = 100%, since no comparable discharge pulse and subsequent relaxation data were available under fully charged conditions. Each pulse-relaxation sequence lasted approximately 70 min, resulting in a total testing time of about 11.5 h per temperature.
4.6. Final Considerations
Overall, all the diagnostic methods and features investigated in this work exhibited sensitivity to battery aging. The results confirm that aging can be detected through a variety of health indicators, although each technique provides different diagnostic information and exhibits different sensitivity to the characterization conditions.
Whenever a temperature dependence was observed, most parameters, with the exception of τI and τr, exhibited enhanced sensitivity at lower temperatures. It is important to note that the cells were characterized at different temperatures while at the same aging level. Therefore, the observed differences are attributable solely to the characterization conditions and indicate that low-temperature measurements amplify the effects of degradation, making aging-related changes more evident. In contrast, the influence of SOC was generally less pronounced and more parameter dependent. Nevertheless, aging effects tended to be more evident at high and low SOC levels.
Capacity estimation proved to be the most direct indicator of aging, providing a straightforward measure of SOH. However, while highly effective for quantifying degradation, it does not provide information on the underlying degradation modes. Capacity loss was also found to be more pronounced at lower characterization temperatures.
In contrast, ICA, DVA, and DRT analysis provide limited direct information on SOH but offer valuable insights into the mechanisms responsible for degradation. ICA and DVA revealed clear aging-related changes, although no systematic temperature dependence was observed. DRT analysis was particularly informative, as it enabled the separation of contributions associated with different electrochemical processes and exhibited enhanced sensitivity at lower temperatures.
EIS analysis can provide both quantitative indicators of SOH, through increases in resistance, and partial insights into degradation modes. All resistance and time-constant parameters evolved consistently with aging, although they reflected different electrochemical and transport processes. In particular, τII exhibited the highest sensitivity to aging, despite not being identifiable under all operating conditions. Similar to the other techniques, EIS-derived parameters generally showed greater sensitivity at lower temperatures and at extreme SOC levels.
Voltage relaxation analysis provides information offering both health indicators and qualitative insights into degradation processes. However, the interpretation of the extracted time constant was less robust, making the attribution of specific mechanisms more challenging. In addition, the results were strongly influenced by the selected sampling interval and steady-state criterion, leading to a higher degree of subjectivity and lower reproducibility compared with EIS analysis.
Overall, the investigated techniques complement each other by providing different levels of diagnostic information, ranging from direct SOH assessment to the interpretation of aging mechanisms. Their main strengths and limitations are summarized in Table 4.
Table 4.
Summary of diagnostic methods, showing information level, test duration, strengths, limitations, and related degradation modes.
5. Conclusions
This paper presents a comparative assessment of several diagnostic methods and the corresponding parameters extracted through an extensive experimental campaign. A key aspect of the study was the adoption of a model-free approach, whereby the comparison among the different techniques was performed without relying on predefined battery model fitting. Instead, the analysis was based on directly observable trends and features, thereby minimizing the influence of model assumptions and fitting uncertainties.
The results show that the investigated methods provide complementary levels of diagnostic information. Charge/discharge voltage curve analysis provides global and quantitative indicators of degradation, whereas ICA and DVA offer qualitative insights into the evolution of characteristic voltage features and possible degradation modes. EIS, DRT, and voltage relaxation analyses provide more process-related information, linking the observed aging behavior to changes in resistive, interfacial, transport, and relaxation dynamics.
Consistent aging trends were observed across all diagnostic methods, suggesting that the identified degradation behavior is largely independent of the methodology employed. While the overall aging trends remained consistent across characterization conditions, low-temperature measurements generally amplified aging-related changes and improved the visibility of degradation signatures.
Overall, no single method is sufficient to fully characterize the degradation process; therefore, combining multiple diagnostic methods enables a more comprehensive interpretation of battery aging. Although the attribution of individual aging mechanisms remains primarily qualitative without additional assumptions or post-mortem analyses, the proposed approach demonstrates that meaningful and complementary diagnostic information can be extracted directly from experimental measurements, providing a practical framework for battery health assessment.
Author Contributions
Conceptualization, S.B., A.B., S.C., and M.M.; methodology, S.B., A.B., S.C., and M.M.; validation, M.M.; formal analysis, S.B., A.B., S.C., and M.M.; investigation, M.M.; writing—original draft preparation, M.M.; writing—review and editing, S.B., A.B., S.C., and M.M.; visualization, S.C. and M.M.; supervision, S.B. All authors have read and agreed to the published version of the manuscript.
Funding
This work has been financed by the Research Fund for the Italian Electrical System under the Three-Year Research Plan 2025–2027 (MASE, Decree n.388 of 6 November 2024), in compliance with the Decree of 12 April 2024.
Data Availability Statement
The data presented in this study are available on request from the corresponding author.
Conflicts of Interest
Authors Andrea Barisione and Silvia Colnago were employed by the company Ricerca sul Sistema Energetico S.p.A. The remaining authors declare that the research was conducted in the absence of any commercial or financial relationships that could be construed as a potential conflict of interest.
References
- Liu, B.; Wu, C.; Liu, Y.; Pan, Y.; Li, D.; Chu, Z.; Zhang, C.; Li, H. Electrochemical-Mechanical Understanding of the Accelerated Degradation of Lithium-Ion Batteries Caused by Mechanical Stress. Energy 2025, 333, 137420. [Google Scholar] [CrossRef] [Scilit]
- Vermeer, W.; Chandra Mouli, G.R.; Bauer, P. A Comprehensive Review on the Characteristics and Modeling of Lithium-Ion Battery Aging. IEEE Trans. Transp. Electrif. 2022, 8, 2205–2232. [Google Scholar] [CrossRef] [Scilit]
- Wang, Y.; Xiang, H.; Soo, Y.-Y.; Fan, X. Aging Mechanisms, Prognostics and Management for Lithium-Ion Batteries: Recent Advances. Renew. Sustain. Energy Rev. 2025, 207, 114915. [Google Scholar] [CrossRef] [Scilit]
- Barcellona, S.; Colnago, S.; Codecasa, L.; Piegari, L. An Accelerated Aging Test Procedure for Lithium-Ion Battery Based on a Dual-Temperature Approach. J. Power Sources 2025, 644, 237167. [Google Scholar] [CrossRef] [Scilit]
- Birkl, C.R.; Roberts, M.R.; McTurk, E.; Bruce, P.G.; Howey, D.A. Degradation Diagnostics for Lithium Ion Cells. J. Power Sources 2017, 341, 373–386. [Google Scholar] [CrossRef] [Scilit]
- Enrico, D.S.; Vanessa, P.; Massimiliano, L.; Antonello, R. Degradation Mechanisms and Differential Curve Modeling for Non-Invasive Diagnostics of Lithium Cells: An Overview. Renew. Sustain. Energy Rev. 2025, 211, 115349. [Google Scholar] [CrossRef] [Scilit]
- Lin, X.; Khosravinia, K.; Hu, X.; Li, J.; Lu, W. Lithium Plating Mechanism, Detection, and Mitigation in Lithium-Ion Batteries. Prog. Energy Combust. Sci. 2021, 87, 100953. [Google Scholar] [CrossRef] [Scilit]
- Jeon, D.H.; Kim, S.; Hempelmann, R. State-of-the-Art Review of Degradation Mechanisms of Commercial Lithium-Ion Batteries. J. Power Sources 2025, 646, 237242. [Google Scholar] [CrossRef] [Scilit]
- Misiani, A.N.; Oni, B.A. A Review on Challenges in Low Temperature Lithium-Ion Cells and Future Prospects. Appl. Energy 2025, 393, 125987. [Google Scholar] [CrossRef] [Scilit]
- Arif, N.A.; Mekhilef, S.; Seyedmahmoudian, M.; Stojcevski, A. Degradation in Li-Ion Batteries and Capacity Decline under Different Cycling Conditions: A Comprehensive Review. J. Energy Storage 2026, 154, 121270. [Google Scholar] [CrossRef] [Scilit]
- Vetter, J.; Novák, P.; Wagner, M.R.; Veit, C.; Möller, K.-C.; Besenhard, J.O.; Winter, M.; Wohlfahrt-Mehrens, M.; Vogler, C.; Hammouche, A. Ageing Mechanisms in Lithium-Ion Batteries. J. Power Sources 2005, 147, 269–281. [Google Scholar] [CrossRef] [Scilit]
- Zheng, B.; Deng, Z.; Luo, Z.; Mao, S.; Ouyang, M.; Han, X.; Wang, H.; Li, Y.; Sun, Y.; Wang, D.; et al. A Comprehensive Review of Lithium-Ion Battery Modelling Research and Prospects: In-Depth Analysis of Current Research and Future Directions. Appl. Energy 2025, 401, 126688. [Google Scholar] [CrossRef] [Scilit]
- Velasco-Arellano, H.; Castillo-Magallanes, N.; Visairo-Cruz, N.; Núñez-Gutiérrez, C.A.; Lázaro, I. Parametric Correlation Analysis between Equivalent Electric Circuit Model and Mechanistic Model Interpretation for Battery Internal Aging. World Electr. Veh. J. 2024, 15, 291. [Google Scholar] [CrossRef] [Scilit]
- Teliz, E.; Zinola, C.F.; Díaz, V. Identification and Quantification of Ageing Mechanisms in Li-Ion Batteries by Electrochemical Impedance Spectroscopy. Electrochim. Acta 2022, 426, 140801. [Google Scholar] [CrossRef] [Scilit]
- Cui, Y.; Zuo, P.; Du, C.; Gao, Y.; Yang, J.; Cheng, X.; Ma, Y.; Yin, G. State of Health Diagnosis Model for Lithium Ion Batteries Based on Real-Time Impedance and Open Circuit Voltage Parameters Identification Method. Energy 2018, 144, 647–656. [Google Scholar] [CrossRef] [Scilit]
- Bian, X.; Liu, L.; Yan, J. A Model for State-of-Health Estimation of Lithium Ion Batteries Based on Charging Profiles. Energy 2019, 177, 57–65. [Google Scholar] [CrossRef] [Scilit]
- Li, J.; Adewuyi, K.; Lotfi, N.; Landers, R.G.; Park, J. A Single Particle Model with Chemical/Mechanical Degradation Physics for Lithium Ion Battery State of Health (SOH) Estimation. Appl. Energy 2018, 212, 1178–1190. [Google Scholar] [CrossRef] [Scilit]
- Kharal, A.Y.; Khalid, M.; Naqvi, I.H.; Arshad, N. Identification and Quantification of Degradation Modes in Lithium-Ion Battery Cells under Dynamic Load Conditions Using Equivalent Circuit and Physics-Based Models. J. Power Sources 2025, 632, 236274. [Google Scholar] [CrossRef] [Scilit]
- Michelini, E.; Höschele, P.; Abbas, S.M.; Ellersdorfer, C.; Moser, J. Assessment of Health Indicators to Detect the Aging State of Commercial Second-Life Lithium-Ion Battery Cells through Basic Electrochemical Cycling. Batteries 2023, 9, 542. [Google Scholar] [CrossRef] [Scilit]
- Makan, O.; Birke, K.-P. Correlation-Based Statistical Analysis of Battery-Cell Aging Parameters. J. Energy Storage 2026, 178, 123685. [Google Scholar] [CrossRef] [Scilit]
- Li, F.; Tang, X.; Song, S.; Wu, L.; Gong, Y.; Huang, X.; Sun, Y. On-Site Lithium Plating Detection in Lithium-Ion Batteries for Energy Storage Using Electrochemical Impedance Spectroscopy. J. Energy Storage 2026, 150, 120446. [Google Scholar] [CrossRef] [Scilit]
- Pastor-Fernández, C.; Uddin, K.; Chouchelamane, G.H.; Widanage, W.D.; Marco, J. A Comparison between Electrochemical Impedance Spectroscopy and Incremental Capacity-Differential Voltage as Li-Ion Diagnostic Techniques to Identify and Quantify the Effects of Degradation Modes within Battery Management Systems. J. Power Sources 2017, 360, 301–318. [Google Scholar] [CrossRef] [Scilit]
- Pastor-Fernández, C.; Yu, T.F.; Widanage, W.D.; Marco, J. Critical Review of Non-Invasive Diagnosis Techniques for Quantification of Degradation Modes in Lithium-Ion Batteries. Renew. Sustain. Energy Rev. 2019, 109, 138–159. [Google Scholar] [CrossRef] [Scilit]
- Bakenhaster, S.T.; Dewald, H.D. Electrochemical Impedance Spectroscopy and Battery Systems: Past Work, Current Research, and Future Opportunities. J. Appl. Electrochem. 2025, 55, 1657–1681. [Google Scholar] [CrossRef] [Scilit]
- Barai, A.; Uddin, K.; Dubarry, M.; Somerville, L.; McGordon, A.; Jennings, P.; Bloom, I. A Comparison of Methodologies for the Non-Invasive Characterisation of Commercial Li-Ion Cells. Prog. Energy Combust. Sci. 2019, 72, 1–31. [Google Scholar] [CrossRef] [Scilit]
- Dubarry, M.; Anseán, D. Best Practices for Incremental Capacity Analysis. Front. Energy Res. 2022, 10, 1023555, Correction in Front. Energy Res. 2023, 11, 1203569. https://doi.org/10.3389/fenrg.2023.1203569. [Google Scholar] [CrossRef] [Scilit]
- Fly, A.; Chen, R. Rate Dependency of Incremental Capacity Analysis (DQ/DV) as a Diagnostic Tool for Lithium-Ion Batteries. J. Energy Storage 2020, 29, 101329. [Google Scholar] [CrossRef] [Scilit]
- Ansean, D.; Garcia, V.M.; Gonzalez, M.; Blanco-Viejo, C.; Viera, J.C.; Pulido, Y.F.; Sanchez, L. Lithium-Ion Battery Degradation Indicators Via Incremental Capacity Analysis. IEEE Trans. Ind. Appl. 2019, 55, 2992–3002. [Google Scholar] [CrossRef] [Scilit]
- Dubarry, M.; Truchot, C.; Liaw, B.Y. Synthesize Battery Degradation Modes via a Diagnostic and Prognostic Model. J. Power Sources 2012, 219, 204–216. [Google Scholar] [CrossRef] [Scilit]
- Saidani, F.; Hutter, F.X.; Scurtu, R.-G.; Braunwarth, W.; Burghartz, J.N. Lithium-Ion Battery Models: A Comparative Study and a Model-Based Powerline Communication. Adv. Radio Sci. 2017, 15, 83–91. [Google Scholar] [CrossRef] [Scilit]
- Iurilli, P.; Brivio, C.; Wood, V. On the Use of Electrochemical Impedance Spectroscopy to Characterize and Model the Aging Phenomena of Lithium-Ion Batteries: A Critical Review. J. Power Sources 2021, 505, 229860. [Google Scholar] [CrossRef] [Scilit]
- Ciucci, F.; Chen, C. Analysis of Electrochemical Impedance Spectroscopy Data Using the Distribution of Relaxation Times: A Bayesian and Hierarchical Bayesian Approach. Electrochim. Acta 2015, 167, 439–454. [Google Scholar] [CrossRef] [Scilit]
- Jung, M.J.; Lee, S.-G.; Choi, K.-S. A New Diagnostic Indicator for Lithium-Ion Batteries via Electrochemical Impedance Spectroscopy: Harnessing the Highest Frequency Peak in Distribution of Relaxation Times. J. Power Sources 2024, 611, 234743. [Google Scholar] [CrossRef] [Scilit]
- Iurilli, P.; Brivio, C.; Wood, V. Detection of Lithium-Ion Cells’ Degradation through Deconvolution of Electrochemical Impedance Spectroscopy with Distribution of Relaxation Time. Energy Technol. 2022, 10, 2200547. [Google Scholar] [CrossRef] [Scilit]
- Schlüter, N.; Ernst, S.; Schröder, U. Finding the Optimal Regularization Parameter in Distribution of Relaxation Times Analysis. ChemElectroChem 2019, 6, 6027–6037. [Google Scholar] [CrossRef] [Scilit]
- Samsung. Samsung INR18650-35E 3500mAh. Available online: https://datasheet4u.com/download/1266159/INR18650-35E.html (accessed on 23 July 2026).
- Barcellona, S.; Colnago, S.; Dotelli, G.; Latorrata, S.; Piegari, L. Aging Effect on the Variation of Li-Ion Battery Resistance as Function of Temperature and State of Charge. J. Energy Storage 2022, 50, 104658. [Google Scholar] [CrossRef] [Scilit]
- Wan, T.H.; Saccoccio, M.; Chen, C.; Ciucci, F. Influence of the Discretization Methods on the Distribution of Relaxation Times Deconvolution: Implementing Radial Basis Functions with DRTtools. Electrochim. Acta 2015, 184, 483–499. [Google Scholar] [CrossRef] [Scilit]
- Zhu, J.; Knapp, M.; Liu, X.; Yan, P.; Dai, H.; Wei, X.; Ehrenberg, H. Low-Temperature Separating Lithium-Ion Battery Interfacial Polarization Based on Distribution of Relaxation Times (DRT) of Impedance. IEEE Trans. Transp. Electrif. 2021, 7, 410–421. [Google Scholar] [CrossRef] [Scilit]
- Shafiei Sabet, P.; Stahl, G.; Sauer, D.U. Non-Invasive Investigation of Predominant Processes in the Impedance Spectra of High Energy Lithium-Ion Batteries with Nickel–Cobalt–Aluminum Cathodes. J. Power Sources 2020, 472, 228189. [Google Scholar] [CrossRef] [Scilit]
- Huang, R.; Wang, X.; Jiang, B.; Chen, S.; Zhang, G.; Zhu, J.; Wei, X.; Dai, H. Revealing the Electrochemical Impedance Characteristics of Lithium-Ion Battery (Nickel-Cobalt-Aluminum vs. Graphite) under Various Alternating Current Amplitudes. J. Power Sources 2023, 566, 232929. [Google Scholar] [CrossRef] [Scilit]
- Barai, A.; Uddin, K.; Widanage, W.D.; McGordon, A.; Jennings, P. A Study of the Influence of Measurement Timescale on Internal Resistance Characterisation Methodologies for Lithium-Ion Cells. Sci. Rep. 2018, 8, 21. [Google Scholar] [CrossRef] [Scilit] [PubMed]
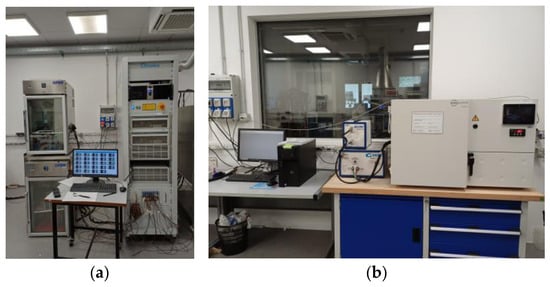
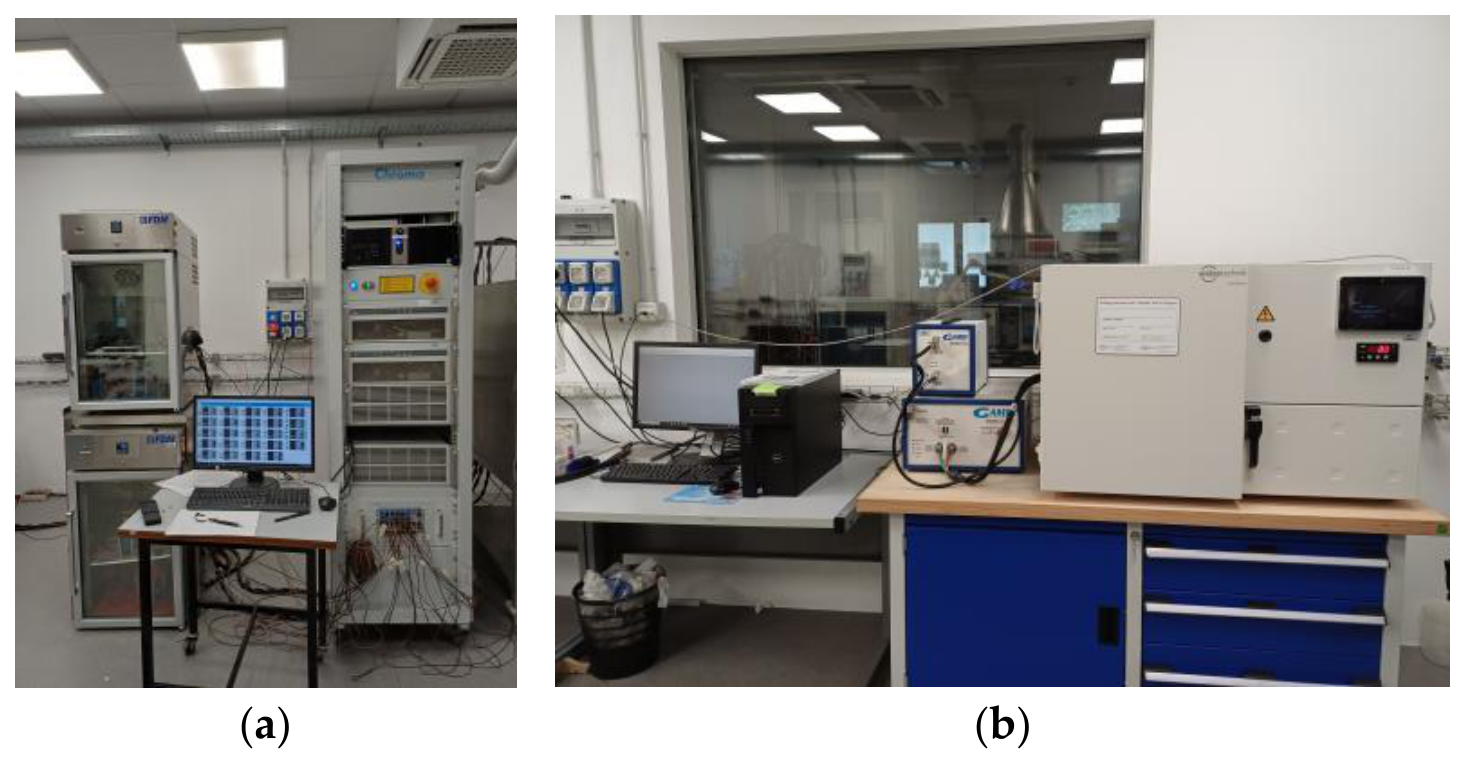
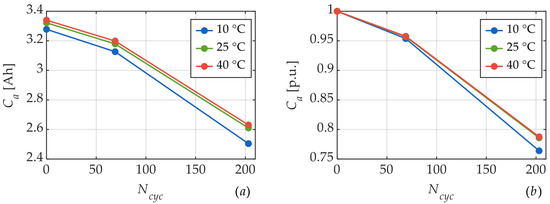
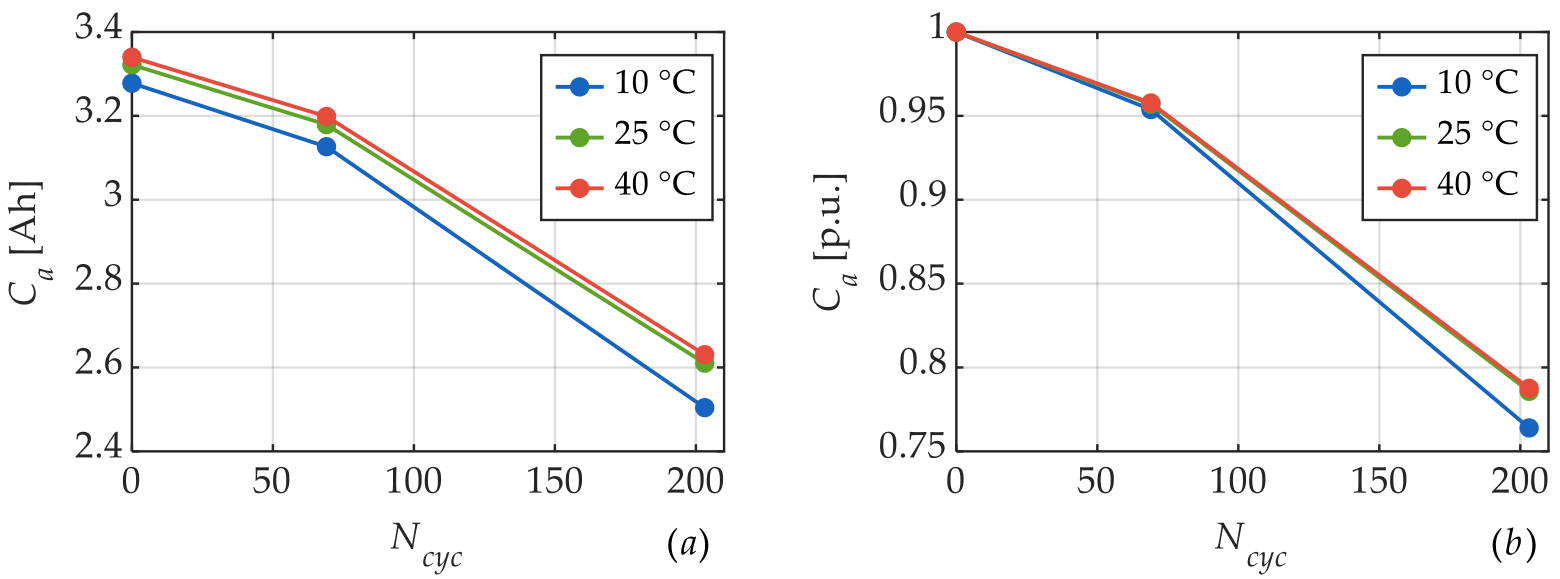
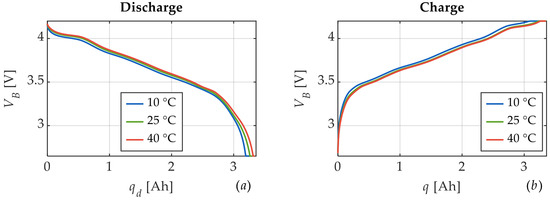
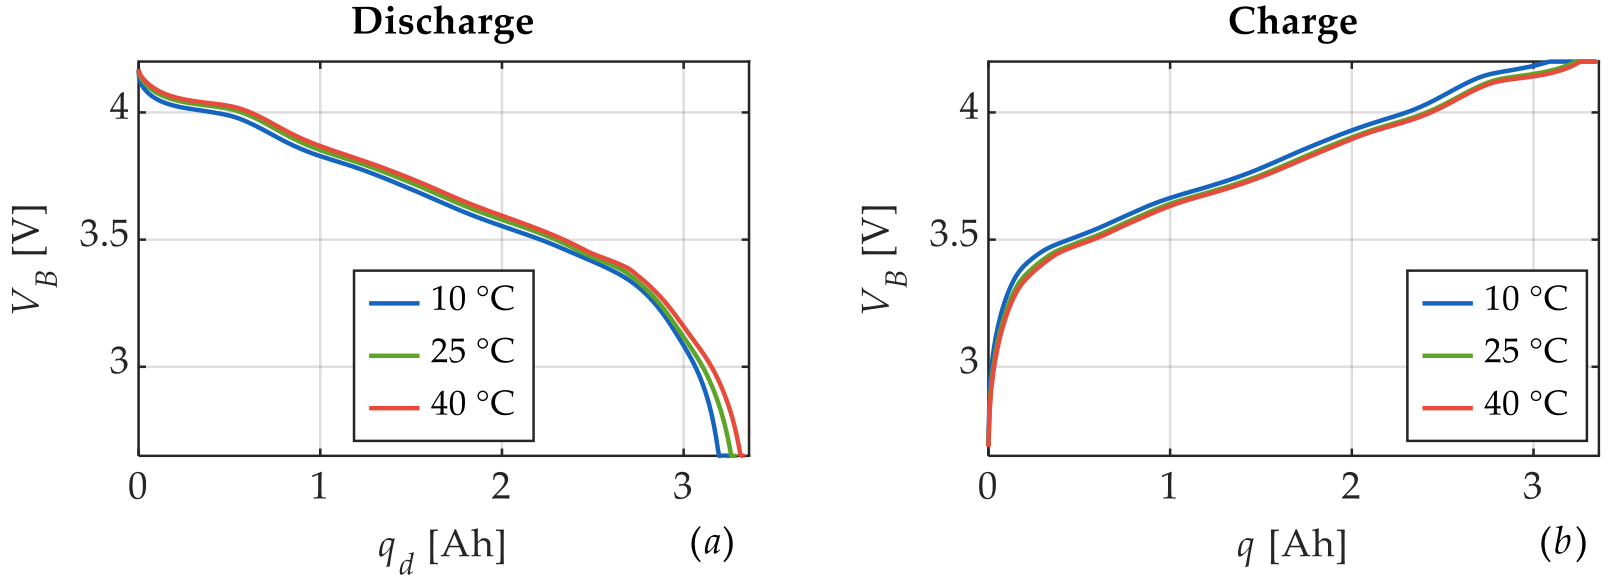
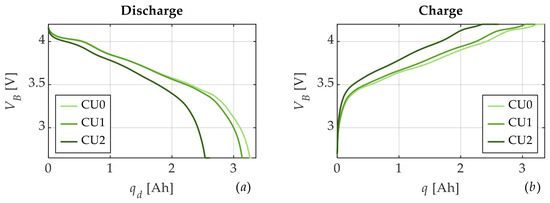
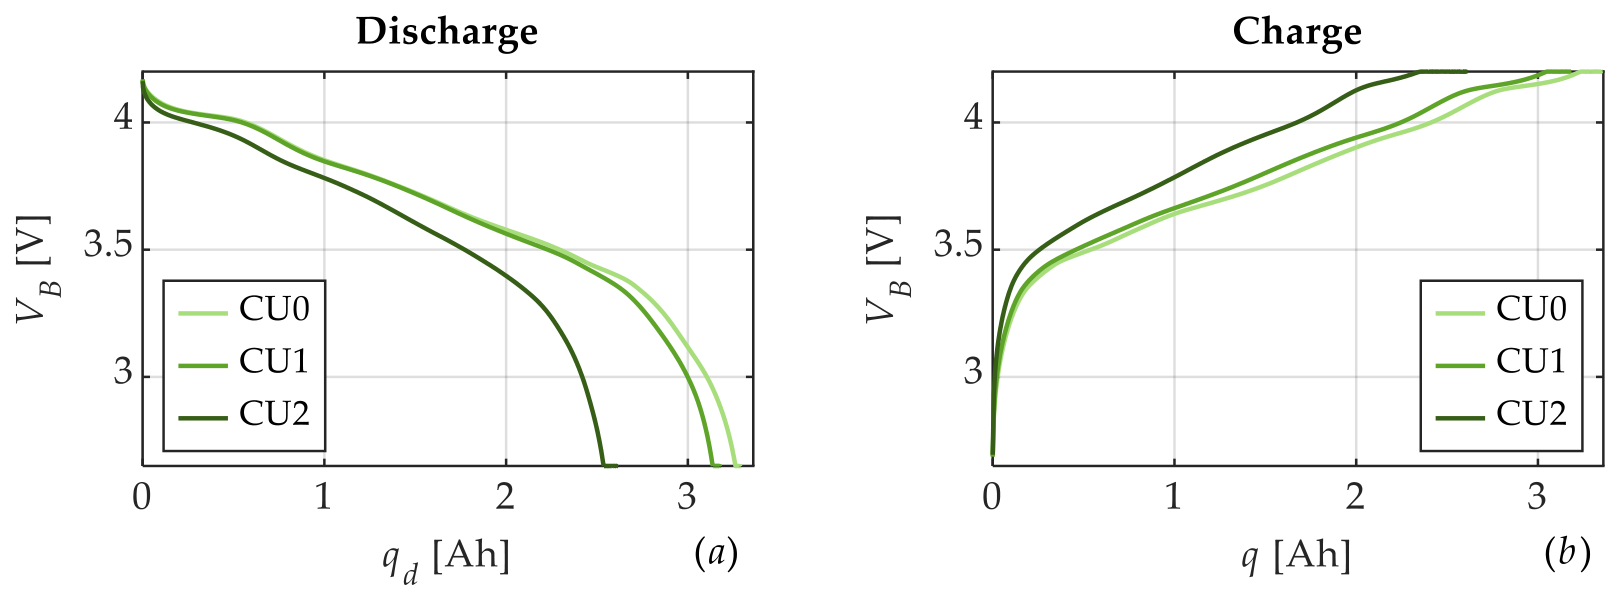
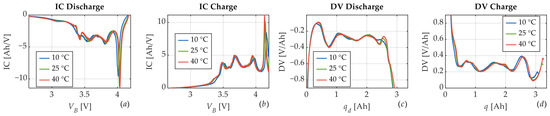
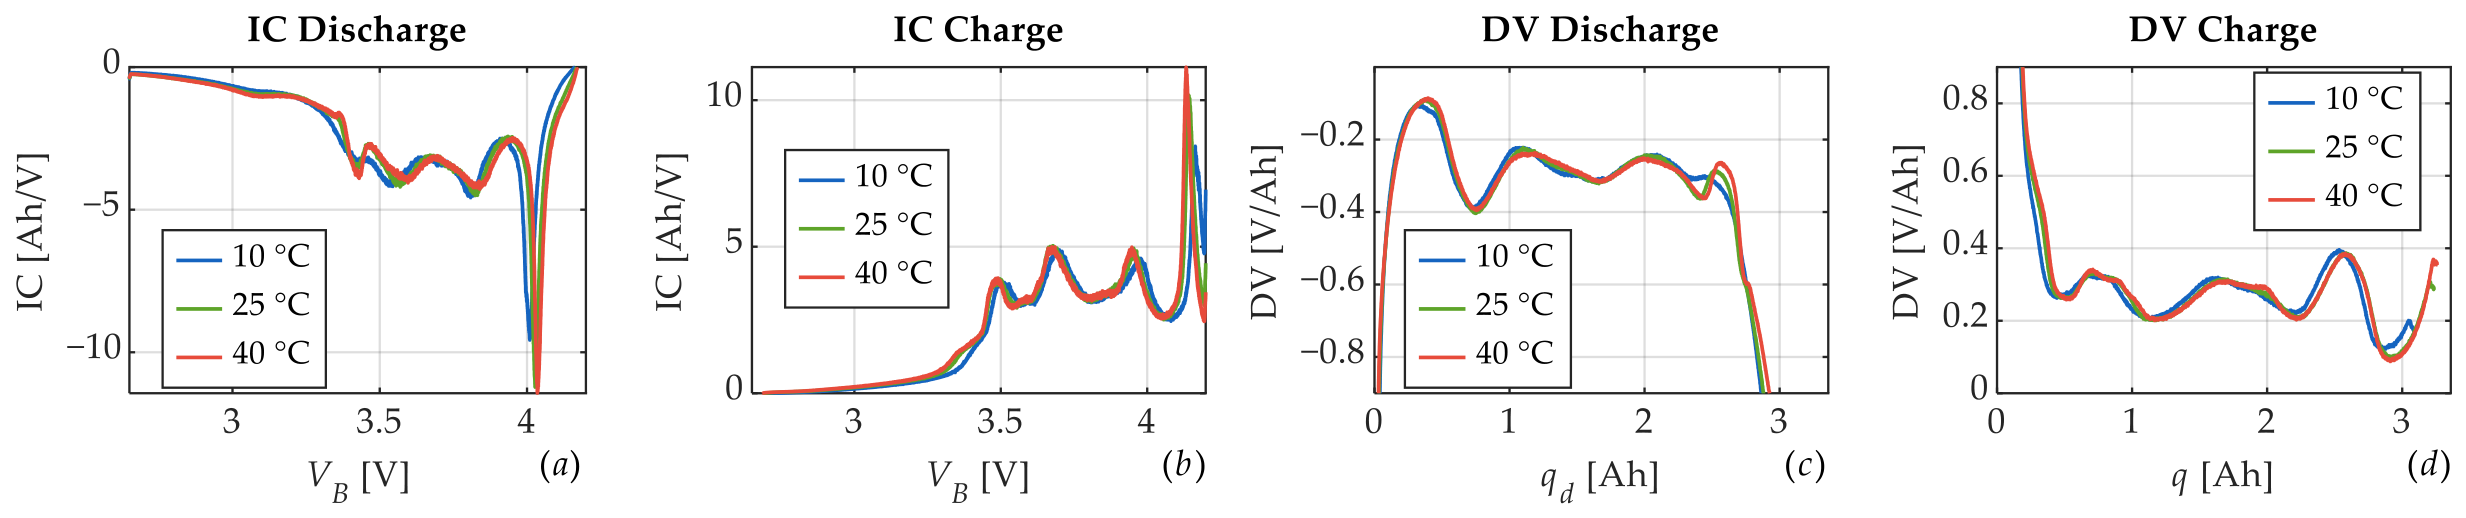
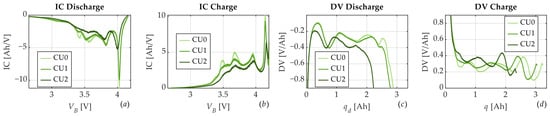
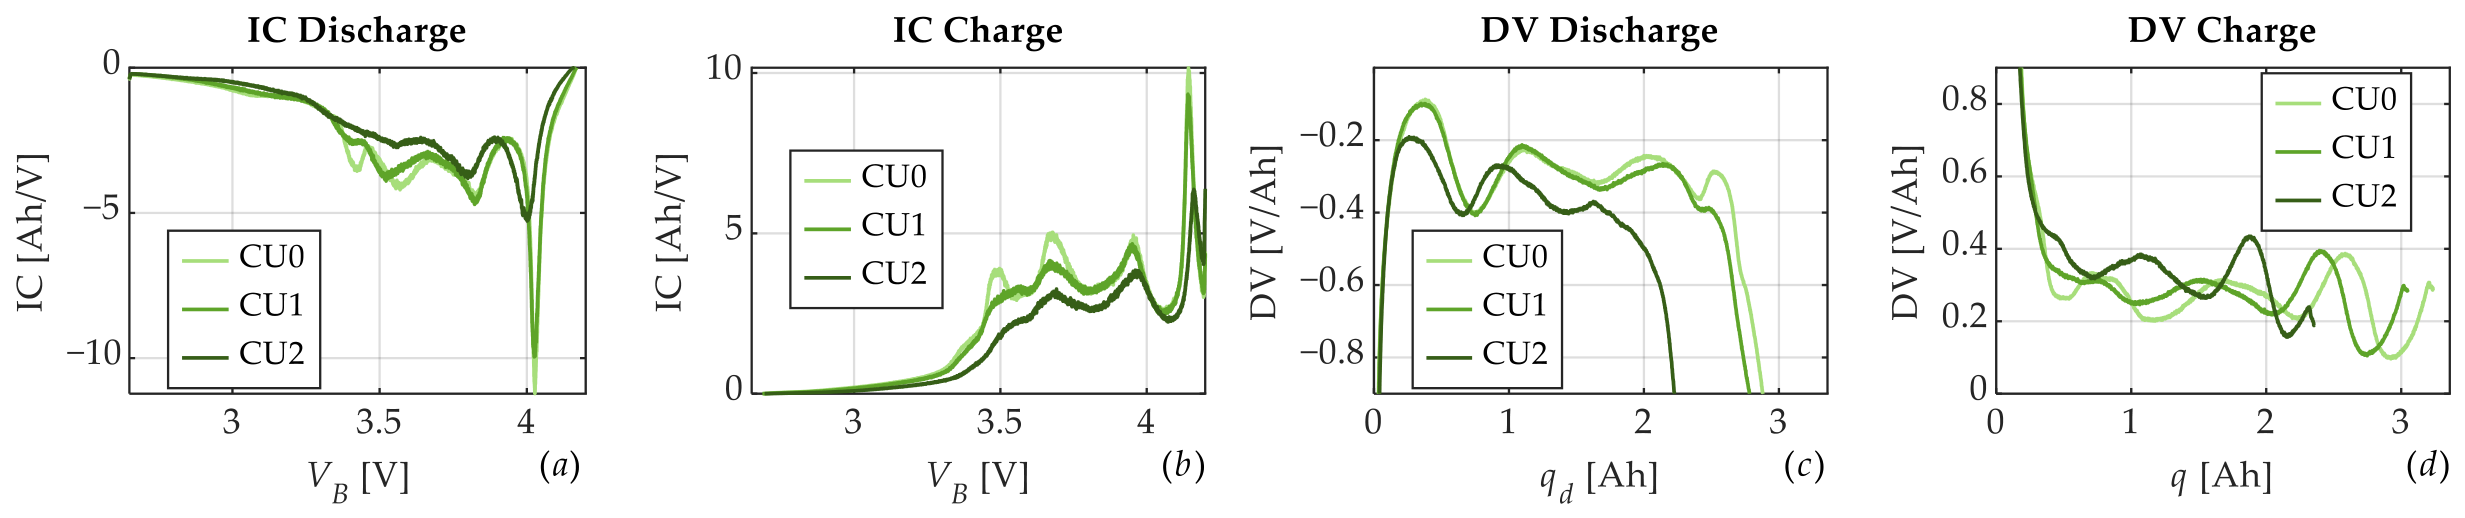
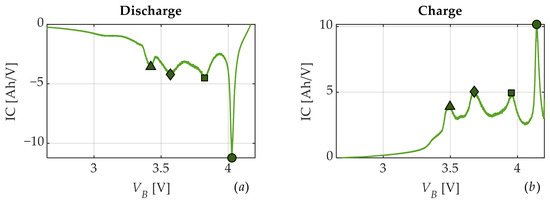
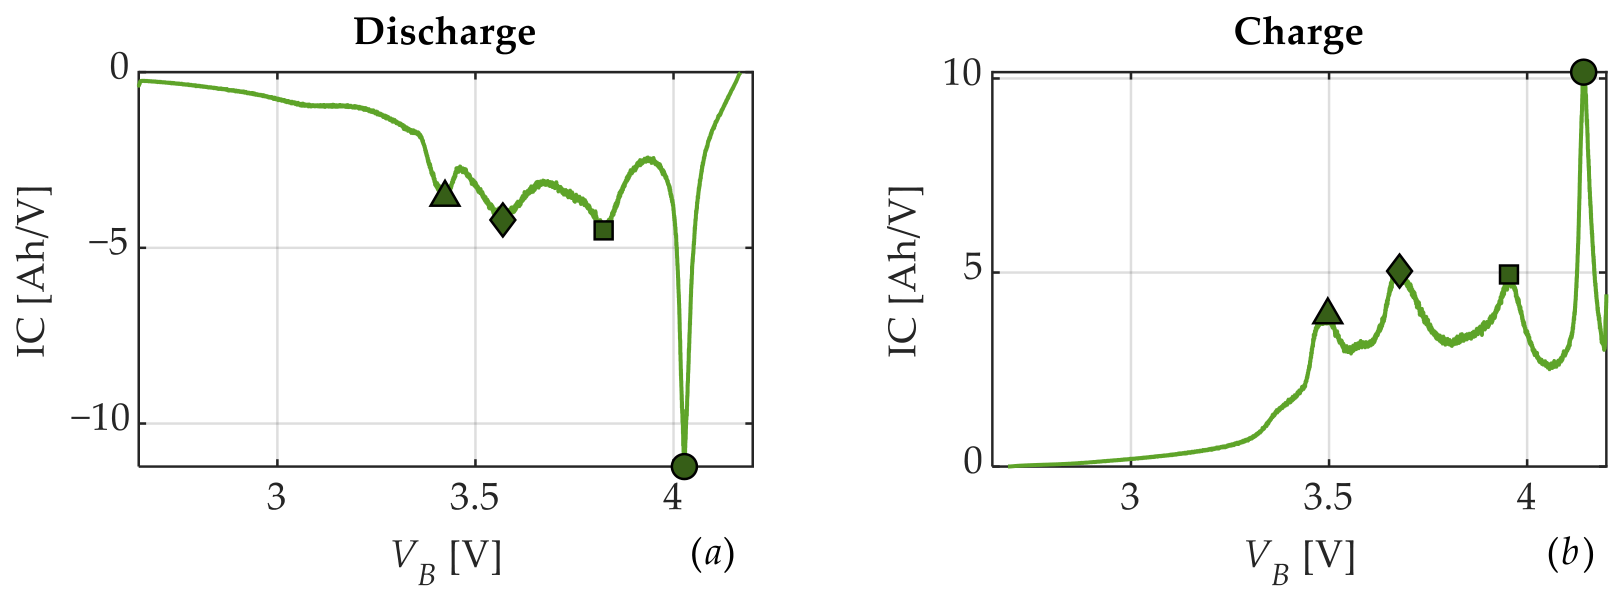
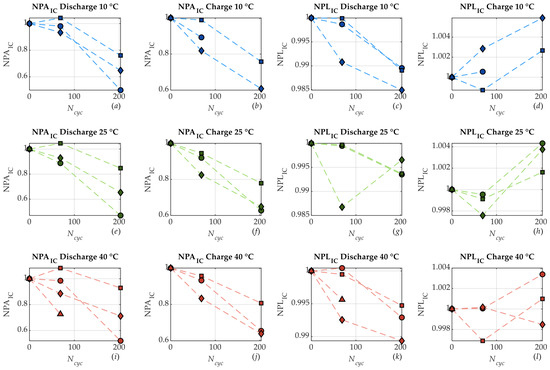
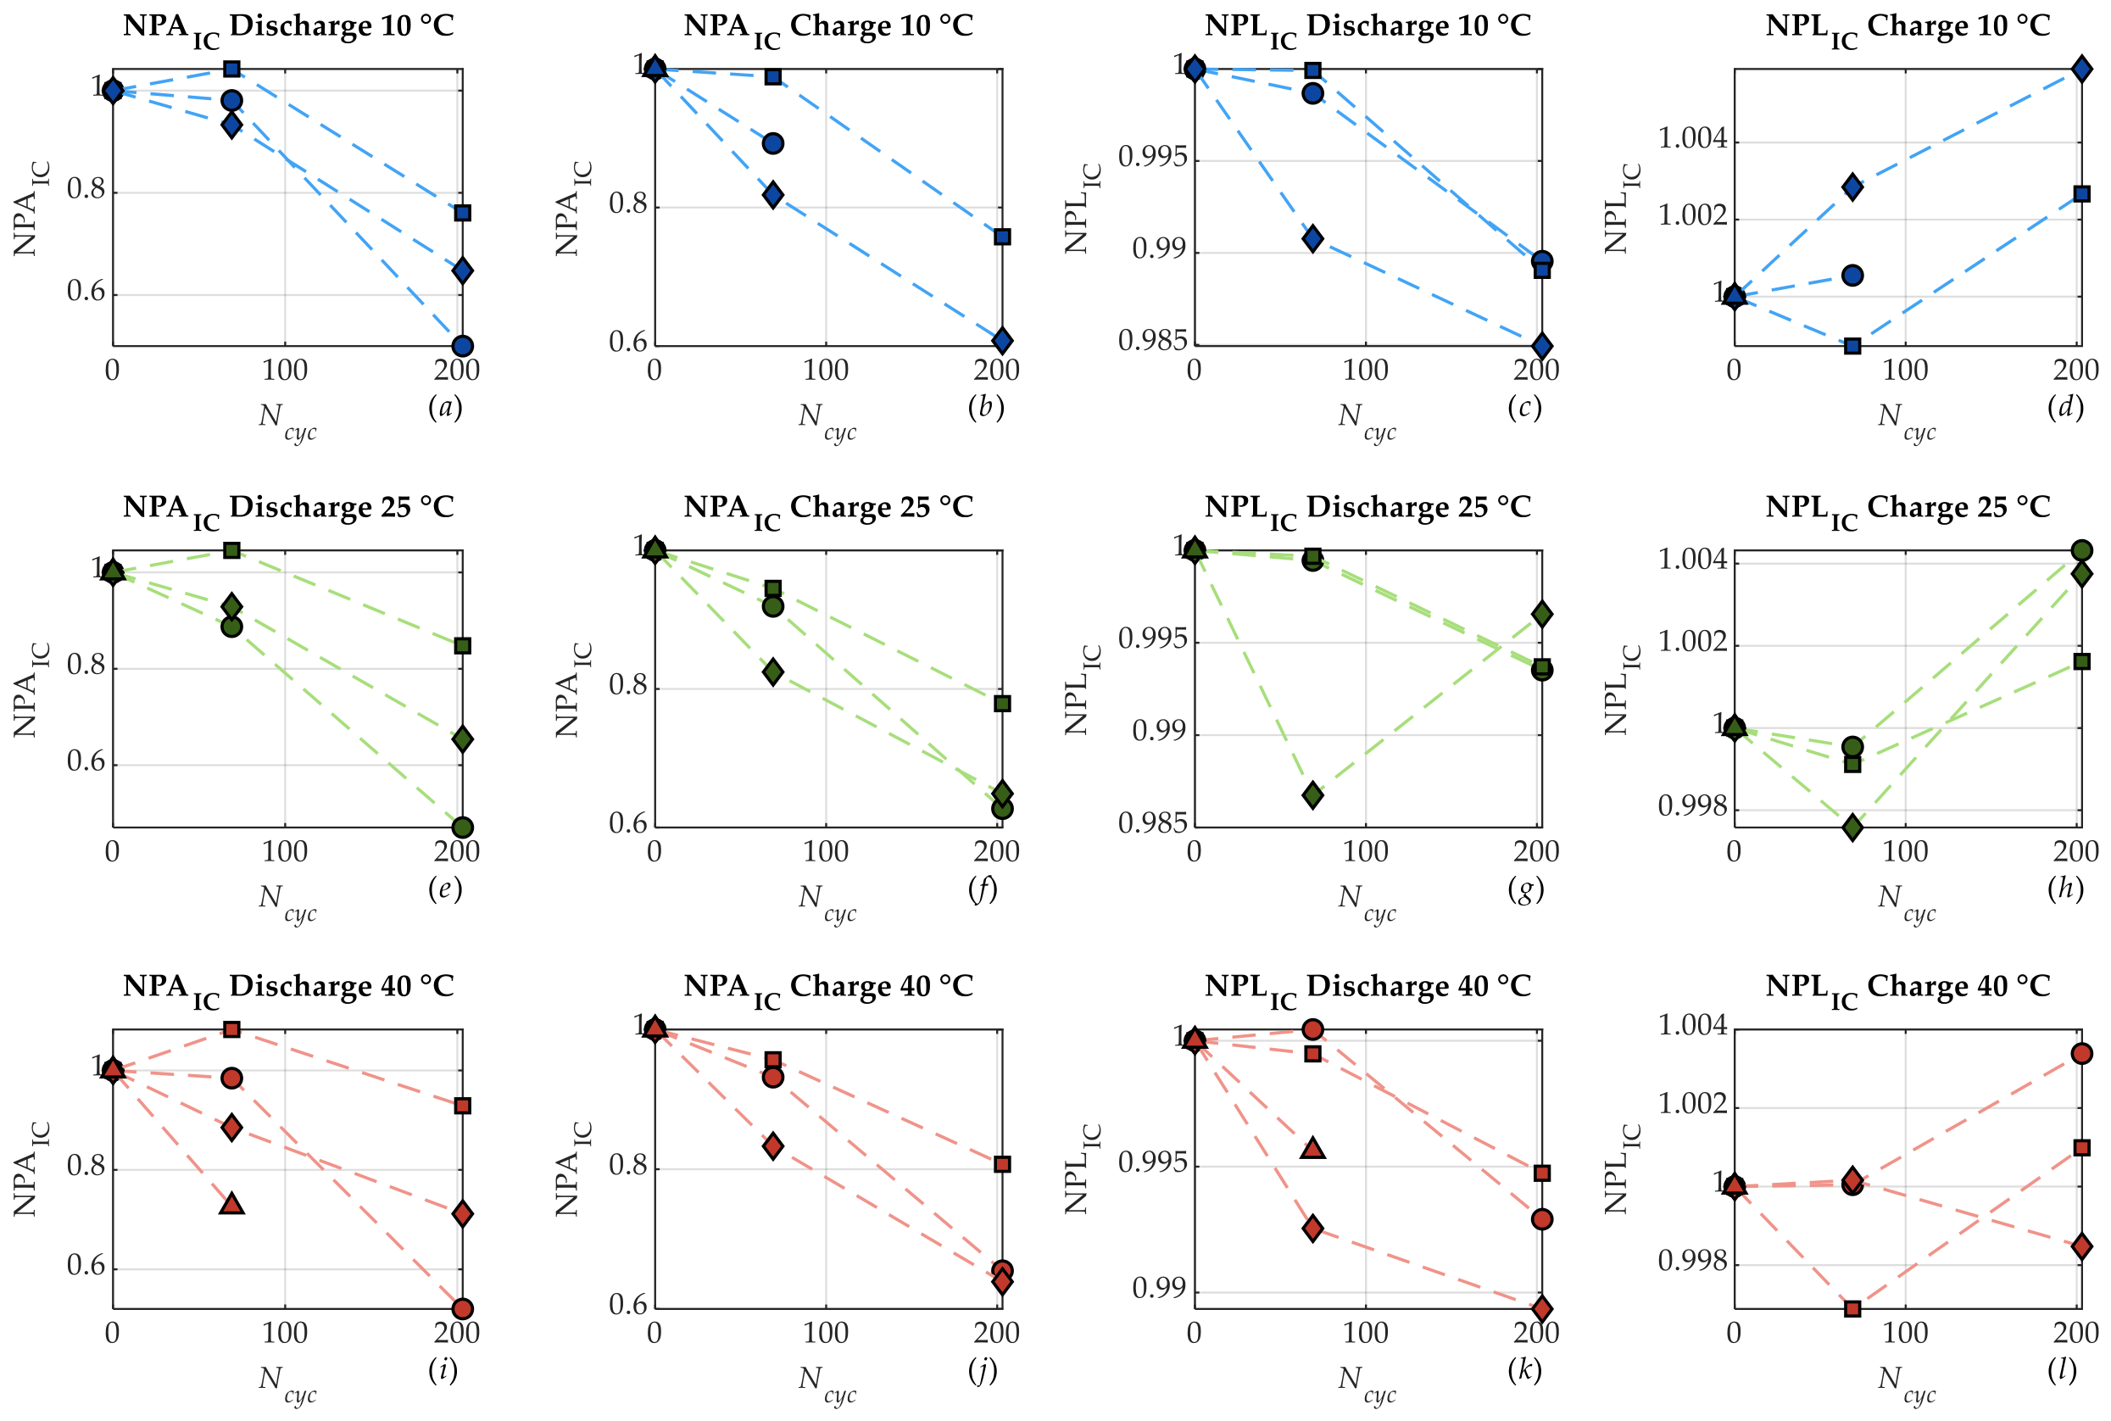
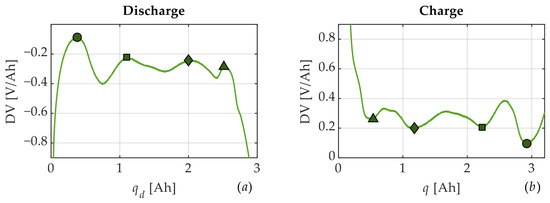
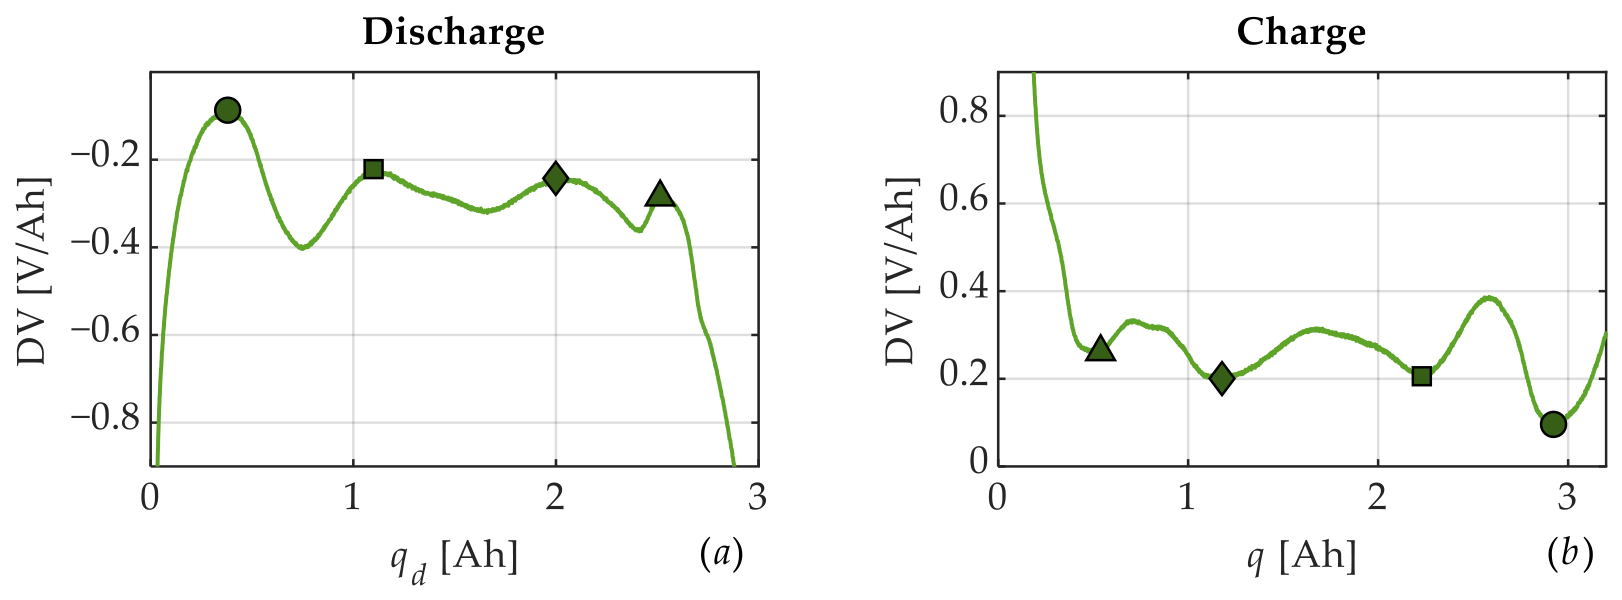
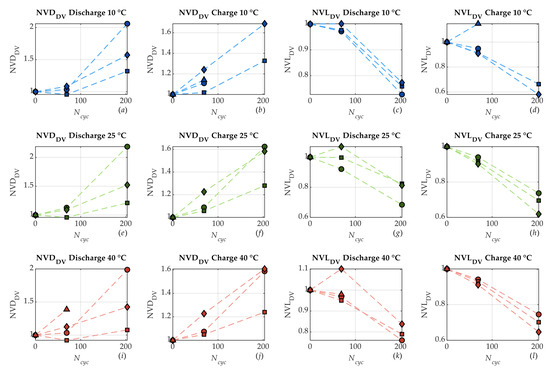
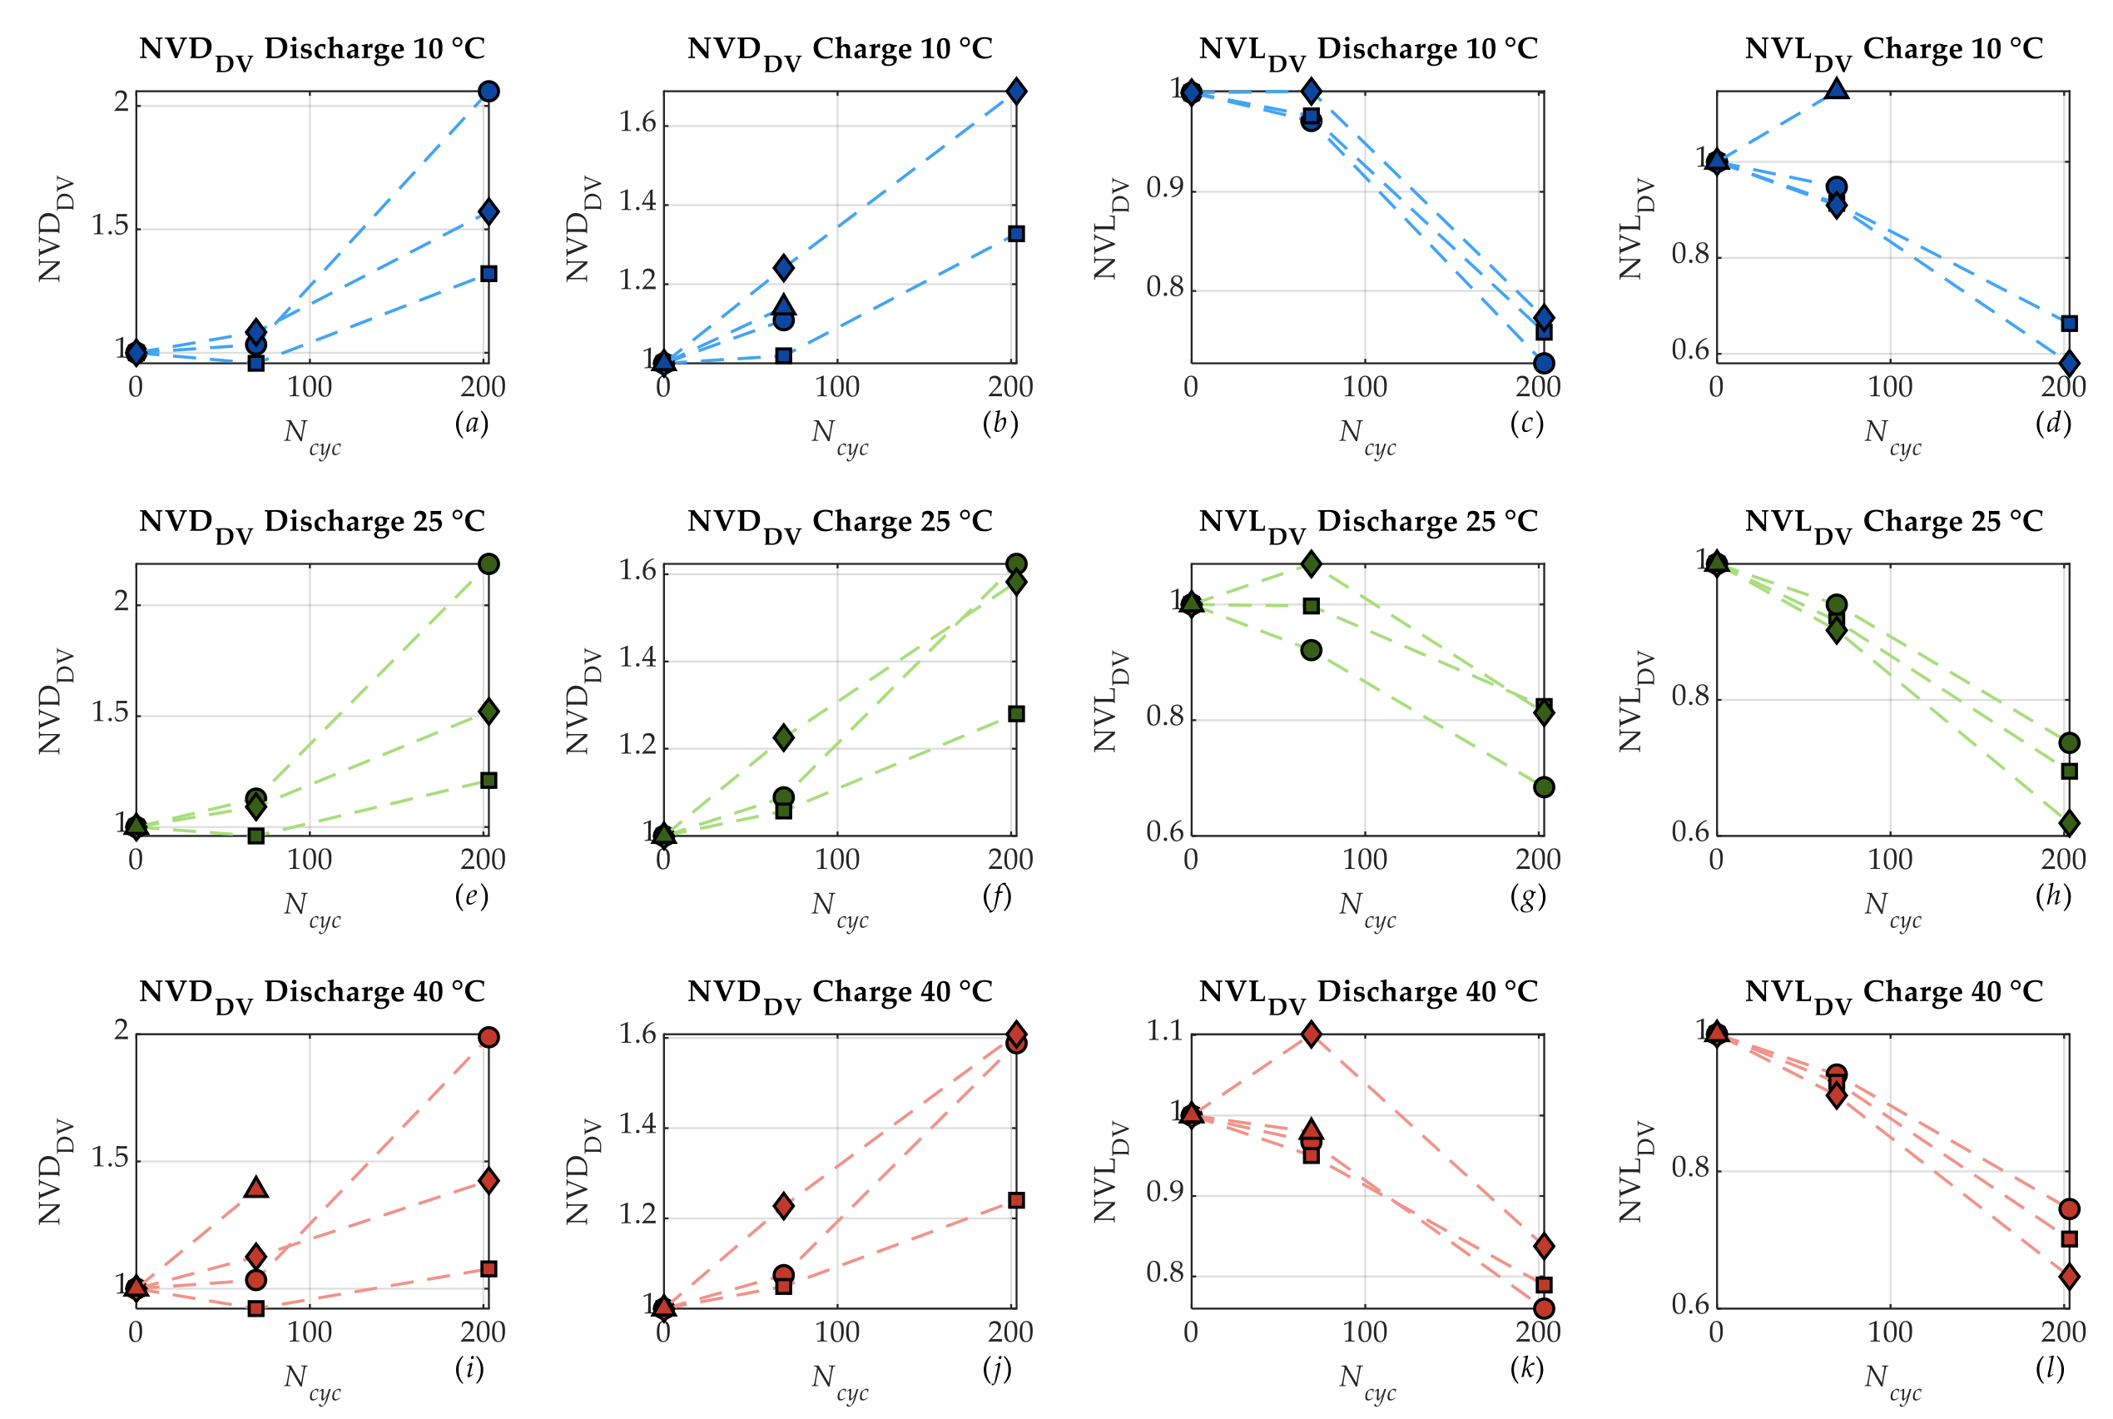
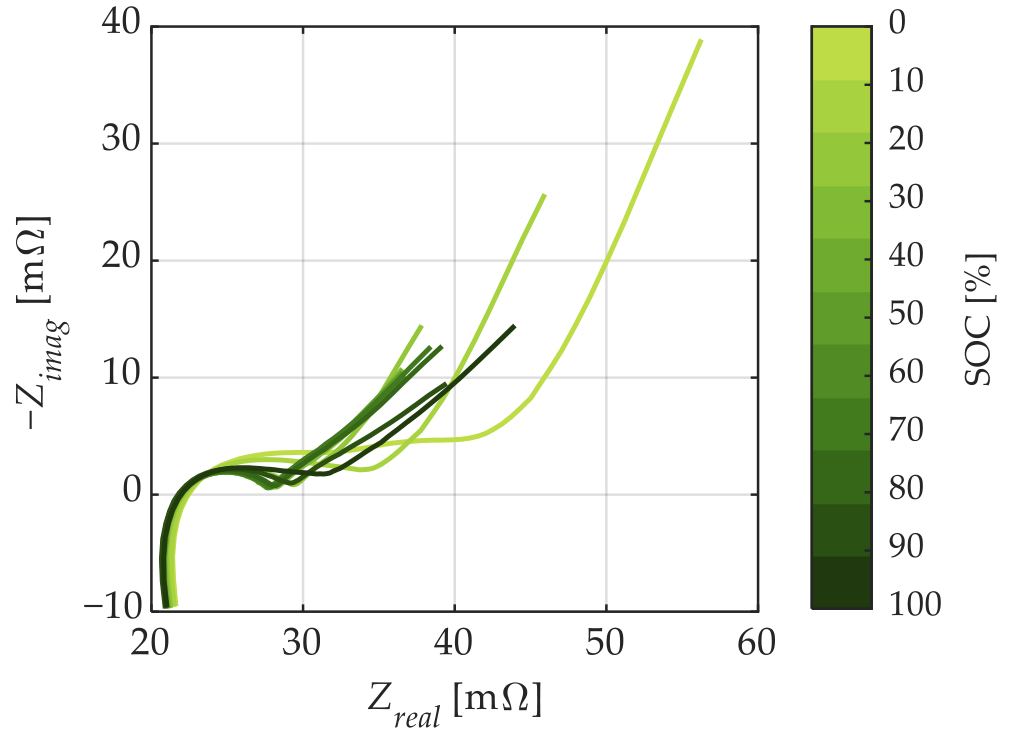
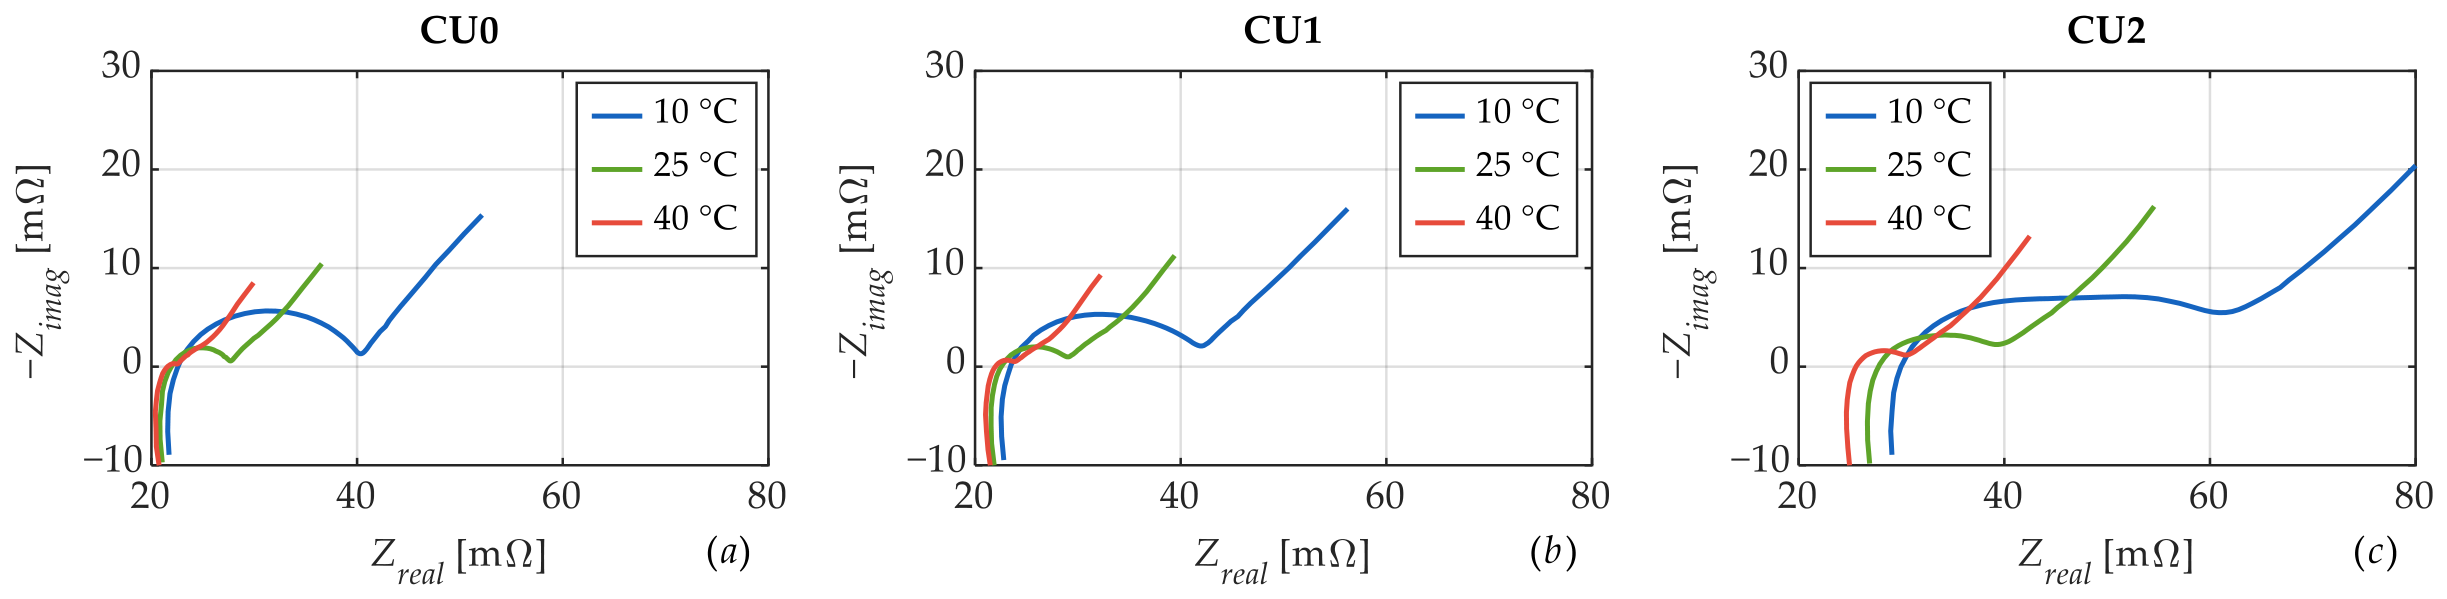
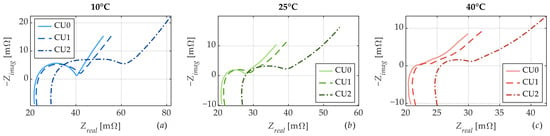
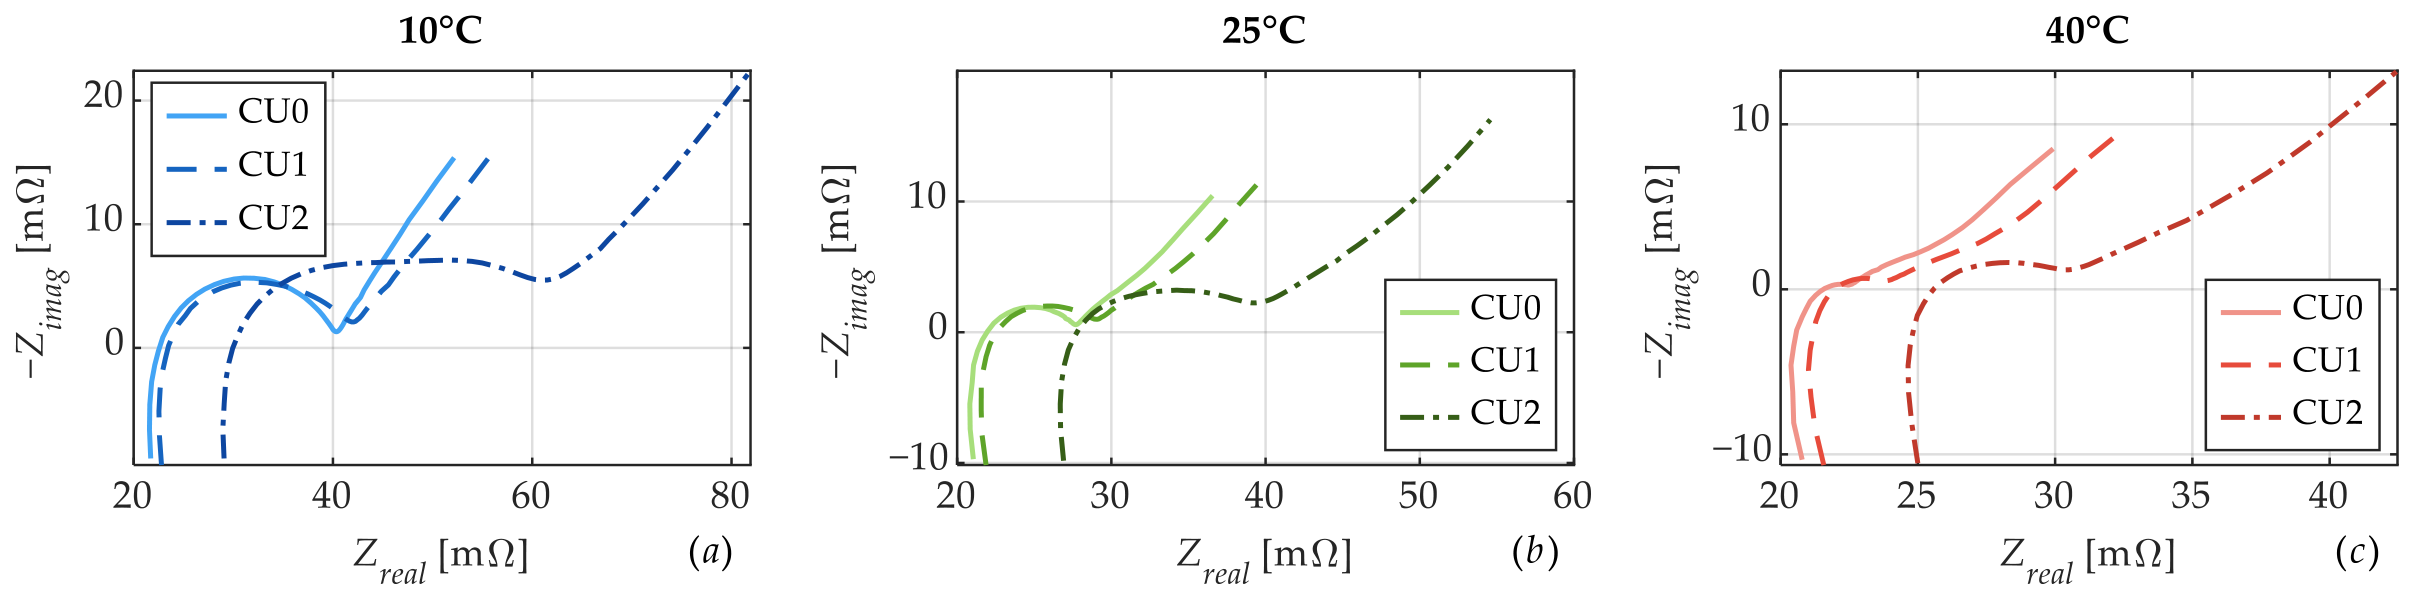
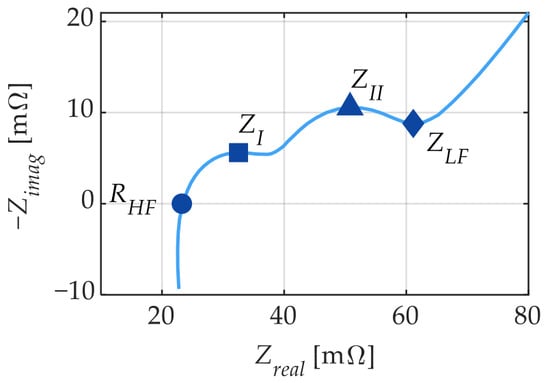
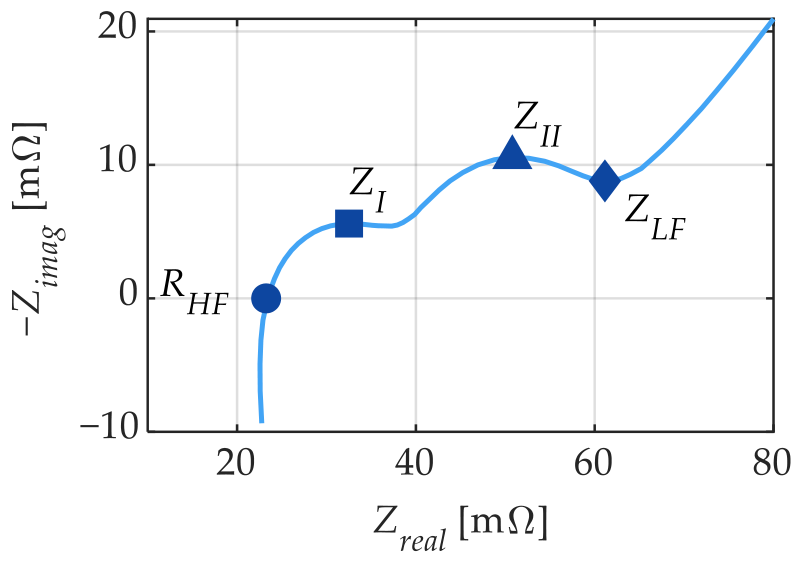
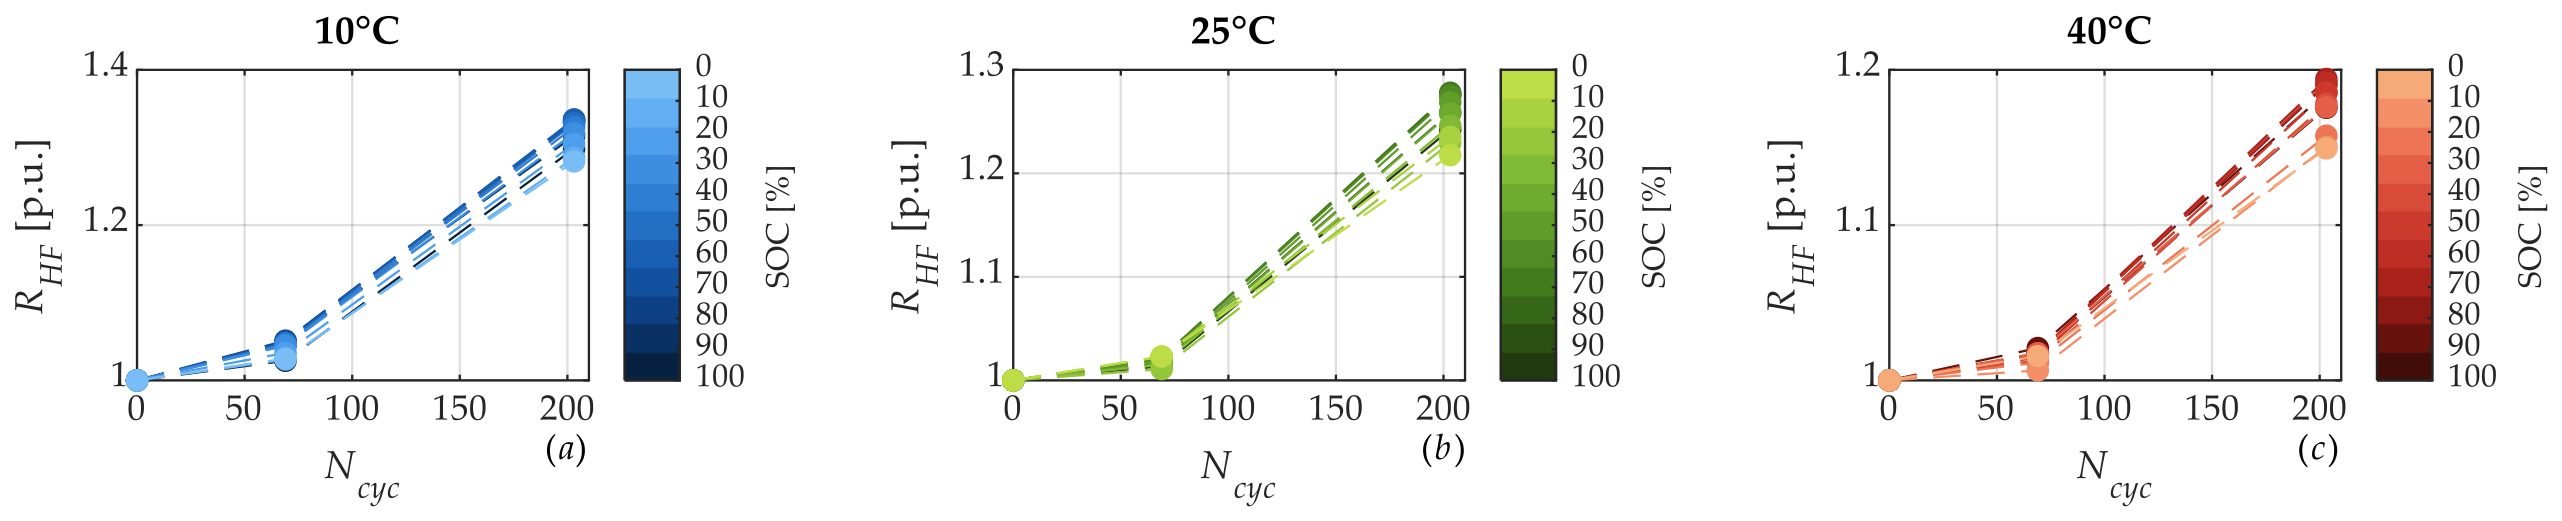
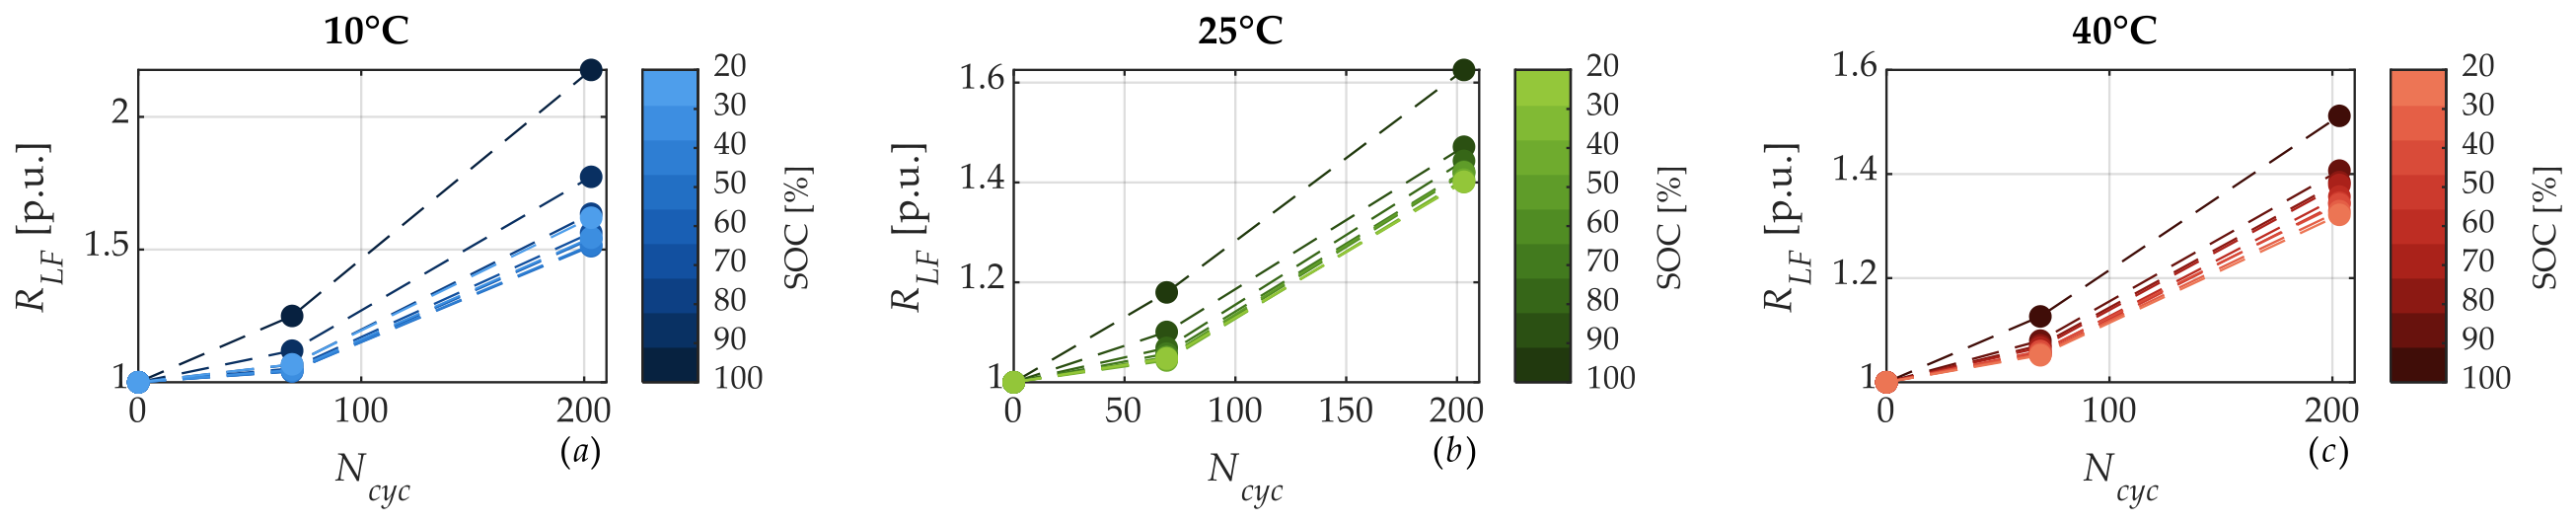
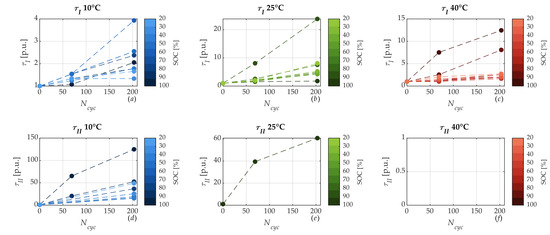
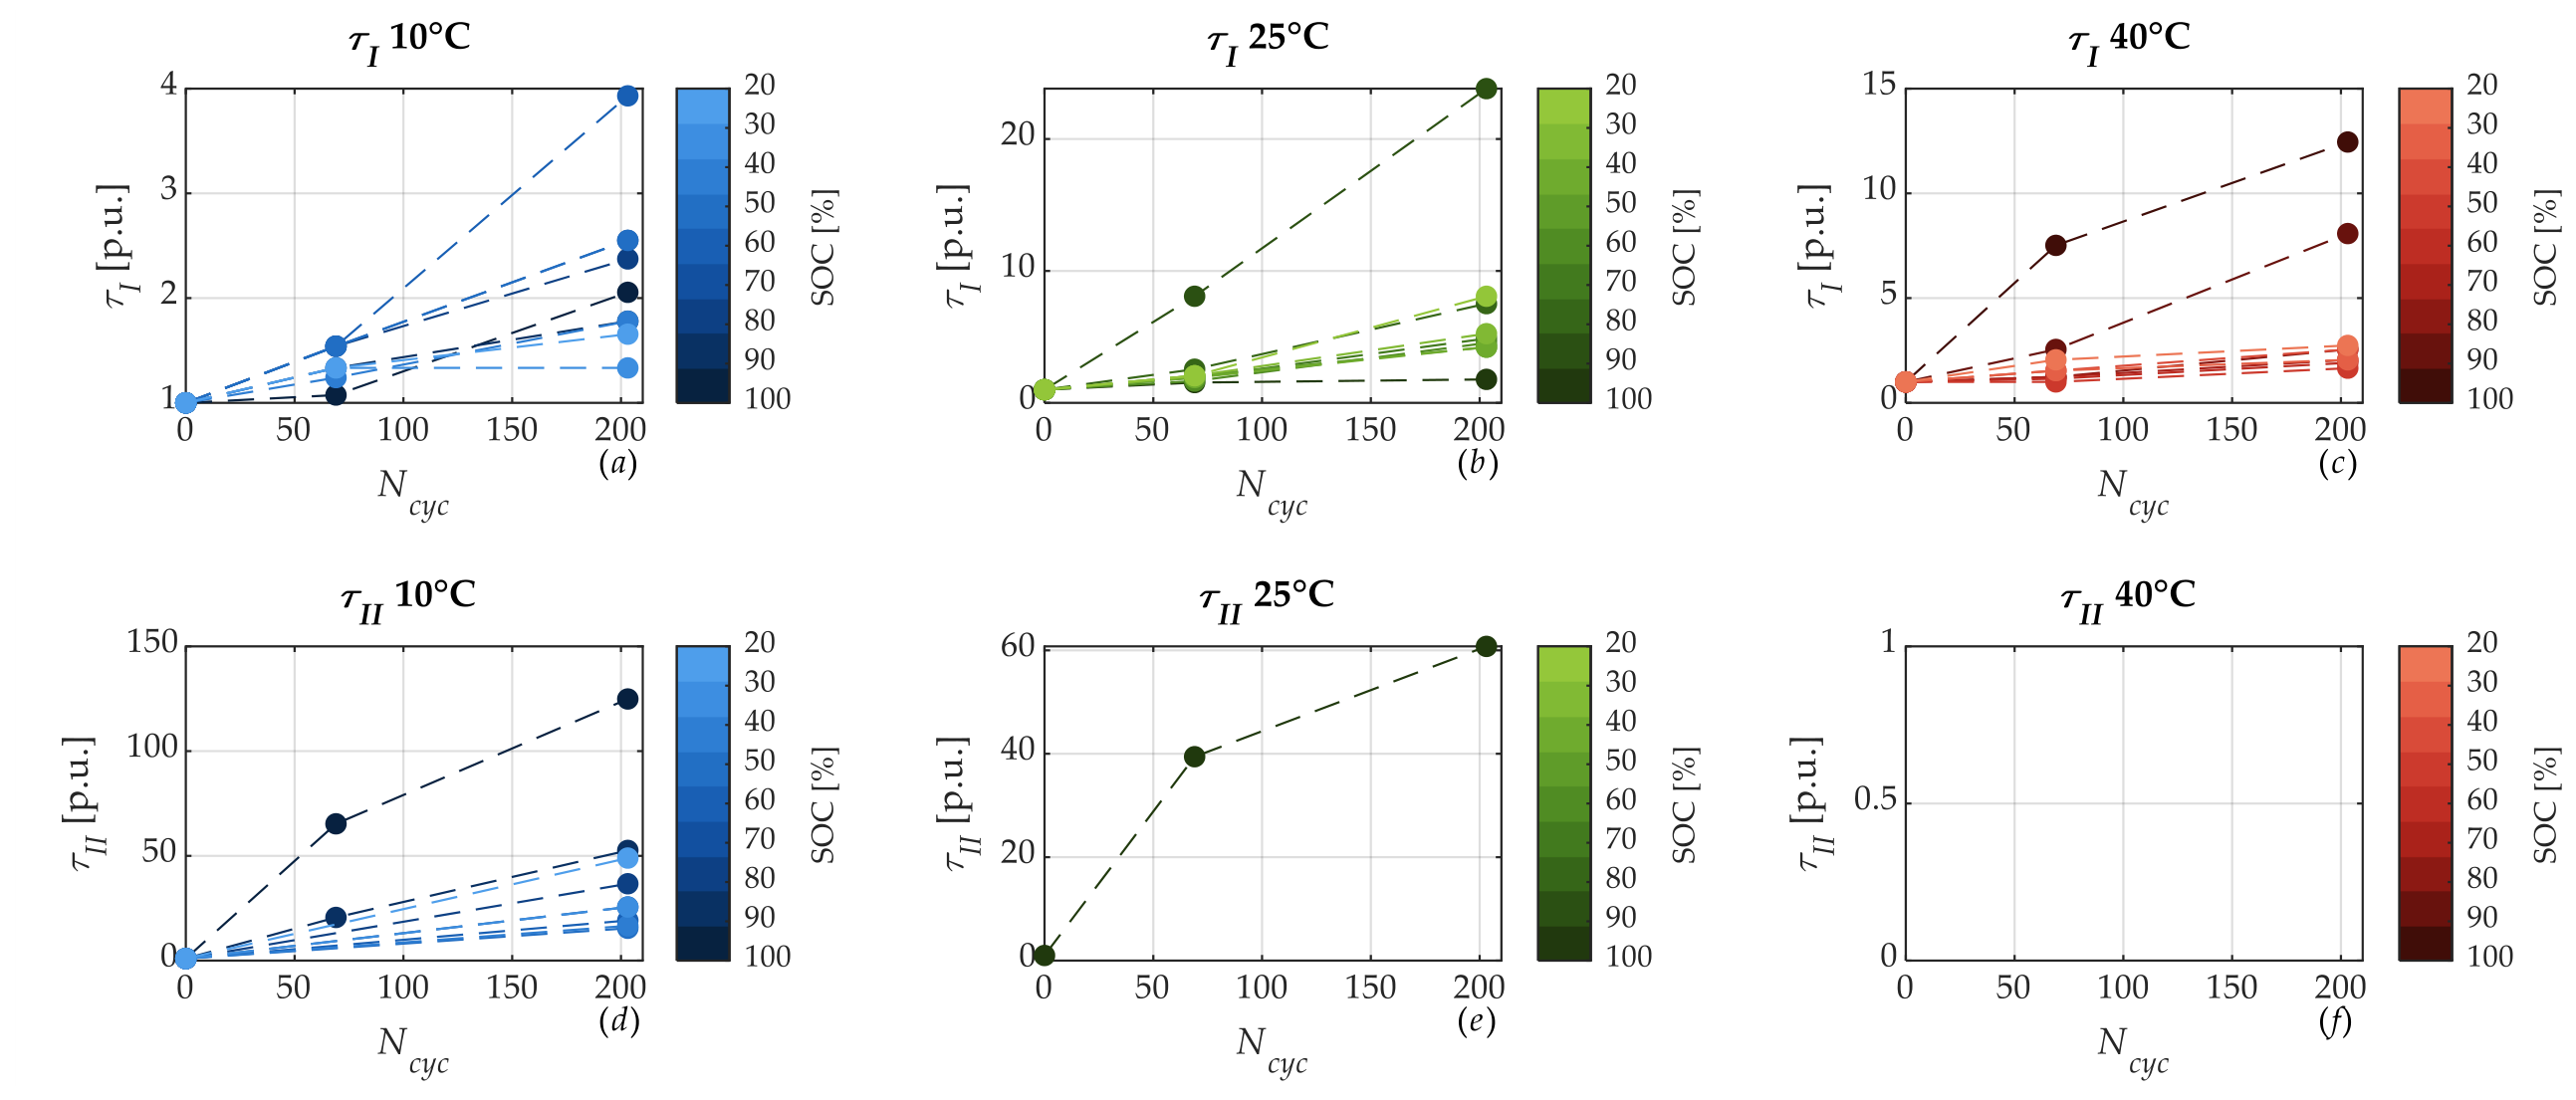
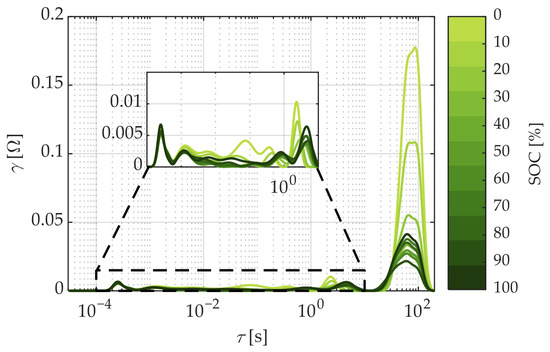
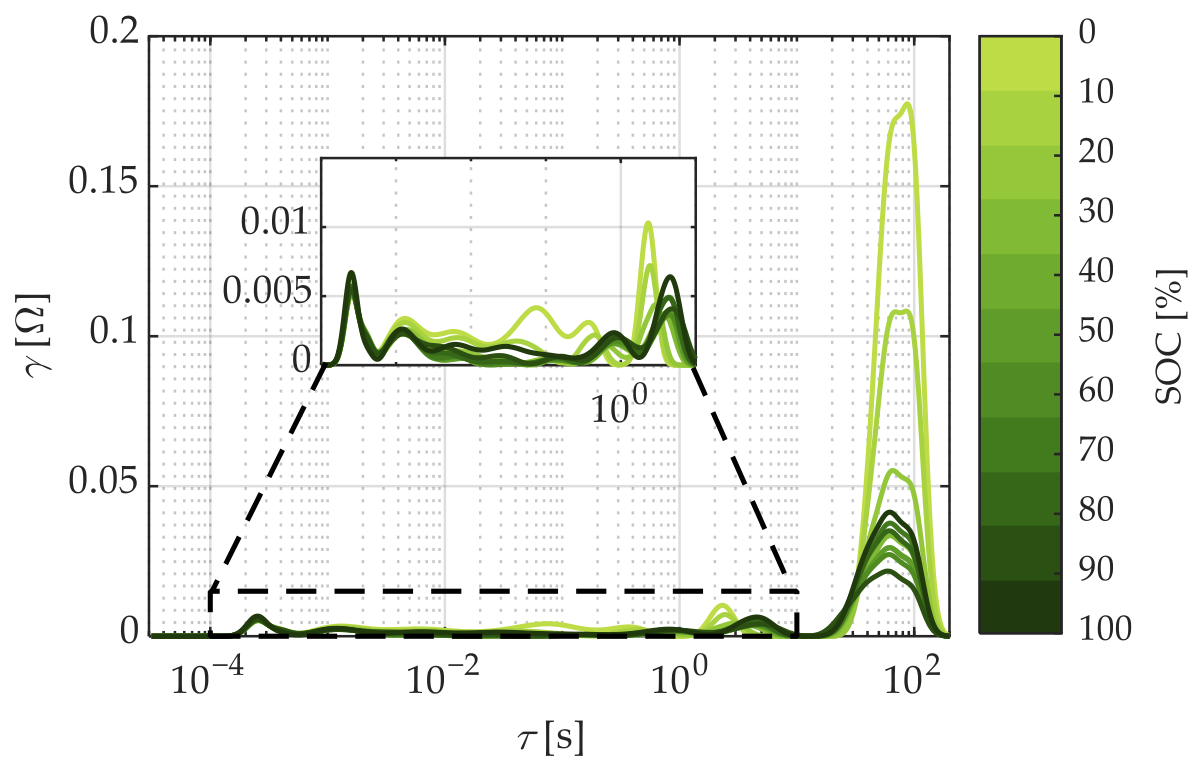
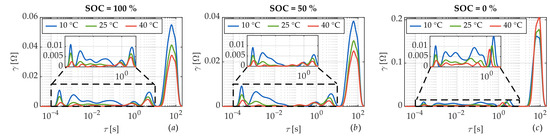
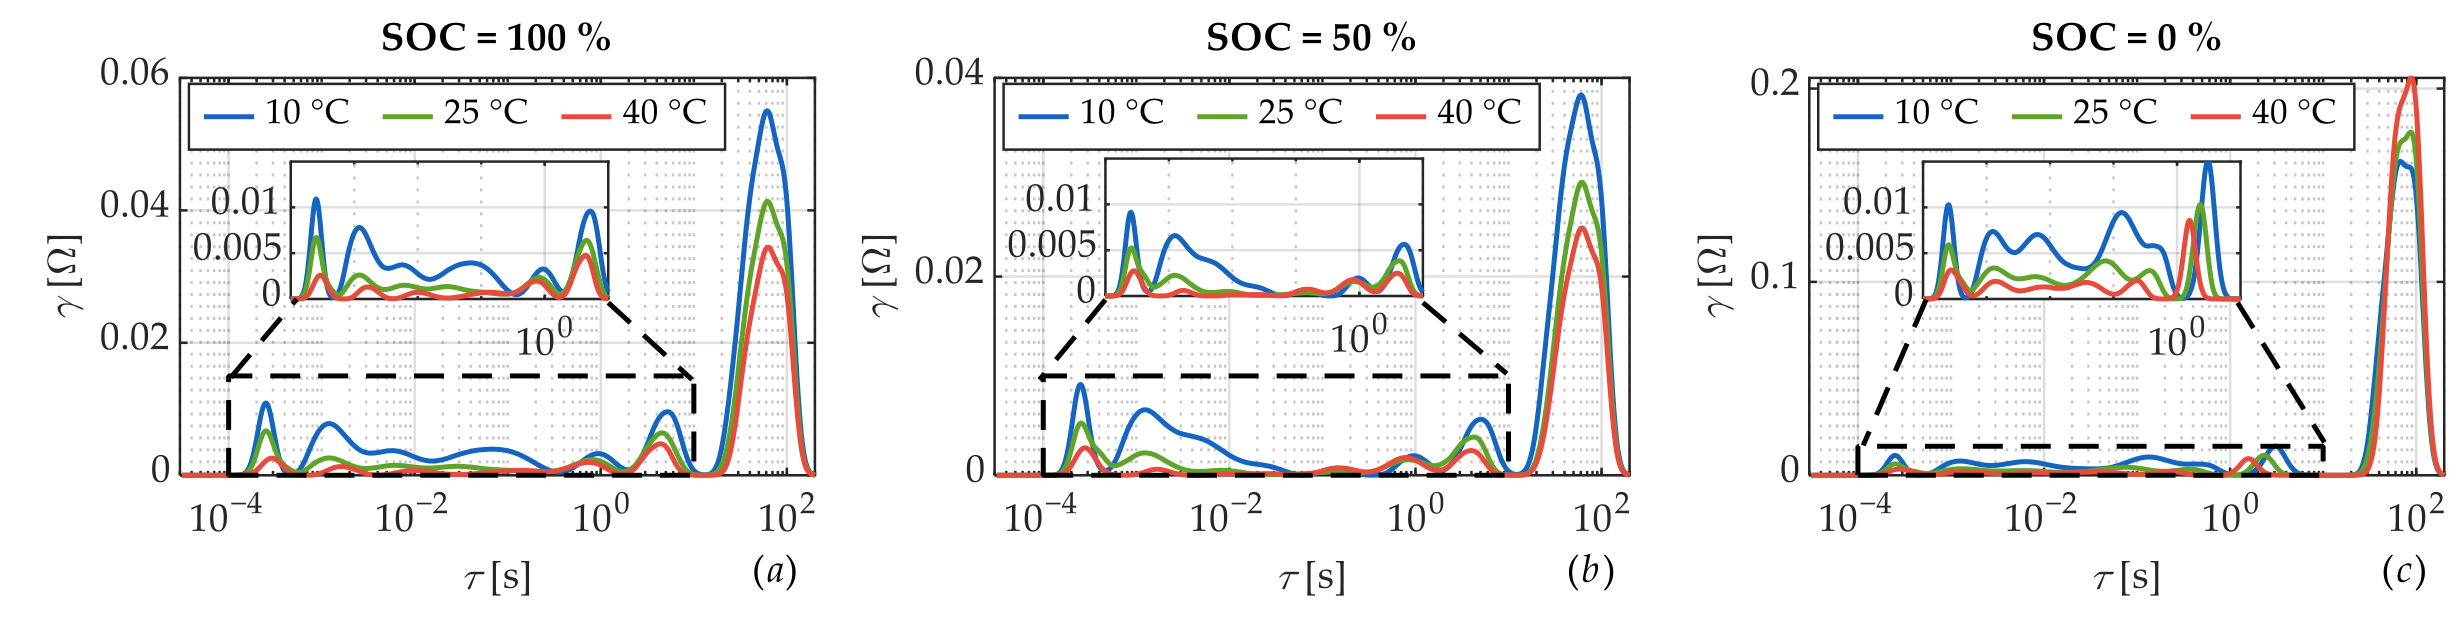
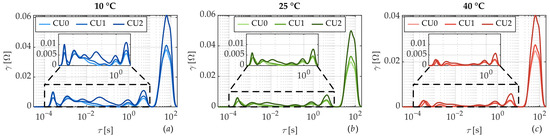
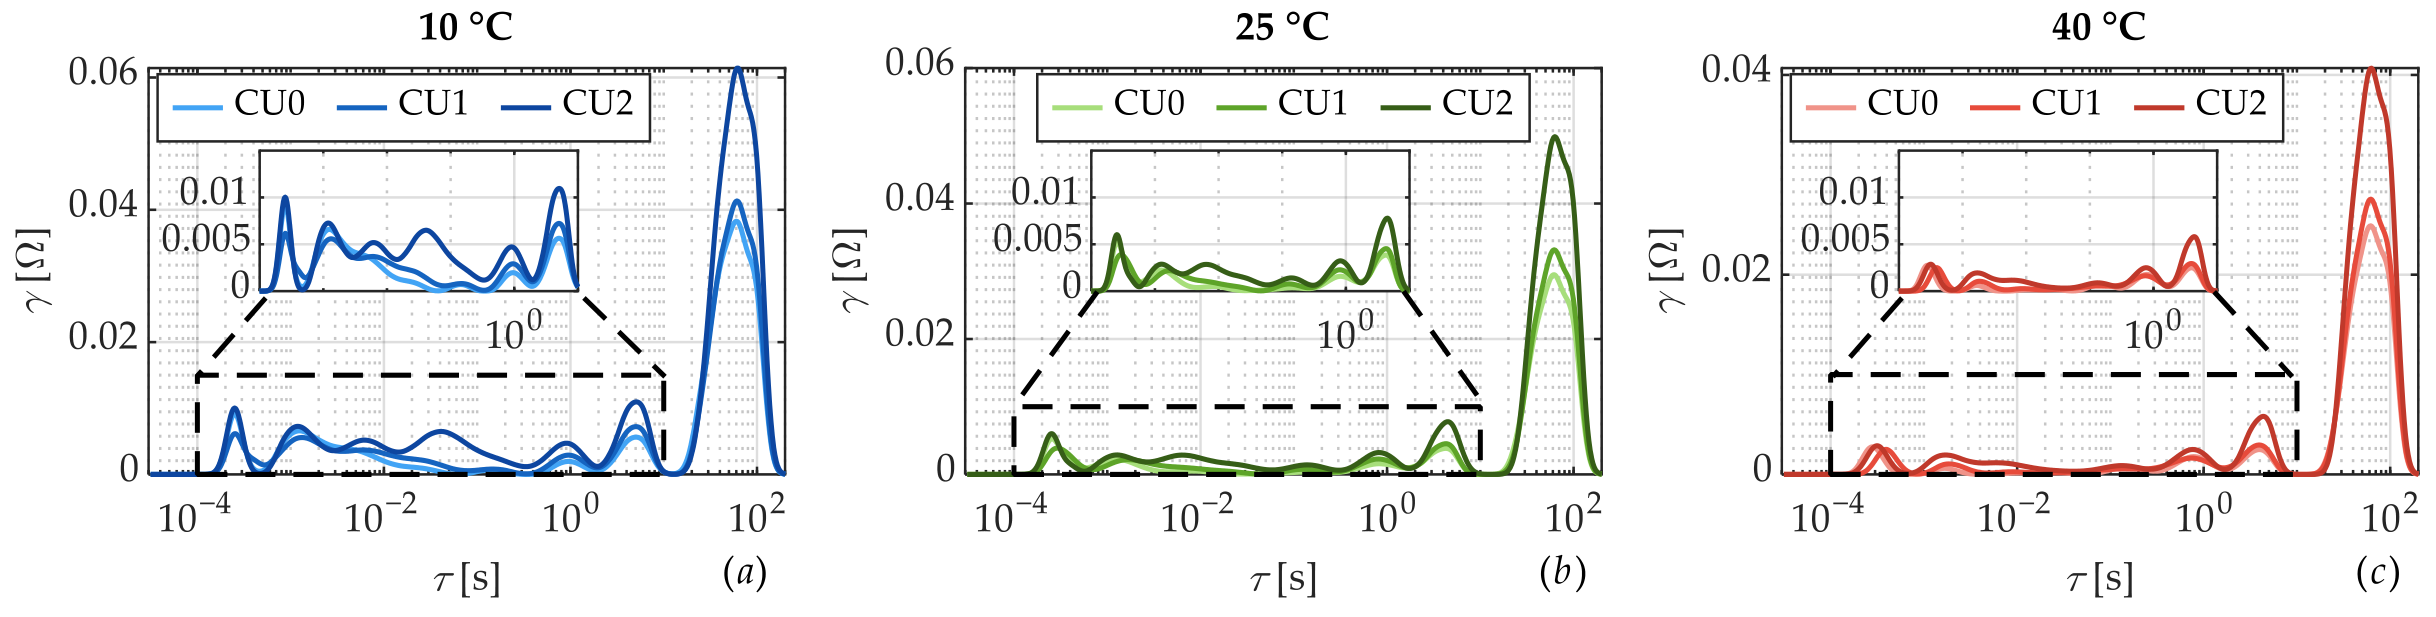
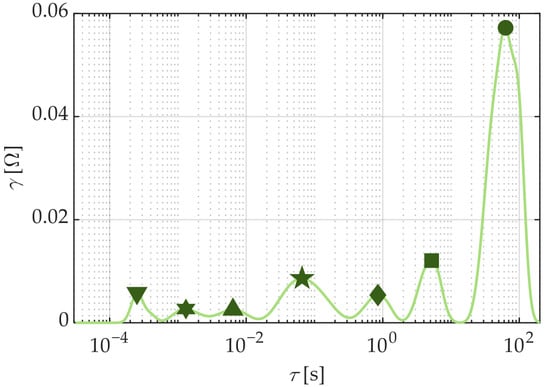
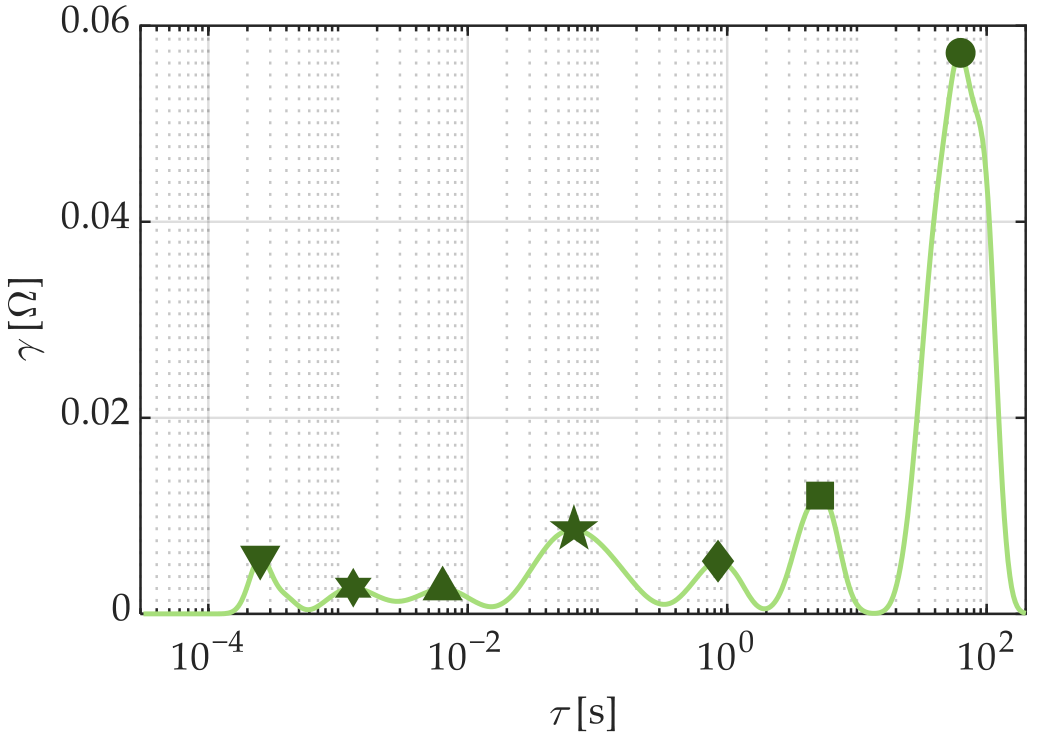
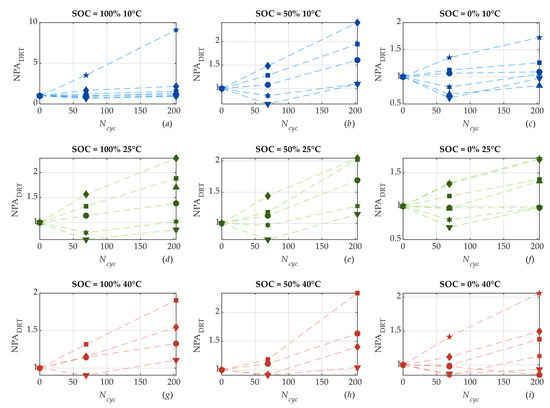
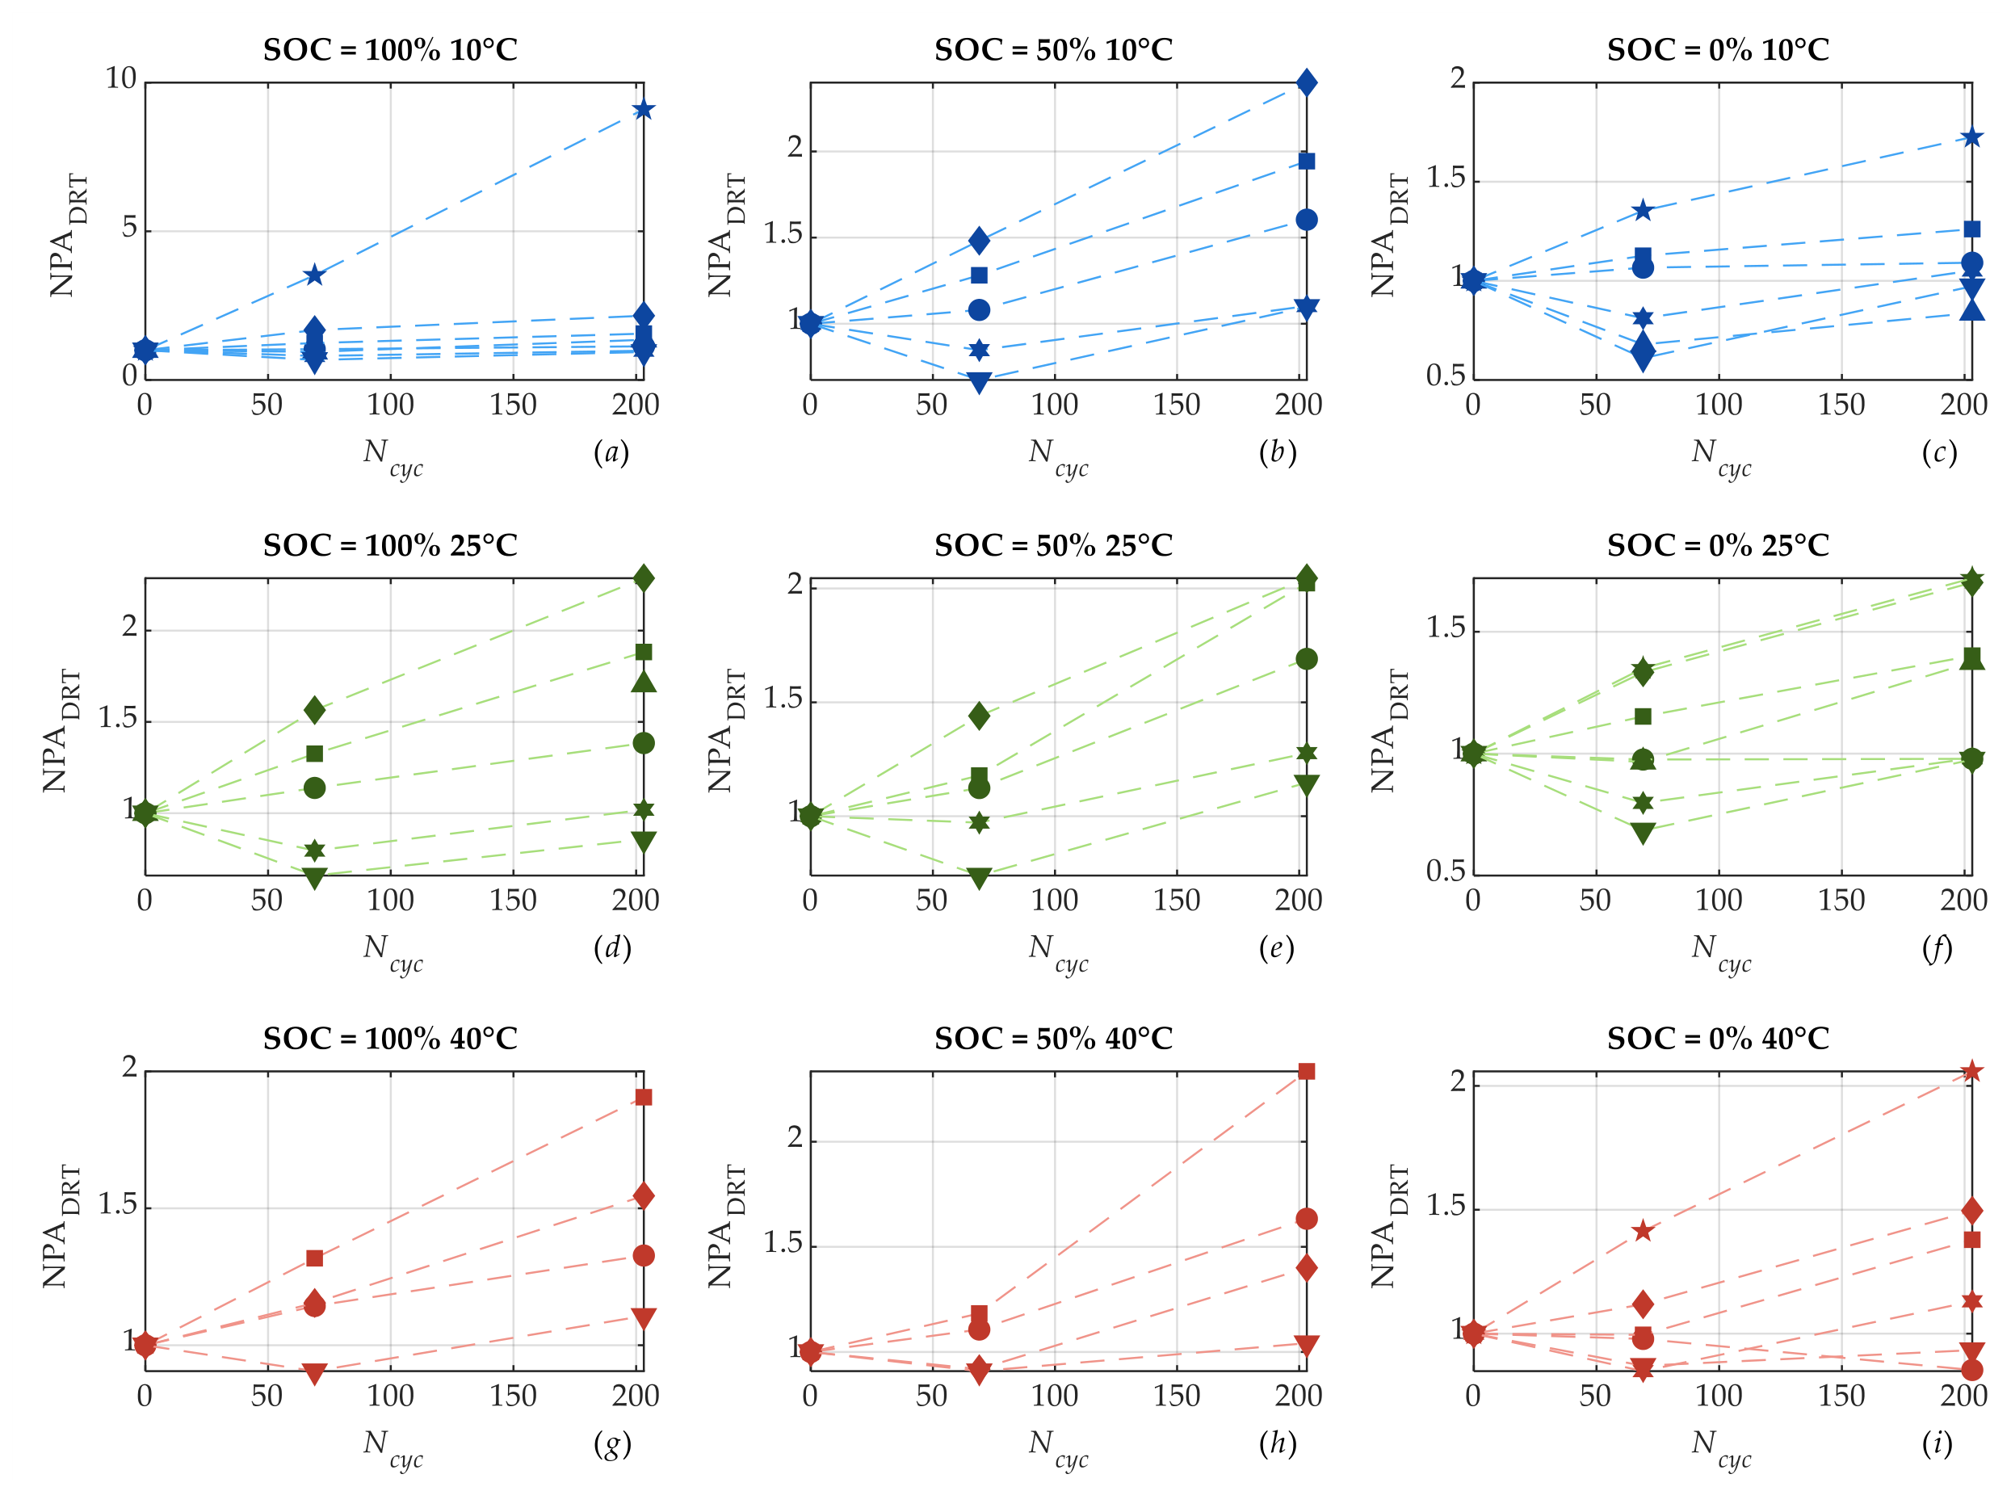
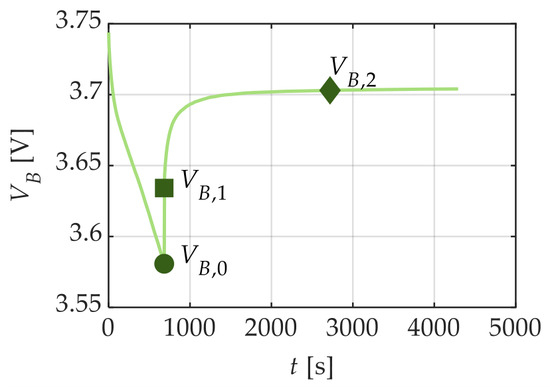
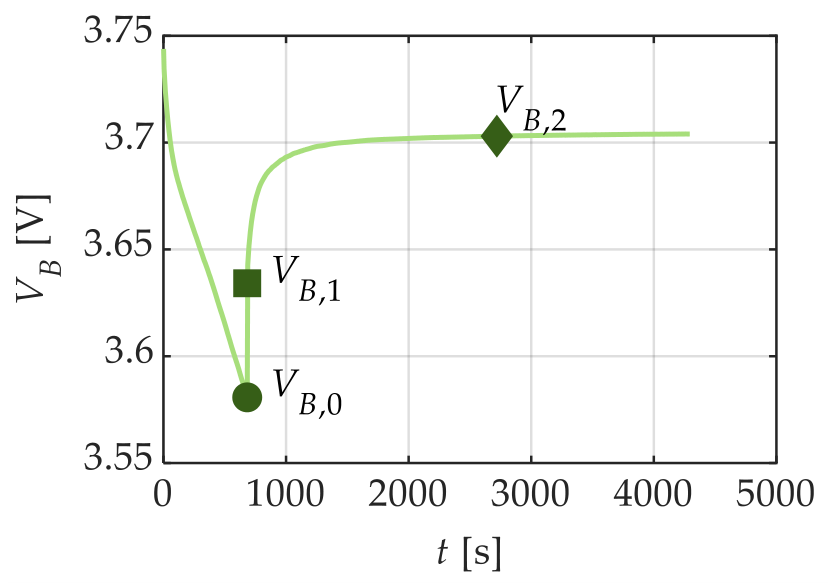
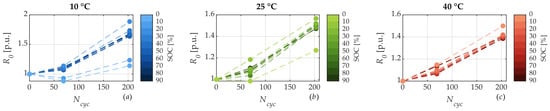
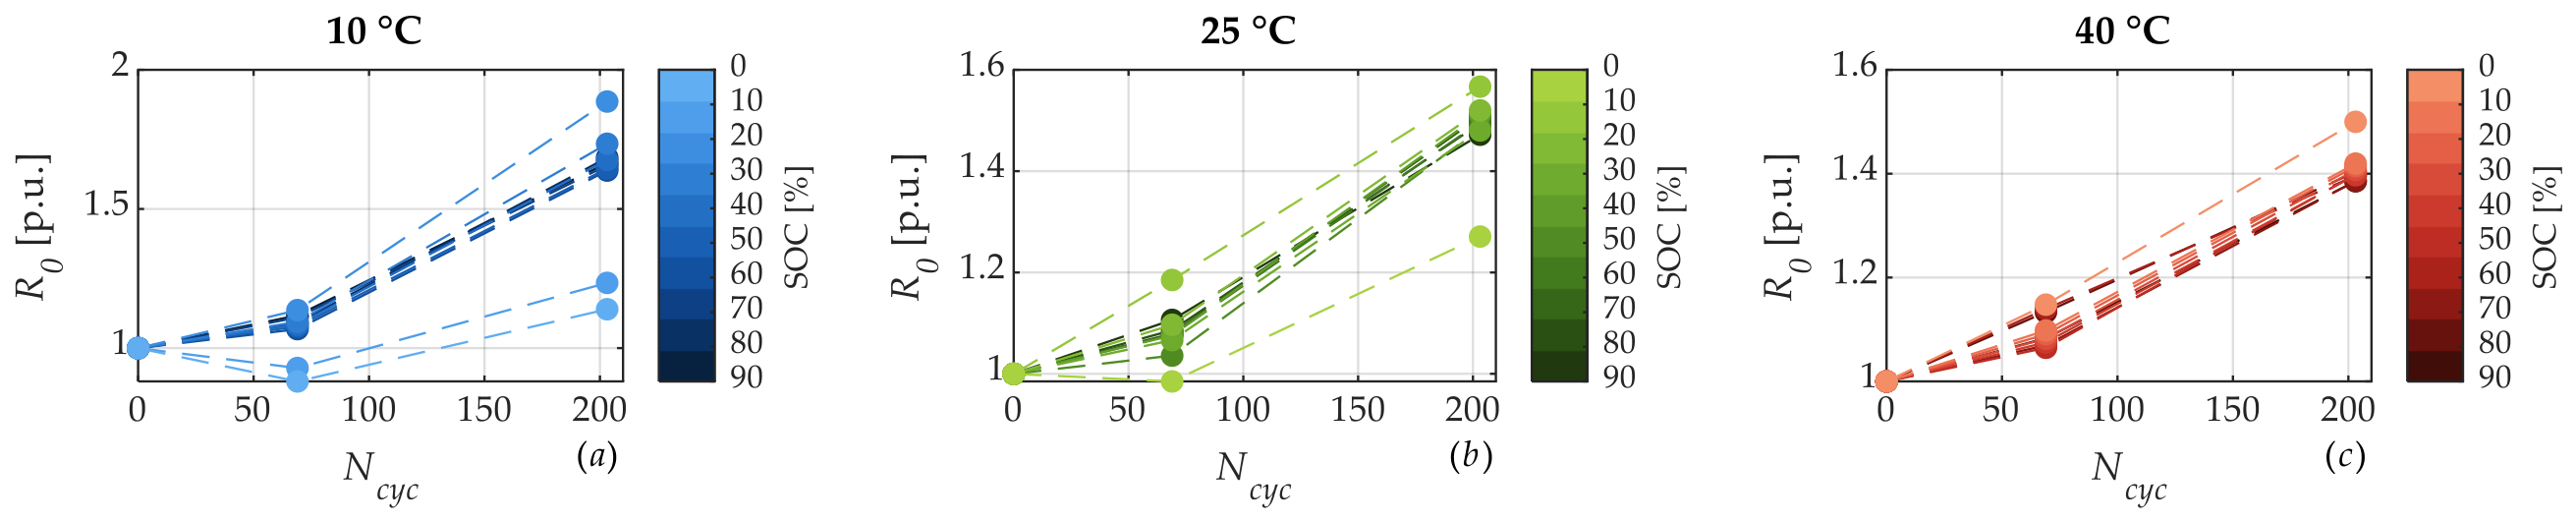
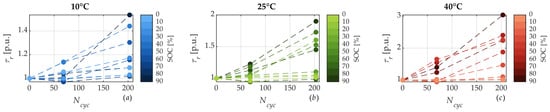
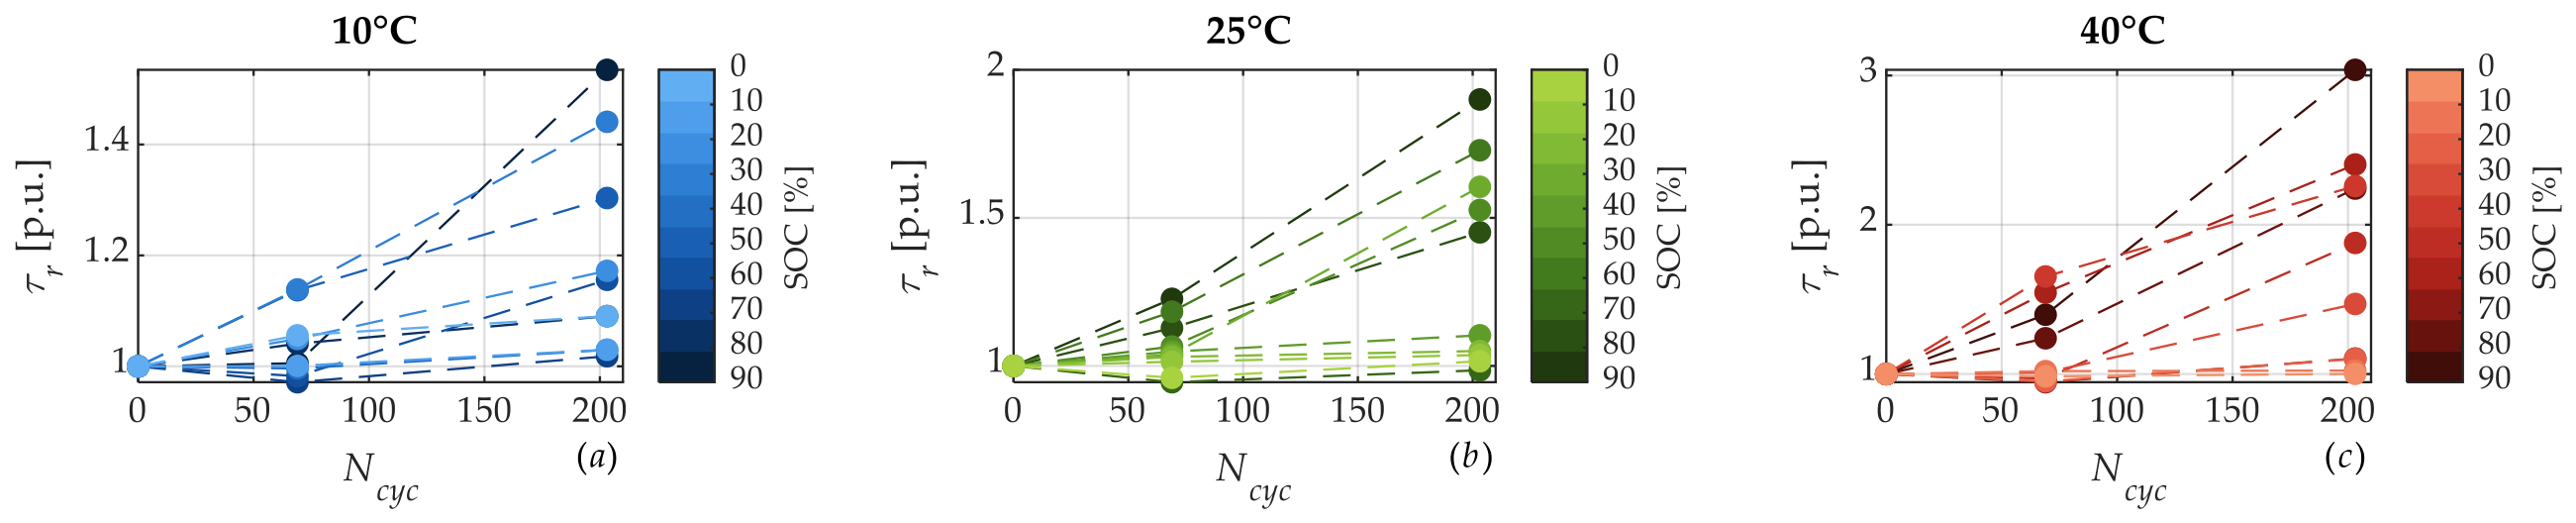

Disclaimer/Publisher’s Note: The statements, opinions and data contained in all publications are solely those of the individual author(s) and contributor(s) and not of MDPI and/or the editor(s). MDPI and/or the editor(s) disclaim responsibility for any injury to people or property resulting from any ideas, methods, instructions or products referred to in the content. |
© 2026 by the authors. Licensee MDPI, Basel, Switzerland. This article is an open access article distributed under the terms and conditions of the Creative Commons Attribution (CC BY) license.