


Abstract
Lithium-ion batteries (LIBs) are currently widely used in the electric vehicle sector and have become one of the core components of new energy vehicles. To ensure that the maximum temperature (Tmax) and maximum temperature difference (∆Tmax) remain within acceptable limits after high-rate discharge, this study proposes a novel air-cooled battery thermal management system (BTMS). This BTMS features innovative design elements in its novel battery case walls and contour-following fin structure. Through physical testing of 21,700 LIB discharges and comparative numerical simulations, the accuracy of the simulation model is ensured. Orthogonal experimental analysis is conducted at four distinct levels for each of the four structural factors involved. The final results demonstrate that the novel battery pack wall and contour-shaped fin structure proposed in this paper significantly enhance the heat dissipation capability of air-cooled BTMS. The proposed Model 9 configuration exhibits optimal thermal performance metrics. The Tmax after 3C rate discharge reaches 39.4 °C, with a ∆Tmax of 7.4 °C. This study demonstrates significant application potential in the structural implementation of air-cooled BTMSs.
1. Introduction
As oil prices escalate and fossil fuel supplies diminish, the advancement of renewable energy sources has garnered significant attention [1]. The advancement of electric and hybrid automobiles is a significant method to mitigate the fossil fuel crisis [2]. Lithium-ion batteries (LIBs) are extensively utilized as power sources for electric vehicles because of their prolonged cycle life and elevated specific energy [3]. LIBs, as electrochemical energy storage devices, produce heat while charging and discharging; if this heat is not dissipated promptly, it will adversely impact battery operational performance and thermal safety [4]. The maximum temperature (Tmax) range for LIBs is 20 °C–50 °C [5]. It is essential to develop an effective and rational heat dissipation strategy for the thermal properties of LIBs to maintain their operating performance.
The heat dissipation of an LIB pack can be primarily divided into three main types based on the cooling medium: air cooling [6,7], liquid cooling [8,9], and phase-change material (PCM) cooling [10,11]. Air cooling systems possess structural and cost advantages, but their cooling efficacy is constrained by the inferior thermal conductivity and heat capacity of air. Moreover, air-cooled systems are particularly susceptible to failure under conditions of elevated battery proliferation. Widely utilized coolants provide benefits over air regarding thermal conductivity and heat capacity, resulting in enhanced cooling efficiency. Nonetheless, coolant leakage can compromise the operational stability of the battery thermal management system (BTMS), and the design of the cooling pipeline necessitates elevated structural configuration and manufacturing expenses for the BTMS [12]. In addition, the temperature of the cooling medium increases during the circulation process, regardless of whether it is air-cooled or liquid-cooled. This phenomenon leads to different heat transfer conditions between the upstream and downstream LIBs, thus creating harmful temperature gradients within the BTMS. As a passive cooling method, PCM cooling technology has been widely used. Due to the phase-change characteristics and favorable latent heat of PCM, it effectively enhances the temperature uniformity of the BTMS [13]. However, due to the limitation of the latent heat of the PCM, the PCM cooling system is prone to failure when the LIBs are operated at high speeds. Nevertheless, as advancements in battery cathode materials progress, the thermal stability of batteries has enhanced, indicating that the necessity for thermal efficiency is alleviated under specific operating conditions. Parra-Panchi et al. [14] investigated various external and battery-powered heating strategies and evaluated the time required for 21,700 LIBs to reach their minimum safe operating temperature. The study concluded that combining external heating with discharge provided reliable cold-start capability for the examined battery modules. Considering thermal objectives and manufacturing costs, the integration of air cooling with PCM appears to be a feasible solution for some small module applications [15].
Research on air cooling for lithium-ion batteries has primarily focused on battery arrangement design, flow channel optimization, and heat dissipation structure development. The configuration of the battery pack significantly influences cooling airflow, thereby affecting the overall thermal performance of the BTMS. Fan et al. [16] compared the cooling efficacy of aligned, staggered, and crossed battery modules at varying inlet velocities. The aligned layout exhibited superior cooling efficiency and temperature homogeneity, followed by the staggered arrangement and, lastly, the cross arrangement. Singh et al. [17] numerically examined the effects of the number and configuration of LIBs on the thermal performance of the BTMS. The results showed that when the number of batteries exceeded a critical threshold of eight, the configuration of LIBs did not influence the temperature distribution of the BTMS. The optimization of flow channels primarily pertains to the design of inlet and outlet, as varying configurations will result in distinct flow paths. Zhang et al. [18] developed a multiple-vent module for 18,650 LIBs and numerically optimized its shape. The findings indicate that the air-cooled BTMS incorporating multiple vents demonstrates superior cooling performance compared to the conventional single-inlet-and-outlet configuration. Yang et al. [19] introduced an innovative heat sink including a bionic surface structure, which was implemented in axial air-cooled BTMS. The Tmax and maximum temperature difference (∆Tmax) of the LIBs were maintained at 34.85 °C and 5 °C, respectively, at a 3C discharge rate. Although the heat dissipation performance is improved, the overly complex structure leads to increased manufacturing costs and adversely affects the assembly efficiency of the BTMS. Moreover, some contemporary designs fail to account for the heating effect along the airflow path, which compromises temperature uniformity within the system.
Regarding air-cooling technology, recent studies have proposed methods such as duct topology optimization and reciprocating airflow. Wang et al. [20] experimentally investigated reciprocating airflow in a Z-type BTMS, focusing on key parameters and novel control strategies. They examined five control parameters for reciprocating air-cooling and demonstrated that their optimized design reduced the ∆Tmax by 65.5% compared to the baseline model. An empirical formula was also derived to characterize the relationships among these parameters. Separately, Yang et al. [21] applied topological optimization to study the layout of inlet and outlet vents, as well as optimal coolant inlet and outlet positions. Their results show that liquid-cooled plates designed through topological optimization achieve lower Tmax under various inlet air velocities compared to conventional vent layouts, straight-channel designs with optimized coolant positions, and single-channel inlet/outlet configurations.
Therefore, numerous studies have integrated PCM into air-cooling systems to balance the heat exchange conditions between upstream and downstream batteries. Ganji et al. [22] experimentally evaluated the thermal performance of a PCM-based battery pack under high-temperature conditions. Their research revealed that when the ambient temperature (Tamb) reached the melting point of PCM, the PCM utilization around the heating unit reached approximately 98%. Singh et al. [23] discovered that a 1 mm thick PCM layer wrapped around the battery decreased the average temperature (Tave) by approximately 4.5 °C at a 5C discharge rate. Song et al. [24] proposed an air-cooled BTMS including a double-layer PCM structure. The double-layer PCM configuration demonstrated superior environmental adaptability compared to the single-layer PCM configuration. Therefore, at the Tamb of 20 °C, the dual-layer PCM configuration maintains the Tmax at the end of the discharge at 30.8 °C. The Tmax at the end of the discharge can be maintained at 30.8 °C. Weng et al. [25] compared the cooling effect of PCM-BTMS with and without fin structures on the Tmax and ∆Tmax of the LIBs at different discharge rates. The findings indicated that the optimal number of fins was four, and the Tmax of the BTMS can be reduced from 36.9 °C to 34.2 °C. The longitudinal fins facilitated the disposal of heat accumulated at the bottom and enhanced convection with the surrounding air. Gu et al. [26] indicated that the Tmax of the hybrid BTMS with fins and PCM can be decreased by 2–4 °C relative to the situation without fins. Liu et al. [27] investigated the effect of the interaction between fin structure and PCM thickness for reducing the Tmax and ∆Tmax in the BTMS. The results suggested that co-optimizing the protruding fin configuration and the PCM can enhance heat transfer from the battery to the cooling medium, improve PCM utilization, and ensure sufficient latent heat capacity.
In conclusion, integrating PCM and fin structures into air-cooling BTMS can enhance the heat dissipation efficiency of LIBs while preserving cost-effectiveness. However, current research predominantly emphasizes the thermal performance of air-cooled BTMS, leaving the influence of BTMS structural configurations on airflow dynamics insufficiently explored. This paper proposes a novel battery pack wall structure integrated with profiled fins to improve the heat dissipation efficiency of an air-cooled BTMS. In contrast to existing air-cooling approaches, this design features no moving parts and requires no active control strategies, rendering it particularly suitable for mass-produced, high-reliability energy storage battery packs. Through theoretical analysis and experimental comparison, the accuracy of the simulation model is validated. Subsequently, a four-level orthogonal experimental design is employed to investigate the influence of four key structural factors on BTMS performance. Finally, using Tmax and ΔTmax as key evaluation metrics, the experimental results are subjected to range analysis and analysis of variance (ANOVA) to determine the optimal combination of factor levels. This study provides a feasible reference for the design of air-cooled BTMS, particularly regarding battery pack configuration and hybrid cooling strategies.
2. Materials and Methods
2.1. Physical Model
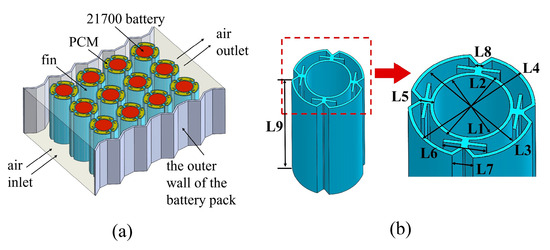
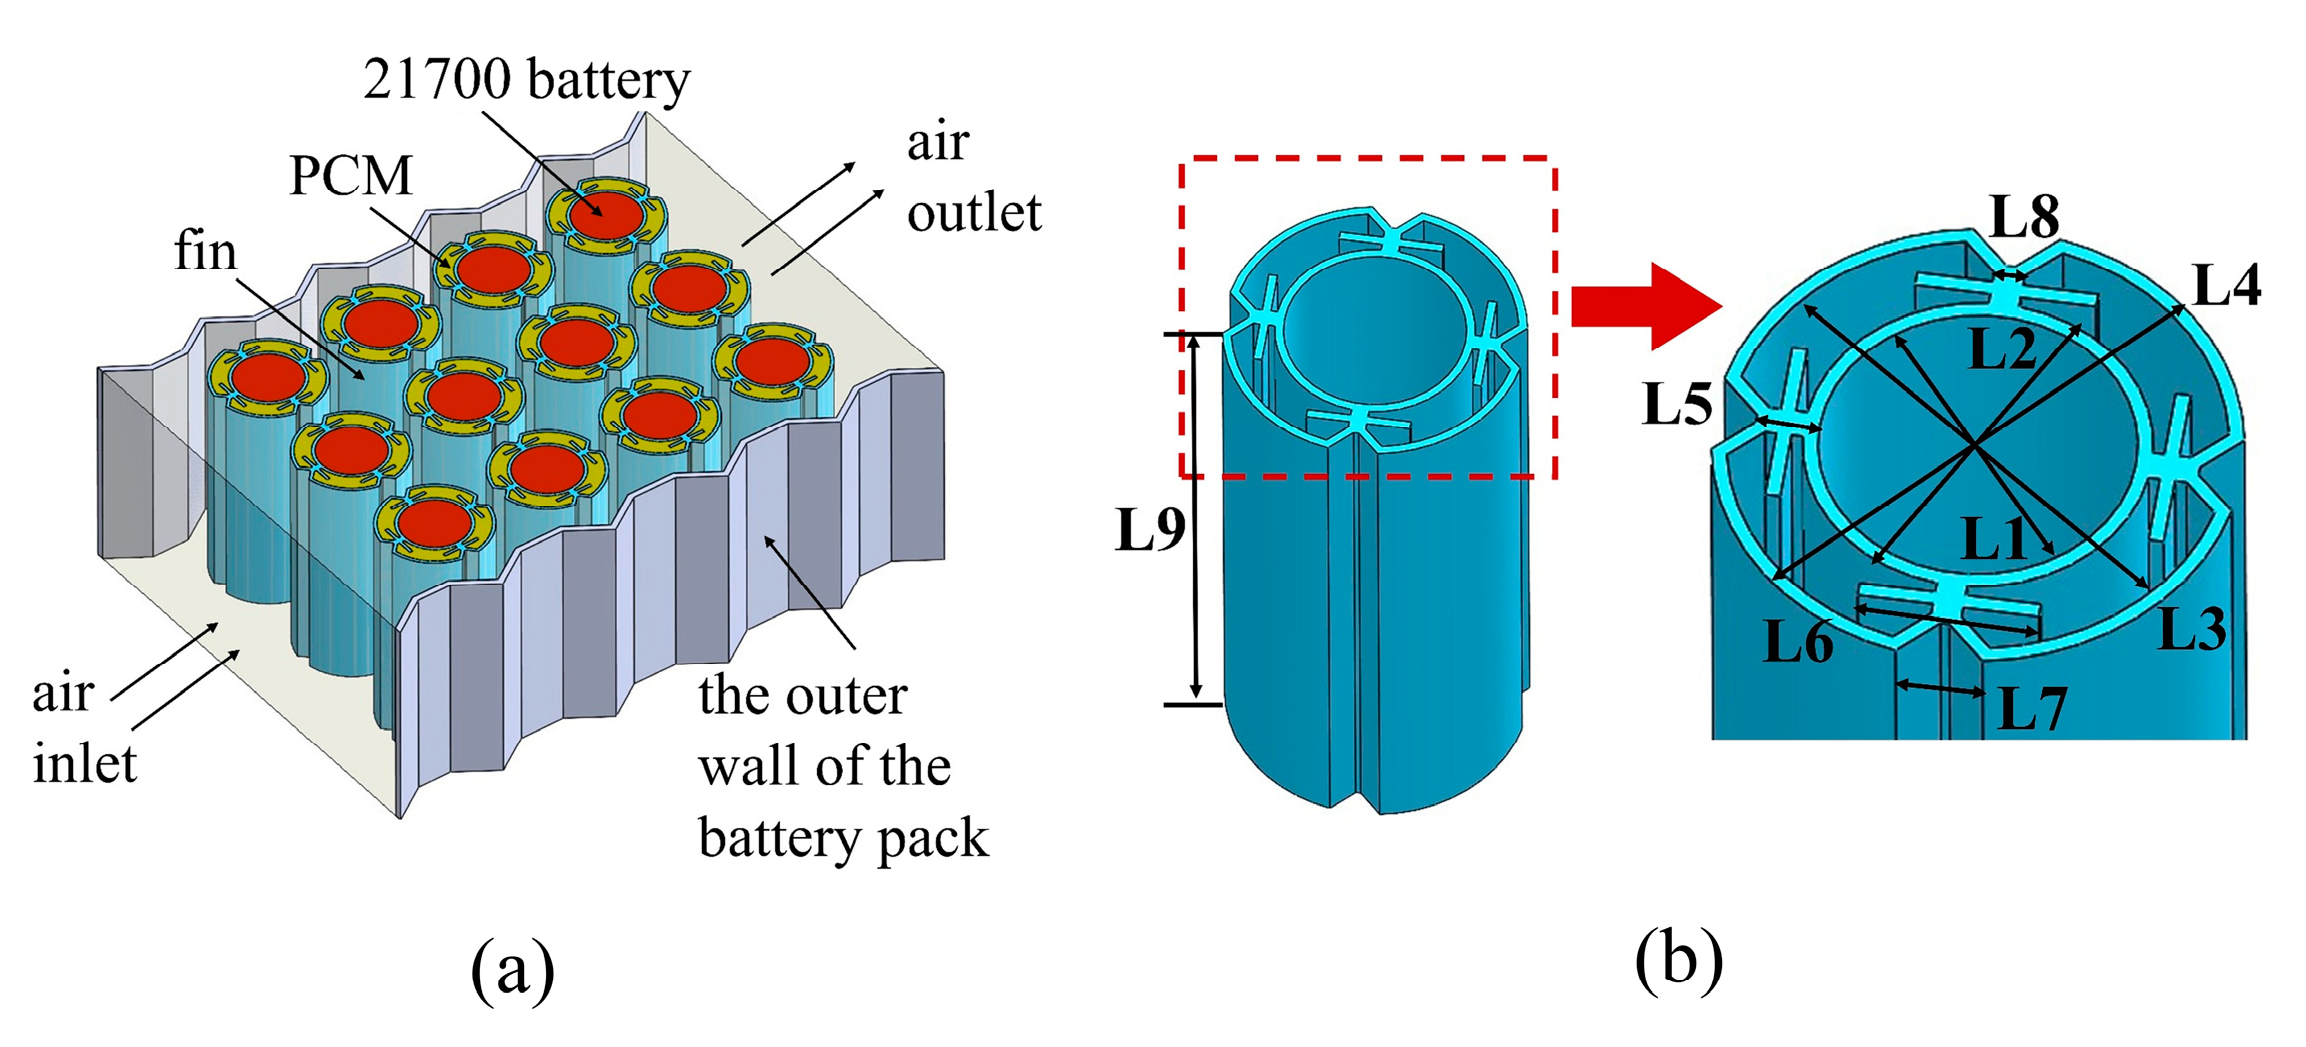
This study investigates the thermal behavior of a cylindrical 21,700-LIB pack under a 3C rate discharge cycle. To facilitate subsequent numerical simulations, the battery geometry is simplified by omitting the internal electrode configurations of the cylindrical batteries. The proposed BTMS structural concept is illustrated in Figure 1a. As both the cylindrical battery and the PCM are embedded within the fin structure, only the dimensions of the aluminum fins are detailed, as shown in Figure 1b. Among these, L1 is 21 mm, L2 is 23 mm, L3 is 33 mm, L4 is 35 mm, L5 is 4.17 mm, L6 is 12 mm, L7 is 5.77 mm, L8 is 0.6 mm, and L9 is 70 mm. The performance parameters of LIBs, PCM, and aluminum fins are shown in Table 1.
Figure 1.
(a) System Principle, (b) Component Dimensions.
Table 1.
Parameters for the battery, PCM, and aluminum fins.
2.2. Control Equation
2.2.1. Battery Model
Due to the complexity of internal electrochemical reactions, the heat generation process in LIBs is simplified for BTMS studies. It is commonly assumed that LIBs behave as a uniform volumetric heat source with constant physical properties. Furthermore, the heat generation rate is considered uniform throughout the battery volume. This assumption remains applicable even under high-rate discharge conditions [24]. Based on these assumptions, the energy conservation equation for the 21,700 LIBs is as follows:
where the represents the density of the battery, with units of kg/m3. The represents the heat capacity of the battery, with units of J/(kg·K). The represents the battery temperature, with units of K. The represents the time, with units of s. The represents the thermal conductivity of the battery, with units of W/(m·K). The represents the heat generation rate, with units of W/m3.
Regarding the heat generation rate per unit volume of LIBs, based on the research by Shi et al. [28], the expression is as follows:
where the represents the volume of the battery, with units of m3. The represents the open-circuit voltage, with units of V. The represents the battery voltage, with units of V. The represents the discharge current, with units of A. The represents the internal resistance, with units of Ω.
According to Equation (2), the heat generated by LIBs results from the interaction of various factors such as current, internal resistance, and temperature.
2.2.2. PCM Model
To facilitate the study of simulation models, the following simplifying assumptions are made for PCM:
- Due to the thinness of the PCM layer, convective and gravitational effects are neglected.
- During the phase transition of PCM, the effects of volume expansion or thermal radiation are not considered.
- The LIBs and PCM are nested within aluminum fins to ensure efficient heat dissipation.
Based on the above assumptions, the energy equation of PCM is:
where the represents the density of the PCM, with units of kg/m3. The represents the heat capacity of the PCM, with units of J/(kg·K). The represents the temperature of PCM, with units of K. The represents the thermal conductivity of the PCM, with units of W/(m·K).
Among these, can be expressed as:
The represents the heat capacity of PCM in solid state, with units of J/(kg·K). The represents the heat capacity of PCM in liquid state, with units of J/(kg·K). The represents the temperature of PCM in solid state, with units of K. The represents the temperature of PCM in liquid state, with units of K. According to the research by Li et al. [29], in this study and are equal.
The liquid fraction (β) is defined as the ratio of the volume of liquid PCM within the local control volume to its total volume. It is calculated using the built-in enthalpy-porosity model in Fluent as:
where denotes the local specific enthalpy, with units of J/kg. The and represent the specific enthalpies at the solidus and the liquids, respectively, both with units of J/kg.
When β < 1, the PCM remains in the phase change plateau, effectively suppressing temperature surges to ensure the battery surface temperature does not exceed the safety threshold.
2.3. Boundary Conditions
This study employs ANSYS Fluent 2022 for numerical simulations. The SIMPLE algorithm is used within Fluent to model the battery discharge process. The initial temperature is uniform throughout the domain. All external surfaces are thermally insulated, and all walls are treated as no-slip boundaries. The lithium-ion batteries are discharged at a 3C rate for a duration of 1200 s.
The initial conditions for numerical simulation are set as follows:
The boundary conditions at the interface between the LIBs-fins and the PCM-fins are as follows:
where the represents the thermal conductivity of the fin, with units of W/(m·K). The represents the temperature of fin, with units of K. The represents the distance coordinate along the interface normal direction, with units of m.
2.4. Model Validation
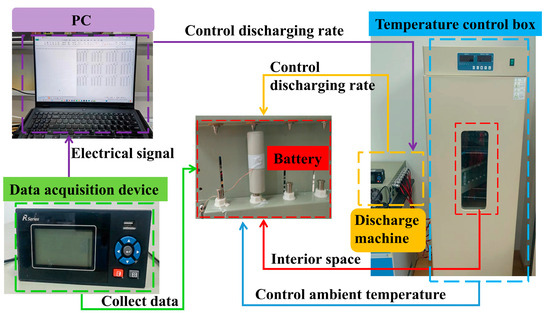
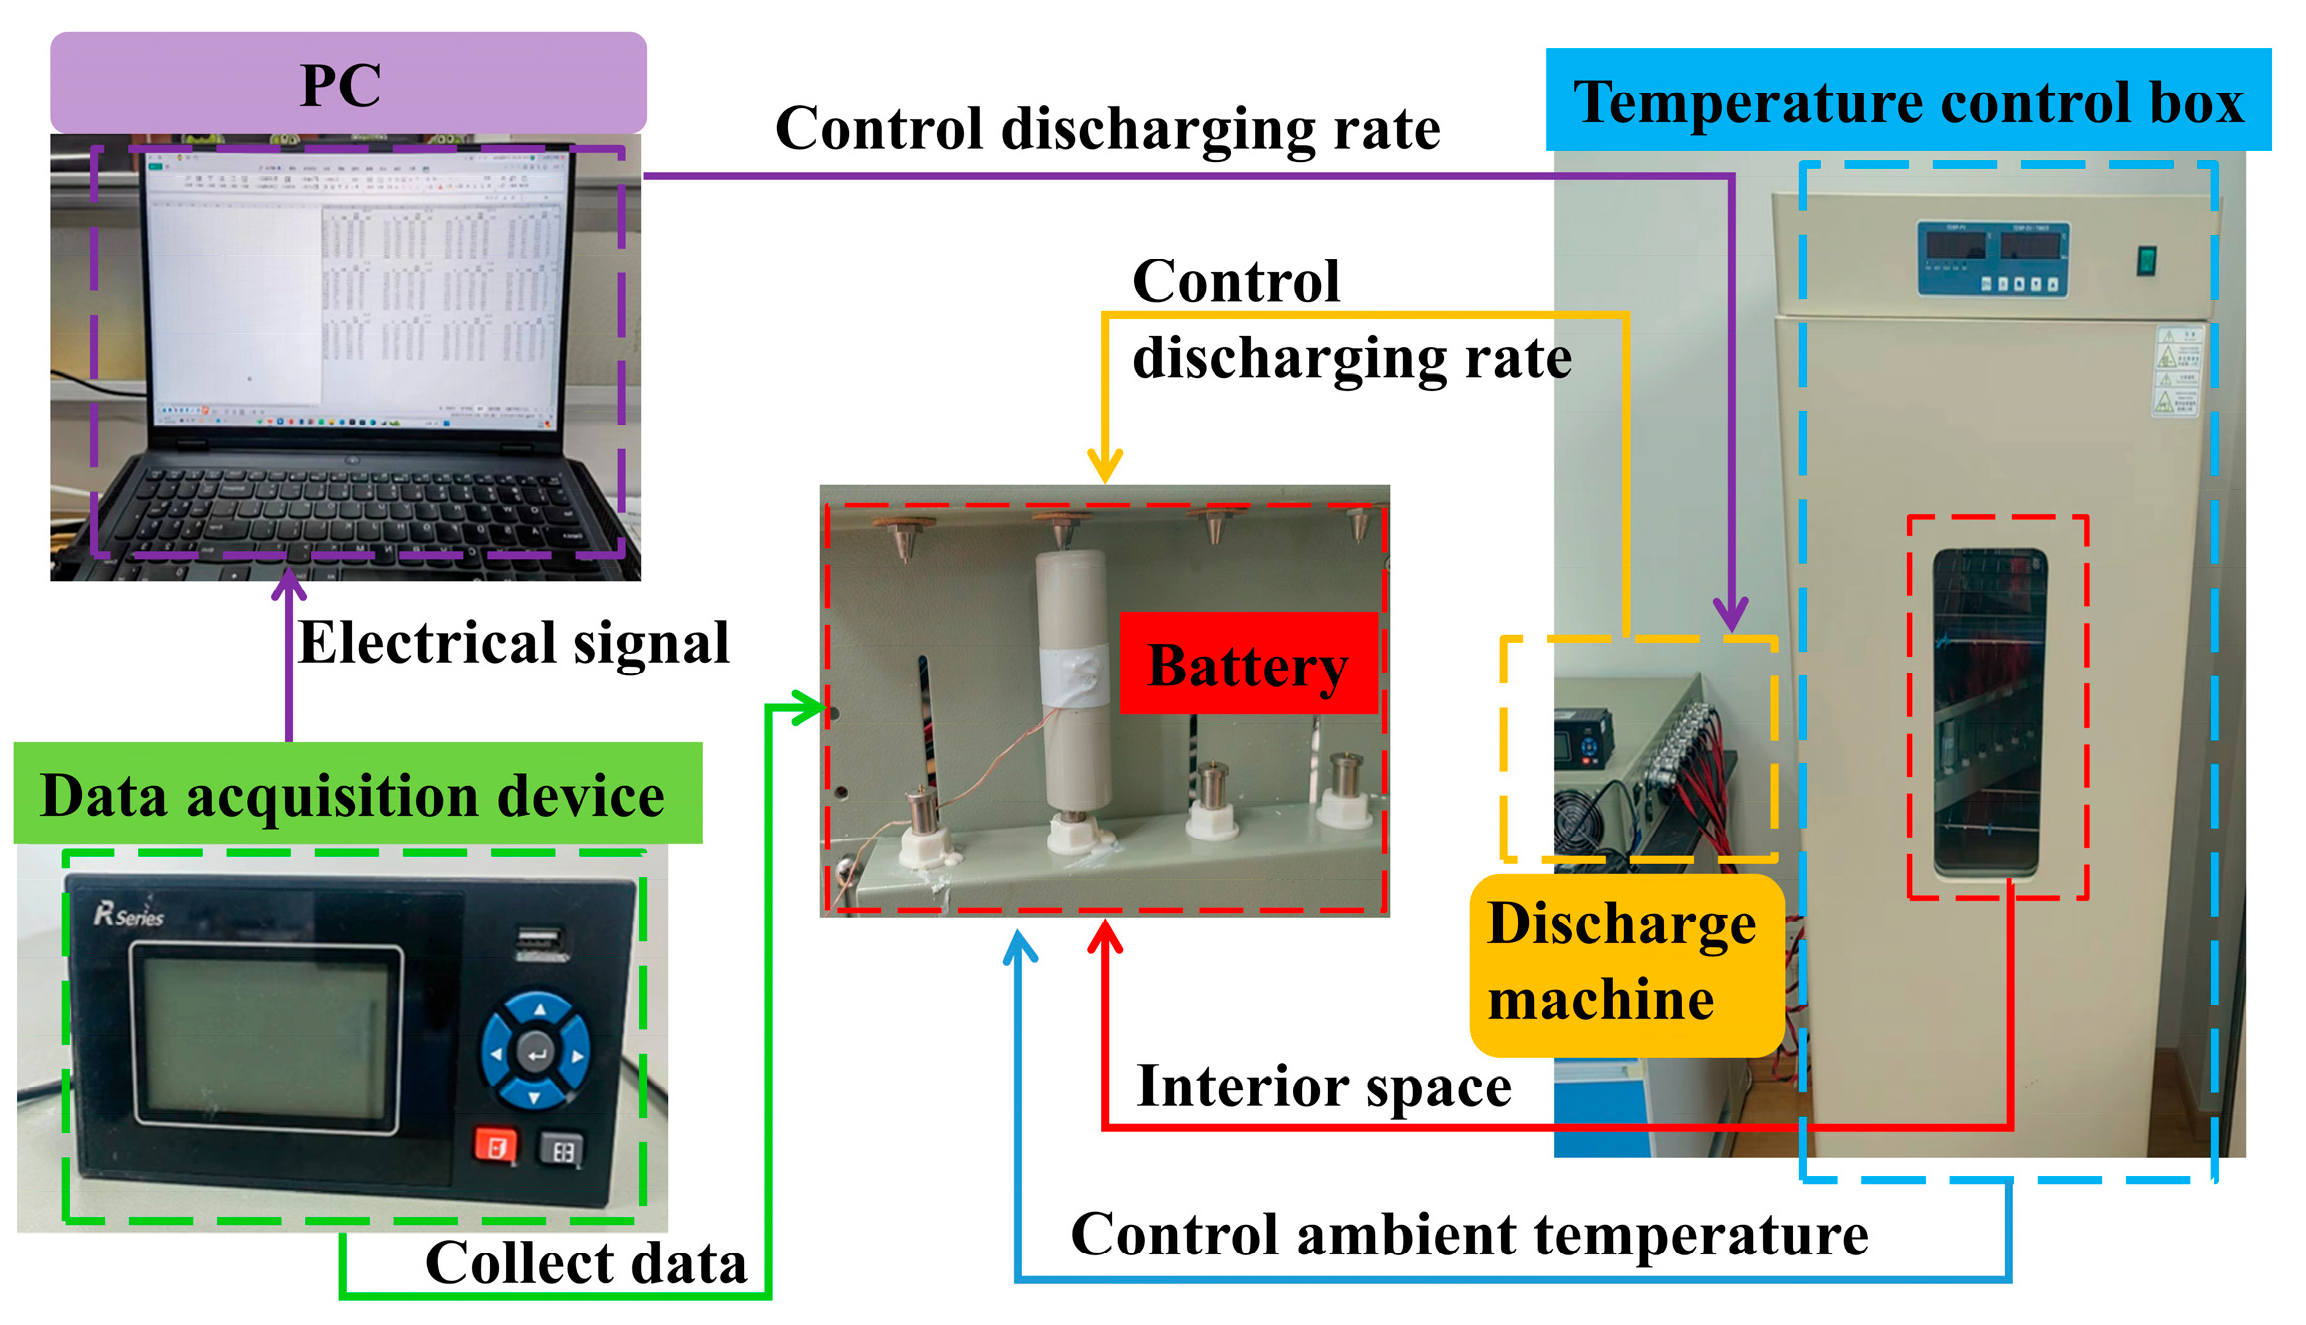
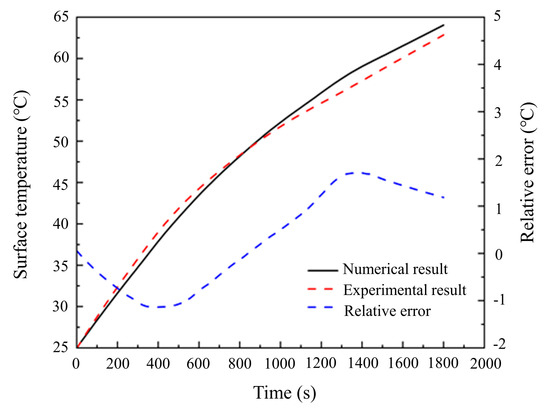
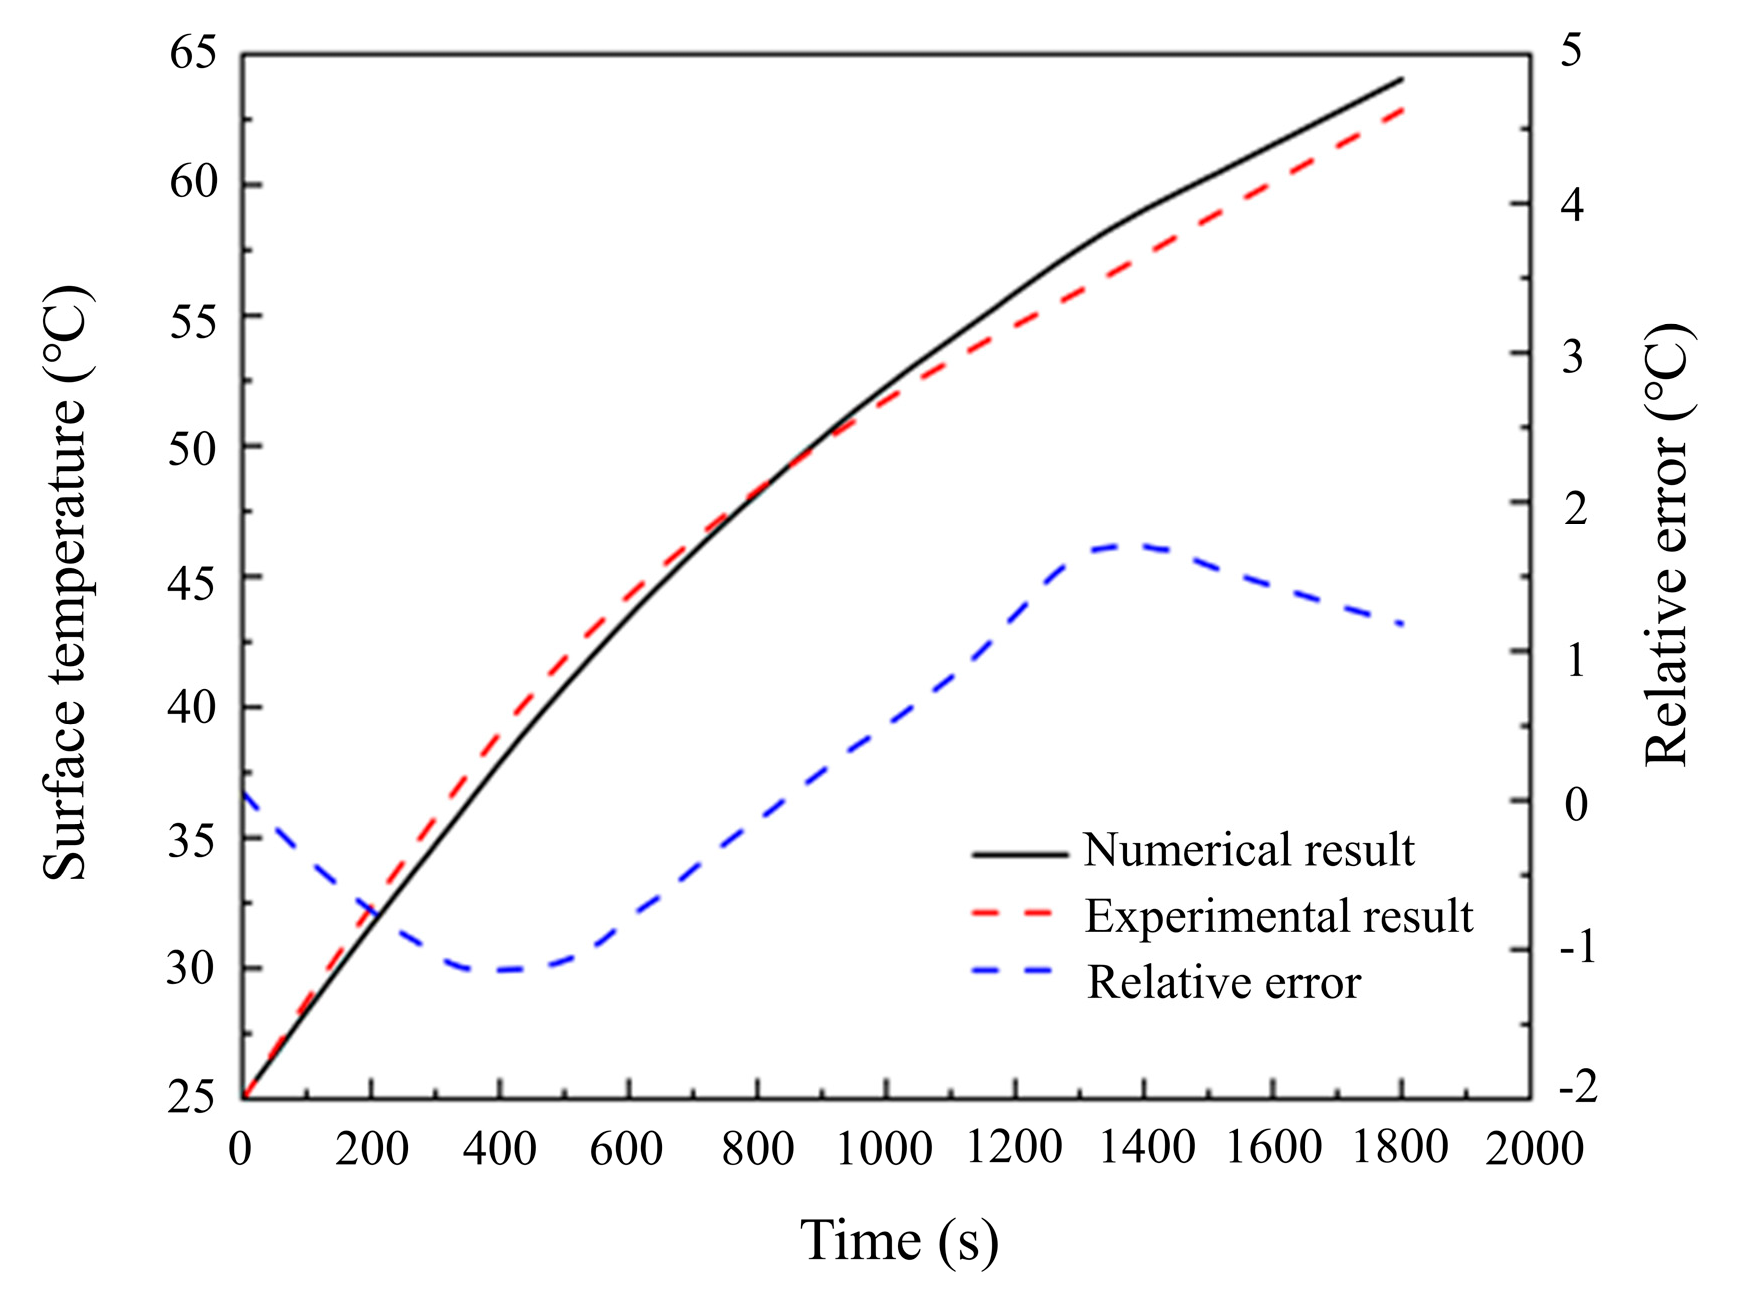
To validate the accuracy of the numerical simulations, a physical discharge temperature-rise experiment was conducted on a 21,700-LIB single cell, and the results were compared with the simulation data. The experimental procedure is illustrated in Figure 2. The cell was placed in a thermal chamber (Shanghai Yiheng Scientific Instrument Co., Ltd., Shanghai, China) maintained at 25 °C. A K-type thermocouple (Shanghai Yiheng Scientific Instrument Co., Ltd., Shanghai, China) was attached to the battery surface to monitor its temperature, and a data acquisition system (Shanghai Yiheng Scientific Instrument Co., Ltd., Shanghai, China) was employed to record the temperature data. Three measurement points were selected, and Tave was calculated. The corresponding temperature rise in the single cell was simulated using ANSYS Fluent 2022. In this study, both experimental and numerical simulations of a 21,700 lithium-ion battery under 3C discharge at 25 °C were performed. Additionally, natural convection with a heat transfer coefficient of 5 W/(m2·K) was applied to the battery surface. The comparison between numerical simulation and experimental results is presented in Figure 3. The overall trend of the simulated temperature rise aligns well with the experimental data, with a terminal discharge error of approximately 1 °C, corresponding to a relative error of 1.8%. The observed deviation may be attributed to measurement uncertainties in the data acquisition system and thermocouples, as well as simplifications in the heat generation model. Despite these minor discrepancies, the results confirm the accuracy of the heat source calculation method and the reliability of the numerical model, thereby ensuring the validity of subsequent simulation studies.
Figure 2.
Experimental temperature test of a single battery.
Figure 3.
Comparison of data curves between physical experiment results and simulation results.
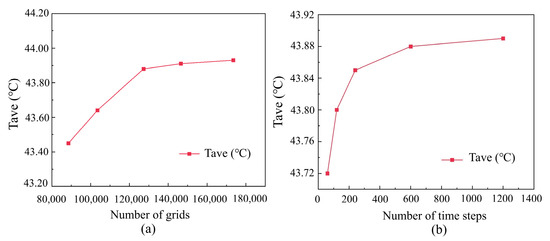
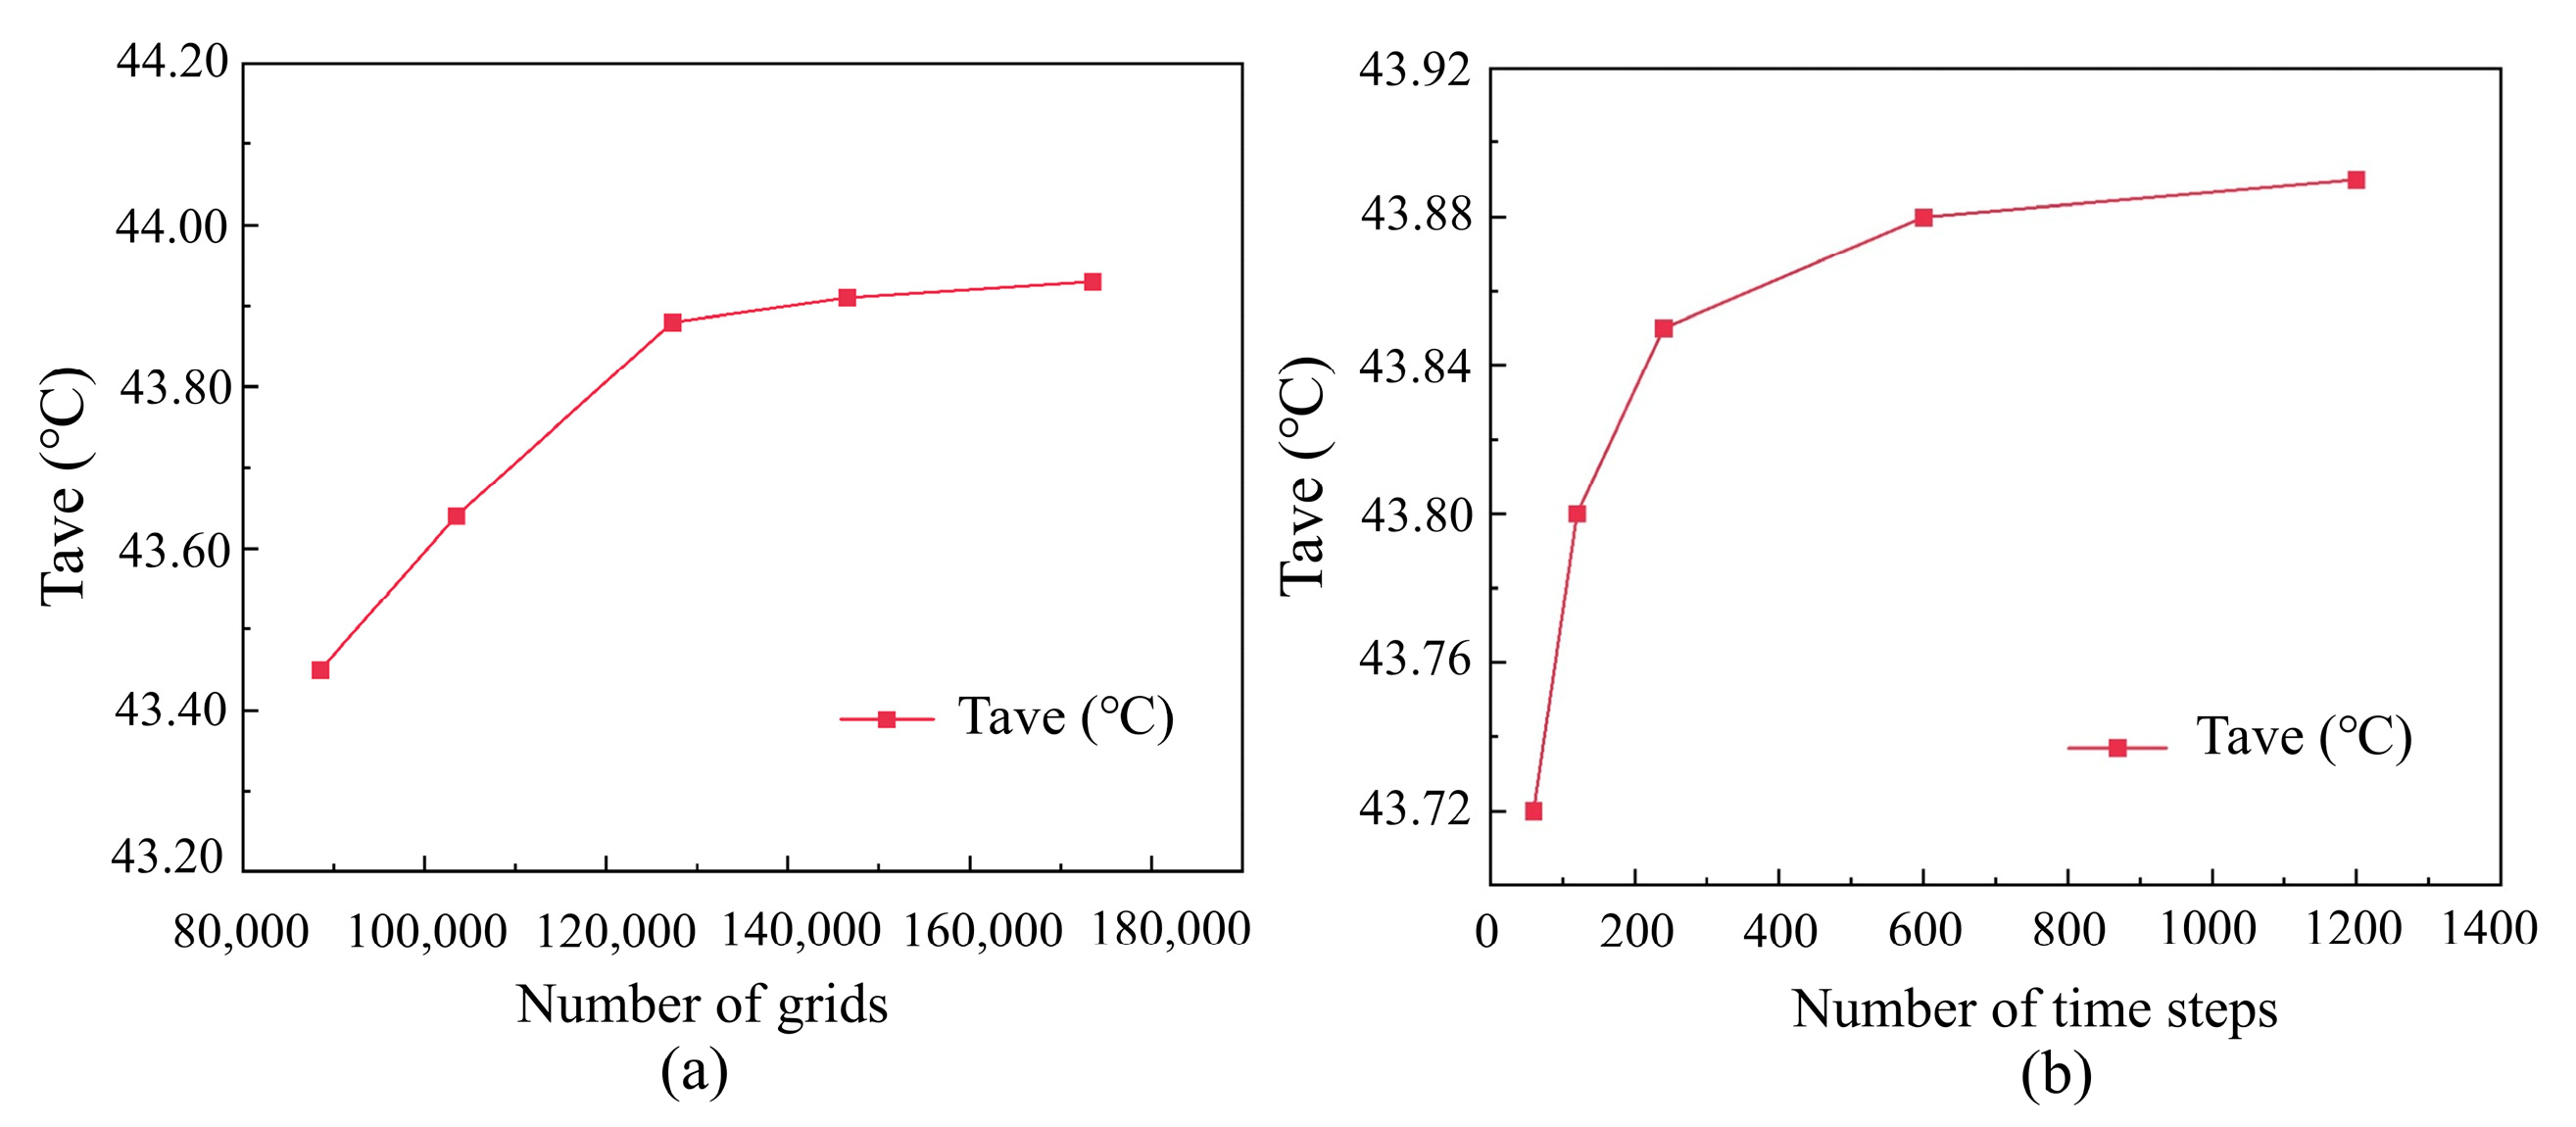
Meshing discretizes the computational domain into finite elements, providing the basis for subsequent simulations. In this study, the meshing module in ANSYS Workbench 2022 is employed to generate a polyhedral volume mesh. Since the simulation focuses on analyzing the temperature field of the battery pack, the Tave of the LIBs at the end of discharge is selected as the key metric to verify both grid independence and time-step independence. The inlet air velocity is set to 3 m/s, with the outlet pressure fixed at 0 Pa. A constant discharge rate of 3C is applied throughout the numerical simulation. The corresponding simulation results are presented in Figure 4.
Figure 4.
Simulation model validation of (a) grid independence; (b) time step independence.
As shown in Figure 4a, when the number of grids exceeds 120,000, the increase in Tave stabilizes. Specifically, Tave rises by only 0.03 °C as the grid count increases from 127,264 to 146,496, and by a negligible 0.02 °C from 146,496 to 173,522. Therefore, considering both computational efficiency and simulation accuracy, the mesh size of 127,264 elements is selected for the battery pack temperature field simulation. The simulation conditions are set to a 3C discharge rate at a Tamb of 25 °C, with a total discharge duration of 1200 s. The time steps of 20 s, 10 s, 5 s, 2 s and 1 s, correspond to the number of steps of 60, 120, 240, 600 and 1200, respectively. The variation of Tave after discharge with different time steps is shown in Figure 4b. When the time step is set to 2 s, the Tave tends to stabilize, so the subsequent simulations are set to 2 s.
3. Results and Discussion
3.1. Influence of Battery Pack Wall Structure
In traditional straight-channel air-cooled BTMS, the flow field is relatively simple, but the progressive thickening of the boundary layer leads to uneven heat dissipation. In smooth straight channels, airflow along the wall forms both velocity and thermal boundary layers, which gradually increase in thickness along the flow direction. To mitigate this issue, this study proposes a novel wall structure incorporating trapezoidal protrusions and triangular recesses. As cooling air flows over the trapezoidal protrusions, it is compressed and accelerated, increasing the local velocity, thinning the boundary layer, and thereby enhancing heat transfer. Within the triangular recesses, the airflow forms a low-pressure recirculation zone. Although the average flow velocity in this region may be reduced, intense turbulent mixing occurs, which further promotes thermal exchange.
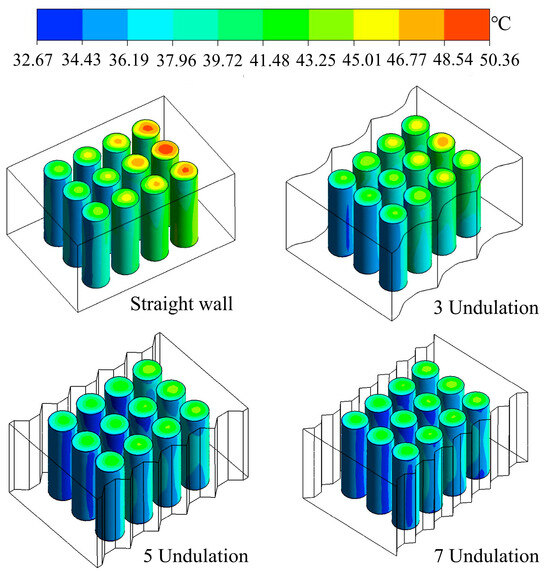
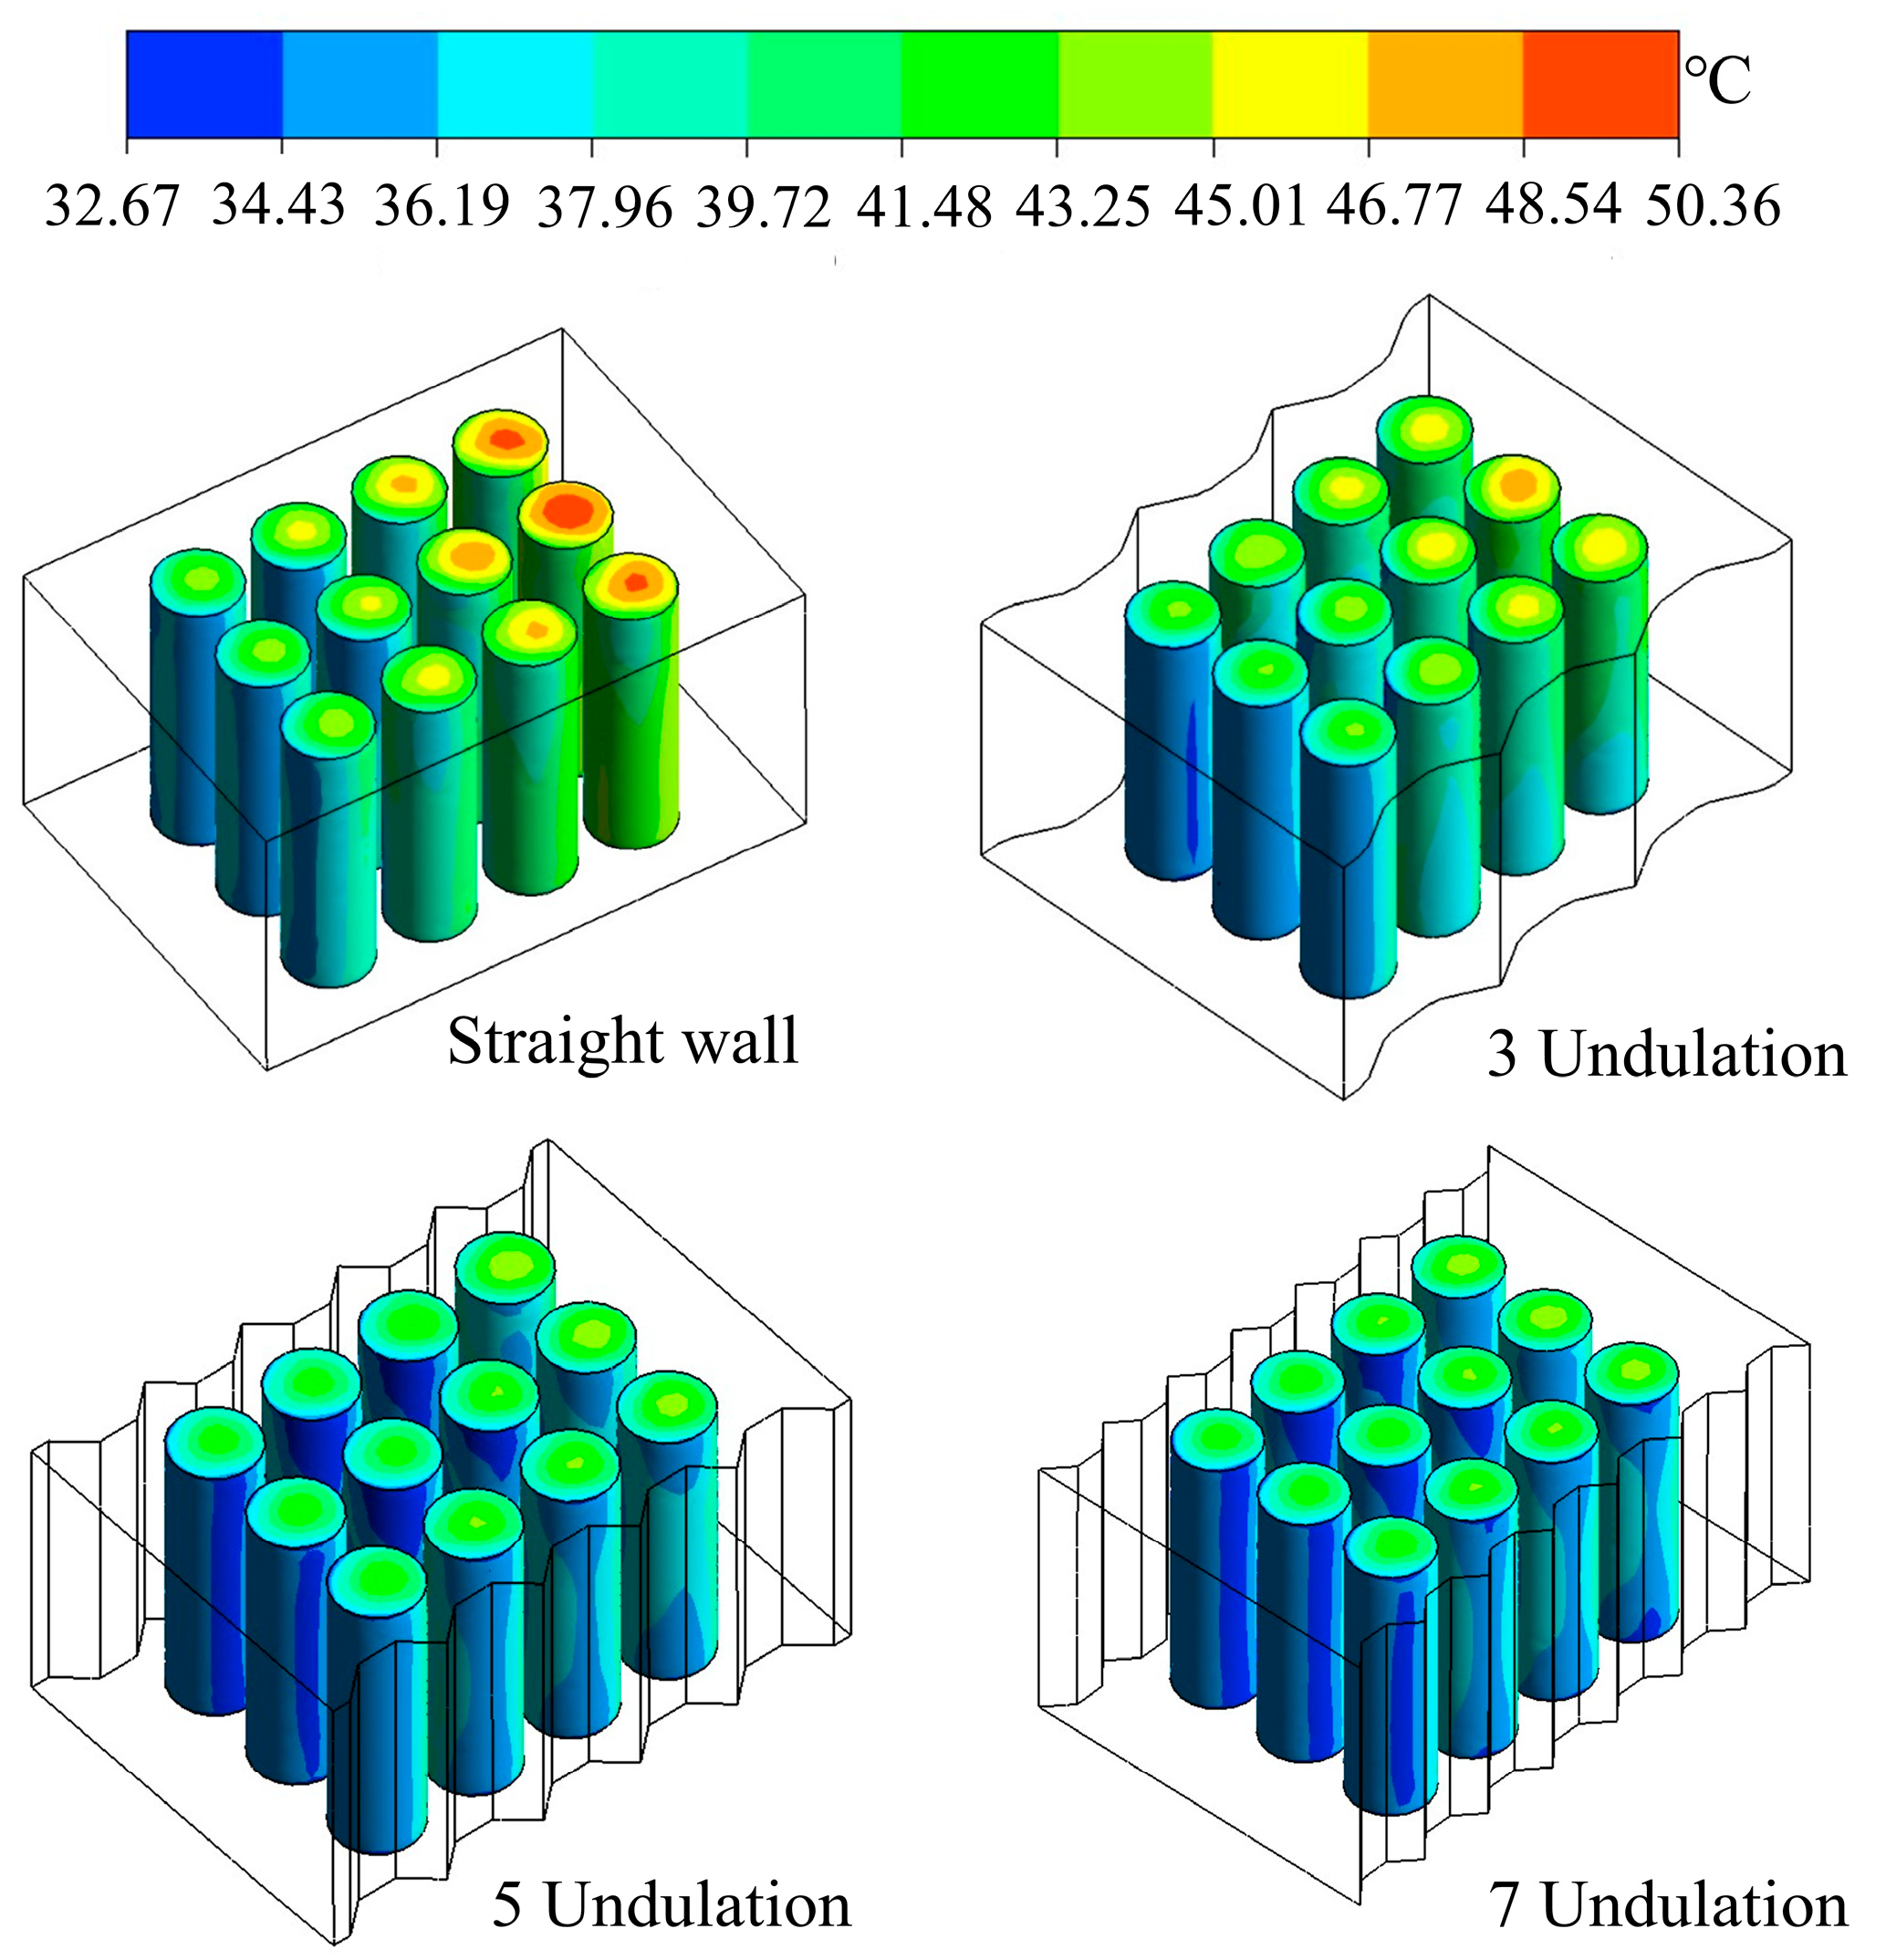
Figure 5 presents the surface temperature distribution contours of the 21,700 LIBs under four different BTMS configurations. The simulations are conducted under an inlet air velocity of 3 m/s, a Tamb of 25 °C, and a 3C discharge cycle. Figure 5 illustrates the temperature distribution within the LIBs after discharge. A consistent trend observed across all BTMS wall structures is that the highest battery temperature occurs near the air outlet. This phenomenon arises because the incoming cool air initially passes over the front-row batteries, absorbing their generated heat and consequently increasing in temperature. As this pre-warmed air flows toward the rear-row batteries, the temperature difference between the air and the batteries diminishes, thereby reducing the cooling effectiveness for the downstream cells.
Figure 5.
Surface temperature contour cloud map of battery packs with different BTMS structures.
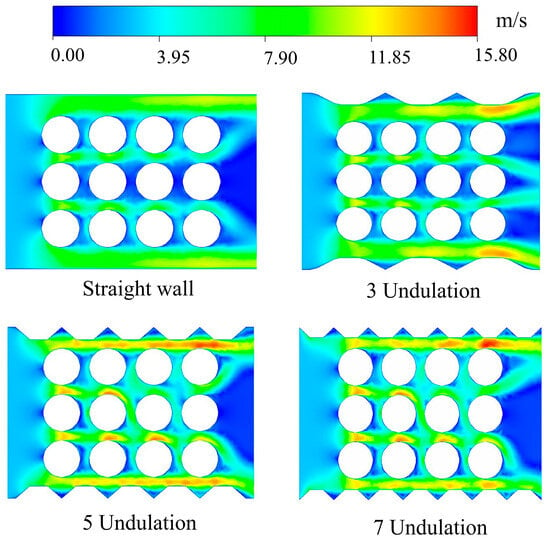
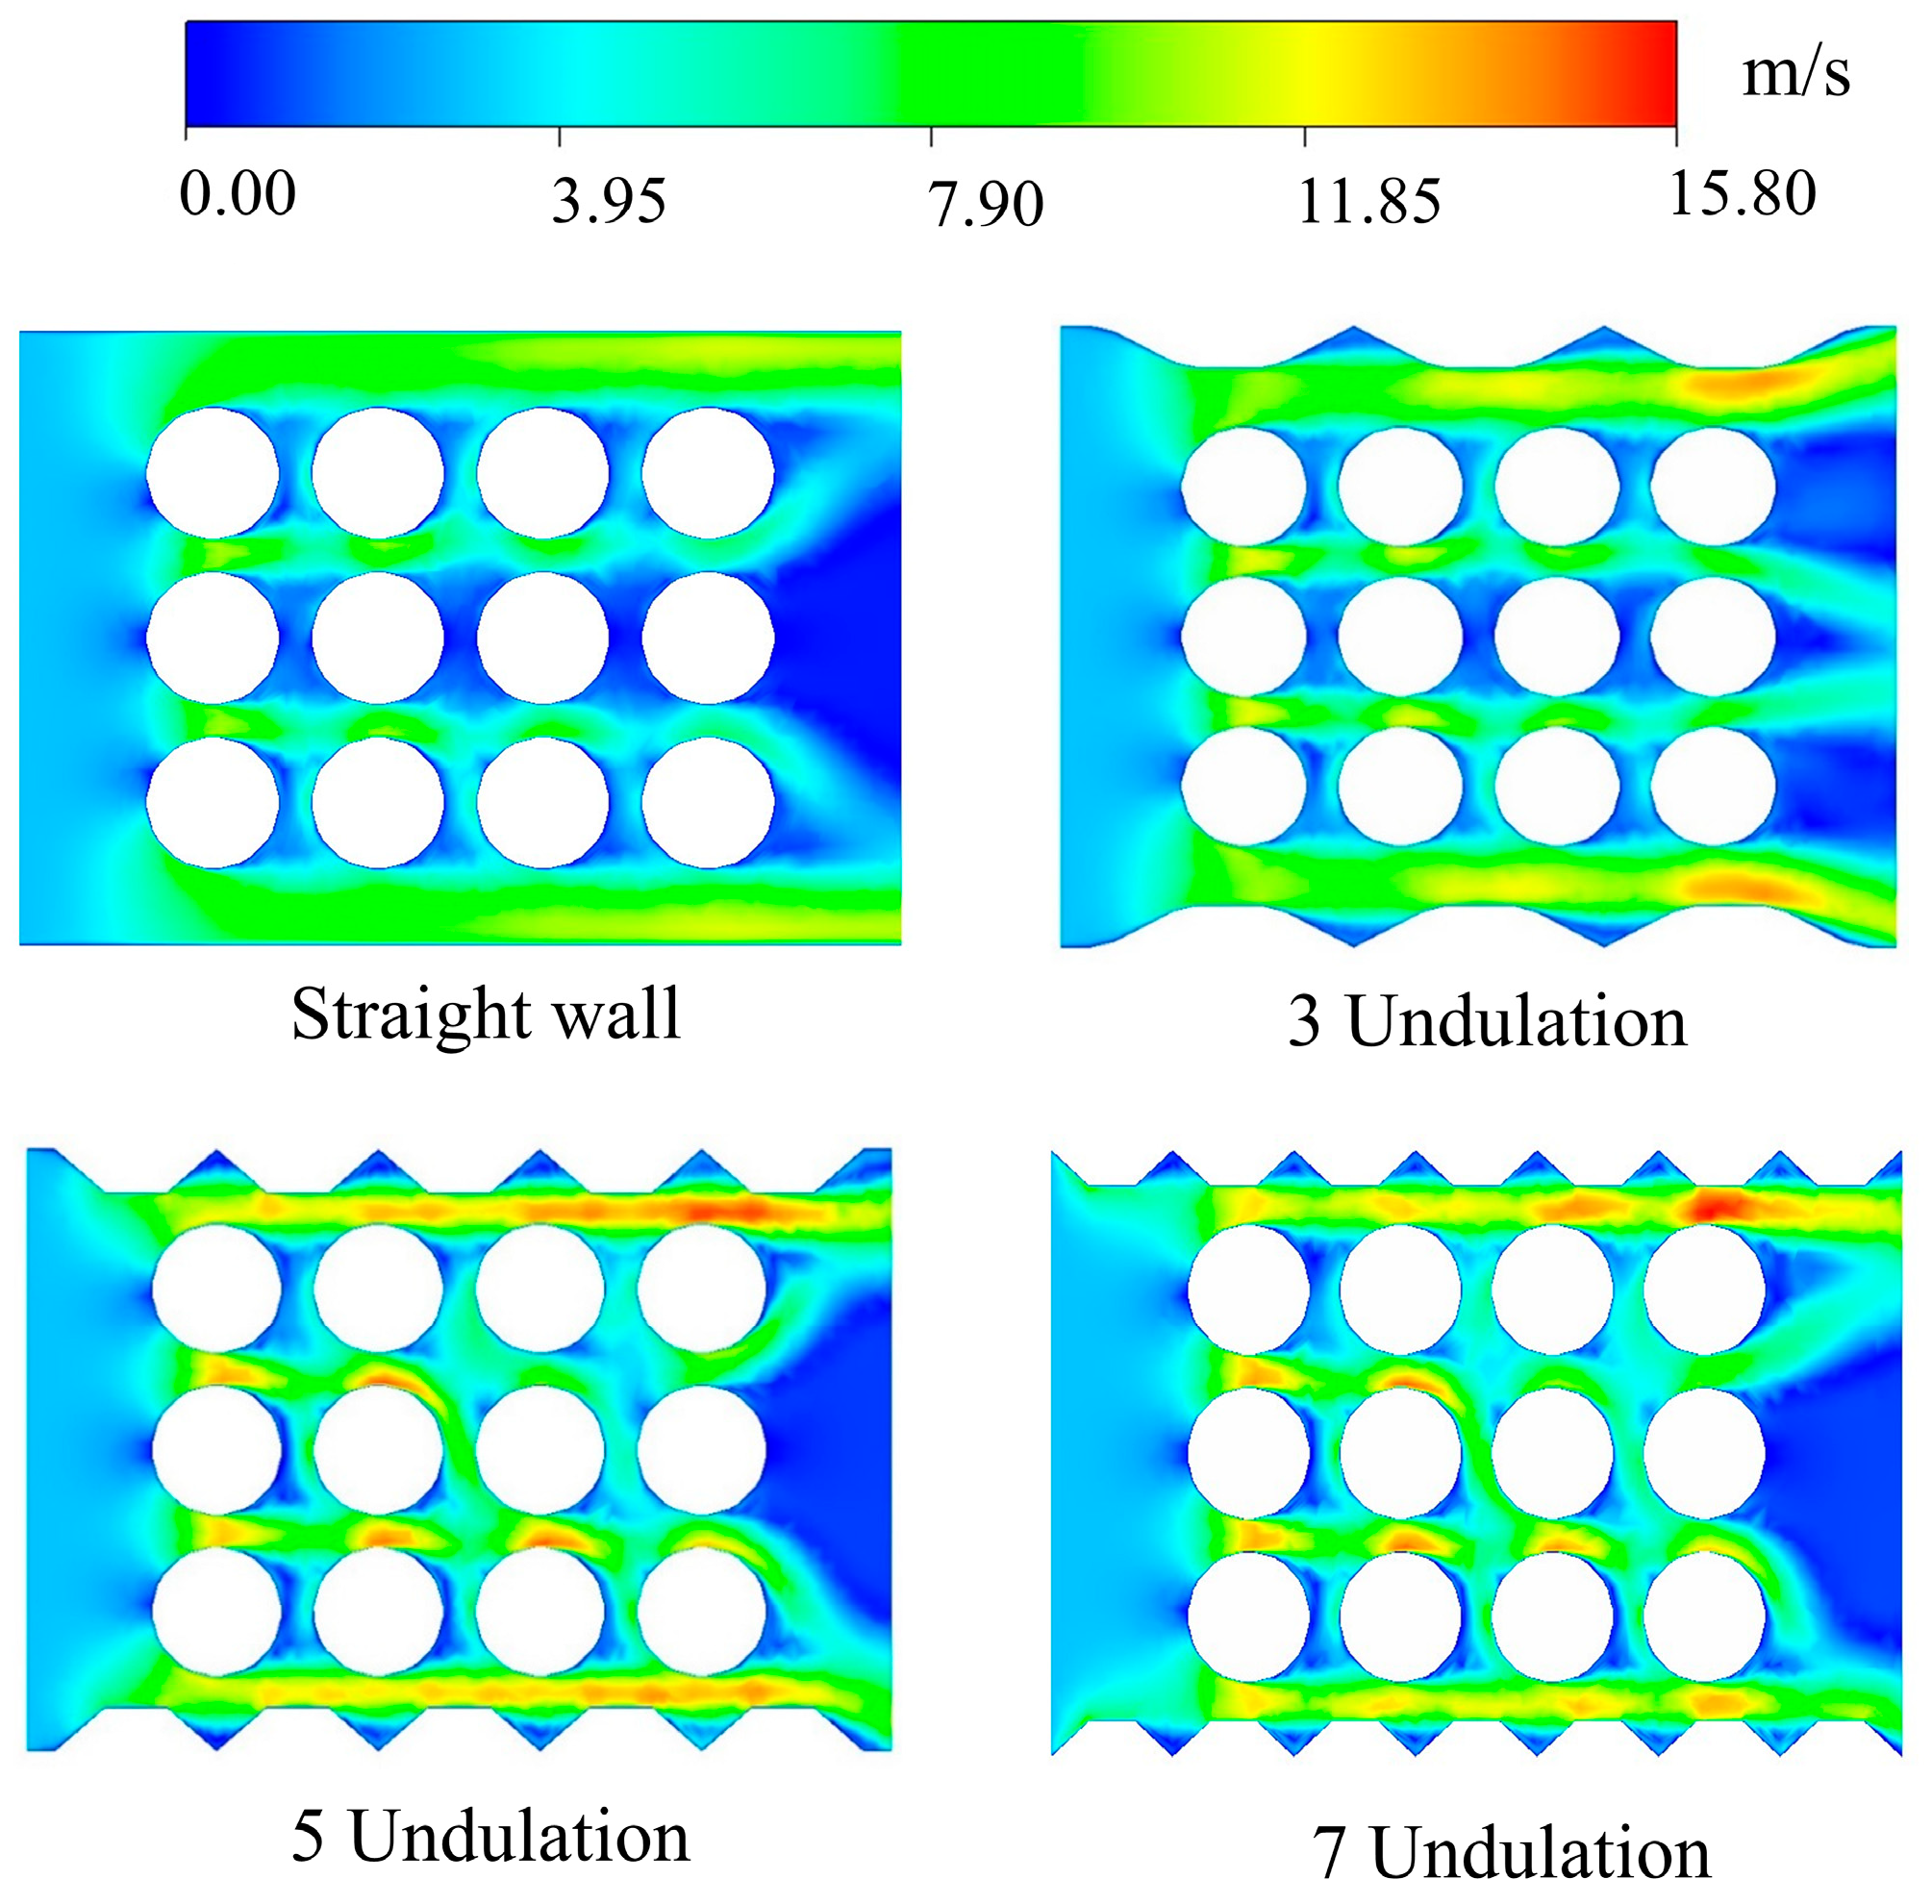
Figure 6 shows the velocity contours of the cooling airflow inside the BTMS for four different wall structures, under the conditions of an inlet air velocity of 3 m/s, a Tamb of 25 °C, and a 3C discharge cycle. It is evident that the trapezoidal protrusion structure significantly increases the airflow velocity within the BTMS compared to the straight-wall design. This enhancement occurs because the inclined surfaces of the protrusions constrict the flow passage, accelerating the cooling air. In contrast, within conventional straight-wall BTMS channels, airflow predominantly passes along the outer edges of the battery pack, limiting effective cooling in the central regions. For batteries located in the middle row, the airflow velocity in the leeward dead zone is nearly zero. However, after incorporating trapezoidal protrusions on the walls, the airflow velocity through the inter-battery gaps increases significantly. Notably, in the BTMS configuration with five trapezoidal protrusions, the internal airflow velocity can reach up to 15.8 m/s. Furthermore, compared to the straight-wall configuration, the leeward airflow dead zones behind the batteries are substantially reduced. When the number of trapezoidal protrusions increases from five to seven, the overall variation in airflow velocity within the BTMS remains minor, with some regions even exhibiting a decrease in velocity.
Figure 6.
Velocity contour cloud map of cooling airflow for BTMS with four wall structures.
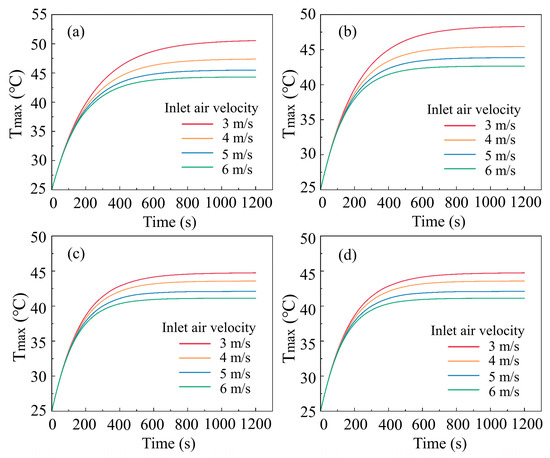
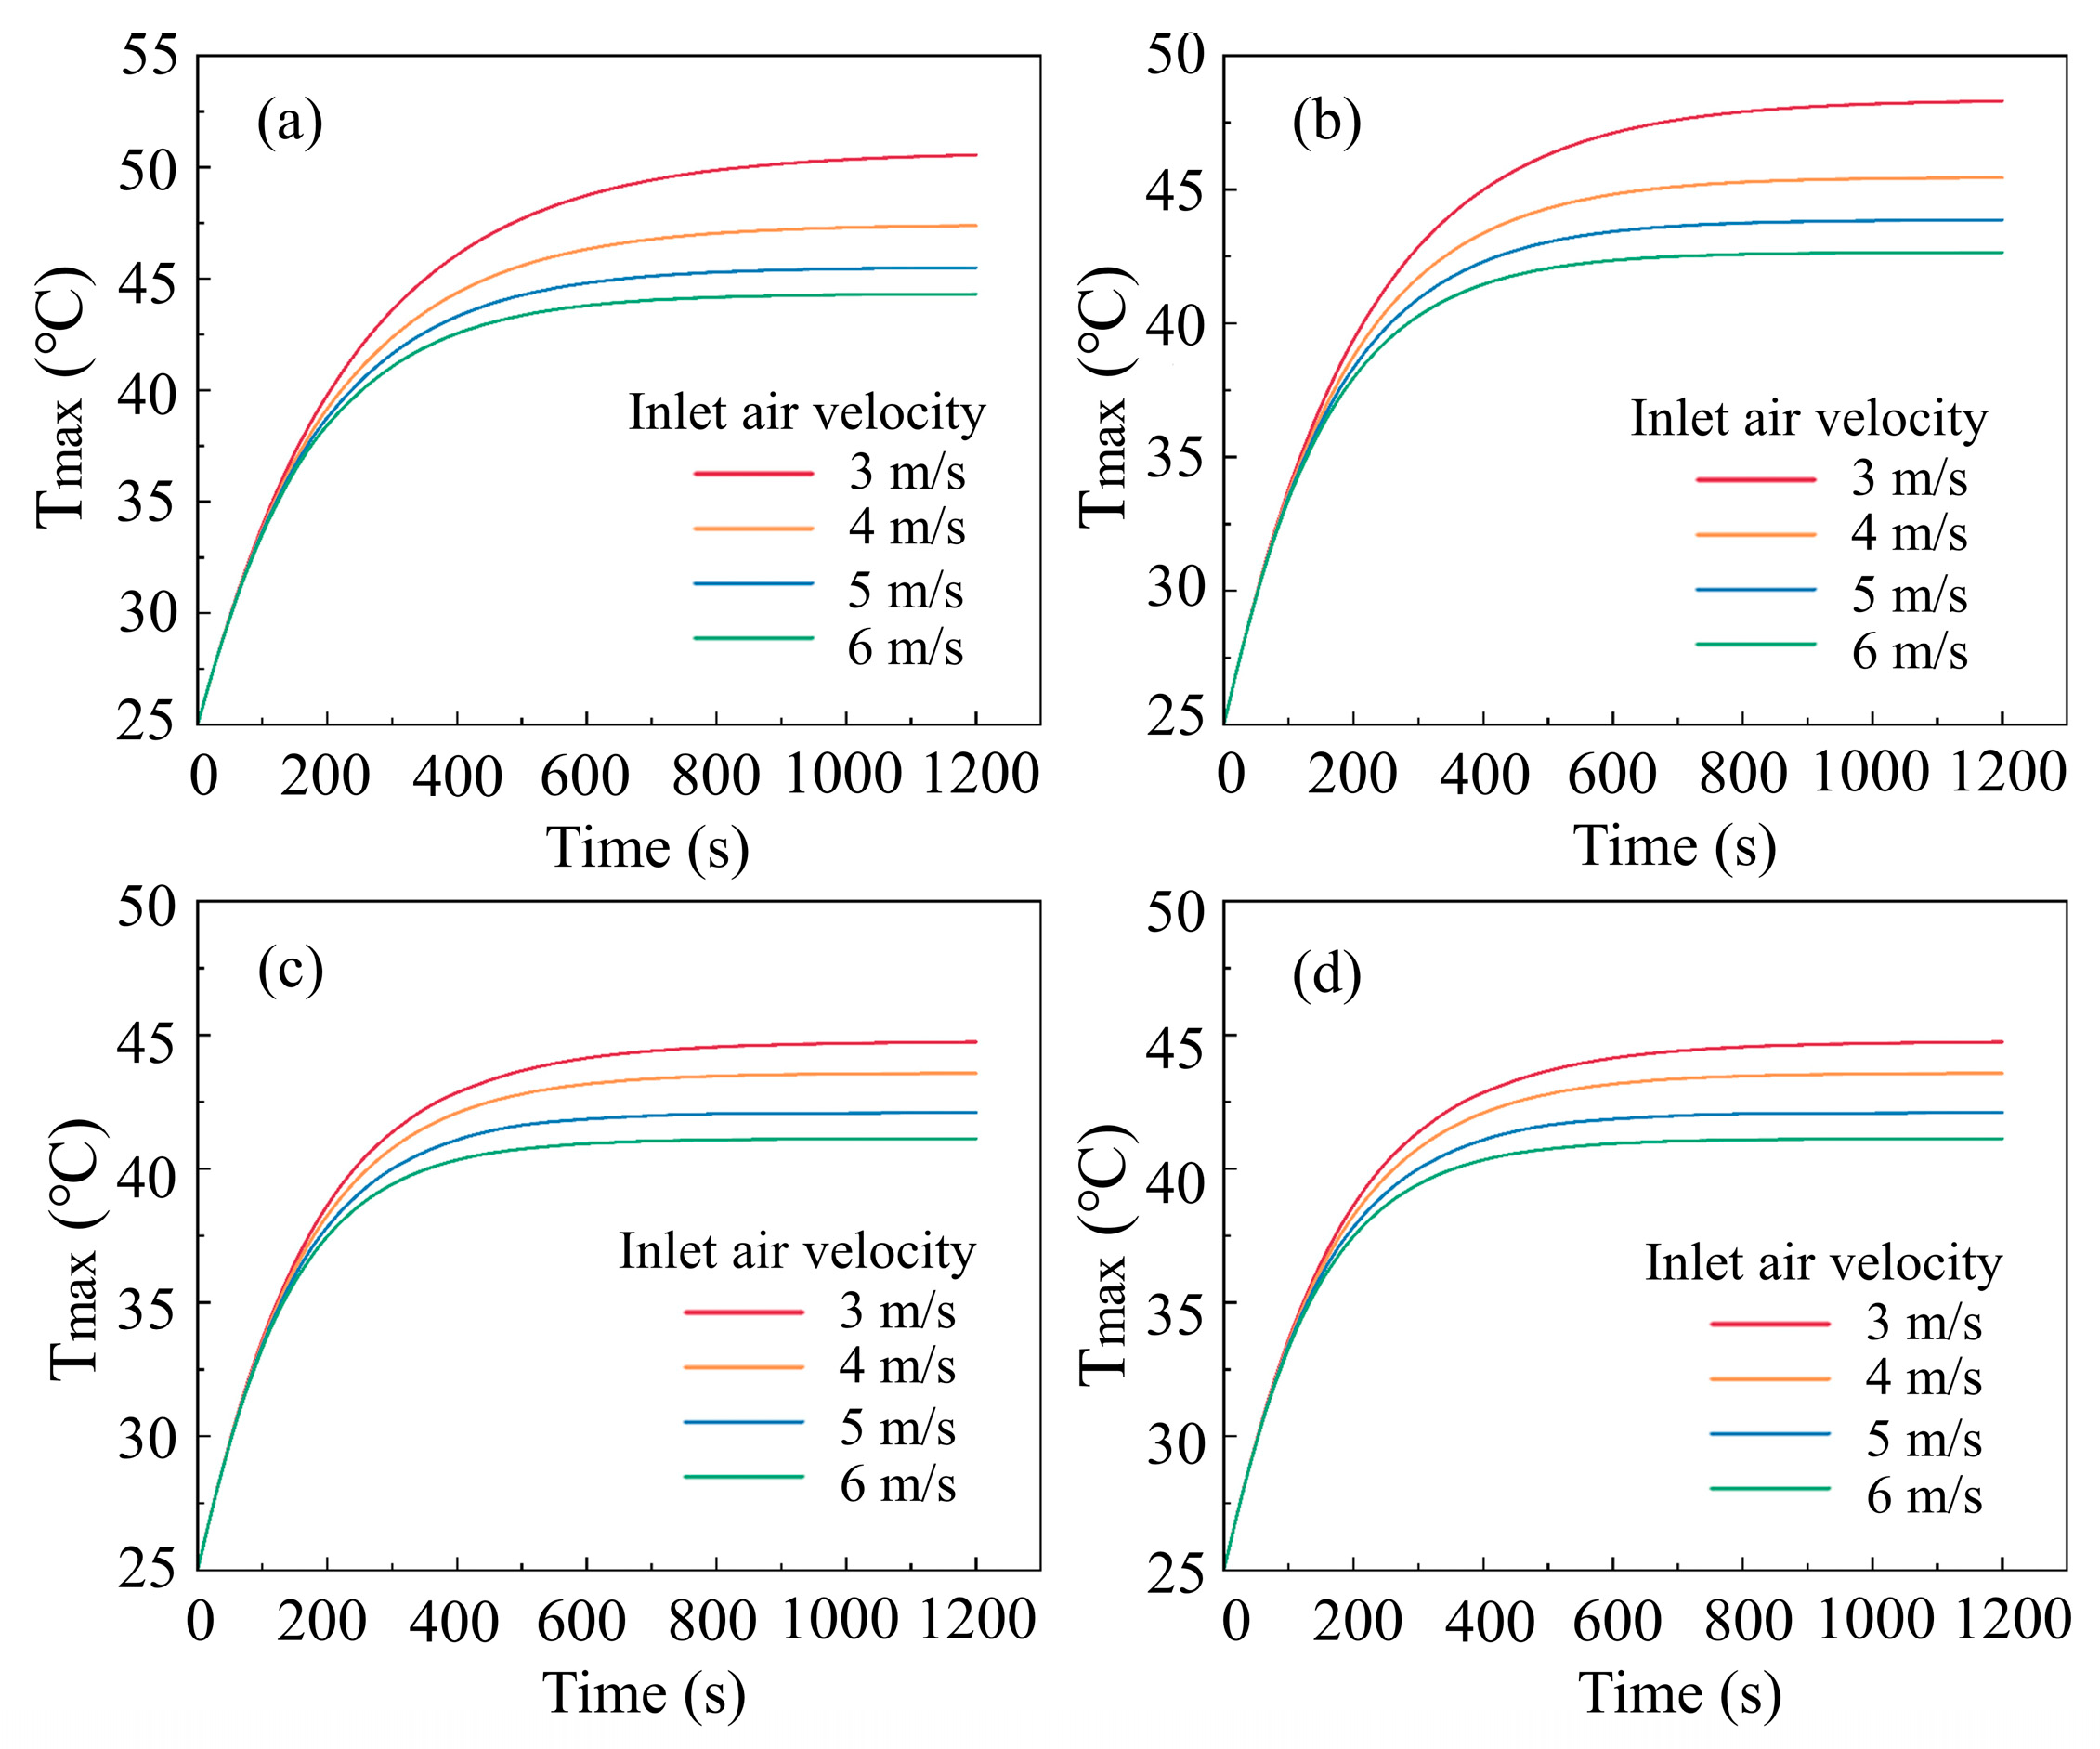
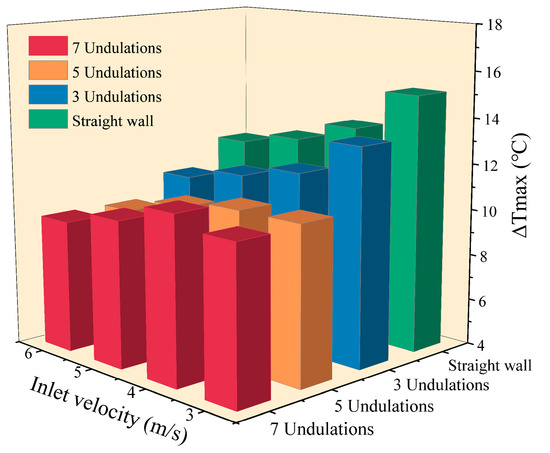
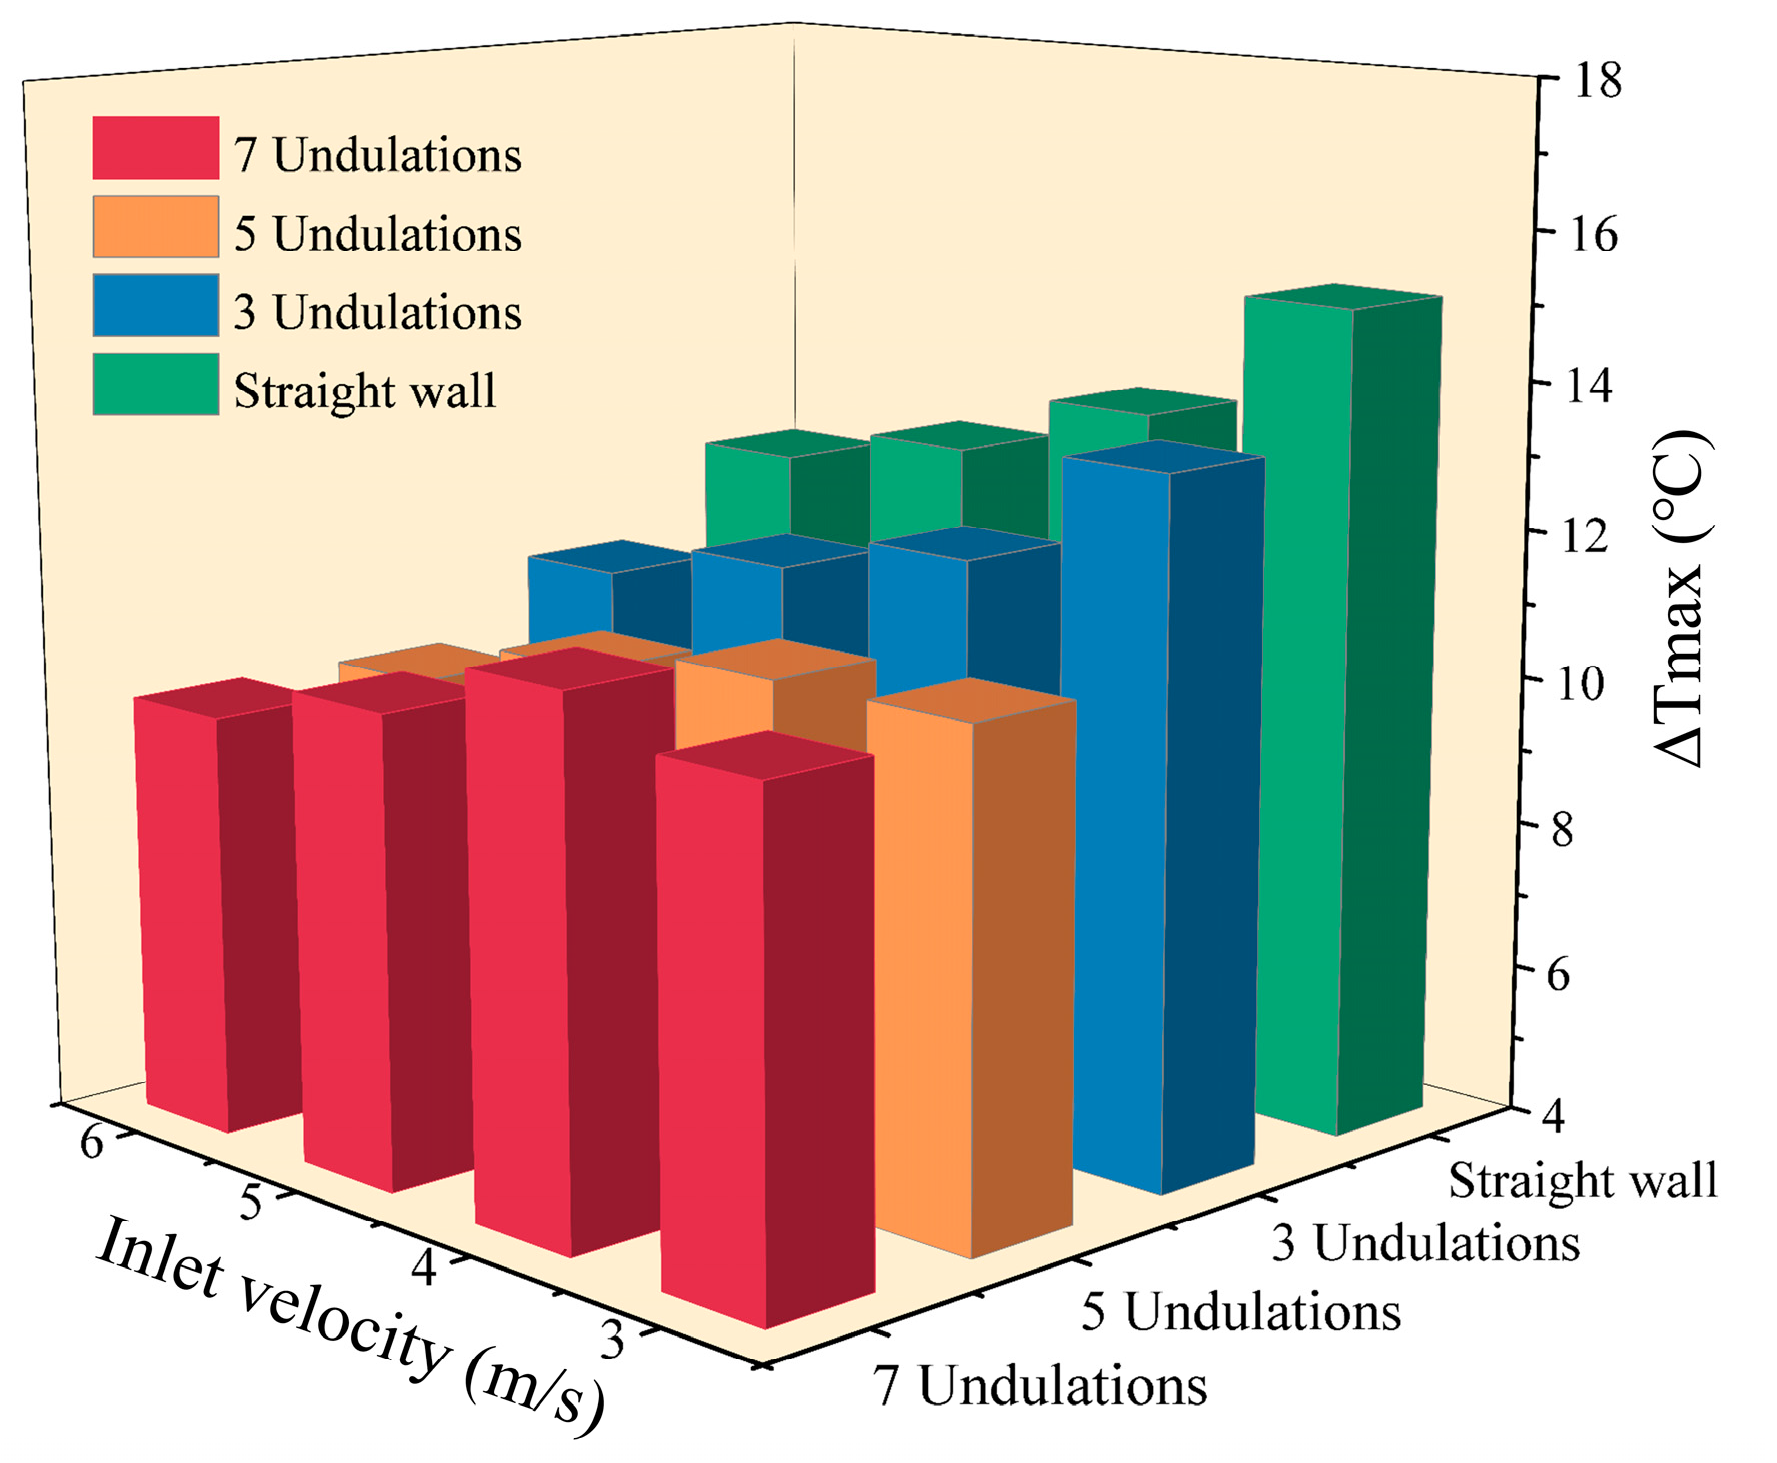
Figure 7 shows the Tmax after 3C discharge for BTMS with four different wall structures. The simulations are conducted under a 3C discharge rate, a Tamb of 25 °C, and four different inlet air velocities. Figure 7a corresponds to the straight-wall structure, while Figure 7b,c, and d represent the proposed trapezoidal-protrusion walls with 3, 5, and 7 protrusions, respectively. It can be observed that, regardless of the number of trapezoidal protrusions, the Tmax remains lower than that of the conventional straight-wall BTMS. Figure 8 presents the ΔTmax within the battery pack after a 3C discharge for the four BTMS configurations. When the wall structure incorporates trapezoidal protrusions, the ΔTmax is consistently reduced compared to the conventional straight-wall design. These results demonstrate that the novel wall structure proposed in this study significantly improves temperature uniformity in the BTMS.
Figure 7.
Comparison of Tmax for four BTMS types at different inlet air velocities: (a) straight wall, (b) 3 undulation, (c) 5 undulation and (d) 7 undulation.
Figure 8.
Comparison of ∆Tmax across four BTMS at different inlet air velocities.
The trapezoidal protrusion structure in the BTMS effectively addresses the key limitation of heat transfer degradation caused by boundary layer thickening in straight channels. By disrupting the thermal boundary layer and enhancing turbulence intensity through fluid dynamic and heat transfer mechanisms, this design achieves overall heat dissipation performance superior to that of conventional straight-wall air-cooled BTMS.
However, this improvement entails an increased pressure drop (ΔP). Under operating conditions of an inlet air velocity of 3 m/s, a Tamb of 25 °C and a 3C discharge rate, numerical simulations are performed to analyze the ΔP and fan power consumption for the four BTMS duct configurations. The simulated ΔP values are 81.65 Pa, 116.12 Pa, 213.70 Pa, and 215.23 Pa, respectively, with corresponding fan power consumptions of 5.5 W, 7.8 W, 14.4 W, and 14.5 W. Although the trapezoidal protrusion structure increases both ΔP and fan power consumption, it substantially enhances cooling performance. For instance, when transitioning from a straight-wall structure to a wall with five trapezoidal protrusions, Tmax decreases by 8 °C. Given the significant gain in thermal performance, the associated increase in power consumption is considered acceptable.
3.2. Effect of Fin Structure Shape
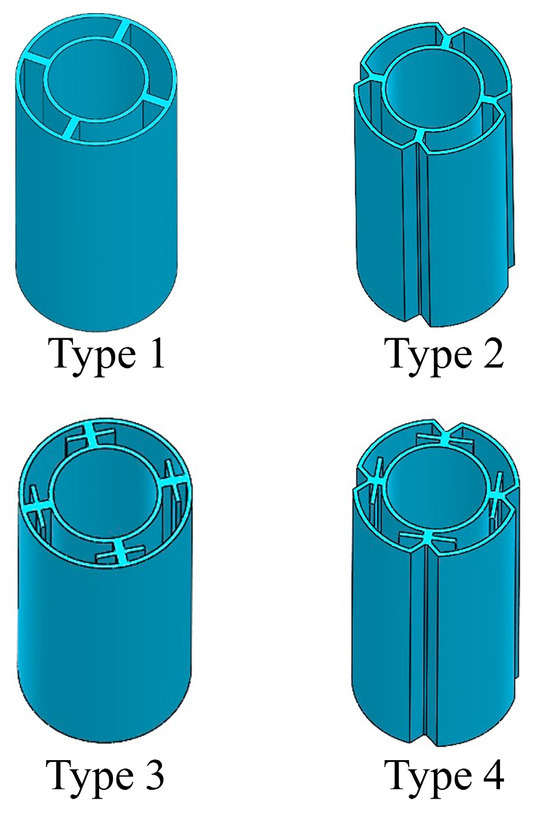
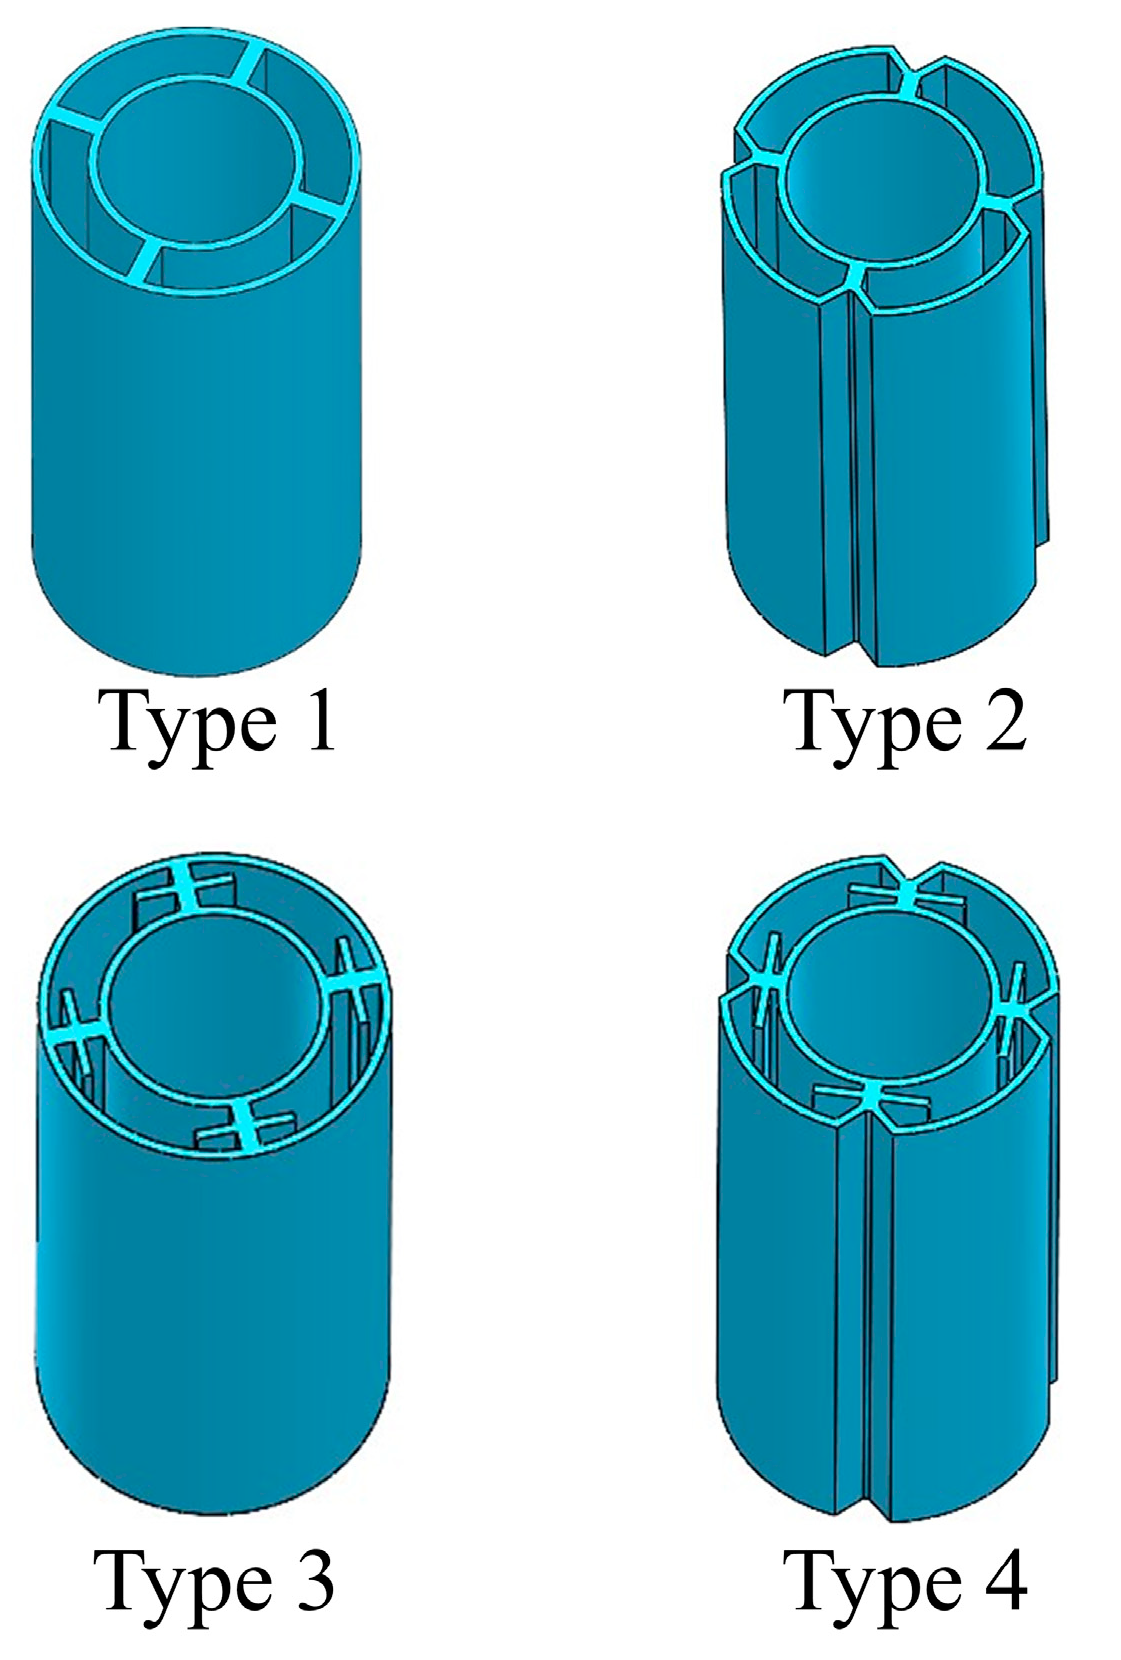
Previous studies have shown that a wall structure with five trapezoidal protrusions significantly improves the cooling performance of the BTMS. Therefore, subsequent simulation models are based on this configuration. However, relying solely on air cooling offers limited effectiveness. To address this, this section adopts a hybrid cooling strategy for the air-cooled BTMS by integrating heat sink fins and PCM. The fin geometry is illustrated in Figure 9. Four fin structures are investigated, all featuring inner and outer rings but differing in their intermediate support connections: Type 1 uses rectangular bars; Type 2 employs a branched profile; Type 3 adopts a crossed profile; and Type 4 combines both branched and crossed profiles. The gaps between the fins are filled with PCM.
Figure 9.
Four types of fin structures.
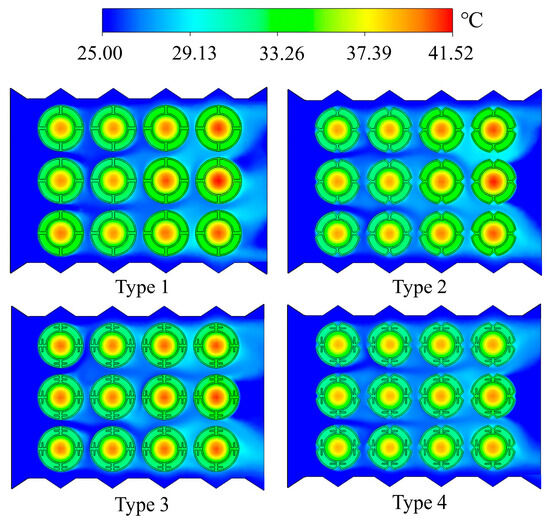
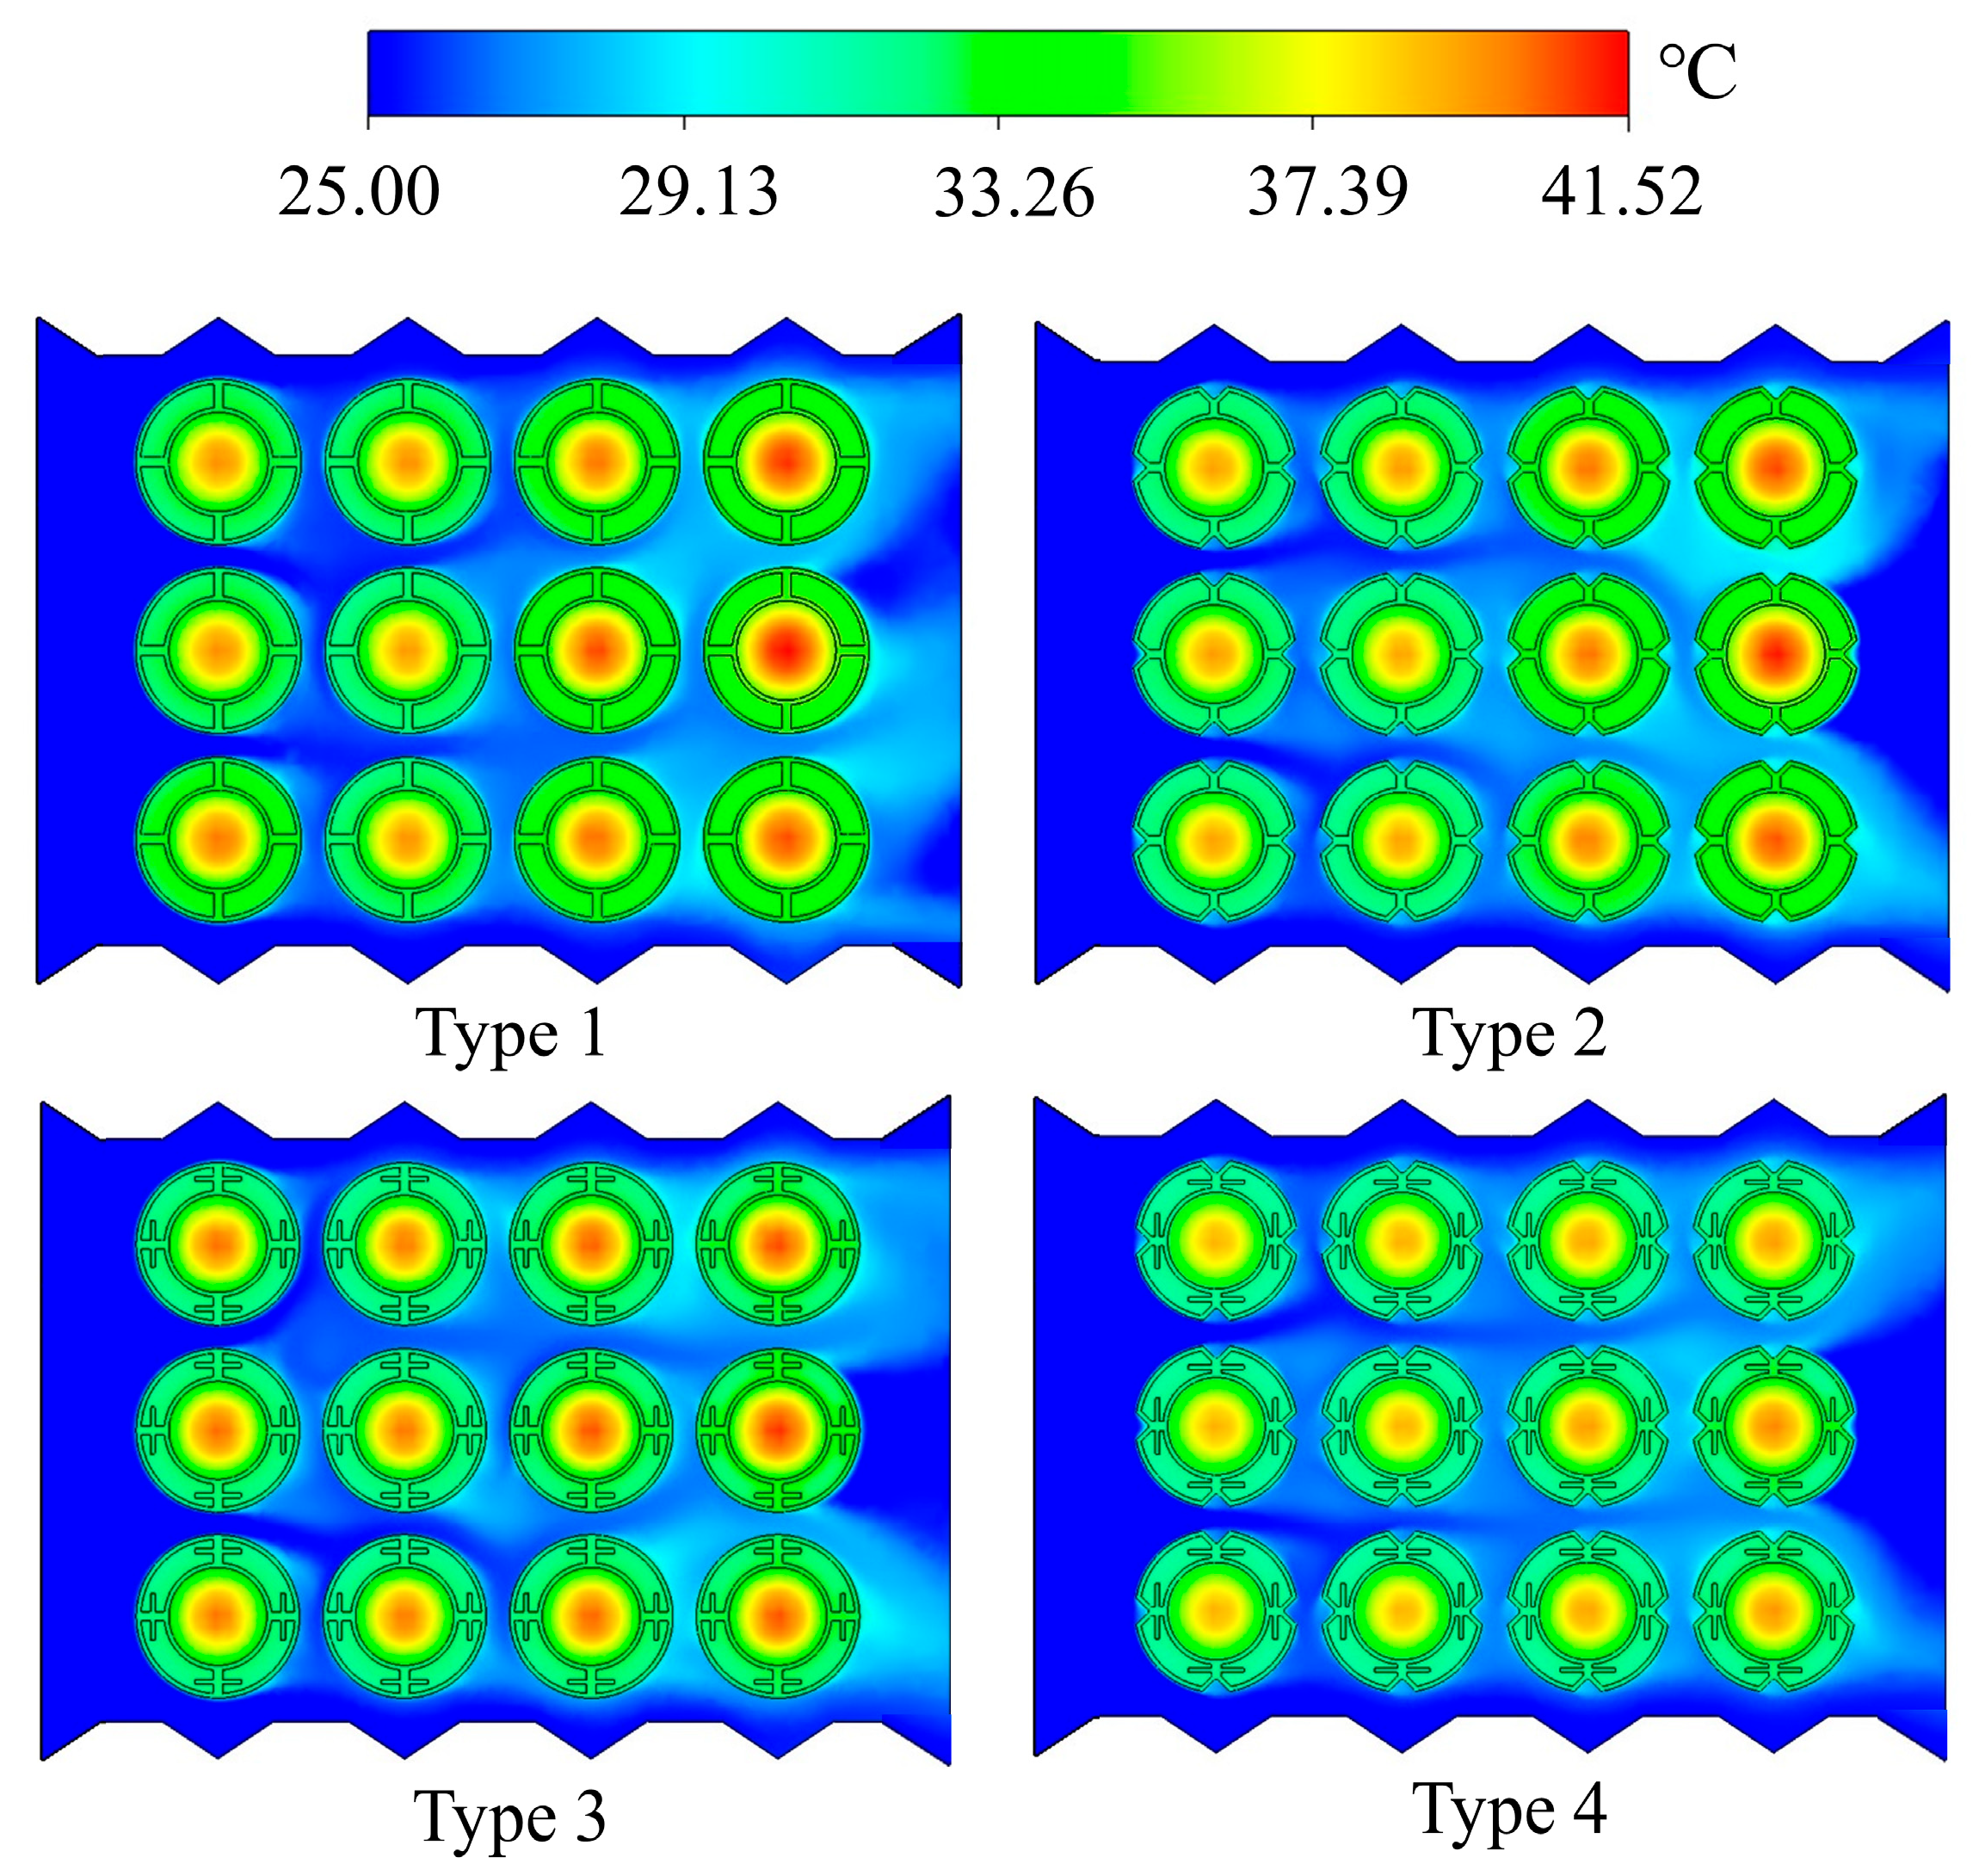
Four distinct fin types, integrated with PCM, are applied to the air-cooled BTMS. Under operating conditions of a 3C discharge rate, a Tamb of 25 °C and an inlet air velocity of 3 m/s, the temperature contours on the XY cross-section of the BTMS are shown in Figure 10. It is evident that integrating fins and PCM significantly enhances the cooling capacity of the BTMS. Compared to a BTMS with the same wall structure but relying solely on air cooling, the Tmax of the Type 1 design is reduced by approximately 4 °C. Among the four fin configurations, Type 4 demonstrates the best cooling performance. According to the cross-sectional temperature contours, the Tmax at the battery center in the Type 4 model reaches 39.41 °C. These results indicate that the Type 4 fin structure is more effective in improving heat dissipation and overall cooling performance than the other three designs.
Figure 10.
Temperature cloud map of BTMS after applying different fin structures.
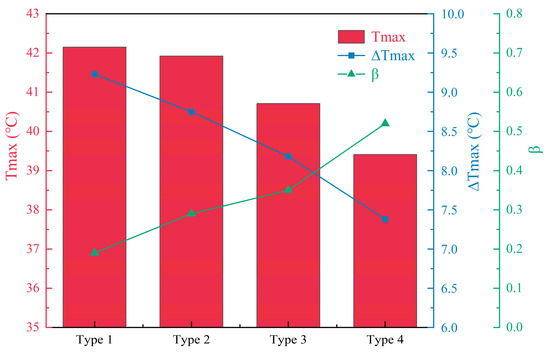
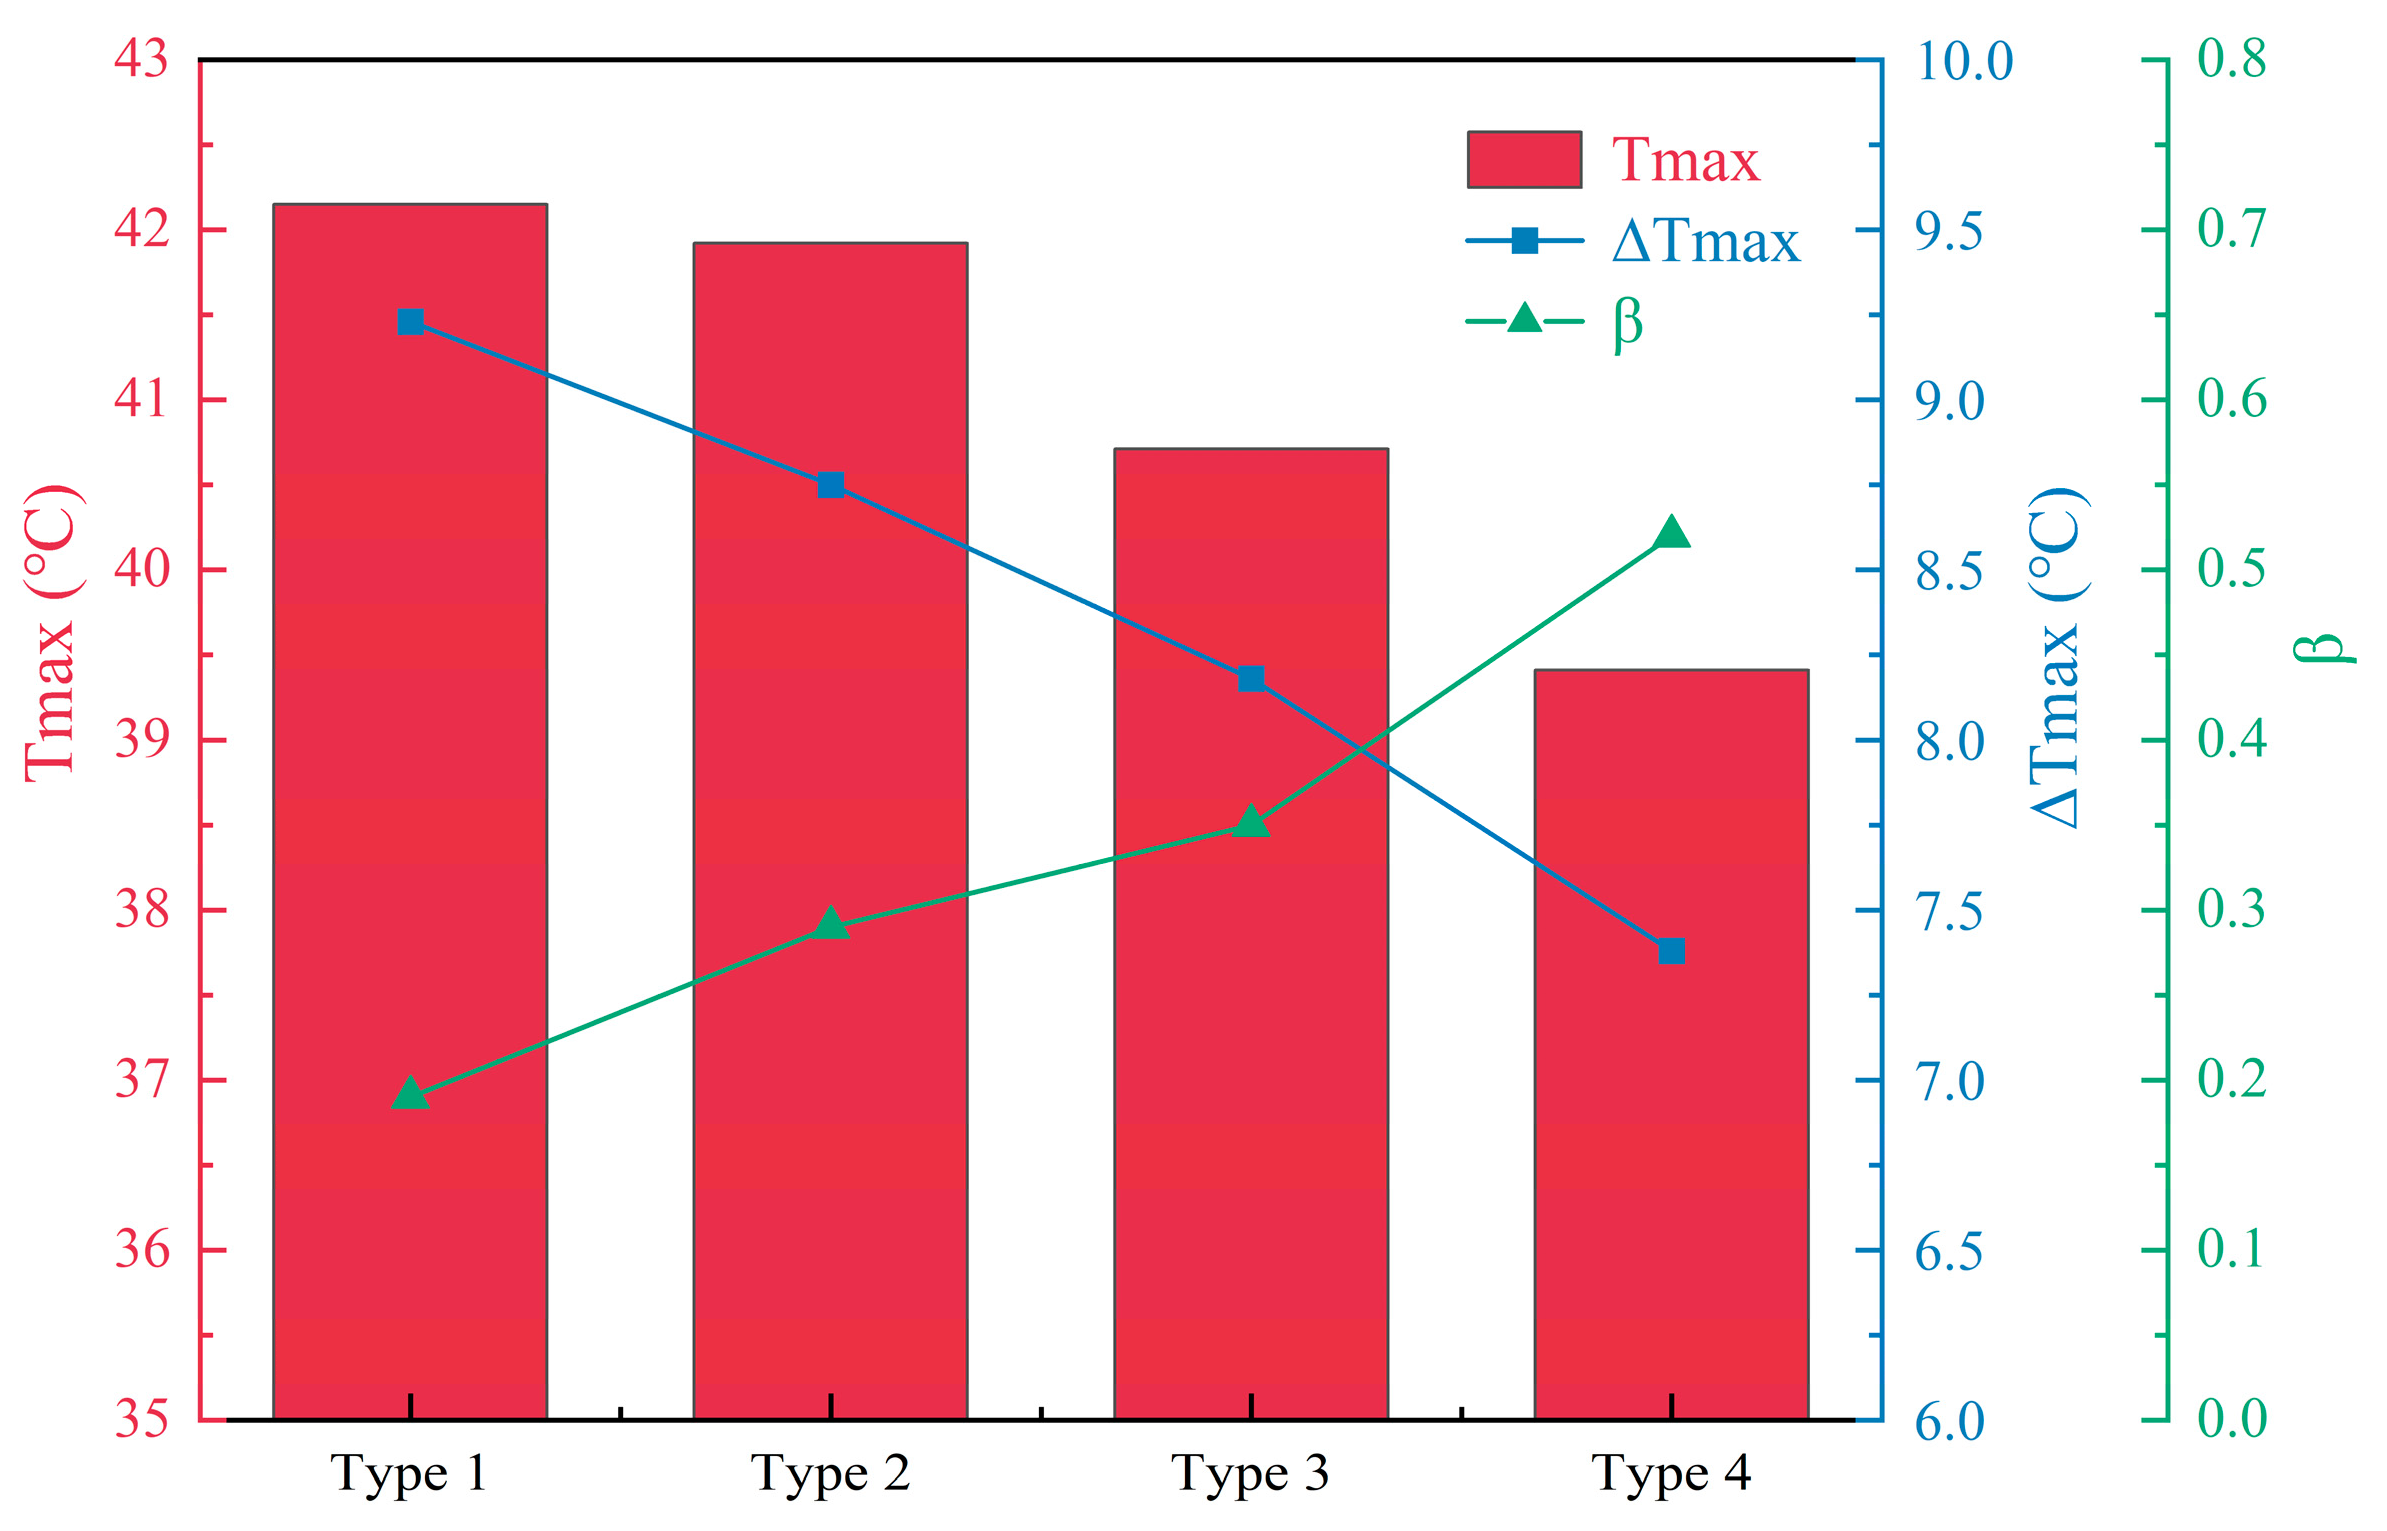
Additional numerical simulation results are provided in Figure 11. The simulations are conducted under a 3C discharge rate, a Tamb of 25 °C and an inlet air velocity of 3 m/s. Regarding the Tmax metric for the entire BTMS, the Type 4 BTMS reduces temperatures by 2.74 °C, 2.51 °C, and 1.3 °C compared to the other systems, respectively. Considering that temperature uniformity is also crucial for BTMS, in terms of the ∆Tmax across the battery pack, the Type 4 BTMS reduces this by 1.85 °C, 1.37 °C, and 0.8 °C, respectively, compared to other systems.
Figure 11.
Comparison of Tmax, ∆Tmax, and β data for BTMS after applying four fin structures.
Regarding the state of the PCM, the β for all four BTMS configurations is between 0.2 and 1, indicating that the PCM remains in a safe and reliable operational state. Furthermore, the β value for Type 4 is 0.52, which shows that the PCM undergoes complete phase transition during the heat absorption process.
3.3. Effect of the Number of Internal Connectors in the Fins
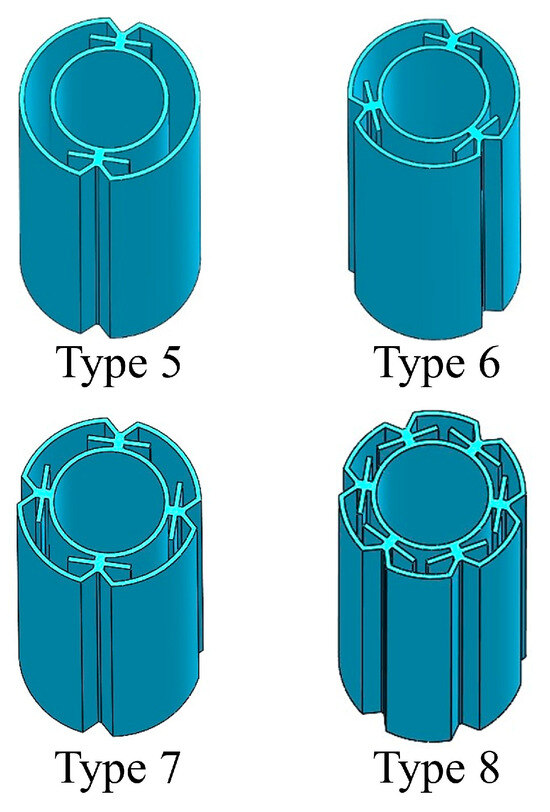
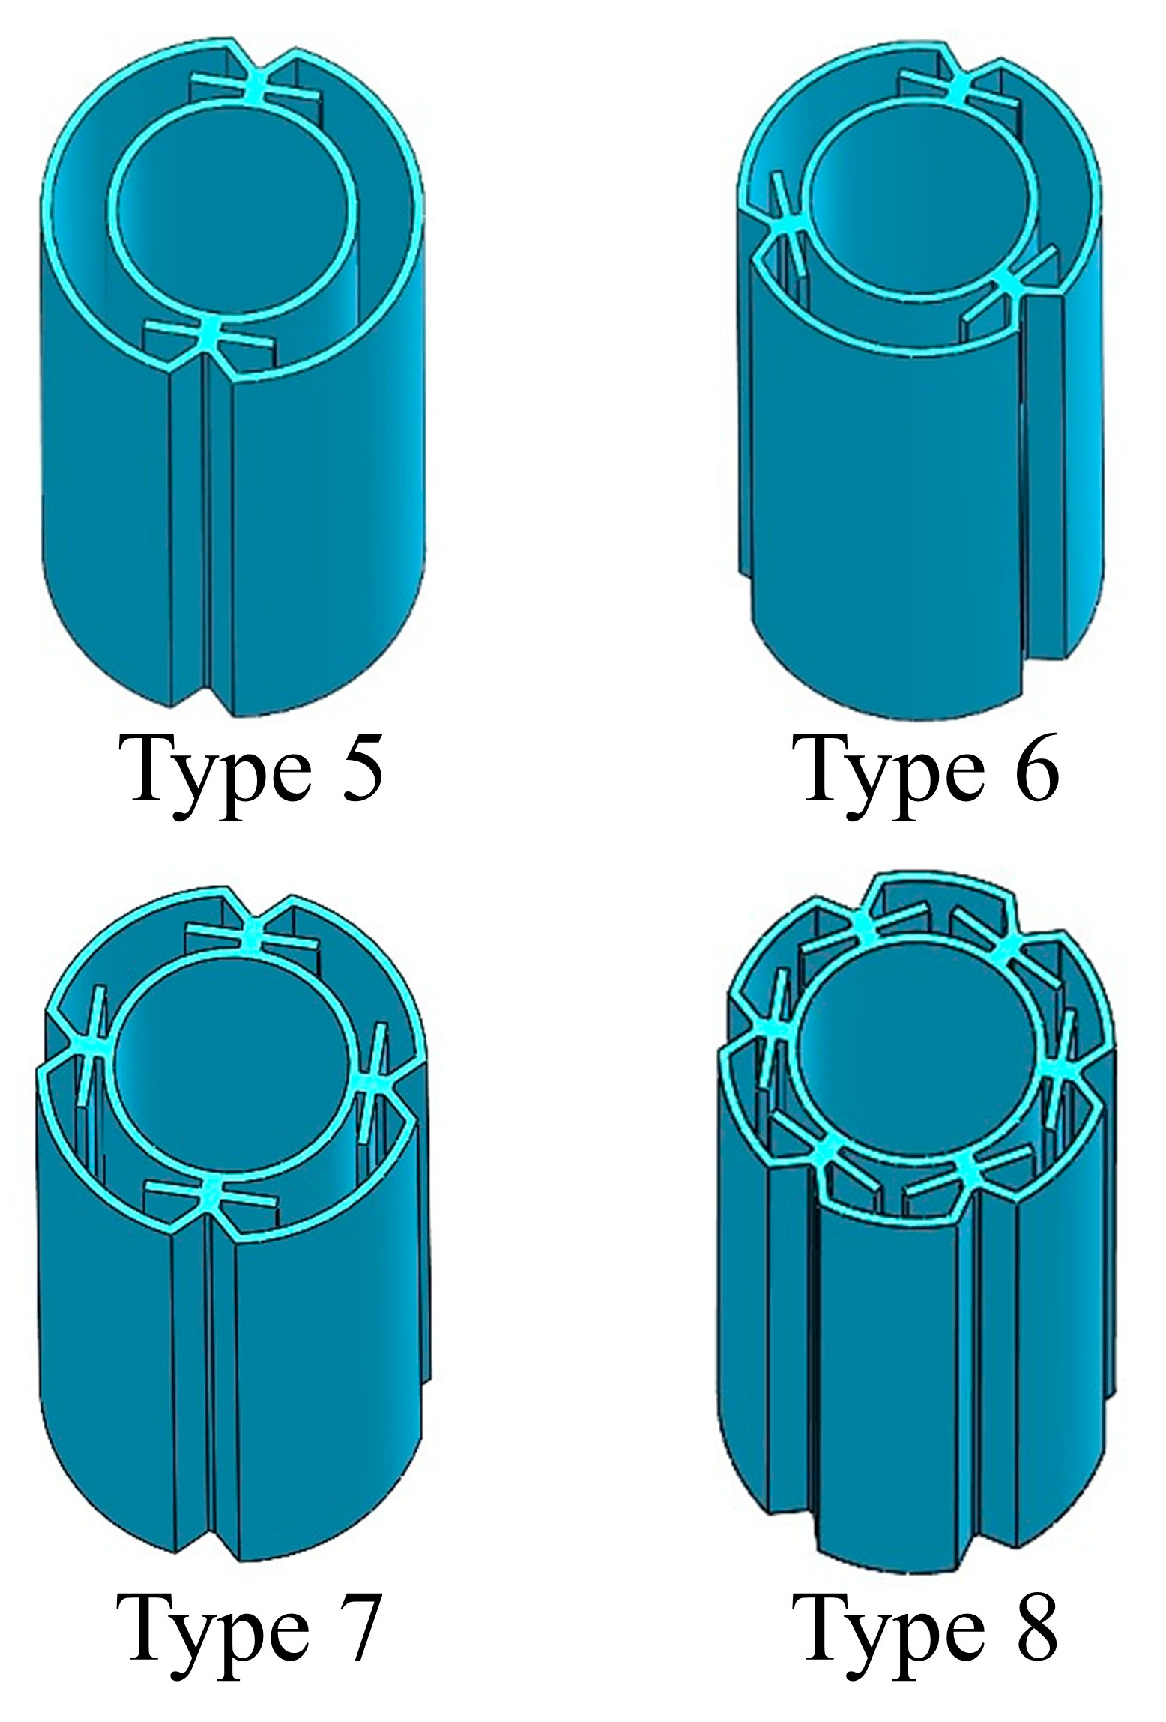
Building on the previous findings, the internal fin structure combining branched and cross-connected supports significantly enhances BTMS cooling performance. This section further investigates how the number of these connecting elements affects the system’s heat dissipation. Four fin designs with varying numbers of connectors are analyzed, as illustrated in Figure 12.
Figure 12.
Fin structure with varying numbers of connecting elements.
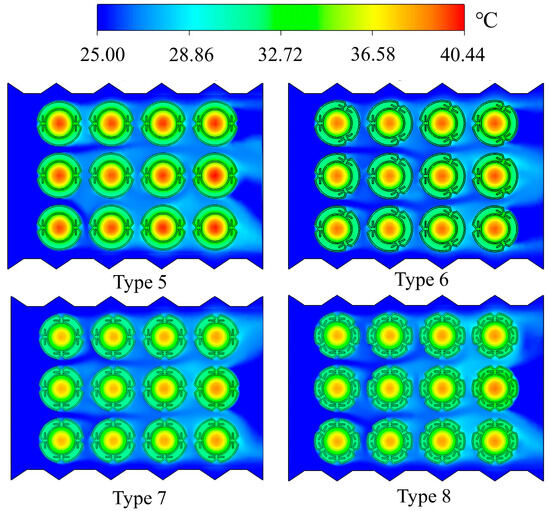
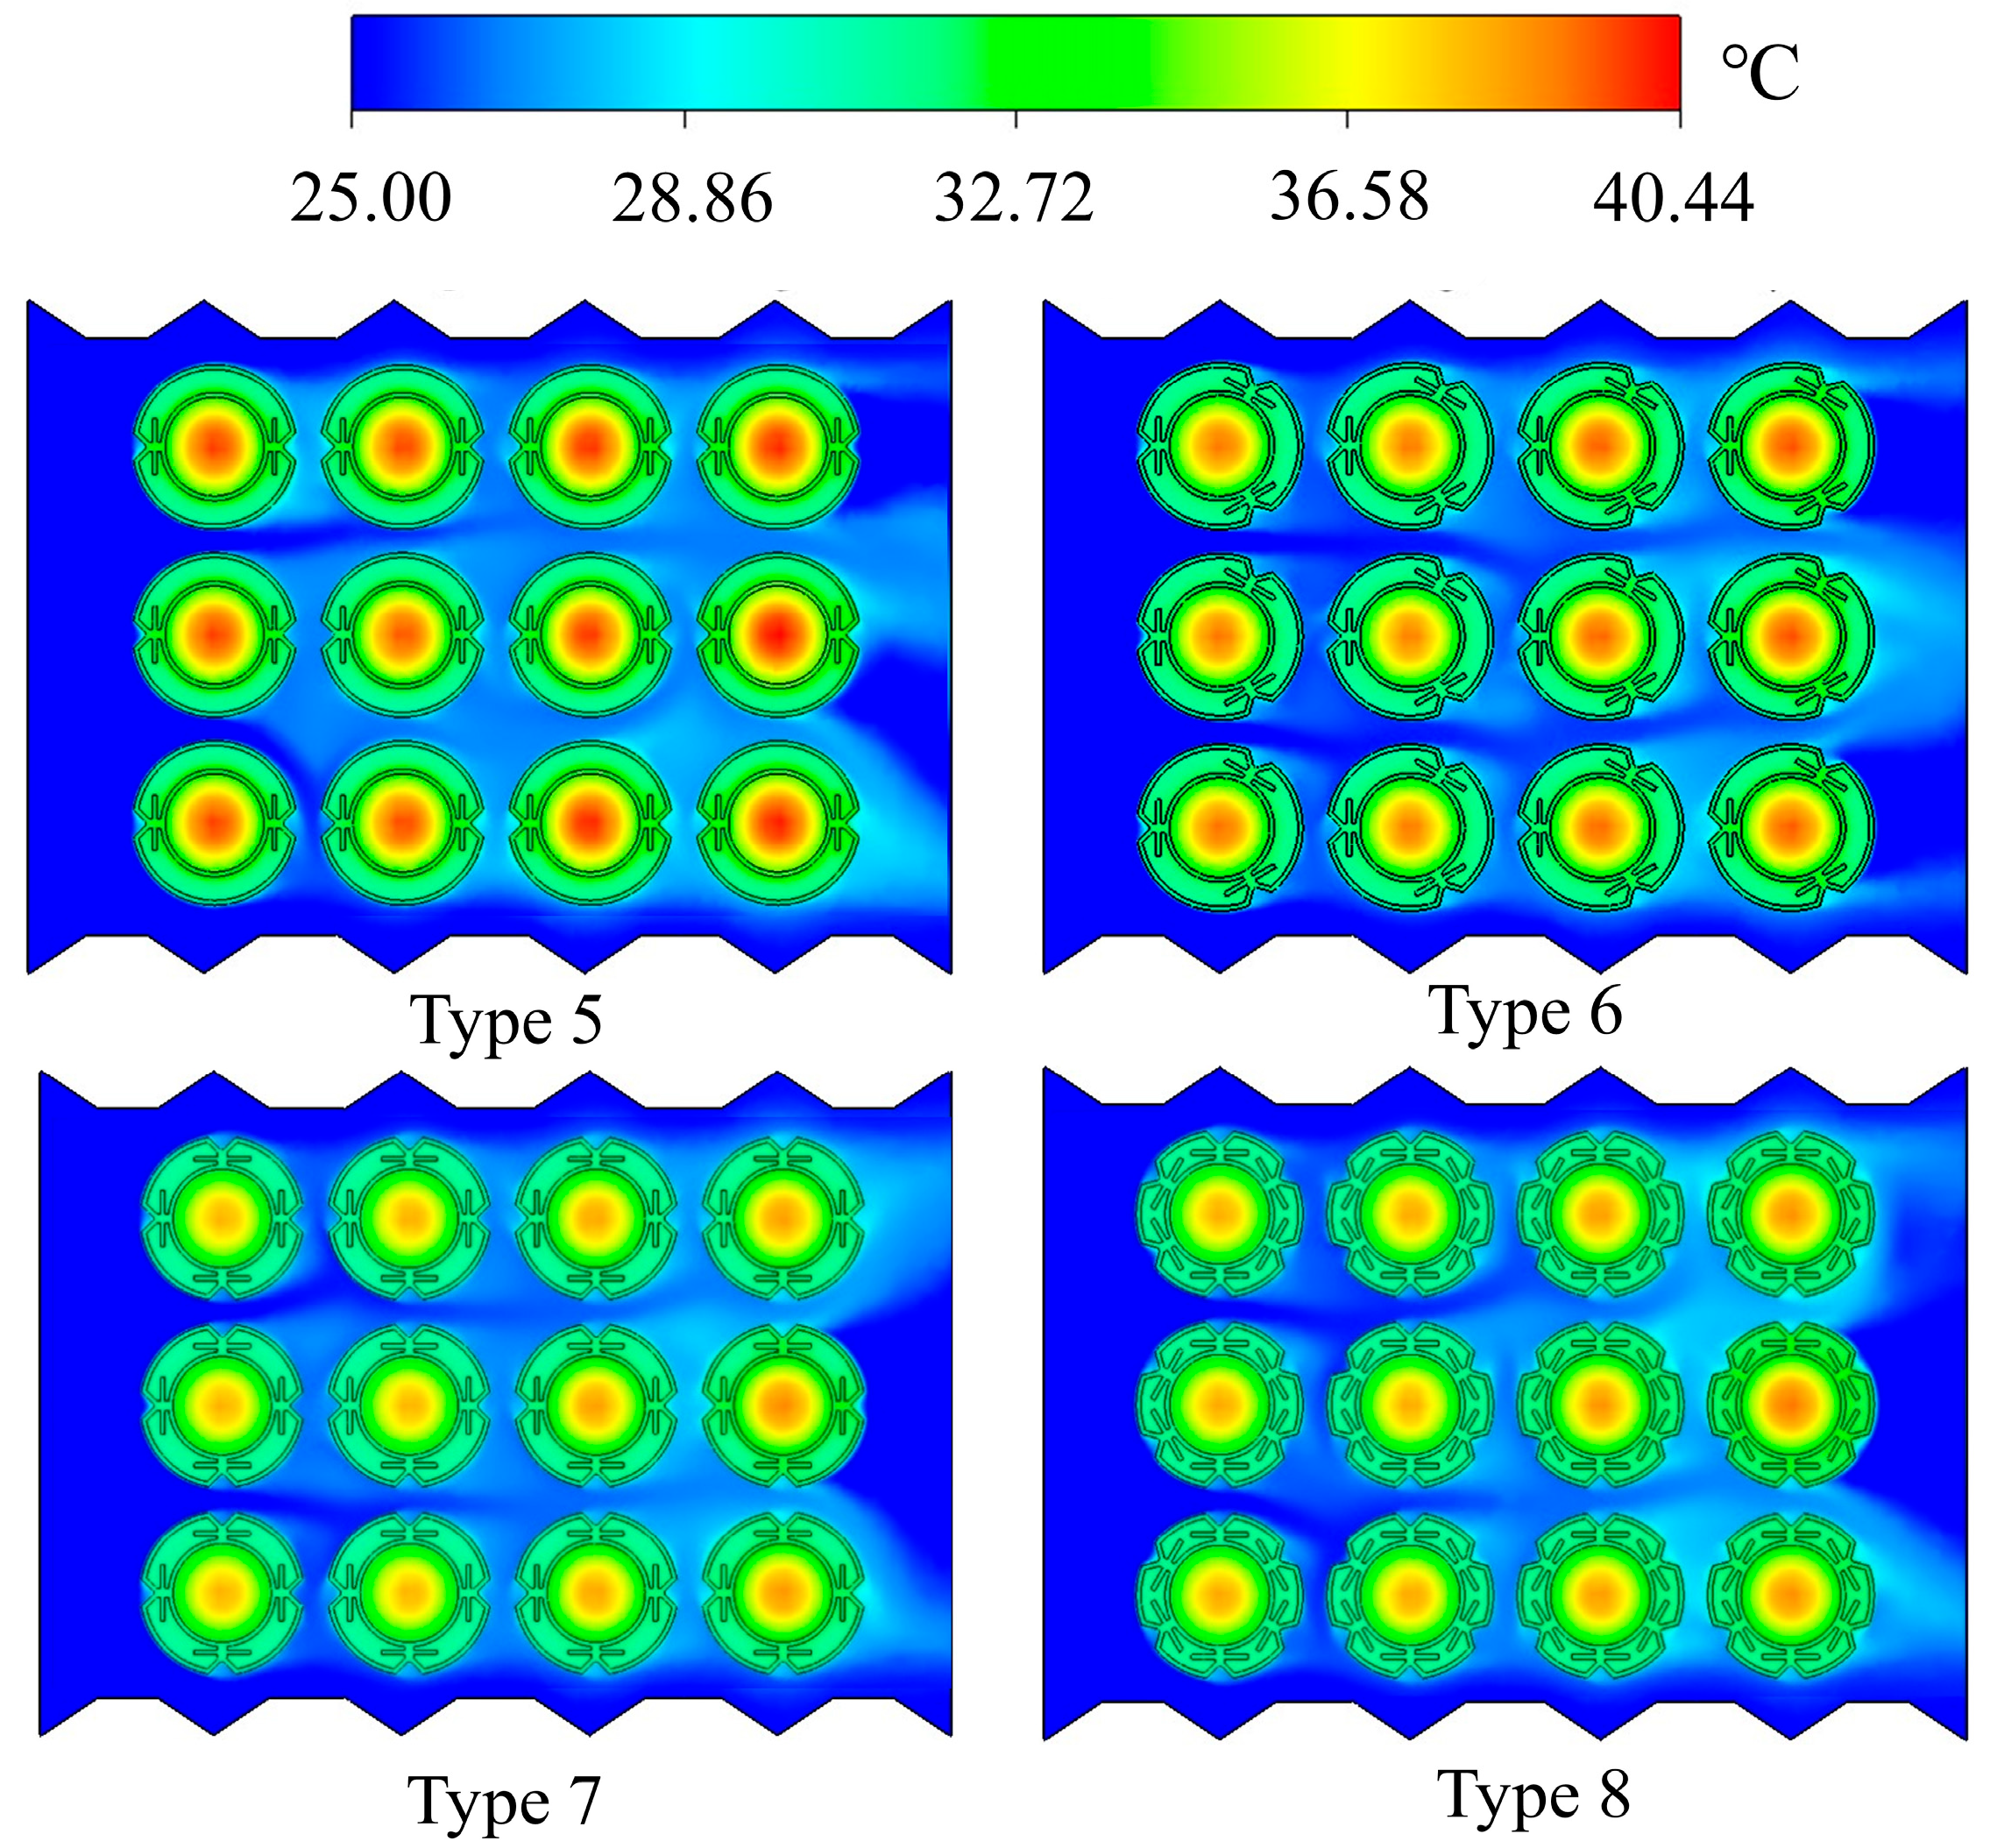
The four fin designs are applied to the air-cooled BTMS and tested under a 3C discharge rate, a Tamb of 25 °C and an inlet air velocity of 3 m/s. The resulting temperature contours on the XY cross-section of the BTMS are presented in Figure 13. The temperature contours indicate that as the number of internal connectors in the fins increases, Tmax gradually decreases. A significant reduction in Tmax is observed when the connector count rises from 2 to 4. In contrast, further increasing the number from 4 to 6 results in only a minor change of 0.1 °C. It should be noted that adding connectors also increases the weight and cost of the BTMS.
Figure 13.
Temperature contour map of BTMS for fins with different numbers of internal links.
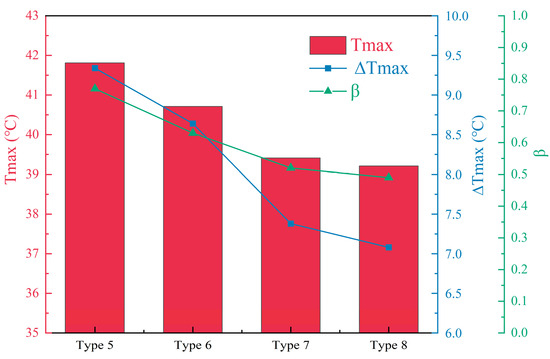
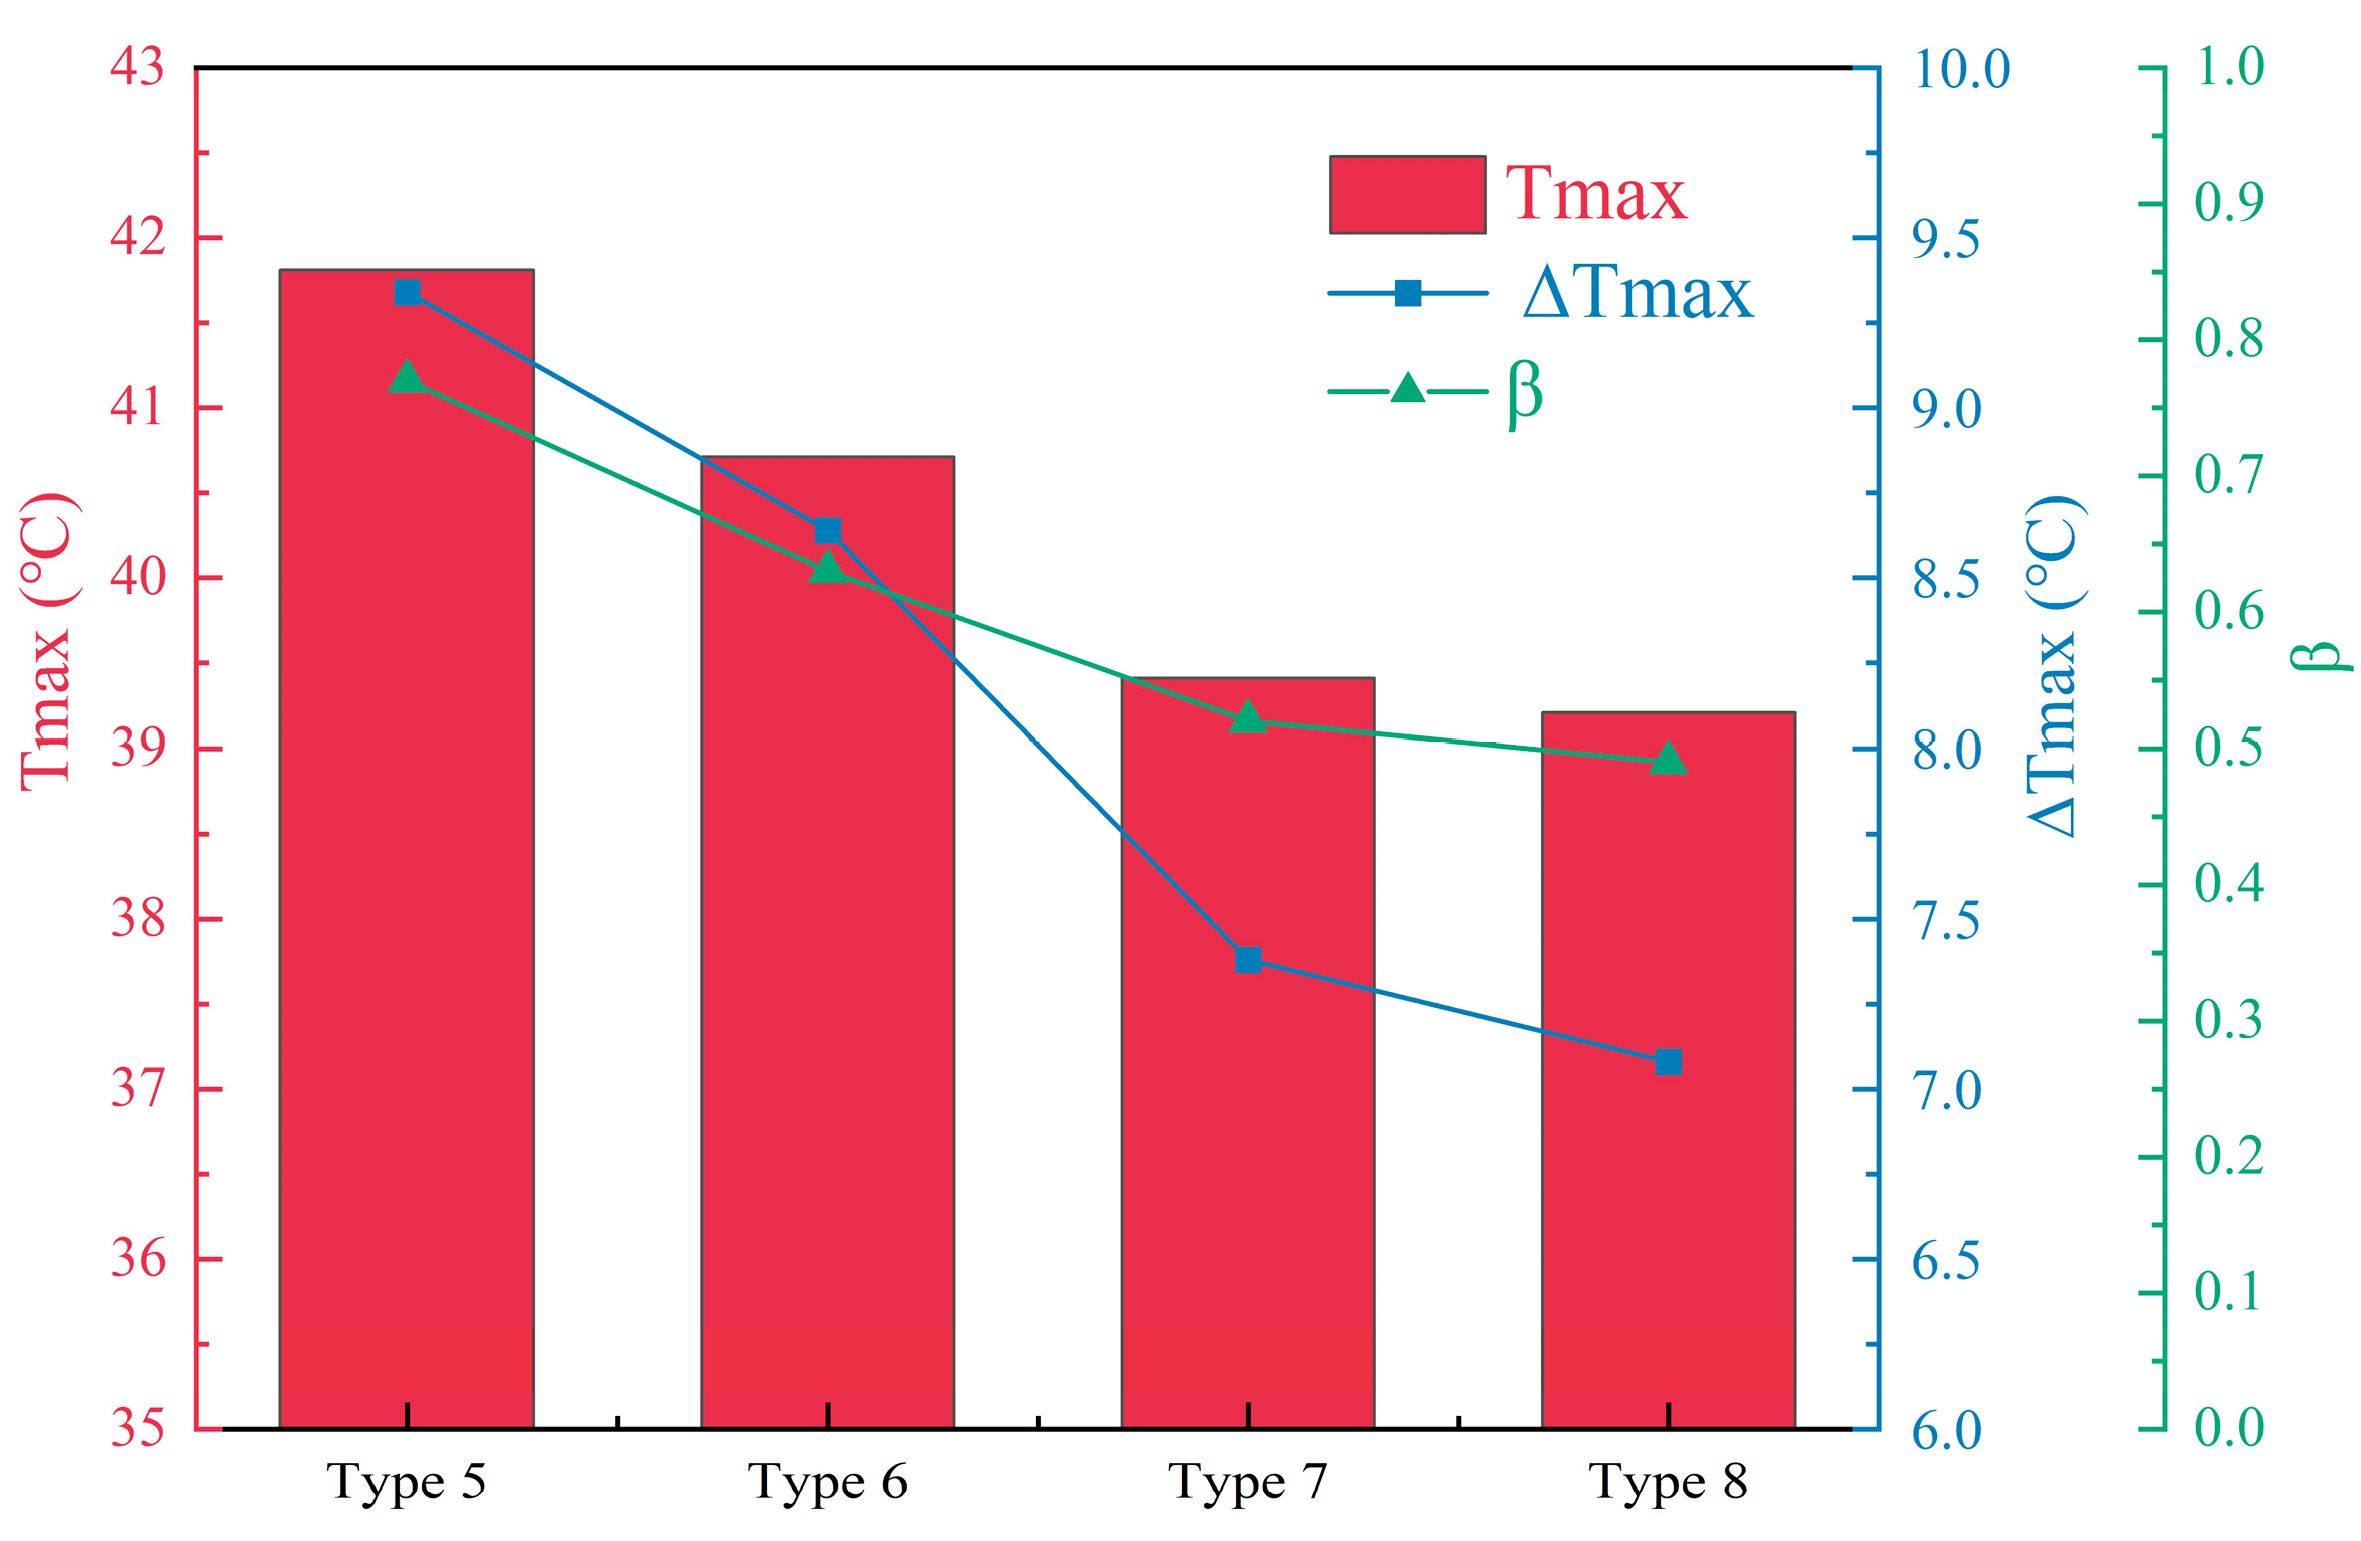
Figure 14 presents the thermal performance data of each BTMS configuration as a function of the number of internal fin connectors. The simulations are performed under a 3C discharge rate, a Tamb of 25 °C and an inlet air velocity of 3 m/s. The Tmax, ∆Tmax and β all exhibit the same trend with a decreasing pattern. The values of all metrics decrease significantly from Type 5 to Type 7. Although a further decrease is observed from Type 7 to Type 8, the reduction is minimal. This indicates that increasing the number of internal connectors in the fins does not always lead to substantial performance gains.
Figure 14.
The Tmax, ∆Tmax and β data comparison of BTMS with different numbers of internal connections in fins.
3.4. Effect of Fin and PCM Placement on the Battery
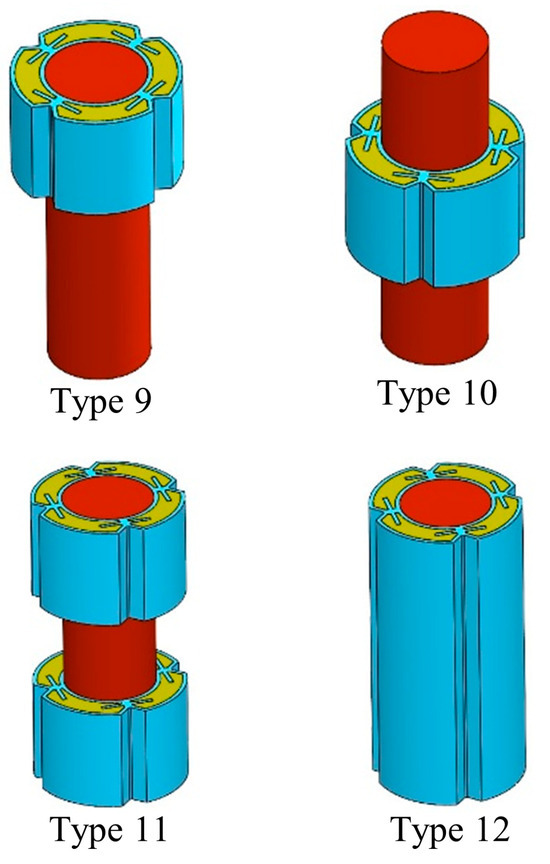
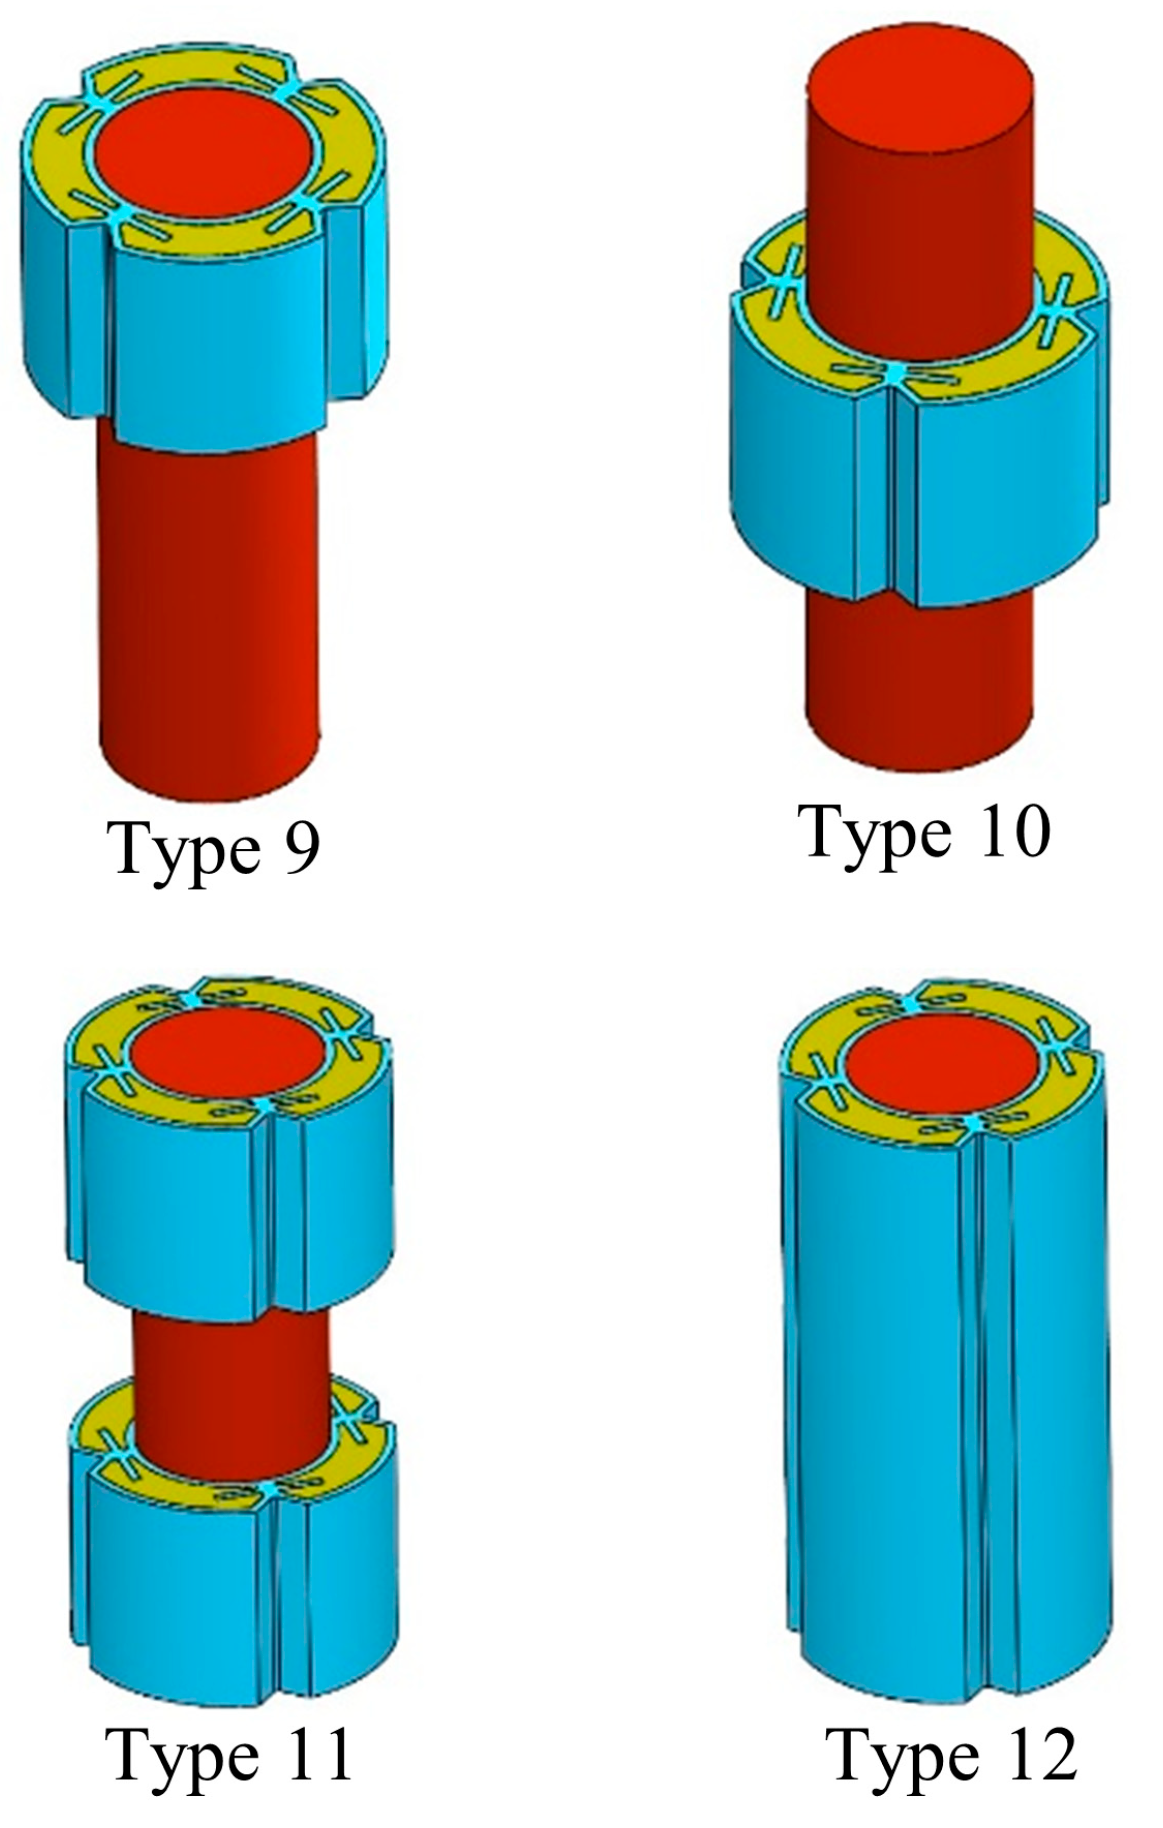
Building on the previous findings, the Type 7 fin structure demonstrated superior cooling performance and thermal balance in the BTMS. Therefore, this section further investigates the effect of different fin and PCM layouts based on the Type 7 design. The axial space around the cylindrical battery is divided into three equal sections along its length. Four layout configurations are examined: fins and PCM placed at the top, middle, top and bottom, and along the entire battery surface. The corresponding structural schematics are shown in Figure 15.
Figure 15.
Schematic diagram of PCM wrapped around different positions on the battery and fin structure.
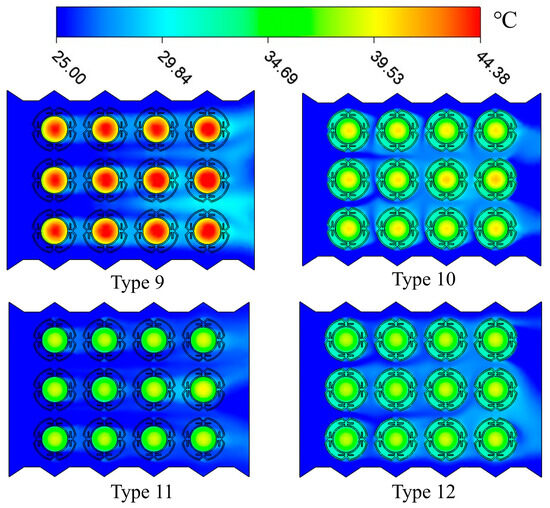
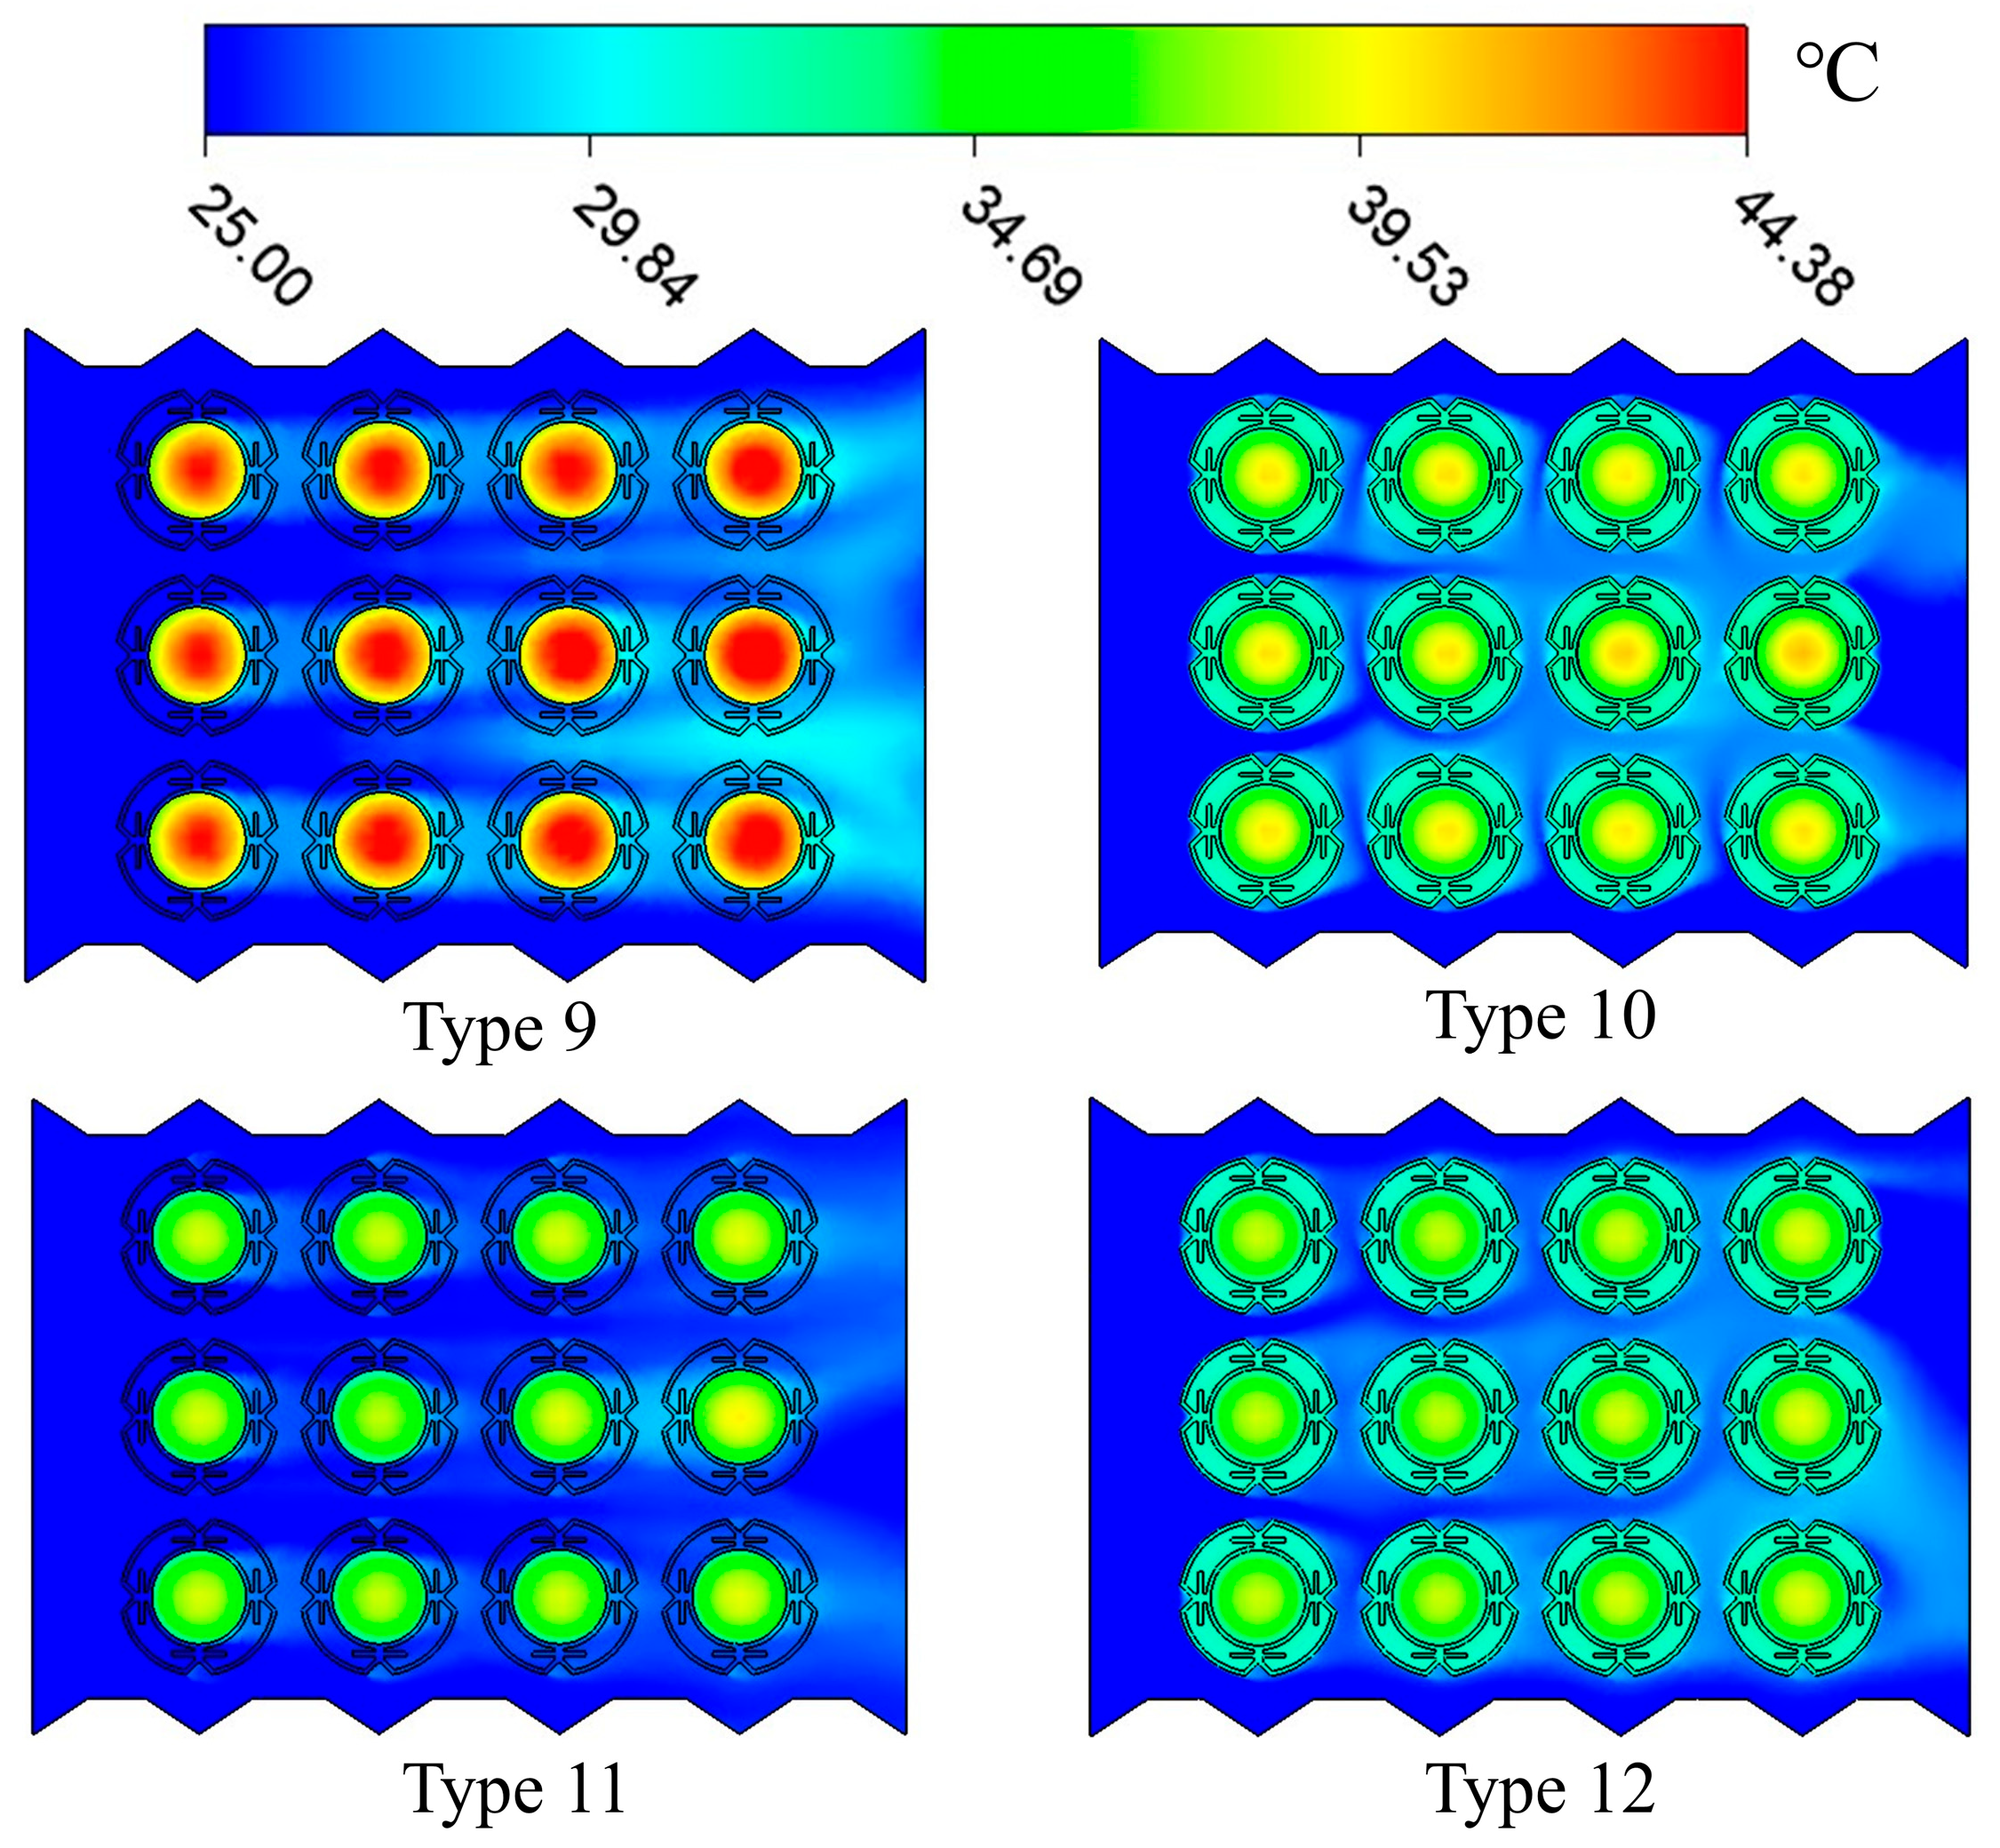
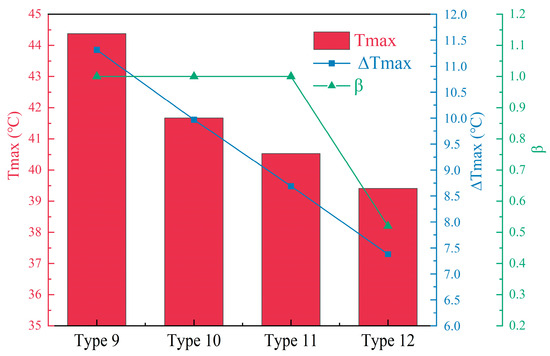
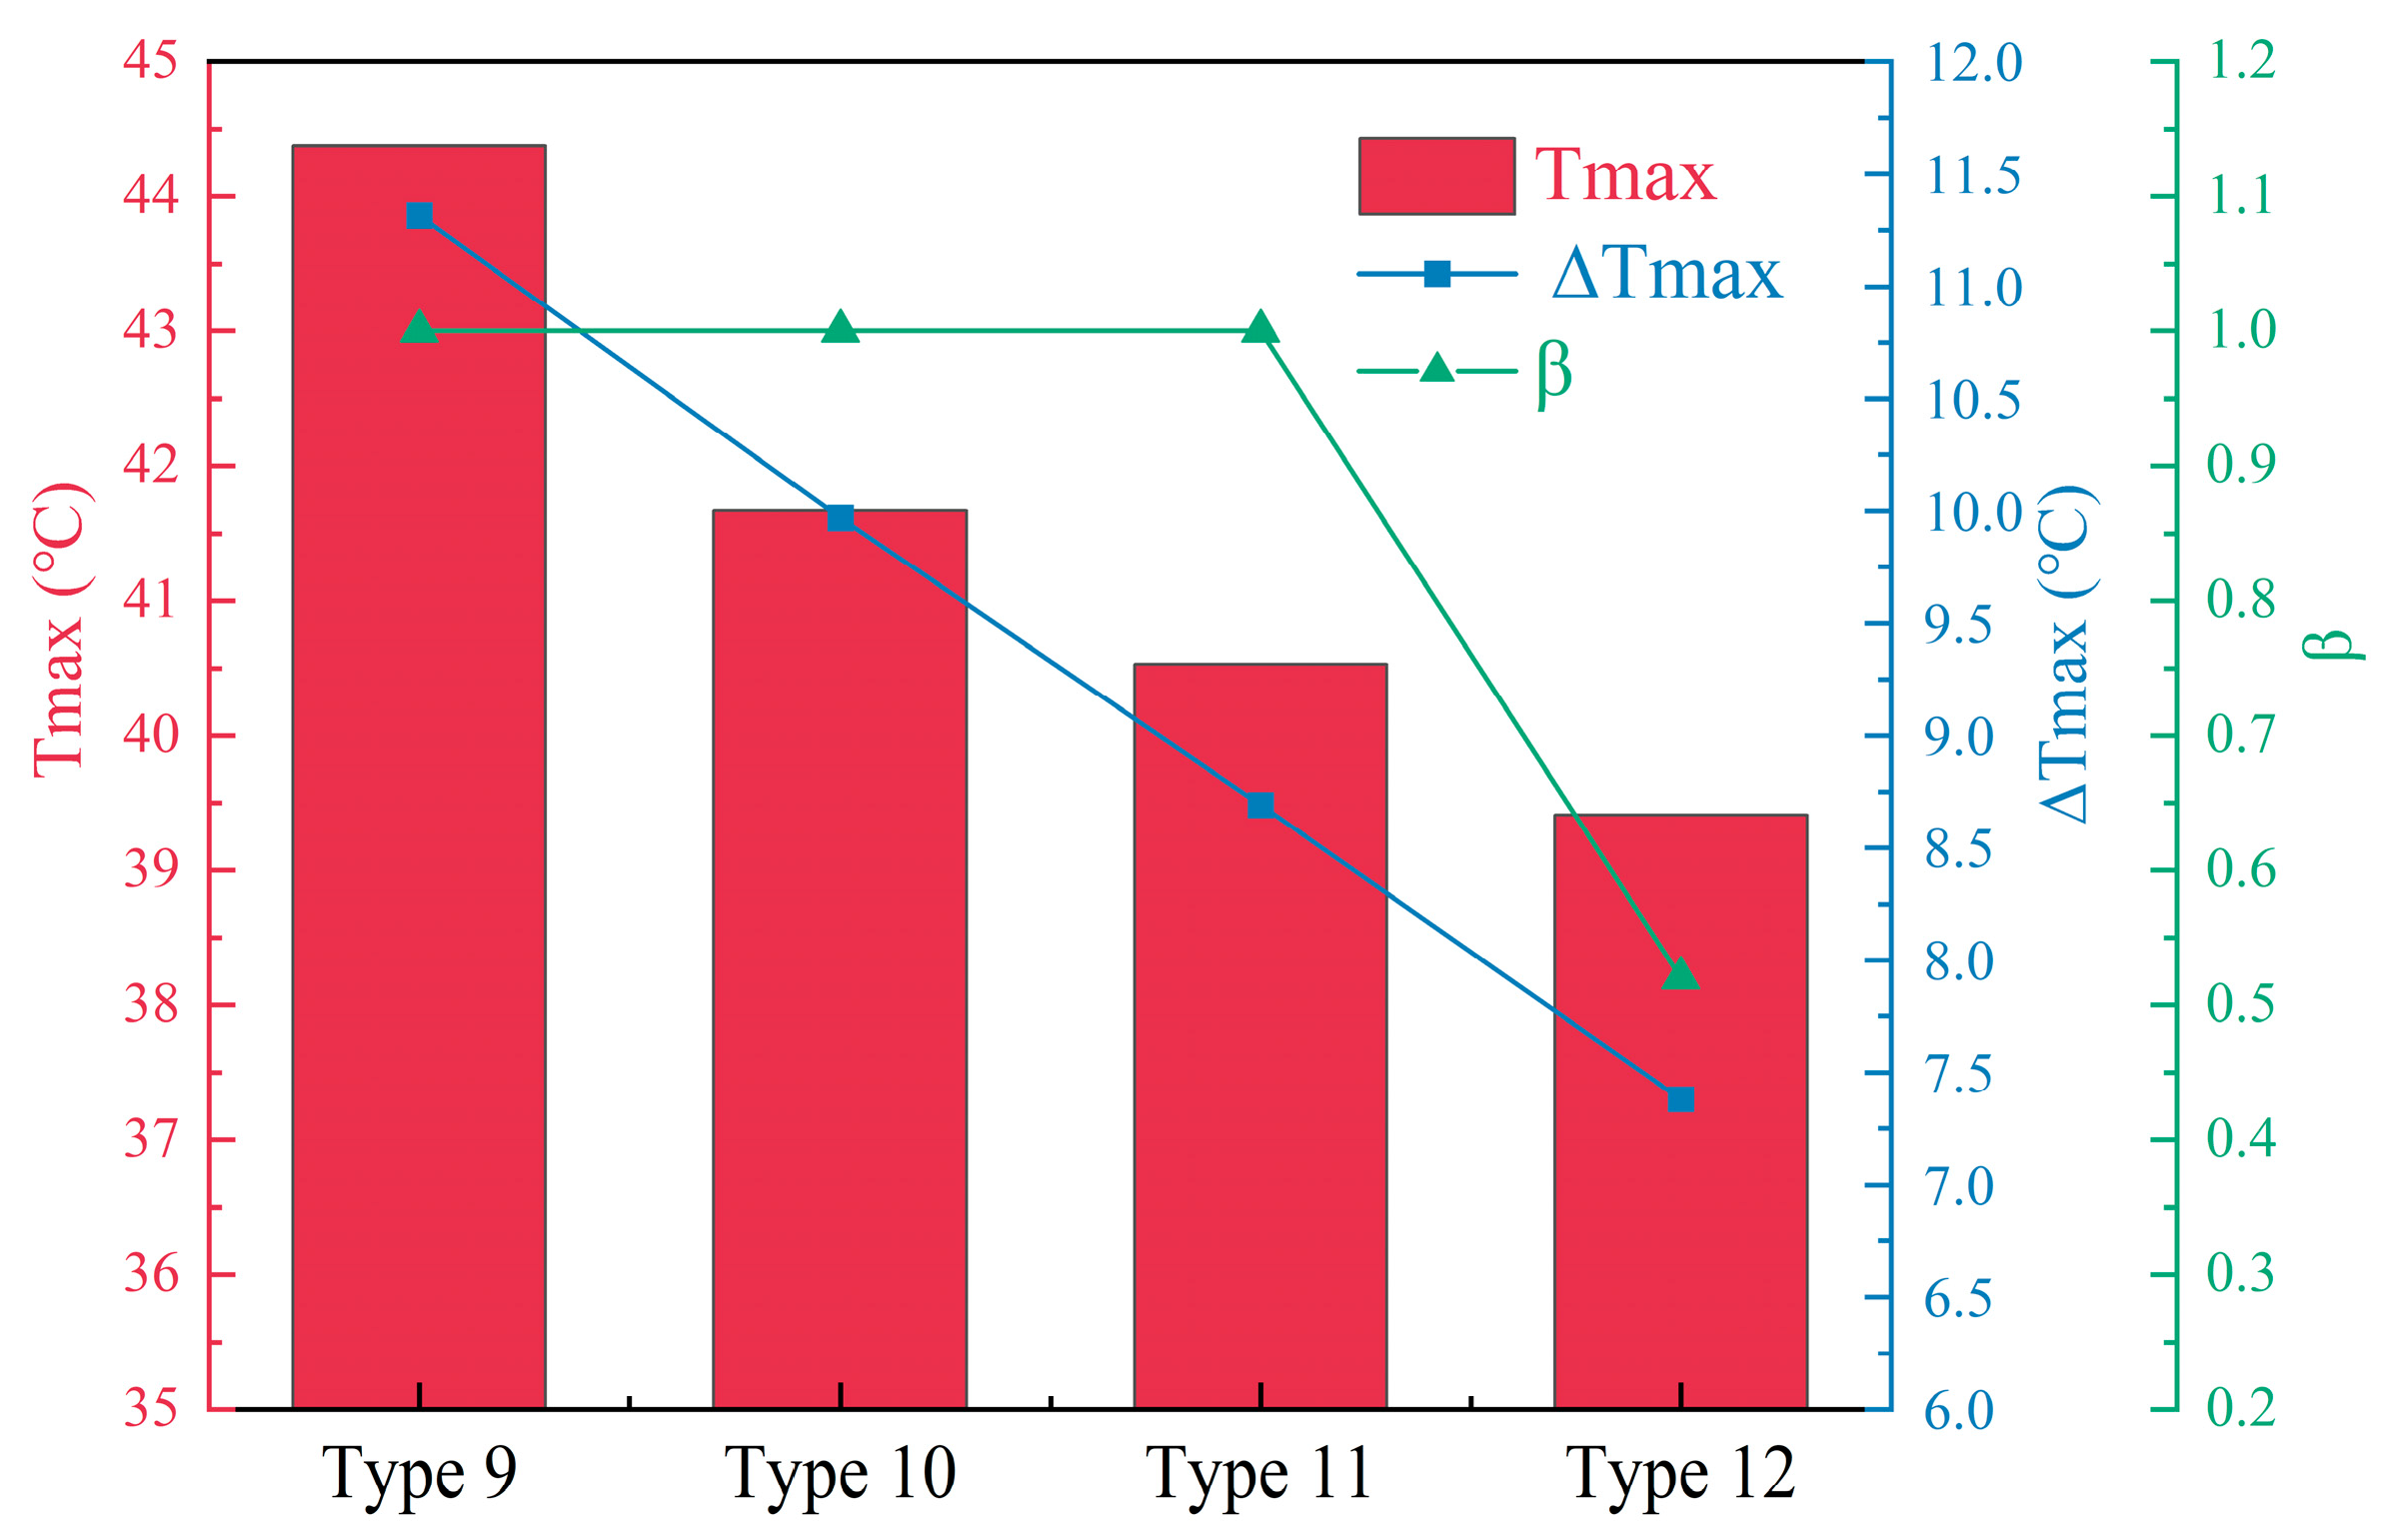
Numerical simulations are performed for the four layout configurations applied to the full BTMS. The simulations are conducted under a 3C discharge rate, a Tamb of 25 °C and an inlet air velocity of 3 m/s. Figure 16 presents the cross-sectional temperature contours of the battery packs for the four simulated layouts. It is evident that for the Type 9 configuration, where fins and PCM are wrapped only around the upper part of the cylindrical battery, the Tmax reaches 44.38 °C. By applying the Type 10, Type 11, and Type 12 configurations in sequence, the cooling efficiency of the BTMS improves progressively, with both Tmax and ΔTmax decreasing further. When the battery is fully enclosed using the Type 12 structure, the Tmax recorded is 39.41 °C, which falls within the acceptable operating range.
Figure 16.
Cross-sectional temperature contour map of BTMS with auxiliary cooling at four different positions.
A comparison of the thermal performance data for the four configurations is presented in Figure 17. The simulations are conducted under a 3C discharge rate, a Tamb of 25 °C and an inlet air velocity of 3 m/s. Measured by Tmax, the Type 9 configuration exhibits the highest value of 44.38 °C, whereas the fully covered Type 12 configuration achieves the lowest Tmax of 39.41 °C. Considering the temperature uniformity requirements of the battery pack, ΔTmax is adopted as the primary metric. Among the four tested configurations, Type 12 shows the lowest ΔTmax at 7.38 °C, indicating that fully covering the cylindrical LIBs with fins and PCM effectively balances inter-cell temperature differences. For the PCM, the β must remain below 1 to ensure safety and reliability after phase change. In the Type 9, 10, and 11 configurations, the limited PCM coverage leads to rapid heat absorption, resulting in β reaching 1. In contrast, the β value for Type 12 is 0.52, which remains within a safe and controllable range.
Figure 17.
Comparison of Tmax, ∆Tmax, and β data for BTMS at four different auxiliary cooling positions.
The Type 12 configuration is advantageous given the heat distribution characteristics of LIBs. Type 10 wraps only the central section, which can cause poor heat dissipation at the battery ends. Type 11 wraps the ends, potentially reducing cooling in the middle. In contrast, the fully covered Type 12 design ensures uniform thermal management over the entire battery surface.
3.5. Orthogonal Design Optimization
Previous research indicates that the four structural factors discussed influence the proposed BTMS to varying degrees. Therefore, an orthogonal experimental design is conducted to determine the optimal combination of these factors by examining different factor-level arrangements. This section analyzes the thermal performance of the battery module through orthogonal experiments. The results are evaluated using range analysis and ANOVA to assess the impact of each factor on the thermal performance.
3.5.1. Orthogonal Design and Analysis
To ensure the accuracy of data results and optimize the number of experiments, a four-factor, four-level L16 (45) orthogonal experimental design is employed. This is because Table L16 (45) can accommodate up to five four-level factors, with the fifth column in this study designated as a blank column. The primary purpose of setting up a blank column is to calculate experimental error. By treating the results from this column as an error term, the influence of other factors on the experimental outcomes can be more accurately assessed. This enhances the reliability of the experimental design and the precision of data analysis. This approach is common in orthogonal designs, particularly when the number of experimental factors is limited but more precise error estimation is required. The factors and levels of the orthogonal test are shown in Table 2.
Table 2.
Factors and levels in orthogonal experiments.
The effects of the number of trapezoidal wall undulations (A), fin structural shape (B), number of internal fin connection structures (C), and the wrapping position of fins and PCM relative to the single battery (D) on BTMS heat dissipation are compared. The results of the orthogonal test are shown in Table 3. The evaluation metrics include the Tmax and ∆Tmax of the LIBs in the BTMS.
Table 3.
Orthogonal test design and indicator results.
3.5.2. Range Analysis
For the selected influencing factors, a larger range analysis result indicates a greater impact of that factor. Range analysis helps identify key influencing factors on experimental results, thereby informing the optimal selection of factor levels. The range analysis results for the Tmax indicator are shown in Table 4. Regarding the Tmax specification for LIBs, the four factors influence it in the following order of priority: D, A, C, and B. Considering that lower battery temperature specifications are preferable, the optimal combination of factors is A3B1C3D4.
Table 4.
Analysis of the range of Tmax indicators.
Similarly, the range analysis results for the ∆Tmax specification are shown in Table 5. Regarding the ∆Tmax metric for batteries, the order of influence among the four factors is D, A, C, and B. Similarly, lower values for the ∆Tmax metric are preferable. Therefore, the optimal combination of factors is A3B1C3D4. It can be observed that, considering both the Tmax and ∆Tmax indicators, the optimal factor combination under extreme range analysis is consistently A3B1C3D4, corresponding to sequence 9 in Table 3.
Table 5.
Analysis of the range of ∆Tmax indicators.
3.5.3. Analysis of Variance
When numerical errors are significant, range analysis may lead to misinterpretations and thus has inherent limitations. Therefore, the results should be validated through analysis of ANOVA, which offers higher precision. ANOVA was performed on the data from Table 3, with the detailed results presented in Table 6 and Table 7.
Table 6.
Analysis of variance for Tmax indicators.
Table 7.
Analysis of variance for ∆Tmax indicators.
Table 6 shows that factor D has a significant influence on Tmax at the 0.05 significance level. Based on the ANOVA results, the ranking of the four factors by their influence is D, A, C, B. This ranking is consistent with the range analysis results presented in Table 4. Similarly, the factor rankings from the ANOVA in Table 7 also align with those from Table 4. Furthermore, the weighted factor orders derived from Table 6 and Table 7 are in agreement. These results indicate that, under the criteria of Tmax and ΔTmax, the optimal factor-level combination is A3B1C3D4.
4. Conclusions
This paper proposes a novel structural design for an air-cooled BTMS. Four key factors are investigated through numerical simulation: the number of protrusions on the battery pack wall, the fin geometry, the number of internal fin connectors and the fin mounting position. Subsequently, a four-level orthogonal experimental design is applied to these factors to systematically determine their optimal combination. The main findings of this study are:
- The novel wall structure proposed in this study demonstrates excellent heat dissipation performance. The results indicate that a design with five protrusions on the wall yields the best performance, and the Type 4 fin structure further enhances thermal performance. Through orthogonal experiments, configuration NO. 9 is identified as optimal, achieving a Tmax of 39.4 °C and a ΔTmax of 7.4 °C in the BTMS.
- This study shows that adding contour-adaptive shapes to both the cooling channel walls and the fins improves the heat dissipation of standard BTMS designs. This geometry enhances the overall thermal performance of the air-cooled system.
- This study also has certain limitations. For instance, the shapes of the wall surfaces are not explored in greater detail. Building on the findings presented here, future work could investigate more complex geometric configurations, which may provide valuable insights for further optimization and enhancement of air-cooled BTMS.
Author Contributions
Conceptualization, J.C. and W.Z.; methodology, J.C.; software, J.C.; validation, J.C. and J.Y.; formal analysis, J.C.; investigation, J.C.; resources, W.Z.; data curation, J.C.; writing—original draft preparation, J.C.; writing—review and editing, W.Z.; visualization, J.C.; supervision, W.Z.; project administration, W.Z.; funding acquisition, W.Z. All authors have read and agreed to the published version of the manuscript.
Funding
This research was funded by the Science and Technology Major Project of Guangxi, grant number Guike AA23062040, AB24010197 and the Guangxi Transportation Science and Technology Promotion Project, grant number GXJT-ZDSYS-2023-03-03.
Data Availability Statement
The original contributions presented in the study are included in the article, further inquiries can be directed to the corresponding author.
Conflicts of Interest
Author Weiguang Zheng was employed by the company Dong Feng Liuzhou Automobile Co., Ltd. The remaining authors declare that the research was conducted in the absence of any commercial or financial relationships that could be construed as a potential conflict of interest.
References
- Zhang, X.; Li, Z.; Luo, L.; Fan, Y.; Du, Z. A Review on Thermal Management of Lithium-Ion Batteries for Electric Vehicles. Energy 2022, 238, 121652. [Google Scholar] [CrossRef] [Scilit]
- Chen, K.; Hou, J.; Song, M.; Wang, S.; Wu, W.; Zhang, Y. Design of Battery Thermal Management System Based on Phase Change Material and Heat Pipe. Appl. Therm. Eng. 2021, 188, 116665. [Google Scholar] [CrossRef] [Scilit]
- Zhao, Y.; Zhang, X.; Yang, B.; Cai, S. A Review of Battery Thermal Management Systems Using Liquid Cooling and PCM. J. Energy Storage 2024, 76, 109836. [Google Scholar] [CrossRef] [Scilit]
- Chang, L.; Ma, C.; Zhang, C.; Duan, B.; Cui, N.; Li, C. Correlations of Lithium-Ion Battery Parameter Variations and Connected Configurations on Pack Statistics. Appl. Energy 2023, 329, 120275. [Google Scholar] [CrossRef] [Scilit]
- Ahmad, F.; Khalid, M.; Panigrahi, B.K. Development in Energy Storage System for Electric Transportation: A Comprehensive Review. J. Energy Storage 2021, 43, 103153. [Google Scholar] [CrossRef] [Scilit]
- Liu, Y.; Zhang, J. Design a J-Type Air-Based Battery Thermal Management System through Surrogate-Based Optimization. Appl. Energy 2019, 252, 113426. [Google Scholar] [CrossRef] [Scilit]
- Zong, S.; Ren, J.; Guan, Y.; Zhang, Y.; Cao, Z.; Yin, X. Experimental Study and Performance Evaluation of R744 Thermal Management Systems with Enhanced Parallel Cooling for Electric Vehicles. J. Power Sources 2024, 621, 235152. [Google Scholar] [CrossRef] [Scilit]
- Lai, Y.; Wu, W.; Chen, K.; Wang, S.; Xin, C. A Compact and Lightweight Liquid-Cooled Thermal Management Solution for Cylindrical Lithium-Ion Power Battery Pack. Int. J. Heat Mass Transf. 2019, 144, 118581. [Google Scholar] [CrossRef] [Scilit]
- Zhang, T.; Gao, Q.; Wang, G.; Gu, Y.; Wang, Y.; Bao, W. Investigation on the Promotion of Temperature Uniformity for the Designed Battery Pack with Liquid Flow in Cooling Process. Appl. Therm. Eng. 2017, 116, 655–662. [Google Scholar] [CrossRef] [Scilit]
- Yousefi, E.; Najafi, K.H.; Jaliliantabar, F.; Adam, A.A. The Effect of Different Enclosure Materials and NePCMs on Performance of Battery Thermal Management System. Mater. Today Proc. 2023, 75, 1–9. [Google Scholar] [CrossRef] [Scilit]
- Nofal, M.; Al-Hallaj, S.; Pan, Y. Thermal Management of Lithium-Ion Battery Cells Using 3D Printed Phase Change Composites. Appl. Therm. Eng. 2020, 171, 115126. [Google Scholar] [CrossRef] [Scilit]
- Cai, Y.; Sun, Q.; Gu, X.; Li, Y.; Luo, W.; Zhang, Y. Multi-Objective Optimization of Battery Thermal Management System Based on a Novel Embedded Hybrid Cooling Plate Considering Time-Based Early Shutdown Strategy. Energy 2024, 312, 133419. [Google Scholar] [CrossRef] [Scilit]
- Zhou, H.; Li, W.; Yang, W.; Guo, X.; Cui, L.; Liu, T. A Hybrid Battery Thermal Management Strategy that Couples Internal PCM with External Air-Jet Cooling. J. Energy Storage 2024, 98, 113127. [Google Scholar] [CrossRef] [Scilit]
- Parra-Panchi, G.; Nasrollahzadeh, H.; Wu, X.-Y.; Fowler, M.; Rangom, Y. Thermal System Simulation of Heating Strategies for 21700 Lithium-Ion Battery Modules Under Cold-Start Conditions. Batteries 2025, 11, 425. [Google Scholar] [CrossRef] [Scilit]
- Xu, X.; Qian, J.; Wang, X.; Pi, Z.; Zhang, H.; Chen, X.; Zhou, F. Cooling Performance Enhanced by Integrating Multicomponent Phase Change Material and Compression Spring into Air-Cooled Battery Module. Appl. Therm. Eng. 2024, 257, 124386. [Google Scholar] [CrossRef] [Scilit]
- Fan, Y.; Bao, Y.; Ling, C.; Chu, Y.; Tan, X.; Yang, S. Experimental Study on the Thermal Management Performance of Air Cooling for High Energy Density Cylindrical Lithium-Ion Batteries. Appl. Therm. Eng. 2019, 155, 96–109. [Google Scholar] [CrossRef] [Scilit]
- Singh, L.K.; Mishra, G.; Sharma, A.K.; Gupta, A.K. A Numerical Study on Thermal Management of a Lithium-Ion Battery Module via Forced-Convective Air Cooling. Int. J. Refrig. 2021, 131, 218–234. [Google Scholar] [CrossRef] [Scilit]
- Zhang, F.; Wang, P.; Yi, M. Design Optimization of Forced Air-Cooled Lithium-Ion Battery Module Based on Multi-Vents. J. Energy Storage 2021, 40, 102781. [Google Scholar] [CrossRef] [Scilit]
- Ganji, M.J.; Agelin-Chaab, M.; Rosen, M.A. Experimental Investigation of Phase Change Material-Based Battery Pack Performance Under Elevated Ambient Temperature. Batteries 2025, 11, 67. [Google Scholar] [CrossRef] [Scilit]
- Wang, C.; Xu, J.; Wang, M.; Xi, H. Experimental Investigation on Reciprocating Air-Cooling Strategy of Battery Thermal Management System. J. Energy Storage 2023, 58, 106406. [Google Scholar] [CrossRef] [Scilit]
- Yang, T.; Liu, H.; Zhang, W.; Ding, A.; Wu, M. Multi-Objective Topology Optimization of the Cooling Plate for Battery Thermal Management. Batteries 2025, 11, 406. [Google Scholar] [CrossRef] [Scilit]
- Yang, W.; Zhou, F.; Zhou, H.; Liu, Y. Thermal Performance of Axial Air Cooling System with Bionic Surface Structure for Cylindrical Lithium-Ion Battery Module. Int. J. Heat Mass Transf. 2020, 161, 120307. [Google Scholar] [CrossRef] [Scilit]
- Singh, L.K.; Gupta, A.K.; Sharma, A.K. Hybrid Thermal Management System for a Lithium-Ion Battery Module: Effect of Cell Arrangement, Discharge Rate, Phase Change Material Thickness and Air Velocity. J. Energy Storage 2022, 52, 104907. [Google Scholar] [CrossRef] [Scilit]
- Song, K.; He, R.; Gao, C.; Mombeki, P.H.J.; He, A.; Zhang, Q.; Zhang, K.; An, Z. Performance of a Combined Battery Thermal Management System with Dual-Layer Phase Change Materials and Air Cooling Technologies. Appl. Therm. Eng. 2024, 254, 123865. [Google Scholar] [CrossRef] [Scilit]
- Weng, J.; Ouyang, D.; Yang, X.; Chen, M.; Zhang, G.; Wang, J. Optimization of the Internal Fin in a Phase-Change-Material Module for Battery Thermal Management. Appl. Therm. Eng. 2020, 167, 114698. [Google Scholar] [CrossRef] [Scilit]
- Gu, Q.; Li, G.; Wu, Z. The Analysis on the Battery Thermal Management System with Composite Phase Change Materials Coupled Air Cooling and Fins. J. Energy Storage 2022, 56, 105977. [Google Scholar] [CrossRef] [Scilit]
- Liu, Z.; Huadan, C.; Wang, B.; Li, P. Coupling Optimization of Protruding Fin and PCM in Hybrid Cooling System and Cycle Strategy Matching for Lithium-Ion Battery Thermal Management. Int. J. Therm. Sci. 2025, 207, 109372. [Google Scholar] [CrossRef] [Scilit]
- Shi, H.; Liu, M.N.; Li, Y.H.; Wang, S.H.; Qiu, C.H.; Cheng, M.M.; Yuan, J.; Yang, K.J.; Kang, C.Z. Multi-Objective Optimization of Integrated Lithium-Ion Battery Thermal Management System. Appl. Therm. Eng. 2023, 223, 119991. [Google Scholar] [CrossRef] [Scilit]
- Li, Y.H.; Chen, Z.L.; Feng, Y.; Liu, M.N.; Kang, C.Z.; Yang, K.J.; Yuan, J.; Qiu, C.H.; Shi, H.; Jiang, Y.L. A Novel Petal-Type Battery Thermal Management System with Dual Phase Change Materials. Int. J. Heat Mass Transf. 2023, 207, 123989. [Google Scholar] [CrossRef] [Scilit]

Disclaimer/Publisher’s Note: The statements, opinions and data contained in all publications are solely those of the individual author(s) and contributor(s) and not of MDPI and/or the editor(s). MDPI and/or the editor(s) disclaim responsibility for any injury to people or property resulting from any ideas, methods, instructions or products referred to in the content. |
© 2026 by the authors. Licensee MDPI, Basel, Switzerland. This article is an open access article distributed under the terms and conditions of the Creative Commons Attribution (CC BY) license.