


Abstract
Equilenin is an equine estrogen constituting the basis of a highly-prescribed pharmaceutical preparation. Although routine 1H and 13C NMR data for it have been reported, complete assignments and a full analysis of the proton spin system have not been established. In the present study, equilenin was examined by solution NMR in deuterochloroform, employing conventional spectral analysis in conjunction with quantum-mechanical techniques to achieve a 1H iterative full spin analysis (HiFSA). The resulting model reproduces the experimental spectrum with high fidelity and permits the determination of true chemical shifts and scalar coupling constants for this complex spin system. In addition, the 13C NMR spectrum was fully assigned using a combination of one- and two-dimensional experiments. The obtained data constitute a robust spectroscopic reference set for equilenin and the analytical value of the Cosmic Truth software for resolving spin systems in steroids. The results provide a valuable source of data for researchers seeking to implement NMR-based assays relevant to analytical, regulatory, and forensic applications.
1. Introduction
Until the 1960s, the structural elucidation of natural products was a laborious and challenging task that included various synthetic and degradation steps. This approach has been made redundant mainly due to the advances in spectroscopy [1]. In the age of powerful pulsed NMR spectrometers with very high S/N ratios, as well as numerous multidimensional techniques and chemical shift reagents, it is feasible to elucidate structures in a timely manner, even when a very low amount of sample is available (ca. 1 mg) [2].
Natural product chemistry has greatly benefited from the practice of reporting spectroscopic data. However, the typical NMR data reporting practices lead to a significant loss of data compared to those available from raw FID data. Commonly, it is nearly impossible to interpret line shapes, multiplicity, and phase from images of spectra. Additionally, the field of organic synthesis has, for a significant amount of time, kept the NMR data reporting requirements low—sometimes as low as completely omitting to report NMR data for new compounds [3]. Led by incorrect assumptions and insufficient data, researchers have, in the past, suggested incorrect structures, with ambiguities sometimes resolved only after total synthesis efforts [3,4,5]. Some researchers have emphasized that such errors could have been addressed much sooner, as a detailed treatment of the plethora of information available from raw NMR data can usually lead to structure validation, dismissal, and/or dereplication [3,6].
While some errors in interpretation are easily addressable by simple expansion of the spectra, others lie in the unwillingness to interpret “multiplets”, as such a process can be complicated by higher-order effects and/or signal overlap [7,8]. The 1H NMR spectra of steroids are notorious for such signals, a consequence of the usually significant nonfunctionalized polycyclic hydrocarbon skeleton [9].
Spectral simulations were recognized as a valuable tool for the interpretation of 1H NMR spectra as early as the 1980s [10,11,12], although these were limited by computing power and the availability of high-resolution NMR data. Pioneering efforts to develop computational methods for spectral deconvolution and total lineshape analysis were made at the University of Kuopio [13,14], founded on the seminal work of Castellano and Bothner-By [15], which culminated with the development of the PERCH software, used by many researchers for spin analyses of various organic molecules [16,17,18]. Such a computational approach is based on the exact diagonalization of the non-relativistic nuclear spin Hamiltonian, in which the experimental 1H NMR spectrum is modeled as a sum of allowed transitions between eigenstates defined by chemical shifts and scalar spin–spin coupling constants. Through their many works in the field of natural product chemistry, Pauli and coworkers have developed a robust protocol employing PERCH to achieve what they coined as 1H iterative full spin analysis, which provides an unequivocal interpretation of 1H NMR spectra [19]. PERCH, a single-threaded FORTRAN program, was discontinued some time ago, while Cosmic Truth (CT) emerged as a modern implementation of the same underlying spin-Hamiltonian formalism utilizing contemporary computing architectures, including multitasking and parallel processing [7]. In principle, no fixed upper limit exists for the number of spins that can be treated with CT. The limitation of such quantum-mechanical NMR spectral simulations is not computational, but arises from the information content of the experimental data. Reliable refinement of chemical shifts and coupling constants requires that the number of experimentally observable spectral features exceeds the number of parameters to be determined; insufficient resolution, overlap, or signal-to-noise may limit parameter uniqueness.
This “genotypic” (rather than “phenotypic”) interpretation reduces even very complex spectra to a small number of numerical parameters, the spin parameters of the analyzed nuclei—chemical shifts (δ), coupling constants (J), and effective linewidths (Δν1/2) [8]. Data provided in such a form are adequate for many applications, e.g., simulating spectra of a compound at different field strengths [7,18], dereplication [19], fingerprinting [20], and qHNMR-based determination of content and purity [21]. In NMR-based analytical workflows, the challenge often lies not in spectral acquisition, but in the interpretation of congested 1H NMR data where closely related structures produce highly similar spectral patterns. In this context, HiFSA represents a model-based analytical assay, in which compound identity is verified by matching experimental spectra against a fully parameterized spin model. As spectroscopic identification remains central to the chemical analysis of pharmaceuticals and controlled substances, the QMSA/HiFSA approach has been suggested as a potentially useful tool in pharmaceutical identity testing and quality control [22].
Equilenin is an equine steroidal estrogen isolated from the urine of pregnant mares by Girard in 1932 [23]. In its conjugated form, equilenin is one of the main components of Premarin, a widely prescribed orally administered estrogen, mostly used for hormone replacement therapy in postmenopausal women to relieve symptoms such as hot flashes, night sweats, and vaginal dryness [24,25]. In this work, we report for the first time the full 1H and 13C NMR data for equilenin. A full assignment was accomplished by a combination of the usual 1D and 2D experiments, while the complete parameters of the 1H NMR spectrum (exact chemical shifts and coupling constants, even for overlapped signals) were obtained by a 1H iterative full spin analysis (HiFSA) executed using quantum mechanical calculations.
2. Materials and Methods
2.1. Materials and Sample Preparation
A commercial standard of equilenin (3-hydroxyestra-1,3,5(10),6,8-pentaen-17-one) supplied by Sigma-Aldrich (St. Louis, MO, USA) was used. A solution of this compound was prepared by dissolving 8 mg of equilenin in 1.0 mL of deuterated chloroform (99.8 atom % D) containing 0.1% (v/v) tetramethylsilane (Sigma-Aldrich, St. Louis, MO, USA), after which 0.7 mL of the solution was transferred into a 5 mm Wilmad 528-TR-7 NMR tube (Vineland, NJ, USA).
2.2. Spectroscopic Methods
The spectra were recorded on a Bruker Avance III NMR spectrometer (1H at 400 MHz, 13C at 101 MHz) equipped with a CryoProbe Prodigy probe, at 25 °C (Bruker BioSpin AG, Fällanden, Switzerland). Chemical shifts are reported in parts per million (ppm, δ) relative to TMS (δH = 0 ppm, δC = 0 ppm), which was used as an internal standard. Scalar coupling constants are reported in hertz (Hz). The 1H NMR spectrum (Figure S1) used as the basis for spin analysis was acquired using 32 scans, an acquisition time of 4.61 s, a digital FID resolution of 0.2167 Hz, an FID data size of 32,768 points, and a spectral width of 3551 Hz. After manual phasing, a fifth-order polynomial baseline correction was applied. The 13C spectrum (Figure S3) was recorded with Waltz 161H broadband decoupling, 1024 scans, 0.5 s relaxation delay, 1 s acquisition time, 0.5 Hz digital FID resolution, 65,536 FID size, 31,850 Hz spectral width, and an overall data point resolution of 0.005 ppm.
1H,1H COSY spectra (Figure S4) were acquired using the Bruker cosygpppqf pulse program with the following parameters: number of scans 8, relaxation times 1 s, time domain 2k, and spectral width 10 ppm (F2) and 10 ppm (F1), with transmitter offset 6.2 ppm. 2D NOESY spectra (Figure S5) were acquired with the pulse program noesygpphpp with a relaxation delay of 1.0 s; the mixing time was 300 ms. Heteronuclear single quantum correlation (HSQC, Figure S6) experiments were performedusing the Brucker hsqcetgp pulse program. The following acquisition parameters were set: 32 number of scans, 16 dummy scans, relaxation delay 1 s, time domain 1k, spectral width 10 ppm (F2) and 160 ppm (F1), and transmitter offset 6.2 ppm (F2) and 75 ppm (F1); the 1JC–H tune value was set to 150 Hz. Heteronuclear multiple bond correlation (HMBC, Figure S7) spectra were acquired using the Bruker hmbcgplpndqf pulse program, with the following parameters: number of scans 64, 16 dummy scans, relaxation delay 1 s, time domain 2k, with a long-range coupling of 8 Hz, spectral width 10 ppm (F2) and 160 ppm (F1), and transmitter offset 6.2 ppm (F2) and 100 ppm (F1).
2.3. Data Processing
On-site spectral processing was performed using the TopSpin software (v. 4.4, Bruker, Karlsruhe, Germany). The optimal 1H NMR spectrum of equilenin was further processed using a mild Lorentzian-to-Gaussian window function (LB = −0.20 Hz; GB = 0.20, Figure S2) for resolution enhancement. Once finalized, the 1H NMR spectrum was exported in the JCAMP-DX file format.
2.4. 1H NMR Full Spin Analysis
The quantum mechanical spectral analysis (QMSA) was performed in Cosmic Truth (CT, ct.nmrsolutions.io, prerelease version RC3), a web-based, client/server software for automatic and semiautomatic spectrum analysis from NMR Solutions Ltd. (Kuopio, Finland). The analysis was executed via the CT web interface and did not require local high-performance computing resources, as all calculations were handled within the client/server environment; convergence was always achieved in less than 5 min.
Inputs constituted the previously prepared JCAMP-DX file format and the SMILES for equilenin, from which CT is able to calculate a molecular geometry using internal optimization protocols. A three-dimensional molecular geometry with explicit proton coordinates is required to define spin connectivity, relative spatial arrangement, and prochirality. CT allows users to supply complete molecular geometries prepared externally by optimization procedures or by experimental methods such as single-crystal X-ray diffraction. Alternatively, CT also accepts inputs such as molecular structures drawn in an integrated structure editor or SMILES strings, from which the program automatically generates a molecular geometry using built-in semiempirical methods; this was the approach utilized in this study.
3. Results and Discussion
3.1. Total Assignments of 1H and 13C NMR Spectra of Equilenin
Although SciFinder-n lists nearly 800 instances of journal articles with at least one mention of equilenin (Figure 1), sources of its NMR spectral data are quite scarce; even published studies dealing with its (semi)synthesis offer either very limited or no data [18,26,27]. The only article offering a partial assignment was for a 1H NMR spectrum recorded in chloroform at 270 MHz in 1997 [28]. Further, a detailed spectroscopic characterization was reported for the two epimers of 3-methoxydihydroequilenin at 500 MHz [29].
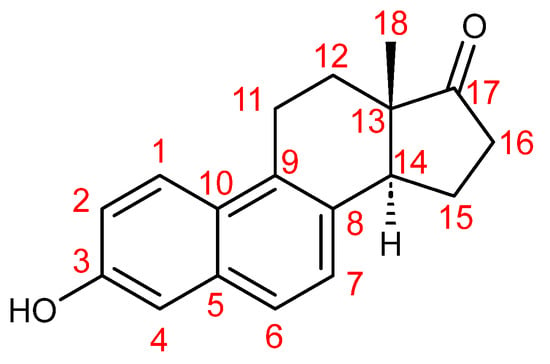
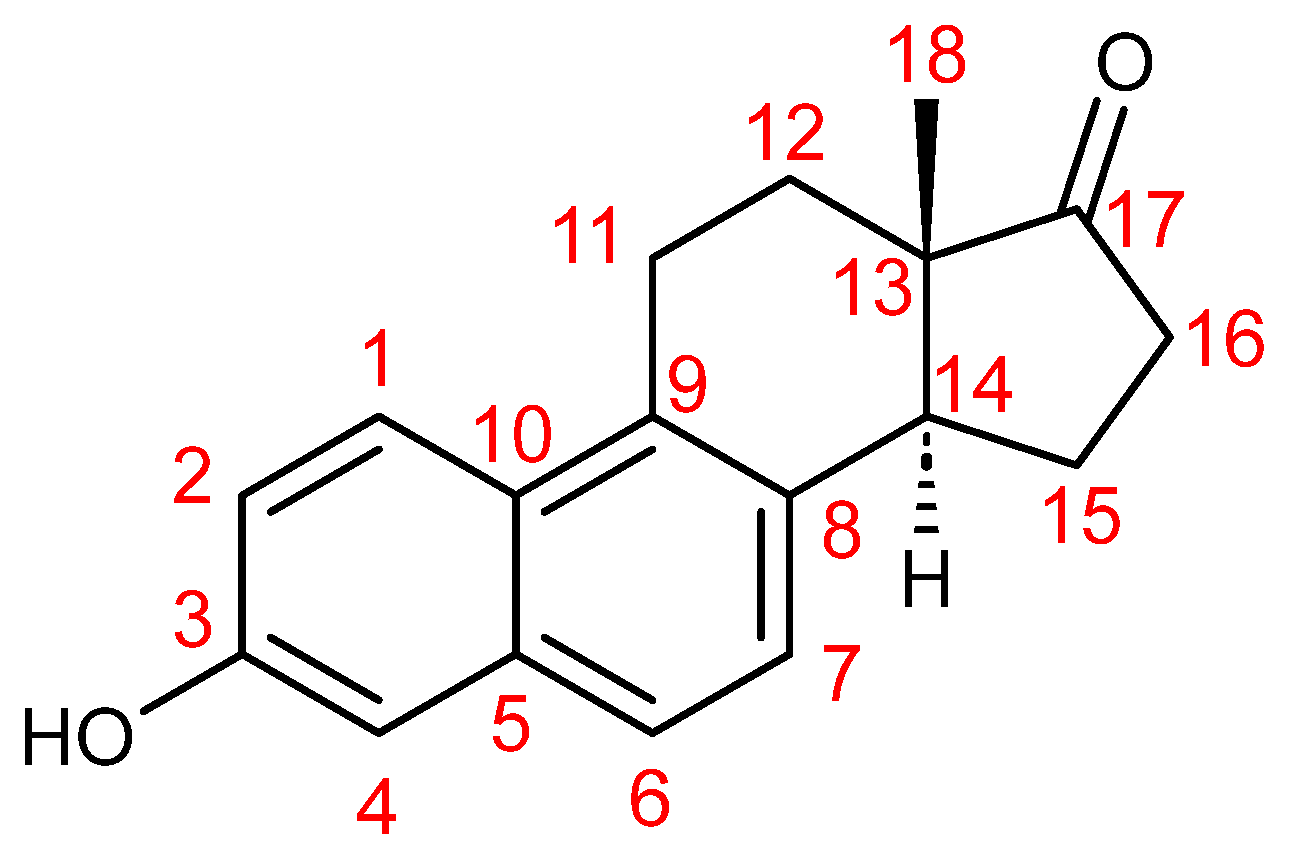
Figure 1.
Equilenin numbering scheme using the usual convention for steroids.
According to the protocol of 1H iterative full spin analysis provided by Pauli and coworkers [30], a preliminary assignment of the individual proton resonances was achieved by 1D and 2D NMR techniques. In cases of signal overlap, assignments to a particular chemical shift are difficult, but relative positions of HSQC interactions can be informative in favorable cases. The 1H NMR spectrum of equilenin contains a total of sixteen nonequivalent protons (Figure 1) which, in deuterochloroform, resonate in the range of ca. 0.8–8 ppm, with protons of the A and B rings resonating in the typical region of 7–8 ppm, while the remainder of protons are found upfield.
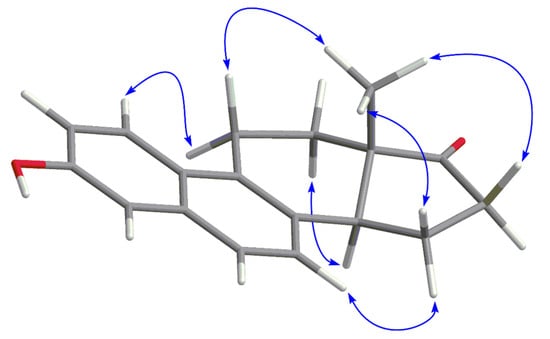
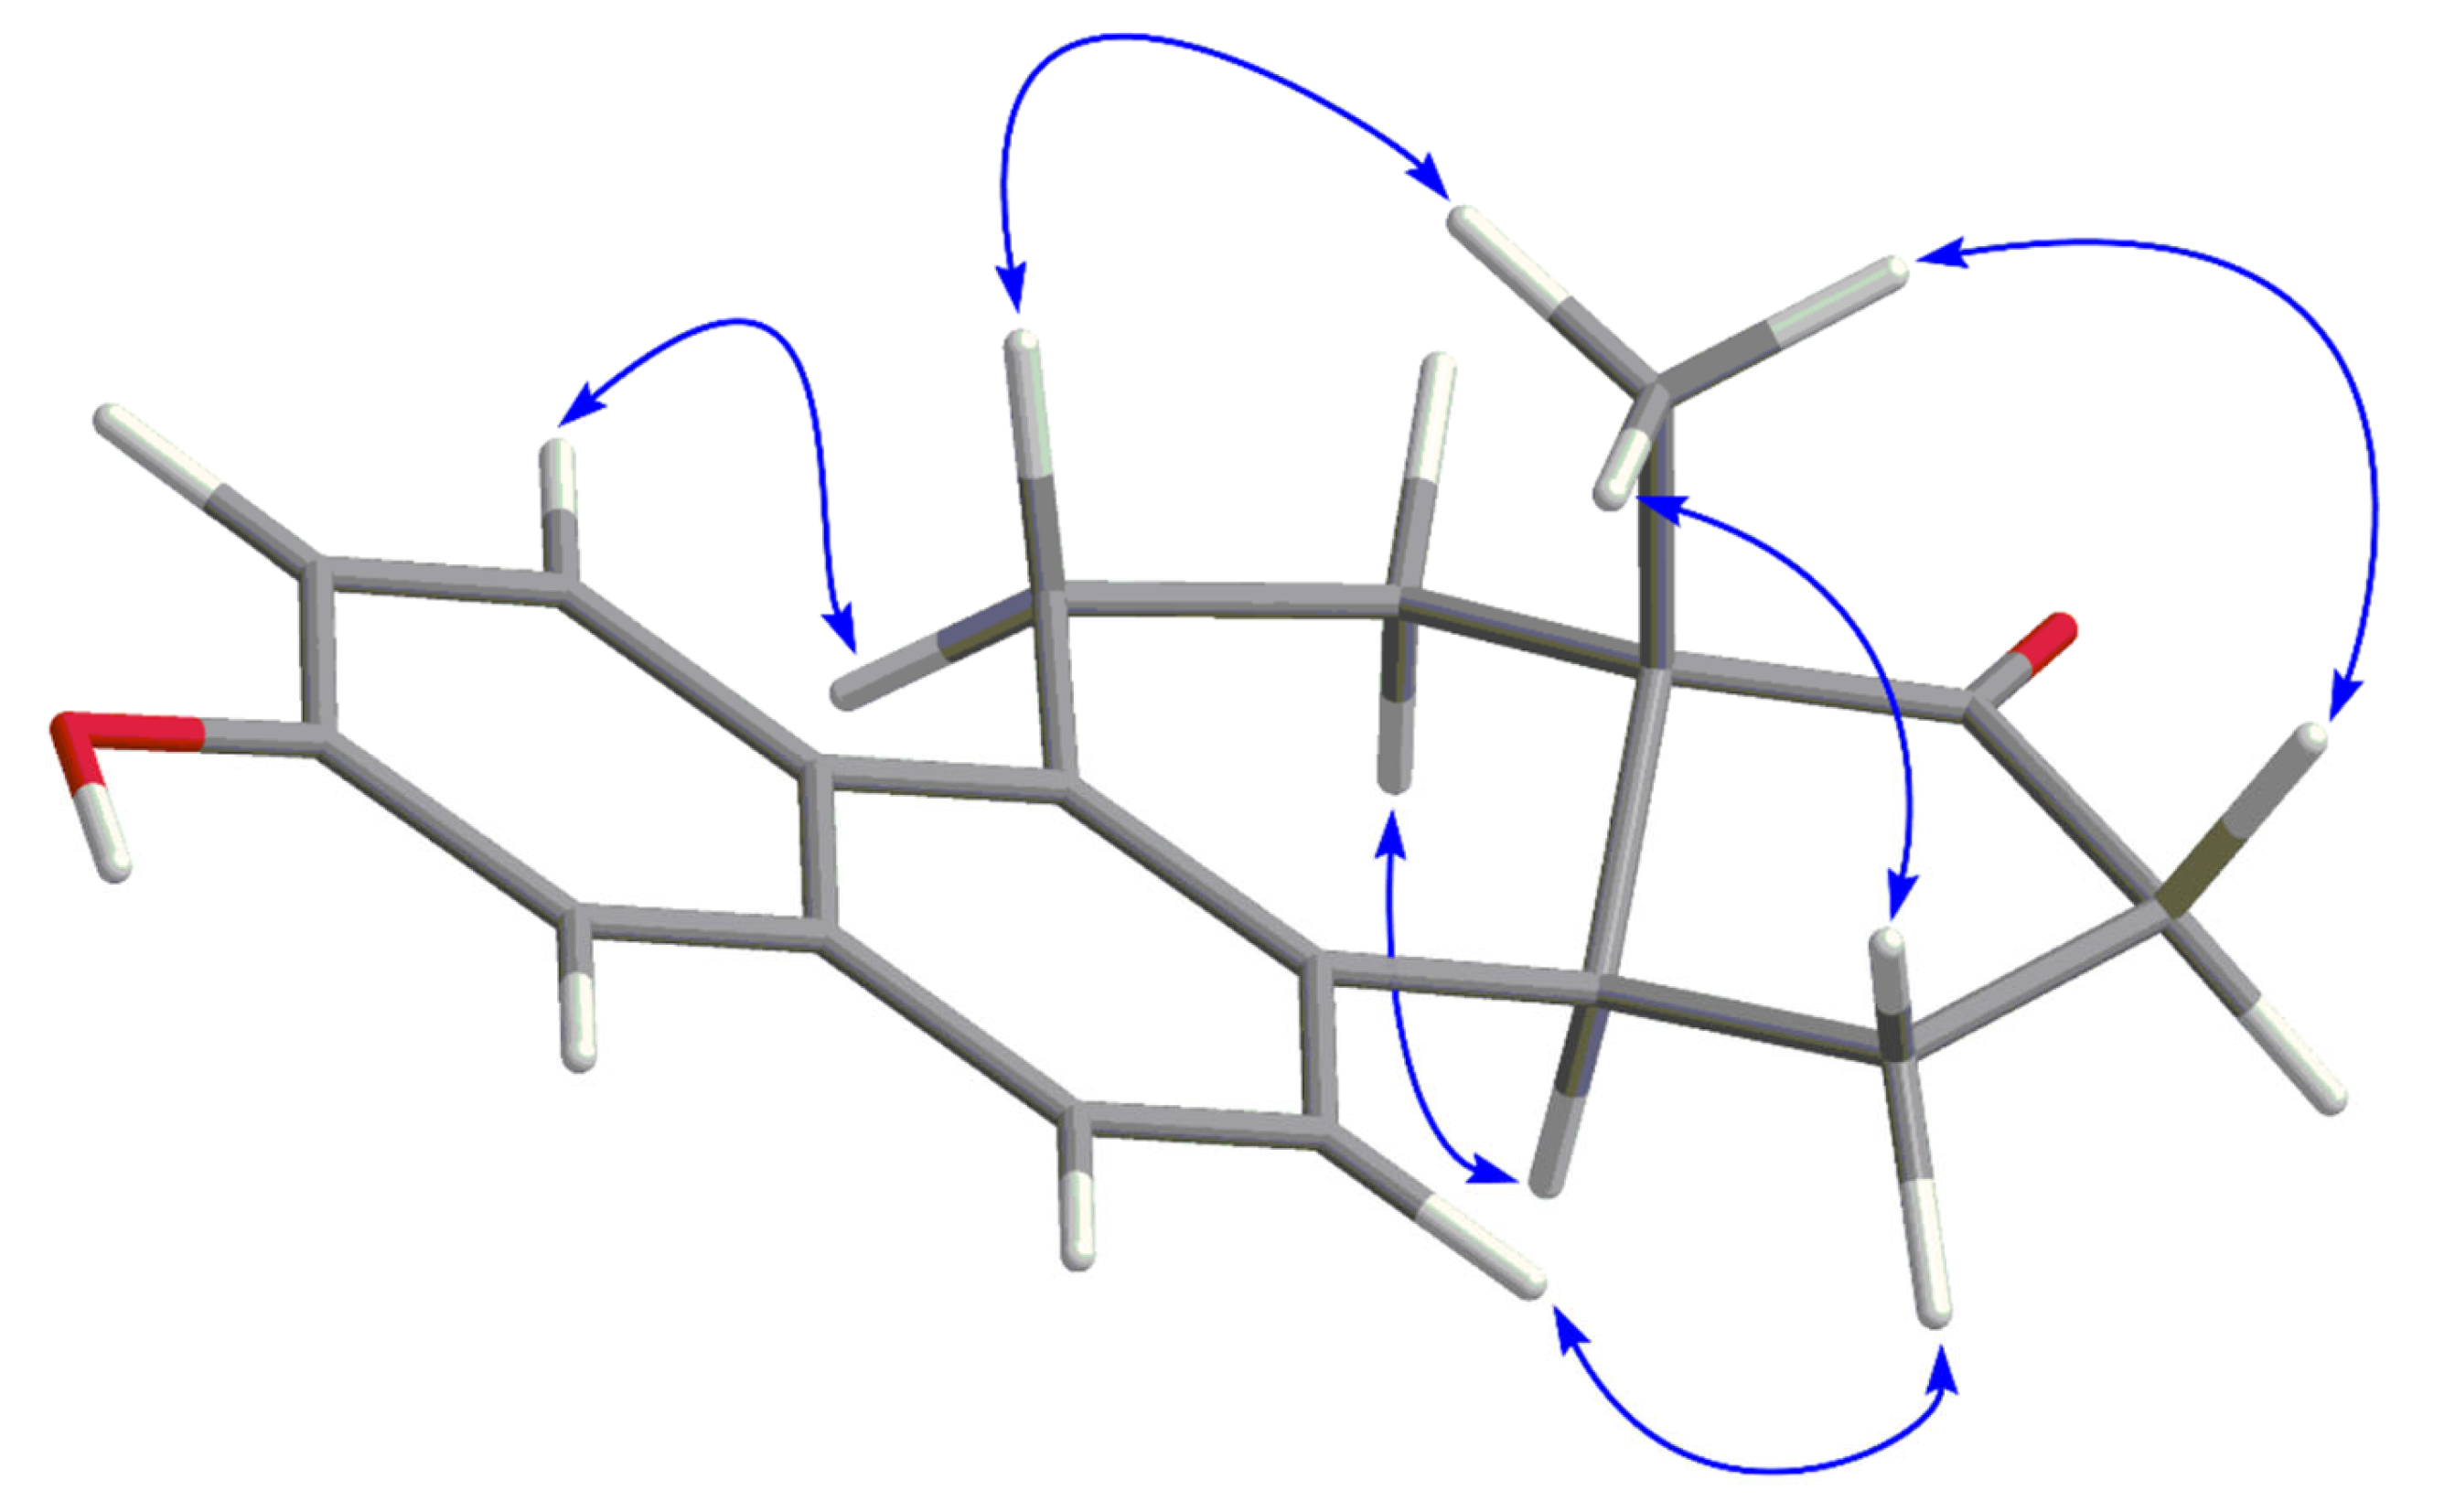
A useful strategy for assignment of resonances of steroids starts from readily discernible groups, in this case the singlet of the angular methyl group at C-13 (0.81 ppm) and the broad signal of the phenol group proton (5.09 ppm). Likewise, in the 13C NMR spectrum, one can easily locate the sole carbonyl signal (220.2 ppm), that of C-17, and a signal at the downfield edge of the aromatic region (152.8 ppm), that of C-3. Starting from HMBC correlations of the initially assigned resonances in the 1H and 13C spectra, together with information from HSQC and 1H,1H COSY, it was possible to routinely perform the total assignments of both spectra (Table 1), with the exception of the orientations of the diastereotopic protons of the steroid core (those at C-11, C-12, C-15, and C-16)—this was done from 2D NOESY interactions (Figure 2). These results also suggest that the previous partial assignment inverted H-2 and H-6 [28].
Figure 2.
NOESY interactions (blue arrows) relevant for assigning individual diastereotopic protons of methylene positions.
Table 1.
A total assignment of the 1H (400 MHz) and 13C (101 MHz) resonances of equilenin (CDCl3).
Table 2.
Calculated 1H chemical shifts (δH, ppm), effective linewidths (Δν1/2, Hz), and 1H,1H spin–spin coupling constants (J, Hz) of equilenin (CDCl3).
3.2. 1H Iterative Full Spin Analysis of Equilenin
1H iterative full spin analysis (HiFSA) has been shown to permit unambiguous interpretation even in cases of pronounced spectral complexity [6]. In earlier work, our research group demonstrated that such analyses may, in principle, be carried out by manual simulation of the spin system [31,32,33,34,35]. Owing, however, to the laborious and time-consuming nature of this procedure, the development of automated iteration schemes represents a considerable practical advance. In this context, the recent successful application of Cosmic Truth (CT), a quantum-mechanical simulation program, has been reported by several authors [7,36,37]. On this basis, the same approach was adopted in the present study.
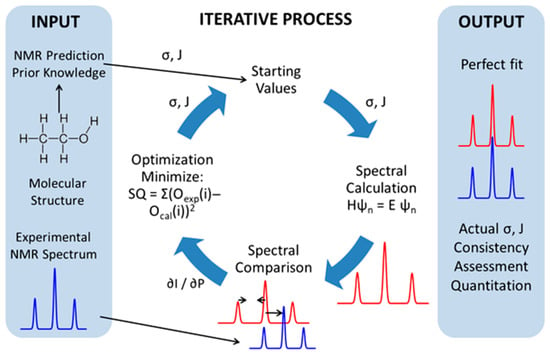
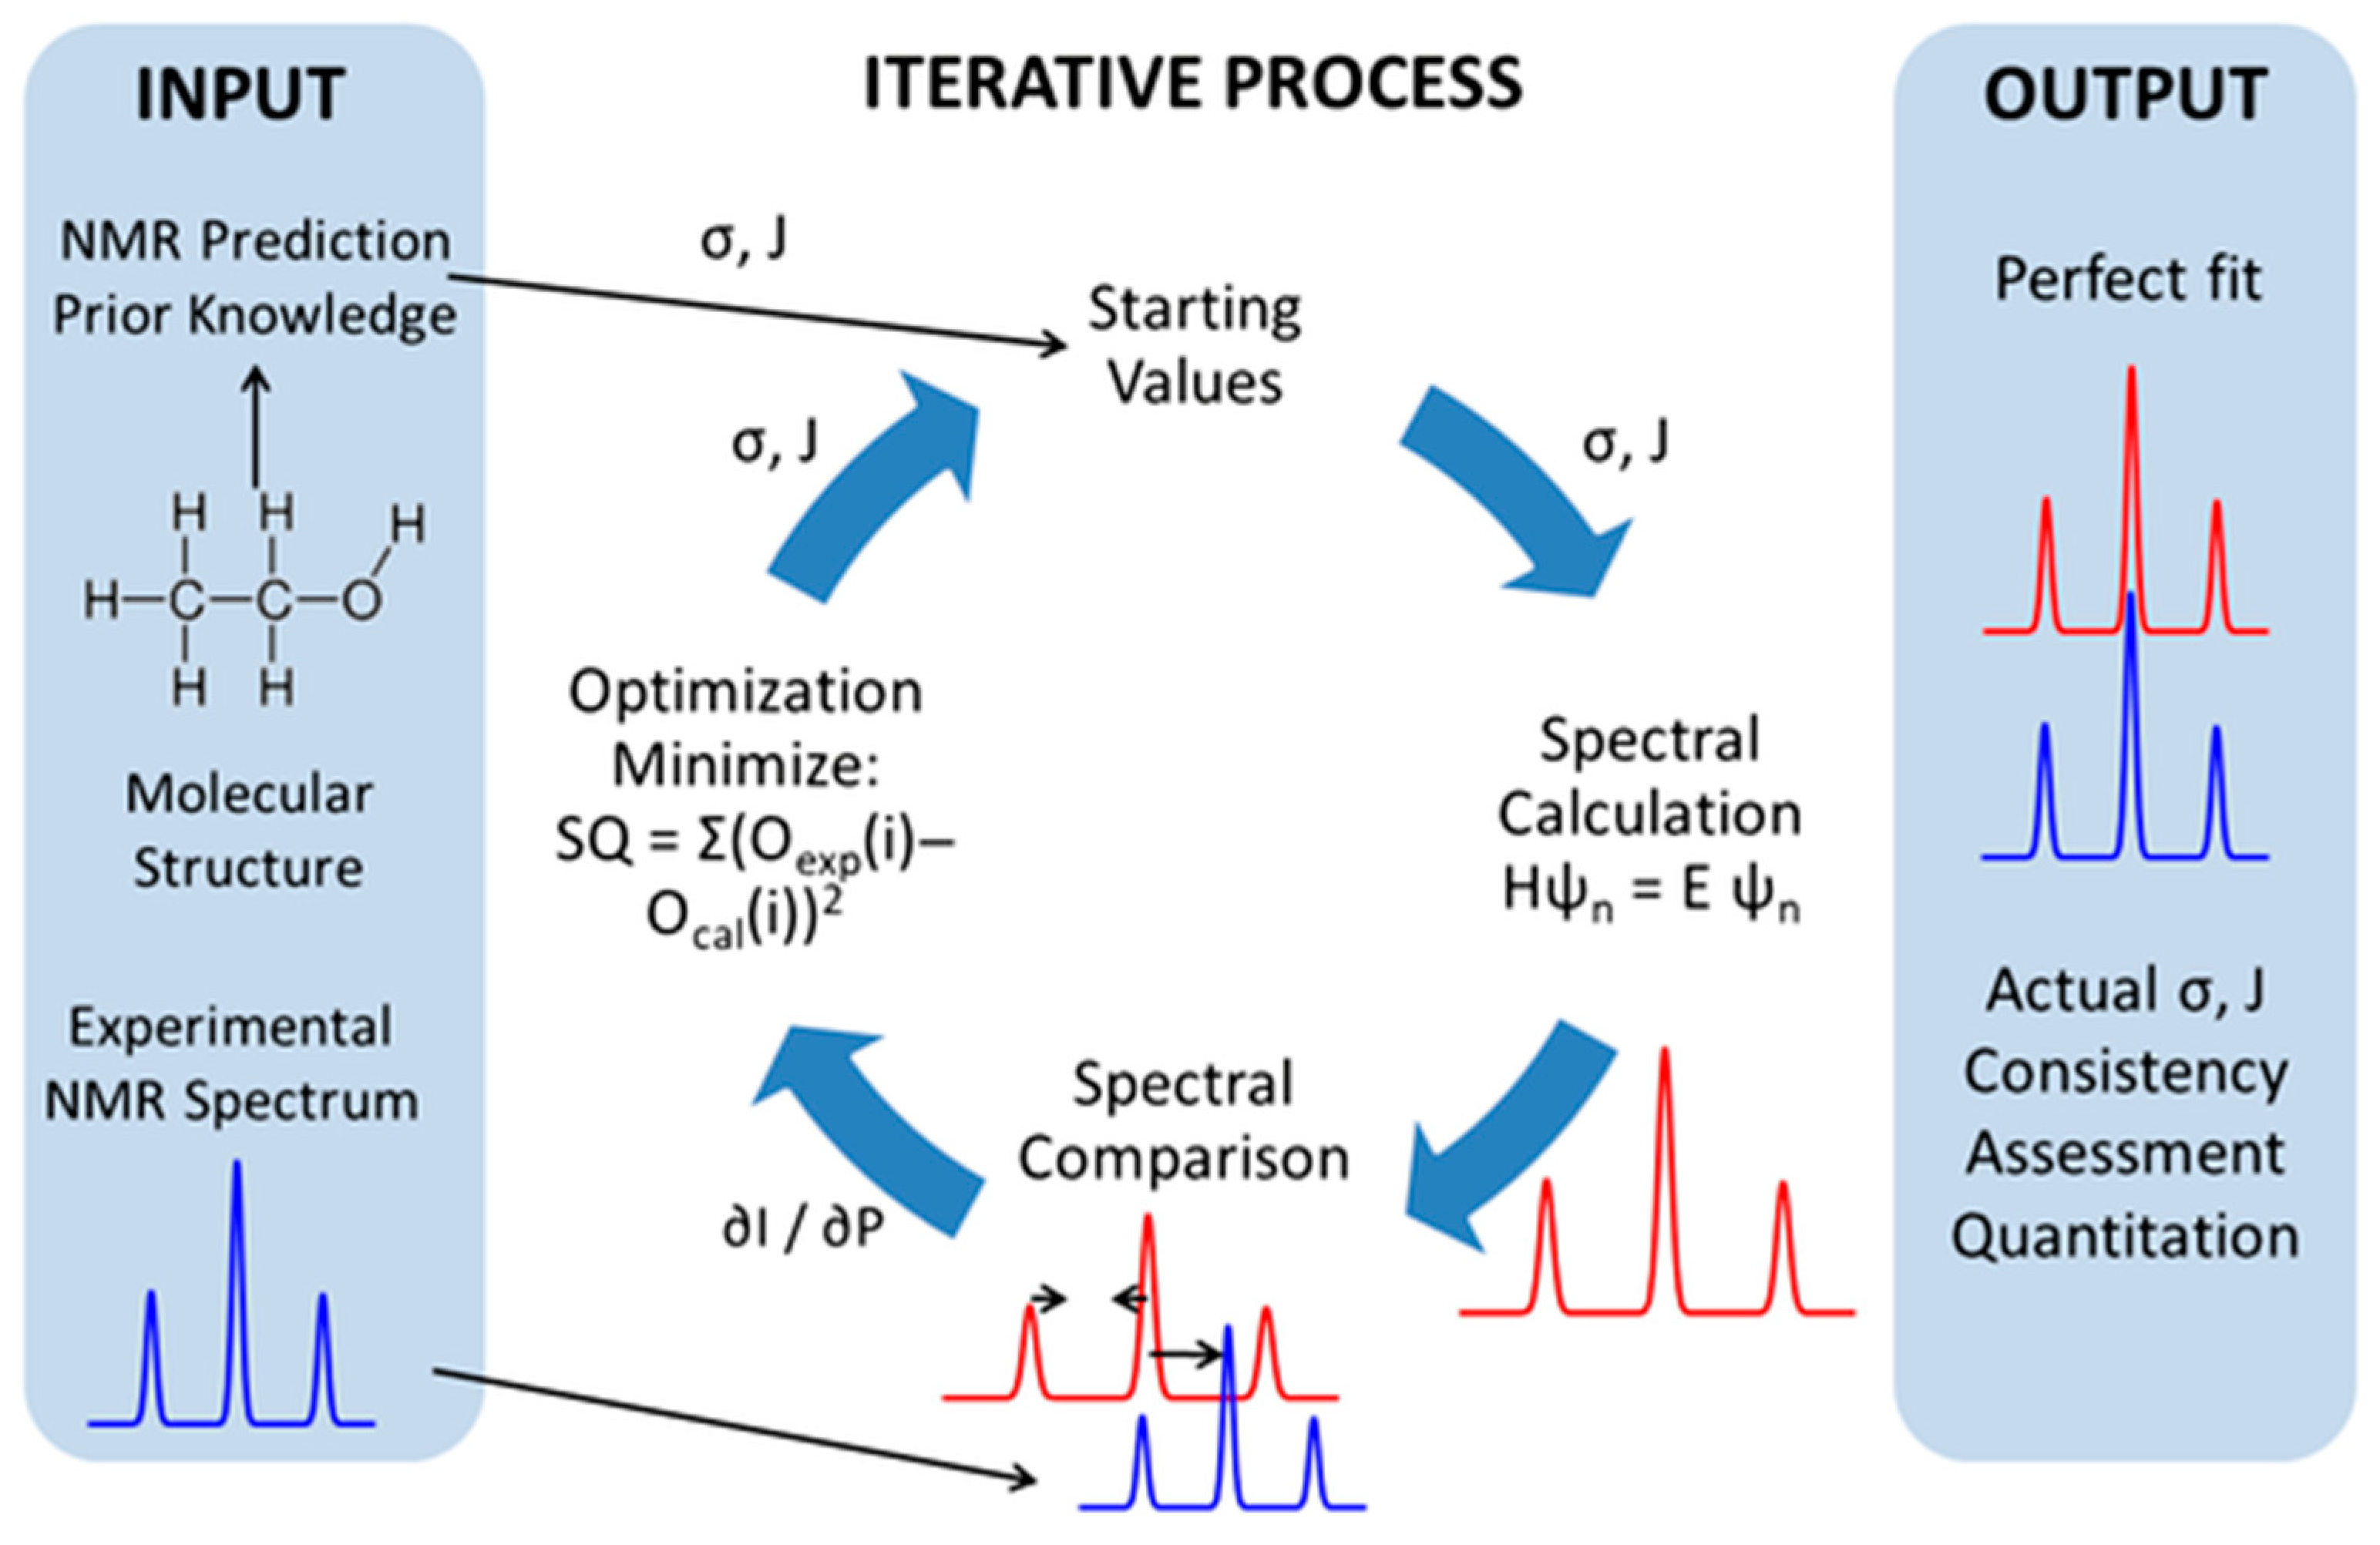
In the initial phase, CT employs a set of NMR parameters derived either from prior analyses or from initial spectral predictions as starting values for the calculation of a simulated spectrum by means of a quantum-mechanical treatment of the spin system. The calculated spectrum is then compared with the experimental one, and the spectral parameters (chemical shifts, coupling constants, relaxation responses, and effective linewidths) are adjusted iteratively so as to reduce the discrepancy between the two. Upon convergence of the iteration, when no further improvement in the agreement can be attained, the corresponding calculated spectrum is shown to the user (Figure 3).
Figure 3.
An overview of the workflow of iterative quantum-mechanical spectral analysis (QMSA) in Cosmic Truth (CT). Initial estimates of chemical shifts (δ) and scalar coupling constants (J), derived from molecular structure and prior information, are used to compute a simulated NMR spectrum by exact spin-Hamiltonian calculations. Iterative optimization minimizes the difference between experimental and calculated spectra until convergence, producing a quantitatively consistent NMR parameter set.
In our case, the initial computational treatment did not lead to a satisfactory solution. Even though some of our previous attempts to perform HiFSA through CT yielded acceptable results in the first run, the size and complexity of the present spin system proved to be a limiting factor. As a consequence, several proton resonances needed to be interchanged: H-6/H-7, H-11α/H-11β, and H-12β/H-15α. This observation highlights the importance of entering the analysis of complex spin systems with proton assignments that are firmly established, preferably derived from complementary one- and two-dimensional NMR experiments.
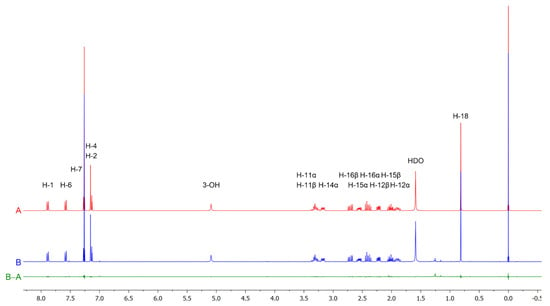
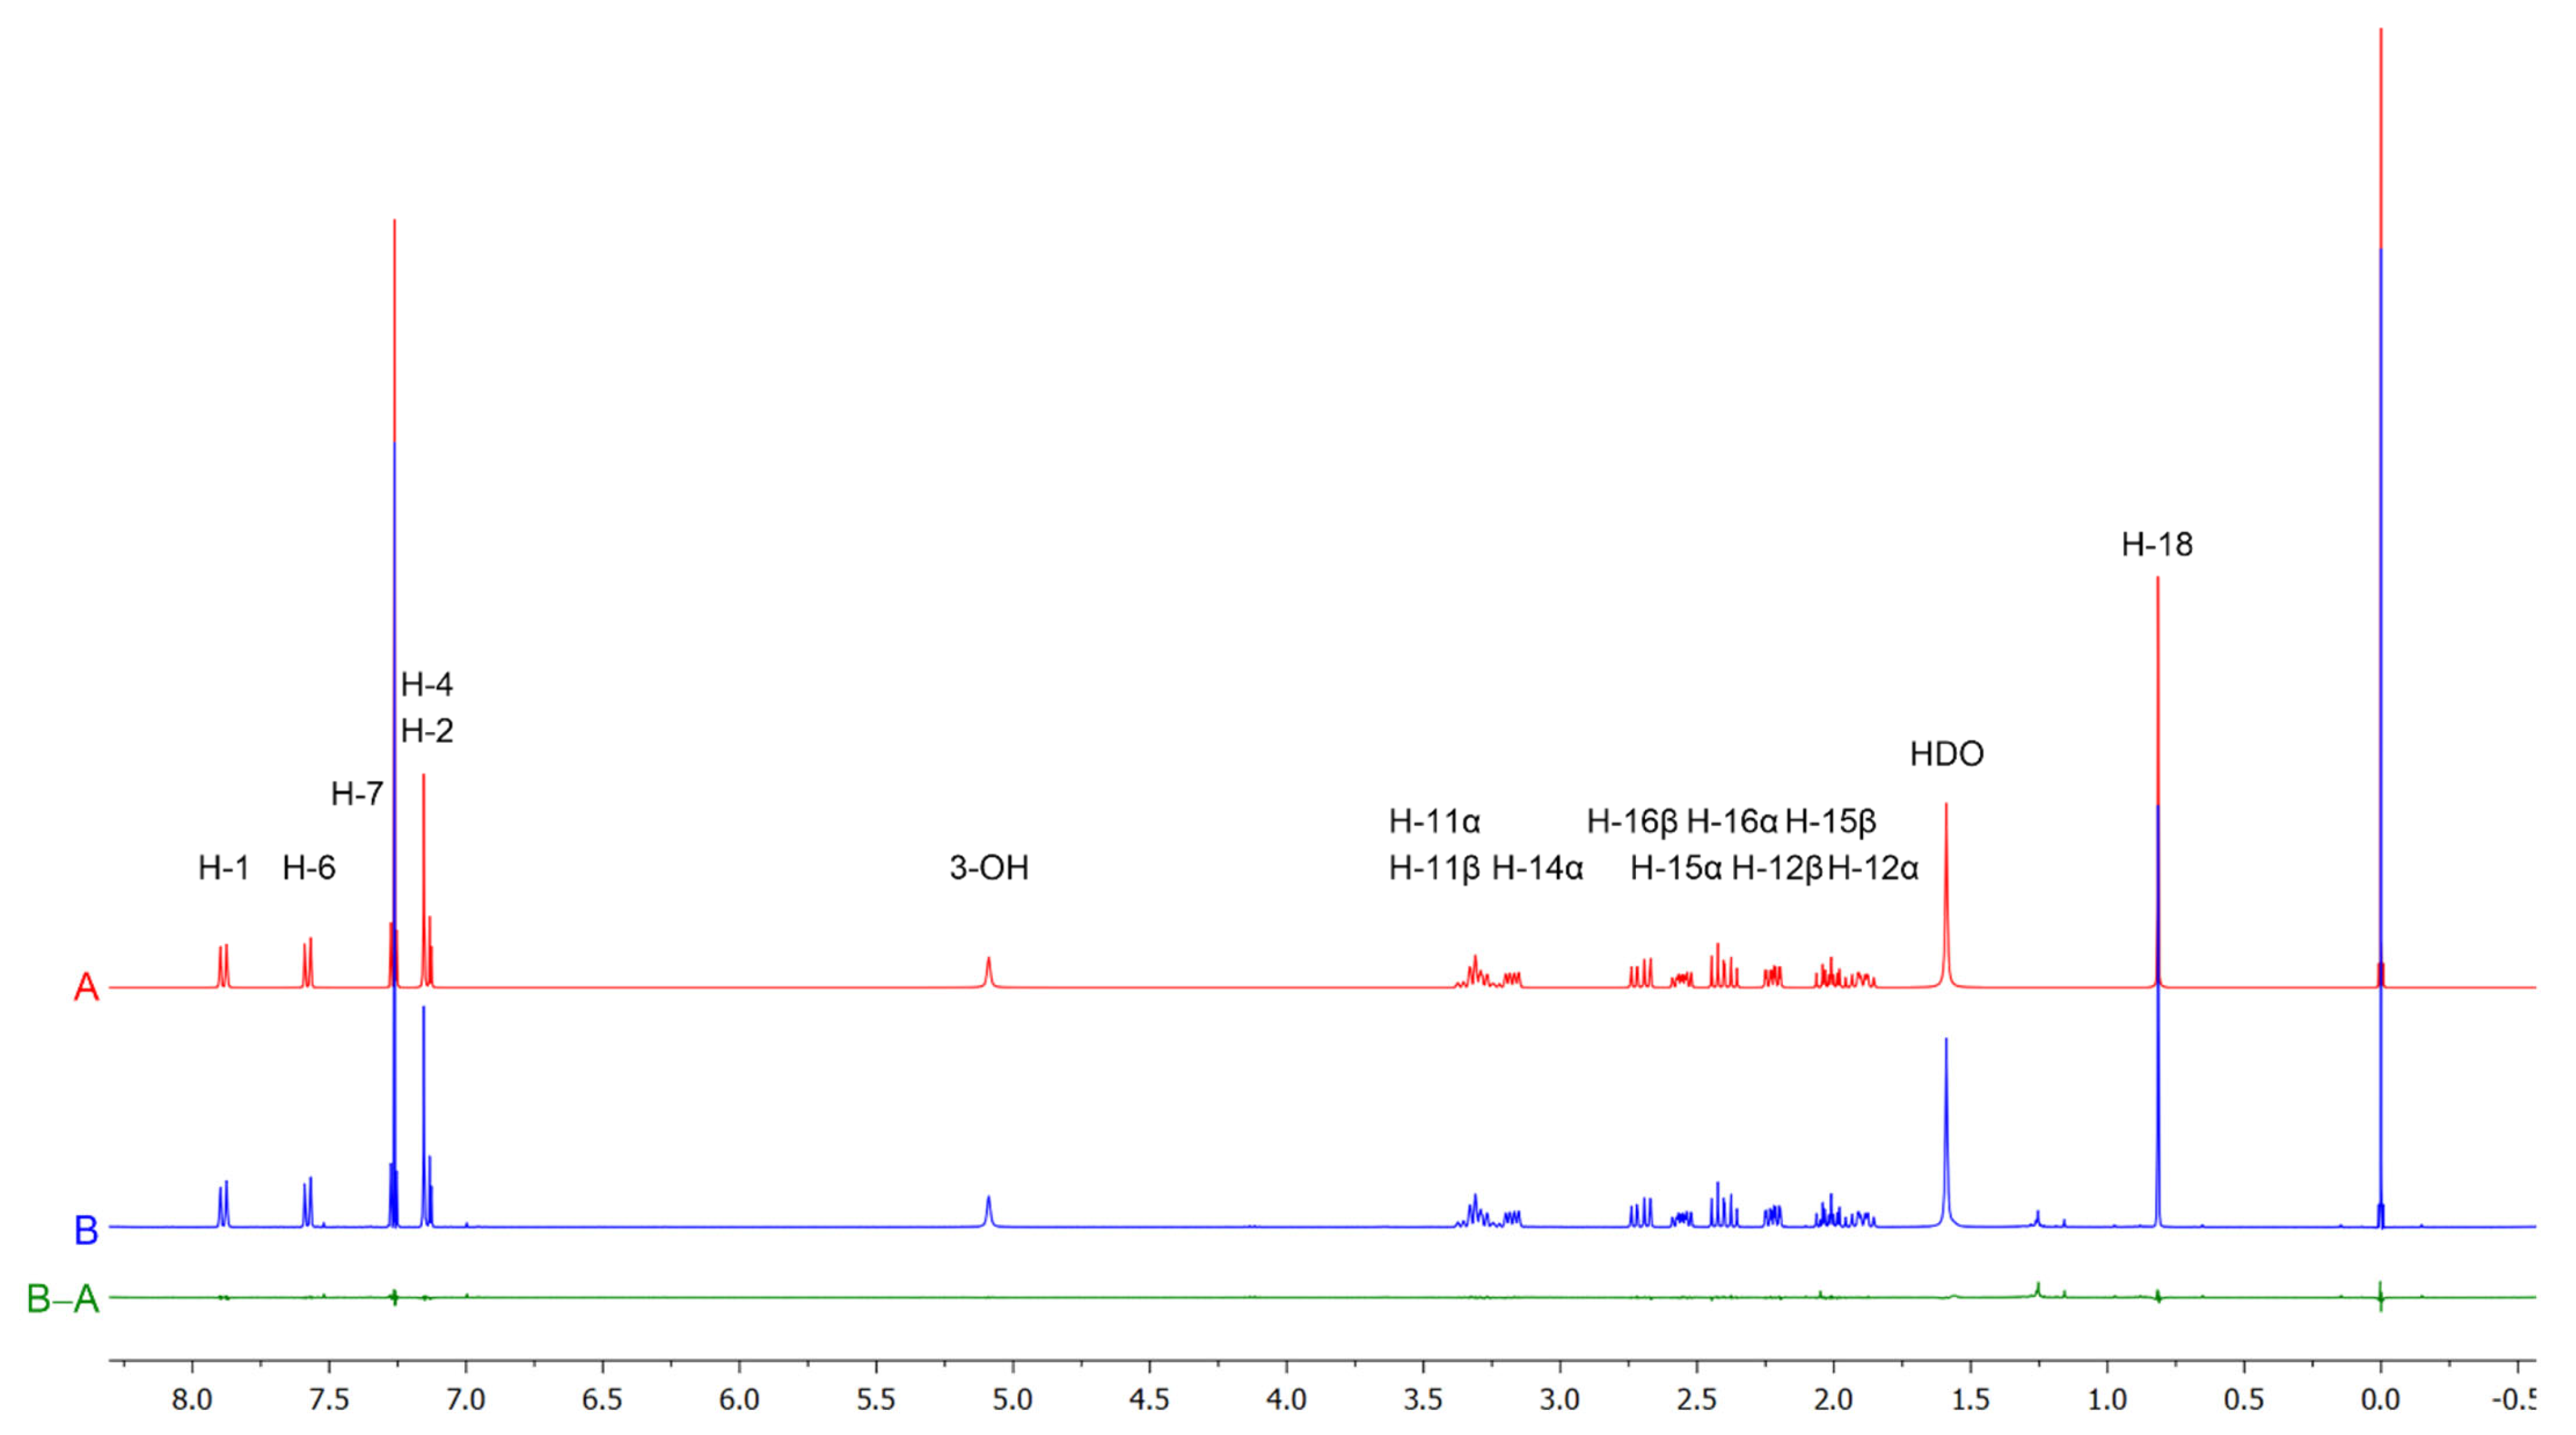
To perform a semi-automatic analysis in CT, the user has the possibility to manually correct spectral parameters in the EDIT mode, allowing the analysis to be repeated and refined automatically. After amending erroneous assignments, we found the optimal strategy to be locking relaxation response values to maximum, while administering changes to coupling constants. The results of the final iteration are given in Table 2, which summarizes the 1H chemical shifts and relevant (>0.1 Hz) scalar coupling constants, including those of overlapped protons and those distorted by higher-order effects. The simulated spectrum is in excellent agreement with the experimental spectra for all spectral lines and line intensities, as shown in Figure 4. The results show that all protons, except for the exchangeable proton of the phenolic group, constitute a single, very large spin system. Specifically, the RMS score, defined in CT as the difference between the experimental and the calculated spectrum and additionally weighted by the local RMS which is calculated for each individual spin system, was 99/100, and the intensity score, calculated by dividing the total area under the experimental spectrum by the total area under the calculated spectrum, was 100/100, indicating a consistent analysis producing a spectrum in excellent quantitative agreement with the experimental spectrum, with the residual spectrum showing no systematic deviations.
Figure 4.
The QMSA-calculated (red, A) and experimental 1H NMR spectrum of equilenin (blue, B, CDCl3, 400 MHz), including the residual (green, B–A).
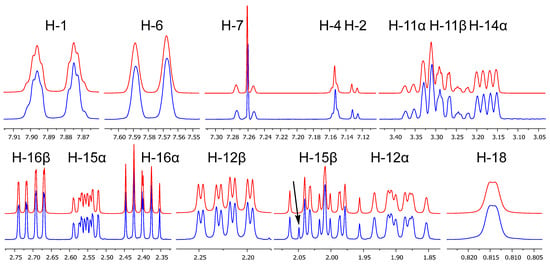
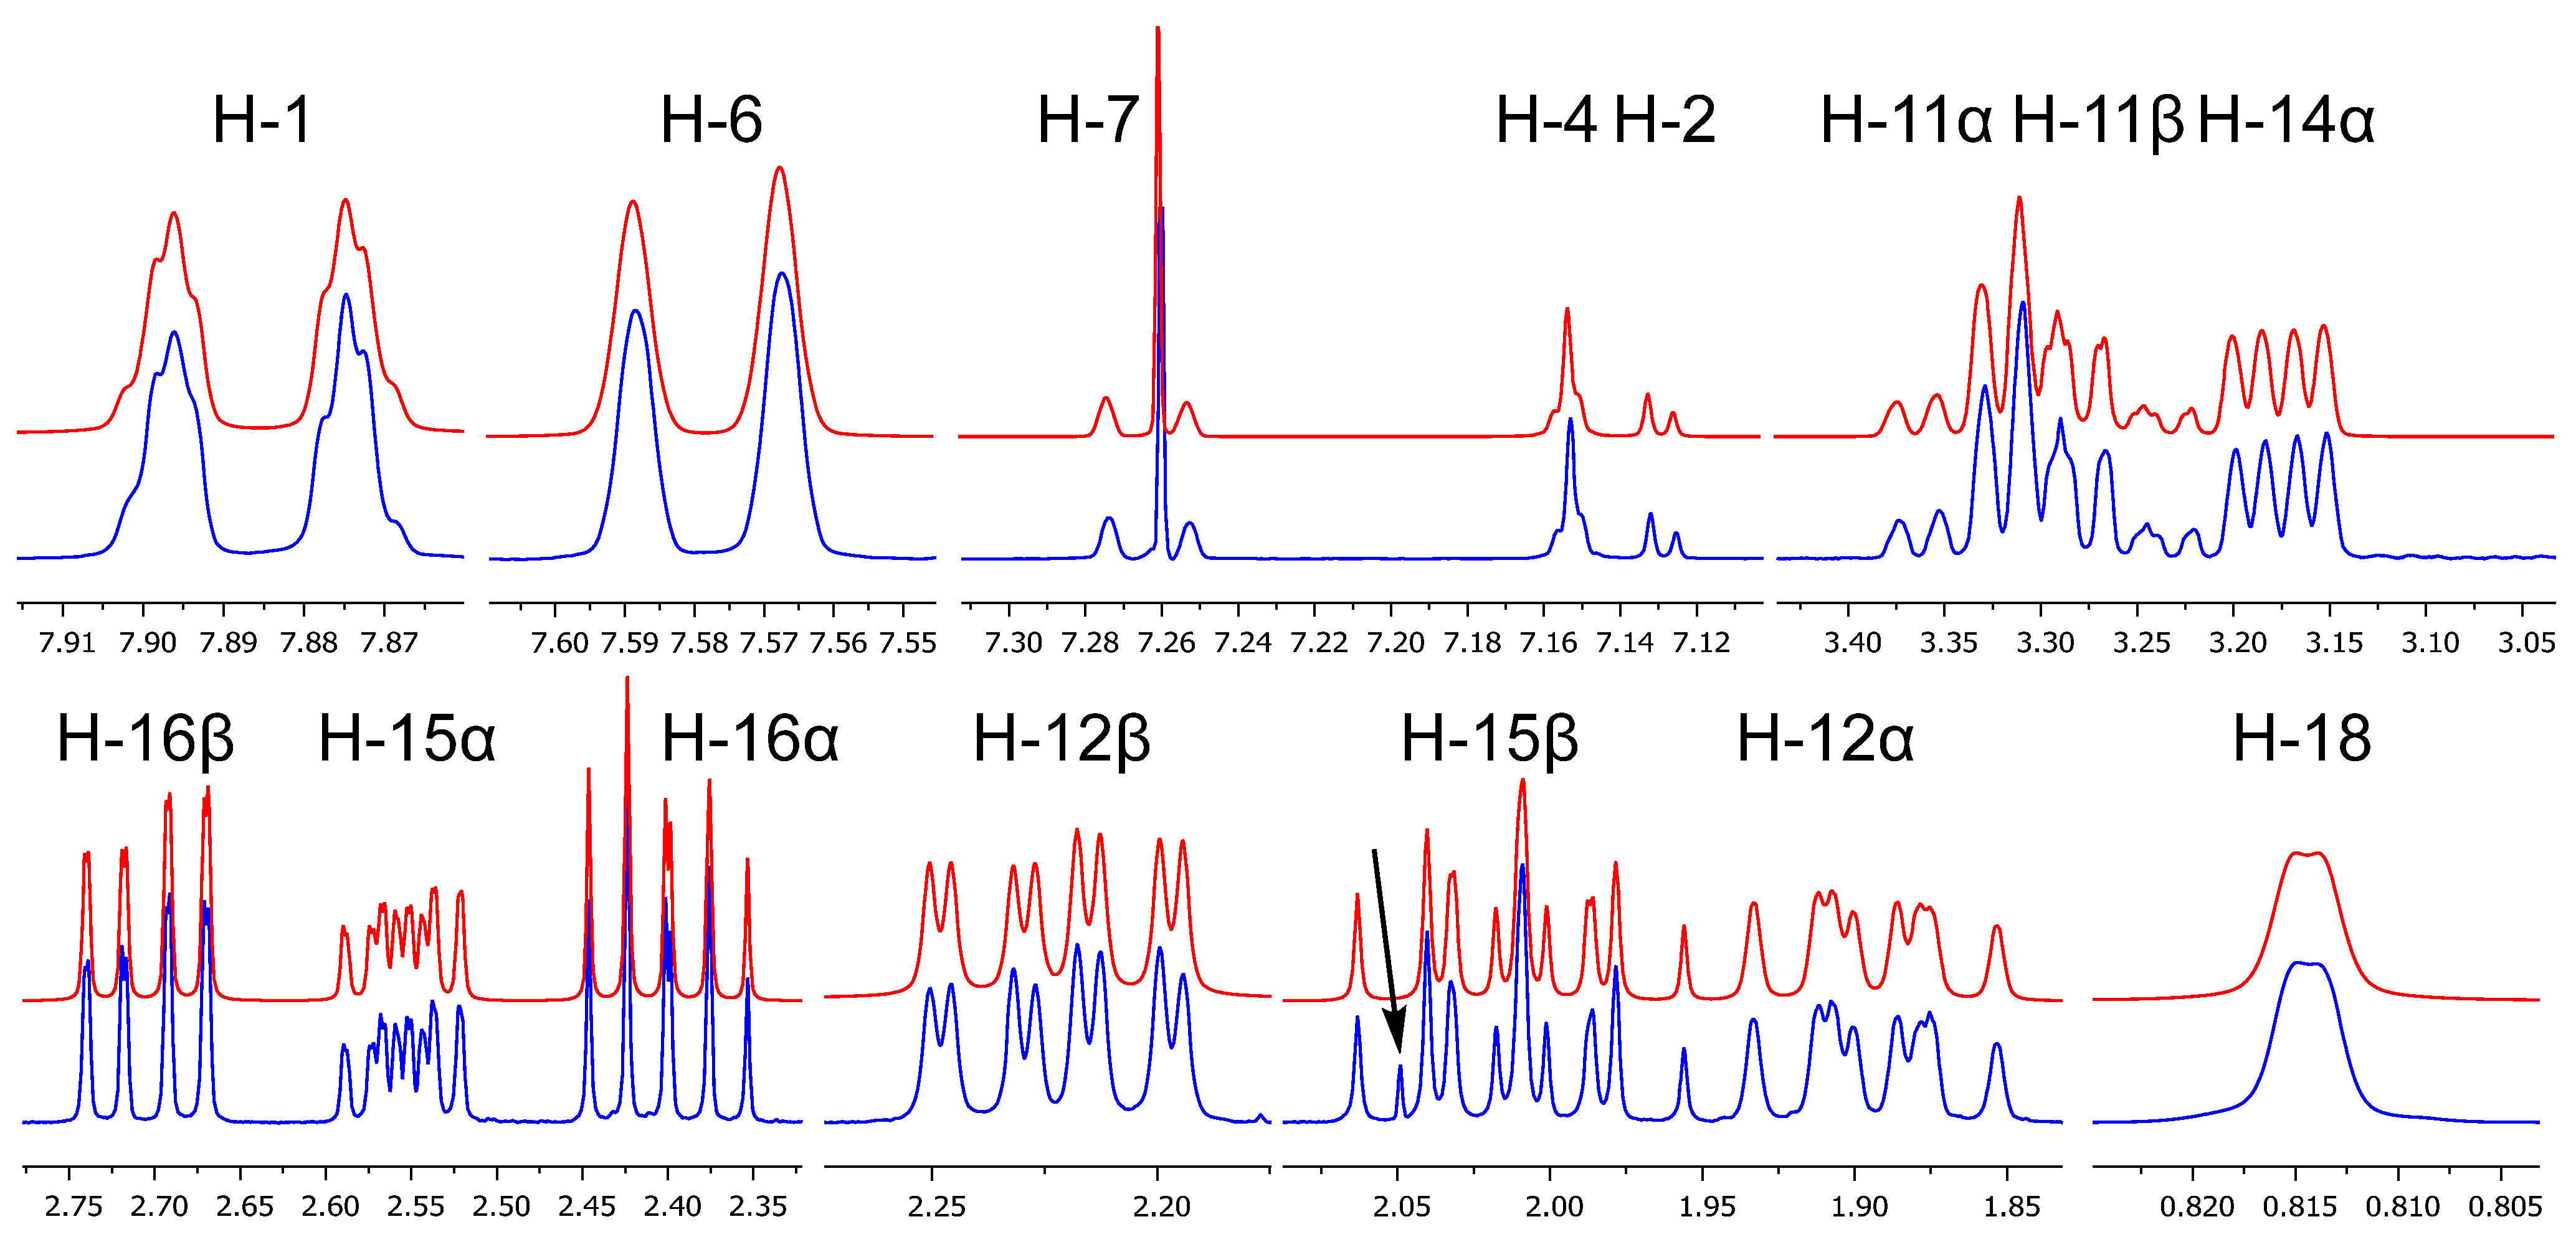
A comparison of the appearances of individual signals is given in Figure 5. The coupling constants of the five aromatic protons are consistent with literature values for naphthalene systems [37]. The geminal couplings of methylene protons also display typical values around −13 Hz in the absence of a neighboring π-acceptor (2J12α,12β; 2J15α,15β), and around −18 Hz (2J11α,11β; 2J16α,16β) in the presence of a neighboring π-acceptor.
Figure 5.
Appearances of individual 1H signals in the experimental spectrum of equilenin (CDCl3, 400 MHz, blue) and the simulated spectrum (red); the arrow indicates the signal arising from the methyl group of ethyl acetate present as an impurity.
Vicinal couplings depend, as expected, on the dihedral angle between the coupled protons, in accordance with the Karplus equation. Ring C of equilenin adopts a half-chair conformation due to the presence of the Δ8 double bond; consequently, the coupling constant between pseudoaxial H-11β and pseudoequatorial H-12β amounts to as much as 8.1 Hz, owing to a dihedral angle of approximately 30°. A comparable coupling constant value (7.8 Hz) was determined for 3J11β,12β in 3-methoxyestra-1,3,5(10),6,8-pentaen-17β-ol using the TOCSY technique [29]. Similarly, the coupling between pseudoequatorial H-11α and pseudoequatorial H-12β is only 1.2 Hz, since the dihedral angle between these protons is close to 90°; we measured this torsion angle to be 85° in a reported crystal structure [38]. In addition, the characteristic signal of the angular methyl group appears as a doublet with a small coupling constant (−0.7 Hz), corresponding to a long-range “W” coupling with H-12α. Another long-range coupling crucial for the explanation of the lineshape of H-1 (Figure 5) was that to H-14α; coupling of H-1 to H-11α and H-11β was initially predicted by the algorithm but was found not to significantly influence the total lineshape.
The sign of scalar coupling constants is not directly accessible from routine 1D 1H NMR experiments. In the present analysis, the reported signs of long-range (4J) couplings arise from the adopted quantum-mechanical model and semiempirical considerations used during spectral fitting. Where the sign of a coupling affects the spectral lineshape, an incorrect sign would prevent convergence to an acceptable fit; conversely, when the sign has no observable impact on the spectrum, it cannot be independently validated without additional experiments, which were not pursued here.
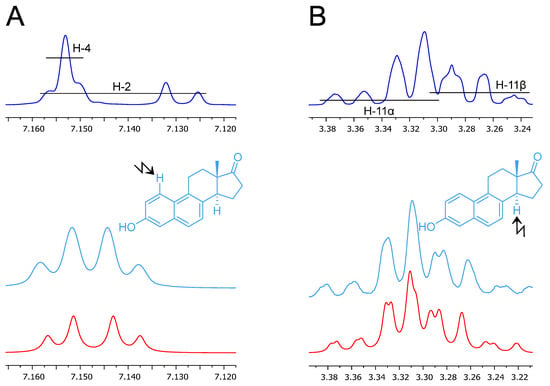
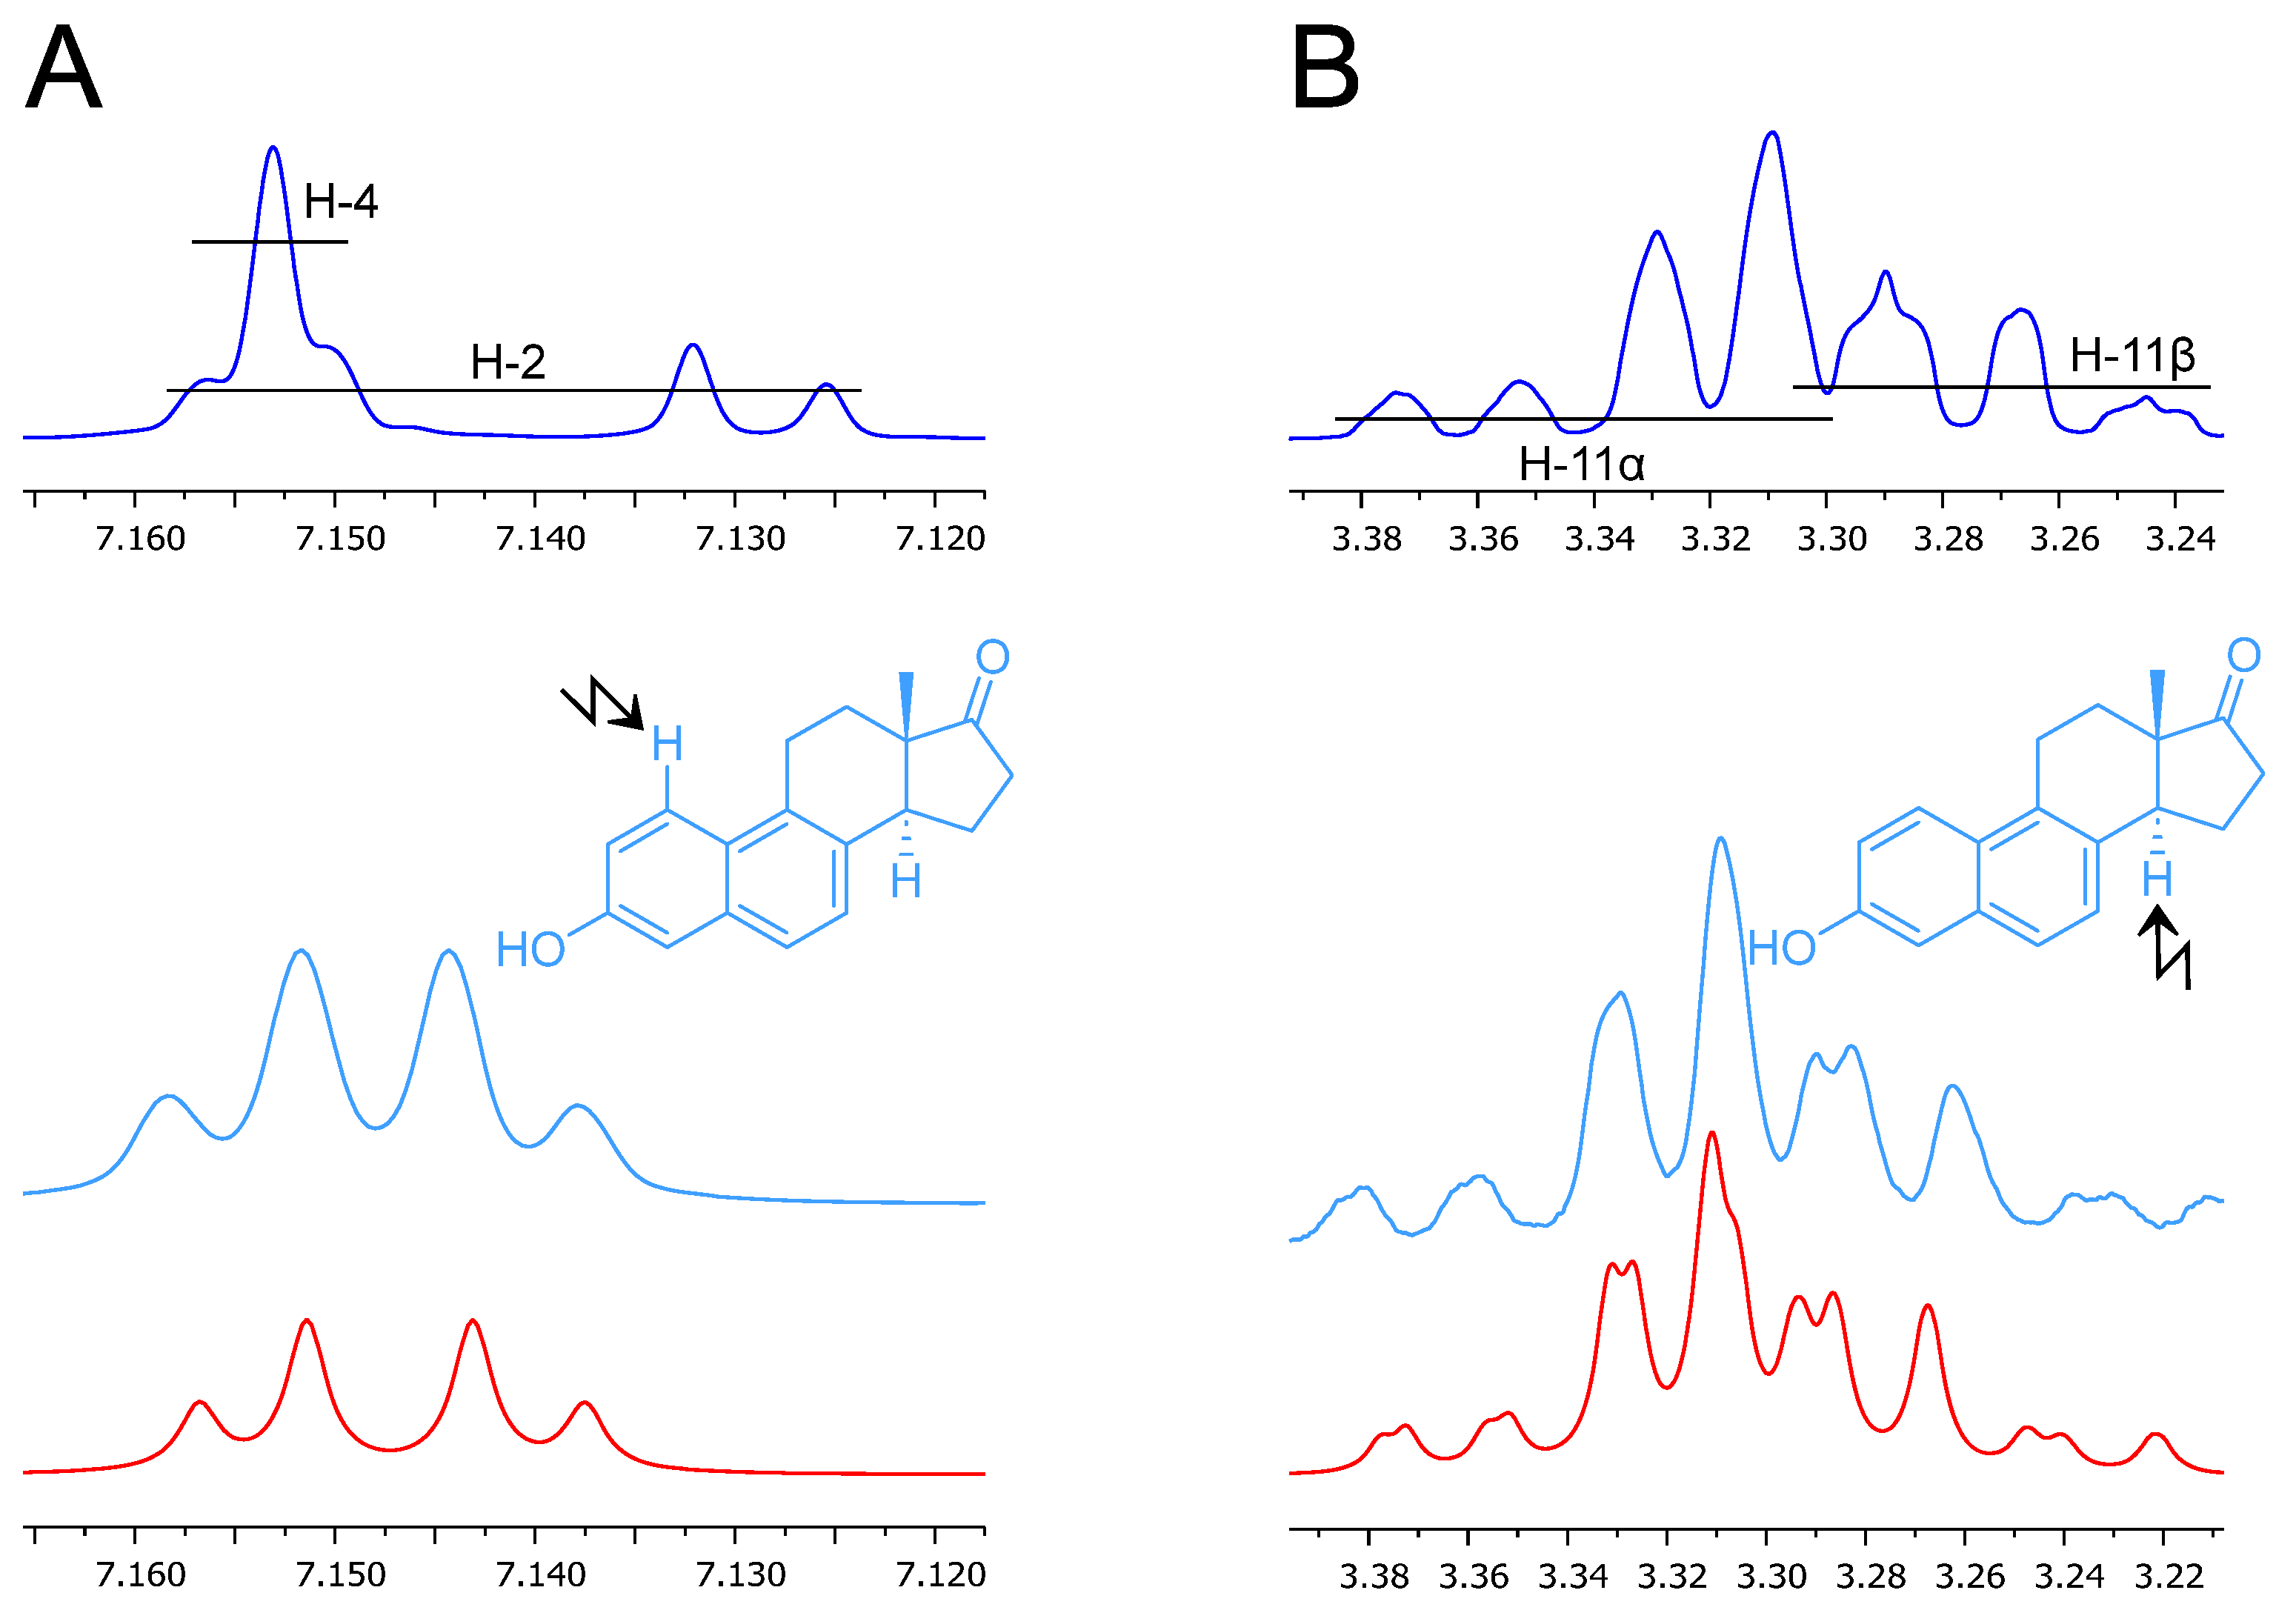
Selective homonuclear decoupling experiments proved particularly useful for refining the values of chemical shifts and coupling constants of (partially) overlapping signals. The H-4 signal is completely overlapped with part of the H-2 signal. Upon irradiation of the H-1 signal, the ortho coupling constant disappears, and the lineshapes of the H-2 and H-4 signals are simplified into a pattern resembling an AB quartet, the form of which can also be confirmed by simulation (Figure 6). Somewhat more complex are the shapes of the two partially overlapping and strongly coupled signals at 3.27 and 3.33 ppm, corresponding to H-11β and H-11α, respectively. In this case, achieving agreement with the experimental spectrum required the introduction of long-range homoallylic coupling constants (4J11α,14α = 0.5 Hz; 4J11β,14α = 2.0 Hz), as also indicated by the results of the decoupling of H-14α (Figure 6).
Figure 6.
Blue: signals of protons H-2 and H-4 (A) and protons H-11α and H-11β (B) in the 1H NMR spectrum of equilenin (CDCl3, 400 MHz); cyan: expansions of the 1H NMR spectrum obtained by irradiation of H-1 (A) or H-14α (B); red: simulated 1H NMR spectra with decoupling of H-1 (A) or H-14α (B).
Beyond serving as a structural reference, the HiFSA-derived parameter set functions as a quantitative spectral fingerprint that enables model-based identification and deconvolution of equilenin in complex 1H NMR spectra. Such an approach would be directly applicable to NMR-based analytical assays used for identity testing and regulatory verification, where robust discrimination of closely related steroidal compounds is required.
4. Conclusions
In the present study, the 1H and 13C NMR spectra of equilenin have been subjected to a detailed analysis. By combining conventional one- and two-dimensional NMR experiments with quantum-mechanically driven full spin analysis, all proton resonances and scalar coupling constants of the molecule were determined, including long-range couplings that are not readily accessible by routine interpretation. The resulting HiFSA model provides a faithful representation of the experimental 1H NMR spectrum and resolves ambiguities arising from spectral overlap and second-order effects.
The complete 1H/13C NMR assignment presented herein establishes a reliable spectroscopic reference for equilenin and illustrates the analytical advantages of quantum-mechanical spin treatment for structurally rigid steroidal systems. Beyond correcting and consolidating earlier partial assignments, the present work demonstrates that exhaustive analysis of the 1H NMR spin network yields parameter sets suitable for spectral simulation and comparison across different experimental conditions. To ensure accurate dereplication and reproducibility beyond tabulated chemical shifts and images of spectra, the original 1H NMR data for equilenin have been included in the Supplementary Materials of the article. As such, these data may facilitate future dereplication, structural verification, and analytical applications involving equilenin and related steroid hormones.
Supplementary Materials
The following supporting information can be downloaded at: https://www.mdpi.com/article/10.3390/magnetochemistry12030032/s1, Figure S1: 1H NMR spectrum of equilenin (CDCl3, 400 MHz); Figure S2: Resolution-enhanced 1H NMR spectrum of equilenin (CDCl3, 400 MHz); Figure S3: 13C{1H} NMR spectrum of equilenin (CDCl3, 101 MHz); Figure S4. 1H,1H–COSY spectrum of equilenin (CDCl3); Figure S5. NOESY spectrum of equilenin (CDCl3); Figure S6. HSQC spectrum of equilenin (CDCl3); Figure S7. HMBC spectrum of equilenin (CDCl3).
Author Contributions
Conceptualization, V.R. and N.S.R.; methodology, V.R. and K.U.; software, V.R. and K.U.; validation, N.S.R. and N.K.; investigation, V.R. and K.U.; resources, B.S.Č.; writing—original draft preparation, V.R.; writing—review and editing, N.S.R., N.K., and B.S.Č.; visualization, K.U. and B.S.Č.; supervision, N.S.R. and B.S.Č.; project administration, N.K.; funding acquisition, N.K. and B.S.Č. All authors have read and agreed to the published version of the manuscript.
Funding
This research was funded by the Provincial Secretariat for Higher Education and Scientific Research of the Autonomous Province of Vojvodina (grant number 003875877 2025 09418 003 000 000 001 04 004).
Data Availability Statement
The original contributions presented in this study are included in the article/supplementary materials. Further inquiries can be directed to the corresponding author.
Acknowledgments
The authors are indebted to Matthias Niemitz for helpful discussions.
Conflicts of Interest
The authors declare no conflicts of interest.
References
- Hanson, J.R. A Hundred Years in the Elucidation of the Structures of Natural Products. Sci. Prog. 2017, 100, 63–79. [Google Scholar] [CrossRef] [Scilit] [PubMed]
- Breton, R.C.; Reynolds, W.F. Using NMR to Identify and Characterize Natural Products. Nat. Prod. Rep. 2013, 30, 501. [Google Scholar] [CrossRef] [Scilit] [PubMed]
- McAlpine, J.B.; Chen, S.-N.; Kutateladze, A.; MacMillan, J.B.; Appendino, G.; Barison, A.; Beniddir, M.A.; Biavatti, M.W.; Bluml, S.; Boufridi, A.; et al. The Value of Universally Available Raw NMR Data for Transparency, Reproducibility, and Integrity in Natural Product Research. Nat. Prod. Rep. 2019, 36, 35–107. [Google Scholar] [CrossRef] [Scilit]
- Robien, W. A Critical Evaluation of the Quality of Published 13C NMR Data in Natural Product Chemistry. In Progress in the Chemistry of Organic Natural Products; Kinghorn, A.D., Falk, H., Gibbons, S., Asakawa, Y., Liu, J., Dirsch, V.M., Eds.; Springer: New York, NY, USA, 2017; Volume 105, pp. 137–215. [Google Scholar]
- Saielli, G.; Bagno, A. Can Two Molecules Have the Same NMR Spectrum? Hexacyclinol Revisited. Org. Lett. 2009, 11, 1409–1412. [Google Scholar] [CrossRef] [Scilit] [PubMed]
- Pauli, G.F.; Niemitz, M.; Bisson, J.; Lodewyk, M.W.; Soldi, C.; Shaw, J.T.; Tantillo, D.J.; Saya, J.M.; Vos, K.; Kleinnijenhuis, R.A.; et al. Toward Structural Correctness: Aquatolide and the Importance of 1D Proton NMR FID Archiving. J. Org. Chem. 2016, 81, 878–889. [Google Scholar] [CrossRef] [Scilit]
- Bhavaraju, S.; Taylor, D.; Niemitz, M.; Lankin, D.C.; Bzhelyansky, A.; Giancaspro, G.I.; Liu, Y.; Pauli, G.F. NMR-Based Quantum Mechanical Analysis Builds Trust and Orthogonality in Structural Analysis: The Case of a Bisdesmosidic Triglycoside as Withania somnifera Aerial Parts Marker. J. Nat. Prod. 2021, 84, 836–845. [Google Scholar] [CrossRef] [Scilit]
- Botros, L.; Liu, Y.; Corbett, C.; Sørensen, D.; Szabo, C.; Bzhelyansky, A.; Niemitz, M.; Korhonen, P.; Pauli, G.F.; Giraudeau, P.; et al. Connecting the Practice of Modern Qualitative and Quantitative NMR Analysis with Its Theoretical Foundation. J. Nat. Prod. 2025, 88, 877–888. [Google Scholar] [CrossRef] [Scilit]
- Kasal, A.; Budesinsky, M.; Griffiths, W.J. Spectroscopic Methods of Steroid Analysis. In Steroid Analysis; Makin, H.L.J., Gower, D.B., Eds.; Springer: Dordrecht, The Netherlands, 2010; pp. 27–161. [Google Scholar]
- Leibfritz, D.; Haupt, E.; Feigel, M.; Hull, W.E.; Weber, W. Strukturnachweis von 9α-Hydroxyöstronmethylether Durch Zweidimensionale Protonen-FT-NMR und 13C-NMR-Spektroskopie. Liebigs Ann. Chem. 1982, 1982, 1971–1981. [Google Scholar] [CrossRef] [Scilit]
- Findlay, J.A.; Jaseja, M.; Brisson, J.-R. Forbeside C, a Saponin from Asterias forbesi. Complete Structure by Nuclear Magnetic Resonance Methods. Can. J. Chem. 1987, 65, 2605–2611. [Google Scholar] [CrossRef] [Scilit]
- Eby, R.; Srivastava, V.K. Conformational Analysis of 1,2-Anhydro-3,4,6-Tri-O-Benzyl-α-d-Glucopyranose and -β-d-Mannopyranose. Carbohydr. Res. 1982, 102, 1–9. [Google Scholar] [CrossRef] [Scilit]
- Laatikainen, R.; Niemitz, M.; Malaisse, W.J.; Biesemans, M.; Willem, R. A Computational Strategy for the Deconvolution of NMR Spectra with Multiplet Structures and Constraints: Analysis of Overlapping 13C-2H Multiplets of 13C Enriched Metabolites from Cell Suspensions Incubated in Deuterated Media. Magn. Reson. Med. 1996, 36, 359–365. [Google Scholar] [CrossRef] [Scilit]
- Laatikainen, R.; Niemitz, M.; Weber, U.; Sundelin, J.; Hassinen, T.; Vepsäläinen, J. General Strategies for Total-Lineshape-Type Spectral Analysis of NMR Spectra Using Integral-Transform Iterator. J. Magn. Reson. Ser. A 1996, 120, 1–10. [Google Scholar] [CrossRef] [Scilit]
- Castellano, S.; Bothner-By, A.A. Analysis of NMR Spectra by Least Squares. J. Chem. Phys. 1964, 41, 3863–3869. [Google Scholar] [CrossRef] [Scilit]
- Inui, T.; Wang, Y.; Nikolic, D.; Smith, D.C.; Franzblau, S.G.; Pauli, G.F. Sesquiterpenes from Oplopanax horridus. J. Nat. Prod. 2010, 73, 563–567. [Google Scholar] [CrossRef] [Scilit] [PubMed]
- Muñoz, M.A.; Perez-Hernandez, N.; Pertino, M.W.; Schmeda-Hirschmann, G.; Joseph-Nathan, P. Absolute Configuration and 1H NMR Characterization of Rosmaridiphenol Diacetate. J. Nat. Prod. 2012, 75, 779–783. [Google Scholar] [CrossRef] [Scilit]
- Napolitano, J.G.; Lankin, D.C.; McAlpine, J.B.; Niemitz, M.; Korhonen, S.-P.; Chen, S.-N.; Pauli, G.F. Proton Fingerprints Portray Molecular Structures: Enhanced Description of the 1H NMR Spectra of Small Molecules. J. Org. Chem. 2013, 78, 9963–9968. [Google Scholar] [CrossRef] [Scilit]
- Pauli, G.F.; Chen, S.-N.; Lankin, D.C.; Bisson, J.; Case, R.J.; Chadwick, L.R.; Gödecke, T.; Inui, T.; Krunic, A.; Jaki, B.U.; et al. Essential Parameters for Structural Analysis and Dereplication by 1H NMR Spectroscopy. J. Nat. Prod. 2014, 77, 1473–1487. [Google Scholar] [CrossRef] [Scilit]
- Napolitano, J.G.; Lankin, D.C.; Graf, T.N.; Friesen, J.B.; Chen, S.-N.; McAlpine, J.B.; Oberlies, N.H.; Pauli, G.F. HiFSA Fingerprinting Applied to Isomers with Near-Identical NMR Spectra: The Silybin/Isosilybin Case. J. Org. Chem. 2013, 78, 2827–2839. [Google Scholar] [CrossRef] [Scilit]
- Napolitano, J.G.; Gödecke, T.; Rodríguez-Brasco, M.F.; Jaki, B.U.; Chen, S.-N.; Lankin, D.C.; Pauli, G.F. The Tandem of Full Spin Analysis and QHNMR for the Quality Control of Botanicals Exemplified with Ginkgo biloba. J. Nat. Prod. 2012, 75, 238–248. [Google Scholar] [CrossRef] [Scilit]
- Achanta, P.S.; Jaki, B.U.; McAlpine, J.B.; Friesen, J.B.; Niemitz, M.; Chen, S.-N.; Pauli, G.F. Quantum Mechanical NMR Full Spin Analysis in Pharmaceutical Identity Testing and Quality Control. J. Pharm. Biomed. Anal. 2021, 192, 113601. [Google Scholar] [CrossRef] [Scilit]
- Girard, A.; Sandulesco, G.; Fridenson, A.; Gaudefroy, C.; Rutgers, J.J. Sur Les Hormones Sexuelles Cristallisées Retirées de l’Urine Des Juments Gravides. C. R. Hebd. Seances Acad. Sci. 1932, 194, 1020–1022. [Google Scholar]
- Scanes, C.G. Animal Attributes Exploited by Humans (Nonfood Uses of Animals). In Animals and Human Society; Scanes, C.G., Toukhsati, S.R., Eds.; Elsevier: New York, NY, USA, 2018; pp. 13–40. [Google Scholar]
- Ruan, X.; Mueck, A.O. Primary Choice of Estrogen and Progestogen as Components for HRT: A Clinical Pharmacological View. Climacteric 2022, 25, 443–452. [Google Scholar] [CrossRef] [Scilit] [PubMed]
- Takano, S.; Inomata, K.; Ogasawara, K. Concise Enantio- and Stereo-Controlled Synthesis of (+)-Equilenin Using Chiral Cyclopentadienone Synthon. J. Chem. Soc. Chem. Commun. 1990, 1544–1546. [Google Scholar] [CrossRef] [Scilit]
- Yoshida, M.; Abdel-Hamid Ismail, M.; Nemoto, H.; Ihara, M. Asymmetric Total Synthesis of (+)-Equilenin Utilizing Two Types of Cascade Ring Expansion Reactions of Small Ring Systems. J. Chem. Soc. Perkin Trans. 1 2000, 2629–2635. [Google Scholar] [CrossRef] [Scilit]
- Caoa, Z.; Liehr, J.G. An Effective Approach to B-Ring Aromatization of Equilin. Synth. Commun. 1997, 27, 145–155. [Google Scholar] [CrossRef] [Scilit]
- Ciuffreda, P.; Casati, S.; Manzocchi, A. Complete 1H and 13C NMR Spectral Assignment of 17-hydroxy Epimeric Sterols with Planar A or A and B Rings. Magn. Reson. Chem. 2004, 42, 360–363. [Google Scholar] [CrossRef] [Scilit]
- Napolitano, J.G.; Lankin, D.C.; Chen, S.; Pauli, G.F. Complete 1H NMR Spectral Analysis of Ten Chemical Markers of Ginkgo biloba. Magn. Reson. Chem. 2012, 50, 569–575. [Google Scholar] [CrossRef] [Scilit]
- Nešić, M.D.; Nešić, M.S.; Raca, I.L.; Bukleski, M.; Radulović, N.S. Unmasking the Aliphatic Repertoire: New Polyunsaturated Metabolites in Bupleurum falcatum sensu lato Provide Chemotaxonomic Insights. Plants 2025, 14, 1432. [Google Scholar] [CrossRef] [Scilit]
- Nesic, M.; Radulovic, N. Assignment of 1H and 13C NMR Spectral Data of Diastereomeric Acetals Directly from Their Mixture by Spectral Simulation. Facta Univ.-Ser. Phys. Chem. Technol. 2021, 19, 69–79. [Google Scholar] [CrossRef] [Scilit]
- Dekić, M.S.; Gusinac, A.M.; Jeremić, S.R.; Jakovljević, V.D.; Plojović, S.A.; Jovanović, D.; Radulović, N.S. Abietane Diterpenoid Salvipisone: Structure Elucidation, Conformational Analysis, and Antimicrobial Activity. J. Mol. Struct. 2025, 1321, 139807. [Google Scholar] [CrossRef] [Scilit]
- Dimitrijević, M.Ž.; Mladenović, M.Z.; Nešić, M.D.; Dekić, M.S.; Raičević, V.N.; Radulović, N.S. New Oxygenated Methoxy-p-Cymene Derivatives from Leopard’s Bane (Doronicum columnae Ten., Asteraceae) Essential Oil: Synthesis Facilitating the Identification of Isomeric Minor Constituents in Complex Matrices. Molecules 2025, 30, 302. [Google Scholar] [CrossRef] [Scilit]
- Radulović, N.S.; Mladenović, M.Z.; Stojanović, N.M.; Randjelović, P.J.; Blagojević, P.D. Structural Elucidation of Presilphiperfolane-7α,8α-Diol, a Bioactive Sesquiterpenoid from Pulicaria vulgaris: A Combined Approach of Solvent-Induced Chemical Shifts, GIAO Calculation of Chemical Shifts, and Full Spin Analysis. J. Nat. Prod. 2019, 82, 1874–1885. [Google Scholar] [CrossRef] [Scilit]
- Juárez-Carrillo, F.; García-Gutiérrez, H.A.; Luna-Vázquez, M.; Espinoza-Hicks, J.C.; Aviña-Verduzco, J.A.; Guzmán-Mejía, R.; Armenta-Salinas, C.; Cerda-García-Rojas, C.M.; Ontiveros-Rodríguez, J.C. Complete 1H and 13C NMR Assignment of the Ent-Labdane 2α-Hydroxyeperuic Acid Combining Conventional NMR Methods and HiFSA. Magn. Reson. Chem. 2025, 63, 387–393. [Google Scholar] [CrossRef] [Scilit]
- Dorst, K.M.; Widmalm, G. NMR Chemical Shift Prediction and Structural Elucidation of Linker-Containing Oligo- and Polysaccharides Using the Computer Program CASPER. Carbohydr. Res. 2023, 533, 108937. [Google Scholar] [CrossRef] [Scilit]
- Frampton, C.S.; MacNicol, D.D. Structure of Equilenin at 100 K: An Estrone-Related Steroid. Acta Crystallogr. E Crystallogr. Commun. 2017, 73, 1223–1226. [Google Scholar] [CrossRef] [Scilit]
Disclaimer/Publisher’s Note: The statements, opinions and data contained in all publications are solely those of the individual author(s) and contributor(s) and not of MDPI and/or the editor(s). MDPI and/or the editor(s) disclaim responsibility for any injury to people or property resulting from any ideas, methods, instructions or products referred to in the content. |
© 2026 by the authors. Licensee MDPI, Basel, Switzerland. This article is an open access article distributed under the terms and conditions of the Creative Commons Attribution (CC BY) license.