


Abstract
Accurate picking-point localization and pose estimation are essential for selective robotic harvesting of marigolds, yet side-view imaging suffers from slender pedicel morphology, frequent occlusions, and weak visual contrast at the corolla–pedicel junction. This study aims to deliver a reliable perception framework that outputs both the 3D picking-point coordinates and the corresponding grasping pose angle for each harvestable flower. To achieve this, we propose an RGB-D based pipeline that integrates depth-assisted foreground extraction, a lightweight instance segmentation model, a dual-strategy corolla–pedicel association module, and geometric pose estimation. To improve pedicel segmentation under weak-boundary and occlusion conditions, an enhanced lightweight model, HSN-YOLOv8n-seg, was developed by incorporating Haar wavelet downsampling to preserve fine-grained texture features, Spatial Group-wise Enhancement to strengthen responses in ambiguous regions, and a lightweight segmentation head to improve mask boundary delineation. The model achieved a Precision of 78.53% and an mAP50 (mean Average Precision at IoU threshold 0.5) of 75.43%, with only 3.17 M parameters and an inference time of 9.42 ms, outperforming representative lightweight segmentation models such as YOLOv9t and YOLOv11n. The framework computes the pedicel centroid as the candidate picking point and pairs it with the corresponding corolla centroid via distance priority matching and cross-line verification; the axis connecting the paired centroids defines the picking pose. Outdoor experiments showed that the largest group-wise mean localization error was 0.0095 m (individual sample maximum: 0.0107 m), and the largest group-wise mean pose angle error was 5.11° (individual sample maximum: 14.14°). Overall, the framework consistently maintains reliable perception under occlusion and indistinct corolla–pedicel boundaries, demonstrating its potential for automated marigold harvesting. Nevertheless, further validation under diverse and complex field backgrounds is necessary before practical deployment.
1. Introduction
Marigold (Tagetes erecta L.) is an annual herb in the Asteraceae family, producing solitary capitula and valued for its high lutein content. As a result, it has important medicinal and economic value and is widely used in food, nutraceutical, and health-product industries [1]. At present, harvesting still relies entirely on manual labor, making the process labor-intensive, slow, and costly. This limitation is rooted in the asynchronous flowering habit of marigold, which requires selective picking of mature flowers. By contrast, conventional mechanized harvesting based on non-selective brushing cannot satisfy the precision demanded by such operations. Although agricultural robotics is advancing, the large and heavy corollas of marigold make grasping orientation critical. Grasps that are not perpendicular to the pedicel axis can easily lead to harvesting failure. Therefore, accurate localization of the picking point and reliable pose estimation remain central challenges for intelligent marigold harvesting [2,3].
To overcome the limitations of traditional flower recognition methods, recent studies have increasingly adopted deep learning techniques. Early studies on flower recognition mainly relied on two-stage detectors represented by Faster R-CNN [4,5]. Despite their strong detection performance, two-stage detectors are often constrained by substantial parameter sizes and limited inference efficiency, which reduces their suitability for real-time harvesting applications. As a result, single-stage detectors, especially those in the YOLO family, have attracted considerable attention for flower detection tasks. Bai et al. [6] enhanced YOLOv7 by introducing a Swin Transformer-based prediction head, thereby improving the detection of small targets, color-similar objects, and overlapping or occluded strawberry seedling flowers and fruits. Qi et al. [7] proposed TC-YOLO for tea chrysanthemum detection and achieved an average precision of 92.49% on a self-constructed dataset under complex illumination and occlusion conditions. Fan et al. [8] developed a lightweight improved YOLOv7 model for marigold corolla detection, obtaining an accuracy of 93.9% and an mAP@0.5 of 97.7%. Meanwhile, model compression techniques, including pruning and knowledge distillation, were also applied to lightweight YOLO-series architectures for flower recognition, demonstrating their effectiveness in reducing model complexity while preserving detection performance [9,10]. Flower recognition technologies have also been extended to related applications, such as flower counting and density estimation [11], pollination [12], and flower thinning [13]. However, existing studies have primarily focused on flower identification and detection.
In recent years, increasing research attention has been devoted to the localization of flower picking points. Existing methods can be broadly categorized into top-view and side-view approaches. Top-view methods generally approximate a flower as a two-dimensional circular projection and indirectly infer the picking height through center-point estimation [14,15]. For example, Nasr et al. [16] employed YOLOv4 to detect mature chamomile flowers in images, mapped the detected pixels to 3D robot-base coordinates, and guided the end-effector to a point 10 mm above the stem for harvesting. Wang et al. [17] used a ZED 2 stereo camera and YOLOv4-Tiny to identify flower centers as candidate picking points. Amer et al. [18] developed an automatic jasmine harvesting system using YOLOv5 and an Intel RealSense D435 depth camera, where flower-center pixels were fused with point-cloud data to estimate 3D positions for nondestructive picking. In top-view strategies, the camera’s optical axis runs nearly parallel to stem growth, limiting direct visualization of the corolla–stem junction. Picking coordinates are therefore commonly inferred from empirical regressions based on corolla dimensions. However, these predictions can become inaccurate with stem inclination or canopy occlusion, increasing the risk of corolla damage and unsuccessful harvesting.
Side-view methods, by contrast, capture the axial profile of the stem, thereby providing a more geometrically intuitive data basis for accurate localization [19]. For the harvesting-point localization in safflower automatic picking, deep learning-based detection [20] and segmentation models [21] were employed to identify and segment safflower stigmas and capitula. By integrating the morphological characteristics of safflower with spatial constraints, the harvesting point was accurately localized [22,23]. Additionally, for marigold picking-point localization, Torre et al. [24] integrated 2D object detection and segmentation with PCA-based pose estimation, and further established a linear regression model between corolla diameter and picking height to infer the optimal harvesting point from side-view 3D point-cloud data. Ma et al. [25] proposed a marigold segmentation approach based on SCS-YOLO-Seg, incorporating a StarNet backbone, a C2f-Star module for model compression, and a dual-path segmentation head with morphological post-processing to localize the picking point. Nevertheless, important limitations remain in existing studies. Most available datasets were collected under smartphone-based imaging conditions, which differ substantially from practical field scenarios using RGB-D cameras mounted on agricultural machinery. Inaccurate pose estimation may result in unsuitable picking directions, thereby increasing the likelihood of harvesting failure [26]. Accordingly, determining the picking position and pose in relation to marigold growth characteristics remains a critical challenge for future research.
Accurate image segmentation is crucial for distinguishing marigold corollas from pedicels, especially when their boundaries are poorly defined. It also supports subsequent pose estimation. In field environments, however, complex background structures often impair pedicel segmentation. Depth information acquired using an RGB-D camera can reduce such background interference [27]. Building on this advantage, this study presents a method for locating marigold picking points and estimating their poses. The main contributions are as follows:
(1) A dedicated marigold dataset was constructed after removing complex background information, and an HSN-YOLOv8n-seg segmentation model was developed. The proposed model integrates an HWD strategy to retain fine-grained features of pedicel targets, a Spatial Group-wise Enhancement (SGE) attention mechanism to improve edge discriminability, and a redesigned NewHead segmentation head to enhance pixel-level segmentation accuracy. These improvements effectively address incomplete segmentation caused by weak boundaries in side-view images.
(2) A marigold picking-point localization and attitude estimation algorithm based on pedicel centroids and geometric constraints is proposed. The algorithm combines distance priority matching with cross-line verification to resolve ambiguities in corolla–pedicel association under multi-object conditions. In addition, an auxiliary pose judgment line is constructed from the pedicel to the corolla, enabling accurate localization of marigold picking points and reliable attitude estimation.
2. Materials and Methods
2.1. Image Acquisition and Preprocessing
In this study, side-view images of marigold plants cultivated in Shache County, Xinjiang, China, were acquired using a Femto Mega RGB-D depth camera (Orbbec, Shenzhen, China), resulting in a total of 585 original images. The images were captured from 8:00 to 10:00 a.m. and 18:00 to 20:00 p.m. under natural lighting, with an average size of 1920 × 1080 pixels, and the background mainly consisted of soil and vegetation. The camera features an ToF sensor with a depth resolution of 1024 × 1024 (up to 15 fps) and a color resolution of 1920 × 1080 (up to 30 fps), a depth range of 0.25–5.46 m. To minimize background interference, depth-information-based distance thresholding was applied to remove non-target background regions, thereby generating background-free side-view images of marigold plants. To construct a high-quality dataset and improve sample diversity, data augmentation and sample expansion were subsequently performed on the background-removed images. Following these procedures, a raw marigold image dataset containing 1000 background-free images was established. To ensure standardization and consistency during annotation, the X-AnyLabeling annotation tool (available at https://github.com/CVHub520/X-AnyLabeling, accessed on 5 September 2026) was used to conduct polygon-based segmentation annotation for two target categories: the corolla (flower) and the pedicel (stem).
2.2. Marigold Picking-Point Localization and Attitude Estimation Method
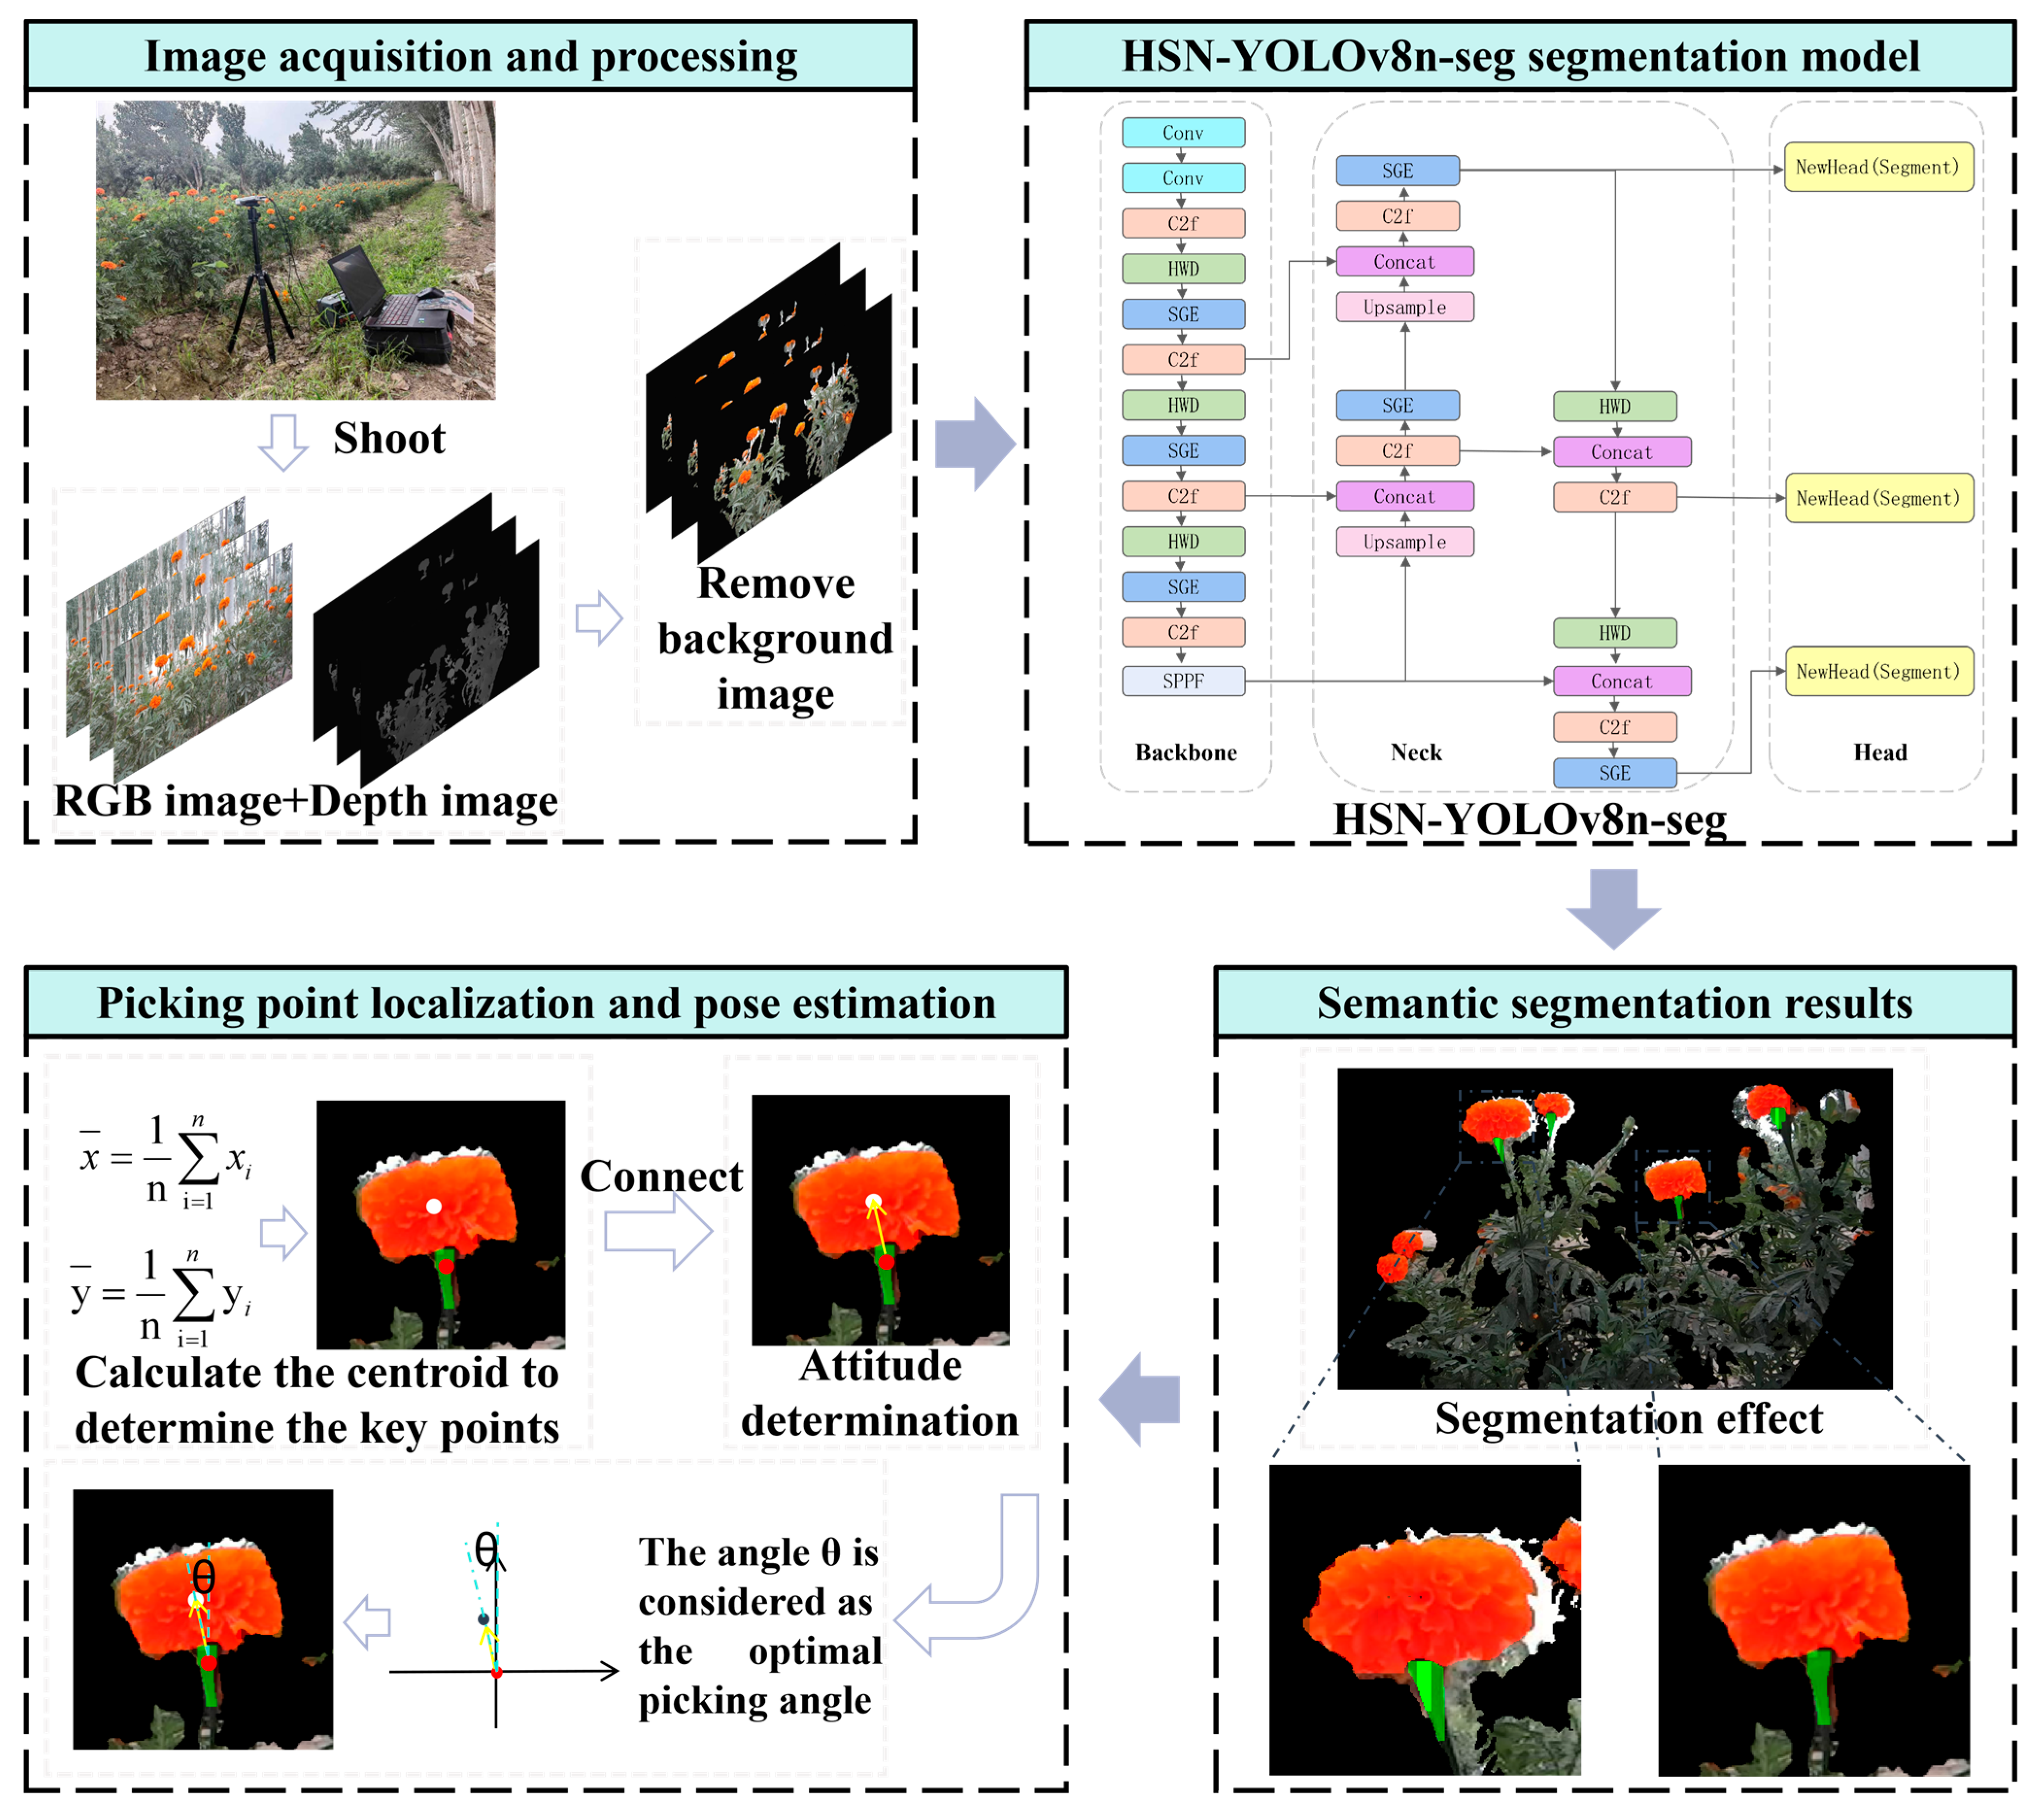
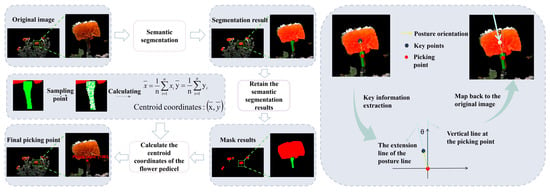
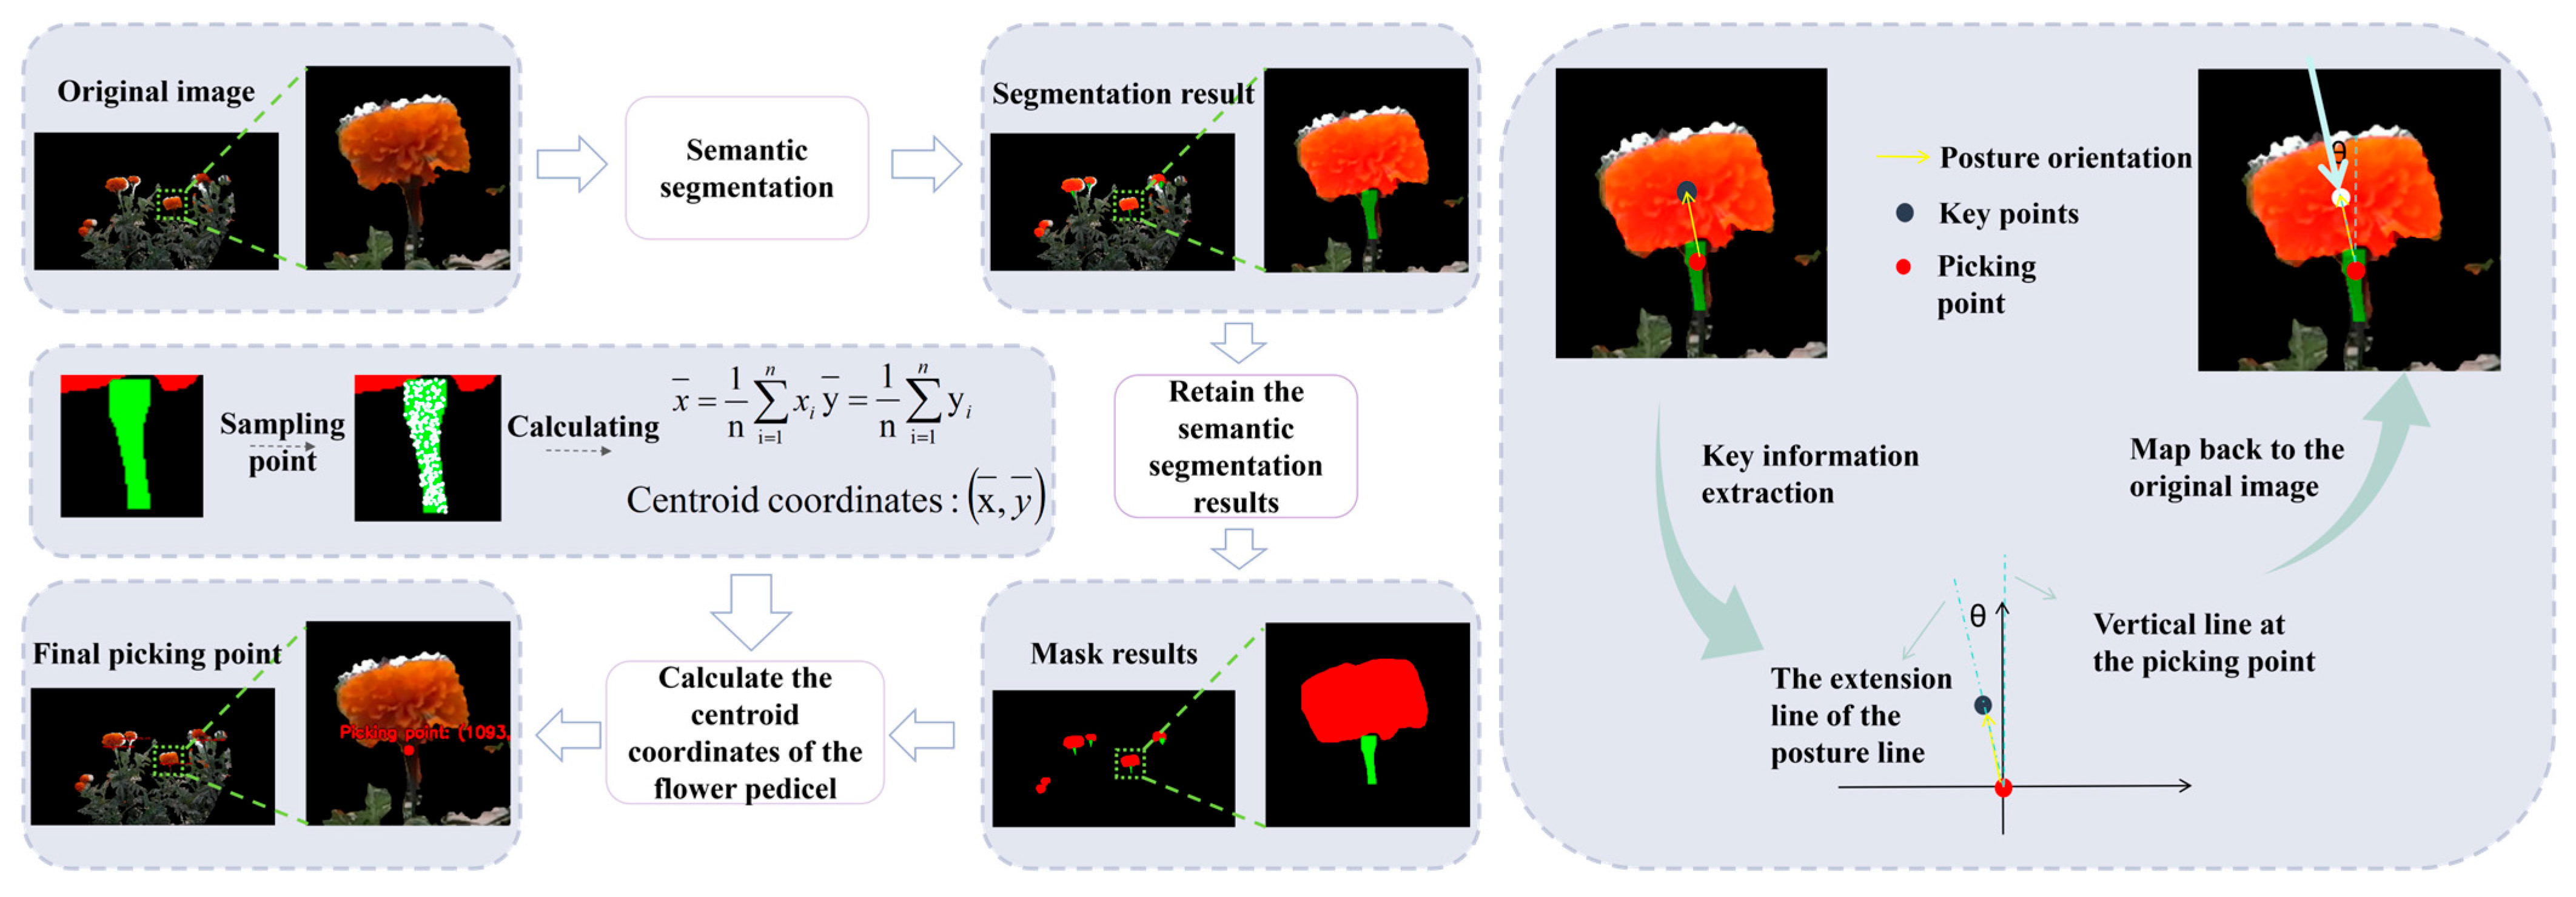
Using the constructed marigold dataset, this study enhanced YOLOv8n-seg and developed algorithms for picking-point localization and attitude estimation under field conditions. The objective was to accurately identify suitable marigold picking targets during field operations. To address the limited segmentation accuracy of the baseline model, three modifications were introduced: lightweight Haar wavelet downsampling (HWD), spatial group-wise enhancement (SGE), and a redesigned segmentation head, termed NewHead. These components were incorporated sequentially to reduce redundant representations while preserving the fine structures of slender pedicels and overlapping corollas. The enhanced network consequently achieved higher segmentation accuracy and improved overall performance. A picking-point localization strategy was then established based on the segmentation results. Specifically, the corolla and pedicel masks were first extracted from the segmentation results. The centroid coordinates of the pedicel masks were then calculated and used as the localized picking points. Subsequently, a matching algorithm is applied to establish the correspondence between each corolla and its associated pedicel. A pose reference line is constructed by connecting the centroids of the matched corolla and pedicel, from which the optimal picking angle is determined. The proposed method provides reliable positional and orientation information for downstream picking actuators, thereby improving the operational accuracy of mechanized marigold harvesting in field environments. The overall workflow is illustrated in Figure 1.
Figure 1.
Process of marigold picking-point localization and attitude estimation.
2.3. Improvement in the YOLOv8n-seg Model
2.3.1. YOLOv8n-seg Model
Compared with conventional two-stage segmentation frameworks, YOLOv8n-seg employs an end-to-end inference paradigm, which simplifies the overall processing pipeline and substantially improves real-time performance, thereby enabling efficient multi-class instance segmentation. As a lightweight real-time instance segmentation model released by Ultralytics within the YOLOv8 family, YOLOv8n-seg integrates a dedicated segmentation head into the YOLOv8n detection backbone, allowing object detection and pixel-level instance mask prediction to be performed simultaneously. In the backbone, the C2f module is adopted to enhance gradient flow and improve feature propagation. In the neck, the PAN-FPN multi-scale feature fusion architecture effectively integrates low-level spatial details with high-level semantic representations, thereby strengthening feature discrimination for small targets, occluded objects, and instances with complex boundaries. Overall, YOLOv8n-seg is characterized by a compact parameter scale, low computational complexity, and high inference speed, making it particularly suitable for deployment in resource-constrained field operation scenarios.
2.3.2. HSN-YOLOv8n-seg Semantic Segmentation Model
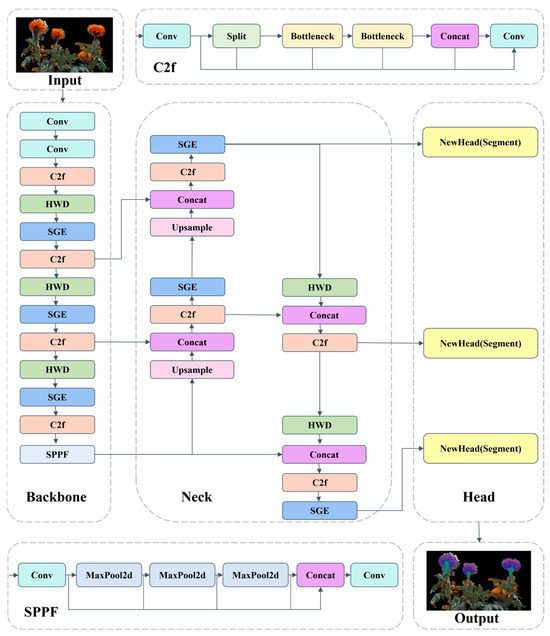
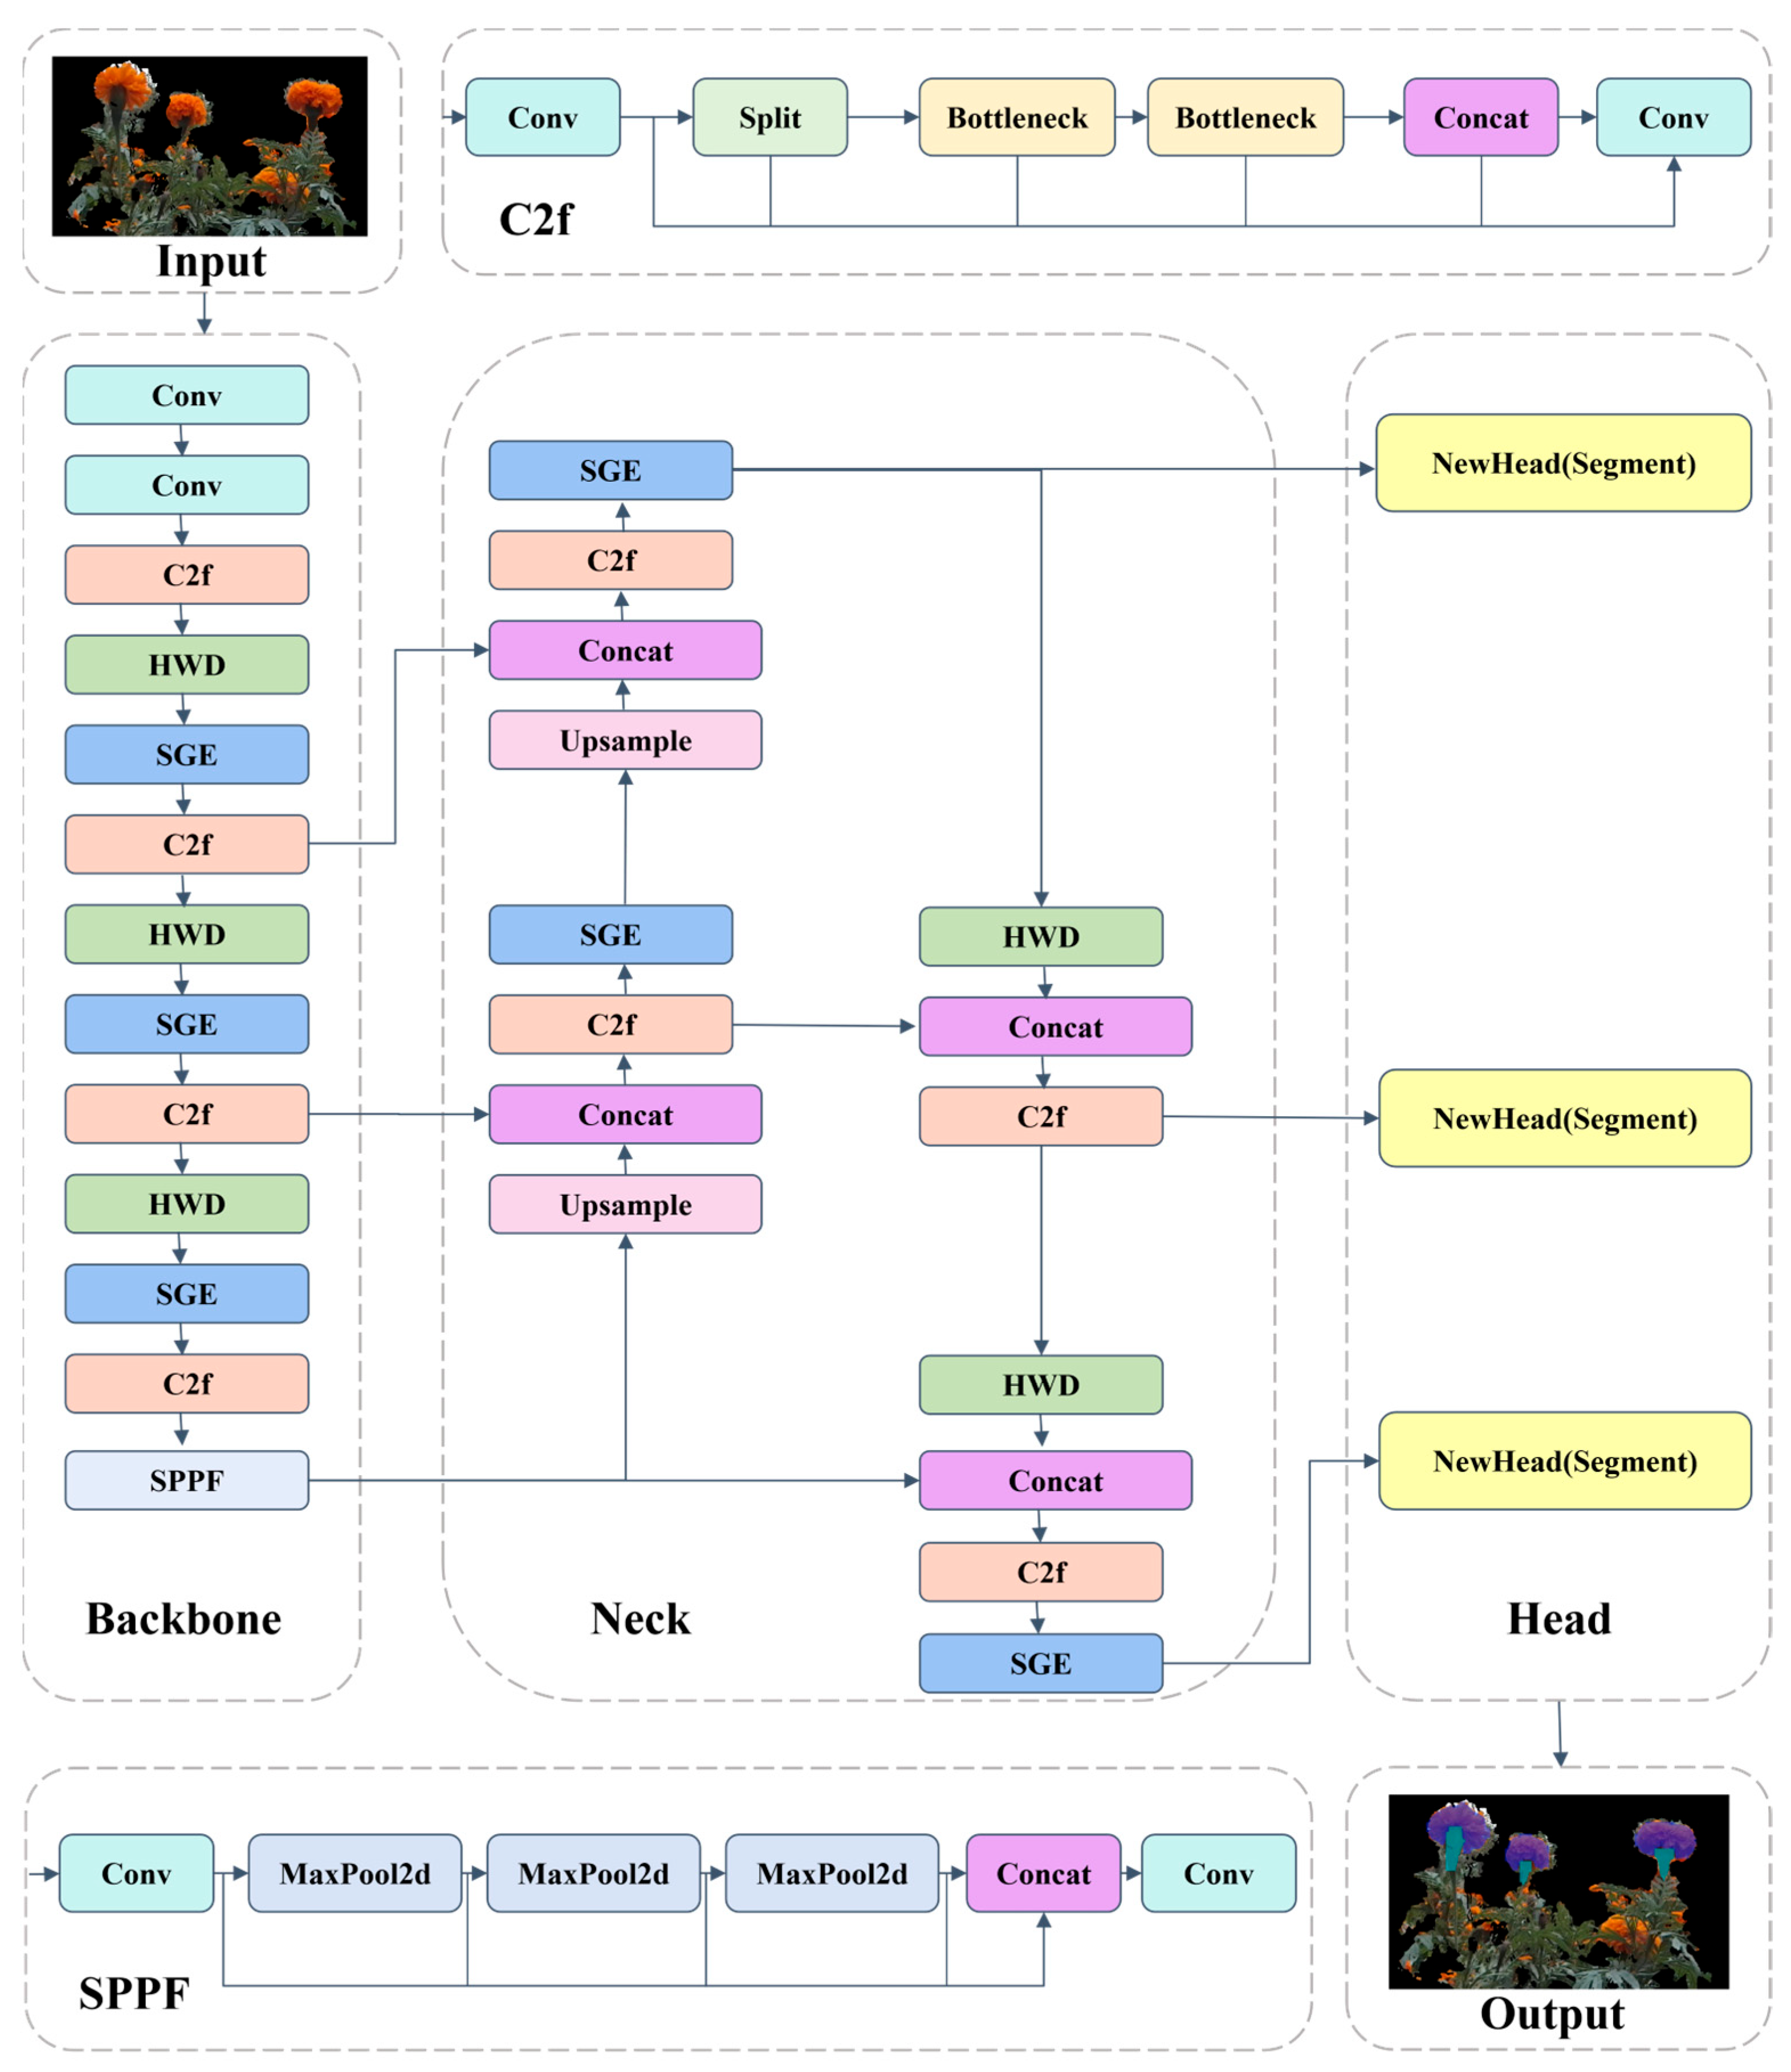
This study addressed the limited segmentation performance of YOLOv8n in side-view, multi-plant, and visually complex marigold scenes, which reduced picking-point localization accuracy, by incorporating three optimization modules into YOLOv8n-seg. First, the lightweight HWD convolutions replaced conventional convolutions, enhanced target saliency, and suppressed responses to irrelevant background regions. Second, the spatial Group-wise Enhancement (SGE) attention was incorporated to reinforce responses around the pedicel and corolla, improving detection and segmentation under occlusion. Third, a dedicated segmentation head, termed NewHead, was employed to refine the segmentation branch and achieve more accurate boundary delineation. Collectively, these modifications improved segmentation accuracy and provided a reliable basis for subsequent picking-point localization and attitude estimation. Figure 2 presents the architecture of the resulting HSN-YOLOv8n-seg model.
Figure 2.
Architecture of HSN-YOLOv8n-seg model.
2.3.3. HWD Module
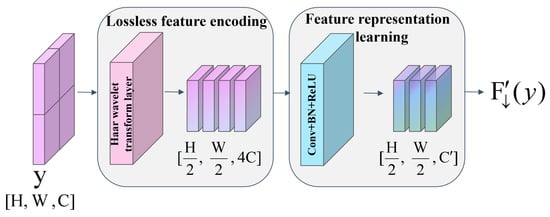
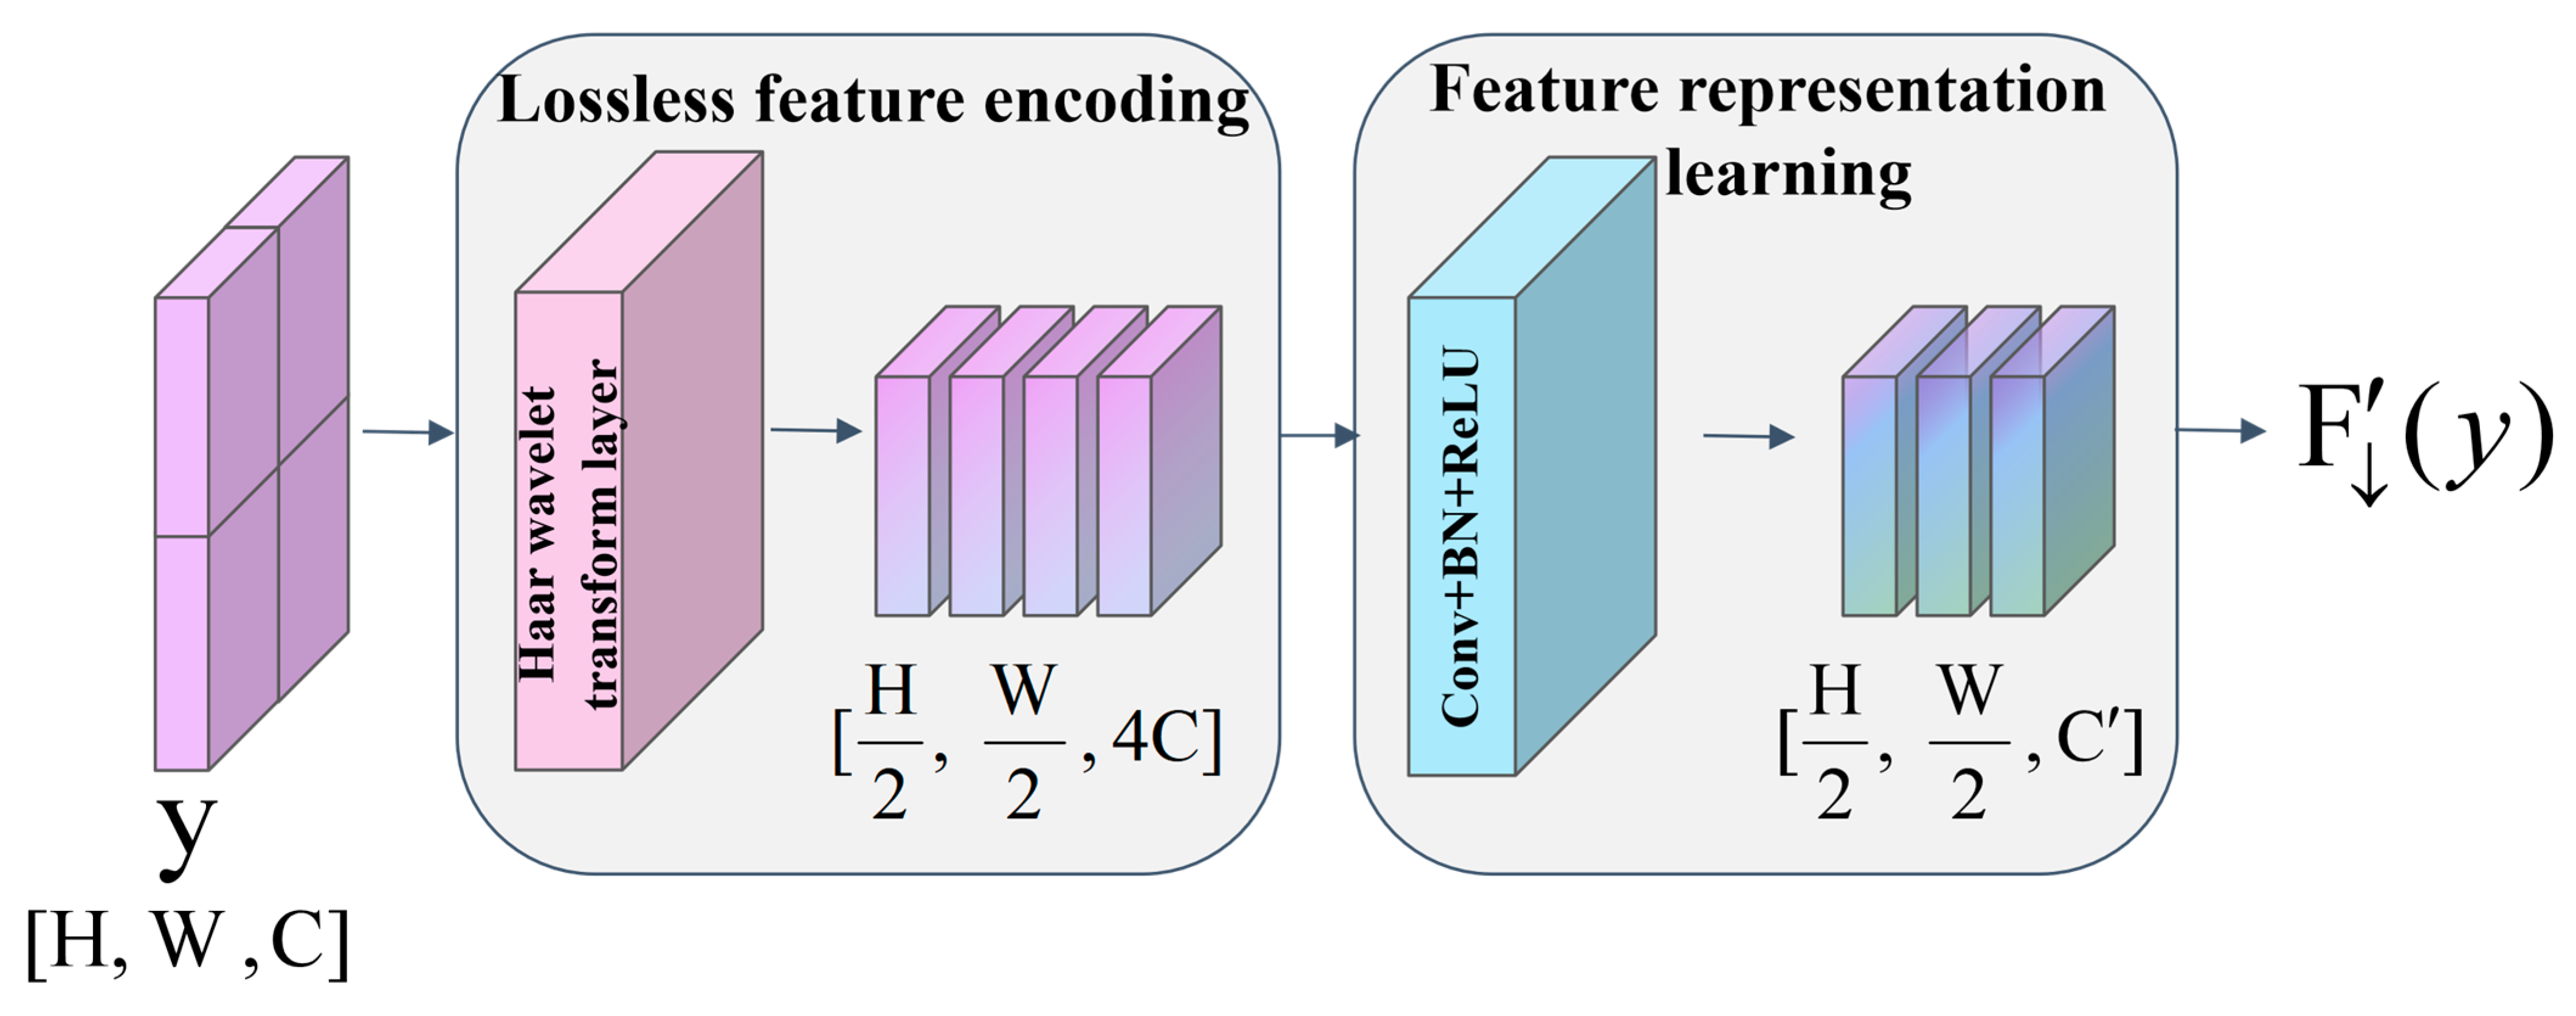
In the original YOLOv8n, spatial resolution decreases mainly through conventional convolutions and max-pooling. Although effective for feature-map compression, these operations can discard fine structural cues, especially those associated with slender pedicels and densely clustered corolla regions in marigolds. This information loss may weaken boundary characterization and produce less clearly defined segmentation contours. To mitigate this limitation, an HWD module is incorporated into the network. By reducing spatial dimensions while preserving informative responses, HWD retains discriminative details and improves target contour delineation. Consequently, it provides a more reliable basis for precise flower segmentation. The detailed structure of the module is illustrated in Figure 3. In the HWD module [28], the lossless feature encoding block first passes through input feature map y with dimensions [H, W, C] through a Haar wavelet downsampling layer to obtain features of dimensions [H/2, W/2, 4C], generating four sub-band features from the base feature map. Subsequently, in the feature representation learning block, a convolutional layer (Conv) is employed to extract local spatial features, a batch normalization layer (BN) stabilizes the training process and accelerates convergence, and a ReLU activation function introduces non-linear mapping capability. These three components are serially connected to form a standard convolution unit, which performs non-linear transformation and channel dimension adjustment on the fused features, ultimately outputting a feature map with dimensions [H/2, W/2, C’], thereby preserving more edge features, texture features, and detailed information. The HWD module significantly reduces the model’s computational cost, enhances target feature extraction capability, and improves model robustness in complex field environments, thus effectively improving the coherent segmentation of pedicels and the complete extraction of corollas.
Figure 3.
Architecture of HWD module.
2.3.4. SGE Attention Mechanism Module
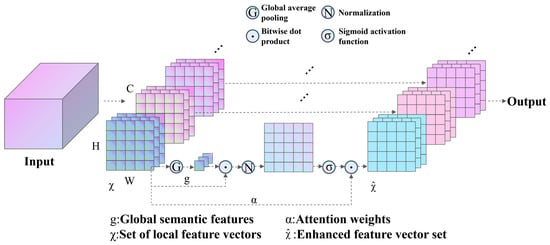
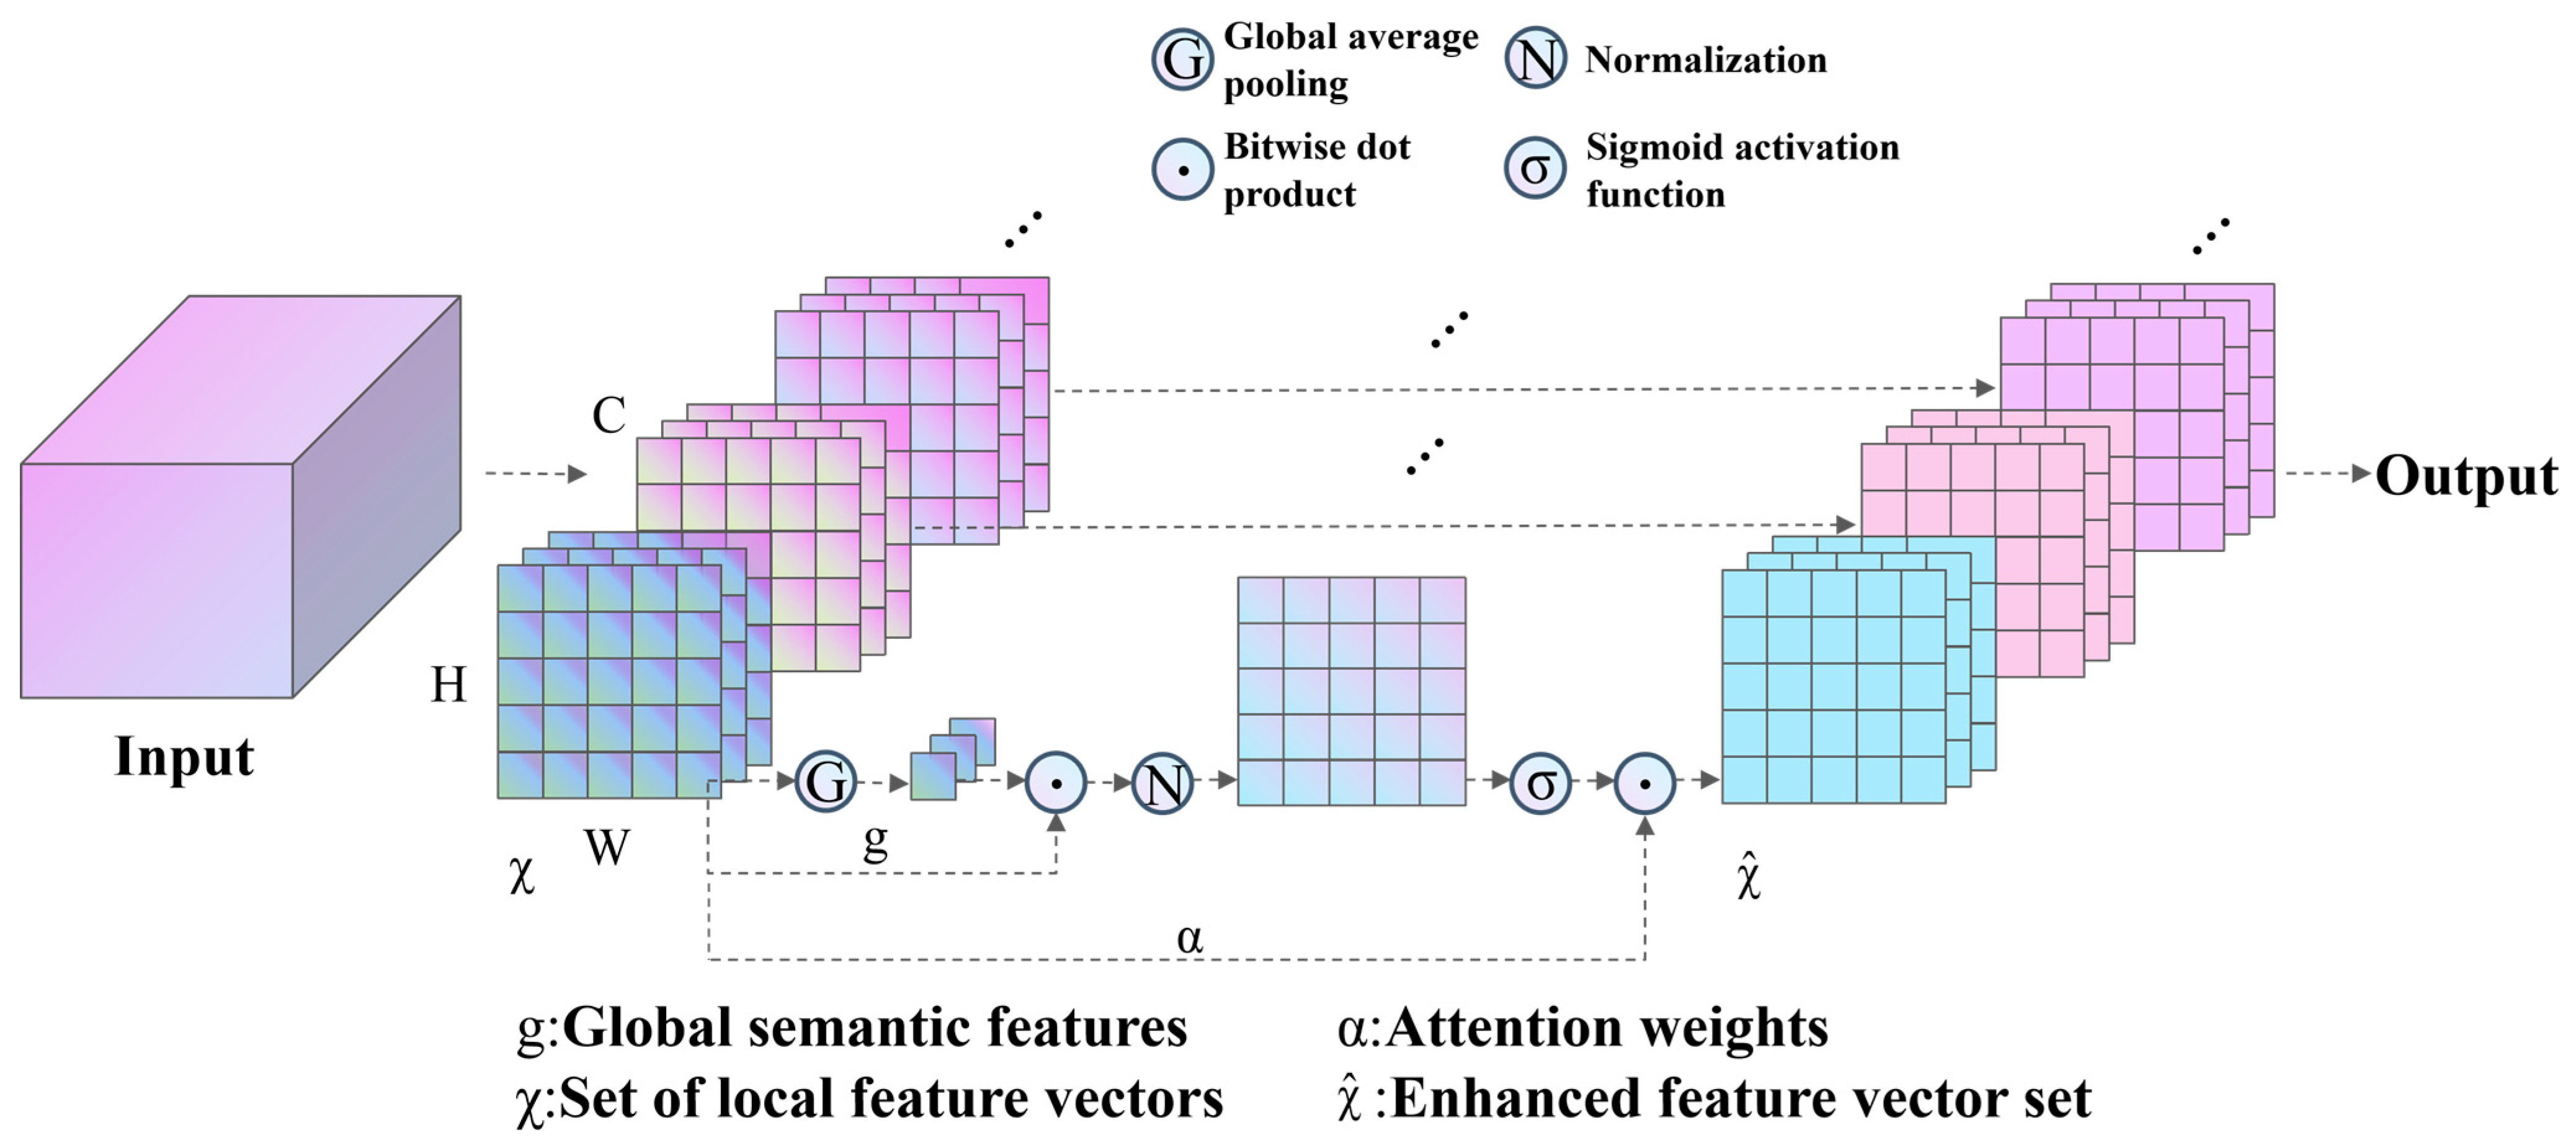
In side-view marigold images, overlapping plants, cluttered backgrounds, and slender pedicels hinder target recognition, resulting in incomplete corolla segmentation, missed pedicels, and uncertain object boundaries. Moreover, because the baseline YOLOv8n model lacks dedicated mechanisms for enhancing spatial and channel-wise features, its robustness against background interference is insufficient. Therefore, the Spatial Group-wise Enhancement (SGE) attention module was embedded into the backbone network to improve feature discrimination [29]. By recalibrating spatial responses within feature groups, the SGE module strengthens the representation of occluded and fine-scale targets, improves segmentation continuity and boundary integrity, and suppresses interference from weeds, branches, and leaves. Consequently, the proposed design enhances the robustness of the model under complex field conditions. The structure of the SGE module is illustrated in Figure 4. The SGE module first divides the input feature map [H, W, C] along the channel dimension into several sub-group features, with each group’s local feature vector set denoted as . Subsequently, global average pooling (G) is applied to each group of local features to obtain the global semantic feature g, which is then combined with the local features via dot-product operation to generate an initial response. After normalization (N), a Sigmoid activation function ( ) is applied to produce the attention weight . Finally, is element-wise multiplied with the original local features to output the enhanced feature vector set , which is then concatenated along the channel dimension to obtain the final Output, thereby reducing the influence of background noise while improving model accuracy.
Figure 4.
Architecture of SGE attention mechanism module.
2.3.5. NewHead Segmentation Head Module
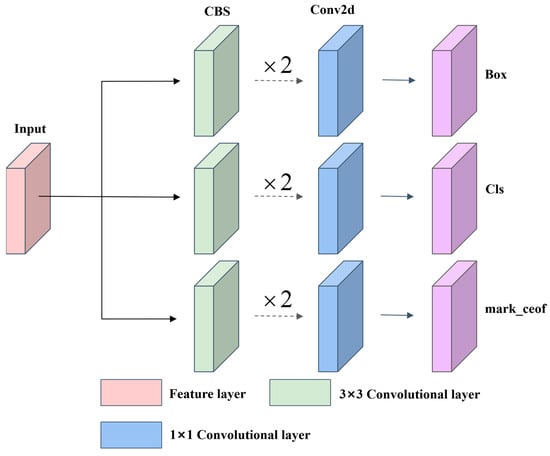
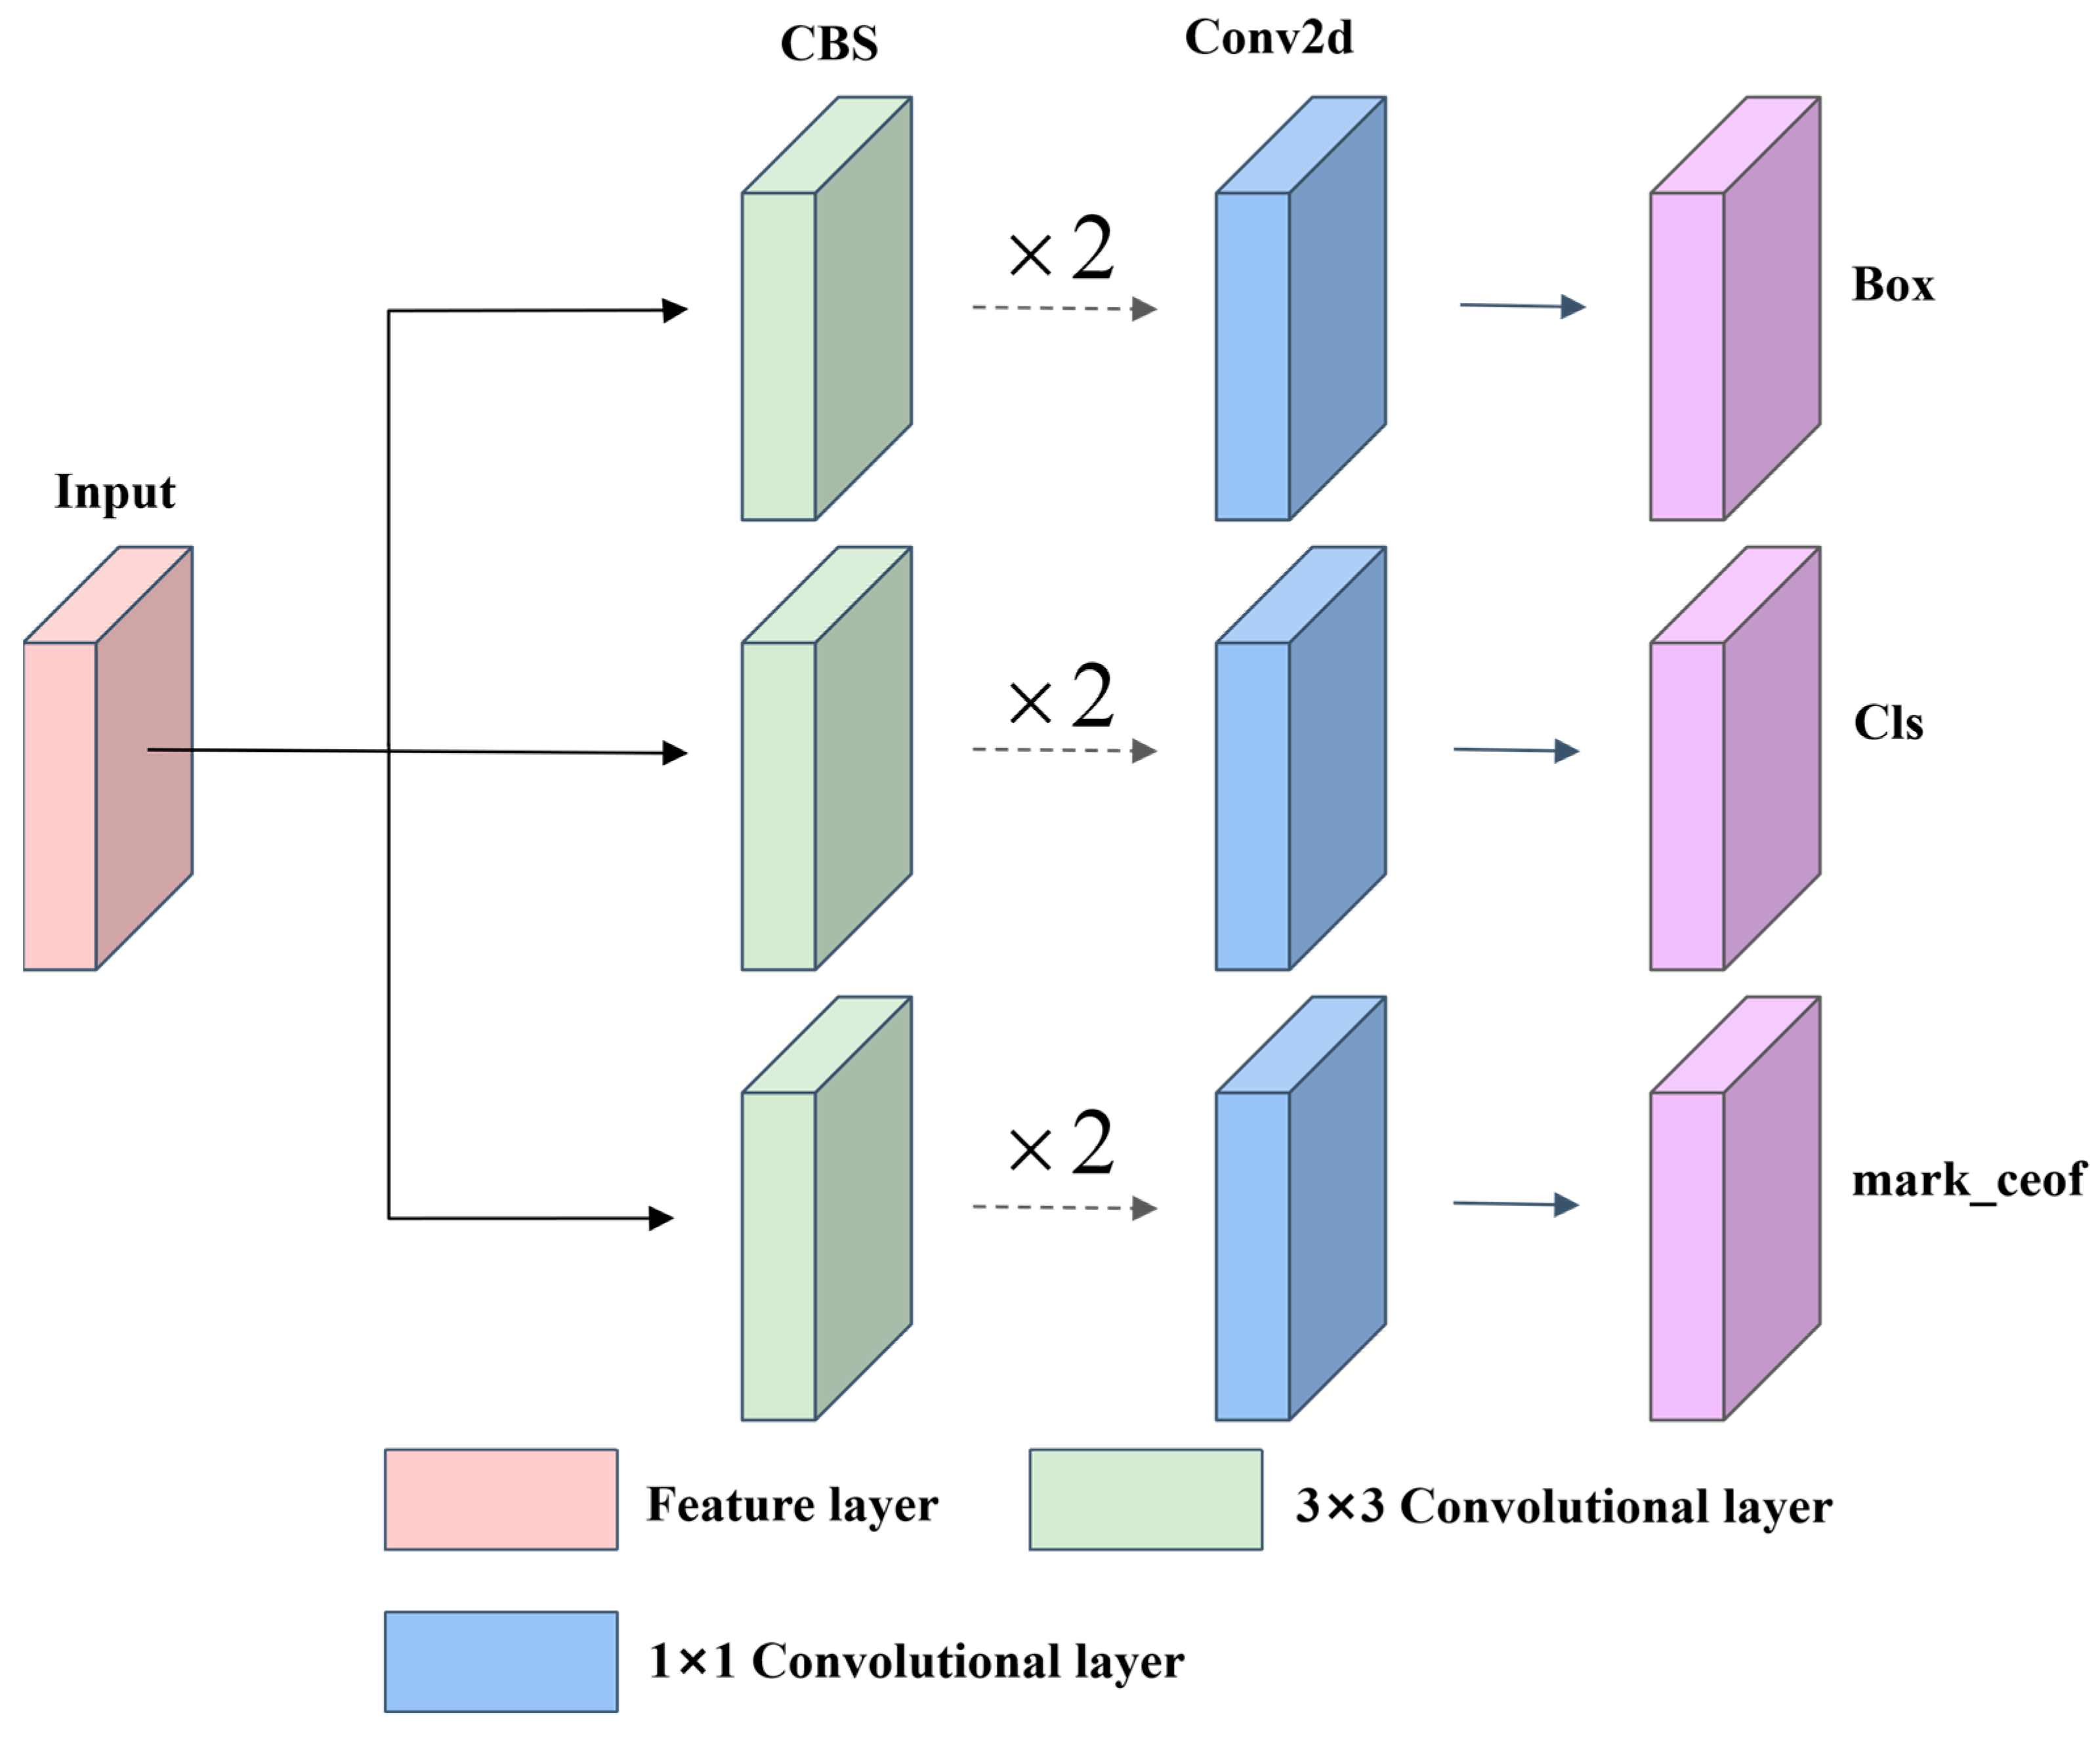
In marigold semantic segmentation, the segmentation head maps high-level features extracted by the backbone network into pixel-level masks. Therefore, its architectural design and feature dimensionality directly influence the completeness of segmentation boundaries between corollas and pedicels. The baseline YOLOv8n-seg segmentation head adopts relatively low-dimensional mask prototypes and mask coefficients to maintain a lightweight structure [30]. However, under complex field conditions, such as interwoven plants, slender and curved pedicels, and overlapping or occluded corollas, this compact design may lead to incomplete masks and blurred boundaries, thereby limiting the accuracy of picking-point localization. To address these limitations, this study proposes a NewHead optimized segmentation head. The proposed design preserves the original decoupled detection and segmentation architecture, feature fusion pathways, and loss functions, while specifically increasing the dimensionality of mask-related features within the segmentation head. In particular, the mask coefficient dimension was doubled to strengthen feature representation and improve the discriminative capacity of the mask branch. The structure of NewHead is shown in Figure 5. Specifically, NewHead receives multi-scale feature maps from the backbone network and processes them through three parallel branches. Each branch consists of a 3 × 3 convolutional layer followed by a 1 × 1 convolutional layer, enabling local feature extraction and channel-wise dimensional adjustment. The three branches generate bounding-box predictions, class predictions, and mask coefficient predictions, respectively. By expanding the mask coefficient dimension while retaining the original detection–segmentation decoupling strategy, feature fusion scheme, and training objectives, NewHead enhances the representation of fine structural details. This improvement is particularly beneficial for distinguishing corolla–pedicel boundaries in cluttered field environments, thereby improving segmentation accuracy and providing more reliable support for precise picking-point localization.
Figure 5.
Architecture of NewHead segmentation head module.
2.4. Marigold Picking-Point Localization and Attitude Estimation
Picking-point localization and attitude estimation are critical for reliable robotic marigold harvesting. In this study, harvestable targets are first screened according to depth-derived distance constraints, and an effective operating distance range is defined using a depth camera, thereby reducing unnecessary computation outside the reachable workspace. To mitigate corolla–pedicel mismatching caused by the interweaving growth of marigold plants under field conditions, a three-stage matching strategy was developed to establish a one-to-one correspondence between corollas and pedicels in accordance with their natural morphological relationships. Specifically, an initial pairing is generated using the centroids of the segmented masks and their Euclidean distances. Cross-line detection is then introduced to verify and rectify the preliminary matching results, improving association accuracy in cluttered and overlapping scenes. The workflow for marigold picking-point localization is illustrated in Figure 6. Based on the semantic segmentation model, the original images are decomposed at the pixel level into corolla and pedicel regions, represented by red corolla masks and green pedicel masks, respectively. Dense sampling is subsequently performed within the pedicel mask regions, and the geometric center of each pedicel is calculated using the centroid formula. The resulting centroid coordinates are defined as the picking-point positions. Finally, these coordinates are mapped back onto the original images, where the picking points are indicated by red dots and their corresponding pixel coordinates are output.
Figure 6.
Flowchart of marigold attitude estimation.
At the same time, to estimate the picking pose of marigolds in 3D space, an auxiliary guidance line is constructed from the pedicel to the corolla and used as the pose reference, as shown in Figure 6. After accurate corolla–pedicel matching, the corolla centroid is extracted as a key point from the segmented corolla mask and marked as a black dot. Together with the localized picking point, marked as a red dot, this key point is used to construct the pose line. Taking the vertical direction at the picking point as the reference, the angle θ between the extended pose line and the vertical direction is calculated as the pose angle, which represents the inclination of the pedicel relative to the vertical axis. Accordingly, the picking direction of the end-effector is aligned with the extension of the pose line and forms an angle θ with the vertical direction. The estimated pose information is then mapped back onto the original image, providing complete pose guidance for robotic arm grasping.
2.5. Experimental Setup and Model Evaluation
2.5.1. Experimental Environment Configuration
All experiments were conducted on the same computing platform to ensure reproducible results and a consistent computational environment. The platform comprised an Intel Xeon Platinum 8352V processor (Intel Corporation, Santa Clara, CA, USA), a 32 GB vGPU, and 80 GB of RAM. Python 3.8.10 supported the software environment, with PyTorch 1.11.0, CUDA 11.3, torchvision 0.12.0, and NumPy 1.22.4 as the principal dependencies. This configuration provided stable computational conditions for model training, inference validation, and subsequent visualization analyses.
2.5.2. Model Evaluation Metrics
The segmentation performance of marigold corollas and pedicels was evaluated using precision (P), recall (R), and mean average precision at an IoU threshold of 0.5 (mAP50). Precision represents the proportion of predicted positive pixels that corresponded to actual positive pixels; lower precision generally indicates more false positive segmentation. Recall measurs the proportion of ground-truth positive pixels that the model correctly identified; lower recall reflects more pronounced omission errors. The mAP50, averaged across the target classes at an IoU threshold of 0.5, providsd an overall assessment of segmentation accuracy for corollas and pedicels.
where TP is the number of true positive masks, FP is the number of false positive masks, FN is the number of false negative masks, and k is the number of labeled classes.
3. Results
3.1. Model Training
The model training hyperparameters were configured as follows. The number of training epochs was set to 300, and all input images were uniformly resized to 640 × 640 pixels. A batch size of 64 was adopted, with an initial learning rate of 0.01 decayed to 0.0001 using a piecewise schedule [31]. The weight decay coefficient was set to 0.0005 to mitigate overfitting.
During training, the model parameters were optimized by minimizing a composite loss function following the standard YOLOv8n-seg framework [32]. The total loss was formulated as Ltotal = Lbox + Lseg + Lcls + Ldfl employed the CIoU loss for bounding box regression [33], Lseg used binary cross-entropy with logits for mask supervision, and Lcls and Ldfl handled classification and localization refinement, respectively [32,34]. The loss decreased rapidly then plateaued, indicating convergence, and no obvious overfitting was observed.
3.2. Experimental Results
3.2.1. Ablation Experiment
To evaluate the contribution of the three proposed optimization modules, namely HWD, SGE, and NewHead, incremental ablation experiments were conducted by progressively integrating each module into the baseline. The models were compared in terms of Precision, Recall, mAP50, number of parameters, model size, and inference time, as summarized in Table 1. The baseline YOLOv8n-seg achieved a Precision of 75.40%, Recall of 76.34%, and mAP50 of 74.81%, with 3.26 M parameters and an inference time of 7.72 ms. Notably, the stem class exhibited significantly lower mAP50 (51.77%) compared with the flower class (97.86%), indicating that pedicel segmentation is the primary bottleneck. Introducing HWD (H-YOLOv8n) reduced the parameter count to 2.94 M and shortened the inference time to 5.43 ms, while slightly improving mAP50 to 75.03%. When SGE was further incorporated (HS-YOLOv8n), Precision increased to 78.18%, but Recall dropped to 72.72% and inference time significantly rose to 14.75 ms. Finally, integrating all three modules (HSN-YOLOv8n) achieved a balanced performance with Precision of 78.53%, Recall of 75.40%, and mAP50 of 75.43%, with 3.17 M parameters and an inference time of 9.42 ms. Notably, the stem mAP50 improved from 51.77% to 53.61%, confirming that NewHead effectively alleviates the segmentation difficulty for slender pedicels caused by SGE incorporation. Compared with the baseline, the proposed model increased Precision by 3.13 percentage points and mAP50 by 0.62 percentage points, while slightly reducing model size by 0.35 MB.
Table 1.
Comparison of ablation experiments results.
3.2.2. Comparative Analysis of Segmentation Performance
To assess the efficiency of HSN-YOLOv8n-seg in marigold segmentation, five lightweight YOLO models were selected as comparative baselines. These included YOLOv8n, YOLOv9t, YOLOv10n, YOLOv11n, and YOLOv12n. The comparison covered Precision, Recall, mAP50, parameter count, model size, and inference time, with the results summarized in Table 2. YOLOv9t had the fewest parameters among the compared models. However, its lower segmentation accuracy and longer inference time limited its practical value. YOLOv10n delivered relatively high Precision but suffered from a substantially lower Recall, reflecting an imbalance that increases missed detections and directly reduces harvest yield. YOLOv11n achieved a slightly higher mAP50 but exhibited a notably lower Precision, indicating a higher false positive rate that is undesirable for harvesting operations. YOLOv12n achieved an inference speed close to that of the baseline model, although its segmentation accuracy was lower. By comparison, HSN-YOLOv8n-seg achieved a Precision of 78.53% and an mAP50 of 75.43%. It contained only 3.17 M parameters, occupied 12.08 MB, and required 9.42 ms for inference. These results indicate that the proposed model improves segmentation accuracy while preserving a compact architecture and efficient inference. This balance provides a reliable basis for subsequent picking-point localization and attitude estimation.
Table 2.
Comparative experimental results of different models.
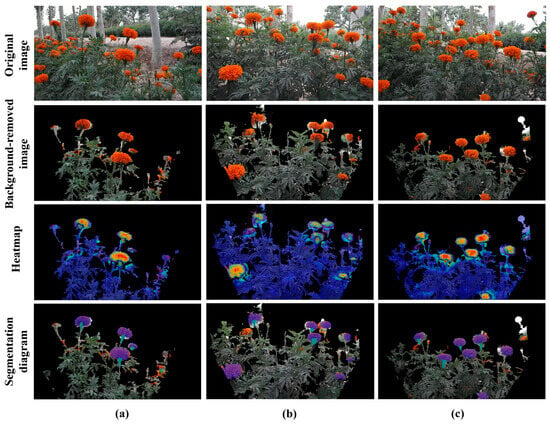
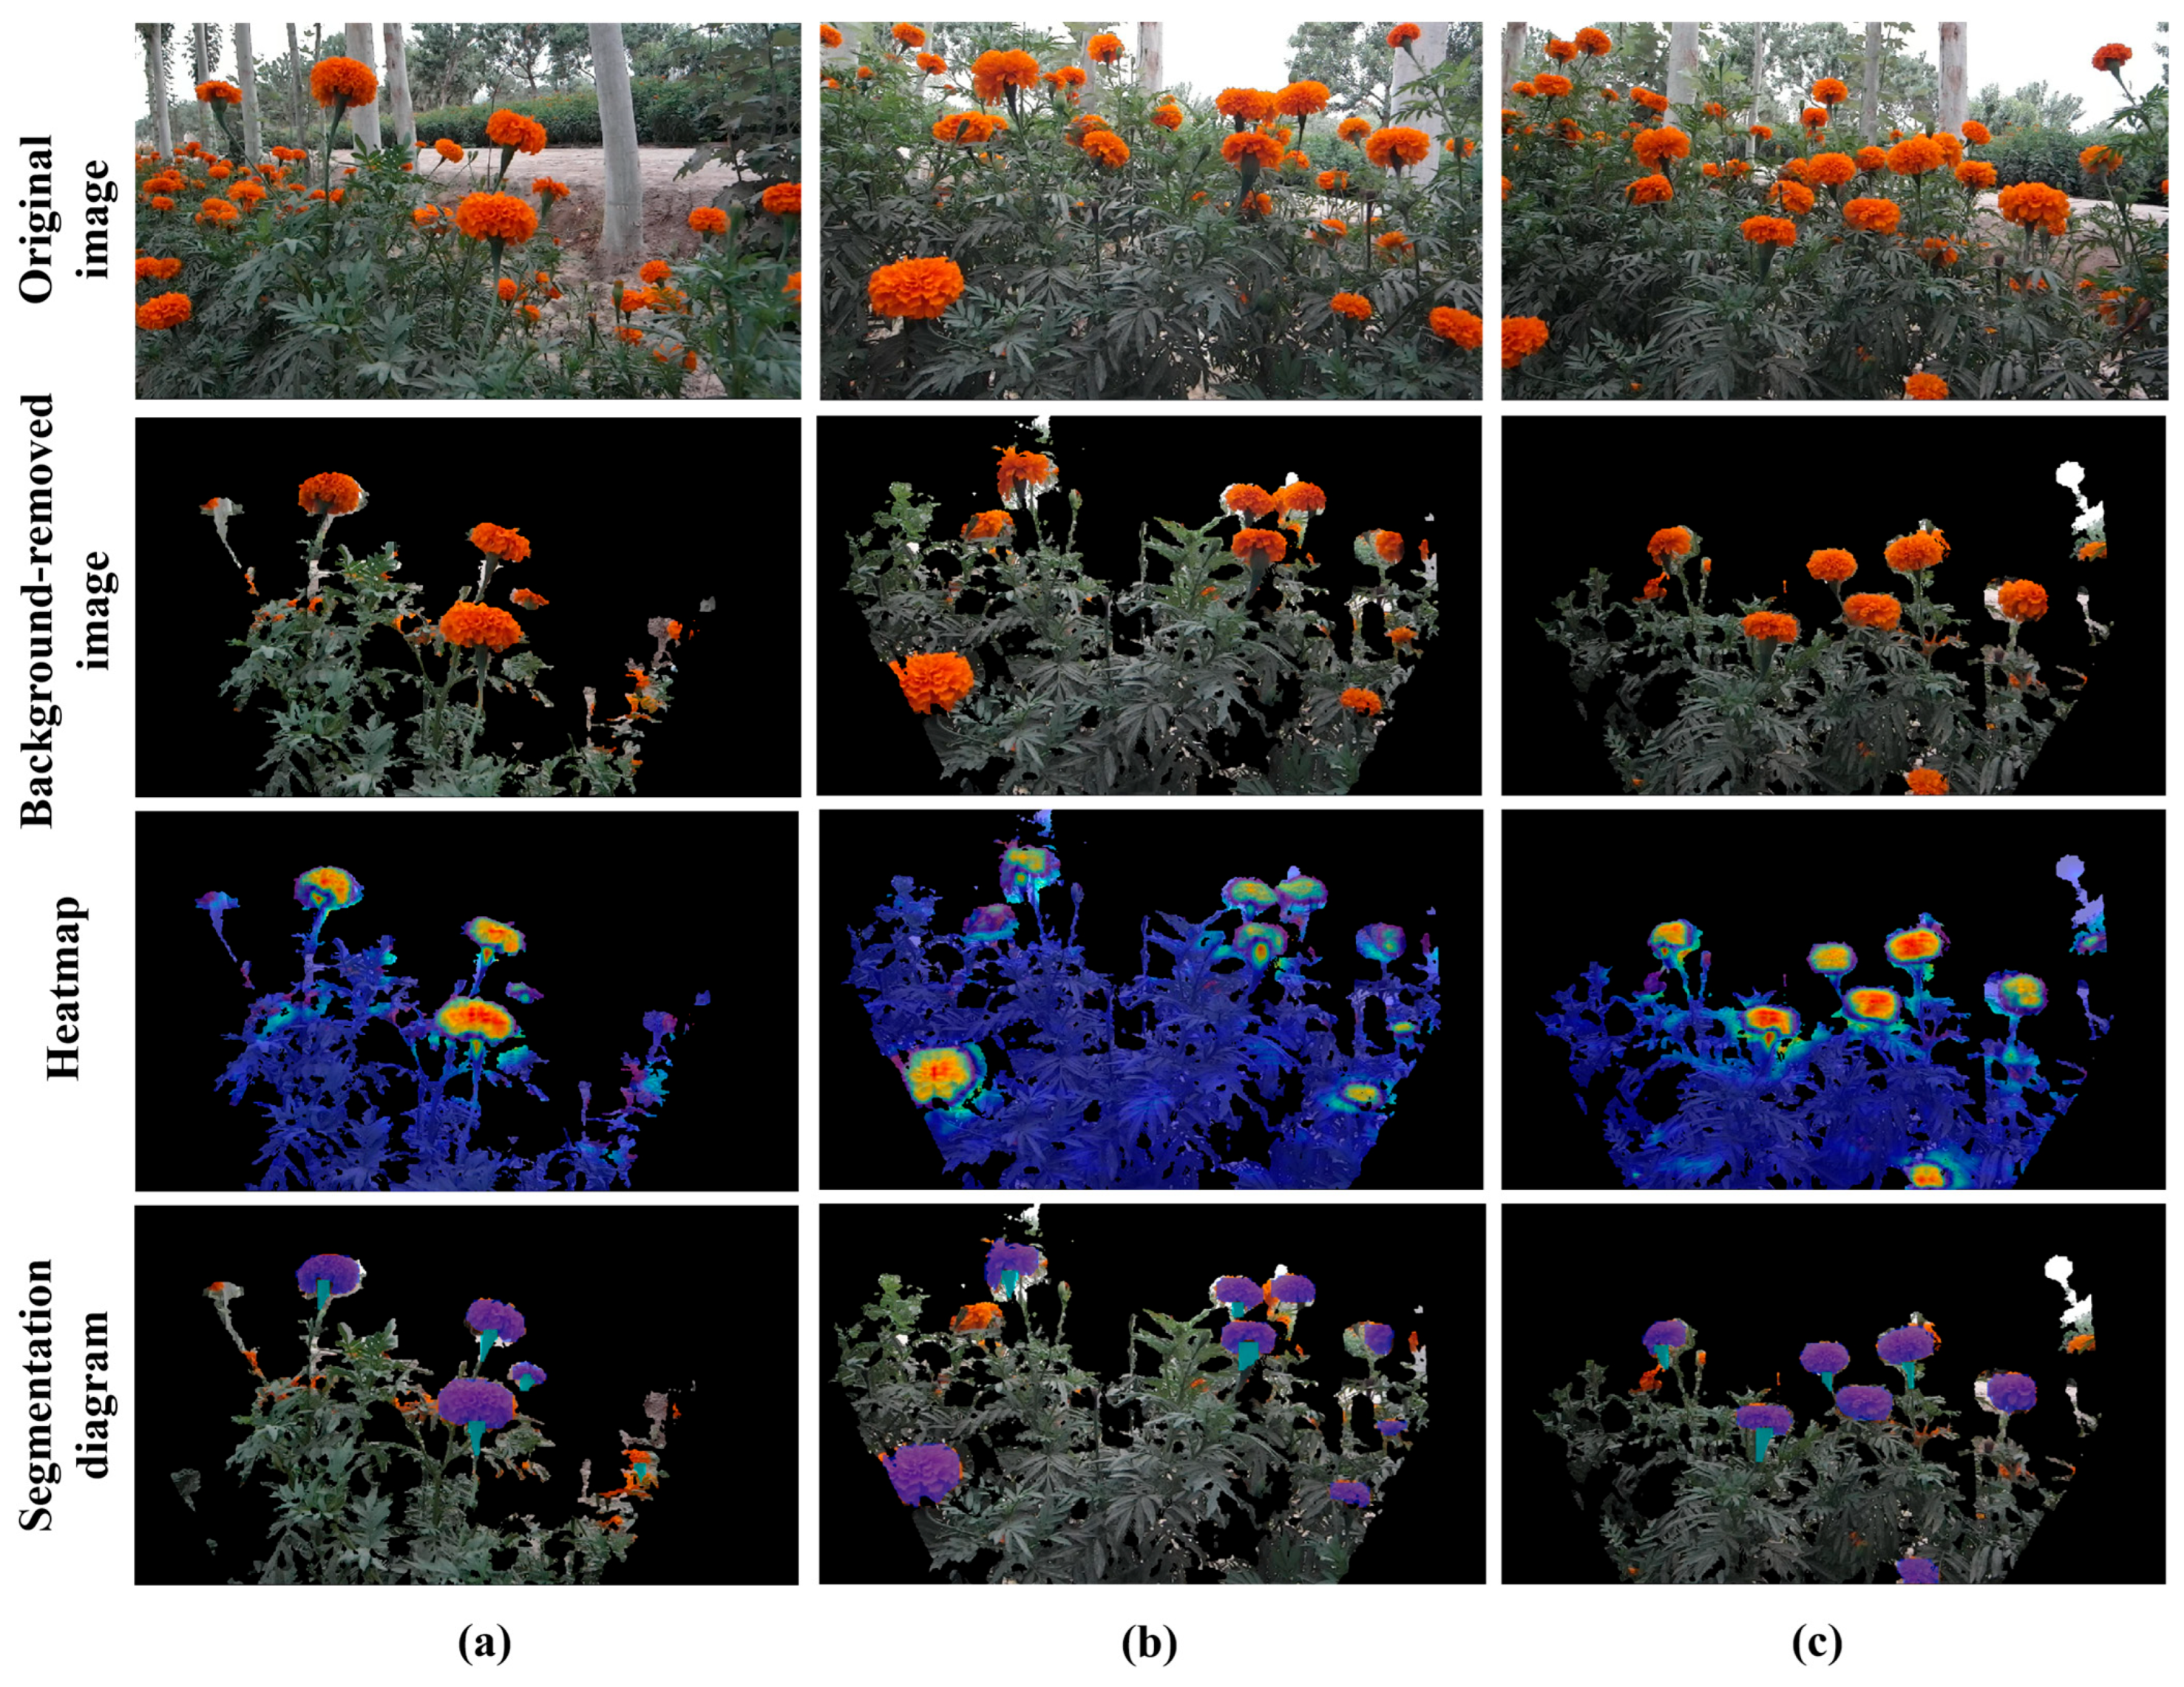
To assess the segmentation performance of HSN-YOLOv8n-seg under field conditions, we examined the prediction results and generated Grad-CAM heatmaps [35], as shown in Figure 7. Across different plant densities, the improved model produced stronger activations in the marigold corolla and pedicel regions. Conversely, responses to irrelevant objects and background areas were markedly weaker. This activation pattern indicates that the model can distinguish plant organs from surrounding interference in complex field environments. The heatmaps also displayed continuous and relatively complete responses along the segmented boundaries. These results provide visual evidence supporting the model’s segmentation performance.
Figure 7.
Heatmaps of marigold segmentation based on HSN-YOLOv8n-seg model: (a) low-density scenario; (b) medium-density scenario; (c) high-density scenario.
3.3. Picking-Point Localization and Attitude Estimation
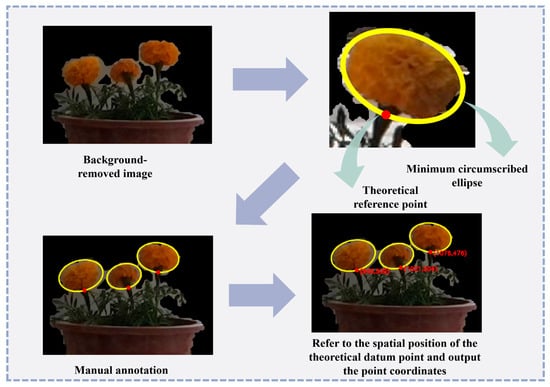
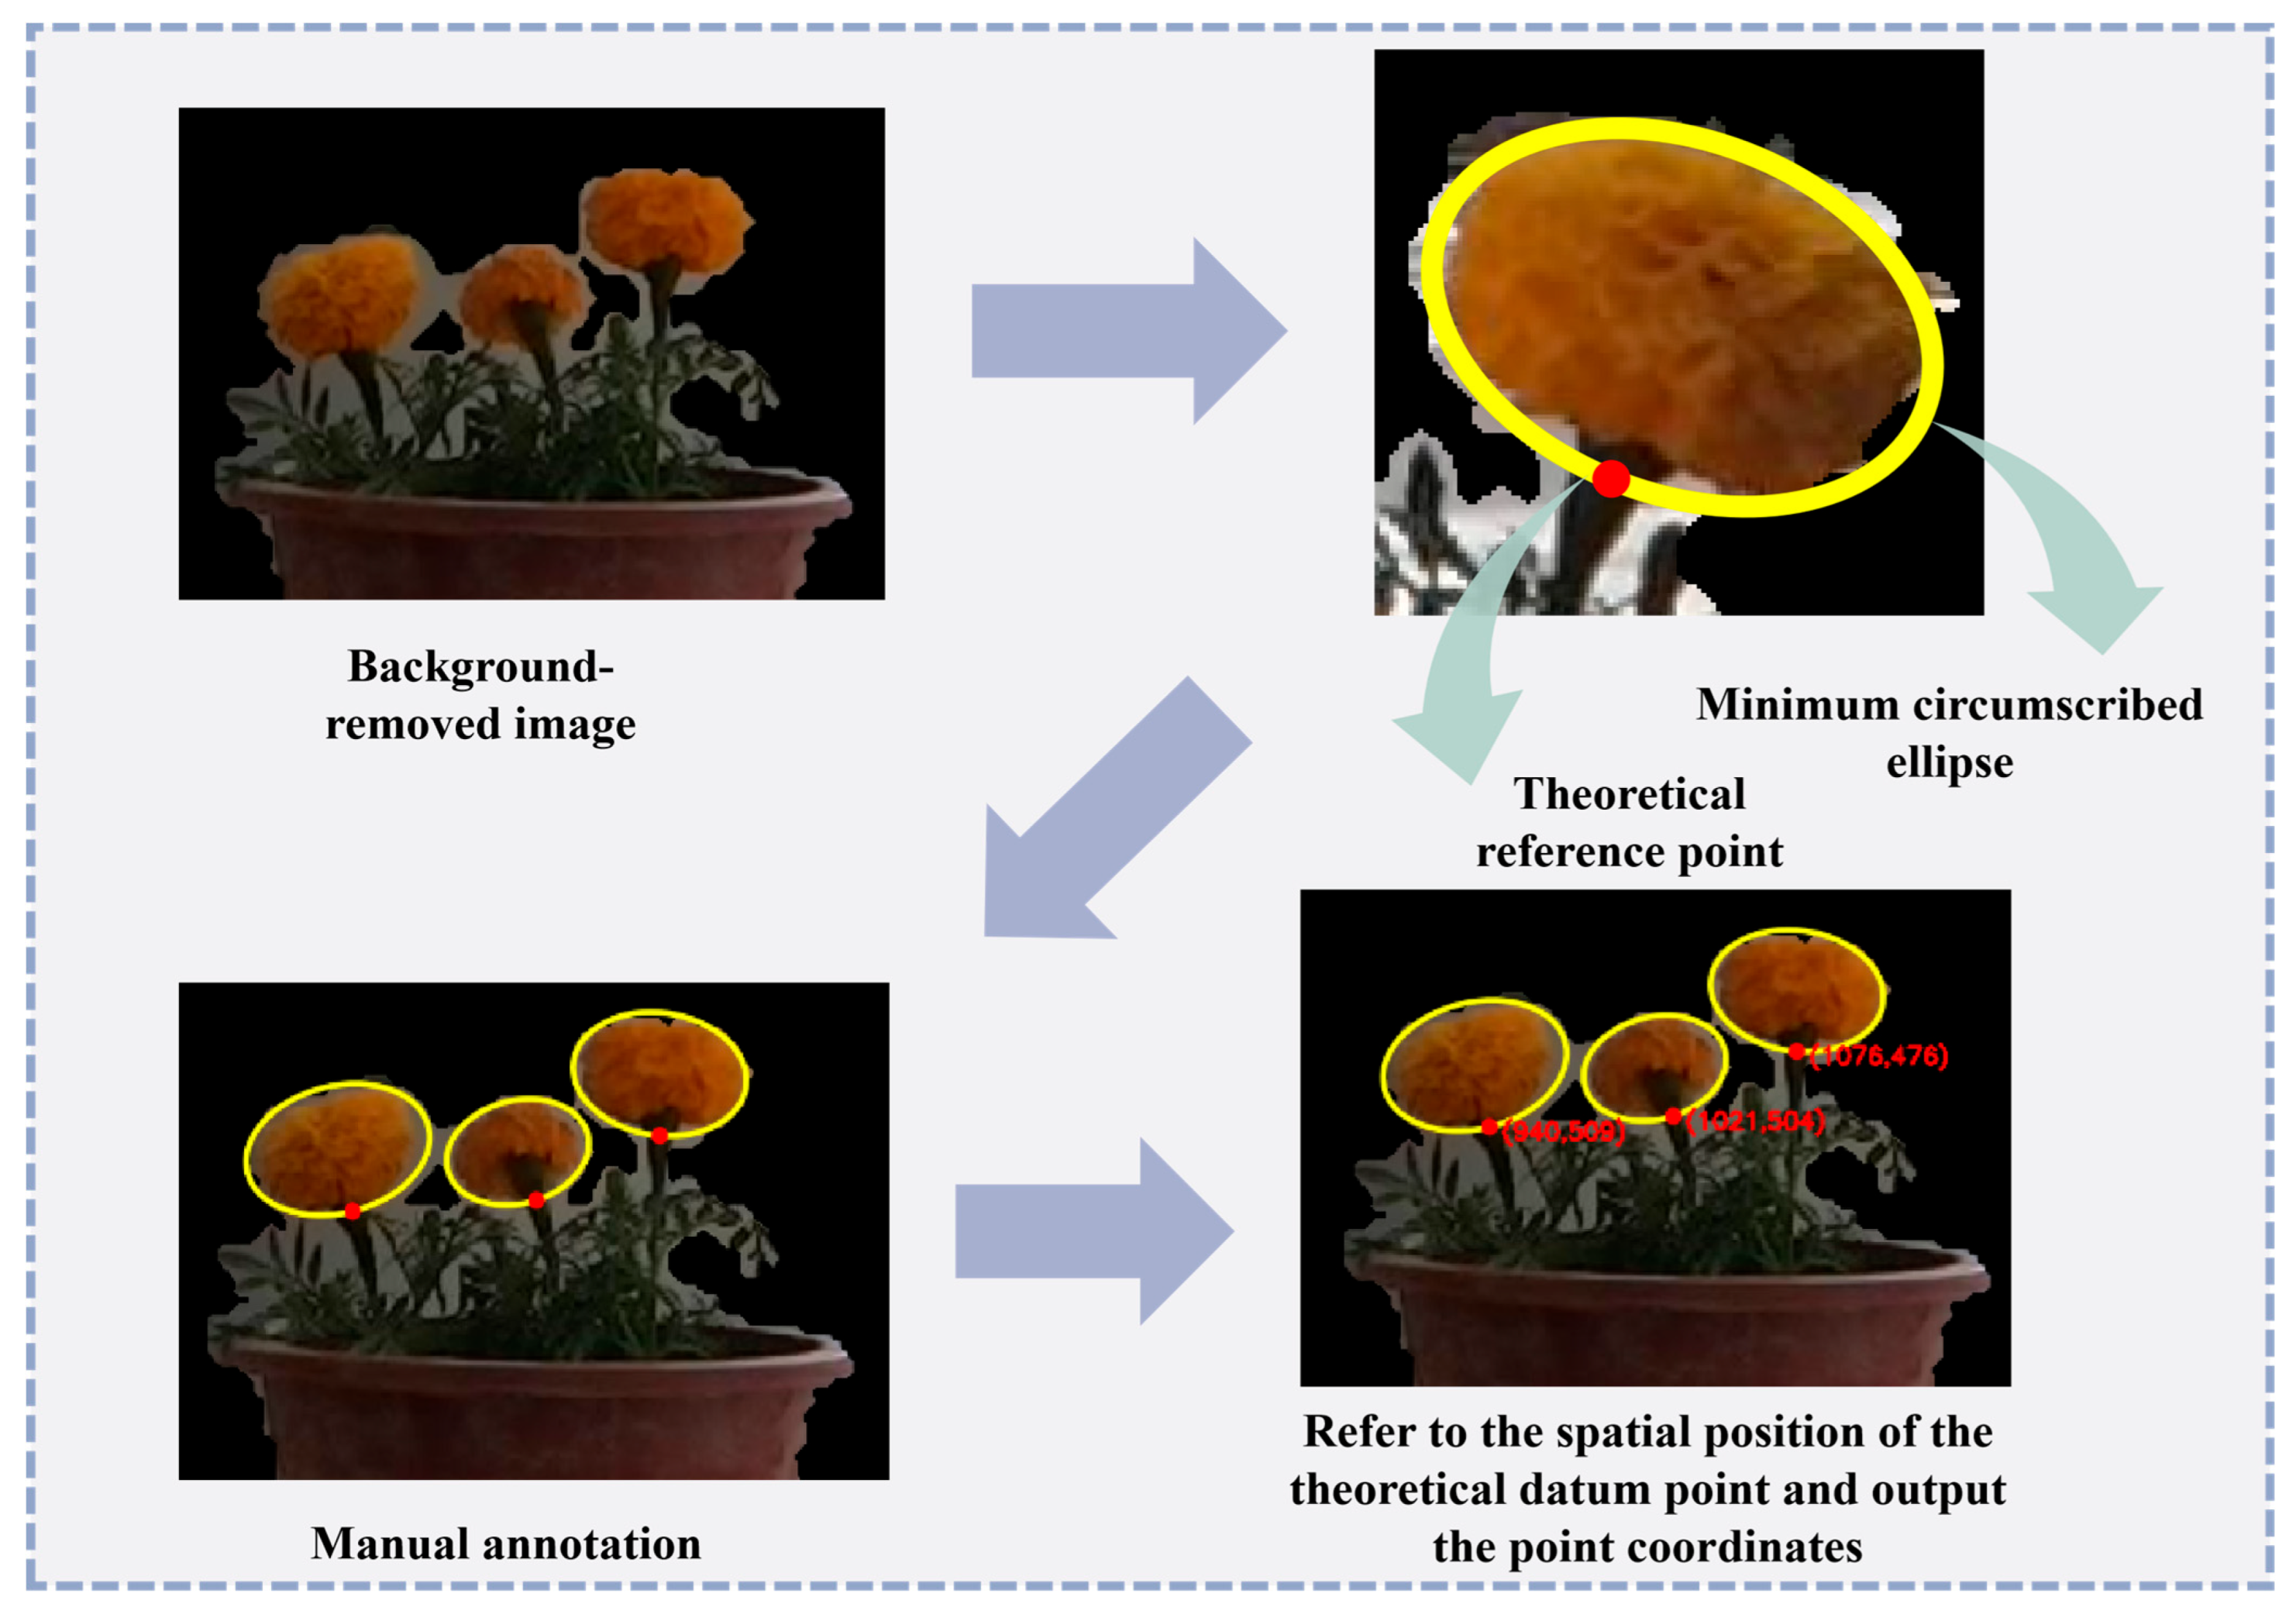
To assess the proposed marigold picking-point localization and attitude estimation method under field conditions, experiments were carried out on randomly distributed marigold plants that more closely represent practical operating scenarios. Manually annotated target positions were used as the ground-truth reference for performance evaluation, as shown in Figure 8. In particular, a minimum enclosing ellipse was fitted to the corolla region so that the resulting contour could capture the corolla morphology as completely as possible. The geometric point corresponding to the intersection between the lower end of the ellipse major axis and the pedicel was defined as the theoretical reference point, thereby enabling quantitative evaluation of picking-point localization accuracy. To minimize subjective bias and ensure annotation reliability, three independent annotators were invited to manually label each target. The average of the three annotations was computed and used as the final ground-truth reference coordinate, thereby reducing individual labeling errors and improving the consistency of the evaluation benchmark. Under real-world measurement conditions, the three-dimensional picking coordinates generated by the proposed algorithm were compared with the manually annotated coordinates to systematically evaluate the localization stability and environmental adaptability of the method in the field.
Figure 8.
Flowchart of manual annotation.
3.3.1. Results of Marigold Picking-Point Localization
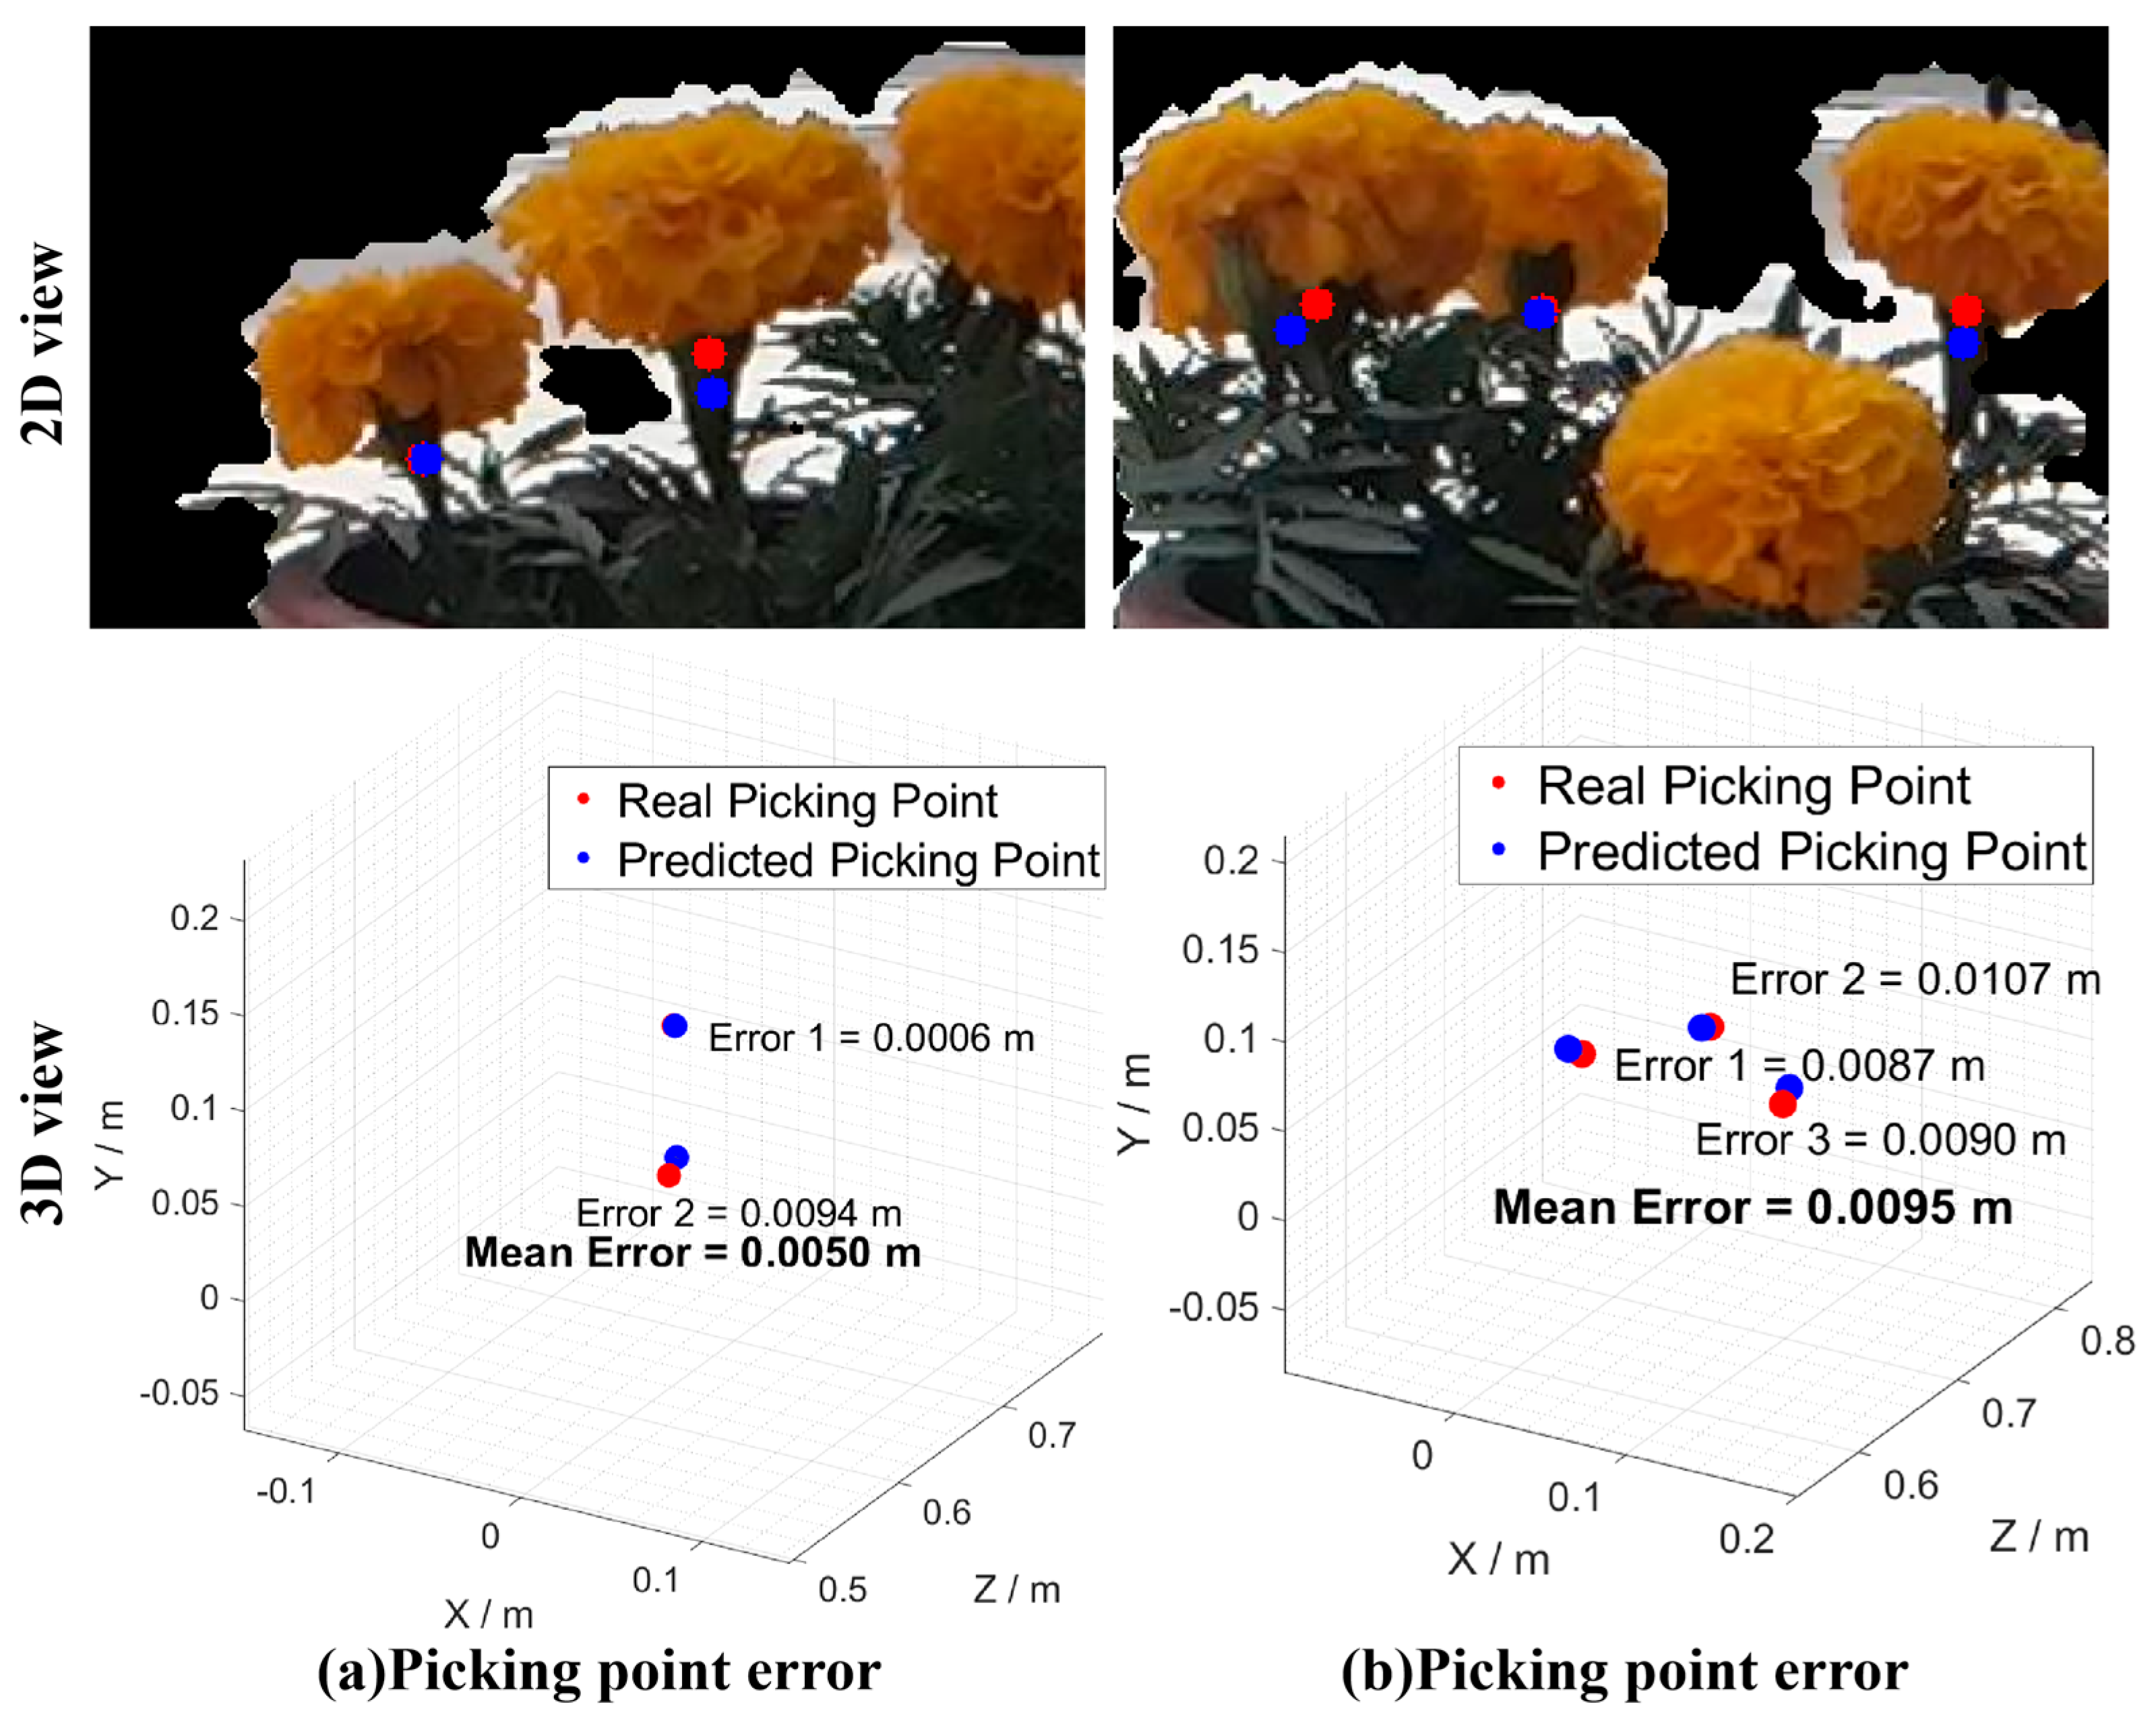
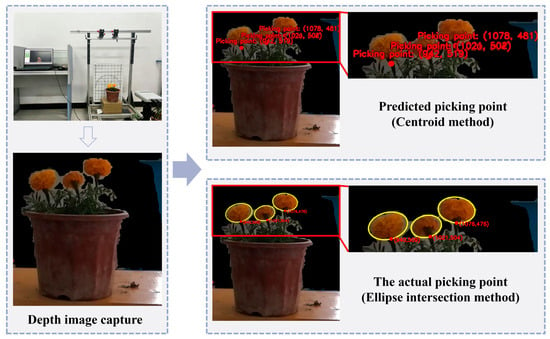
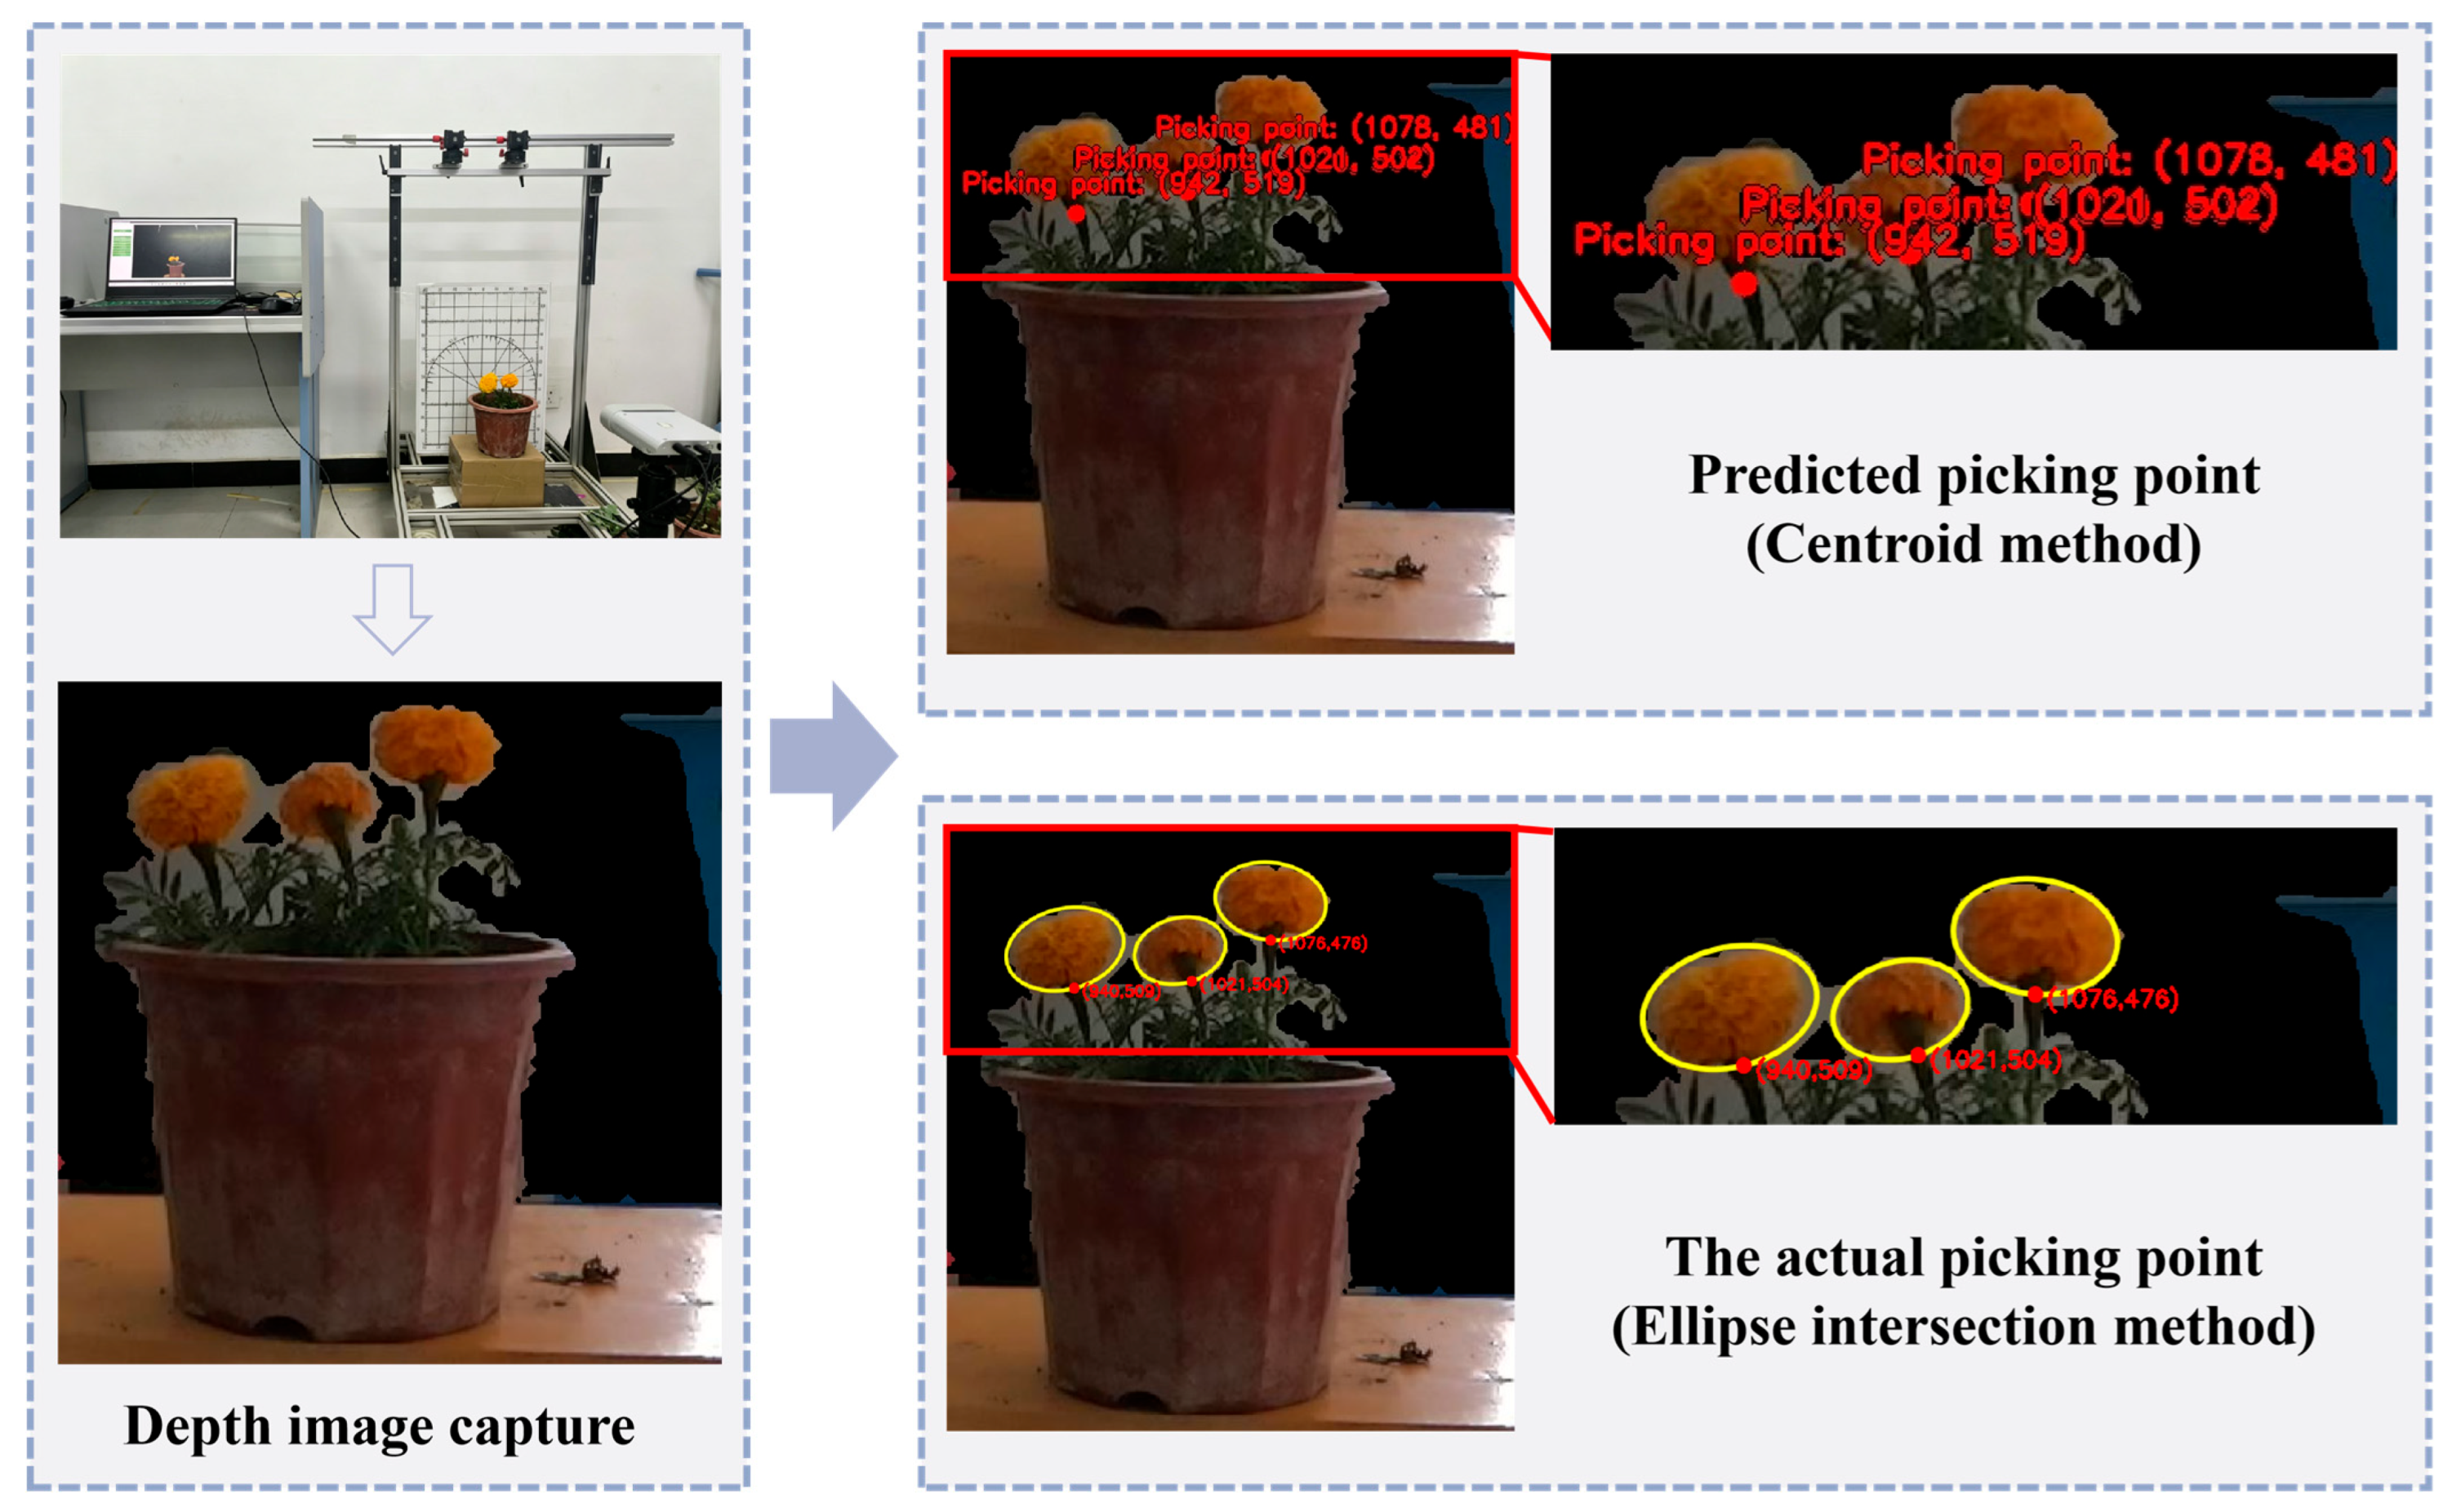
To intuitively characterize the spatial distribution of localization errors at the picking points, the sampled points were mapped into a three-dimensional coordinate space, as illustrated in Figure 9. In this coordinate system, the X-axis represents the lateral deviation in the frontal view, the Y-axis represents the longitudinal deviation in the frontal view, and the Z-axis represents the depth deviation, namely the distance between the target and the RGB-D camera. It should be noted that the Y-axis is oriented downward in the RGB image but upward in the three-dimensional coordinate space. Although these two directions are opposite, this difference does not affect the subsequent error analysis. Based on this framework, two groups of results were obtained. Groups a and b were conducted under outdoor simulated conditions. The coordinate values corresponding to each group are listed in Table 3.
Figure 9.
Comparison of predicted and actual picking points.
Table 3.
Comparison data of real and predicted coordinates.
The mean error for each individual sample point was calculated as the Euclidean distance between the predicted 3D coordinate and the ground-truth coordinate. For each experimental group, the mean error was then computed by averaging the mean errors of all sample points within that group. Specifically, for a group containing n sample points, the group-wise mean error is defined as follows:
where represents the error of the i-th sample point in the group, and n is the number of sample points in that group. The resulting mean values for each group are reported in the “mean error” column of Table 3.
The experimental results suggest that the centroid-based localization method used in this study achieved accuracy comparable to that of the manual ellipse intersection approach. In the practical localization tests for marigold picking, as shown in Figure 10, the group-wise mean comprehensive localization errors for the two outdoor groups were 0.0050 m and 0.0095 m, respectively, with individual sample maximum errors of 0.0094 m for group a and 0.0107 m for group b, thereby satisfying the accuracy requirements for actual harvesting operations.
Figure 10.
Comparison of picking-point errors in outdoor scenarios: (a) two-sample scene; (b) three-sample scene.
3.3.2. Results of Marigold Attitude Estimation
To validate the accuracy of the attitude estimation method proposed in this study, its estimation performance was assessed by quantifying the deviations between the predicted and actual picking angles. The mean angular error for each group was computed using the same averaging procedure as in Equation (5), where is defined as the absolute difference between the real angle and the predicted angle for each sample within the group. The statistical results of the angular differences between the measured and predicted values are summarized in Table 4.
Table 4.
Comparison data of real and predicted picking angle.
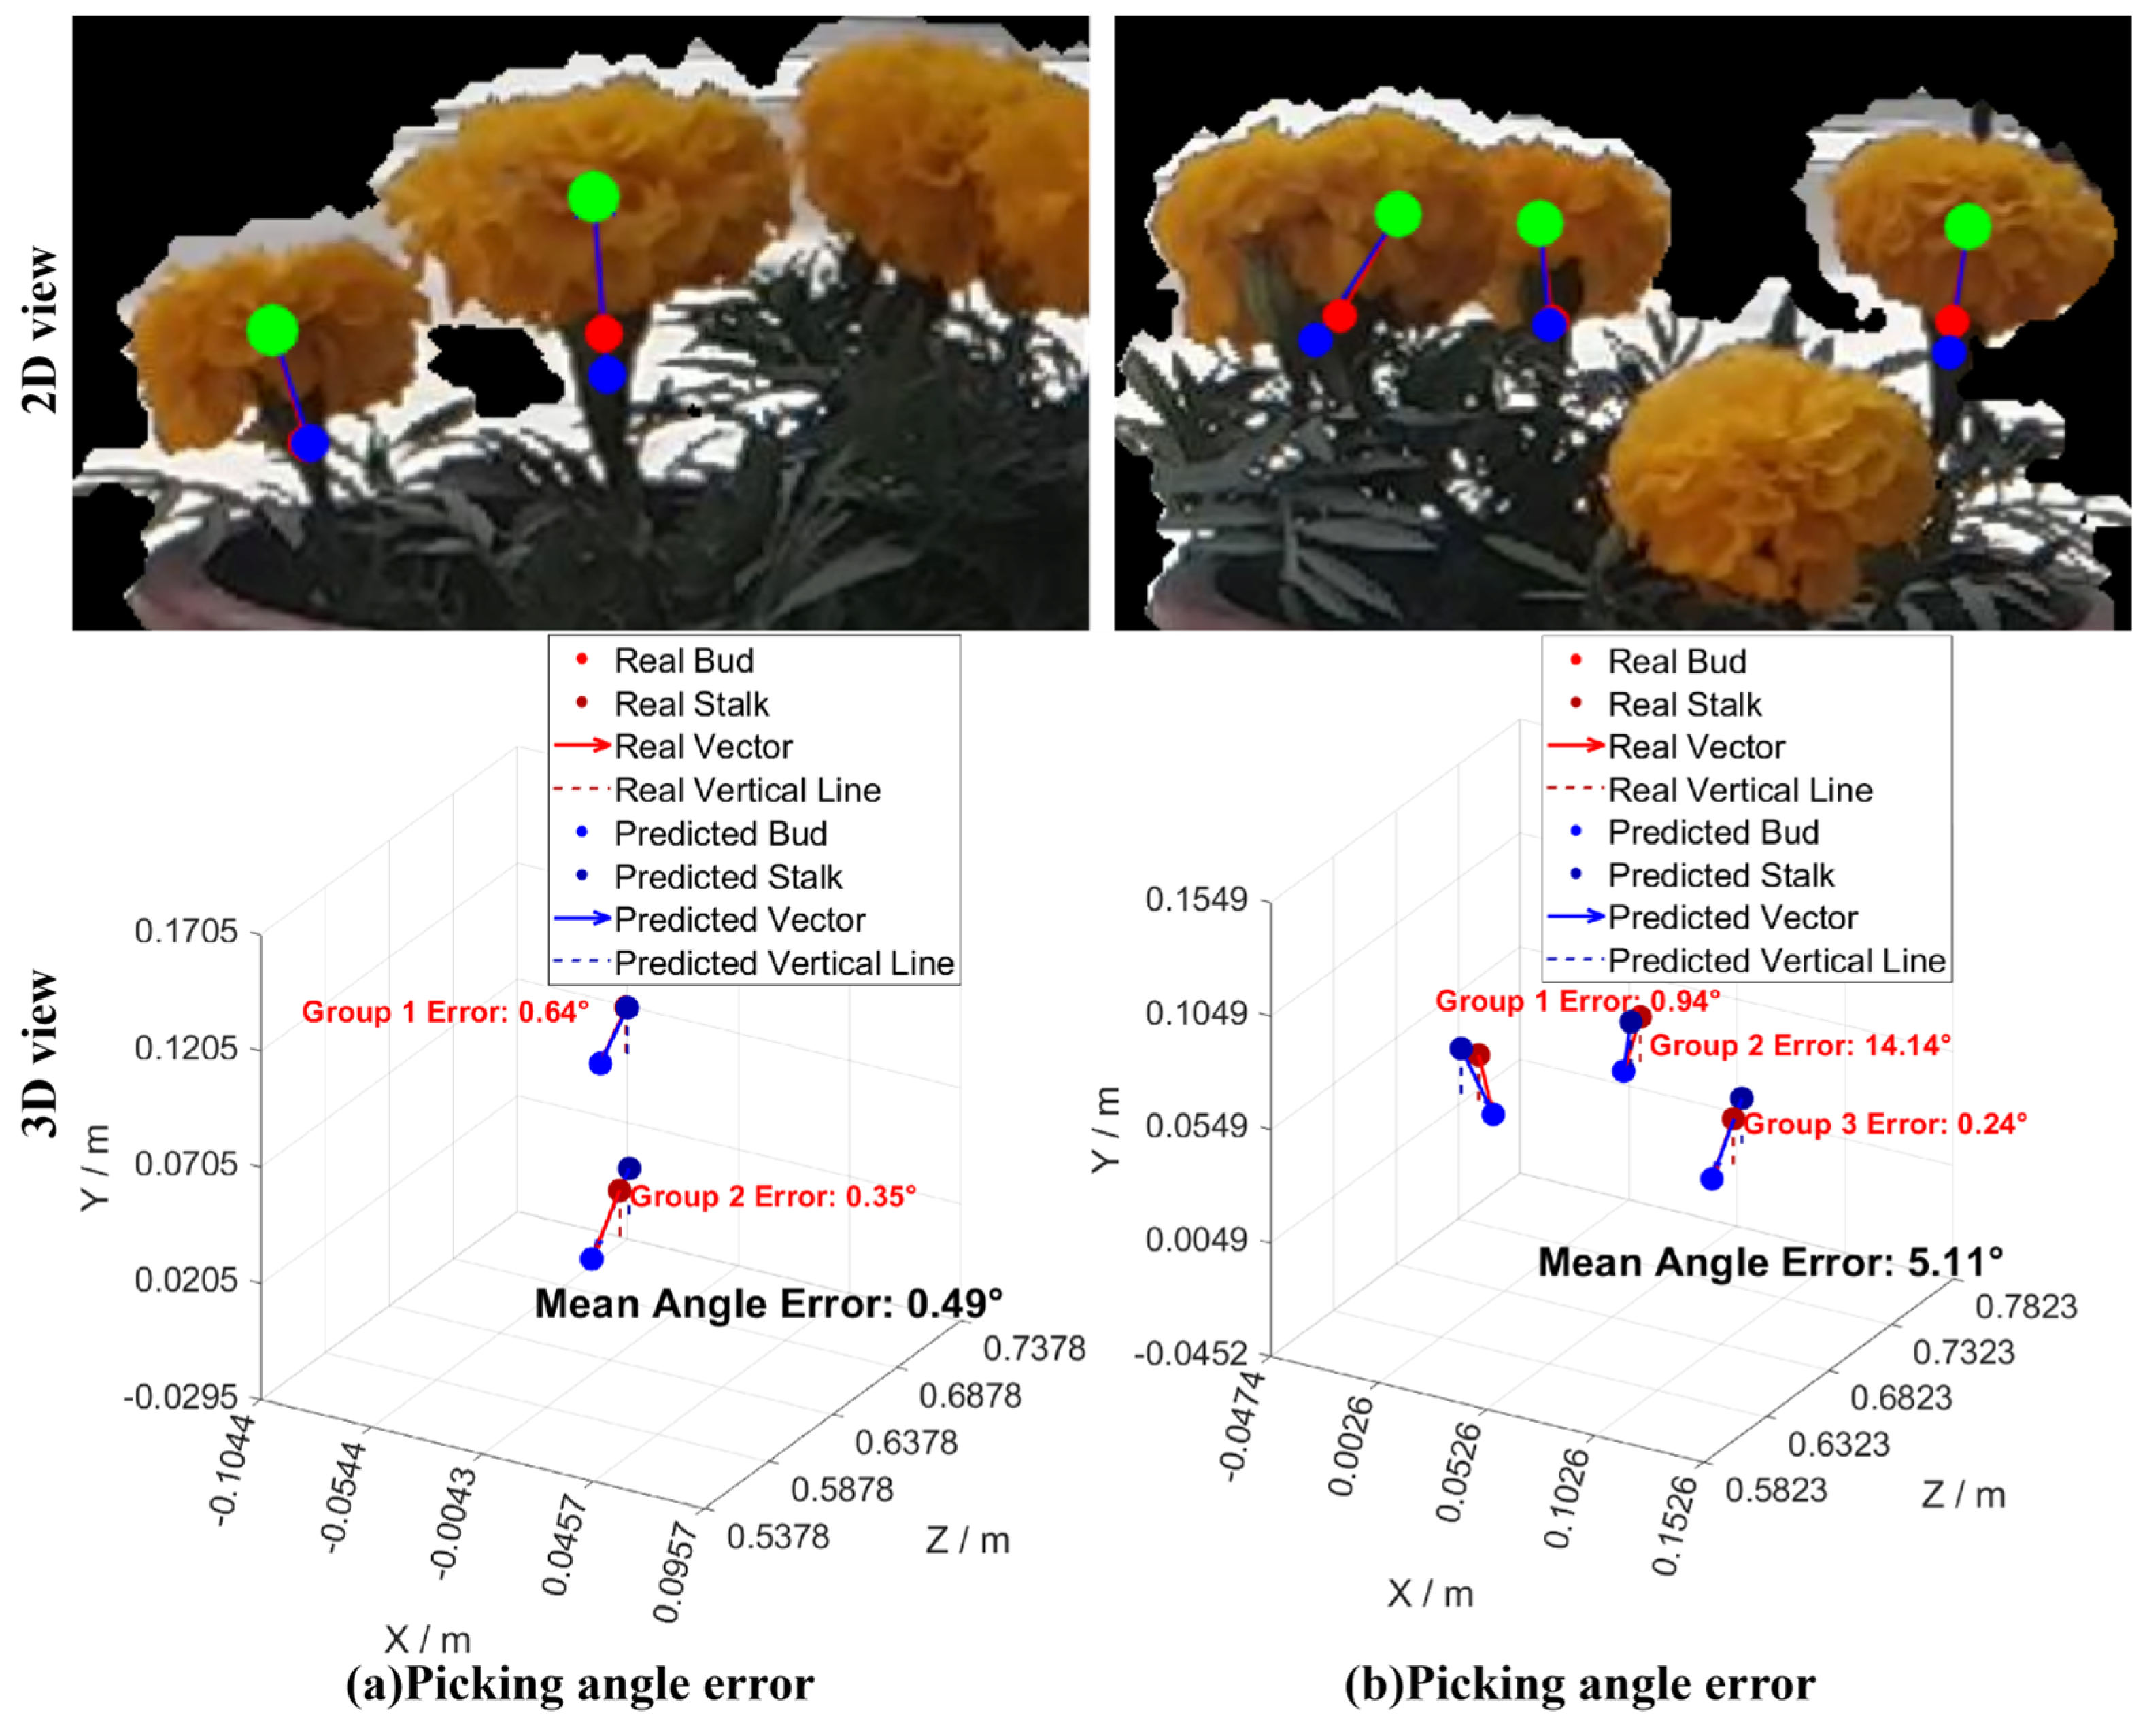
To evaluate the proposed 3D attitude estimation method, pedicel picking points were identified from the localization results in Figure 9. Corolla centroids were extracted using the centroid method and used as key points. The line connecting each pedicel point and corolla centroid was defined as the attitude estimation line [36]. With the local vertical at the picking point as reference, the angle θ between this line and the vertical was calculated. This angle represents the three-dimensional inclination of the pedicel. In outdoor scenes, as shown in Figure 11, spatially variable illumination made the pose estimates more sensitive to lighting changes. The effect was clearest in the middle flower of group b. Its marked Z-axis tilt meant that small picking-point errors caused relatively large changes in the estimated angle. The angular error for this sample therefore exceeded 10°. Despite this case, the mean error remained below 6° in every experimental group. The predicted picking angles thus remained sufficiently close to the ground truth for harvesting. Moreover, the method successfully processed every randomly selected test sample. It provided accurate picking-point localization and consistent attitude estimates across the tested scenes. These results support its robustness and potential for field deployment. Overall, the method provides a practical technical foundation for automated marigold harvesting.
Figure 11.
Comparison of picking angle errors in outdoor scenarios: (a) two-sample scene; (b) three-sample scene.
4. Discussion
The proposed HSN-YOLOv8n-seg model incorporates HWD, SGE attention, and the NewHead segmentation head to retain fine pedicel details and improve boundary delineation. For picking-point localization, pedicel centroid estimation, distance-prioritized matching, and cross-line verification help resolve ambiguous corolla–pedicel associations in scenes containing multiple targets. Experimental results indicate that the method maintains localization and pose errors within the tolerance limits of practical harvesting, while outperforming several widely used lightweight segmentation networks.
Compared with [25], our method offers greater practical value for robotic harvesting. In [25], marigold images were captured with a smartphone and lacked depth information. Consequently, picking points could be identified only in two dimensions, preventing direct recovery of the three-dimensional coordinates required for robotic operation. By contrast, the Femto Mega camera simultaneously records RGB and depth data, enabling more dependable three-dimensional localization of candidate picking points. The proposed distance-based filtering scheme also suppresses responses from irrelevant background regions, improving localization consistency in visually cluttered field scenes. Relative to [15], the proposed strategy achieves higher accuracy and greater stability under changing environmental conditions. However, the validation in [15] was conducted exclusively indoors, which may limit the generalizability of its findings to diverse agricultural environments. In this study, the method was evaluated under outdoor conditions, with varying illumination and degrees of occlusion. This broader evaluation provides stronger evidence of its feasibility, robustness, and suitability for deployment in field environments.
Pedicel occlusion is a major limitation of the present study. Under natural field conditions, intertwined branches and leaves frequently obscure pedicels to varying degrees [37]. Consequently, the segmentation model may fail to delineate the entire pedicel. Under severe occlusion, the pedicel may disappear entirely from the predicted mask. These errors directly compromise subsequent picking-point localization and attitude estimation. When the corolla covers the pedicel, substantial structural overlap obscures their boundary and complicates accurate separation. Pedicel–pedicel occlusion presents a related challenge. The foreground pedicel is generally segmented successfully, whereas the background pedicel is often incompletely recovered. Such cases remain difficult to resolve using the current single-view imaging framework [38]. Moreover, pedicels on distant plants are slender and consequently more prone to missed detection. The irregular morphology of miniature corollas reduces recognition accuracy and further complicates attitude estimation. Future work will investigate multi-view imaging to alleviate occlusion and improve perception robustness and environmental adaptability in complex field settings. One possible solution is synchronized image acquisition using cameras positioned at different viewing angles around each target plant. The resulting point clouds could then be registered to reconstruct complete three-dimensional flower structures from complementary observations. This configuration may recover occluded pedicels when they remain visible from at least one alternative viewpoint.
5. Conclusions
The proposed HSN-YOLOv8n-seg integrates HWD, SGE, and NewHead to improve segmentation accuracy without substantially increasing computational complexity. It achieves a precision of 78.53%, exceeding the baseline by 3.13 percentage points, while mAP50 reaches 75.43%, an improvement of 0.62 percentage points. The model remains compact, with 3.17 M parameters, a size of 12.08 MB, and an inference time of 9.42 ms. Compared with YOLOv9t and YOLOv11n, it delivers more accurate segmentation and a better balance between efficiency and predictive performance.
For picking-point localization and attitude estimation, the picking position was determined from the centroid of the pedicel mask. A one-to-one correspondence between corollas and pedicels was then constructed using distance priority matching together with cross-line verification. The line segment joining the two centroids served as the reference baseline for estimating the flower pose. Experimental results showed that the overall picking-point localization errors for the two test groups were 0.0050 m, and 0.0095 m, respectively, remaining below 0.01 m in all cases. The corresponding pose angle errors were 0.49°, and 5.11°, respectively, both less than 6°. These findings indicate that the proposed approach achieves accurate picking-point localization and robust attitude estimation, thereby providing a reliable technical basis for the vision system of robotic marigold harvesting.
In summary, the proposed HSN-YOLOv8n-seg model enables high-precision segmentation of marigold corollas and pedicels, while the errors in picking-point localization and attitude estimation satisfy the practical requirements of automated harvesting. Future work will focus on pedicel occlusion in field conditions by investigating multi-view localization strategies to alleviate segmentation failure caused by occlusion from branches and leaves. A potential implementation involves synchronized data acquisition from multiple cameras positioned at different viewing angles around the target plant, followed by point cloud registration to reconstruct complete 3D flower structures from the fused multi-view data. This approach would allow occluded pedicels to be recovered from complementary viewpoints where they remain visible.
Author Contributions
Conceptualization, B.M., Y.X. and B.C.; methodology, B.M., Y.X. and B.C.; software, B.M. and Y.X.; validation, B.M., Y.X. and B.C.; formal analysis, B.M. and Y.X.; investigation, B.M., Y.X. and B.C.; resources, B.M., Y.X. and B.C.; data curation, B.M., Y.X. and B.C.; writing—original draft preparation, B.M., Y.X. and B.C.; writing—review and editing, B.M., Y.X. and B.C.; visualization, B.M., Y.X. and B.C.; supervision, B.M., Y.X. and B.C. All authors have read and agreed to the published version of the manuscript.
Funding
This study was supported by the National Natural Science Foundation of China (NSFC) project (32660480) and the Scientific Research Start-up Project for High-level Talents at Xinjiang Institute of Technology (Program No. XJLG2022G003).
Data Availability Statement
The original contributions presented in this study are included in the article; further inquiries can be directed to the corresponding author.
Acknowledgments
During the preparation of this work, the authors used ChatGPT (version 5.0) for grammar checking to improve the readability of article. After using these servers, the authors reviewed and edited the content as needed and takes full responsibility for the content of the published article.
Conflicts of Interest
The authors declare no conflicts of interest.
References
- Parklak, W.; Ounjaijean, S.; Kulprachakarn, K.; Boonyapranai, K. In vitro α-amylase and α-glucosidase inhibitory effects, antioxidant activities, and lutein content of nine different cultivars of marigold flowers (Tagetes spp.). Molecules 2023, 28, 3314. [Google Scholar] [CrossRef] [Scilit] [PubMed]
- Yang, Q.; Luo, S.; Chang, C.; Xun, Y.; Bao, G. Segmentation algorithm for Hangzhou white chrysanthemums based on least squares support vector machine. Int. J. Agric. Biol. Eng. 2019, 12, 127–134. [Google Scholar] [CrossRef] [Scilit]
- Kohan, A.; Borghaee, A.M.; Yazdi, M.; Minaei, S.; Sheykhdavudi, M.J. Robotic harvesting of rosa damascena using stereoscopic machine vision. World Appl. Sci. J. 2011, 12, 231–237. [Google Scholar]
- Patel, S. Marigold Flower Blooming Stage Detection in Complex Scene Environment using Faster RCNN with Data Augmen-tation. Int. J. Adv. Comput. Sci. Appl. 2023, 14, 79. [Google Scholar] [CrossRef] [Scilit]
- Zhang, Z.; Shi, R.; Xing, Z.; Guo, Q.; Zeng, C. Improved faster region-based convolutional neural networks (R-CNN) model based on split attention for the detection of safflower filaments in natural environments. Agronomy 2023, 13, 2596. [Google Scholar] [CrossRef] [Scilit]
- Bai, Y.; Yu, J.; Yang, S.; Ning, J. An improved YOLO algorithm for detecting flowers and fruits on strawberry seedlings. Biosyst. Eng. 2024, 237, 1–12. [Google Scholar] [CrossRef] [Scilit]
- Qi, C.; Gao, J.; Pearson, S.; Harman, H.; Chen, K.; Shu, L. Tea Chrysanthemum Detection under Unstructured Environments Using the TC-YOLO Model. Expert Syst. Appl. 2022, 193, 116473. [Google Scholar] [CrossRef] [Scilit]
- Fan, Y.; Tohti, G.; Geni, M.; Zhang, G. A marigold corolla detection model based on the improved YOLOv7 lightweight. Signal. Image Video Process. 2024, 18, 4703–4712. [Google Scholar] [CrossRef] [Scilit]
- Ma, B.; Wu, Z.; Ge, Y.; Chen, B.; Lin, J.; Zhang, H.; Xia, H. Continuous Picking Path Planning Based on Lightweight Marigold Corollas Recognition in the Field. Biomimetics 2025, 10, 648. [Google Scholar] [CrossRef] [Scilit] [PubMed]
- Fatehi, F.; Bagherpour, H.; Parian, J.A. Enhancing the Performance of YOLOv9t Through a Knowledge Distillation Approach for Real-Time Detection of Bloomed Damask Roses in the Field. Smart Agric. Technol. 2025, 10, 100794. [Google Scholar] [CrossRef] [Scilit]
- Li, C.; Song, Z.; Wang, Y.; Zhang, Y. Research on bud counting of cut lily flowers based on machine vision. Multimed. Tools Appl. 2023, 82, 2709–2730. [Google Scholar] [CrossRef] [Scilit]
- Hao, W.; Zhang, J.; Xu, W.; Fan, X.; Norton, T.; Cui, Y. Clip-assisted flower detection and wind-compensated precision liquid pollination robot for kiwifruit orchards. Comput. Electron. Agric. 2026, 241, 111250. [Google Scholar] [CrossRef] [Scilit]
- Bhattarai, U.; Bhusal, S.; Zhang, Q.; Karkee, M.; Zhang, Q.; Karkee, M. AgRegNet: A deep regression network for flower and fruit density estimation, localization, and counting in orchards. Comput. Electron. Agric. 2024, 227, 109534. [Google Scholar] [CrossRef] [Scilit]
- Guo, H.; Chen, H.; Wu, T. MSDP-Net: A YOLOv5-Based Safflower Corolla Object Detection and Spatial Positioning Net-work. Agriculture 2025, 15, 855. [Google Scholar] [CrossRef] [Scilit]
- Ma, B.; Wu, Z.; Ge, Y.; Chen, B.; Lin, J.; Zhang, H.; Xia, H. A Lightweight Segmentation Model Method for Marigold Picking Point Localization. Horticulturae 2026, 12, 97. [Google Scholar] [CrossRef] [Scilit]
- Nasr, G.E.M.; Ibrahim, M.M.; Tayel, M.Y.; Salama, D.S. Innovative robot for chamomile flower harvesting as a new approach based on visual selection. Agric. Eng. Int. CIGR J. 2024, 26, 4. [Google Scholar]
- Wang, J.; Gao, Z.; Zhang, Y.; Zhou, J.; Wu, J.; Li, P. Real-time detection and location of potted flowers based on a ZED camera and a YOLO V4-tiny deep learning algorithm. Horticulturae 2021, 8, 21. [Google Scholar] [CrossRef] [Scilit]
- Amer, M.A.; Rajan, P.; Mehanny, S.; Artyszak, A.; Ahmed, M.A.A. Innovative design of an experimental jasmine flower automated picker system using vertical gripper and YOLOv5. Agriculture 2023, 13, 1595. [Google Scholar] [CrossRef] [Scilit]
- Rui, Z.; Zhang, Z.; Hao, C.; Igathinathane, C.; Azizi, A.; Wu, X.; Zhang, M.; Abid, F.; Javidan, S.M. Development and field evaluation of a straddle-frame honeysuckle harvesting robot. Biosyst. Eng. 2025, 257, 104234. [Google Scholar] [CrossRef] [Scilit]
- Zhang, H.; Ge, Y.; Xia, H.; Sun, C. Safflower picking points localization method during the full harvest period based on SBP-YOLOv8s-seg network. Comput. Electron. Agric. 2024, 227, 109646. [Google Scholar] [CrossRef] [Scilit]
- Xing, Z.; Zhang, Z.; Wang, Y.; Xu, P.; Guo, Q.; Zeng, C.; Shi, R. SDC-DeepLabv3+: Lightweight and Precise Localization Algorithm for Safflower-Harvesting Robots. Plant Phenomics 2024, 6, 0194. [Google Scholar] [CrossRef] [Scilit] [PubMed]
- Chen, B.; Ding, F.; Ma, B.; Yao, Q.; Ning, S. Research on detection and location method of safflower filament picking points during the blooming period in unstructured environments. Sci. Rep. 2025, 15, 10851. [Google Scholar] [CrossRef] [Scilit] [PubMed]
- Wang, X.; Zhou, J.; Xu, Y.; Cui, C.; Liu, Z.; Chen, J. Location of safflower filaments picking points in complex environment based on improved Yolov5 algorithm. Comput. Electron. Agric. 2024, 227, 109463. [Google Scholar] [CrossRef] [Scilit]
- Torre, F.T.D.; Melgani, F.; Pertot, I.; Furlanello, C. Artificial Intelligence Vision Methods for Robotic Harvesting of Edible Flowers. Plants 2024, 13, 3197. [Google Scholar] [CrossRef] [Scilit] [PubMed]
- Ma, B.; Wu, Z.; Ge, Y.; Chen, B.; Zhang, H.; Xia, H.; Wang, D. A Recognition Method for Marigold Picking Points Based on the Lightweight SCS-YOLO-Seg Model. Sensors 2025, 25, 4820. [Google Scholar] [CrossRef] [Scilit] [PubMed]
- Muriki, H.; Teo, H.R.; Sengupta, V.; Hu, A.-P. Robotic 3D flower pose estimation for small-scale urban farms. In Proceedings of the 2025 IEEE International Conference on Robotics and Automation (ICRA); IEEE: New York, NY, USA, 2025; pp. 15539–15545. [Google Scholar]
- Fu, L.; Majeed, Y.; Zhang, X.; Karkee, M.; Zhang, Q. Faster R–CNN–based apple detection in dense-foliage fruiting-wall trees using RGB and depth features for robotic harvesting. Biosyst. Eng. 2020, 197, 245–256. [Google Scholar] [CrossRef] [Scilit]
- Xu, G.; Liao, W.; Zhang, X.; Li, C.; He, X.; Wu, X. Haar wavelet downsampling: A simple but effective downsampling module for semantic segmentation. Pattern Recognit. 2023, 143, 109819. [Google Scholar] [CrossRef] [Scilit]
- Li, Y.X.; Li, X.; Yang, J. Spatial group-wiseenhance: Enhancing semantic feature learning in CNN. In Proceedings of the Asian Conference on Computer Vision; Springer Nature: Cham, Switzerland, 2022; pp. 687–702. [Google Scholar]
- Bolya, D.; Zhou, C.; Xiao, F.; Lee, Y.J. YOLACT: Real-Time Instance Segmentation. In Proceedings of the 2019 IEEE/CVF International Conference on Computer Vision (ICCV), Seoul, Republic of Korea, 27 October–2 November 2019; pp. 9157–9166. [Google Scholar]
- Loshchilov, I.; Hutter, F. SGDR: Stochastic gradient descent with warm restarts. In Proceedings of the International Conference on Learning Rep-Resentations (ICLR), Toulon, France, 24–26 April 2017. [Google Scholar]
- Ultralytics. YOLOv8[EB/OL]. 2023. Available online: https://github.com/ultralytics/ultralytics (accessed on 19 January 2026).
- Zheng, Z.; Wang, P.; Liu, W.; Li, J. Distance-IoU loss: Faster and better learning for bounding box regression. In Proceedings of the AAAI Conference on Artificial Intelligence, New York, NY, USA, 7–12 February 2020; Volume 34, pp. 12993–13000. [Google Scholar]
- Li, X.; Wang, W.; Wu, L.; Chen, S.; Hu, X.; Li, J.; Tang, J.; Yang, J. Generalized focal loss: Learning qualified and distributed bounding boxes for dense object detection. Adv. Neural Inf. Process. Syst. 2020, 33, 21002–21012. [Google Scholar]
- Selvaraju, R.R.; Cogswell, M.; Das, A.; Vedantam, R.; Parikh, D.; Batra, D. Grad-CAM: Visual explanations from deep networks via gradient-based localization. In Proceedings of the IEEE International Conference on Computer Vision (ICCV), Venice, Italy, 22–29 October 2017; pp. 618–626. [Google Scholar]
- Chen, J.; Yu, T.; Lou, M.; Xu, X.; Jiang, H.; Ren, G. Tomato harvesting pose estimation based on fruit-stem spatial relationship. Comput. Electron. Agric. 2026, 250, 111913. [Google Scholar]
- Fu, L.; Gao, F.; Wu, J.; Li, R.; Karkee, M.; Zhang, Q. Application of consumer RGB-D cameras for fruit detection and localization in field: A critical review. Comput. Electron. Agric. 2020, 177, 105687. [Google Scholar] [CrossRef] [Scilit]
- Wang, Z.; Zhang, H.; Bian, L.; Zhou, L.; Ge, Y. Accurate plant 3D reconstruction and phenotypic traits extraction via stereo imaging and multi-view point cloud alignment. Front. Plant Sci. 2025, 16, 1642388. [Google Scholar] [CrossRef] [Scilit] [PubMed]

Disclaimer/Publisher’s Note: The statements, opinions and data contained in all publications are solely those of the individual author(s) and contributor(s) and not of MDPI and/or the editor(s). MDPI and/or the editor(s) disclaim responsibility for any injury to people or property resulting from any ideas, methods, instructions or products referred to in the content. |
© 2026 by the authors. Licensee MDPI, Basel, Switzerland. This article is an open access article distributed under the terms and conditions of the Creative Commons Attribution (CC BY) license.