


Abstract
Light is a key environmental factor regulating plant photosynthesis, yet the coordinated effects of photoperiod and light intensity on photosynthetic dynamics in non-heading Chinese cabbage remain unclear. Using experimental data, we developed a circadian clock-controlled photosynthesis model integrating photoperiod and light-intensity inputs. The model was calibrated and evaluated against experimental observations and was then used to analyze circadian gene expression, diurnal net photosynthetic rate (), light-period net CO2 assimilation, and the marginal carbon benefit of increasing daily light integral (DLI). Under a constant DLI of 9.216 mol·m−2·d−1, extending the photoperiod from 8 to 20 h while reducing light intensity from 320 to 128 µmol·m−2·s−1 lowered and delayed the instantaneous peak but progressively increased light-period net CO2 assimilation. Among the treatments examined, 20L:4D produced the highest net CO2 assimilation. Moreover, across the simulated DLI range of 5–19 mol·m−2·d−1, the 20-h photoperiod consistently produced the highest net assimilation, whereas the marginal carbon benefit of additional light declined by approximately 62%. The results suggest that distributing a fixed daily light input over a longer photoperiod at lower instantaneous light intensity can enhance daily carbon gain within the tested range, whereas increasing DLI produces progressively diminishing photosynthetic returns. This study provides a modeling framework for evaluating photoperiod–light intensity coordination and provides a quantitative basis for optimizing light–environment management in controlled-environment agriculture.
1. Introduction
Non-heading Chinese cabbage (Brassica campestris ssp. chinensis) is a leafy vegetable rich in vitamin C, calcium, potassium, dietary fiber, and various antioxidants. It is characterized by a short growth cycle and high yield potential [1]. This crop is widely cultivated in the middle and lower reaches of the Yangtze River in China and plays a significant role in the country’s urban “vegetable basket” program [2]. Due to limited land resources around cities, it is increasingly produced in controlled-environment facilities, where quality and yield can be improved by optimizing growing conditions. Light is one of the most critical environmental factors influencing plant growth [3]. The use of artificial light sources to control the light environment is already technically feasible [3] and has been widely applied to various grain and vegetable crops [4,5,6,7]. However, limited information is available on how light intensity and photoperiod should be coordinated to improve photosynthetic performance and carbon gain in non-heading Chinese cabbage.
Light intensity is a key environmental factor regulating plant growth, development, and stress responses, and even small fluctuations in light intensity can markedly affect multiple physiological processes in plants, including leaf morphogenesis, photosynthetic efficiency, flower bud differentiation, and cell division activity [3,8]. In many crops, decreasing light intensity often leads to a substantial reduction in root and shoot biomass [9]. For instance, shading significantly promoted stem elongation in soybean, with stem length increasing by 210.3% compared with plants grown under full sunlight [10]. However, the optimal light environment for crop growth is highly species-specific. In shade-tolerant crops such as Panax ginseng, a relatively low light intensity has been reported to be suitable for both shoot and root growth [11]. Conversely, in Cannabis sativa, dry inflorescence yield has been reported to increase linearly with increasing canopy-level PPFD up to 1800 μmol·m−2·s−1 [12]. However, light management in greenhouse production cannot be considered independently of the surrounding microclimate. Fanourakis et al. [13] emphasized that irradiance, photoperiod, temperature, vapor pressure deficit, CO2 concentration, irrigation regime, and nutrient supply interactively regulate carbon assimilation, pigment metabolism, nutritional quality, and postharvest performance in leafy vegetables. These responses are also strongly species-specific, indicating that greenhouse climate optimization should coordinate multiple environmental factors rather than maximize any single variable. Within this broader framework, quantifying the combined effects of photoperiod and instantaneous irradiance in non-heading Chinese cabbage represents an important step toward crop-specific, multifactor environmental management.
In addition to light intensity, photoperiod is a key factor regulating plant physiological processes. As carbon-fixing organisms, plants have evolved precise mechanisms to sense and adapt to photoperiod changes [14,15]. Variations in photoperiod directly influence photosynthetic efficiency, growth and development rates, and starch metabolism dynamics [16]. Studies have shown that moderately extending the photoperiod can significantly enhance photosynthetic capacity and promote growth [16,17]. However, excessively long photoperiods or continuous light can have detrimental effects, including reduced photosynthetic capacity, excessive starch accumulation, and light stress responses [18]. Therefore, providing an appropriate alternation of light and dark periods is essential for plant growth and the efficient production of target compounds [19].
Studies have shown that different combinations of photoperiod and light intensity significantly affect plant yield, leaf morphology, texture, and photosynthetic efficiency [20,21]. Under a constant daily light integral (DLI), reducing light intensity while extending the photoperiod promotes leaf expansion and increases lettuce yield [22]. In contrast, shortening the photoperiod and increasing light intensity increased the fresh weight of cabbage microgreens [23]. These findings indicate that equivalent DLIs do not necessarily produce equivalent physiological or growth responses because photoperiod and instantaneous light intensity affect plants through partly different mechanisms. Therefore, photoperiod and light intensity should be considered jointly, and their appropriate combination is likely to be species-specific.
Recent research shows that the circadian clock is a key regulatory system through which plants integrate light intensity and photoperiod signals. It regulates internal rhythms through feedback loops within the core oscillator, ensuring that plant responses to light conditions are synchronized with daily and seasonal changes [24,25]. Light also modulates gene expression through clock-related pathways, particularly those involved in light responses and carbon assimilation, thereby aligning photosynthesis with the external light–dark cycle [26]. Therefore, incorporating circadian regulation into photosynthesis modeling may help explain the dynamic responses of non-heading Chinese cabbage to different light regimes.
Mathematical models have previously been developed to describe the effects of light conditions and photoperiod on crop photosynthesis and productivity. Dynamic crop-growth models have linked incident photosynthetically active radiation, CO2 concentration, temperature, photosynthetic assimilation, and respiratory loss with dry-matter accumulation [27]. Other studies have explicitly incorporated illumination duration into carbon-balance models to simulate crop productivity under different photoperiods [28]. In parallel, mathematical models of the plant circadian clock have characterized clock entrainment, phase, and rhythmic stability under different light–dark cycles [29]. These studies demonstrate that photoperiod-dependent crop productivity and circadian entrainment can both be quantitatively described.
However, crop-productivity models generally represent photoperiod through illumination duration, cumulative irradiance, and carbon balance without explicitly incorporating circadian-clock regulation and photosynthesis-related gene expression. Conversely, circadian-clock models primarily focus on oscillator entrainment and generally do not connect clock-gene dynamics with crop-specific photosynthetic output and daily net CO2 assimilation. An experimentally evaluated framework linking photoperiod, light intensity, circadian regulation, photosynthesis-related gene expression, and photosynthetic carbon gain remains lacking for non-heading Chinese cabbage.
We hypothesized that, even under the same DLI, redistributing light through different photoperiod–light-intensity combinations would alter rhythmic photosynthesis in association with circadian-clock-related changes in photosynthesis-related gene expression, thereby producing differences in diurnal net photosynthetic rate and light-period net CO2 assimilation. To test this hypothesis, we developed a circadian-clock-regulated photosynthesis model integrating photoperiod and light-intensity inputs, transcriptional time delays, photosynthesis-related gene dynamics, and net photosynthetic rate. The model was calibrated and evaluated using measurements of clock-gene expression, photosynthesis-related gene expression, and under different photoperiod–light-intensity combinations. It was subsequently used to examine rhythmic gene-expression dynamics, quantify changes in diurnal and light-period net CO2 assimilation under constant-DLI treatments, and evaluate how the maximum attainable assimilation and marginal carbon benefit varied with increasing DLI. Leaf SPAD responses and model-parameter sensitivity were also assessed to provide additional physiological and computational evaluation. This study aimed to clarify how the temporal distribution of a given light input influences photosynthetic carbon gain and to determine whether extending the photoperiod at lower instantaneous light intensity can increase cumulative photosynthetic carbon gain in non-heading Chinese cabbage.
2. Materials and Methods
2.1. Plant Materials, Growth Conditions, and Light Treatments
The experiment was conducted at Nanjing Agricultural University using seedlings of the non-heading Chinese cabbage (Brassica campestris ssp. chinensis) inbred line ‘NHCC-001’. After the seedlings had developed one true leaf, they were transplanted into plastic pots (10 cm top diameter, 8.5 cm height, 7 cm bottom diameter) at one seedling per pot. The substrate consisted of peat, perlite, and vermiculite mixed at a volume ratio of 3:1:1. After transplantation, seedlings were grown in growth chambers (model SHK-500, Zhongyi Instruments, Guangzhou, China) under day/night temperatures of 22 °C/18 °C, a relative humidity of 70%, and a CO2 concentration of 400 ± 10 μmol·mol−1.
Experiment 1 (light intensity treatment): Seedlings were pre-cultured for 10 days under a photosynthetic photon flux density (PPFD) of 100 μmol·m−2·s−1 with an 8 h light/16 h dark (8L:16D) photoperiod. From day 11 onward, the PPFD was switched to 180 μmol·m−2·s−1 with a 16L:8D photoperiod, and the seedlings were grown for an additional 8 days.
Experiment 2 (photoperiod × light intensity treatment): Seedlings were pre-cultured for 10 days under a PPFD of 100 μmol·m−2·s−1 with an 8L:16D photoperiod. From day 11 onward, they were transferred to different combinations of photoperiod and light intensity for an additional 8 days, including 8L:16D (170, 320 μmol·m−2·s−1), 12L:12D (113, 213 μmol·m−2·s−1), 16L:8D (85, 160 μmol·m−2·s−1), and 20L:4D (68, 128 μmol·m−2·s−1).
Photoperiods were automatically controlled by electronic timers, with lights-on uniformly set at 06:00 (defined as ZT0) and lights-off adjusted according to the designated photoperiod. Tray positions were rotated daily to ensure uniform illumination, and plants were watered every 4 days with 500 mL per tray (containing eight pots).
Beginning on day 7 of the experimental treatment (the four-leaf-one-heart stage, approximately 20 days after sowing), leaf samples were collected every 4 h beginning at ZT0, for a total of 13 sampling time points covering two complete 24-h cycles. Within each treatment, samples at different time points were taken from the second uppermost fully expanded functional leaf of different plants, with three independent plants per time point serving as biological replicates. This leaf position was selected because it is functionally mature and representative of the source-leaf photosynthetic status, while avoiding the developmental heterogeneity of apical juvenile leaves and the senescence- and shading-related heterogeneity of basal leaves; the same leaf position was used for the gas-exchange measurements to ensure consistency between gene expression and photosynthetic data. Samples were immediately frozen in liquid nitrogen and stored at −80 °C until analysis.
On day 7 of the experimental treatment, the net photosynthetic rate () was measured using a portable photosynthesis–fluorescence system (LI-6800, LI-COR Biosciences, Lincoln, NE, USA). Measurements were conducted at an airflow rate of 500 μmol·s−1, a temperature of 22 ± 1 °C, a relative humidity of 70–80%, and a CO2 concentration of 400 μmol·mol−1, with the measurement light intensity matched to that of each treatment. Five plants were randomly selected per treatment, and was measured on the second uppermost fully expanded functional leaf of each plant, corresponding to the same leaf position used for gene-expression sampling. Each plant was considered an independent biological replicate (n = 5). Results are presented as the mean ± standard deviation (SD).
2.2. RNA Extraction and RT-qPCR Analysis
Total RNA was extracted from leaf tissues using the Hi-Pure Plant Total RNA Kit for polysaccharide- and polyphenol-rich samples (TSP0202, Tsingke Biotechnology, Beijing, China). RNA integrity and purity were assessed by 1.2% agarose gel electrophoresis, and RNA concentration and purity (A260/A280 and A260/A230 ratios) were determined using a microvolume UV spectrophotometer (NanoDrop ND-1000, Thermo Fisher Scientific, Wilmington, DE, USA). Equal amounts of total RNA were reverse-transcribed into cDNA using the SynScript® III RT SuperMix for qPCR kit (Tsingke Biotechnology) according to the manufacturer’s instructions. The resulting cDNA was diluted 8-fold and used as the template for quantitative PCR.
The expression levels of circadian clock-related photosynthetic genes were quantified by real-time quantitative PCR (RT-qPCR). Gene-specific primers were designed based on the gene sequences using the online tool Primer-BLAST (using Primer3 and BLAST) (https://www.ncbi.nlm.nih.gov/tools/primer-blast/, accessed on 24 April 2026); primer sequences are provided in Supplementary Table S1. qPCR was performed on a Bio-Rad CFX96 Real-Time PCR system using the ArtiCanCEO SYBR qPCR Mix (Tsingke Biotechnology). The amplification program was as follows: initial denaturation at 95 °C for 5 min, followed by 40 cycles of 95 °C for 15 s, 60 °C for 20 s, and 72 °C for 20 s. After amplification, a melting-curve analysis was conducted to confirm product specificity using the following program: 95 °C for 15 s, 65 °C for 1 min, and a gradual increase from 65 °C to 95 °C at a rate of 0.1 °C/s with continuous fluorescence acquisition.
BcGAPDH (BcC09g068080) was used as the internal reference gene for normalization, and each sample was analyzed in three biological replicates. Relative expression levels were calculated using the 2−ΔΔCt method [30], with amplification efficiencies and reference-gene stability assessed according to the MIQE guidelines.
2.3. Measurement of Relative Chlorophyll Content
The relative chlorophyll content (SPAD value) of leaves was measured using a portable chlorophyll meter (SPAD-502, Konica Minolta, Osaka, Japan). Measurements were conducted at the middle of the light period of each treatment (ZT4 for 8L:16D, ZT6 for 12L:12D, ZT8 for 16L:8D, and ZT10 for 20L:4D) on the second uppermost functional leaf of each plant. Five biological replicates were used per treatment, with the measured value of each plant representing one replicate.
2.4. Genetic Regulatory Network
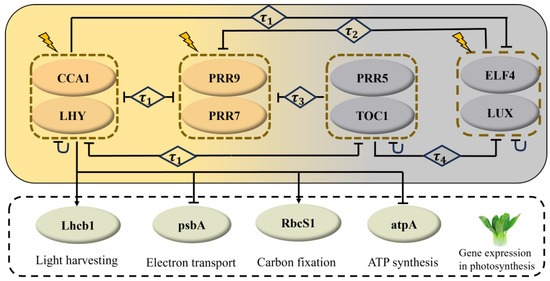
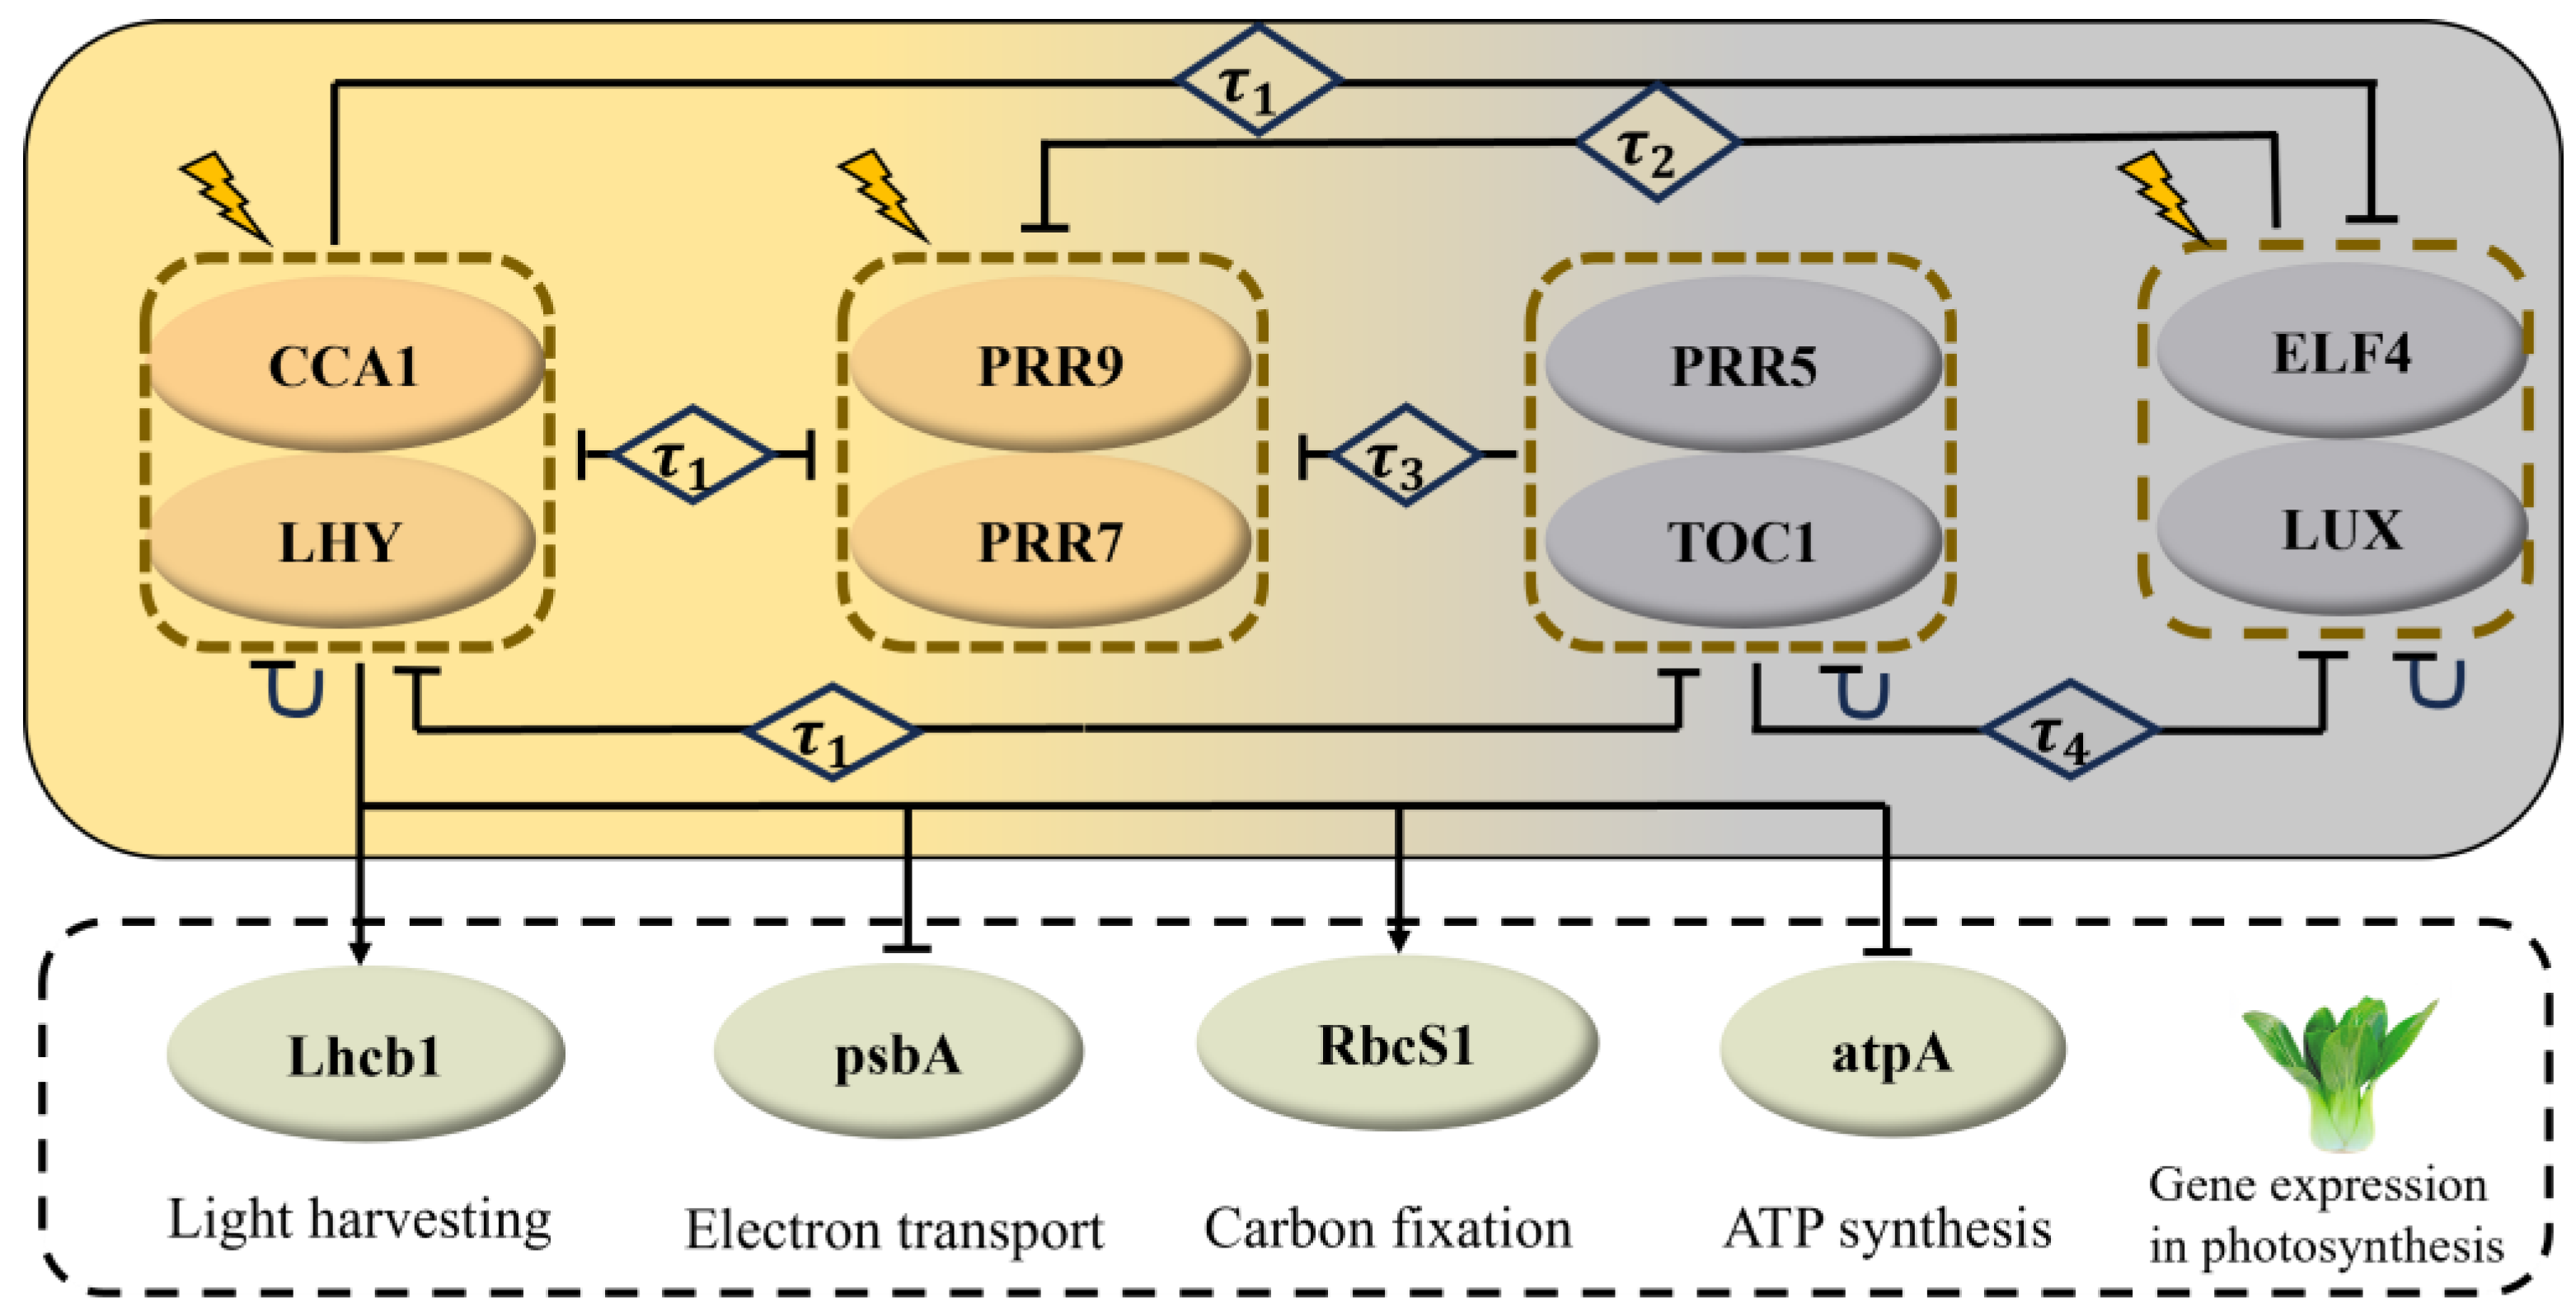
The circadian rhythm system primarily consists of three components: input signals, a central oscillator, and output signals [31]. Key components of this system include CIRCADIAN CLOCK ASSOCIATED 1 (CCA1), LATE ELONGATED HYPOCOTYL (LHY), PSEUDO RESPONSE REGULATOR (PRR) gene family, TIMING OF CAB EXPRESSION 1 (TOC1), EARLY FLOWERING 4 (ELF4), and LUX ARRHYTHMO (LUX). Together, these components form multiple interlinked negative feedback loops [24,25], constituting a complex gene regulatory network. Based on these regulatory relationships among clock genes, we constructed a regulatory network for the core clock genes of non-heading Chinese cabbage (Figure 1).
Figure 1.
Circadian clock-regulated photosynthetic gene network. Arrows indicate activation, blunt arrows indicate inhibition, lightning symbols represent light signals, and plant icons denote non-heading Chinese cabbage. denotes a transcriptional time delay.
In the circadian output pathway, CCA1 promotes the transcription of Lhcb1 and RbcS1 while suppressing the expression of psbA and atpA [32]. Based on this relationship, we constructed an integrated regulatory network for photosynthesis-related genes (Figure 1, within the black dashed box). This network was then used to develop a mathematical model for simulating and predicting the effects of different light conditions on photosynthesis.
2.5. Model Equations
Based on the circadian-clock-regulated photosynthetic gene network (Figure 1), we developed a dynamical model to characterize how the circadian clock controls photosynthesis. Following Xiao and Cao [33], Ukai-Tadenuma et al. [34], and Tokuda et al. [35], the model incorporates transcriptional time delays, which are crucial for maintaining circadian rhythms in clock-component expression.
Equations (S1)–(S8) describe the changes in mRNA and protein concentrations of the core clock genes CCA1/LHY (CL), PRR7/PRR9 (P97), PRR5/TOC1 (P51), and ELF4/LUX (EL), respectively. Equation (S9) describes the dynamics of P, a non-clock-regulated variable representing a group of proteins that accumulate during darkness and are rapidly degraded following light exposure. These proteins mediate the acute transcriptional response at the dark-to-light transition. Equations (S10)–(S17) describe the changes in mRNA and protein concentrations of the photosynthetic genes Lhcb1, psbA, RbcS1, and atpA, respectively. In the model, P modulates the light-input terms and in Equations (S18) and (S19), which enter the transcription equations for CL and P97, respectively. Through their effects on the circadian-clock network, these light-input terms indirectly affect the expression of photosynthesis-related genes and the simulated (see Supplementary Materials).
2.6. Parameter Estimation
The model contained 57 free parameters, all of which were estimated simultaneously by minimizing a cost function incorporating the experimentally measured expression profiles of both circadian-clock and photosynthesis-related genes. Among these parameters, 37 governing the circadian-clock module were initialized based on Greenwood et al. [36], whereas the remaining 20 governed the photosynthesis-related gene module. The joint calibration used 104 data points from eight circadian-clock genes (CCA1, LHY, PRR7, PRR9, PRR5, TOC1, ELF4, and LUX) and 52 data points from four photosynthesis-related genes (Lhcb1, psbA, RbcS1, and atpA), with all genes measured at 13 time points. The cost function was defined as the sum of the per-gene mean squared normalized residuals:
where and denote the experimentally measured and simulated mRNA levels of gene g at the i-th time point, respectively. Each gene was normalized by the minimum value of its measured time series to balance the contributions of genes with different expression abundances.
We optimized the parameter set by employing a genetic algorithm and a simulated annealing algorithm implemented in MATLAB’s Global Optimization Toolbox, and performed multiple simulations with different initial parameter sets to avoid converging to local optima, thus obtaining the optimal parameter set (Table S2). Goodness of fit was quantified by the root mean square error (RMSE) and the coefficient of determination () between the simulated and measured profiles (Section 3.1, Section 3.2, Section 3.3 and Section 3.4). Parameter sensitivity and local robustness were evaluated using ±10% parameter perturbations and partial rank correlation coefficients (PRCC) under ±30% perturbations (Section 3.6). The 95% confidence intervals of selected high-sensitivity parameters were estimated by residual bootstrap resampling with 150 replicates and are listed in Supplementary Table S3. These analyses characterize local parameter sensitivity and uncertainty but do not fully establish parameter uniqueness or propagate parameter uncertainty to all model predictions.
2.7. Numerical Simulations
All numerical simulations were performed using MATLAB R2021b with the built-in delay equation solver dde23. The model was entrained under 8L:16D conditions with a light intensity of 100 μmol·m−2·s−1 for 240 h to ensure that the system reached a stable oscillation. The model was subsequently entrained for 480 h under each photoperiod–light-intensity treatment. The first 200 h after each transition were discarded as transient dynamics. The final six complete cycles were used to calculate the periods, phases, and amplitudes of the gene-expression rhythms and to quantify photosynthetic carbon assimilation.
3. Results
3.1. Experimental Expression Patterns and Model Calibration
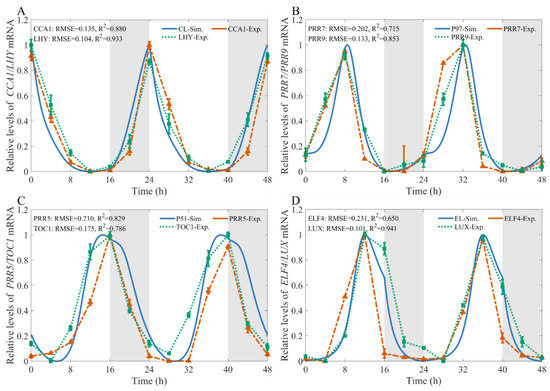
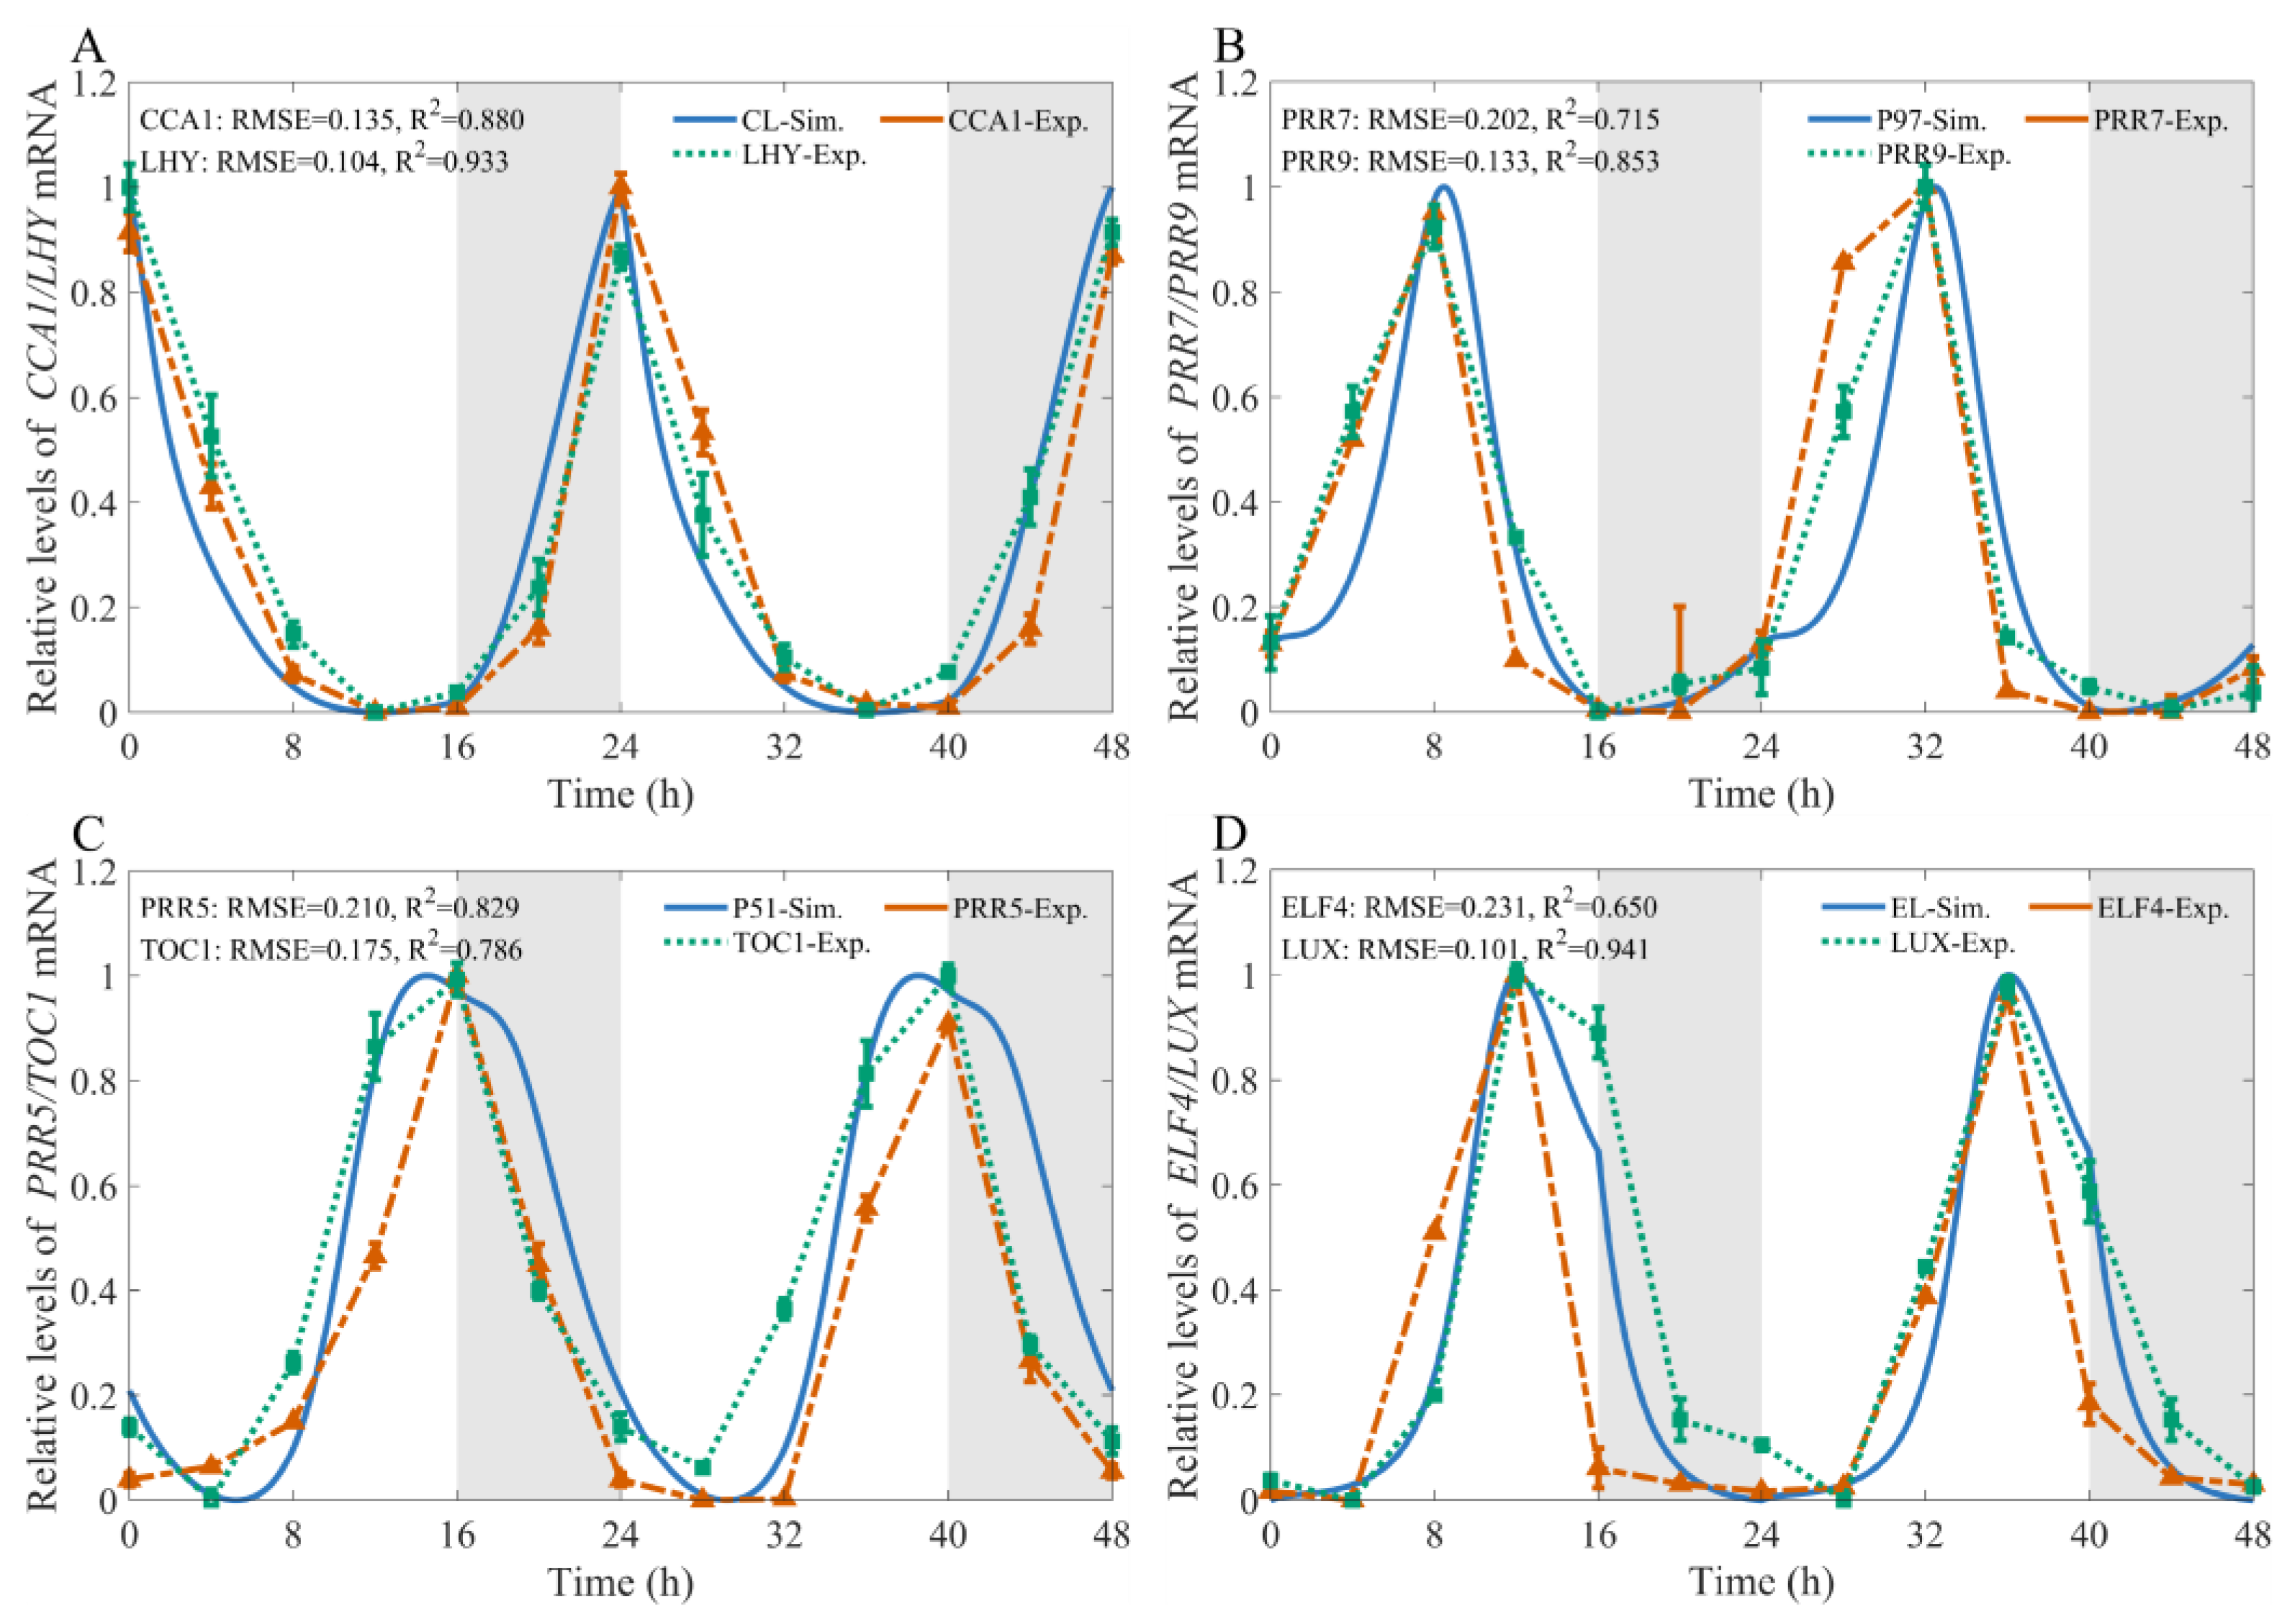
The relative transcript levels of core circadian clock genes were determined by RT-qPCR (see Tables S4–S6 in the Supplementary Materials). Under 16L:8D conditions, the core circadian clock genes exhibited clear rhythmic expression patterns. As shown in Figure 2, CCA1 and LHY displayed similar expression dynamics: transcript levels decreased rapidly after light exposure, reached a minimum at ZT12, and then gradually accumulated and peaked at dawn. PRR9 and PRR7, which are morning-expressed genes, reached their peak expression at ZT8, followed by a rapid decline to minimum levels at dusk (ZT16), and gradual accumulation during the night. PRR5 and TOC1 showed more complex expression patterns. Their transcript levels increased during the daytime, peaked around dusk, and then decreased rapidly during the night. In contrast, ELF4 and LUX showed delayed expression patterns. Their transcript levels declined after the ZT12 peak and remained low during the night, before increasing again after ZT4 in the following light period.
Figure 2.
Experimental and simulated expression profiles under 16L:8D conditions with a light intensity of 180 μmol·m−2·s−1. Experimentally measured and simulated mRNA levels of (A) CCA1/LHY, (B) PRR7/PRR9, (C) PRR5/TOC1, and (D) ELF4/LUX. Experimental data were obtained from three biological replicates and are presented as the mean ± SD. Experimental and simulated time series were independently normalized using min–max scaling. Grey shaded areas indicate dark periods.
Under the optimized parameter set, the model reproduced the diurnal expression dynamics of core circadian clock genes under the 16L:8D photoperiod condition. To quantitatively evaluate the consistency between model simulations and experimentally measured mRNA abundance, RMSE and were calculated for each gene, where indicates the strength of the linear association between the two datasets. Most clock genes, including CCA1, LHY, PRR7, PRR9, TOC1, PRR5, and LUX, exhibited relatively low RMSE values (0.101–0.210) and high values (0.715), indicating agreement between simulated and observed temporal expression profiles. In contrast, ELF4 showed a relatively higher RMSE (0.231) and a lower value (0.650) (see Figure 2D). Overall, the model reproduced the principal temporal features of most core circadian clock genes under the tested photoperiod, although its performance varied among individual genes.
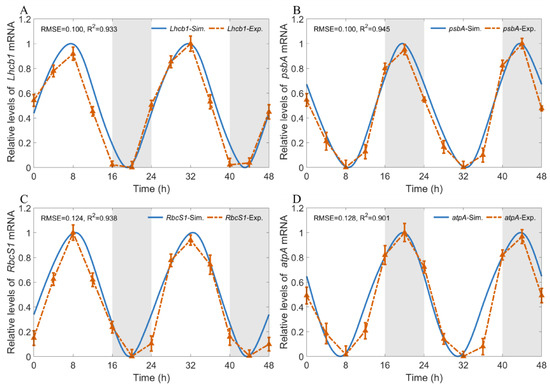
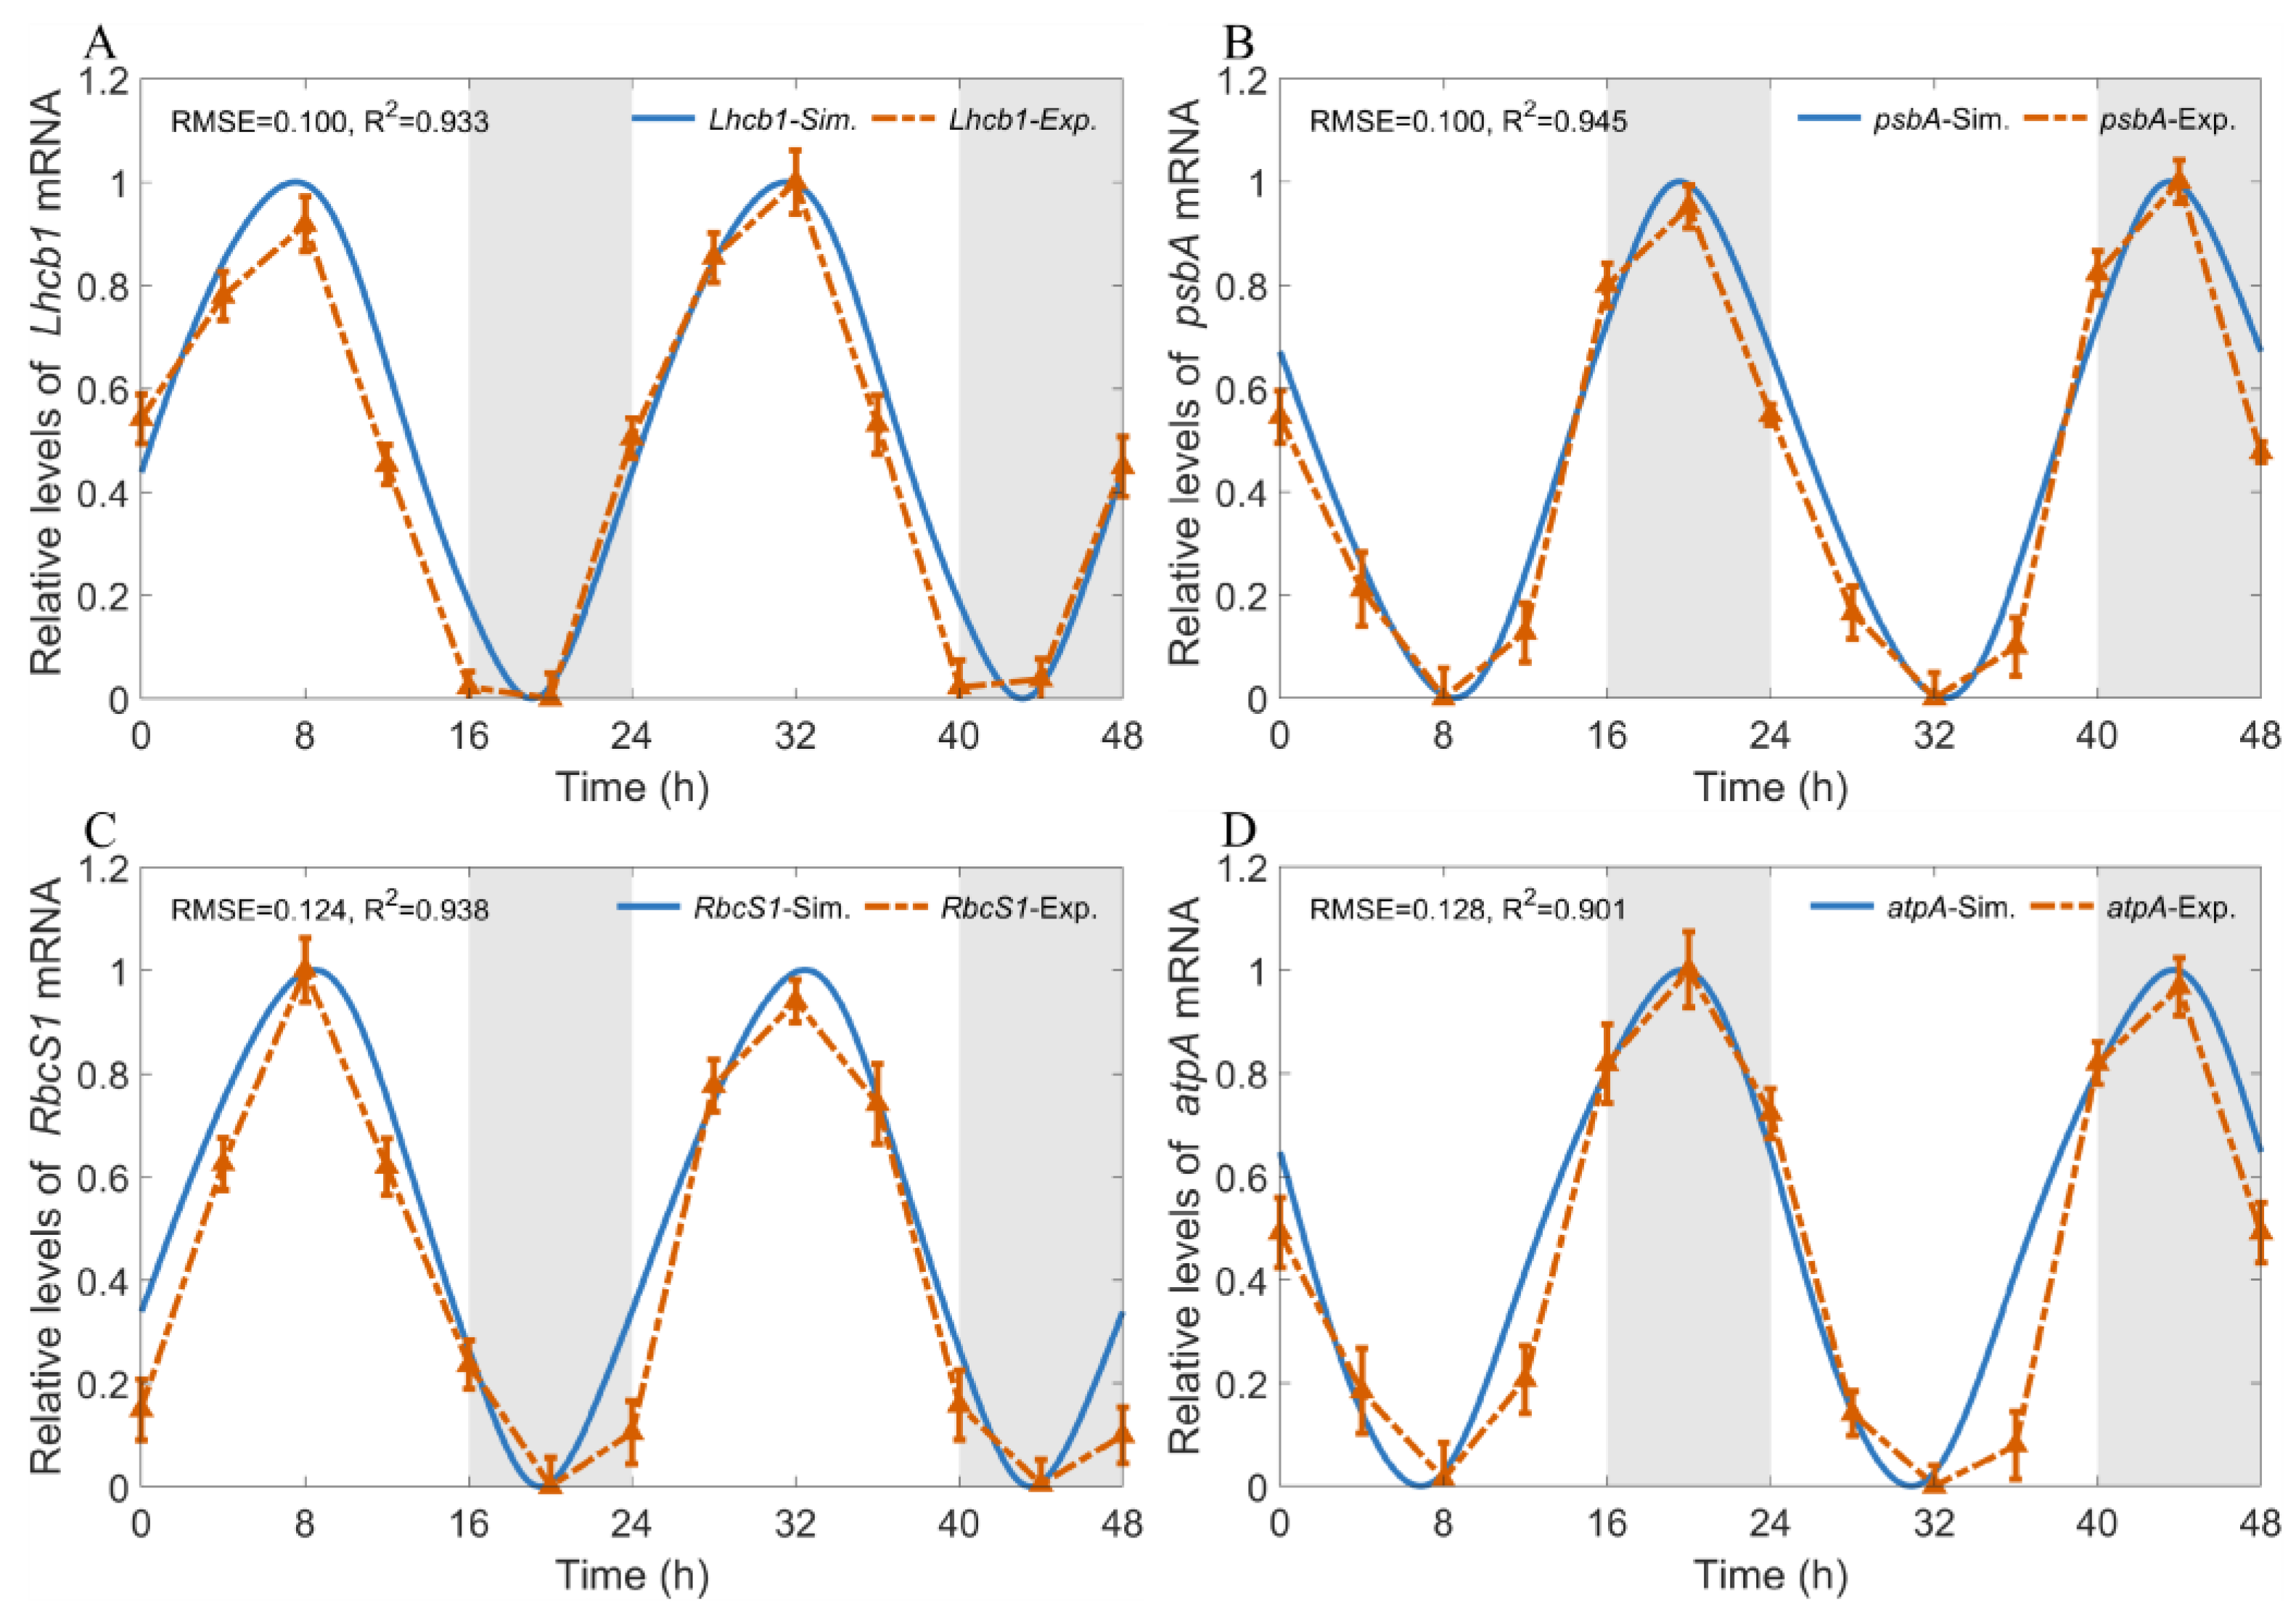
Under the same 16L:8D conditions, all four photosynthesis-related genes exhibited clear diurnal oscillations (Figure 3). Specifically, Lhcb1, which encodes the light-harvesting chlorophyll a/b-binding protein, and RbcS1, which encodes the small subunit of Rubisco, displayed similar expression patterns: their transcript abundances increased progressively after lights-on, peaked at ZT8, and then declined rapidly to a trough during the early dark period (Figure 3A,C). By contrast, psbA and atpA showed opposite circadian phases: their expression levels decreased after lights-on, reached a minimum at ZT8, and then recovered rapidly, peaking at ZT20 during the dark period (Figure 3B,D). These results indicate that the circadian phases of different photosynthetic genes differ markedly under the same photoperiod, suggesting that their temporal regulation by the circadian clock occurs at distinct time windows.
Figure 3.
Experimental and simulated expression profiles under 16L:8D conditions with a light intensity of 180 μmol·m−2·s−1. Experimentally measured and simulated mRNA levels of (A) Lhcb1, (B) psbA, (C) RbcS1, and (D) atpA. Experimental data were obtained from three biological replicates and are presented as the mean ± SD. Experimental and simulated time series were independently normalized using min–max scaling. Grey shaded areas indicate dark periods.
The simulated profiles were broadly consistent with the experimental observations and captured the principal phases, peaks, and troughs. The values for Lhcb1, psbA, RbcS1, and atpA were 0.933, 0.945, 0.938, and 0.901, respectively, and the corresponding RMSE values were 0.100, 0.100, 0.124, and 0.128. Among these, psbA demonstrated the most accurate fit, whereas atpA exhibited the largest relative deviation, with only minor discrepancies observed at specific time points. Overall, this model effectively recapitulates the daily transcription dynamics of photosynthetic genes under a 16L:8D photoperiod, indicating that the model captured the principal transcriptional patterns of these photosynthesis-related genes under the calibration condition.
3.2. Validation of CCA1 Expression Dynamics Under Additional Light Treatments
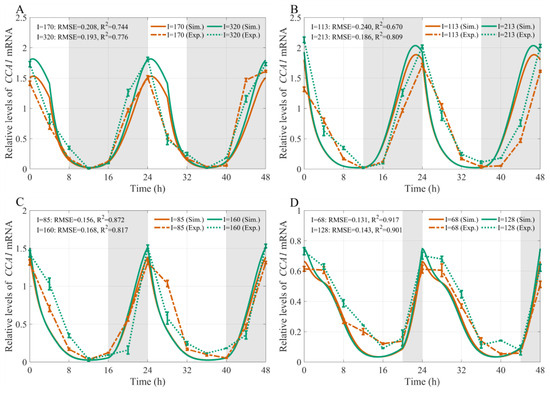
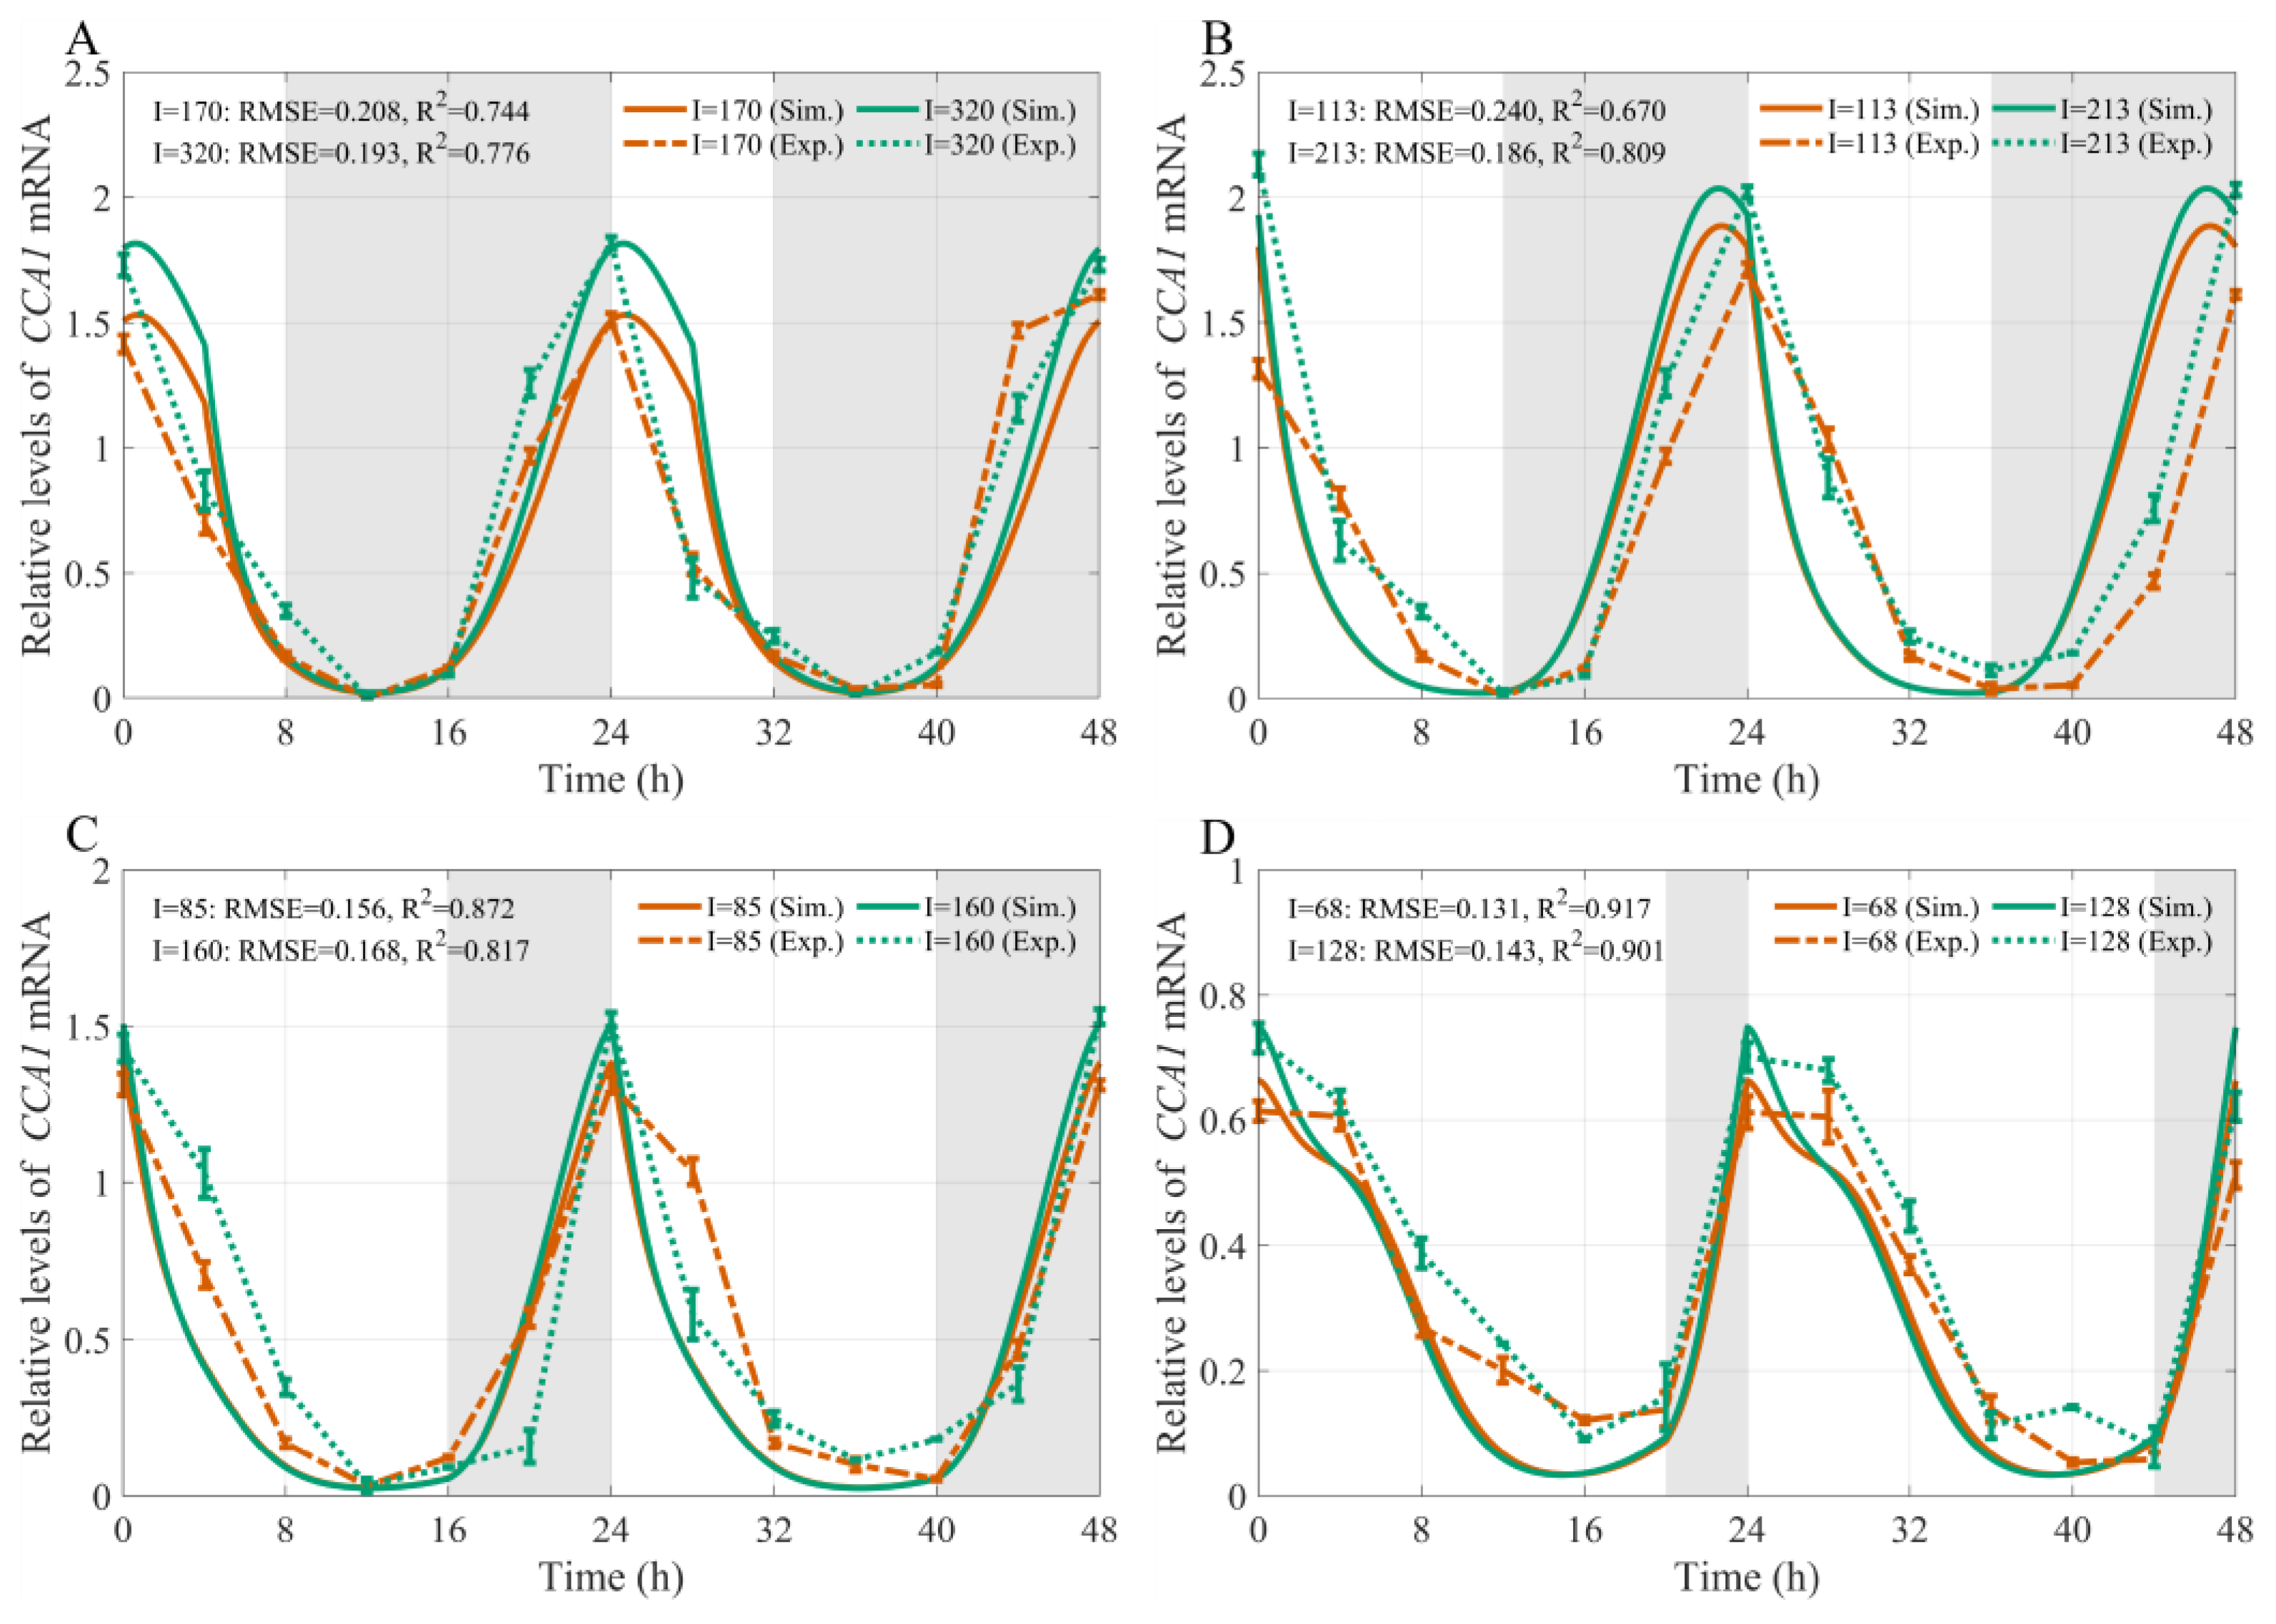
To evaluate model performance under light conditions not used for parameter estimation, simulated CCA1 expression profiles were compared with experimental measurements obtained under eight additional photoperiod–light-intensity combinations (Figure 4). Under two constant DLI conditions, the model-simulated time-course profiles of the core clock gene CCA1 show a high degree of consistency with the experimentally observed expression curves in terms of the timing of peak and trough expression during the diurnal light–dark cycle.
Figure 4.
Comparison of model simulations and experimental measurements of the diurnal profiles of relative CCA1 mRNA expression in non-heading Chinese cabbage under different photoperiod and light intensity treatments. (A–D) correspond to 8L:16D (I = 170, 320 μmol·m−2·s−1), 12L:12D (I = 113, 213 μmol·m−2·s−1), 16L:8D (I = 85, 160 μmol·m−2·s−1), and 20L:4D (I = 68, 128 μmol·m−2·s−1) photoperiod treatments, respectively. Solid and dashed lines represent model simulations and experimental measurements, respectively. Orange and green lines denote the low- and high-light-intensity treatments, respectively. Experimental data were obtained from three biological replicates and are presented as the mean ± SD. Grey shaded areas indicate dark periods.
Under the 8L:16D, 12L:12D, and 16L:8D treatments, CCA1 expression reached a maximum near the beginning of the light period, declined during the subsequent light phase, and recovered before or after the next dark-to-light transition (Figure 4A–C). Within each photoperiod, the lower- and higher-light treatments showed broadly similar peak and trough timing, whereas the higher-light treatment generally produced a higher peak expression level and a larger oscillation amplitude. Under 20L:4D, CCA1 expression exhibited a lower absolute peak, a relatively elevated trough, and a broader expression peak compared with the shorter-photoperiod treatments (Figure 4D).
Comparisons between the simulated and experimental data reveal broad agreement in dynamic patterns, with minor discrepancies observed during the gene’s low-expression phases. The values of all groups exceed 0.670, with the treatments at 68 μmol·m−2·s−1 and 128 μmol·m−2·s−1 achieving the highest values of 0.917 and 0.901, respectively. The overall RMSE remains at a relatively low level, demonstrating that the model captured the principal CCA1 expression patterns under the examined treatment combinations. The temporal and amplitude differences should therefore be interpreted as responses to the combined photoperiod–light intensity treatments rather than as independent effects of either factor.
3.3. Calibration and Validation of the Net Photosynthetic-Rate Model
To explore how circadian-regulated gene expression is associated with diurnal changes in net photosynthetic rate, we modified and extended a previously reported photosynthetic light-response model by incorporating circadian regulation and photosynthesis-related gene expression [37]. The model integrated three components: direct light-intensity response, circadian regulation, and photosynthesis-related gene expression. Previous studies in pakchoi showed that BrCCA1 directly binds to the BrLhcb1 promoter, increases BrLhcb1 expression, enhances carbon fixation, and significantly increases , supporting a link between circadian regulation and photosynthetic performance [38]. Moreover, Lhcb1 represents light-harvesting capacity, psbA encodes the D1 protein of photosystem II, RbcS1 is associated with Rubisco-mediated CO2 fixation, and atpA is related to chloroplast ATP synthesis [39,40,41,42]. Accordingly, CL was included as a circadian regulatory factor, and the modeled protein levels corresponding to Lhcb1, psbA, RbcS1, and atpA were used to represent key components of photosynthetic capacity. The equation was defined as follows:
where
Here , and denote the modeled protein levels of CL, P97 and P51, and represents the modeled protein level of Lhcb1, psbA, RbcS1, and atpA, respectively. These state variables are used as regulatory proxies for the circadian-regulated contributions associated with the corresponding photosynthetic processes; they do not represent enzyme activities or the total abundance of the complete photosynthetic complexes. is the regulatory coefficient, and () are the half-saturation constants of CL, P97, P51, Lhcb1, psbA, RbcS1, and atpA on in non-heading Chinese cabbage.
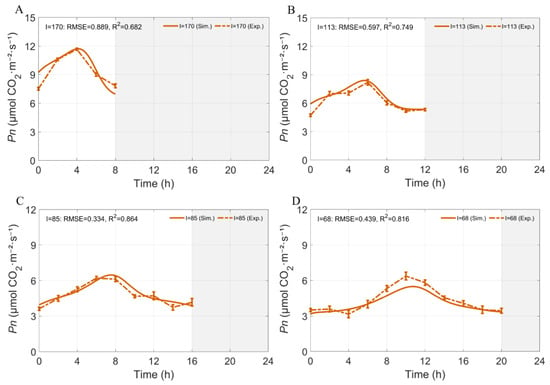
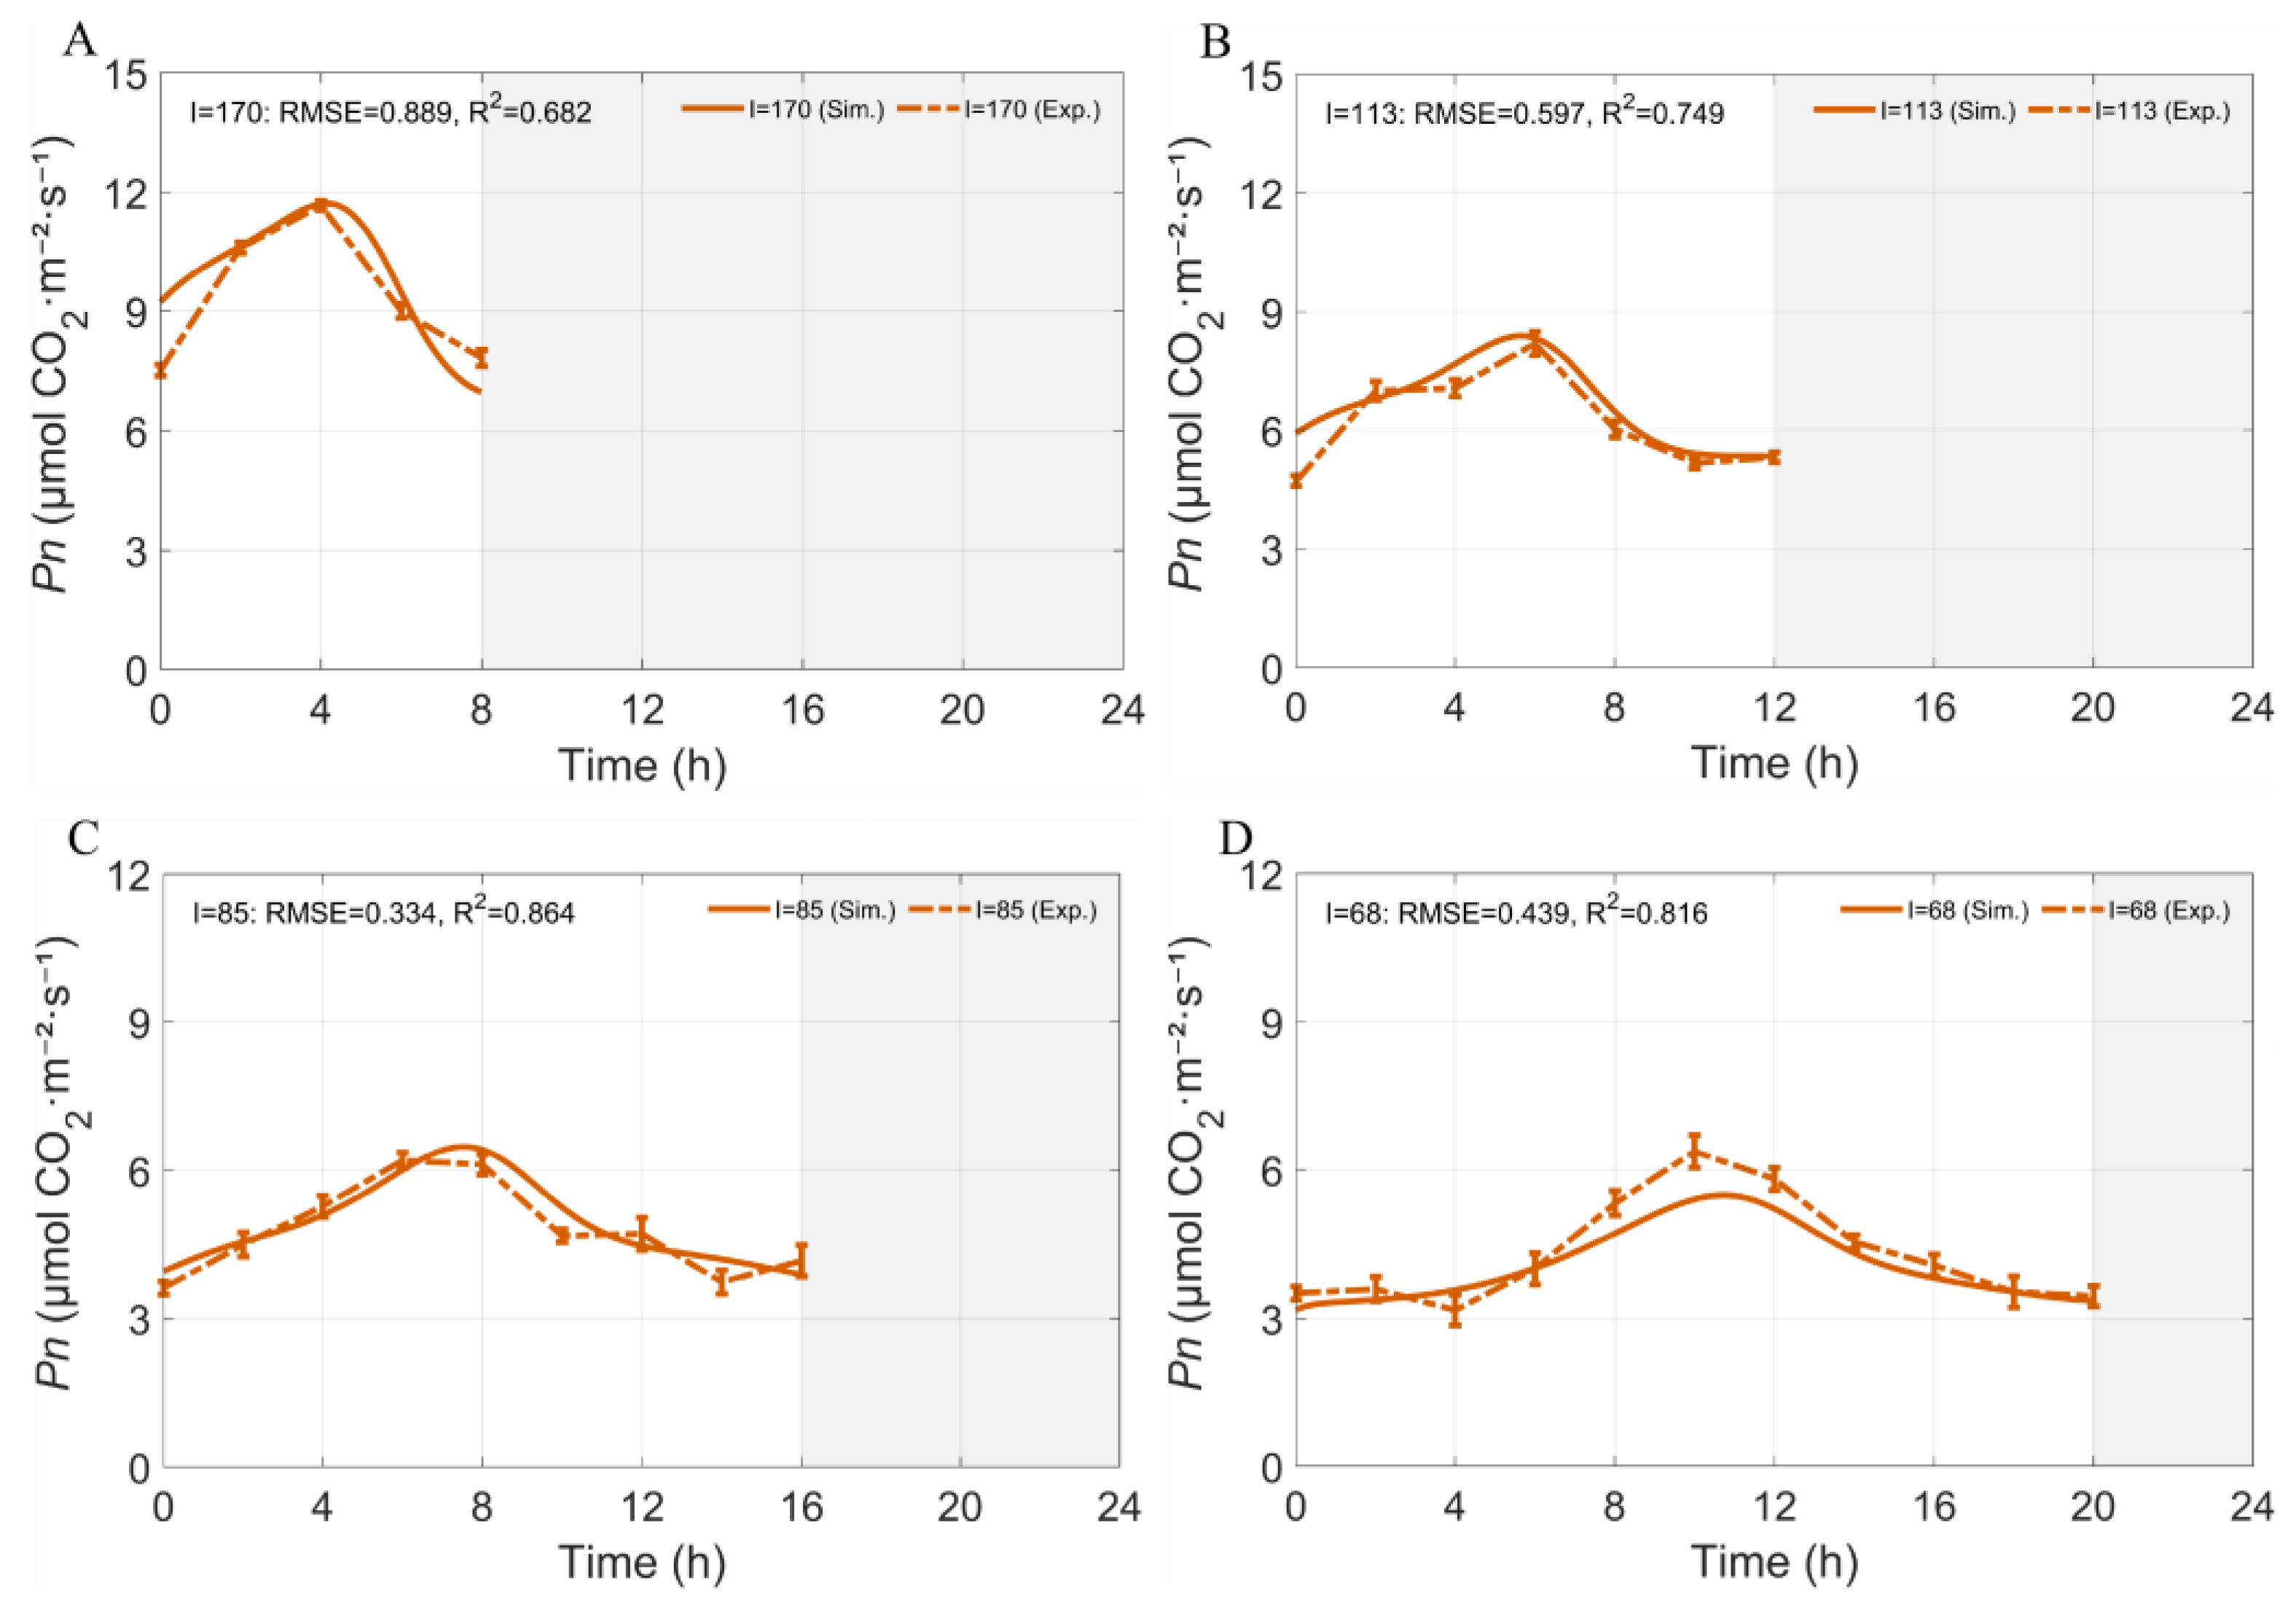
In Equation (1), denotes the light intensity, is the light-saturated net photosynthetic rate, is the initial quantum efficiency, and represents the dark respiration rate. Parameters in model (1) were estimated by minimizing the difference between simulated and measured , with simulations conducted at DLI = 4.896 mol·m−2·d−1 and measurements obtained from the photoperiod–light intensity combinations shown in Figure 5. All parameter values are given in Table S7 of the Supplementary Materials.
Figure 5.
Comparison of simulated and measured of non-heading Chinese cabbage under different photoperiod–light intensity combinations at DLI = 4.896 mol·m−2·d−1. (A) 8L:16D photoperiod (170 μmol·m−2·s−1); (B) 12L:12D photoperiod (113 μmol·m−2·s−1); (C) 16L:8D photoperiod (85 μmol·m−2·s−1); (D) 20L:4D photoperiod (68 μmol·m−2·s−1). Solid and dashed lines represent model simulations and corresponding experimental measurements, shown as mean ± SD (n = 5) respectively. Grey shaded areas indicate dark periods.
Under the calibration DLI of 4.896 mol·m−2·d−1, the model generally reproduced the measured diurnal dynamics across the four photoperiod–light-intensity combinations (Figure 5). As the photoperiod increased from 8 to 20 h and the corresponding light intensity decreased, the timing of peak was progressively delayed. The ranged from 0.682 to 0.864, with RMSE values ranging from 0.334 to 0.889 µmol CO2·m−2·s−1. The best agreement was observed under 16L:8D ( = 0.864, RMSE = 0.334), whereas the 8L:16D treatment showed the largest deviation ( = 0.682, RMSE = 0.889). Overall, the model captured the principal temporal patterns of under the calibration conditions, although fitting performance varied among treatments.
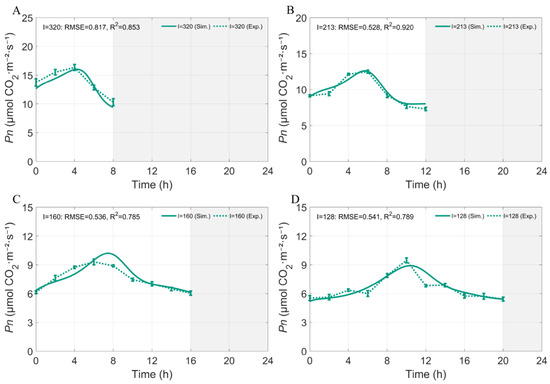
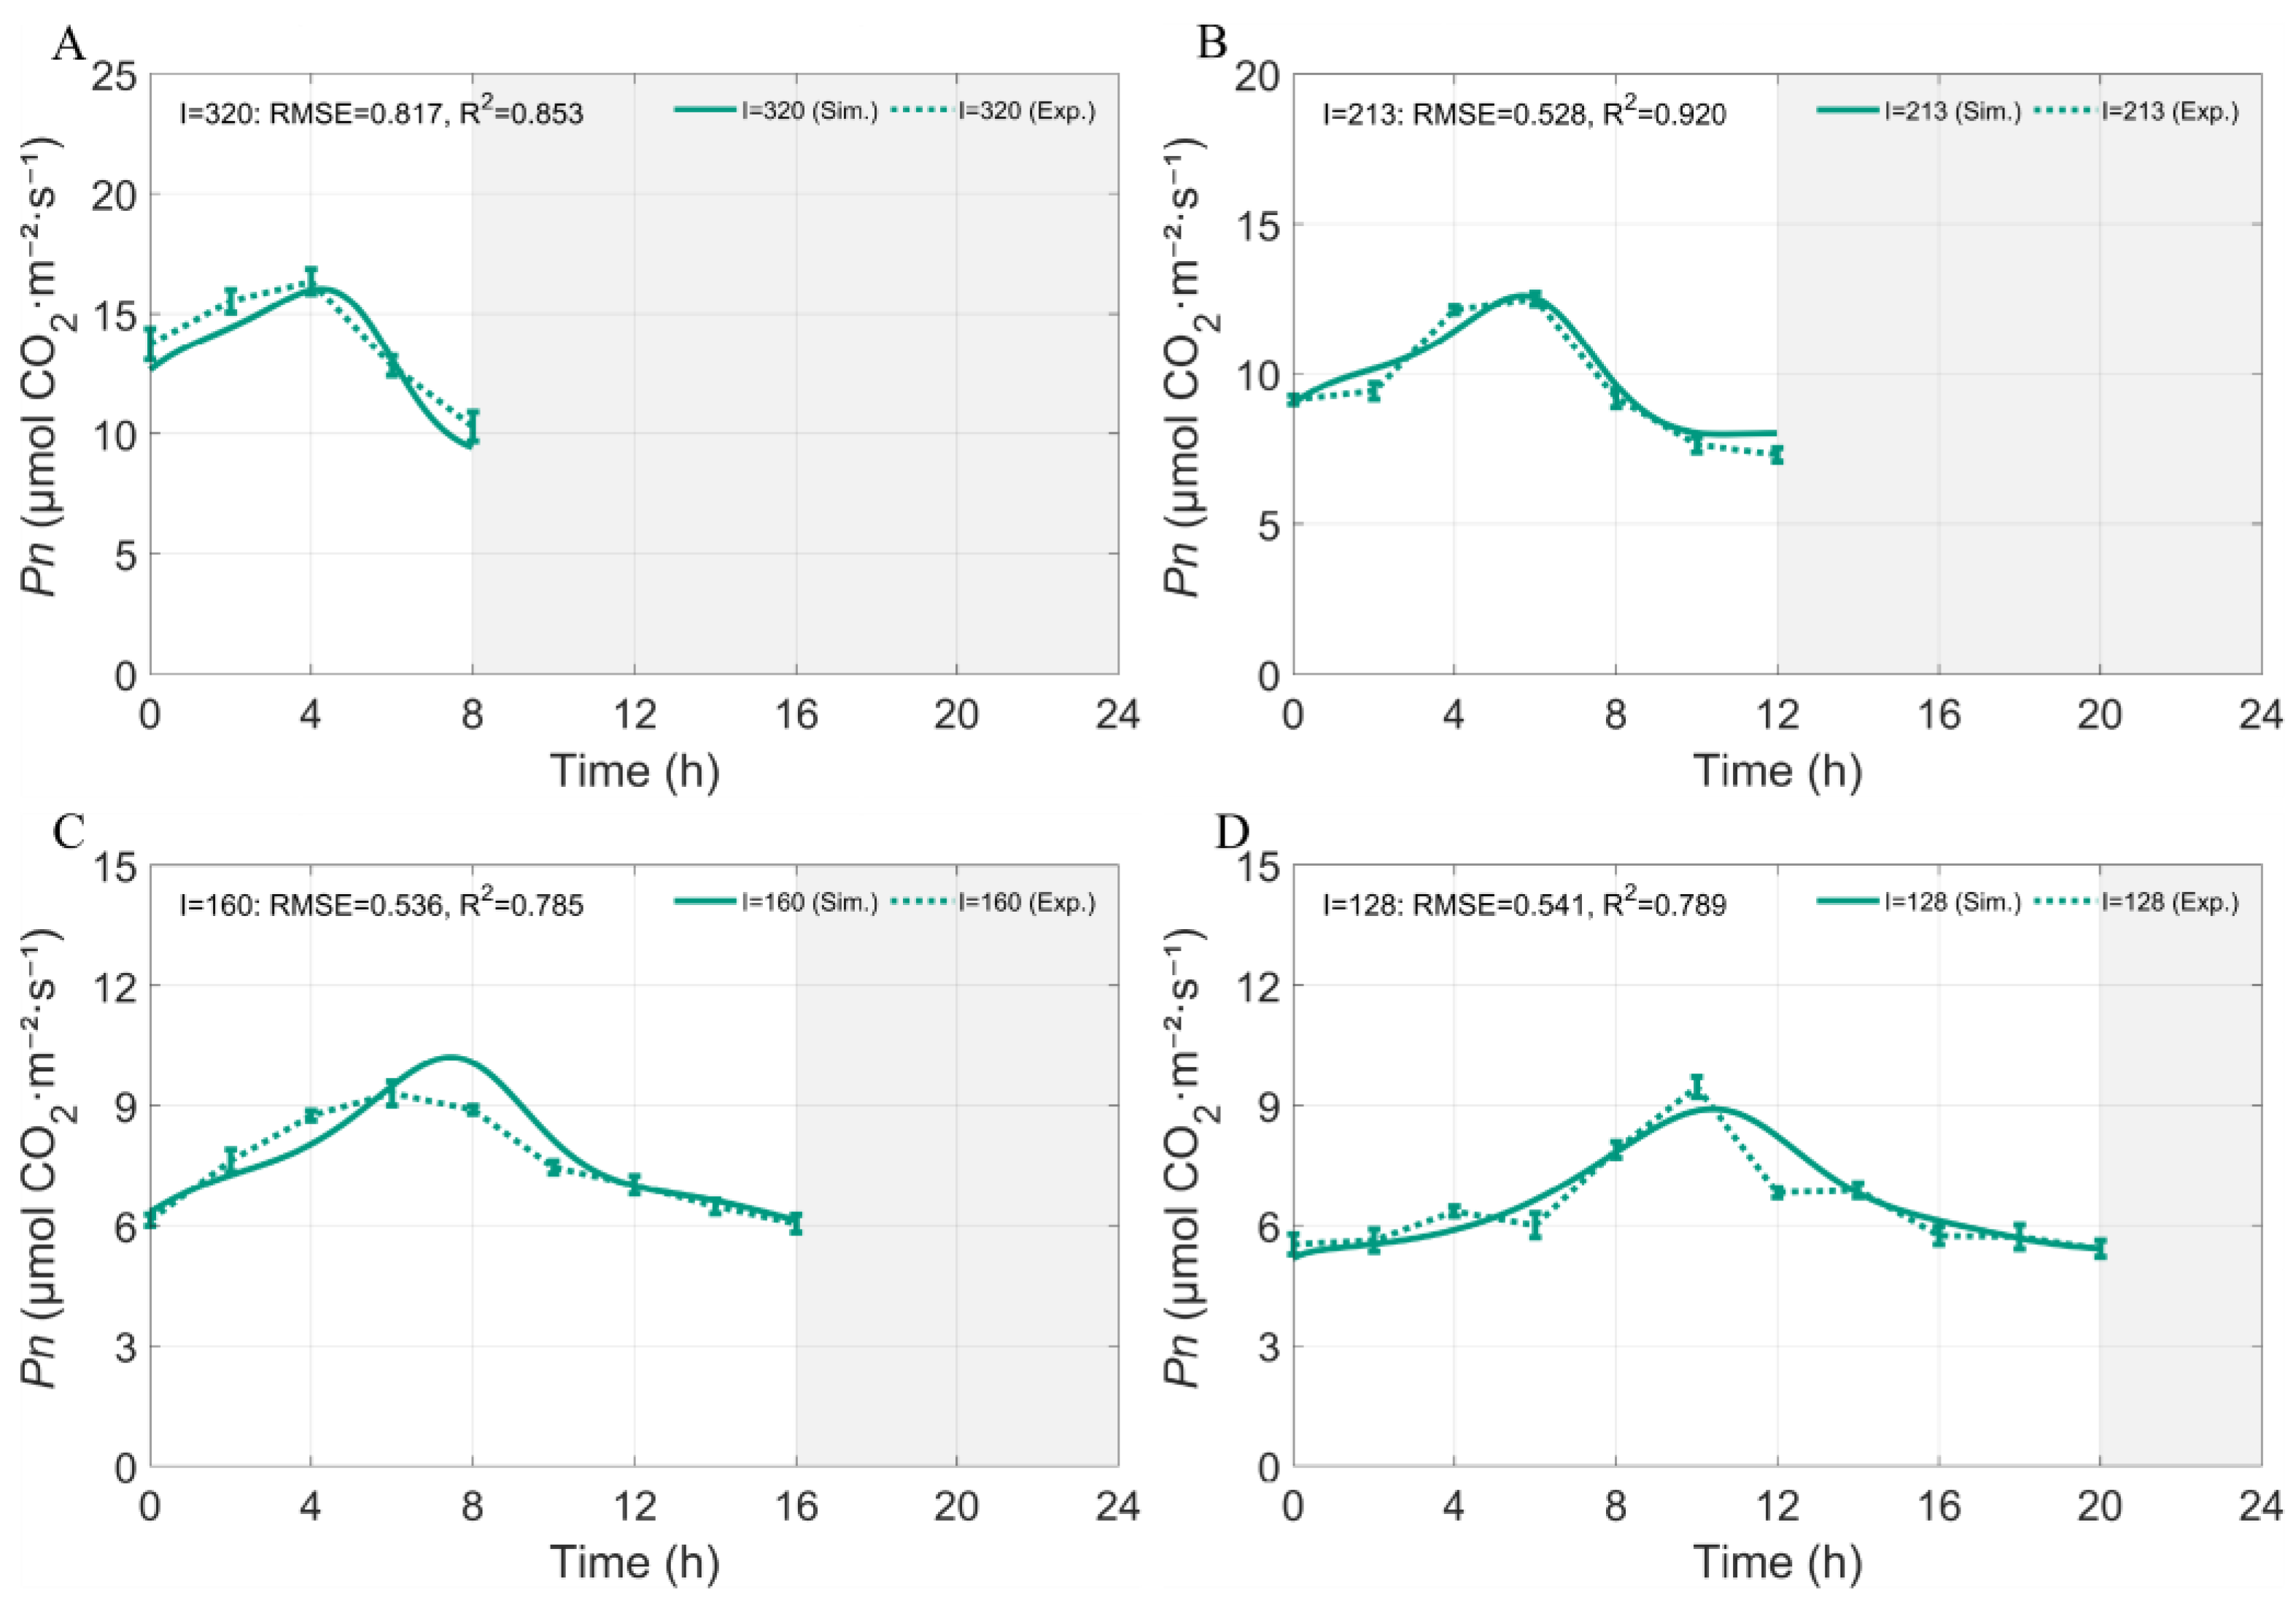
To further validate the model in Equation (1), a higher DLI of 9.216 mol·m−2·d−1 was applied, and four light intensity–photoperiod combinations were established (Figure 6A–D). At an equal DLI, the light intensity–photoperiod combination modulated the diurnal dynamics of . As the photoperiod was extended with a corresponding reduction in light intensity, the amplitude of the peak gradually declined, and the timing of the peak was progressively delayed.
Figure 6.
Validation of measured and simulated of non-heading Chinese cabbage under different photoperiod–light intensity combinations at DLI = 9.216 mol·m−2·d−1. (A) 8L:16D photoperiod (320 μmol·m−2·s−1); (B) 12L:12D photoperiod (213 μmol·m−2·s−1); (C) 16L:8D photoperiod (160 μmol·m−2·s−1); (D) 20L:4D photoperiod (128 μmol·m−2·s−1). Solid and dashed lines represent model simulations and corresponding experimental measurements, shown as mean ± SD (n = 5) respectively. Grey shaded areas indicate dark periods.
Under 8L:16D (Figure 6A), increased rapidly after light onset, reaching a peak of approximately 16–17 μmol CO2·m−2·s−1 within about 4 h, the highest among the four treatments, followed by a sharp decline, with remaining at a relatively low level toward the end of the light period. When the photoperiod was extended to 12L:12D (Figure 6B), peaked at 4–6 h after light onset at approximately 13 μmol CO2·m−2·s−1, with a slightly lower and later peak than that under 8L:16D, followed by a rapid decline. Under 16L:8D (Figure 6C), the peak was further delayed to 6–8 h and decreased to approximately 9.5–10 μmol CO2·m−2·s−1, with a generally lower photosynthetic level and a gradual decline after the peak. Under 20L:4D (Figure 6D), the peak was postponed to 8–10 h, with a peak value of approximately 9–9.5 μmol CO2·m−2·s−1.
The simulated (Sim.) and measured (Exp.) values exhibited generally consistent trends. The model reproduced the core pattern that, under equal DLI, extending the photoperiod with reduced light intensity lowered the peak and delayed its occurrence. Among the treatments, the short-photoperiod–high-light-intensity treatment (8L:16D) exhibited a relatively large RMSE, indicating some discrepancy between simulation and measurement, whereas the other three treatments had values of 0.785–0.920 and RMSE values of 0.528–0.541 µmol CO2·m−2·s−1.
Taken together, even at a constant DLI, the combination of light intensity and photoperiod altered the diurnal dynamics of : short-photoperiod–high-light-intensity conditions favored a higher instantaneous peak, whereas long-photoperiod–low-light-intensity conditions resulted in a reduced and delayed peak. The model adequately captured these response characteristics, supporting the applicability of the model under the tested DLI and photoperiod–light intensity combinations.
3.4. Estimation of Light-Period Net CO2 Assimilation and Its Response to Photoperiod and Light Intensity
Carbon assimilation is a direct product of photosynthesis and serves as a crucial indicator of leaf photosynthetic productivity and the capacity for carbon fixation. Light-period net CO2 assimilation is the time-integrated outcome of net photosynthesis. We therefore calculated it by integrating instantaneous over the light period:
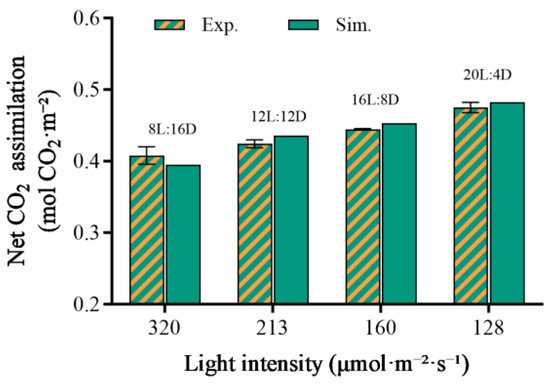
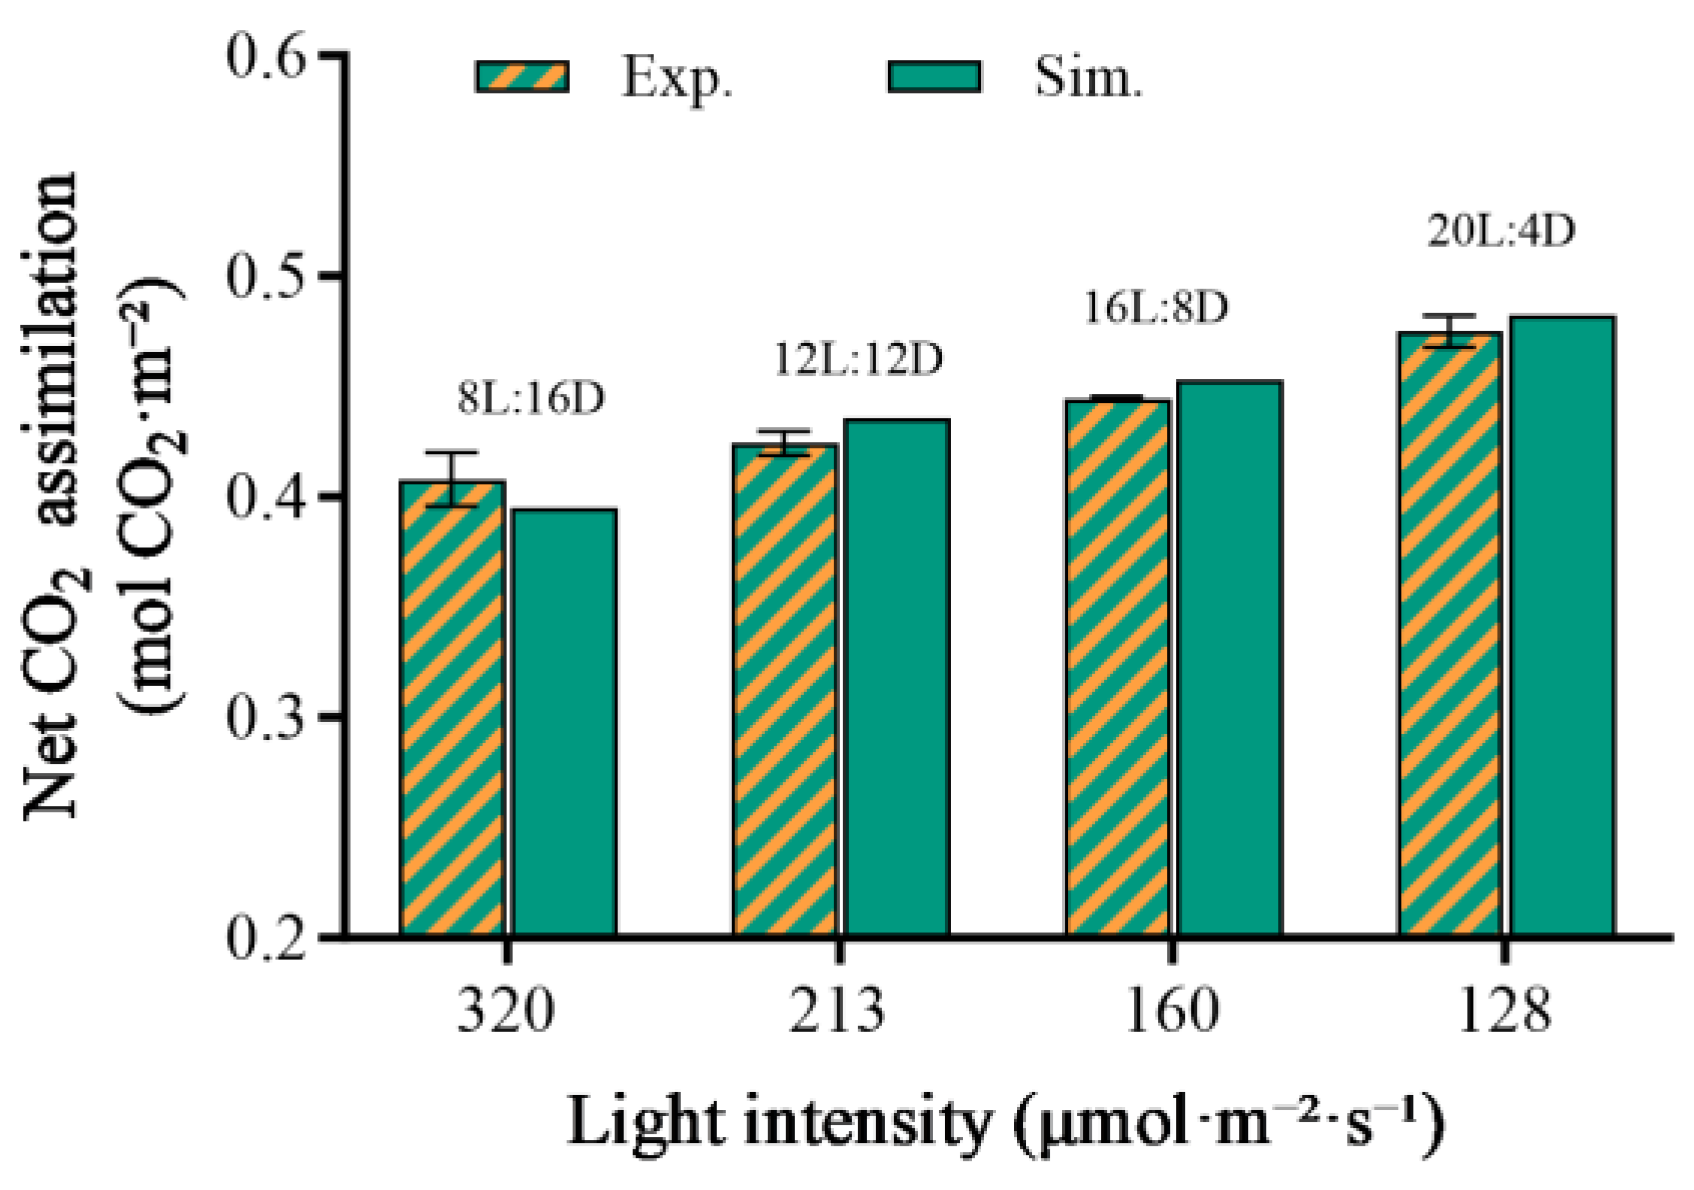
where represents the net CO2 assimilation during the light period (mol CO2·m−2), and T is the daily light duration (h). Using Equation (2), we calculated and compared the net CO2 assimilation under different combinations of light intensity and photoperiod, under constant DLI conditions. The results showed differences in net CO2 assimilation among the treatments (Figure 7), indicating that even with the same daily photon input, the configuration of light intensity and photoperiod influences carbon assimilation efficiency.
Figure 7.
Effects of photoperiod and light intensity on light-period net CO2 assimilation under constant DLI. Under a constant DLI, four photoperiod treatments (8L:16D, 12L:12D, 16L:8D, and 20L:4D) were established, with the corresponding light intensities adjusted inversely with photoperiod to maintain the same DLI. Hatched bars represent experimentally measured values (Exp.), and solid bars represent model-simulated values (Sim.). Experimental data were obtained from five independent biological replicates and are presented as the mean ± SD.
Under a constant DLI of 9.216 mol·m−2·d−1, we compared the net CO2 assimilation of the non-heading Chinese cabbage under different photoperiod and light intensity combinations. The results showed that as the photoperiod increased and light intensity decreased, the net CO2 assimilation gradually increased across all treatments from 8L:16D to 20L:4D. Notably, the light environment with a longer photoperiod and lower light intensity produced higher assimilation under the same DLI. The net CO2 assimilation under the 20L:4D treatment reached 0.475 mol CO2·m−2, which was 16% higher than that under the 8L:16D treatment, representing the highest value among all treatments. This suggests that the 20L:4D photoperiod–light intensity combination produced the highest value among the tested treatments (Figure 7). Moreover, the close agreement between simulated and measured values supports the model’s ability to reproduce the response patterns of net CO2 assimilation within the tested conditions.
Marginal benefit describes the additional daily net CO2 assimilation achieved per unit increase in DLI, thereby indicating how efficiently supplemental light was converted into additional carbon gain. The marginal benefit of increasing DLI was calculated from the maximum daily net CO2 assimilation attainable at each DLI. For a given DLI, the maximum assimilation among the simulated photoperiods, , was the maximum 24-h net CO2 assimilation () among all examined photoperiods. The marginal benefit between two consecutive DLI levels was then calculated using a finite difference:
Here, represents the additional net CO2 assimilation obtained per unit increase in incident photons and is expressed as mol CO2 mol −1 photons. A higher indicates that additional light produces a relatively large carbon gain, whereas a declining indicates diminishing photosynthetic returns. This metric therefore provides a quantitative basis for identifying DLI ranges in which supplemental lighting remains biologically efficient and for avoiding excessive light inputs that produce only limited additional carbon assimilation. Because adjacent DLI levels differed by 1 mol·m−2·d−1, the calculated marginal benefit was numerically equal to the increase in optimal between consecutive DLI levels. For visualization, each marginal-benefit value was plotted against the upper DLI value of the corresponding interval.
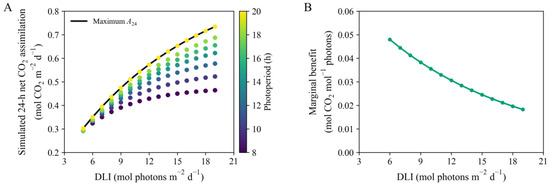
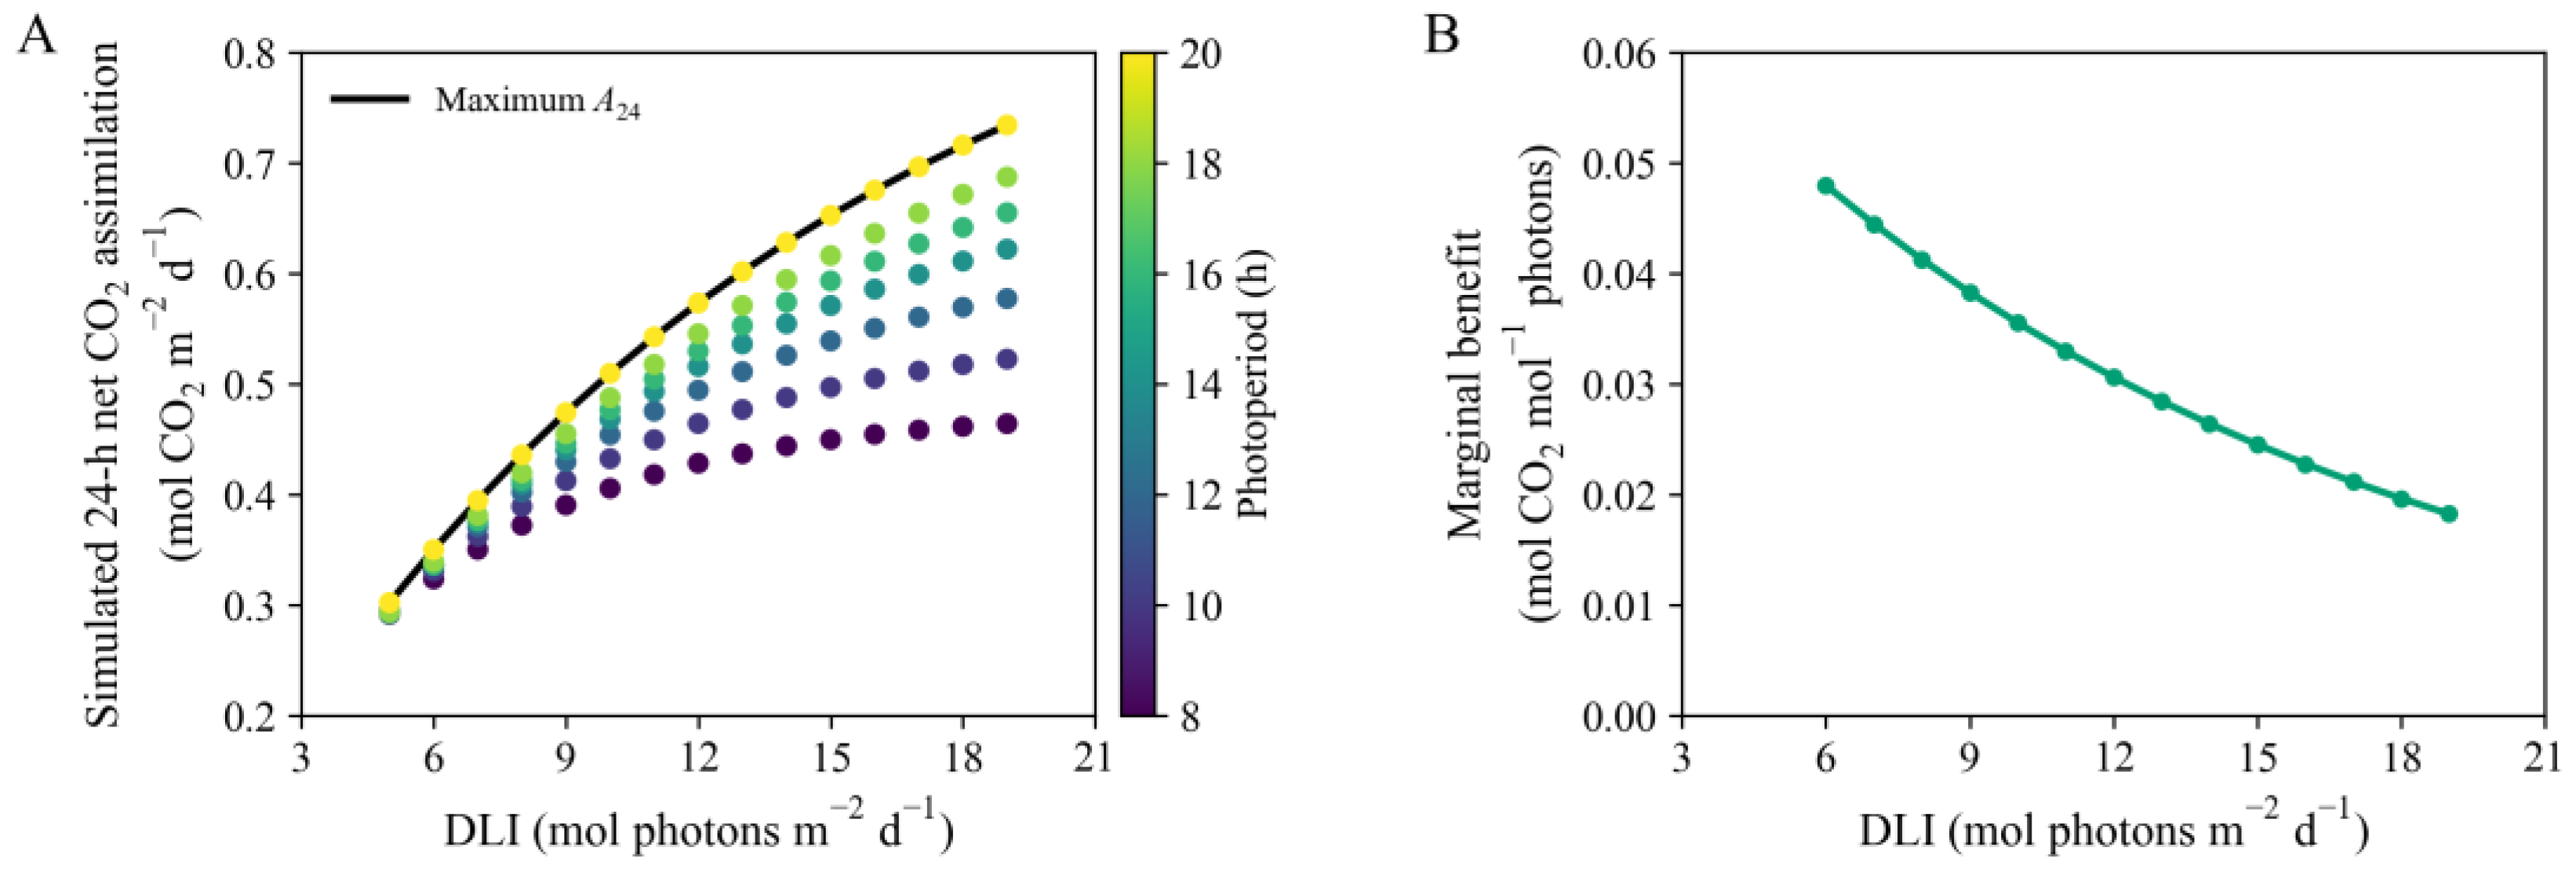
Simulated 24-h net CO2 assimilation increased nonlinearly with DLI, with the response varying among photoperiods (Figure 8A). Across the displayed DLI range of 5–19 mol·m−2·d−1, the 20-h photoperiod consistently produced the highest net assimilation. Maximum net assimilation increased from 0.302 mol CO2 m−2·d−1 at a DLI of 5 mol·m−2·d−1 to 0.734 mol CO2 m−2·d−1 at a DLI of 19 mol·m−2·d−1. The corresponding light intensity increased from 69.4 to 263.9 μmol·m−2·s−1.
Figure 8.
(A) Simulated 24-h net CO2 assimilation for 105 combinations of daily light integral (DLI; 5–19 mol·m−2·d−1) and photoperiod (8–20 h). Point colors indicate photoperiod. The solid black line connects the maximum simulated assimilation at each DLI among the photoperiods examined. (B) Marginal benefit of increasing DLI, calculated as the increase in maximum 24-h net CO2 assimilation per unit increase in DLI. Each value is plotted against the upper DLI of the corresponding interval.
Although maximum net assimilation continued to increase with DLI, the marginal benefit of additional light declined monotonically (Figure 8B). It decreased from 0.0479 mol CO2 mol−1 for the DLI increase from 5 to 6 mol·m−2·d−1 to 0.0182 mol CO2 mol−1 for the increase from 18 to 19 mol·m−2·d−1, representing a reduction of approximately 62%. The simulations indicated progressively diminishing modeled returns.
3.5. Leaf Chlorophyll Content Responses to Combined Photoperiod–Light Intensity Treatments Under Constant DLI
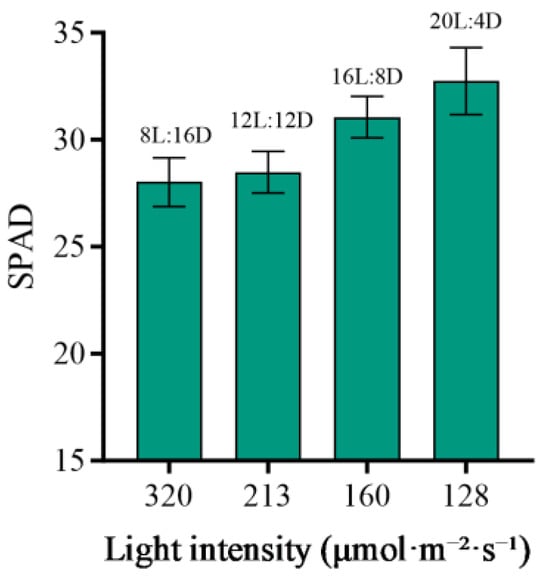
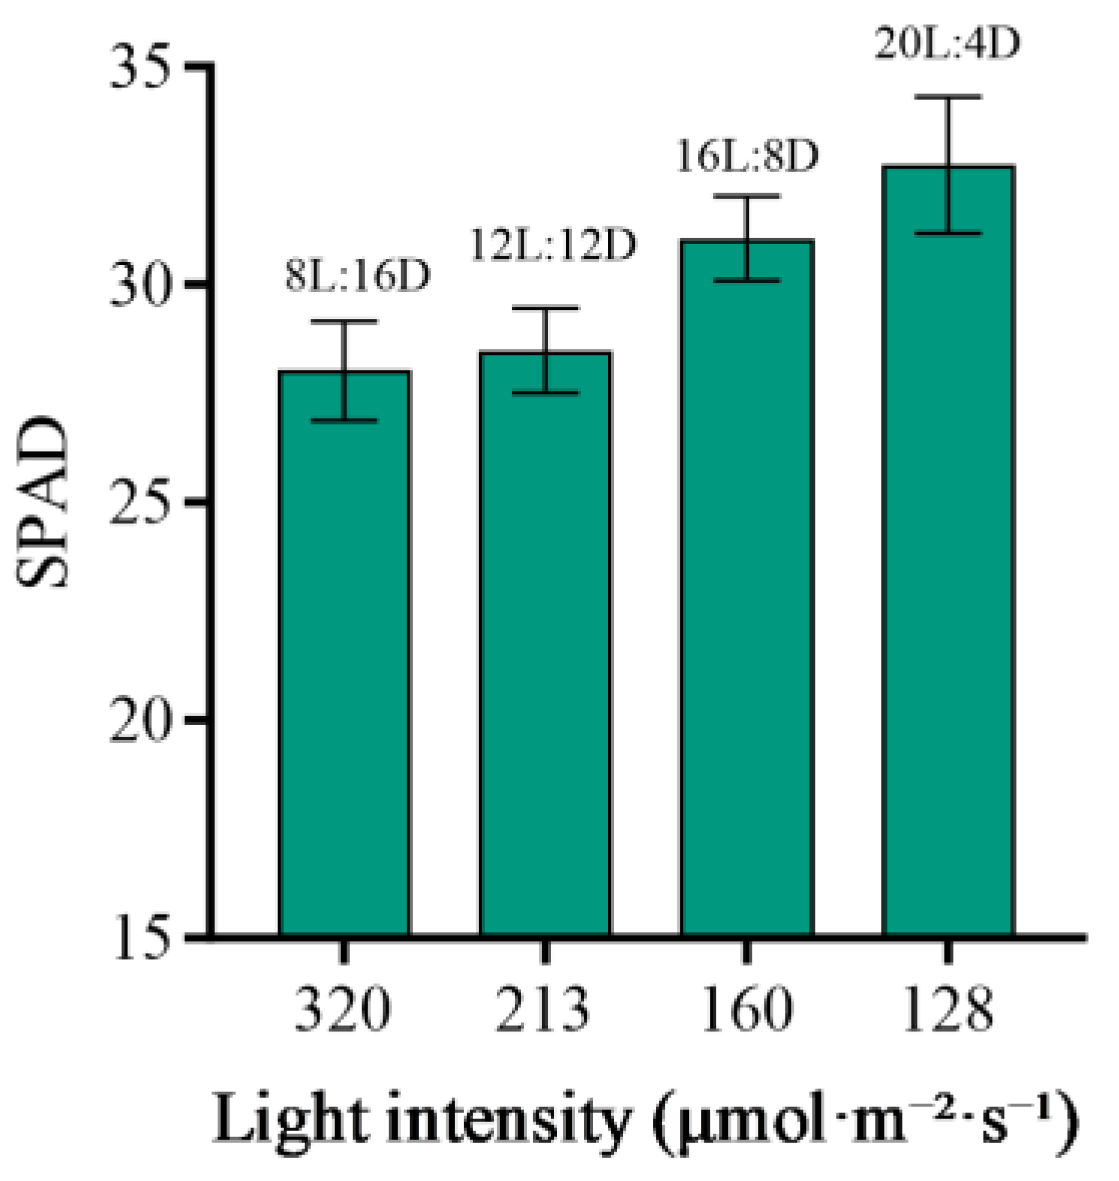
Leaf SPAD values differed among the combined photoperiod–light intensity treatments at a constant DLI of 9.216 mol·m−2·d−1 (Figure 9). The 8L:16D treatment, with the highest light intensity of 320 µmol·m−2·s−1, showed the lowest mean SPAD value. Mean SPAD values increased across the 12L:12D, 16L:8D, and 20L:4D treatments as photoperiod increased and light intensity decreased, with the highest value observed under 20L:4D at 128 µmol·m−2·s−1. Thus, among the treatments examined, longer-photoperiod–lower- light-intensity combinations were associated with higher leaf SPAD values. Because photoperiod and light intensity covaried under constant DLI, their individual contributions could not be separated.
Figure 9.
Effects of photoperiod and instantaneous light intensity on leaf SPAD values under a constant DLI. At a DLI of 9.216 mol·m−2·d−1, four photoperiod treatments (8L:16D, 12L:12D, 16L:8D, and 20L:4D) were established, with the instantaneous light intensity varying correspondingly among treatments. Bars represent the mean ± SD (n = 5).
3.6. Sensitivity Analysis of Parameters
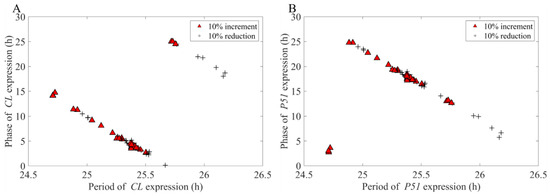
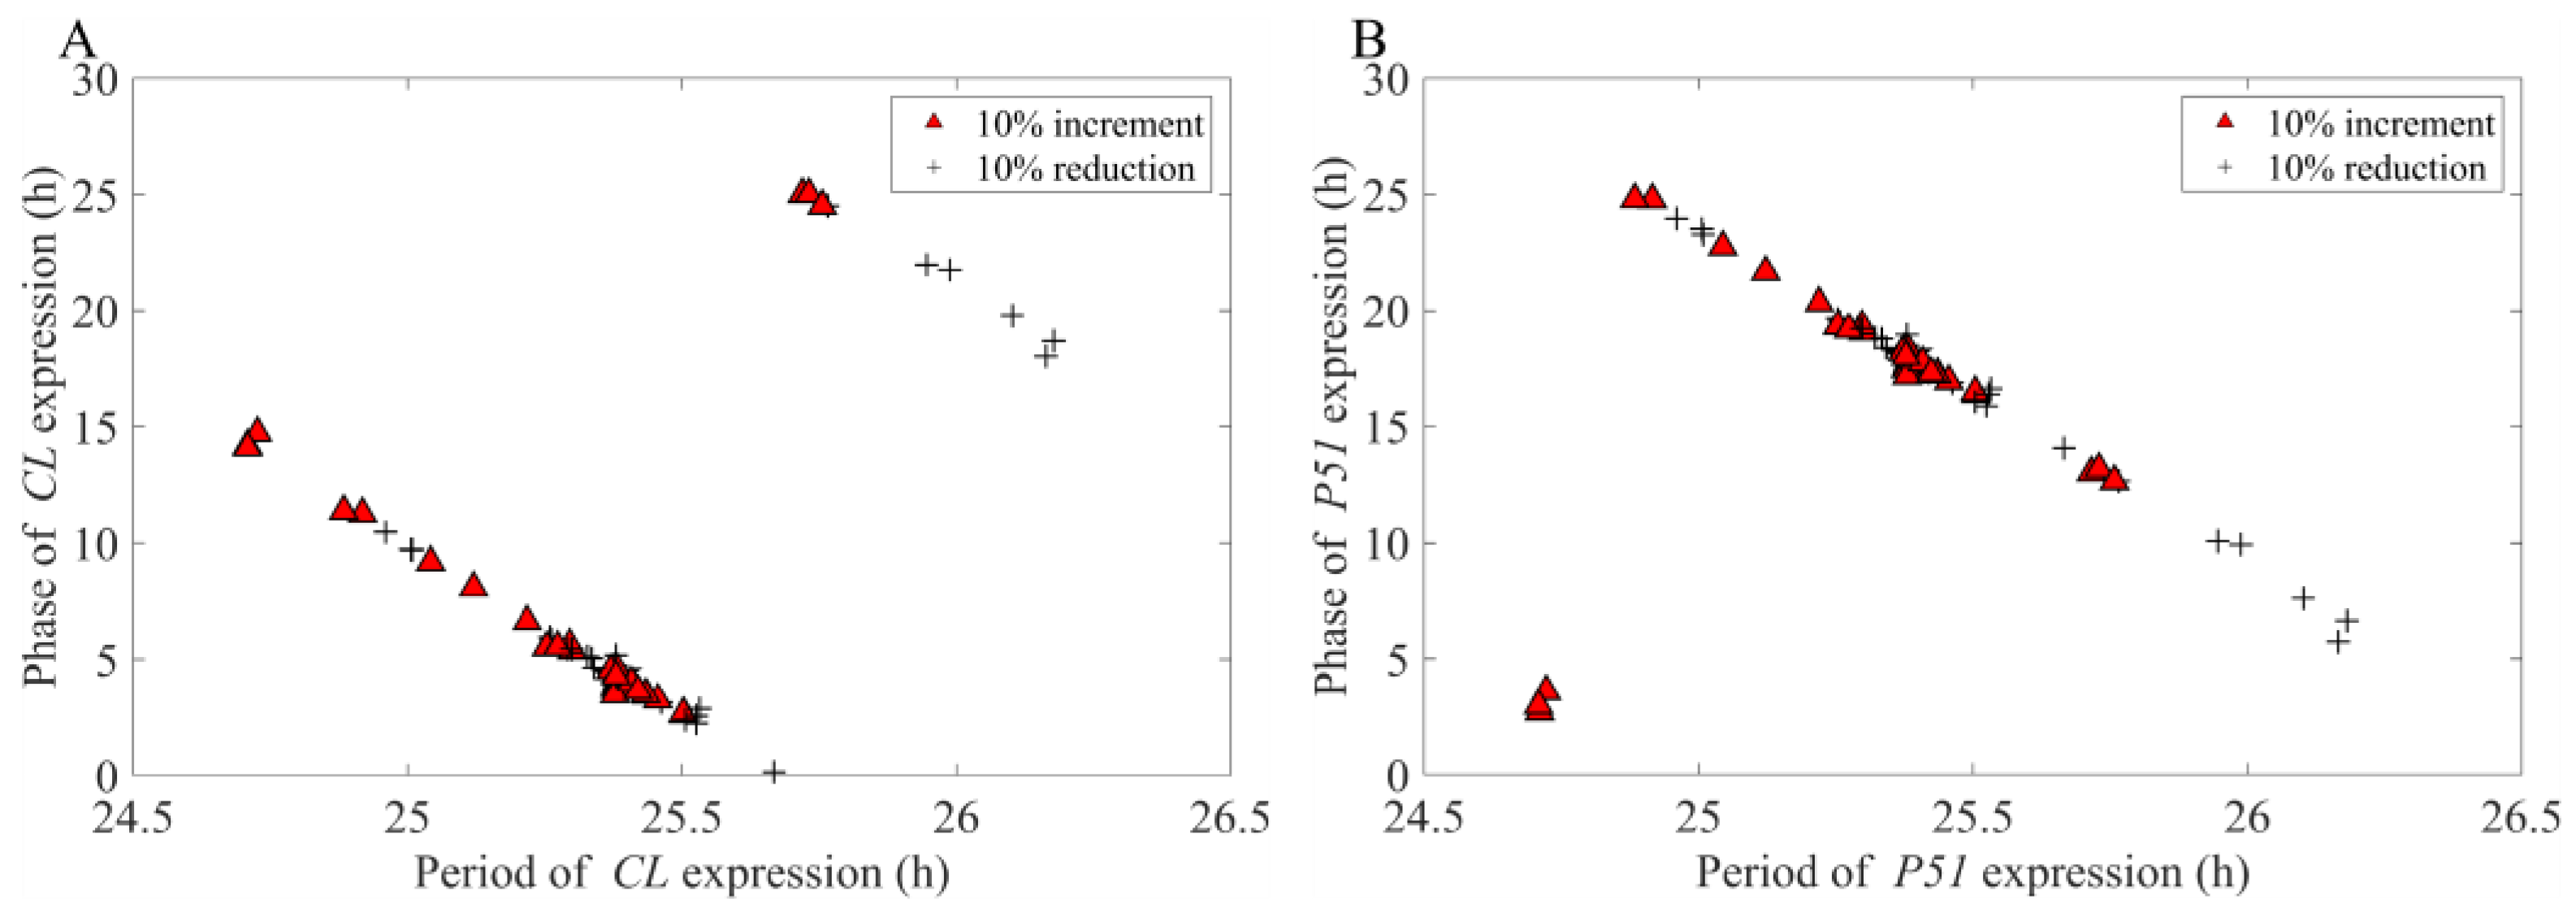
To evaluate the robustness of the model, we applied a moderate perturbation of ±10% to each model parameter and examined the corresponding responses of the key outputs, namely the period and phase of the circadian rhythms. The results showed that, under parameter perturbation, the period and phase of the core components CL (CCA1/LHY) and P51 (PRR5/TOC1) neither diverged markedly nor exhibited abrupt changes under constant light (LL) conditions; instead, they clustered tightly around the unperturbed baseline values (indicated by the pentagram; Figure 10). The limited changes in period and phase under ±10% perturbations indicate local robustness around the calibrated parameter set.
Figure 10.
Changes in period and phase for Clock Components under LL conditions with light intensity set to 100 μmol·m−2·s−1, following a ± 10% perturbation of individual model parameters. (A) CL: Experession phase against period. (B) P51: Experession phase against period. Red triangles indicate 10% increases in parameter values, black crosses indicate 10% decreases, and five-pointed stars represent the unperturbed baseline values.
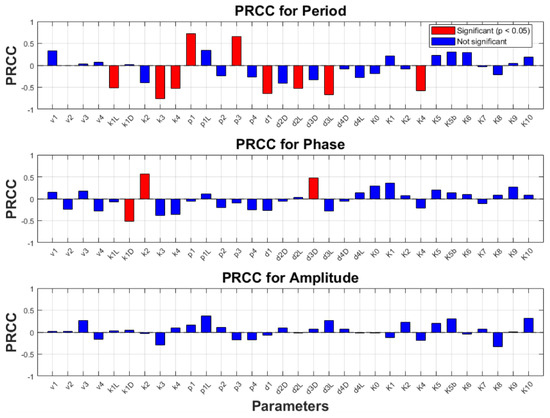
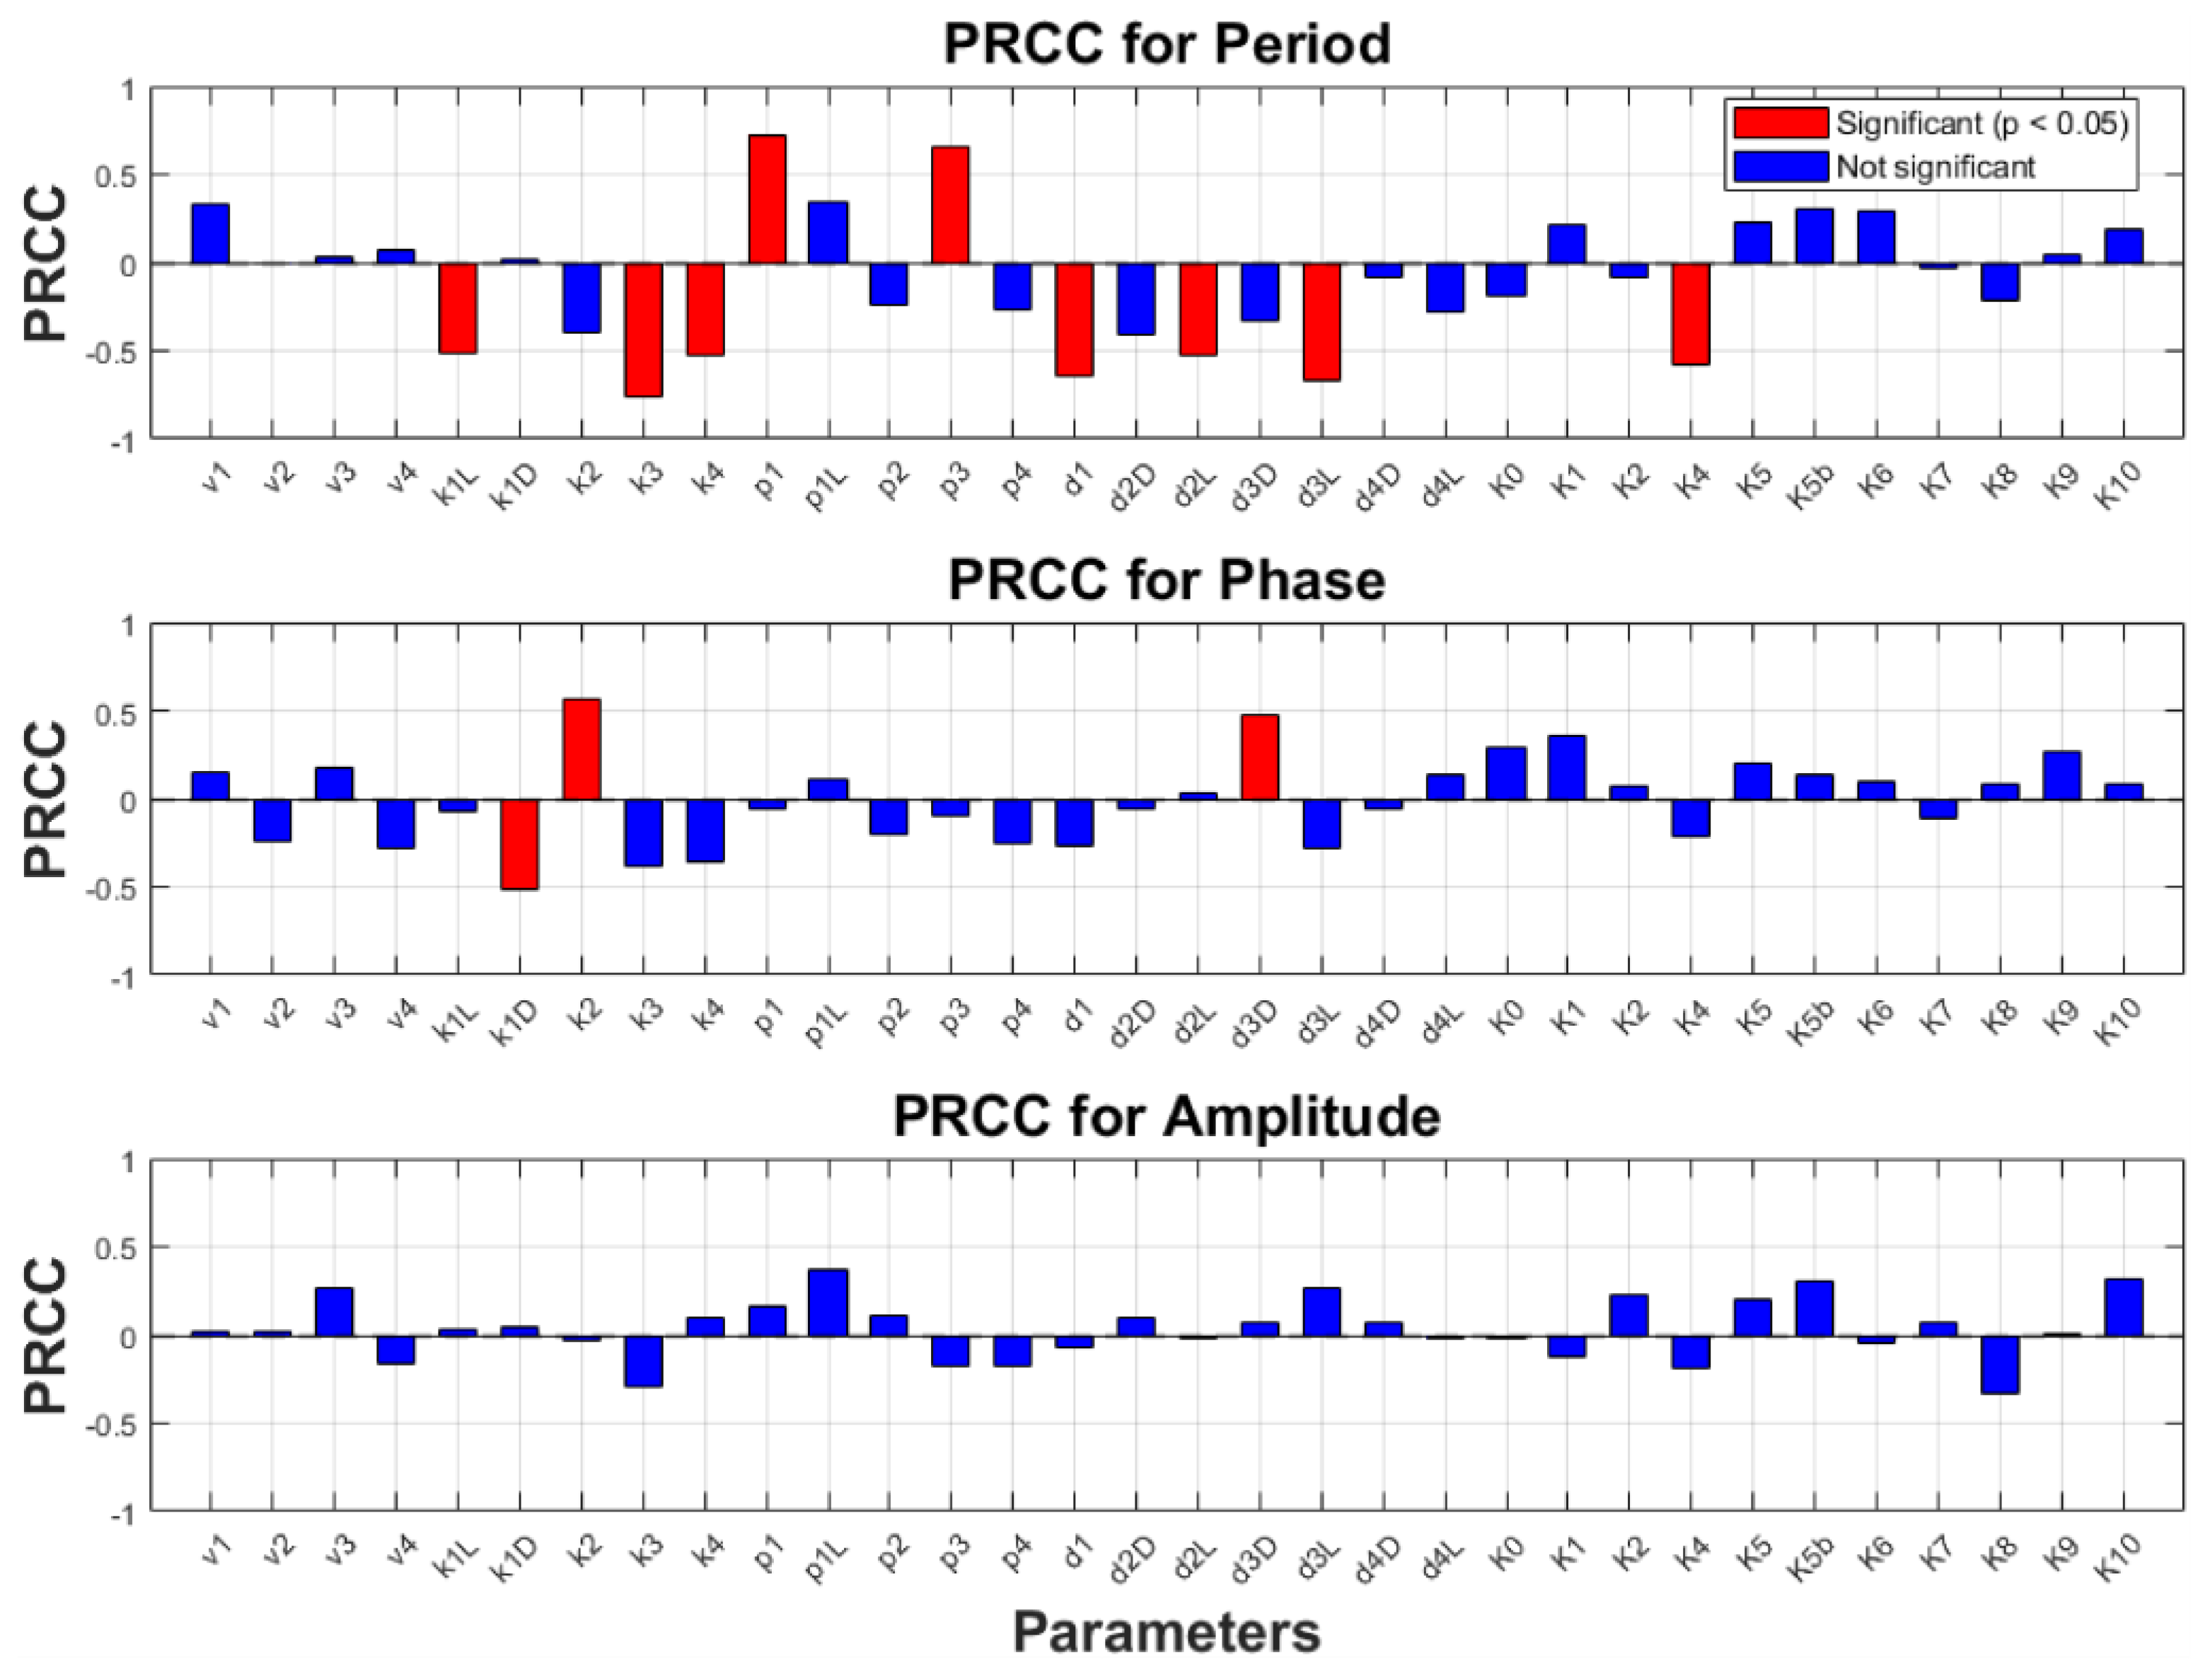
In addition, to quantitatively evaluate the influence of model parameters on the expression of the circadian clock gene CL, we performed a sensitivity analysis using the partial rank correlation coefficient (PRCC), examining the effects of ±30% perturbations of each parameter on the period, phase, and amplitude of CL expression (Figure 11). The PRCC values directly reflect the sensitivity relationship between parameters and output variables: a positive value indicates that the parameter and the corresponding output change in the same direction, whereas a negative value indicates an inverse relationship. As shown in Figure 11, the parameters, , , , , , , , and exerted relatively strong effects on the period of CL oscillation, with p1 and p3 showing positive effects; by contrast, only , , and markedly affected the phase of CL expression.
Figure 11.
PRCC values for period, phase, and amplitude of circadian clock gene CL expression were calculated under LL conditions with light intensity set to 100 μmol·m−2·s−1. A positive PRCC indicates that the parameter increases with the corresponding indicator, while a negative PRCC indicates an inverse relationship. The absolute value of the PRCC reflects the strength of the correlation between the parameter and the relevant indicator.
These highly sensitive parameters are mainly involved in the core processes of transcription, translation, and degradation that determine the oscillatory dynamics of the circadian clock, and their biological significance can be summarized as follows: , , and correspond to the mRNA degradation rates of CCA1/LHY, PRR5/TOC1, and ELF4/LUX, respectively, whereas and control the protein synthesis rates of CCA1/LHY and PRR5/TOC1, respectively—the synthesis–degradation balance of mRNA and the translation rate collectively determine the accumulation and decline of clock components, thereby directly regulating the oscillation period. The parameters , , and represent the light-dependent protein degradation rates of CCA1/LHY, PRR7/PRR9, and PRR5/TOC1, respectively, and is the Hill constant for the repression of PRR7/PRR9 by PRR5/TOC1; these processes modulate the strength and time constant of the negative feedback, thereby affecting period length. Furthermore, , , and influence the degradation of CCA1/LHY mRNA in darkness, PRR7/PRR9 mRNA, and PRR5/TOC1 protein in darkness, respectively, thereby regulating the phase of CL expression through light-dependent differences in degradation.
Therefore, accurate estimation of these highly sensitive parameters is particularly important for ensuring reliable model predictions; in comparison, low-sensitivity parameters can tolerate considerable uncertainty without substantially affecting model robustness, thereby contributing to more accurate predictions of related gene expression.
4. Discussion
In this study, we developed an integrated regulatory model incorporating both light intensity and photoperiod inputs to investigate their coordinated effects on photosynthesis. Several circadian clock models have previously been established for vegetable crops and applied to studies of clock-regulated physiological processes [32,43,44,45]. The model reproduced the principal temporal patterns of most clock and photosynthesis-related genes under the calibration condition. Under eight additional photoperiod–light-intensity combinations, simulated CCA1 expression agreed with the experimental profiles, with values of 0.670–0.917. The model also captured the main diurnal patterns under the calibration and higher-DLI validation treatments, although fitting performance varied among treatment combinations. These results support the use of the model for analyzing general temporal responses under the tested light conditions rather than for predicting every individual time point precisely.
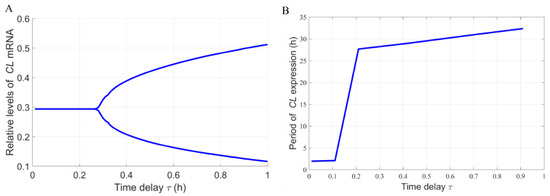
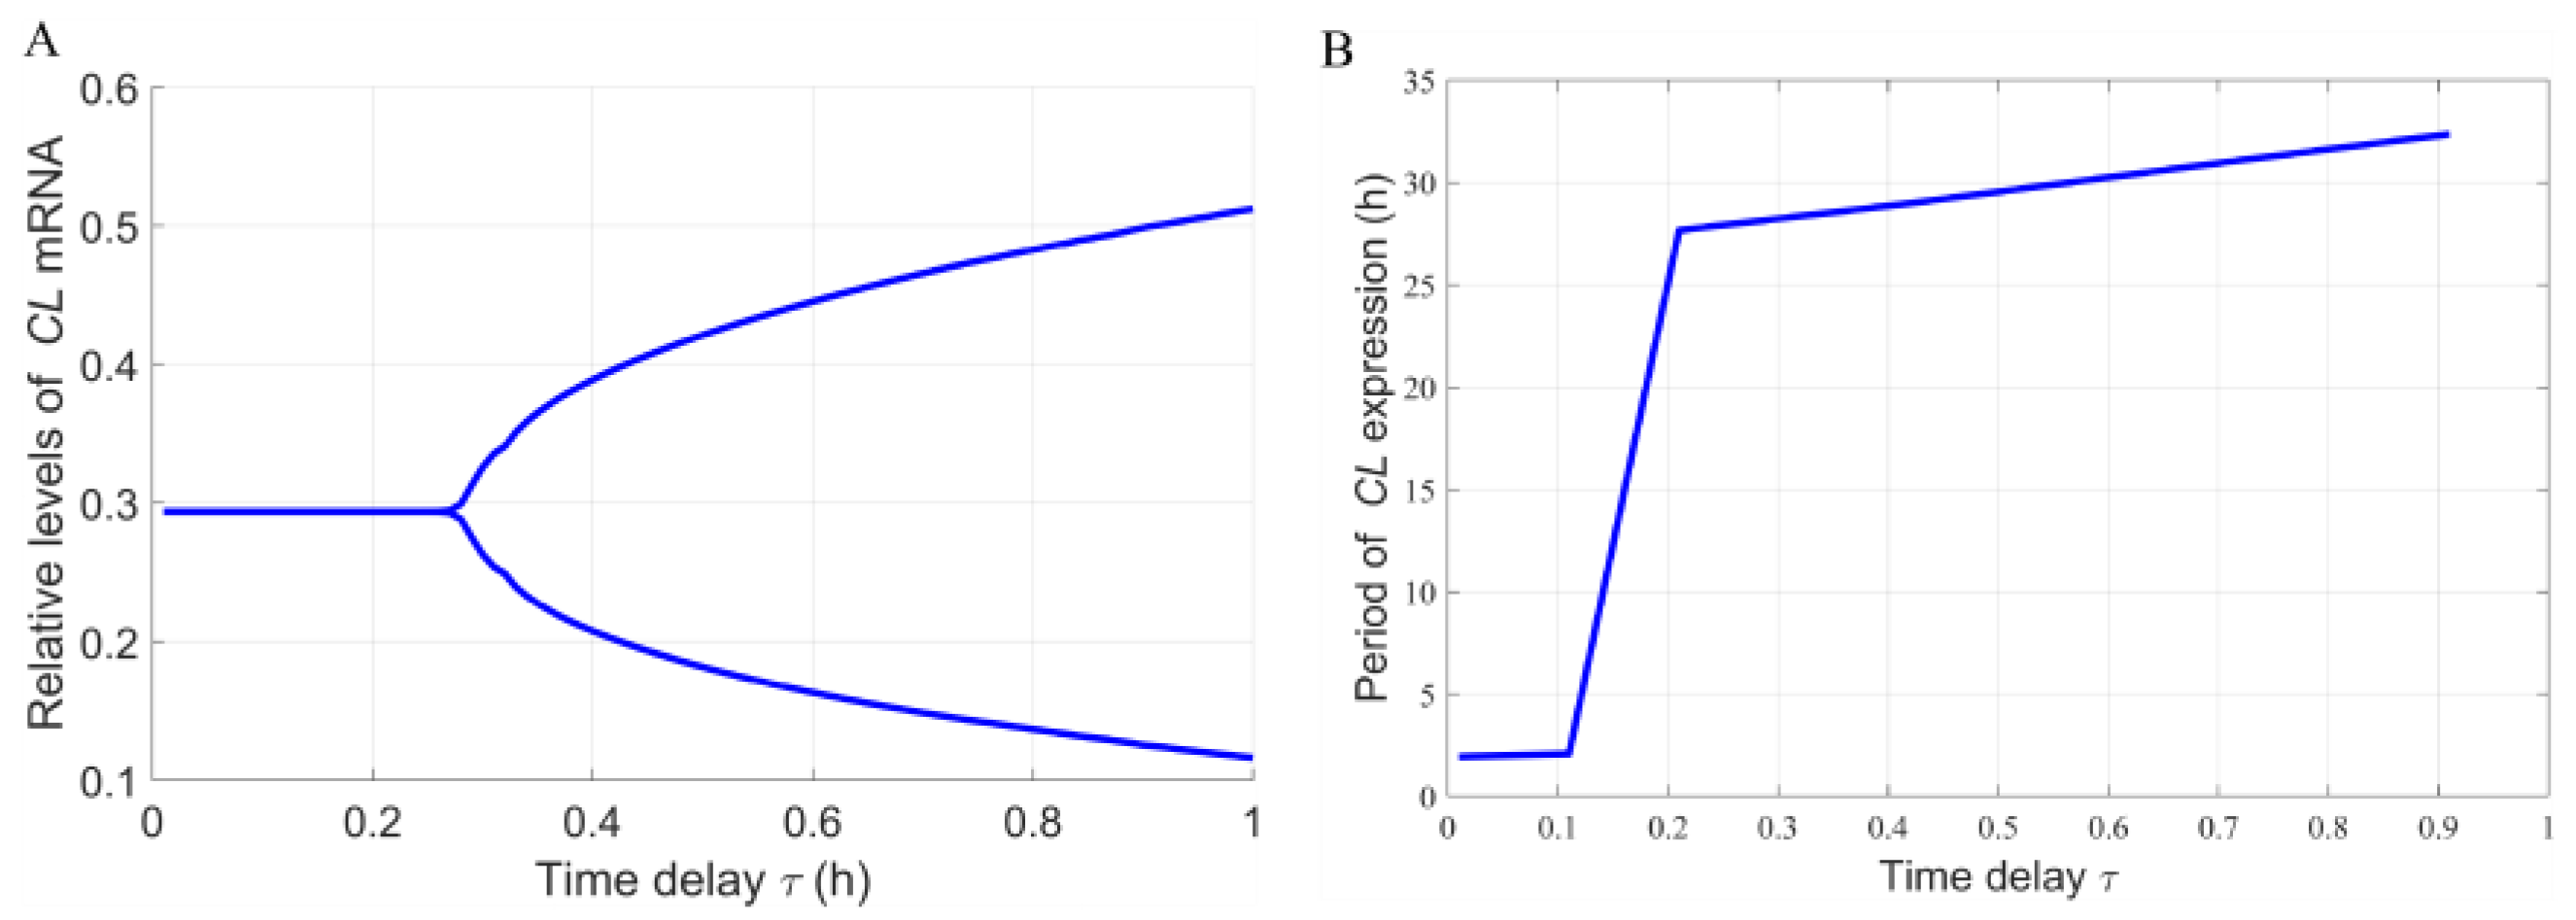
Transcriptional delays were retained within the circadian-clock module because delayed negative feedback is an established mechanism capable of supporting and modulating circadian oscillations. Under LL conditions at 100 µmol·m−2·s−1, increasing the delay caused CL expression to transition from a stable steady state to sustained oscillations, indicating a Hopf bifurcation, while the oscillation period increased progressively with the delay (Figure 12). This behavior is consistent with previous theoretical studies showing that delayed feedback can promote oscillation generation and regulate circadian periodicity [33]. The result supports the inclusion of transcriptional delays in the present framework, although the bifurcation represents a model-derived mechanism that requires experimental verification.
Figure 12.
Hopf bifurcation analysis of the circadian clock model under LL conditions at 100 μmol·m−2·s−1. (A) Bifurcation diagram of CL mRNA expression with increasing transcriptional delay. The two branches indicate the maximum and minimum expression levels after the onset of sustained oscillations. (B) Oscillation period of CL expression as a function of transcriptional delay.
The expression of the photosynthesis-related genes showed distinct circadian phases. Lhcb1 and RbcS1 reached their highest transcript levels during the light period, whereas psbA and atpA exhibited approximately opposite expression phases. Previous studies have linked CCA1 with the transcriptional regulation of Lhcb1 and carbon fixation [38], while Lhcb1, psbA, RbcS1, and atpA are associated with light harvesting, photosystem II function, Rubisco-mediated carbon fixation, and chloroplast ATP synthesis, respectively [39,40,41,42]. In the present model, the corresponding protein state variables were used as regulatory proxies for the temporal contributions of these processes to . However, these variables do not represent directly measured protein abundances, enzyme activities, or complete photosynthetic complexes. Therefore, agreement between the modeled and measured temporal profiles does not establish the independent causal contribution of any individual gene to photosynthetic performance. The underlying regulatory relationships should instead be regarded as biologically informed model assumptions and hypotheses requiring further experimental testing.
A major result was that equivalent DLIs did not produce equivalent diurnal photosynthetic responses. At a constant DLI of 9.216 mol·m−2·d−1, extending the photoperiod from 8 to 20 h while reducing irradiance from 320 to 128 µmol·m−2·s−1 lowered and delayed the instantaneous peak. Nevertheless, light-period net CO2 assimilation progressively increased and the simulated value reached 0.475 mol CO2·m−2 under 20L:4D, approximately 16% higher than under 8L:16D. This contrast likely reflects the nonlinear photosynthetic response to irradiance. A short photoperiod with high light intensity produced a higher instantaneous , but the high rate was maintained for a shorter period and approached the saturating region of the light response. In comparison, distributing the same DLI over a longer period maintained moderate photosynthetic activity for longer, resulting in greater cumulative assimilation. Similar benefits of longer photoperiods at lower light intensity under constant DLI have been reported in other controlled-environment crops [22].
The SPAD response provides limited evidence of physiological acclimation. Under the constant DLI, the lowest mean SPAD value occurred under 8L:16D with the highest irradiance, whereas the highest value occurred under 20L:4D with the lowest irradiance. Plants acclimated to lower light intensity may increase their light-harvesting pigment content, particularly chlorophyll b, to enhance light capture [46,47], whereas high instantaneous light intensity may increase the risk of photoinhibition and oxidative stress [48,49]. More broadly, the contrasting assimilation responses may reflect the combined effects of nonlinear light responses, photoperiod-dependent circadian gating, starch turnover, source–sink feedback, and dark-period respiratory losses. Because these processes were not measured directly, they should be regarded as physiologically plausible explanations rather than demonstrated mechanisms. Moreover, SPAD does not directly measure chlorophyll composition, photosystem II efficiency, or photodamage, and the simultaneous adjustment of photoperiod and irradiance prevents their independent contributions from being separated. Future experiments should therefore combine gas exchange with chlorophyll fluorescence, Rubisco activity, carbohydrate accumulation, respiration, biomass, and yield measurements to test these proposed mechanisms.
Simulations across DLIs of 5–19 mol·m−2·d−1 suggested that integrated carbon gain depended on both total photon input and its temporal distribution. Among the simulated photoperiods, the 20-h treatment consistently produced the highest integrated net CO2 assimilation, whereas the marginal carbon benefit of additional light declined by approximately 62%, indicating diminishing modeled carbon returns with increasing photon input. However, only DLIs of 4.896 and 9.216 mol·m−2·d−1 were experimentally examined; predictions above this range, including combinations involving irradiances greater than 320 μmol·m−2·s−1, should therefore be regarded as exploratory extrapolations rather than validated high-light responses. Moreover, the marginal carbon-benefit metric quantifies the modeled increase in CO2 assimilation per unit increase in incident photons and should not be equated with electricity-use efficiency, production cost, or yield per kWh. Although treatments with the same DLI receive an equivalent photon dose, their actual operating costs may differ because of LED photon efficacy, dimming efficiency, lighting duration, electricity pricing, and associated cooling and dehumidification requirements. Because electricity consumption, crop-cycle duration, marketable yield, product quality, and yield per kWh were not measured, the 20-h treatment should be interpreted only as producing the highest assimilation among the photoperiods examined, not as a universal physiological, agronomic, or commercially optimal lighting strategy.
These results also highlight the need to distinguish among instantaneous , integrated leaf-level CO2 assimilation, whole-plant carbon gain, and marketable yield. Instantaneous describes the gas-exchange rate of a unit leaf area at a particular time, whereas cumulative assimilation depends on both the magnitude and duration of photosynthetic activity. In the present study, the experimentally derived integrated value represents leaf-area-based net CO2 assimilation during the light period. It does not include respiratory carbon loss during the dark period and therefore should not be interpreted as a complete 24-h carbon balance. Whole-plant biomass accumulation also depends on leaf-area development, carbon allocation, source–sink relationships, tissue carbon content, and respiration. Consequently, the higher light-period assimilation observed under 20L:4D cannot by itself be interpreted as evidence of higher marketable yield, improved crop quality, or a commercial production optimum.
Several limitations should be considered, together with the corresponding priorities for future research. Only the NHCC-001 genotype at one developmental stage was examined under controlled temperature, humidity, and CO2 conditions. The complete circadian-clock and photosynthesis-related gene network was calibrated primarily using RT-qPCR data collected under one main light condition with three biological replicates per time point, whereas the additional photoperiod–light-intensity treatments principally evaluated CCA1 rather than the entire downstream network. The model was experimentally evaluated at DLIs of 4.896 and 9.216 mol·m−2·d−1; predictions above this range, including combinations involving irradiances greater than 320 μmol·m−2·s−1, remain exploratory extrapolations. In addition, photoperiod and irradiance varied simultaneously under the constant-DLI design, preventing their independent effects from being separated. Protein abundance, post-translational regulation, stomatal dynamics, chloroplast acclimation, carbohydrate turnover, whole-plant respiration, biomass, crop quality, and marketable yield were not measured directly. Parameter sensitivity analysis identified influential parameters but did not fully establish parameter uniqueness or propagate parameter uncertainty into all and integrated-assimilation predictions. The model therefore cannot yet be generalized to other cultivars, developmental stages, production systems, Brassica crops, or other leafy vegetables without additional validation, and its predictions may change under different temperatures, VPDs, CO2 concentrations, irrigation and nutrient regimes, plant densities, and stages of canopy closure [13]. Future studies should consequently use factorial experiments that vary photoperiod and irradiance independently and should evaluate additional genotypes, developmental stages, and production environments. Gas-exchange measurements should be combined with chlorophyll fluorescence, Rubisco activity, protein abundance, starch and soluble-sugar concentrations, dark respiration, leaf-area development, dry-matter accumulation, tissue carbon, crop quality, and marketable yield. Independent datasets and formal uncertainty propagation are also required to evaluate predictive robustness. Finally, electricity consumption, LED photon efficacy, climate-control energy demand, crop-cycle duration, and yield per kWh should be quantified before the model outputs are translated into commercial lighting recommendations.
Overall, the results show that, within the examined conditions, the temporal distribution of a given daily light input was associated with differences in diurnal and leaf-area-based light-period CO2 assimilation. Extending the photoperiod while reducing instantaneous irradiance lowered and delayed the peak but increased cumulative assimilation among the four experimentally examined treatments. Simulations across the wider DLI range further generated testable hypotheses concerning diminishing carbon returns with increasing photon input, but these projections require experimental validation. Accordingly, the model provides a framework for interpreting temporal photosynthetic responses and designing subsequent validation experiments rather than direct evidence for a universally applicable or commercially optimal lighting strategy.
5. Conclusions
This study linked light conditions, circadian-regulated gene dynamics, and diurnal photosynthetic performance in non-heading Chinese cabbage. Under a constant DLI of 9.216 mol·m−2·d−1, extending the photoperiod while reducing irradiance lowered and delayed the peak. Among the four treatments examined, 20L:4D produced the highest leaf-area-based light-period net CO2 assimilation, reaching 0.475 mol CO2 m−2 and exceeding that under 8L:16D by approximately 16%. These results indicate that the temporal distribution of daily light was associated with photosynthetic carbon gain within the experimental conditions.
Simulations across a broader DLI range suggested diminishing carbon returns as photon input increased and generated hypotheses concerning the effects of photoperiod–irradiance combinations. Because experimental evaluation was restricted to two DLI levels and leaf-level photosynthetic measurements, these broader predictions require independent validation. The model should therefore be regarded as a framework for interpreting temporal photosynthetic responses and guiding future experiments, rather than as evidence supporting a universally applicable or commercially optimal lighting strategy.
Supplementary Materials
The following supporting information can be downloaded at https://www.mdpi.com/article/10.3390/horticulturae12091127/s1, Section S1. Common reference genes and primer sequences; Table S1: Common reference genes and primer sequences for the non-heading Chinese cabbage; Section S2. Circadian clock model of non-heading Chinese cabbage; Section S3. Biological interpretation of model parameters; Table S2: Biological explanations and values of parameters in the circadian clock model; Section S4. Confidence interval of circadian clock parameters; Table S3: presents the estimated values of high-sensitivity parameters for the circadian model along with their 95% confidence intervals, derived from residual bootstrapping resampling performed 150 times; Section S5. Relative expression levels of core circadian clock genes and photosynthesis-related genes; Table S4: Mean and standard deviation of the relative expression levels of core circadian clock genes; Table S5: Mean and standard deviation of the relative expression levels of core circadian clock genes; Table S6: Mean and standard deviation of the relative expression levels of photosynthesis genes; Section S6. Parameters related to photosynthetic rate models; Table S7: Parameters of light-response model.
Author Contributions
Conceptualization, X.Y. and X.H.; methodology, X.Y.; software, Y.W.; validation, Y.W., M.X., and H.L.; investigation, X.Y. and H.L.; data curation, M.X. and J.L.; writing—original draft preparation, H.L. and J.L.; writing—review and editing, H.L., Y.W., J.L. and X.Y.; visualization, H.L.; supervision, X.Y.; project administration, X.Y.; funding acquisition, X.Y. and X.H. All authors have read and agreed to the published version of the manuscript.
Funding
This study was partially supported by the Primary Research & Development Plan (Modern Agriculture) of Jiangsu Province (BE2023350), the National Natural Science Foundation of China (11171155), Jiangsu Seed Industry Revitalization Project (JBGS(2021) 064), and the Natural Science Foundation of Jiangsu Province, China (BK20171370).
Data Availability Statement
The original contributions presented in this study are included in the article and Supplementary Material. Further inquiries can be directed to the corresponding authors.
Acknowledgments
We would like to thank Ruqiang Zhang of Cornell University for his inspiring discussions; his meticulous work has significantly improved the quality of the manuscript. We also thank Fei Ding of Nanjing Agricultural University for his help in the biological experiments during the revision stage.
Conflicts of Interest
The authors declare that there is no conflict of interest.
References
- Cui, J.; Zhan, X.; Wang, Q.; Zhang, D.; Li, D.; Li, X.; Gao, L.; Zhu, H.; Chang, L.; Li, J.; et al. Principal Component Analysis and Cluster Analysis of Hydroponic Adaptation Potential in Different Pakchoi (Brassica campestris ssp. Chinensis) Parent Materials. Horticulturae 2025, 11, 822. [Google Scholar] [CrossRef] [Scilit]
- Li, Y.; Liu, G.-F.; Ma, L.-M.; Liu, T.-K.; Zhang, C.-W.; Xiao, D.; Zheng, H.-K.; Chen, F.; Hou, X.-L. A Chromosome-Level Reference Genome of Non-Heading Chinese Cabbage [Brassica campestris (Syn. Brassica rapa) ssp. Chinensis]. Hortic. Res. 2020, 7, 212. [Google Scholar] [CrossRef] [Scilit]
- Yang, F.; Feng, L.; Liu, Q.; Wu, X.; Fan, Y.; Raza, M.A.; Cheng, Y.; Chen, J.; Wang, X.; Yong, T.; et al. Effect of Interactions between Light Intensity and Red-to-Far-Red Ratio on the Photosynthesis of Soybean Leaves under Shade Condition. Environ. Exp. Bot. 2018, 150, 79–87. [Google Scholar] [CrossRef] [Scilit]
- Li, J.; Zhang, Y.; Cheng, R.; Li, T. Light Spectrum, Intensity, and Photoperiod Are Key for Production as Well as Speed Breeding of Spring Wheat in Indoor Farming. Plant Environ. Interact. 2025, 6, e70085. [Google Scholar] [CrossRef] [Scilit]
- Ficht, A.; Bruch, A.; Rajcan, I.; Pozniak, C.; Lyons, E.M. Evaluation of the Impact of Photoperiod and Light Intensity on Decreasing Days to Maturity in Winter Wheat. Crop Sci. 2023, 63, 812–821. [Google Scholar] [CrossRef] [Scilit]
- Folta, K.M.; Koss, L.L.; McMorrow, R.; Kim, H.-H.; Kenitz, J.D.; Wheeler, R.; Sager, J.C. Design and Fabrication of Adjustable Red-Green-Blue LED Light Arrays for Plant Research. BMC Plant Biol. 2005, 5, 17. [Google Scholar] [CrossRef] [Scilit]
- Gao, W.; He, D.; Ji, F.; Zhang, S.; Zheng, J. Effects of Daily Light Integral and LED Spectrum on Growth and Nutritional Quality of Hydroponic Spinach. Agronomy 2020, 10, 1082. [Google Scholar] [CrossRef] [Scilit]
- Kong, D.-X.; Li, Y.-Q.; Wang, M.-L.; Bai, M.; Zou, R.; Tang, H.; Wu, H. Effects of Light Intensity on Leaf Photosynthetic Characteristics, Chloroplast Structure, and Alkaloid Content of Mahonia bodinieri (Gagnep.) Laferr. Acta Physiol. Plant. 2016, 38, 120. [Google Scholar] [CrossRef] [Scilit]
- Yang, F.; Huang, S.; Gao, R.; Liu, W.; Yong, T.; Wang, X.; Wu, X.; Yang, W. Growth of Soybean Seedlings in Relay Strip Intercropping Systems in Relation to Light Quantity and Red:Far-Red Ratio. Field Crops Res. 2014, 155, 245–253. [Google Scholar] [CrossRef] [Scilit]
- Wu, Y.; Gong, W.; Yang, W. Shade Inhibits Leaf Size by Controlling Cell Proliferation and Enlargement in Soybean. Sci. Rep. 2017, 7, 9259. [Google Scholar] [CrossRef] [Scilit]
- Lee, B.; Pham, M.D.; Cui, M.; Lee, H.; Hwang, H.; Jang, I.; Chun, C. Growth and Physiological Responses of Panax Ginseng Seedlings as Affected by Light Intensity and Photoperiod. Hortic. Environ. Biotechnol. 2022, 63, 835–846. [Google Scholar] [CrossRef] [Scilit]
- Rodriguez-Morrison, V.; Llewellyn, D.; Zheng, Y. Cannabis Yield, Potency, and Leaf Photosynthesis Respond Differently to Increasing Light Levels in an Indoor Environment. Front. Plant Sci. 2021, 12, 646020. [Google Scholar] [CrossRef] [Scilit]
- Fanourakis, D.; Körner, O.; Makraki, T.; Spyrou, G.P.; Karavidas, I.; Tsaniklidis, G.; Woltering, E.; Ntatsi, G. Greenhouse Climate Shapes Nitrate Levels, Nutritional Quality, and Shelf Life in Leafy Vegetables: Species-Specific Responses. Front. Plant Sci. 2026, 17, 1806482. [Google Scholar] [CrossRef] [Scilit]
- Osnato, M.; Cota, I.; Nebhnani, P.; Cereijo, U.; Pelaz, S. Photoperiod Control of Plant Growth: Flowering Time Genes Beyond Flowering. Front. Plant Sci. 2022, 12, 805635. [Google Scholar] [CrossRef] [Scilit]
- Roeber, V.M.; Schmülling, T.; Cortleven, A. The Photoperiod: Handling and Causing Stress in Plants. Front. Plant Sci. 2022, 12, 781988. [Google Scholar] [CrossRef] [Scilit]
- Gendron, J.M.; Leung, C.C.; Liu, W. Energy as a Seasonal Signal for Growth and Reproduction. Curr. Opin. Plant Biol. 2021, 63, 102092. [Google Scholar] [CrossRef] [Scilit]
- Wu, S.; Li, R.; Bu, C.; Zhu, C.; Miao, C.; Zhang, Y.; Cui, J.; Jiang, Y.; Ding, X. Photoperiodic Effect on Growth, Photosynthesis, Mineral Elements, and Metabolome of Tomato Seedlings in a Plant Factory. Plants 2024, 13, 3119. [Google Scholar] [CrossRef] [Scilit]
- Bhatta, M.; Sandro, P.; Smith, M.R.; Delaney, O.; Voss-Fels, K.P.; Gutierrez, L.; Hickey, L.T. Need for Speed: Manipulating Plant Growth to Accelerate Breeding Cycles. Curr. Opin. Plant Biol. 2021, 60, 101986. [Google Scholar] [CrossRef] [Scilit]
- Xu, Y.; Ibrahim, I.M.; Harvey, P.J. The Influence of Photoperiod and Light Intensity on the Growth and Photosynthesis of Dunaliella salina (Chlorophyta) CCAP 19/30. Plant Physiol. Biochem. 2016, 106, 305–315. [Google Scholar] [CrossRef] [Scilit]
- Elkins, C.; Van Iersel, M.W. Longer Photoperiods with the Same Daily Light Integral Improve Growth of Rudbeckia Seedlings in a Greenhouse. HortScience 2020, 55, 1676–1682. [Google Scholar] [CrossRef] [Scilit]
- Weaver, G.; Van Iersel, M.W. Longer Photoperiods with Adaptive Lighting Control Can Improve Growth of Greenhouse-Grown ‘Little Gem’ Lettuce (Lactuca sativa). HortScience 2020, 55, 573–580. [Google Scholar] [CrossRef] [Scilit]
- Jeong, S.J.; Zhen, S.; Zhang, Q.; Niu, G. Lowering Light Intensity While Extending Photoperiod at a Constant Daily Light Integral Synergistically Interacts with Warm Temperature to Enhance Leaf Expansion and Crop Yield in Lettuce in the Absence of Far-Red Light. Front. Plant Sci. 2025, 16, 1529455. [Google Scholar] [CrossRef] [Scilit]
- Dmitry, F.; Alexander, V. The Photoperiod/Light Intensity Ratio Affects the Yield of Microgreens Within One Daylight Integral. Mod. Concepts Dev. Agron. 2022, 11, 1097–1098. [Google Scholar] [CrossRef] [Scilit]
- Nohales, M.A.; Kay, S.A. Molecular Mechanisms at the Core of the Plant Circadian Oscillator. Nat. Struct. Mol. Biol. 2016, 23, 1061–1069. [Google Scholar] [CrossRef] [Scilit]
- Xu, X.; Yuan, L.; Yang, X.; Zhang, X.; Wang, L.; Xie, Q. Circadian Clock in Plants: Linking Timing to Fitness. J. Integr. Plant Biol. 2022, 64, 792–811. [Google Scholar] [CrossRef] [Scilit]
- Do Nascimento, A.S.M.; Henschel, J.M.; Felipe, S.H.S.; Rodrigues, A.A.C.; Figueiredo, F.A.M.M.D.A.; Ferraz, T.M.; Reis, F.D.O.; Corrêa, T.R.; Batista, D.S. Photoperiod and Circadian Regulation in Plants: A Review of Insights from In Vitro Studies. Biology 2025, 14, 1502. [Google Scholar] [CrossRef] [Scilit]
- Van Henten, E.J. Validation of a Dynamic Lettuce Growth Model for Greenhouse Climate Control. Agric. Syst. 1994, 45, 55–72. [Google Scholar] [CrossRef] [Scilit]
- Yudina, L.; Sukhova, E.; Gromova, E.; Mudrilov, M.; Zolin, Y.; Popova, A.; Nerush, V.; Pecherina, A.; Grishin, A.A.; Dorokhov, A.A.; et al. Effect of Duration of LED Lighting on Growth, Photosynthesis and Respiration in Lettuce. Plants 2023, 12, 442. [Google Scholar] [CrossRef] [Scilit]
- De Caluwé, J.; De Melo, J.R.F.; Tosenberger, A.; Hermans, C.; Verbruggen, N.; Leloup, J.-C.; Gonze, D. Modeling the Photoperiodic Entrainment of the Plant Circadian Clock. J. Theor. Biol. 2017, 420, 220–231. [Google Scholar] [CrossRef] [Scilit]
- Livak, K.J.; Schmittgen, T.D. Analysis of Relative Gene Expression Data Using Real-Time Quantitative PCR and the 2−ΔΔCT Method. Methods 2001, 25, 402–408. [Google Scholar] [CrossRef] [Scilit]
- Creux, N.; Harmer, S. Circadian Rhythms in Plants. Cold Spring Harb. Perspect. Biol. 2019, 11, a034611. [Google Scholar] [CrossRef] [Scilit]
- Lv, H.; Chen, C.; Luo, J.; Xiao, M.; Xiong, A.; Hou, X.; You, X. Skeleton Photoperiod Enhances Photosynthetic Yield in Celery via Circadian-Regulated Metabolic Coordination. Horticulturae 2025, 11, 520. [Google Scholar] [CrossRef] [Scilit]
- Xiao, M.; Cao, J. Genetic Oscillation Deduced from Hopf Bifurcation in a Genetic Regulatory Network with Delays. Math. Biosci. 2008, 215, 55–63. [Google Scholar] [CrossRef] [Scilit]
- Ukai-Tadenuma, M.; Yamada, R.G.; Xu, H.; Ripperger, J.A.; Liu, A.C.; Ueda, H.R. Delay in Feedback Repression by Cryptochrome 1 Is Required for Circadian Clock Function. Cell 2011, 144, 268–281. [Google Scholar] [CrossRef] [Scilit]
- Tokuda, I.T.; Akman, O.E.; Locke, J.C.W. Reducing the Complexity of Mathematical Models for the Plant Circadian Clock by Distributed Delays. J. Theor. Biol. 2019, 463, 155–166. [Google Scholar] [CrossRef] [Scilit]
- Greenwood, M.; Tokuda, I.T.; Locke, J.C.W. A Spatial Model of the Plant Circadian Clock Reveals Design Principles for Coordinated Timing. Mol. Syst. Biol. 2022, 18, e10140. [Google Scholar] [CrossRef] [Scilit]
- He, K.; Wang, L.; Ratkowsky, D.A.; Shi, P. Comparison of Four Light-Response Models Using Relative Curvature Measures of Nonlinearity. Sci. Rep. 2024, 14, 24058. [Google Scholar] [CrossRef] [Scilit]
- Liu, T.; Duan, W.; Chen, Z.; Yuan, J.; Xiao, D.; Hou, X.; Li, Y. Enhanced Photosynthetic Activity in Pak Choi Hybrids Is Associated with Increased Grana Thylakoids in Chloroplasts. Plant J. 2020, 103, 2211–2224. [Google Scholar] [CrossRef] [Scilit]
- Chen, J.-H.; Chen, S.-T.; He, N.-Y.; Wang, Q.-L.; Zhao, Y.; Gao, W.; Guo, F.-Q. Nuclear-Encoded Synthesis of the D1 Subunit of Photosystem II Increases Photosynthetic Efficiency and Crop Yield. Nat. Plants 2020, 6, 570–580. [Google Scholar] [CrossRef] [Scilit]
- Kanno, K.; Suzuki, Y.; Makino, A. A Small Decrease in Rubisco Content by Individual Suppression of RBCS Genes Leads to Improvement of Photosynthesis and Greater Biomass Production in Rice Under Conditions of Elevated CO2. Plant Cell Physiol. 2017, 58, 635–642. [Google Scholar] [CrossRef] [Scilit]
- Yamori, W.; Takahashi, S.; Makino, A.; Price, G.D.; Badger, M.R.; Von Caemmerer, S. The Roles of ATP Synthase and the Cytochrome b 6/ f Complexes in Limiting Chloroplast Electron Transport and Determining Photosynthetic Capacity. Plant Physiol. 2011, 155, 956–962. [Google Scholar] [CrossRef] [Scilit]
- Huang, W.; Tikkanen, M.; Cai, Y.-F.; Wang, J.-H.; Zhang, S.-B. Chloroplastic ATP Synthase Optimizes the Trade-off between Photosynthetic CO2 Assimilation and Photoprotection during Leaf Maturation. Biochim. Biophys. Acta (BBA)-Bioenerg. 2018, 1859, 1067–1074. [Google Scholar] [CrossRef] [Scilit]
- Huang, L.; Yang, P.; Cui, H.; Sun, Z.; Ren, S.; Wang, Z. Effects of Topdressing Ratio and Frequency on the Dry Matter, Yield, and Quality of Tomato and Celery under a Small Amount of Continuous Subsurface Drip Irrigation. Int. J. Agric. Biol. Eng. 2023, 16, 273–284. [Google Scholar] [CrossRef] [Scilit]
- Huang, T.; Liu, H.; Tao, J.-P.; Zhang, J.-Q.; Zhao, T.-M.; Hou, X.-L.; Xiong, A.-S.; You, X. Low Light Intensity Elongates Period and Defers Peak Time of Photosynthesis: A Computational Approach to Circadian-Clock-Controlled Photosynthesis in Tomato. Hortic. Res. 2023, 10, uhad077. [Google Scholar] [CrossRef] [Scilit]
- Li, S.; Yuan, T.; Ibrahim, M.; Wu, F. Rotational Strip Bean and Celery Intercropping Alters the Microbial Community to Improve Crop Yield and Soil Nutrients. Horticulturae 2024, 10, 432. [Google Scholar] [CrossRef] [Scilit]
- Anderson, J.M. Photoregulation of the Composition, Function, and Structure of Thylakoid Membranes. Annu. Rev. Plant Physiol. 1986, 37, 93–136. [Google Scholar] [CrossRef]
- Murchie, E.H.; Horton, P. Acclimation of Photosynthesis to Irradiance and Spectral Quality in British Plant Species: Chlorophyll Content, Photosynthetic Capacity and Habitat Preference. Plant Cell Environ. 1997, 20, 438–448. [Google Scholar] [CrossRef] [Scilit]
- Van Gestel, N.C.; Nesbit, A.D.; Gordon, E.P.; Green, C.; Paré, P.W.; Thompson, L.; Peffley, E.B.; Tissue, D.T. Continuous Light May Induce Photosynthetic Downregulation in Onion–Consequences for Growth and Biomass Partitioning. Physiol. Plant. 2005, 125, 235–246. [Google Scholar] [CrossRef] [Scilit]
- Pettersen, R.I.; Torre, S.; Gislerød, H.R. Effects of Leaf Aging and Light Duration on Photosynthetic Characteristics in a Cucumber Canopy. Sci. Hortic. 2010, 125, 82–87. [Google Scholar] [CrossRef] [Scilit]
Disclaimer/Publisher’s Note: The statements, opinions and data contained in all publications are solely those of the individual author(s) and contributor(s) and not of MDPI and/or the editor(s). MDPI and/or the editor(s) disclaim responsibility for any injury to people or property resulting from any ideas, methods, instructions or products referred to in the content. |
© 2026 by the authors. Licensee MDPI, Basel, Switzerland. This article is an open access article distributed under the terms and conditions of the Creative Commons Attribution (CC BY) license.