


Highlights
What are the main findings?
- Carbon and nitrogen substrates reshape metabolic flux to balance nutrient synthesis and redox status, with differential metabolites enriched in key metabolic pathways.
- A complete cascade mechanism was clarified in mycelium, in which nutrient supply triggers metabolic remodeling, regulates oxidative balance, and induces subsequent pathway response.
What are the implications of the main findings?
- The results lay theoretical support for precision fermentation and targeted biosynthesis of active ingredients in Phallus rubrovolvatus.
- An applicable metabolomics research system was constructed for the research of rare edible and medicinal fungi.
Abstract
The mycelium of Phallus rubrovolvatus contains abundant metabolites with broad application prospects in functional foods and pharmaceuticals. However, how carbon and nitrogen substrate availability regulate the accumulation dynamics of mycelial metabolites remains under-explored. In this study, the supply levels of carbon (glucose) and nitrogen (peptone) were optimized to select high-biomass mycelia. Integrating nutritional activity assays with metabolomics and redundancy analysis, the regulatory mechanisms governing carbon–nitrogen metabolic flux were deciphered. The results demonstrated that mycelial nutritional content and antioxidant capacity exhibited a progressive upward trend under three distinct modes: carbon-driven, nitrogen-driven, and carbon–nitrogen synergistic-driven regimes. In the optimal carbon–nitrogen synergistic-driven group, the contents of total soluble sugars, reducing sugars, flavonoids, total phenolics, and soluble proteins increased by 72.06%, 160.80%, 52.47%, 113.69%, and 8.21%, respectively, compared with the control group. Meanwhile, the scavenging rates of superoxide anion, hydroxyl, ABTS, and DPPH free radicals increased by 14.12%, 24.09%, 14.77%, and 66.47%, respectively, compared with the control group. Differentially accumulated metabolites were significantly enriched in amino acid metabolism, energy metabolism, and secondary metabolite biosynthesis pathways. Carbon and nitrogen substrates reshaped intracellular metabolic flux, cooperatively regulating nutrient synthesis and intracellular redox equilibrium. This work reveals a cascade-linking relationship in which nutrient supply triggers metabolic remodeling, regulates oxidative balance, and drives pathway response. It provides theoretical support for the precision fermentation and industrial upgrade of P. rubrovolvatus, while offering a valuable reference paradigm for the high-value exploitation of other rare edible and medicinal fungi.
1. Introduction
Phallus rubrovolvatus, belonging to the phylum Basidiomycota, class Agaricomycetes, order Phallales, family Phallaceae, and genus Phallus, is known as the “Queen of Fungi” [1]. As a rare edible and medicinal fungus, P. rubrovolvatus is rich in polysaccharides, proteins, amino acids, dietary fibers, and various trace elements [1]. It also exhibits marked antioxidant, immunomodulatory, and antitumor activities [2], conferring exceptionally high nutraceutical and medical value. However, traditional cultivation of P. rubrovolvatus involves long production cycles [3] and faces pronounced environmental constraints. Moreover, the active functional components in its fruiting bodies vary considerably due to multiple factors, including production region, climate, cultivation substrates, management practices, processing, and storage [4]. In contrast, submerged liquid fermentation enables the rapid and controlled accumulation of mycelial biomass and secondary metabolites, offering consistent bioactive composition and significantly shortened cycles, which represents the only viable path to transcend traditional cultivation and achieve industrial-scale production. However, systematic optimizations of liquid fermentation formulations for P. rubrovolvatus remain rarely reported.
Carbon and nitrogen sources serve as core nutritional factors in fungal liquid fermentation, with their types and concentrations directly dictating mycelial biomass and the synthesis of secondary metabolites [5]. Glucose and peptone are standard carbon and nitrogen sources for culturing edible fungi [6]; variations in their levels are tightly coupled with mycelial biomass, nutrient content, and antioxidant activity. Mycelial biomass directly reflects the efficiency of nutrient substrate utilization by the mycelia, signaling their capacity to absorb and assimilate carbon and nitrogen sources [7]. In solid medium screening experiments with Pleurotus ostreatus, Zwinkels et al. found that mycelial growth achieved its maximum density and rate only under appropriate concentration ratios of glucose to peptone [8]. Similarly, Wu et al. demonstrated in submerged liquid cultures of Pleurotus citrinopileatus that mycelial dry weight peaked at a glucose concentration of 35 g·L−1 and a peptone concentration of 36.8 g·L−1 [9]. Furthermore, Cui et al. observed during the optimization of Grifola frondosa liquid fermentation that regulating glucose and peptone concentrations increased not only mycelial biomass yield but also exopolysaccharide accumulation [10]. Intracellular soluble total sugars, reducing sugars, and proteins function as primary metabolites providing energy and structural foundations for mycelial growth [11], whereas flavonoids and total phenolics act as key secondary metabolites serving as the core material carriers for mycelial antioxidant activity [12]. Together, culture substrate, metabolites, and antioxidant activity form a progressive causal chain transmitted step-by-step from initial input to functional output. Currently, studies on edible fungal mycelia in liquid fermentation mostly focus on measuring single active components or antioxidant capacity [13,14], lacking a systemic correlation analysis that integrates “nutrient composition–antioxidant function–metabolic network” as a whole.
Metabolomics captures the holistic metabolic response to nutritional cues, enabling the identification of key pathways and regulatory nodes that drive bioactive metabolite accumulation. The metabolome offers a direct window into metabolic remodeling at the molecular level. Wang et al. assembled the genome of P. rubrovolvatus and integrated metabolome and transcriptome analyses, revealing that amino acids confer the unique flavor [15]. Another study characterized the metabolomic profiles of P. rubrovolvatus subjected to coal burning drying, electrothermal hot air drying, and freeze drying, identifying 69 differential metabolites and proposing potential biomarkers for quality control [16]. However, no study has employed metabolomics to investigate how carbon and nitrogen substrate levels regulate bioactive metabolite accumulation in the mycelium. Furthermore, conventional medium optimization approaches rely on empirical screening of biomass or single compound classes, which cannot reveal the global metabolic reconfiguration underlying phenotypic changes. Therefore, integrating untargeted metabolomics with systematic manipulation of carbon and nitrogen supply levels is a necessary step toward mechanistic understanding.
Building upon this, this study innovatively couples untargeted metabolomics technology into the formulation optimization process of P. rubrovolvatus liquid fermentation. It systematically analyzes the differential characteristics of mycelial metabolic profiles driven by different carbon and nitrogen substrates, and reveals the synergistic response relationships among nutritional components, antioxidant capacity, and metabolites through Redundancy Analysis (RDA) constrained modeling. The novelty of this study lies in transcending the limitations of traditional “black-box” optimization. By elucidating how nutritional regimes reshape mycelial metabolic flux and revealing the biochemical basis of media-regulated antioxidant activity through global metabolomics, this work establishes a theoretical framework for a novel fermentation paradigm. This paradigm enables the targeted accumulation of bioactive compounds via rational media design, offering significant scientific value and application potential for the high-value utilization of specialty fungal resources.
2. Materials and Methods
2.1. Experimental Materials
The P. rubrovolvatus strain “Wansun No. 3” was obtained from Bailu Modern Agricultural Technology Co., Ltd., located in Taihe County, Fuyang City, Anhui Province, China.
2.2. Preparation of Liquid Fermentation Broth
The preserved P. rubrovolvatus strain was inoculated onto a solid medium consisting of 50 g fresh bamboo leaves (Fengyang, Anhui, China), 200 g potatoes, 20 g glucose, 0.3 g KH2PO4, and 0.15 g MgSO4 (all purchased from Shanghai Titan Technology Co., Ltd., Shanghai, China) along with 20 g agar (Beijing Solarbio Science & Technology Co., Ltd., Beijing, China) dissolved in 1 L of distilled water. Following incubation at a constant temperature of 25 °C for 25 days and two successive subcultures for activation, the strain was transferred into a liquid seed medium containing 20 g glucose, 6 g peptone (Beijing Aoboxing Bio-tech Co., Ltd., Beijing, China), and 10 g corn steep liquor (Shanghai Yuanye Bio-Technology Co., Ltd., Shanghai, China) per liter of distilled water. This seed culture was maintained at 25 °C and 140 rpm in a rotary shaker (SPH-2102, Shanghai Shiping Equipment Co., Ltd., Shanghai, China) for 20 days. Subsequently, a 10% (v/v) inoculum of the liquid seed culture was introduced into a 250 mL Erlenmeyer flask (Haimen Rongxing Biotechnology Co., Ltd., Nantong, China) containing 150 mL of liquid fermentation medium and cultivated under the same conditions (25 °C, 140 rpm) for 10 days. The resulting cultures were subjected to suction-filtration using an apparatus (SHB-III, Zhengzhou Greatwall Scientific Industrial and Trade Co., Ltd., Zhengzhou, China) and freeze-drying (FD-1A-50, Beijing Boyikang Laboratory Instruments Co., Ltd., Beijing, China) to obtain the P. rubrovolvatus mycelia.
2.3. Liquid Fermentation Experiments
2.3.1. Single-Factor Experiments
With other components held constant, glucose concentrations (20, 25, 30, 35, and 40 g·L−1) were first evaluated relative to the control (CK: 20 g·L−1 glucose, 6 g·L−1 peptone), yielding the optimal glucose formula (Pr1) based on dry weight. Based on this optimal glucose concentration, peptone levels (6, 9, 12, 15, and 18 g·L−1) were subsequently screened to establish the final formulation (Pr2) for peak biomass accumulation.
2.3.2. Orthogonal Experimental Design
Based on the single-factor trial results, glucose and peptone concentrations were selected as the key variables, with three levels established for each factor. An L9(32) orthogonal experimental design was implemented to optimize these two factors across three levels, ultimately determining the optimal formulation combination (Pr3) for maximizing mycelial biomass accumulation.
2.4. Determination of Nutritional Components
For the mycelia harvested from formulations CK, Pr1, Pr2, and Pr3, nutritional parameters were determined using established assays.
Total soluble sugars were determined using a modified phenol-sulfuric acid method [17]. Briefly, 0.1 g dried mycelium powder was mixed with 7 mL distilled water and extracted in a water bath at 80 °C for 3 h. After cooling to room temperature, the mixture was centrifuged at 4500 rpm for 10 min, and the supernatant was collected. After a 50-fold dilution, 200 µL of this diluted solution was mixed with 100 µL of 5% (w/v) phenol solution and 500 µL of concentrated sulfuric acid. After vortexing, the reaction mixture was heated in a boiling water bath for 20 min. The absorbance was measured at 490 nm using a UV–Vis spectrophotometer (U-T6PC, Yipu Instrument Manufacturing Co., Ltd., Shanghai, China). D-glucose was used as the reference standard. All samples were analyzed in triplicate. Total soluble sugar content was calculated from the standard curve and expressed as glucose equivalents (mg glucose·g−1 dry mycelium).
where Ctest = glucose concentration of the test sample calculated from the standard curve (mg·mL−1);
D = dilution factor of the sample supernatant;
Vtotal = total volume of the aqueous extraction solution (mL);
m = dry weight of mycelium powder for extraction (g).
Reducing sugars were quantified using a modified 3,5-dinitrosalicylic acid (DNS) colorimetric method [18]. Briefly, 0.1 g dried mycelium powder was homogenized with 10 mL distilled water and incubated in a water bath at 80 °C for 30 min. After centrifugation, the supernatant was collected as the extraction solution. An aliquot (400 µL) of the extraction solution was mixed with 300 µL of DNS reagent in a 10 mL test tube. After thorough mixing, the tube was heated in a boiling water bath for 5 min and then cooled to room temperature. Subsequently, 4.3 mL of distilled water was added and mixed well. The absorbance was measured at 540 nm using a UV–Vis spectrophotometer (U-T6PC, Yipu Instrument Manufacturing Co., Ltd., Shanghai, China). D-glucose was used as the reference standard. All samples were analyzed in triplicate. Reducing sugar content was calculated based on the standard curve and expressed as glucose equivalents (mg glucose·g−1 dry mycelium).
where x = glucose concentration calculated from the standard curve (mg·mL−1);
- Vtotal = total volume of the aqueous extraction solution (mL);
- Vtest = volume of extraction solution taken for the color reaction (mL);
- m = dry weight of mycelium powder for extraction (g).
Flavonoids were analyzed via a modified sodium nitrite–aluminum nitrate colorimetric method [19]. Briefly, 0.2 g dried mycelium powder was mixed with 6 mL of 72% ethanol. Ultrasonic extraction was performed at 51 °C with 300 W power for 51 min. After cooling to room temperature, the mixture was centrifuged at 4000 rpm for 10 min, and the supernatant was collected. The residue was re-extracted twice under identical conditions to obtain the final test solution. The solution was diluted 10-fold with distilled water to a final volume of 10 mL. Then, 100 µL of 5% (w/v) sodium nitrite solution was added, mixed well, and allowed to stand for 6 min. Subsequently, 100 µL of 10% (w/v) aluminum chloride solution was added, mixed, and incubated for another 6 min. Afterwards, 1 mL of 1 mol·L−1 NaOH solution and 300 µL of 60% ethanol were added sequentially. The mixture stood for 12 min, and the absorbance was measured at 510 nm using a UV–Vis spectrophotometer (U-T6PC, Yipu Instrument Manufacturing Co., Ltd., Shanghai, China). All samples were analyzed in triplicate. Rutin was used as the reference standard.
where Corig = rutin concentration calculated from the standard curve (mg·mL−1);
- Vtotal = total volume of the extraction solution (mL);
- m = dry weight of mycelium powder for extraction (g).
Total phenols were quantified using a modified Folin–Ciocalteu colorimetric method [20]. Briefly, 0.2 g dried mycelium powder was mixed with 6 mL of 72% ethanol. Ultrasonic extraction was performed at 51 °C with 300 W power for 51 min. After cooling to room temperature, the mixture was centrifuged at 4000 rpm for 10 min, and the supernatant was collected. The residue was re-extracted twice under the same conditions to obtain the test solution. An aliquot of 100 µL test solution was mixed with 400 µL of distilled water, and 0.5 mL of Folin–Ciocalteu reagent was added and mixed thoroughly. After incubation in the dark for 2 min, 2 mL of 7.5% (w/v) sodium carbonate solution and 1 mL of distilled water were added sequentially. The mixture was incubated in a water bath at 40 °C for 30 min under dark conditions. The absorbance was measured at 760 nm using a UV–Vis spectrophotometer (U-T6PC, Yipu Instrument Manufacturing Co., Ltd., Shanghai, China). Gallic acid was used as the reference standard. The standard stock solution was prepared by dissolving accurately weighed gallic acid dried to constant weight in distilled water. All samples were analyzed in triplicate.
where Ctest = gallic acid concentration of the test sample calculated from the standard curve (mg·mL−1);
- Vtotal = total volume of the extraction solution (mL);
- Vabs = volume of supernatant taken for the color reaction (mL);
- m = dry weight of mycelium powder for extraction (g).
Soluble protein content was evaluated by the Coomassie Brilliant Blue (Bradford) method [21]. Briefly, 0.2 g dried mycelium powder was mixed with 3 mL distilled water and extracted in a water bath at 55 °C for 2.5 h. After cooling to room temperature, the mixture was centrifuged at 4000 rpm for 15 min, and the supernatant was collected as the test solution. An aliquot of 100 µL test solution was mixed with 500 µL Coomassie brilliant blue reagent and shaken thoroughly. After standing for 5 min, the absorbance was measured at 595 nm using a UV–Vis spectrophotometer (U-T6PC, Yipu Instrument Manufacturing Co., Ltd., Shanghai, China). Protein content was calculated from the standard curve. Bovine serum albumin (BSA) was used as the reference standard. All samples were analyzed in triplicate.
where Ctest = BSA concentration calculated from the standard curve (mg·mL−1);
- Vtotal = total volume of the aqueous extraction solution (mL);
- m = dry weight of mycelium powder for extraction (g).
2.5. Evaluation of Antioxidant Activities
The antioxidant potential of the mycelia obtained from formulations CK, Pr1, Pr2, and Pr3 was evaluated through multiple assays. Briefly, dried mycelium powder was mixed with distilled water at a solid–liquid ratio of 1:30, followed by extraction in an 80 °C water bath for 3 h. After cooling and centrifugation, the supernatant was collected, concentrated, and freeze-dried to yield crude aqueous extract powder. This powder was reconstituted with distilled water to prepare a 2.0 mg·mL−1 aqueous extract solution for subsequent antioxidant activity assays.
Superoxide anion radical scavenging activity was determined using a modified pyrogallol autoxidation method [22]. Briefly, 200 μL aqueous extract, 5.7 mL 0.05 mol·L−1 Tris–HCl buffer (pH 8.2), and 0.1 mL 6 mmol·L−1 pyrogallol solution were mixed thoroughly. The mixture was incubated in a water bath at 25 °C for 6 min, and absorbance was measured at 320 nm and recorded as Ai. A0 was obtained by replacing sample extract with equal-volume distilled water, and At was determined by replacing pyrogallol solution with equal-volume distilled water. All measurements were performed in triplicate, and the superoxide anion radical scavenging rate was calculated according to the established formula. The content was calculated according to the following equation:
where Ai = absorbance of the reaction system containing sample extract;
- At = absorbance of the blank system without pyrogallol;
- A0 = absorbance of the control system without sample extract.
Hydroxyl radical scavenging activity was evaluated using a modified salicylic acid colorimetric method [23]. Briefly, 1 mL aqueous extract, 1 mL 10 mmol·L−1 ferrous sulfate solution, 1 mL 10 mmol·L−1 salicylic acid solution, and 1 mL 6 mmol·L−1 hydrogen peroxide solution were mixed and incubated at 37 °C for 30 min. After rapid cooling, absorbance was measured at 510 nm and recorded as Ai. A0 was measured using distilled water instead of sample extract, and At was measured using distilled water instead of hydrogen peroxide. All experiments were conducted in triplicate, and the hydroxyl radical scavenging rate was calculated. The content was calculated according to the following equation:
where Ai = absorbance of the complete reaction system containing the sample;
- At = absorbance of the blank system without hydrogen peroxide;
- A0 = absorbance of the control system without sample extract.
DPPH radical scavenging activity was measured using a modified DPPH assay [24]. A 0.1 mmol·L−1 DPPH solution was prepared with methanol. In a test tube, 1 mL aqueous extract was mixed with 2 mL DPPH solution, and the mixture reacted fully at room temperature in the dark for 30 min. The absorbance was detected at 517 nm using 70% methanol as blank and recorded as Ai. A0 was obtained by replacing sample extract with equal-volume 70% methanol, and At was obtained by replacing DPPH solution with equal-volume 70% methanol. All samples were analyzed in triplicate, and the DPPH radical scavenging rate was calculated. The content was calculated according to the following equation:
where Ai = absorbance of the reaction system containing the sample extract;
- At = absorbance of the blank system without DPPH solution;
- A0 = absorbance of the control system without sample extract.
ABTS radical cation scavenging activity was determined via a modified ABTS decolorization assay [25]. ABTS working solution was freshly prepared by mixing 7 mmol·L−1 ABTS solution and 2.45 mmol·L−1 potassium persulfate solution at a volume ratio of 1:1, followed by incubation in the dark for 16 h to generate ABTS radical cations. The stock solution was diluted with methanol and stored at 30 °C to adjust its absorbance to 0.70 ± 0.02 at 734 nm to obtain the working solution. For the sample group, 0.8 mL ABTS working solution and 0.2 mL aqueous extract were added sequentially into a quartz cuvette, shaken for 10 s, and kept static for 6 min. The absorbance A1 was recorded at 734 nm. For the blank group, the sample solution was replaced with 95% ethanol to obtain A0. All measurements were performed in triplicate. The content was calculated according to the following equation:
where A1 = absorbance of the reaction system containing the sample extract;
- A0 = absorbance of the blank control system without sample extract.
2.6. Metabolomic Analysis via LC-MS/MS
2.6.1. Sample Collection and Preparation
The mycelium dry powder (80 mg) of P. rubrovolvatus obtained from CK, Pr1, Pr2, and Pr3 cultures were quickly frozen in liquid nitrogen immediately and ground into fine powder with a mortar and pestle. 1000 μL methanol/acetonitrile/H2O (2:2:1, v/v/v) was added to homogenized solution for metabolite extraction. The mixture was centrifuged for 20 min (10,900 rpm, 4 °C). The supernatant was dried in a vacuum centrifuge. For LCMS analysis, the samples were redissolved in 100 μL acetonitrile/water (1:1, v/v) solvent and centrifuged at 14,000× g at 4 °C for 15 min, then the supernatant was injected. All samples were prepared in three independent biological replicates (n = 3) for each formulation (CK, Pr1, Pr2, and Pr3), yielding a total of 12 samples for LC-MS analysis.
2.6.2. LC-MS/MS Analysis
Analysis was performed using a UHPLC (Thermo Fisher Scientific, Waltham, MA, USA) coupled to an Orbitrap Exploris™ 480 mass spectrometer (Thermo Fisher Scientific, Waltham, MA, USA).
For HILIC separation, samples were analyzed using a 2.1 mm × 100 mm ACQUITY UPLC BEH Amide 1.7 µm column (Waters Corporation, Dublin, Ireland) maintained at 25 °C, with a flow rate of 0.5 mL·min−1 and an injection volume of 2 μL. Samples were kept at 4 °C in the autosampler throughout the analysis. In both ESI positive and negative modes, the mobile phase contained A (25 mM ammonium acetate and 25 mM ammonium hydroxide in water) and B (acetonitrile). The gradient was 95% B for 0.5 min and was linearly reduced to 65% in 4.5 min, and then was reduced to 40% in 0.5 min, and then increased to 95% in 0.5 min and kept for 2 min.
The ESI source conditions were set as follows: Ion Source Gas1 as 50, Ion Source Gas2 as 2, source temperature as 350 °C, IonSpray Voltage Floating (ISVF) as +3500 V/−2800 V. In MS only acquisition, the instrument was set to acquire over the m/z range 70–1200 Da, the resolution was set at 60,000 and the accumulation time was set at 100 ms. In auto MS/MS acquisition, the instrument was set to acquire over the m/z range 70–1200 Da, the resolution was set at 60,000 and the accumulation time was set at 100 ms, dynamic exclusion duration of 4 s. Quality control (QC) samples, prepared by pooling equal volumes of all samples, were injected at regular intervals throughout the analytical sequence to monitor instrument stability and ensure data reproducibility.
2.6.3. Data Processing
The raw MS data were converted to MzXML files using ProteoWizard MSConvert (Version 3.0.20360, https://proteowizard.sourceforge.io/, accessed on 8 May 2026) and subsequently imported into the freely available XCMS software (Version 4.4.0, Scripps, La Jolla, CA, USA) [26]. For peak picking, the following parameters were used: centWave m/z = 10 ppm, peakwidth = c (10, 60), prefilter = c (10, 100). For peak grouping, bw = 5, mzwid = 0.025, minfrac = 0.5 were used. CAMERA (Collection of Algorithms of MEtabolite pRofile; https://bioconductor.org/packages/CAMERA/, accessed on 8 May 2026) was used for annotation of isotopes and adducts [27]. In the extracted ion features, only the variables having more than 50% of the nonzero measurement values in at least one group were kept. Metabolite annotation of metabolites was performed by comparing of accuracy m/z value (<10 ppm), and MS/MS fragmentation spectra with an in-house database established with available authentic standards (Shanghai Applied Protein Technology, containing over 6000 metabolite entries). In addition, metabolites were identified using tandem mass spectrometry (MS/MS) spectral matching was performed against four public spectral libraries, including MassBank, METLIN, HMDB, and MoNA, to in-house spectral libraries cross-validate the identification results. This dual-strategy approach, combining with public database matching, substantially improves the reliability of metabolite identification. Metabolite identification confidence was assigned following the tiered classification system proposed by the Metabolomics Standards Initiative (MSI). Metabolites matched by MS/MS spectra and validated via co-elution with authentic reference standards under identical chromatographic conditions were assigned to Level 1 (identified metabolites). Compounds annotated only by MS/MS spectral similarity without co-elution confirmation against reference standards were classified as Level 2 (putatively annotated compounds). All metabolites detected in the present study were categorized according to these criteria. For consistent terminology throughout the manuscript, all matched chemical compounds are uniformly termed “putatively annotated metabolites” in the main text. All raw LC–MS metabolomics datasets and post-processed quantitative results have been deposited to the MetaboLights repository hosted by EMBL-EBI (https://www.ebi.ac.uk/metabolights/, accessed on 6 August 2026) under study accession MTBLS15277.
2.7. Statistical Analysis
Excel 2016 and Origin 2021 were used to analyze and plot the nutritional component and antioxidant scavenging capacity data. Pearson’s correlation analysis was performed to evaluate the correlations between nutritional components and antioxidant activities. After sum-normalization, the processed data were analyzed by R package (Version 3.6.3, https://bioconductor.org/packages/ropls/, accessed on 8 May 2026) [28], where it was subjected to multivariate data analysis, orthogonal partial least-squares discriminant analysis (OPLS-DA). The 7-fold cross-validation and response permutation testing were used to evaluate the robustness of the model. The variable importance in the projection (VIP) value of each variable in the OPLS-DA model was calculated to indicate its contribution to the classification [29]. Student’s t test was applied to determine the significance of differences between two groups of independent samples [30]. We adopted the criteria of variable importance in projection (VIP) > 1, fold change (FC) > 2 or < 0.5, and false discovery rate (FDR) < 0.05 to screen significantly changed metabolites. In addition, for metabolic pathway enrichment analysis, pathways with FDR < 0.05 and enrichment factor > 0.1 were considered significantly enriched. A Sankey diagram was then generated using R language based on the relationships between metabolites and their associated pathways. Redundancy analysis (RDA) was performed using the vegan package in R (v4.3.2; https://cran.r-project.org/web/packages/, accessed on 8 May 2026) to evaluate the impacts of phenotypic traits (nutritional components and antioxidant activities) on metabolite profiles. The statistical significance of the RDA model was verified using permutation tests.
3. Results
3.1. Effects of Single Factors on Mycelial Biomass
While maintaining the peptone concentration (6 g·L−1) and other components constant, different glucose concentrations were evaluated. As shown in Figure 1A, the mycelial dry weight reached its peak at a glucose concentration of 30 g·L−1 (Pr1), representing a 19.74% increase compared with the control group (CK, 20 g·L−1 glucose). When the glucose concentration was further increased to 40 g·L−1, the mycelial dry weight dropped to its minimum value, showing a 10.30% decrease relative to CK. These results indicate that mycelial dry weight exhibited an initial increase followed by a decline as glucose concentrations increased in the liquid fermentation medium. Therefore, 30 g·L−1 was identified as the optimal glucose concentration for mycelial growth.
Figure 1.
Effects of different glucose concentrations (A) and peptone concentrations (B) on mycelial biomass of P. rubrovolvatus under single-factor conditions. Different lowercase letters (a–e) indicate significant differences at p < 0.05.
While maintaining the optimal glucose concentration (30 g·L−1) and other components constant, different peptone concentrations were investigated. As illustrated in Figure 1B, the mycelial dry weight peaked at 9.13 g·L−1 when the peptone concentration was 15 g·L−1 (Pr2), which was a 10.67% increase compared to that obtained at 6 g·L−1 peptone. When the peptone concentration was further elevated to 18 g·L−1, the mycelial dry weight decreased by 14.85% from its maximum. These findings demonstrate that mycelial dry weight displayed a trend of gradual increase followed by a decrease as peptone concentrations increased. Consequently, with all other liquid medium components held constant, the formulation containing 30 g·L−1 glucose and 15 g·L−1 peptone provided the optimal conditions for mycelial growth.
3.2. Optimization of Mycelial Biomass via Orthogonal Design
Based on the single-factor experimental results, an L9(32) orthogonal array design was employed to optimize the medium composition for maximizing mycelial biomass. Factors and levels were selected based on the prior results, as detailed in Table 1. As presented in Table 2, mycelial dry weight varied significantly across the nine experimental combinations. Run 2 (25 g·L−1 glucose and 15 g·L−1 peptone) achieved the maximum biomass of 9.82 g·L−1, whereas Run 9 (35 g·L−1 glucose and 18 g·L−1 peptone) resulted in the minimum of 7.71 g·L−1, indicating that both glucose and peptone concentrations significantly affect fermentation performance. Range analysis revealed that the influence of peptone concentration (R = 1.06) on biomass was more pronounced than that of glucose concentration (R = 0.86). Analysis of the mean values (K-values) indicated that the optimal biomass was obtained at 25 g·L−1 glucose (K1 = 27.42, k1 = 9.14) and 15 g·L−1 peptone (K2 = 27.62, k2 = 9.21). Two-way ANOVA was further performed to confirm the statistical significance of each factor and their interaction (Table 3). The results showed that both glucose (F = 23.804, p < 0.001) and peptone (F = 31.545, p < 0.001) exerted significant main effects, and their interaction was also statistically significant (F = 4.012, p = 0.017). The final optimal medium was determined as 25 g·L−1 glucose and 15 g·L−1 peptone (Pr3).
Table 1.
Factors and levels of orthogonal test for liquid fermentation broth of P. rubrovolvatus.
Table 2.
Orthogonal experimental results for liquid fermentation of P. rubrovolvatus.
Table 3.
Two-way ANOVA results for the effects of glucose and peptone concentrations on mycelial dry weight of P. rubrovolvatus.
3.3. Nutritional Profile
Along with the increase in mycelial biomass, the content of total soluble sugars reached its maximum of 166.56 mg·g−1 in Pr3, representing a 72.06% increase compared with the control group (Figure 2A). The reducing sugar content reached a peak of 112.77 mg·g−1 in Pr3, showing a 160.80% increase compared with the control group (Figure 2B). The flavonoid content peaked at 3.08 mg·g−1 in Pr3, which was a 52.47% increase relative to the control group (Figure 2C). The total phenolic content reached its maximum value of 8.21 mg·g−1 in Pr3, representing a 113.69% increase over the control group (Figure 2D). The protein content reached its highest level of 52.86 mg·g−1 in Pr3, showing an 8.21% increase compared with the control group (Figure 2E). Therefore, the levels of all measured nutritional components were highest in Pr3. These findings revealed that nutritional component contents rose alongside the accumulation of mycelial biomass, presenting an obvious ascending tendency.
Figure 2.
Nutritional components ((A): Total soluble sugar; (B): Reducing sugar; (C): Flavonoids; (D): Total phenolics; (E): Protein) of P. rubrovolvatus mycelia under different samples. Different letters indicate significant differences at p < 0.05.
3.4. Antioxidant Activities
At an aqueous extract concentration of 2 mg·mL−1 (Figure 3), all radical scavenging capacities of Pr3 were significantly superior to those of the control group (CK). Specifically, the scavenging rates for superoxide anion, hydroxyl, ABTS, and DPPH free radicals reached 57.77%, 95.56%, 66.12%, and 70.12%, respectively, representing increases of 14.12%, 24.09%, 14.77%, and 66.47% over CK. These results indicate that the trends in antioxidant activity parameters were significantly and positively correlated with mycelial biomass accumulation. This demonstrates that optimizing the medium formulation effectively promoted mycelial biomass accumulation and enhanced its antioxidant activity.
Figure 3.
Antioxidant activities of P. rubrovolvatus mycelia under different formulations. (A) Superoxide anion radical scavenging rate; (B) Hydroxyl radical scavenging rate; (C) ABTS free radical scavenging rate; (D) DPPH radical scavenging rate. Different letters indicate significant differences at p < 0.05.
3.5. Relationship Between Nutritional Components and Antioxidant Activities
As shown in Figure 4, strong positive intercorrelations were observed among total soluble sugar, reducing sugar, flavonoids, and protein, with correlation coefficients ranging from 0.87 to 0.97. Conversely, total phenols were weakly to moderately negatively correlated with these components (r = −0.24 to −0.58). The relationships between antioxidant capacities and nutritional components varied considerably depending on the specific assay employed. For ABTS radical scavenging, the activity was weakly to moderately positively associated with soluble sugar (r = 0.36), reducing sugar (r = 0.33), flavonoids (r = 0.46), and protein (r = 0.36), while showing only a weak negative correlation with total phenols (r = −0.26). Superoxide anion scavenging exhibited a moderate positive correlation exclusively with total phenols (r = 0.41), and its correlations with other nutrients were negligible, ranging from −0.21 to 0.04. Hydroxyl radical scavenging capacity did not follow any consistent trend in relation to most nutritional components, with the sole exception of a moderate negative correlation with total phenols (r = −0.44). DPPH radical scavenging, in contrast, demonstrated moderate positive correlations with soluble sugar (r = 0.69), reducing sugar (r = 0.53), flavonoids (r = 0.69), and protein (r = 0.64), alongside a moderate negative correlation with total phenols (r = −0.54).
Figure 4.
Partial correlation heatmap between nutritional components and antioxidant activities of P. rubrovolvatus mycelia, controlling for the effect of mycelial dry weight. The size of the circle represents the magnitude of the correlation coefficient.
3.6. Untargeted Metabolomics Analysis of Mycelia
3.6.1. Classification of Metabolites
A total of 2376 metabolites were putatively annotated under combined positive and negative ion modes. As depicted in Figure 5, these metabolites were categorized into 12 distinct superclasses. The dominant superclass was lipids and lipid-like molecules (523, 22.01%), followed by organic acids and derivatives (511, 21.51%) and organoheterocyclic compounds (487, 20.50%). The remaining classes included benzenoids (352, 14.81%), organic oxygen compounds (176, 7.41%), phenylpropanoids and polyketides (97, 4.08%), organic nitrogen compounds (60, 2.53%), nucleosides, nucleotides, and analogues (52, 2.19%), alkaloids and derivatives (37, 1.56%), and lignans, neolignans, and related compounds (12, 0.51%). Additionally, 14 metabolites were assigned to others (0.59%), with the remaining 55 classified as undefined (2.30%).
Figure 5.
Superclass classification of metabolites detected in P. rubrovolvatus mycelia.
3.6.2. OPLS-DA and Permutation Tests
Orthogonal partial least squares-discriminant analysis (OPLS-DA) is a modified variant of PLS-DA that filters out noise unrelated to categorical variables, thereby enhancing model interpretability and reliability. The OPLS-DA score plot comprises two principal components: the predictive component (t[1]) and the orthogonal component (tO[1]). Specifically, t[1] maximizes inter-group differences to achieve effective sample discrimination, whereas tO[1] primarily reflects intra-group variation. As shown in Figure 6, samples between the Pr3 and CK groups in Figure 6E were distinctly separated along the t[1] axis, exhibiting a substantial inter-group distance, with t[1] accounting for 70.7% of the total variation. This indicates the most pronounced metabolic divergence between Pr3 and CK mycelia. In Figure 6A, t[1] explained 56.3% of the variation, demonstrating moderate inter-group separation between Pr1 and CK; however, the low intra-group dispersion along tO[1] suggests that their metabolic differences were likely driven by a restricted subset of key metabolites. Conversely, Figure 6C yielded the lowest t[1] explanatory power (51.4%), corresponding to the minimal distinction between Pr2 and Pr1.
Figure 6.
OPLS-DA score plots and permutation test validation for P. rubrovolvatus mycelia samples. (A,C,E) OPLS-DA score plots for Pr1 vs. CK, Pr2 vs. Pr1, and Pr3 vs. CK, respectively. (B,D,F) Permutation test plots (200 iterations) for Pr1 vs. CK, Pr2 vs. Pr1, and Pr3 vs. CK, respectively. The dashed lines in panels (B,D,F) represent the fitted regression lines of R2Y and Q2 generated during the permutation test.
To eliminate potential overfitting inherent to supervised modeling, a 200-iteration permutation test was conducted to evaluate the validity and robustness of the OPLS-DA models. As illustrated in Figure 6B,D,F, the original R2 and Q2 values consistently exceeded those generated by random permutations. Although the intercepts of the Q2 regression lines remained near zero and did not fall below zero, the gradual decline of R2 and Q2 with decreasing permutation retention indicates no significant overfitting, thus confirming satisfactory model stability and predictive capability.
Notably, despite exhibiting a slightly lower R2 cumulative value, the Pr3 vs. CK comparison yielded the highest principal component variance coverage and the most distinct spatial segregation, highlighting the most pronounced metabolomic divergence between these conditions. Overall, these well-validated OPLS-DA models provide a sound foundation for the subsequent screening of differentially expressed metabolites.
3.6.3. Differentially Expressed Metabolites
On the basis of the validated OPLS-DA models, volcano plots were constructed to visually illustrate the dynamic changes in differentially expressed metabolites (DEMs) (Figure 7). The majority of candidate metabolites were distributed beyond the designated fold-change and statistical significance thresholds, attesting to the stringency and reliability of the selection criteria. Across the three comparison groups, the total number of DEMs displayed a progressive upward trend, accompanied by distinct changes in up- and down-regulated metabolites. Specifically, the number of up-regulated DEMs increased continuously across the comparison groups, while the number of down-regulated DEMs slightly decreased first and then rose sharply. Among all comparisons, the Pr1 vs. CK pair accumulated the fewest total DEMs (471). The Pr2 vs. Pr1 group demonstrated the most balanced proportion between up- and down-regulated metabolites. In contrast, the Pr3 vs. CK comparison yielded the largest count of DEMs (670), indicating the most extensive metabolic reprogramming under the Pr3 condition in P. rubrovolvatus.
Figure 7.
Volcano plots of DEMs among different comparison groups. (A–C) Volcano plots representing Pr1 vs. CK, Pr2 vs. Pr1, and Pr3 vs. CK, respectively. The x-axis represents the logarithmic fold-change (log2(FC)), and the y-axis indicates the statistical significance (−log10(p value)). Red and blue dots designate significantly up- and down-regulated metabolites, respectively, whereas grey dots signify non-significant metabolites. The spot size is positively correlated with the VIP score, where larger spots denote higher VIP values.
3.6.4. Metabolic Pathway Enrichment and Correlation Analysis of DEMs
A Sankey diagram was constructed to systematically map the distribution and functional associations between DEMs and their annotated Kyoto Encyclopedia of Genes and Genomes (KEGG) pathways (Figure 8).
Figure 8.
Sankey diagram illustrating the relationship between differentially expressed metabolites and enriched KEGG pathways: Panels (A–C) correspond to Pr1 vs. CK, Pr2 vs. Pr1, and Pr3 vs. CK, respectively. Rectangles on the left denote the annotated significantly differential metabolites, where red represents up-regulated relative abundance and blue signifies down-regulation; darker color shading indicates a larger fold change in metabolite expression between groups, reflecting a more pronounced regulation trend. Circles on the right designate enriched KEGG pathways, with circle area proportional to the pathway enrichment factor. The thickness of the connecting lines corresponds to the absolute logarithm of the fold change, log2(FC).
Among the significantly enriched metabolic pathways in the Pr1 vs. CK comparison (Figure 8A), succinic acid was significantly up-regulated across phenylalanine metabolism, alanine, aspartate and glutamate metabolism, and the cAMP signaling pathway. Vitamin K1 and α-Tocopheryl acetate displayed the thickest connectivity bands with vitamin digestion and absorption, corresponding to the highest fold change (FC) values, and were significantly up-regulated in this pathway. Conversely, phenylalanine was significantly down-regulated across five metabolic pathways: phenylalanine metabolism, mineral absorption, cyanoamino acid metabolism, phenylalanine, tyrosine and tryptophan biosynthesis, and aminoacyl-tRNA biosynthesis. Furthermore, its derivative, N-acetyl-L-phenylalanine, was significantly down-regulated in phenylalanine metabolism.
Among the metabolic pathways significantly enriched in the Pr2 vs. Pr1 comparison (Figure 8B), serotonin exhibited the largest up-regulation magnitude, predominantly enriched in taste transduction and the cAMP signaling pathway. Lotaustralin and linamarin were significantly up-regulated within cyanoamino acid metabolism. D-erythro-imidazolylglycerol phosphate was up-regulated in histidine metabolism, whereas histidine and 1-methyl-L-histidine were significantly down-regulated in this pathway. In phenylalanine metabolism, phenylalanine and its derivatives, N-acetyl-L-phenylalanine and phenaceturic acid, were synchronously up-regulated. Tyrosine was synchronously up-regulated across five metabolic pathways: cyanoamino acid metabolism, phenylalanine, tyrosine and tryptophan biosynthesis, thiamine metabolism, phenylalanine metabolism, and aminoacyl-tRNA biosynthesis. L-citrulline was up-regulated in the arginine biosynthesis pathway. Conversely, sucrose was down-regulated in both the phosphotransferase system (PTS) and taste transduction. L-methionine was significantly down-regulated in the aminoacyl-tRNA biosynthesis pathway. Thiamine monophosphate was significantly down-regulated in thiamine metabolism. N-acetyl-D-glucosamine was significantly down-regulated in the phosphotransferase system (PTS). Further analysis revealed that the majority of metabolites enriched in the Pr2 vs. Pr1 comparison were closely associated with amino acids.
Among the metabolic pathways significantly enriched in the Pr3 vs. CK comparison (Figure 8C), all DEMs were consistently up-regulated. Notably, choline metabolism in cancer exhibited the highest degree of pathway enrichment, with 1-pentadecanoyl-sn-glycero-3-phosphocholine annotated as its associated DEM, followed by arginine biosynthesis, in which L-citrulline was up-regulated. Within mineral absorption, both L-methionine and valine were up-regulated, while L-methionine and folate were likewise up-regulated in folate transport and metabolism. Succinic acid in the glucagon signaling pathway and 2,3-pyridinedicarboxylic acid in beta-alanine metabolism were both elevated. In linoleic acid metabolism, linoleic acid and FA 18:2 + 2O similarly displayed an up-regulated trend. Furthermore, succinic acid was annotated as a shared DEM across the cAMP signaling pathway, other carbon fixation pathways, and nicotinate and nicotinamide metabolism. In addition to succinic acid, nicotinate and nicotinamide metabolism contained propionic acid and 2,3-pyridinedicarboxylic acid. In the pentose phosphate pathway, 2-deoxyribose 5-phosphate was up-regulated. Valine and succinic acid were up-regulated in cyanoamino acid metabolism and lysine degradation, respectively. Ketoleucine was elevated in lipoic acid metabolism. Additionally, within bile secretion, folate was all up-regulated.
3.6.5. Redundancy Analysis (RDA) of DEMs in Relation to Nutritional Components and Antioxidant Activities
Figure 9A depicts the redundancy analysis (RDA) evaluating the relationships between nutritional components and (DEMs. The first two axes, RDA1 and RDA2, accounted for 53.96% and 21.43% of the total metabolic variance, respectively, yielding a cumulative explained variance of 78.89%. Global permutation tests showed high statistical significance for the overall model (F = 12.33, p = 0.001), indicating that nutritional components were strongly associated with the inter-group variation in metabolite profiles. Figure 9B illustrates the RDA between antioxidant activity indicators and DEMs. RDA1 and RDA2 explained 46.08% and 13.60% of the total variance, respectively, with a cumulative explained variance of 59.68%. The global permutation test confirmed the statistical validity of the model (F = 3.5606, p = 0.004). As evidenced by Figure 9, the clustering patterns of DEMs exhibited marked consistency. Specifically, metabolites M2, M3, M4, M7, M8, and M9 (detailed nomenclature provided in Table 4) were identified as characteristic DEMs distinguishing the CK and Pr1 groups, showing negative correlations with both nutritional component contents and antioxidant activities. Metabolites M19, M20, and M21 were tightly associated with protein content. Metabolites clustered near the Pr3 group (M1, M5, M6, M10, M11, M12, M14, M15, M16, and M17) exhibited positive correlations with carbohydrates, polyphenols, flavonoids, superoxide anion, hydroxyl, DPPH, and ABTS free radicals. Additionally, M18, M22, and M23 also exhibited positive correlations with carbohydrates, polyphenols, and flavonoids.
Figure 9.
Redundancy Analysis (RDA) of DEMs with nutritional components and antioxidant capacities. Panel (A): RDA between nutritional indices and DEMs; Panel (B): RDA between antioxidant activities and DEMs. Red dots indicate DEMs strongly correlated with nutritional or antioxidant parameters (|r| > 0.6, permutation test p < 0.01), while white dots stand for DEMs with weak correlations.
Table 4.
Information of significant DEMs in P. rubrovolvatus mycelia.
4. Discussion
Through the optimization of liquid fermentation formulations, this study evaluated the nutritional composition and antioxidant activities of P. rubrovolvatus mycelia and further integrated untargeted metabolomics with redundancy analysis (RDA) to systematically elucidate the regulatory patterns of medium composition on mycelial metabolic accumulation. The results demonstrated that under three regulatory modes, namely carbon-driven, nitrogen-driven, and carbon–nitrogen synergistic regulation, the nutritional characteristics, antioxidant capacity, and metabolic profiles of mycelia exhibited coordinated variation patterns, accompanied by the synergistic activation of multiple metabolic pathways. These findings reveal a stepwise regulatory pattern in which nutrient supply triggers metabolic remodeling, modulates oxidative balance, and initiates pathway response. This pattern highlights the coordinated regulation of mycelial quality formation by nutrient availability and metabolic adaptation. This study provides theoretical support for the targeted optimization of liquid fermentation processes and the standardized production of functional mycelial products of P. rubrovolvatus.
In edible fungal liquid fermentation, the carbon source serves not only as the essential energy supplier for mycelial growth and the structural backbone for cellular skeleton construction [31], but also as the fundamental determinant of mycelial growth rate and biomass accumulation [32]. Transitioning from CK to Pr1, the glucose concentration increased from 20 g·L−1 to 30 g·L−1; thus, the Pr1 vs. CK comparison represents a carbon-driven group, with primary metabolites constituting the core DEMs.
Among the up-regulated metabolites, succinic acid, a key intermediate of the TCA cycle, showed significant enrichment in phenylalanine metabolism, alanine, aspartate and glutamate metabolism, and the cAMP signaling pathway, suggesting enhanced carbon metabolism under carbon-driven conditions [33]. Succinic acid can accept carbon skeletons released from phenylalanine degradation and generate TCA cycle intermediates, such as fumaric acid, thereby facilitating the entry of carbon flux from aromatic amino acids into the central carbon metabolic network and its integration into TCA cycle turnover [34]. In the cAMP signaling pathway, succinic acid may participate in carbon skeleton rearrangement and transamination processes, indirectly regulating carbon–nitrogen metabolic coupling by influencing the α-ketoglutarate/glutamate balance [35]. Furthermore, vitamin K1 and α-tocopheryl acetate exhibited significant accumulation among vitamin-related metabolites. Combined with the increased carbohydrate content detected in P. rubrovolvatus mycelia, these results suggest that sufficient carbon supply may activate primary lipid metabolism, thereby promoting the accumulation of fat-soluble vitamins [36]. The differential enrichment patterns of these two metabolite classes indicate that carbon-driven regulation provides essential carbon skeleton substrates for central energy metabolism and lipid-derived compound biosynthesis in fungal mycelia, serving as an important basis for maintaining basal biosynthesis, energy supply, and intracellular nutrient accumulation. Redundancy analysis (RDA) further revealed that succinic acid, identified as a characteristic DEM in the Pr1 vs. CK comparison, was positively correlated with nutritional components and antioxidant activities. Collectively, under carbon-driven conditions, glucose-derived carbon skeletons were likely directed toward mycelial growth, polysaccharide and protein biosynthesis, and antioxidant-related secondary metabolic pathways (e.g., phenolic compounds and flavonoids), rather than being subjected to non-selective complete oxidation for energy production. These findings suggest that the mycelia maintained an active anabolic state under carbon-driven conditions, rather than simply accumulating storage compounds.
Nitrogen sources serve as essential substrates for the synthesis of key biological macromolecules, including proteins and nucleic acids [37], supporting mycelial cell division, proliferation, and differentiation, while regulating the biosynthetic efficiency of various secondary metabolic pathways [38]. Transitioning from Pr1 to Pr2, the peptone concentration increased from 6 g·L−1 to15 g·L−1; thus, the Pr2 vs. Pr1 comparison represented a nitrogen-driven group, in which the majority of up-regulated DEMs were amino acids and their amino-modified derivatives. At the primary metabolic level, L-citrulline, a characteristic intermediate of the urea cycle, exhibited increased abundance in the arginine biosynthesis pathway, indicating enhanced urea cycle activity and suggesting that excess nitrogen may be stored in the form of arginine, which contains four nitrogen atoms. Phenylalanine and its derivatives (N-acetylphenylalanine and phenylacetylglycine), together with tyrosine, were synchronously up-regulated in multiple metabolic pathways, indicating that increased nitrogen availability promoted aromatic amino acid biosynthesis and further facilitated the accumulation of downstream derivatives. This finding is consistent with the results reported by Huang et al. [39] in Lentinula edodes. Furthermore, the histidine metabolic pathway exhibited a distinct metabolic branching pattern: the intermediate D-erythro-imidazolylglycerol phosphate was up-regulated, whereas the pathway end-product histidine and its downstream metabolite 1-methyl-L-histidine were down-regulated. Given that histidine contains three nitrogen atoms, it is hypothesized that histidine and its downstream products are rapidly converted into other nitrogenous metabolites or incorporated into protein synthesis, reflecting an accelerated turnover rate of nitrogenous primary metabolic substrates under nitrogen-surplus conditions [40].
At the secondary metabolic level, the increased abundance of serotonin suggested that sufficient nitrogen supply promoted the redistribution of tryptophan metabolism toward secondary metabolite biosynthesis, which is consistent with the findings of Kung et al. [41]. Within the cyanoamino acid metabolic pathway, the abundances of linamarin and lotaustralin were up-regulated. This pathway generates ammonia molecules by cleaving nitrogenous groups within cyanogenic structures and subsequently assimilates ammonia nitrogen into amino acid carbon skeletons. This outcome is consistent with the findings of Zuk et al. [42] in Linum usitatissimum and echoes the regulatory effect of nitrogen sources on alkaloid contents observed by Ribeiro et al. [43] in Leucopaxillus giganteus, collectively suggesting that increased nitrogen availability positively regulates the accumulation of nitrogen-containing secondary metabolites. Redundancy analysis (RDA) showed a strong correlation between the Pr2 group and total protein content, indicating that increased nitrogen availability specifically promoted intracellular protein synthesis. Collectively, nitrogen-driven regulation is characterized by enhanced nitrogen assimilation efficiency, which fuels the synergistic accumulation of nitrogenous primary metabolites (amino acids) and nitrogenous secondary metabolites (serotonin, linamarin, lotaustralin.), ultimately manifesting as elevated mycelial protein content. However, thiamine monophosphate, histidine, 1-methyl-L-histidine, sucrose, trachelanthine, and N-acetyl-D-glucosamine exhibited marked enrichment differences in the nitrogen-driven group, displaying an overall down-regulation trend. Their negative correlations with nutritional indicators and antioxidant activities in the RDA further suggest that a relative deficit in carbon sources counteracted the stimulatory effect of elevated nitrogen. Consequently, thereby suppressing the synthesis or accumulation of these metabolites, rendering them negative-response metabolites under nitrogen-driven conditions.
An appropriate supply of carbon and nitrogen can regulate the production of fermentation metabolites and activate associated metabolic pathways [44]. From the CK to Pr3 group, the glucose concentration increased from 20 g·L−1 to 25 g·L−1, and the peptone concentration rose from 6 g·L−1 to 15 g·L−1. Therefore, the Pr3 vs. CK comparison represented a carbon–nitrogen synergistic-driven group. The DEMs were significantly enriched in two major functional modules, carbon metabolism and nitrogen metabolism, with all DEMs displaying up-regulated abundance. At the carbon metabolism level, 2-deoxyribose 5-phosphate serves as a key intermediate metabolite in the pentose phosphate pathway, capable of providing a ribose backbone for intracellular nucleotide synthesis as well as generating NADPH to participate in intracellular reductive reactions [45]. Succinic acid is a crucial primary metabolite of the TCA cycle, extensively involved in the cAMP signaling pathway, glucagon signaling pathway, carbon fixation metabolism, and lysine metabolism; suggesting its important role in intracellular energy metabolism and carbon skeleton distribution [46]. Propionic acid [47], linoleic acid, and its oxidized derivative Fa 18:2 + 2O [48] participate in cofactor synthesis and lipid carbon source metabolism, respectively, and may contribute to carbon recycling and lipid homeostasis maintenance. At the nitrogen metabolism level, L-citrulline accumulated most prominently in the arginine biosynthesis pathway, while 2,3-pyridinedicarboxylic acid was also up-regulated in nicotinate and nicotinamide metabolism. These findings align with the L-citrulline accumulation observed by Reizine et al. [49] in infection models and accord with the metabolic traits reported by Waddell et al. [50] regarding 2,3-pyridinedicarboxylic acid (quinolinic acid) as a precursor for NAD+ synthesis. These findings suggest that nitrogen supplementation enhanced nitrogen assimilation and storage capacity in mycelia. Carbon-nitrogen synergetic regulation is primarily manifested in four aspects: First, succinic acid, as a pivotal intermediate in central carbon metabolism, provides carbon skeletons for the synthesis of various amino acids and links amino acid catabolism through the lysine degradation pathway, thereby facilitating the coordination between carbon metabolism and nitrogen turnover [51]. Concurrently, folate and L-methionine connect carbon skeleton supply with nitrogen assimilation through one-carbon unit transfer, serving as an important connection between carbon and nitrogen metabolism [52]. Second, the glucagon and cAMP signaling pathways may regulate carbon and nitrogen metabolism at the signaling level, contributing to the metabolic adaptation of mycelia under different nutrient conditions [53]. Third, the anaplerotic effect of the TCA cycle supplies carbon skeletons for amino acid synthesis [51]. Sufficient carbon availability promotes the shikimate pathway for aromatic amino acid biosynthesis, thereby providing essential precursors for phenylpropanoid-skeleton secondary metabolites such as flavonoids and polyphenols [54]. Fourth, NADPH generated via the pentose phosphate pathway and ATP produced via the TCA cycle may supply reducing power and energy for the reductive synthesis and modification reactions of secondary metabolism, respectively [55].
Redundancy analysis (RDA) revealed that the Pr3 sample was positively correlated with total soluble sugars, reducing sugars, protein, flavonoids, total phenolics, as well as DPPH, ABTS, superoxide anion, and hydroxyl radical scavenging activities. Metabolites clustered near the Pr3 sample including succinic acid, L-citrulline, ketoleucine, 2-deoxyribose 5-phosphate, 1-pentadecanoyl-sn-glycero-3-phosphocholine, folate, valine, Linoleic acid, Fa 18:2 + 2O, and propionic acid, were positively correlated with carbohydrate contents, polyphenols, flavonoids, and antioxidant indicators, while Tyrosine, L-methionine, and 2,3-pyridinedicarboxylic acid also showed positive correlations with carbohydrates, polyphenols, and flavonoids. Therefore, carbon-nitrogensynergistic regulation enhanced the overall primary metabolic activity of mycelia, providing sufficient precursors for the biosynthesis and accumulation of secondary metabolites (flavonoids and total phenolics), ultimately being associated with the coordinated increases in mycelial biomass, DEMs, nutritional components, and their antioxidant activities. In summary, carbon–nitrogen synergistic supply did not amplify the metabolic shifts caused by single-nutrient regulation; instead, it may contribute to metabolic balance through the interaction and coordination between carbon and nitrogen metabolism, suggesting that mycelia may activate metabolic homeostasis regulation under simultaneous carbon and nitrogen enrichment.
5. Conclusions
This study systematically characterizes mycelial metabolic reprogramming and pathway characteristics of P. rubrovolvatus under three nutritional fermentation regimes, including carbon-driven, nitrogen-driven, and carbon–nitrogen synergistic conditions. Carbon-centric cultivation potentially remodels core carbon and lipid metabolism. Succinic acid was screened as a signature differential metabolite, which is closely correlated with mycelial biomass accumulation and primary anabolism. Nitrogen enrichment tends to promote the accumulation of amino acids and nitrogen-containing secondary metabolites, such as serotonin, linamarin, and lotaustralin. The relative shortage of carbon nutrients under high-nitrogen conditions may be associated with the decreased abundance of several responsive metabolites. Co-supplementation of carbon and nitrogen induces the coordinated alteration of carbon and nitrogen metabolic profiles. A variety of key metabolites exhibited positive correlations with nutritional components and antioxidant capacity, implying the improved metabolic performance under synergistic nutrient conditions. These metabolomic observations suggest a potential stepwise regulatory cascade. Nutrient availability may trigger metabolic reprogramming and modulate oxidative homeostasis, thereby eliciting downstream pathway responses that possibly affect mycelial quality. This study preliminarily delineates the associations between medium composition, metabolomic signatures, nutritional traits, and antioxidant properties. It provides a theoretical reference for further optimization of liquid fermentation and targeted exploitation of functional components in P. rubrovolvatus mycelia.
Author Contributions
Conceptualization, X.L. and S.J.; methodology, F.H. and X.L.; software, X.L. and S.J.; validation, F.H., X.L. and F.S.; formal analysis, F.H. and X.L.; investigation, F.H.; resources, S.J.; data curation, X.L. and F.H.; writing—original draft preparation, X.L.; writing—review and editing, X.L. and S.J.; visualization, X.L. and S.J.; supervision, T.Z. and S.J.; project administration, S.J.; funding acquisition, S.J. All authors have read and agreed to the published version of the manuscript.
Funding
This research was funded by the First-batch Project of Anhui Provincial Science and Technology Special Mission Teams Project, grant number 2023tpt106, and the Demonstration Site Project of Anhui Provincial “1 + 5” Agricultural Science and Technology Innovation Alliance—Edible Fungi Demonstration Site, Jixi County, Xuancheng City, China.
Data Availability Statement
All raw LC–MS metabolomics datasets and post-processed quantitative results generated in this study have been deposited to the MetaboLights repository hosted by EMBL-EBI (https://www.ebi.ac.uk/metabolights/, accessed on 6 August 2026) under study accession MTBLS15277. Other raw experimental data supporting the findings of this study are available from the corresponding author upon reasonable request.
Conflicts of Interest
The authors declare no conflicts of interest.
References
- Liu, H.; Xiang, D.; Cheng, Z.; Ma, L.; Yang, S.; Xie, J. Drying methods on fruit quality and antioxidant activity of two rare edible fungi (Dictyophora rubrovolvata and Phallus impudicus L.). LWT 2024, 206, 116603. [Google Scholar] [CrossRef] [Scilit]
- Zhao, K.; Wang, F.; Pan, X.; Zhu, C. Extraction and primary investigation of antitumor activity of polysaccharides from the volva of Dictyophora rubrovolvata. Mycosystema 2008, 27, 289–296. [Google Scholar]
- Song, Z.; Li, X.; Xie, M.; Lu, J.; Bao, D.; Jiang, S. Dynamic Coupling Mechanism of Soil Microbial Community Shifts and Nutrient Fluxes During the Life Cycle of Dictyophora rubrovolvata. Horticulturae 2025, 11, 989. [Google Scholar] [CrossRef] [Scilit]
- Xia, Z.; Wang, R.; Ma, C.; Li, J.; Lei, J.; Ji, N.; Pan, X.; Chen, T. Effect of controlled atmosphere packaging on the physiology and quality of fresh-cut Dictyophora rubrovolvata. Foods 2023, 12, 1665. [Google Scholar] [CrossRef] [Scilit] [PubMed]
- Bisko, N.; Mustafin, K.; Al-Maali, G.; Suleimenova, Z.; Lomberg, M.; Narmuratova, Z.; Mykchaylova, O.; Mytropolska, N.; Zhakipbekova, A. Effects of cultivation parameters on intracellular polysaccharide production in submerged culture of the edible medicinal mushroom Lentinula edodes. Czech Mycol. 2020, 72, 1–17. [Google Scholar] [CrossRef] [Scilit]
- Guo, S.; Xu, L.-N.; Li, Y.-T.; Guo, W.-W.; Guo, X.-F.; Hong, S.-S. Statistical optimization of biomass and extracellular polysaccharide production by the wild Helvella lacunosa mycelium in liquid-state fermentation using a pine needles extract medium. J. Chem. 2023, 2023, 3591787. [Google Scholar] [CrossRef] [Scilit]
- Krupodorova, T.; Barshteyn, V.; Dzhagan, V.; Pluzhnyk, A.; Zaichenko, T.; Blume, Y. Enhancement of antioxidant activity and total phenolic content of Fomitopsis pinicola mycelium extract. Fungal Biol. Biotechnol. 2024, 11, 18. [Google Scholar] [CrossRef] [Scilit] [PubMed]
- Zwinkels, J.; van Oorschot, S.; van Mastrigt, O.; Smid, E.J. The potential of mycelium from mushroom-producing fungi in alternative protein production: A focus on fungal growth, metabolism, and nutrition. Curr. Res. Food Sci. 2025, 12, 101278. [Google Scholar] [CrossRef] [Scilit] [PubMed]
- Wu, C.-Y. The influence of cultivation conditions on mycelial growth and exopolysaccharide production of culinary-medicinal mushroom Pleurotus citrinopileatus Singer (Agaricomycetideae). Int. J. Med. Mushrooms 2008, 10, 279–292. [Google Scholar] [CrossRef] [Scilit]
- Cui, F.J.; Li, Y.; Xu, Z.H.; Xu, H.Y.; Sun, K.; Tao, W.Y. Optimization of the medium composition for production of mycelial biomass and exo-polymer by Grifola frondosa GF9801 using response surface methodology. Bioresour. Technol. 2006, 97, 1209–1216. [Google Scholar] [CrossRef] [Scilit] [PubMed]
- Lung, M.-Y.; Chang, Y.-C. Antioxidant properties of the edible Basidiomycete Armillaria mellea in submerged cultures. Int. J. Mol. Sci. 2011, 12, 6367–6384. [Google Scholar] [CrossRef] [Scilit] [PubMed]
- He, M.; Peng, Q.; Xu, X.; Shi, B.; Qiao, Y. Antioxidant capacities and non-volatile metabolites changes after solid-state fermentation of soybean using oyster mushroom (Pleurotus ostreatus) mycelium. Front. Nutr. 2024, 11, 1509341. [Google Scholar] [CrossRef] [Scilit] [PubMed]
- Flores, G.A.; Girometta, C.E.; Cusumano, G.; Angelini, P.; Tirillini, B.; Ianni, F.; Blasi, F.; Cossignani, L.; Pellegrino, R.M.; Emiliani, C.; et al. Untargeted metabolomics used to describe the chemical composition, antioxidant and antimicrobial effects of extracts from Pleurotus spp. mycelium grown in different culture media. Antibiotics 2022, 11, 1468. [Google Scholar] [CrossRef] [Scilit] [PubMed]
- Krupodorova, T.; Barshteyn, V.; Gafforov, Y.; Rašeta, M.; Zaichenko, T.; Blume, Y. Comparative evaluation of free radical scavenging activity and total metabolite profiles among 30 macrofungi species. Bioresour. Bioprocess. 2025, 12, 13. [Google Scholar] [CrossRef] [Scilit] [PubMed]
- Wang, J.; Tian, H.; Xu, Y.; Peng, X.; Zhang, C.; Lu, M.; Lu, Z.; Xu, S.; Wen, T.; Yang, C. Comprehensive analysis of the metabolome and the whole genome transcriptome to reveal the regulatory mechanism the flavor of Phallus rubrovolvatus. Food Biosci. 2024, 60, 104483. [Google Scholar] [CrossRef] [Scilit]
- Dong, H.; Zhou, C.; Li, X.; Gu, H.; E, H.; Zhang, Y.; Zhou, F.; Zhao, Z.; Fan, T.; Lu, H.; et al. Ultraperformance liquid chromatography-quadrupole time-of-flight mass spectrometry based untargeted metabolomics to reveal the characteristics of Dictyophora rubrovolvata from different drying methods. Front. Nutr. 2022, 9, 1056598. [Google Scholar] [CrossRef] [Scilit] [PubMed]
- DuBois, M.; Gilles, K.A.; Hamilton, J.K.; Rebers, P.A.; Smith, F. Colorimetric method for determination of sugars and related substances. Anal. Chem. 1956, 28, 350–356. [Google Scholar] [CrossRef] [Scilit]
- Miller, G.L. Use of dinitrosalicylic acid reagent for determination of reducing sugar. Anal. Chem. 1959, 31, 426–428. [Google Scholar] [CrossRef] [Scilit]
- Jia, Z.; Tang, M.; Wu, J. The determination of flavonoid contents in mulberry and their scavenging effects on superoxide radicals. Food Chem. 1999, 64, 555–559. [Google Scholar] [CrossRef] [Scilit]
- Singleton, V.L.; Rossi, J.A., Jr. Colorimetry of total phenolics with phosphomolybdic-phosphotungstic acid reagents. Am. J. Enol. Vitic. 1965, 16, 144–158. [Google Scholar] [CrossRef] [Scilit]
- Fountoulakis, M.; Juranville, J.-F.; Manneberg, M. Comparison of the Coomassie brilliant blue, bicinchoninic acid and Lowry quantitation assays, using non-glycosylated and glycosylated proteins. J. Biochem. Biophys. Methods 1992, 24, 265–274. [Google Scholar] [CrossRef] [Scilit] [PubMed]
- Marklund, S.; Marklund, G. Involvement of the superoxide anion radical in the autoxidation of pyrogallol and a convenient assay for superoxide dismutase. Eur. J. Biochem. 1974, 47, 469–474. [Google Scholar] [CrossRef] [Scilit] [PubMed]
- Smirnoff, N.; Cumbes, Q.J. Hydroxyl radical scavenging activity of compatible solutes. Phytochemistry 1989, 28, 1057–1060. [Google Scholar] [CrossRef] [Scilit]
- Blois, M.S. Antioxidant Determinations by the Use of a Stable Free Radical. Nature 1958, 181, 1199–1200. [Google Scholar] [CrossRef] [Scilit]
- Re, R.; Pellegrini, N.; Proteggente, A.; Pannala, A.; Yang, M.; Rice-Evans, C. Antioxidant activity applying an improved ABTS radical cation decolorization assay. Free Radic. Biol. Med. 1999, 26, 1231–1237. [Google Scholar] [CrossRef] [Scilit] [PubMed]
- Smith, C.A.; Want, E.J.; O’Maille, G.; Abagyan, R.; Siuzdak, G. XCMS: processing mass spectrometry data for metabolite profiling using nonlinear peak alignment, matching, and identification. Anal. Chem. 2006, 78, 779–787. [Google Scholar] [CrossRef] [Scilit] [PubMed]
- Kuhl, C.; Tautenhahn, R.; Böttcher, C.; Larson, T.R.; Neumann, S. CAMERA: An integrated strategy for compound spectra extraction and annotation of liquid chromatography/mass spectrometry data sets. Anal. Chem. 2012, 84, 283–289. [Google Scholar] [CrossRef] [Scilit] [PubMed]
- Thévenot, E.A.; Roux, A.; Xu, Y.; Ezan, E.; Junot, C. Analysis of the human adult urinary metabolome variations with age, body mass index, and gender by implementing a comprehensive workflow for univariate and OPLS statistical analyses. J. Proteome Res. 2015, 14, 3322–3335. [Google Scholar] [CrossRef] [Scilit] [PubMed]
- Wold, S.; Sjöström, M.; Eriksson, L. PLS-regression: A basic tool of chemometrics. Chemom. Intell. Lab. Syst. 2001, 58, 109–130. [Google Scholar] [CrossRef] [Scilit]
- Westerhuis, J.A.; Hoefsloot, H.C.J.; Smit, S.; Vis, D.J.; Smilde, A.K.; van Velzen, E.J.J.; van Duijnhoven, J.P.M.; van Dorsten, F.A. Assessment of PLSDA cross validation. Metabolomics 2008, 4, 81–89. [Google Scholar] [CrossRef] [Scilit]
- Bolaño-Losada, C.; Zimmermann, B.; Horn, S.J.; Kohler, A.; Shapaval, V. Effect of hydrogen peroxide and carbon-to-nitrogen ratio on growth and biochemical profile in oleaginous mucoromycota. Microb. Cell Factories 2025, 24, 232. [Google Scholar] [CrossRef] [Scilit] [PubMed]
- Zhang, X.; Hou, X.; Xu, D.; Xue, M.; Zhang, J.; Wang, J.; Yang, Y.; Lai, D.; Zhou, L. Effects of Carbon, Nitrogen, Ambient pH and light on mycelial growth, sporulation, sorbicillinoid biosynthesis and related gene expression in Ustilaginoidea virens. J. Fungi 2023, 9, 390. [Google Scholar] [CrossRef] [Scilit] [PubMed]
- Liu, X.; Zhao, G.; Sun, S.; Fan, C.; Feng, X.; Xiong, P. Biosynthetic pathway and metabolic engineering of succinic acid. Front. Bioeng. Biotechnol. 2022, 10, 843887. [Google Scholar] [CrossRef] [Scilit] [PubMed]
- Becker, P.; Kirstein, S.; Wünsch, D.; Koblitz, J.; Buschen, R.; Wöhlbrand, L.; Bunk, B.; Hinrichs, C.; Kaltenhäuser, S.; Lehmann, J.; et al. Systems biology of aromatic compound catabolism in facultative anaerobic Aromatoleum aromaticum EbN1T. mSystems 2022, 7, e00685-622. [Google Scholar] [CrossRef] [Scilit] [PubMed]
- Liebing, A.-D.; Rabe, P.; Krumbholz, P.; Zieschang, C.; Bischof, F.; Schulz, A.; Billig, S.; Birkemeyer, C.; Pillaiyar, T.; Garcia-Marcos, M.; et al. Succinate receptor 1 signaling mutually depends on subcellular localization and cellular metabolism. FEBS J. 2025, 292, 2017–2050. [Google Scholar] [CrossRef] [Scilit] [PubMed]
- Sułkowska-Ziaja, K.; Zengin, G.; Gunia-Krzyżak, A.; Popiół, J.; Szewczyk, A.; Jaszek, M.; Rogalski, J.; Muszyńska, B. Bioactivity and mycochemical profile of extracts from mycelial cultures of Ganoderma spp. Molecules 2022, 27, 275. [Google Scholar] [CrossRef] [Scilit] [PubMed]
- Lima Valesca, H.; Matugawa Alexandre, T.; Mascarin Gabriel, M.; Fernandes Éverton Kort, K. Complex nitrogen sources from agro-industrial byproducts: Impact on production, multi-stress tolerance, virulence, and quality of Beauveria bassiana blastospores. Microbiol. Spectr. 2024, 12, e04040-23. [Google Scholar] [CrossRef] [Scilit] [PubMed]
- Han, J.; Sun, R.; Huang, C.; Xie, H.; Gao, X.; Yao, Q.; Yang, P.; Li, J.; Gong, Z. Effects of different carbon and nitrogen ratios on yield, nutritional value, and amino acid contents of Flammulina velutipes. Life 2024, 14, 598. [Google Scholar] [CrossRef] [Scilit] [PubMed]
- Huang, X.; Zhang, R.; Yang, Q.; Li, X.; Xiang, Q.; Zhao, K.; Ma, M.; Yu, X.; Chen, Q.; Zeng, X.; et al. Cultivating Lentinula edodes on substrate containing composted sawdust affects the expression of carbohydrate and aromatic amino acid metabolism-related genes. mSystems 2022, 7, e00827-21. [Google Scholar] [CrossRef] [Scilit] [PubMed]
- Polkinghorne, M.A.; Hynes, M.J. L-histidine utilization in Aspergillus nidulans. J. Bacteriol. 1982, 149, 931–940. [Google Scholar] [CrossRef] [Scilit] [PubMed]
- Kung, H.-C.; Bui, N.-H.; Huang, B.-W.; Cheruiyot, N.K.; Chang-Chien, G.-P. Biosynthetic pathways of tryptophan metabolites in Saccharomyces cerevisiae strain: Insights and implications. Int. J. Mol. Sci. 2024, 25, 4747. [Google Scholar] [CrossRef] [Scilit] [PubMed]
- Zuk, M.; Pelc, K.; Szperlik, J.; Sawula, A.; Szopa, J. Metabolism of the cyanogenic glucosides in developing flax: Metabolic analysis, and expression pattern of genes. Metabolites 2020, 10, 288. [Google Scholar] [CrossRef] [Scilit] [PubMed]
- Ribeiro, B.; Andrade, P.B.; Baptista, P.; Barros, L.; Ferreira, I.C.F.R.; Seabra, R.M.; Valentão, P. Leucopaxillus giganteus mycelium: Effect of nitrogen source on organic acids and alkaloids. J. Agric. Food Chem. 2008, 56, 4769–4774. [Google Scholar] [CrossRef] [Scilit] [PubMed]
- Sapsirisuk, S.; Songdech, P.; Watchaputi, K.; Puttarak, P.; Euanorasetr, J.; Soontorngun, N. Optimizing carbon-to-nitrogen ratios for enhanced antimicrobial sophorolipid production in Starmerella riodocensis GT-SL1R. FEMS Yeast Res. 2026, 26, foag007. [Google Scholar] [CrossRef] [Scilit] [PubMed]
- Rouvinen, J.; Andberg, M.; Pääkkönen, J.; Hakulinen, N.; Koivula, A. Current state of and need for enzyme engineering of 2-deoxy-D-ribose 5-phosphate aldolases and its impact. Appl. Microbiol. Biotechnol. 2021, 105, 6215–6228. [Google Scholar] [CrossRef] [Scilit] [PubMed]
- Trauelsen, M.; Hiron, T.K.; Lin, D.; Petersen, J.E.; Breton, B.; Husted, A.S.; Hjorth, S.A.; Inoue, A.; Frimurer, T.M.; Bouvier, M.; et al. Extracellular succinate hyperpolarizes M2 macrophages through SUCNR1/GPR91-mediated Gq signaling. Cell Rep. 2021, 35, 109246. [Google Scholar] [CrossRef] [Scilit] [PubMed]
- Brütting, C.; Lara Bisch, M.; Brandsch, C.; Hirche, F.; Stangl, G.I. Impact of dietary propionate on fructose-induced changes in lipid metabolism, gut microbiota and short-chain fatty acids in mice. Int. J. Food Sci. Nutr. 2021, 72, 160–173. [Google Scholar] [CrossRef] [Scilit] [PubMed]
- Faizo, N.; Narasimhulu, C.A.; Forsman, A.; Yooseph, S.; Parthasarathy, S. Peroxidized linoleic acid, 13-HPODE, alters gene expression profile in intestinal epithelial cells. Foods 2021, 10, 314. [Google Scholar] [CrossRef] [Scilit] [PubMed]
- Reizine, F.; Grégoire, M.; Lesouhaitier, M.; Coirier, V.; Gauthier, J.; Delaloy, C.; Dessauge, E.; Creusat, F.; Uhel, F.; Gacouin, A. Beneficial effects of citrulline enteral administration on sepsis-induced T cell mitochondrial dysfunction. Proc. Natl. Acad. Sci. USA 2022, 119, e2115139119. [Google Scholar] [CrossRef] [Scilit] [PubMed]
- Waddell, J.; Khatoon, R.; Kristian, T. Cellular and mitochondrial NAD homeostasis in health and disease. Cells 2023, 12, 1329. [Google Scholar] [CrossRef] [Scilit] [PubMed]
- Inigo, M.; Deja, S.; Burgess, S.C. Ins and outs of the TCA cycle: The central role of anaplerosis. Annu. Rev. Nutr. 2021, 41, 19–47. [Google Scholar] [CrossRef] [Scilit] [PubMed]
- Bekdash, R.A. Methyl Donors, epigenetic alterations, and brain health: Understanding the connection. Int. J. Mol. Sci. 2023, 24, 2346. [Google Scholar] [CrossRef] [Scilit] [PubMed]
- Zhang, J.; Zheng, Y.; Martens, L.; Pfeiffer, A.F.H. The regulation and secretion of glucagon in response to nutrient composition: Unraveling their intricate mechanisms. Nutrients 2023, 15, 3913. [Google Scholar] [CrossRef] [Scilit] [PubMed]
- El-Azaz, J.; Maeda, H.A. The multilayered regulation of aromatic amino acid biosynthesis in plants. Trends Biochem. Sci. 2025, 50, 1051–1071. [Google Scholar] [CrossRef] [Scilit] [PubMed]
- Sun, Y.; Zhang, T.; Lu, B.; Li, X.; Jiang, L. Application of cofactors in the regulation of microbial metabolism: A state of the art review. Front. Microbiol. 2023, 14, 1145784. [Google Scholar] [CrossRef] [Scilit] [PubMed]
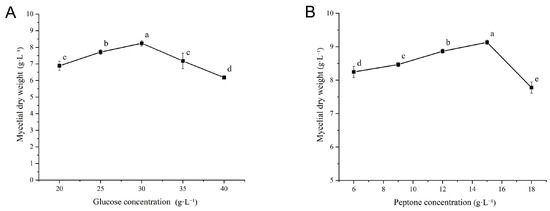
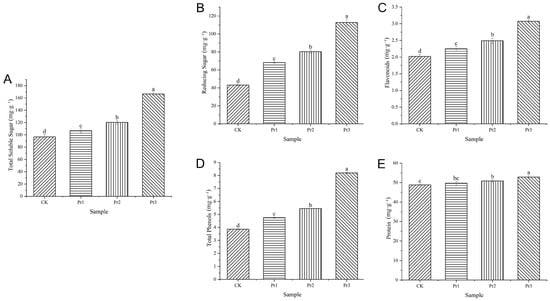
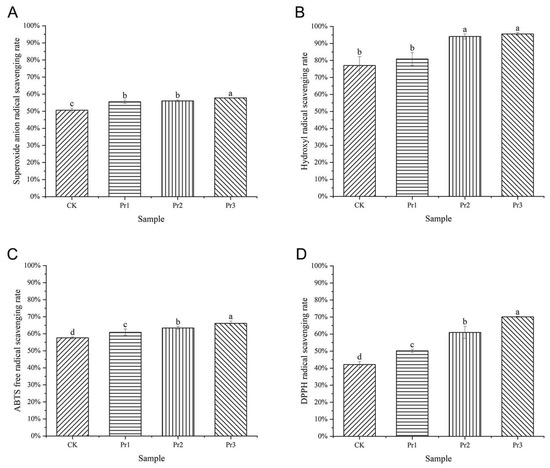
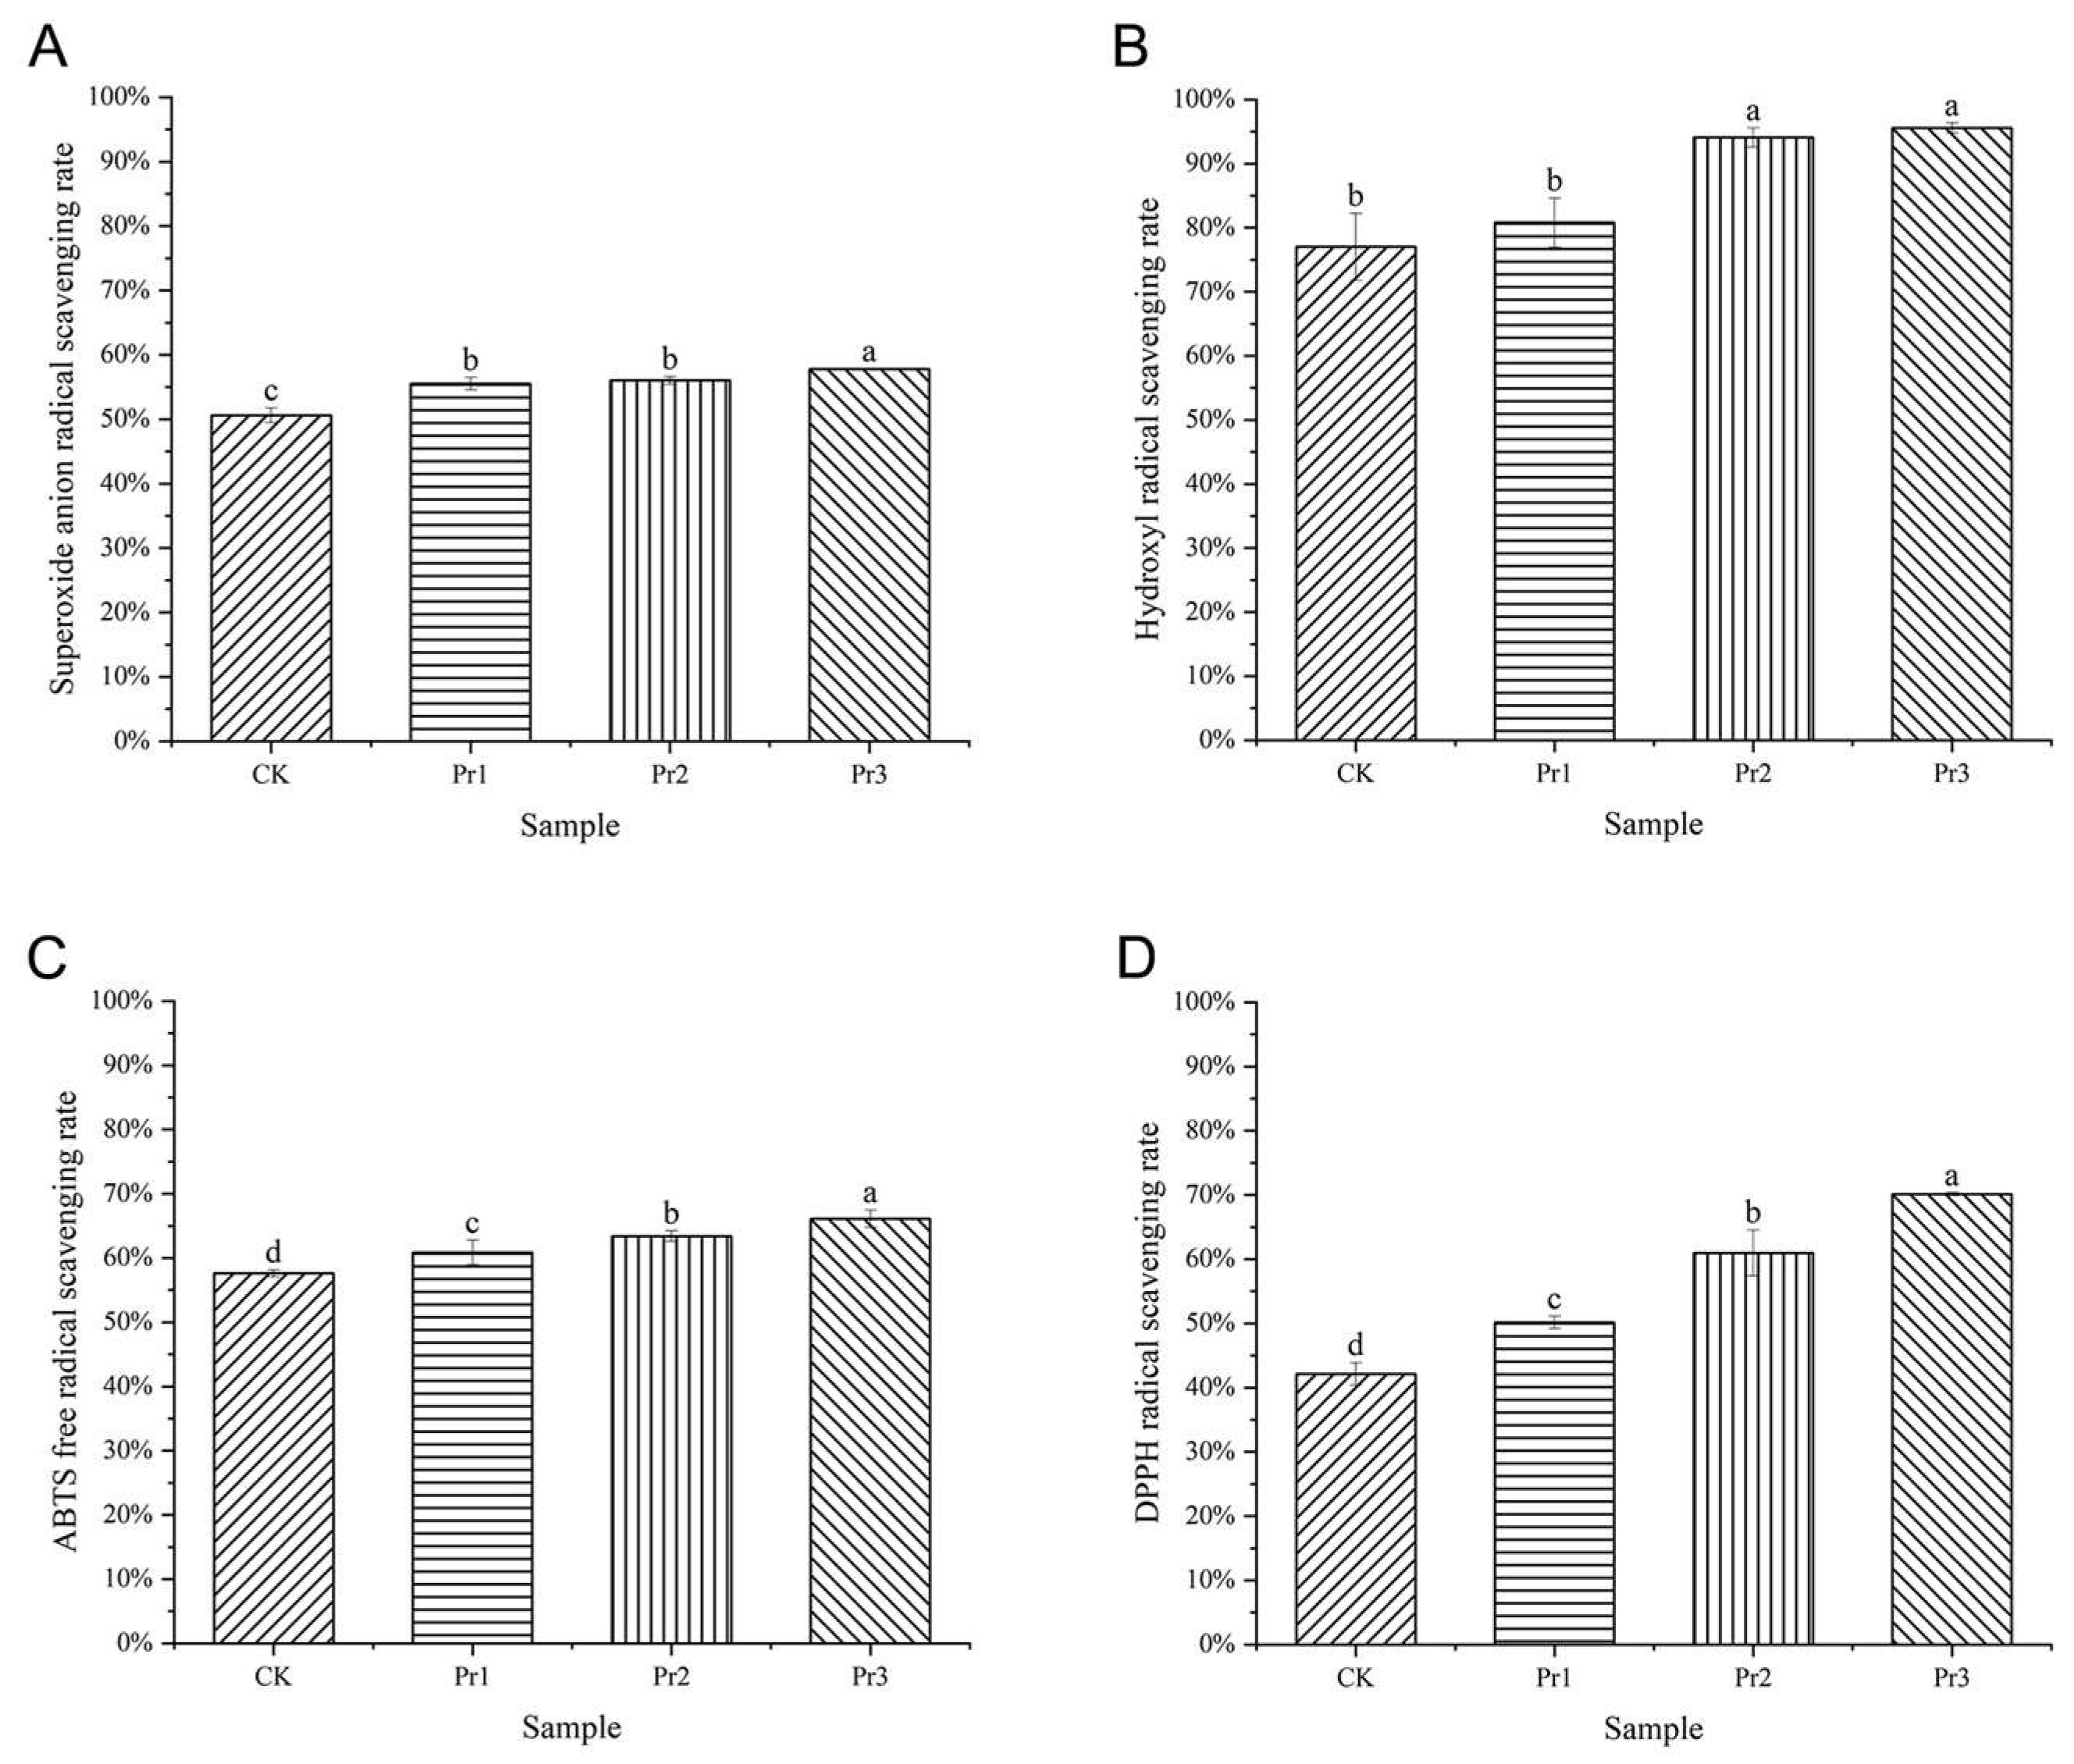
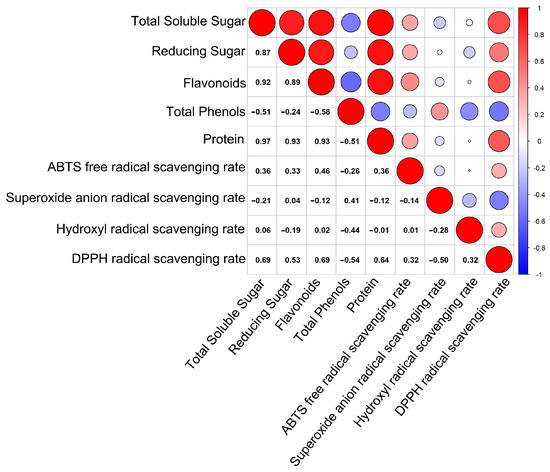
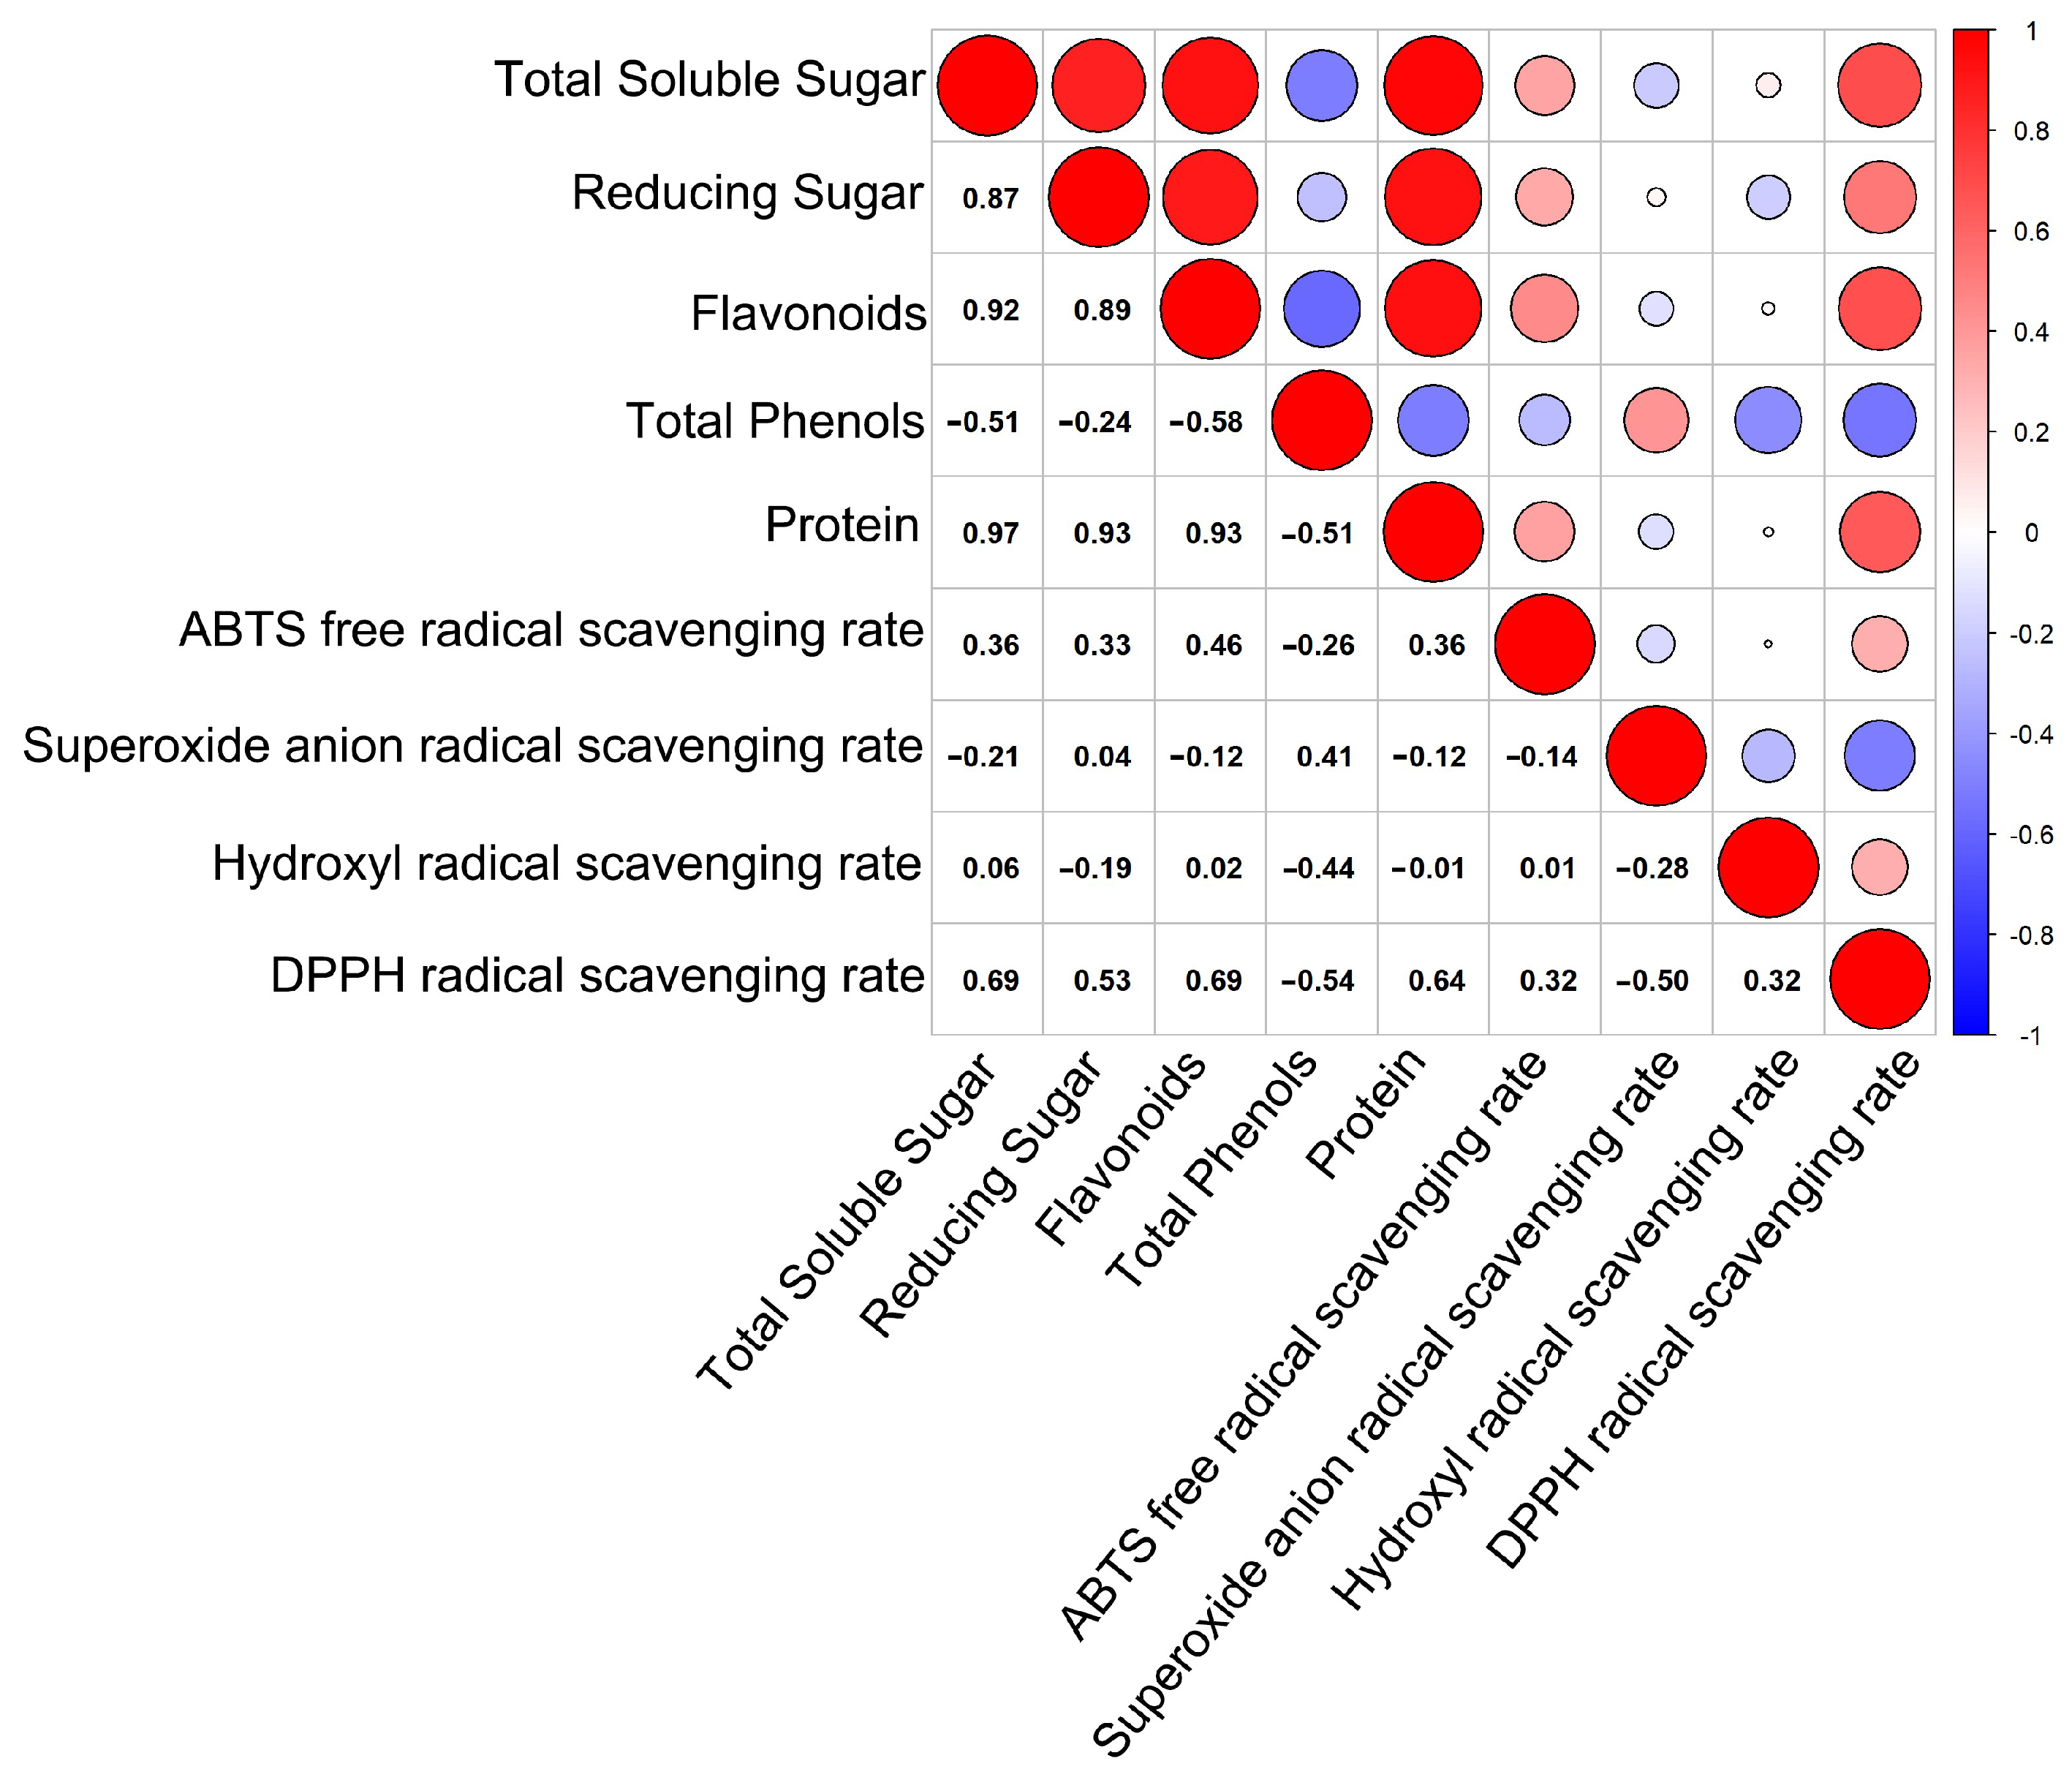
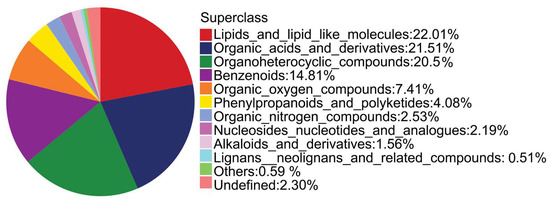
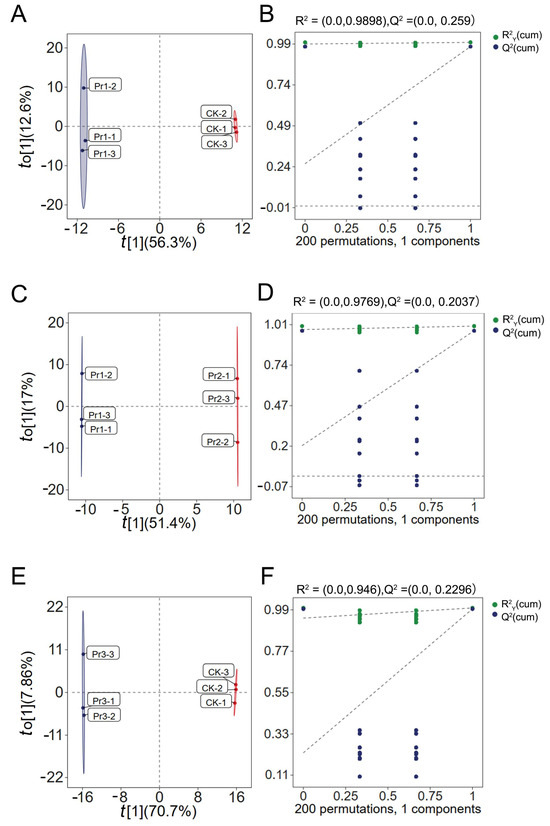
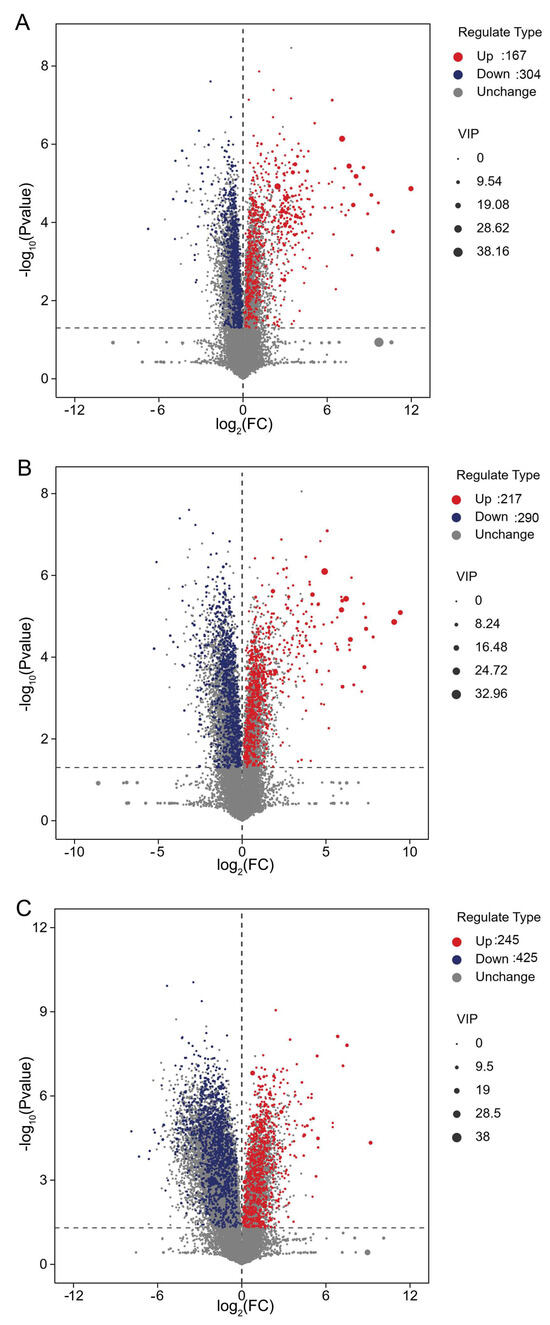
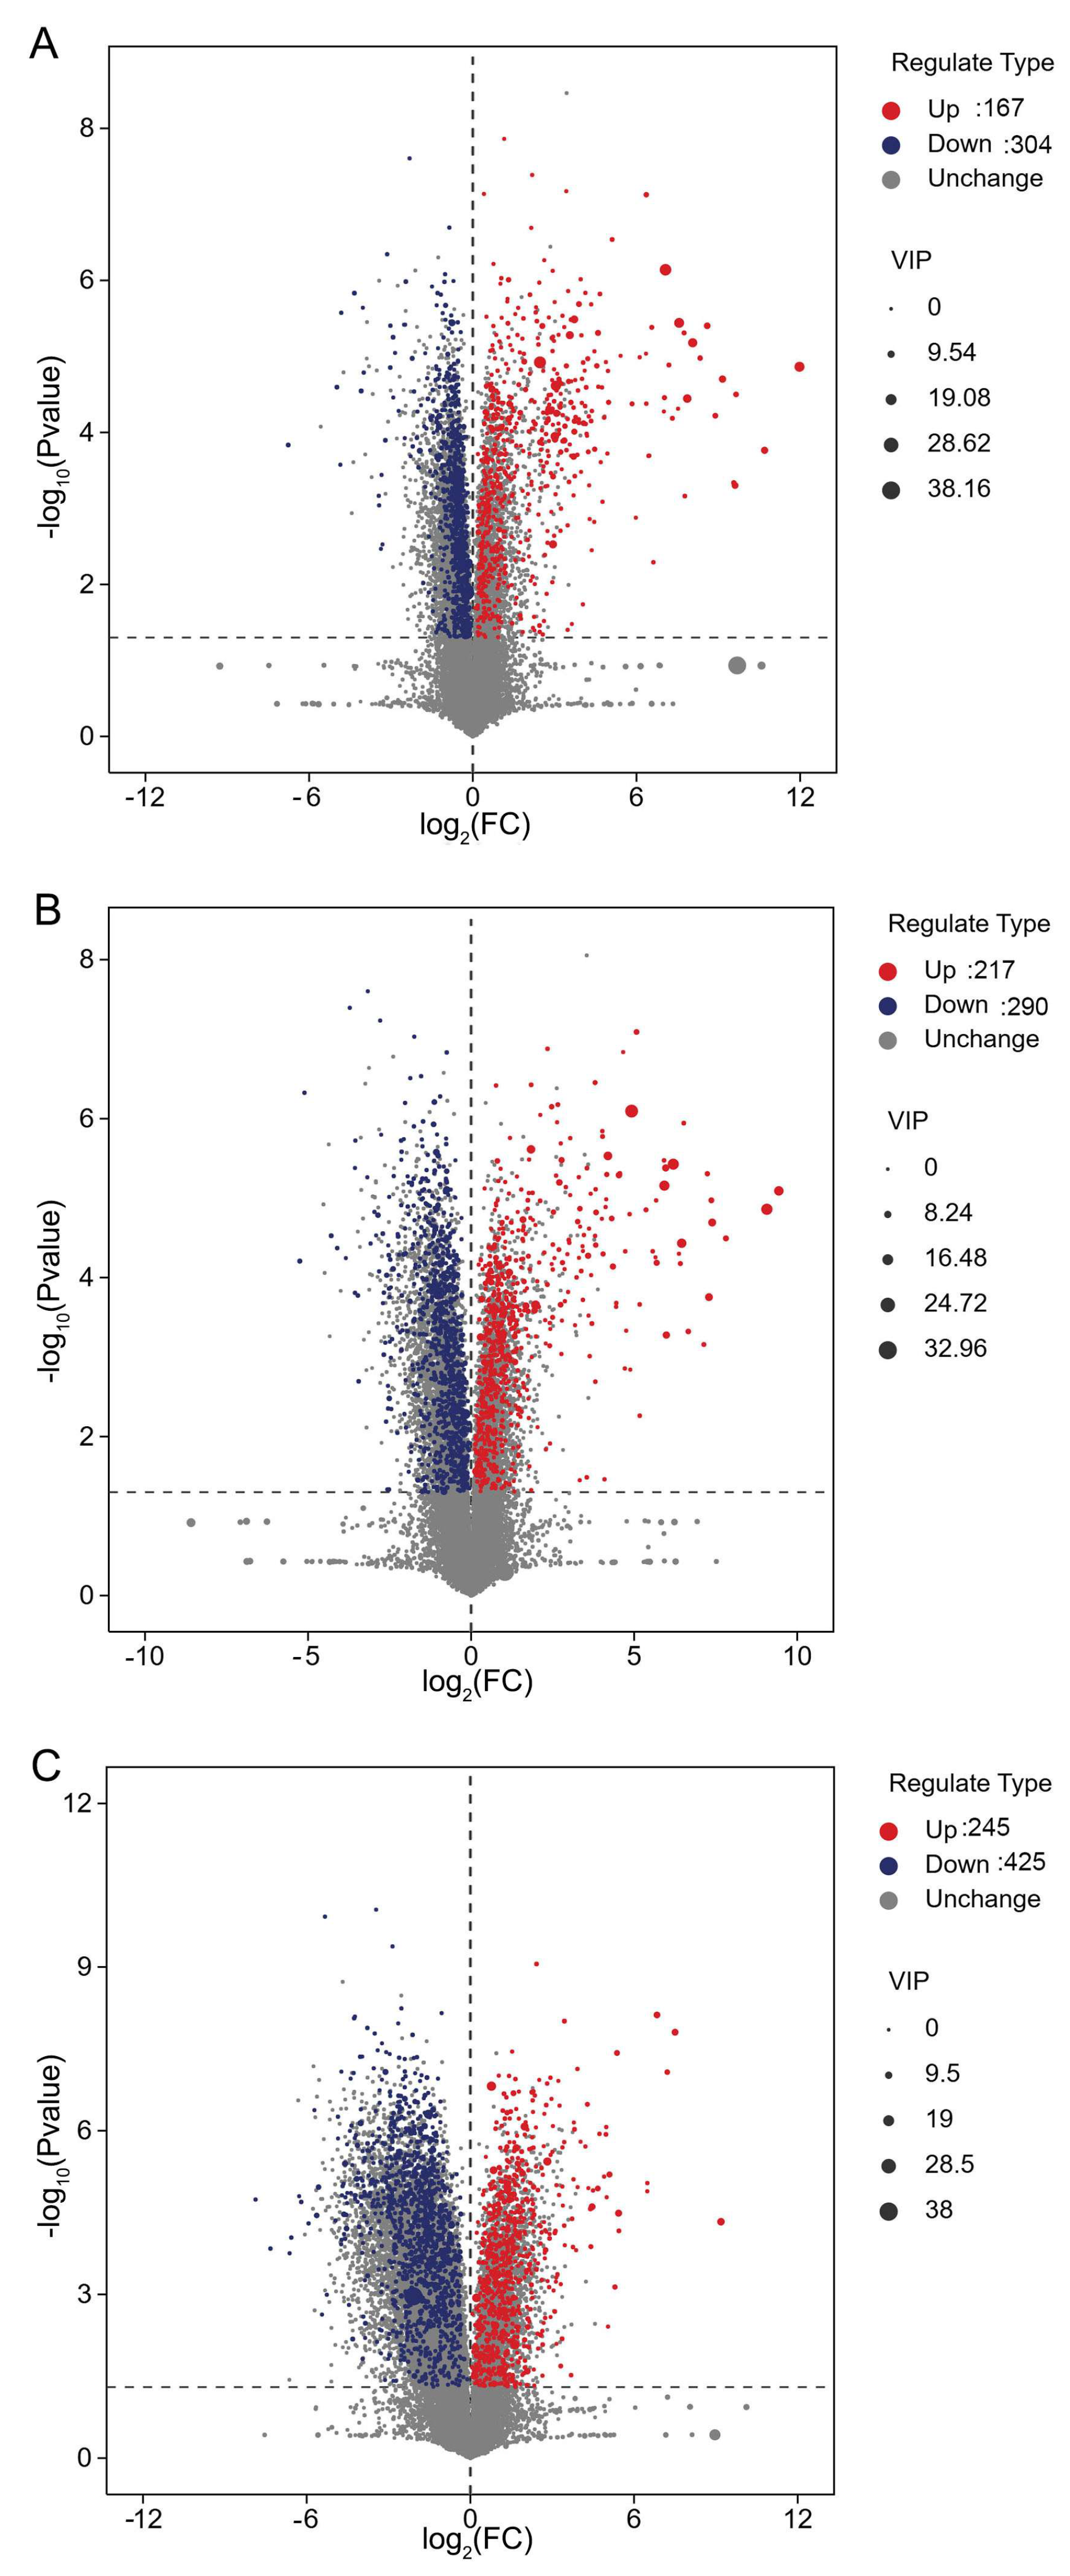
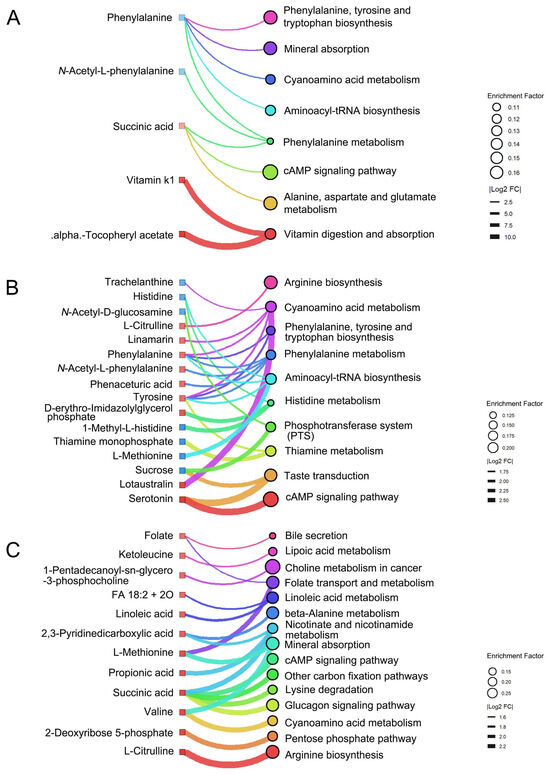
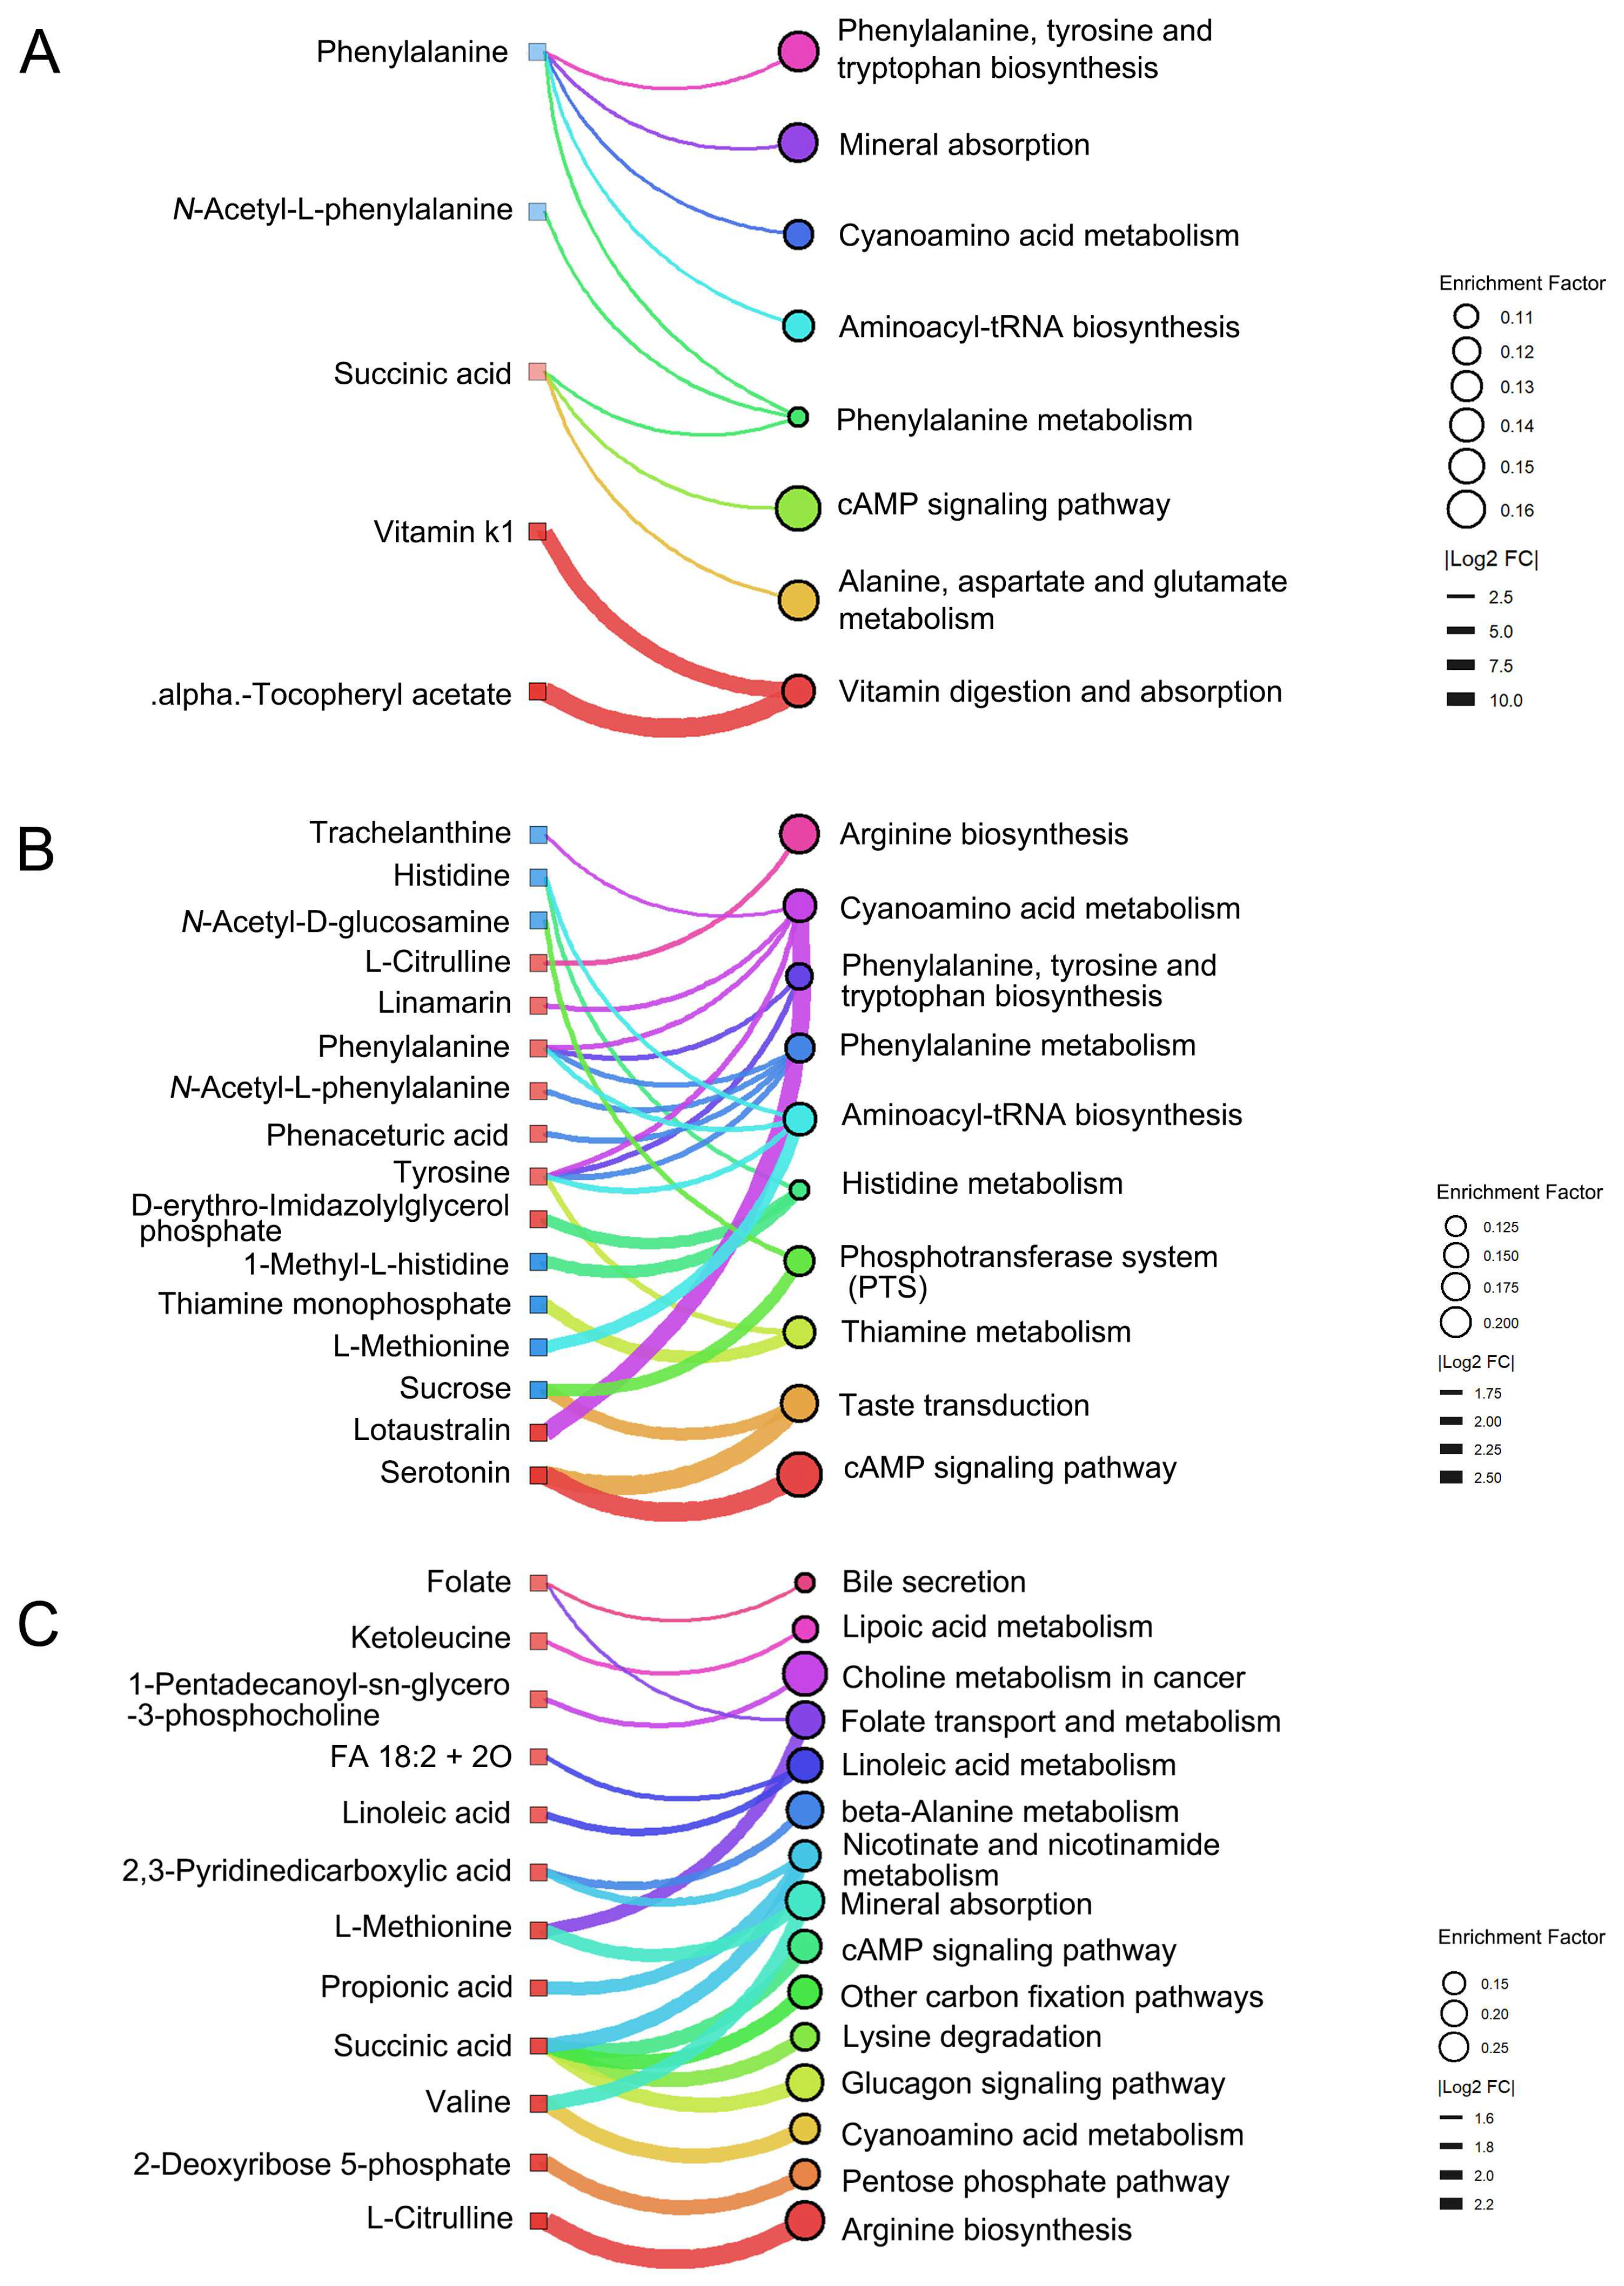
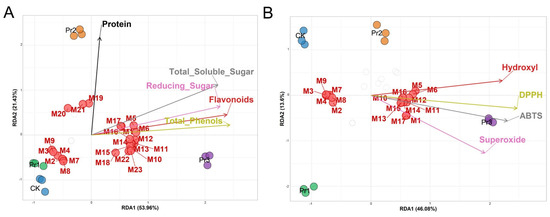
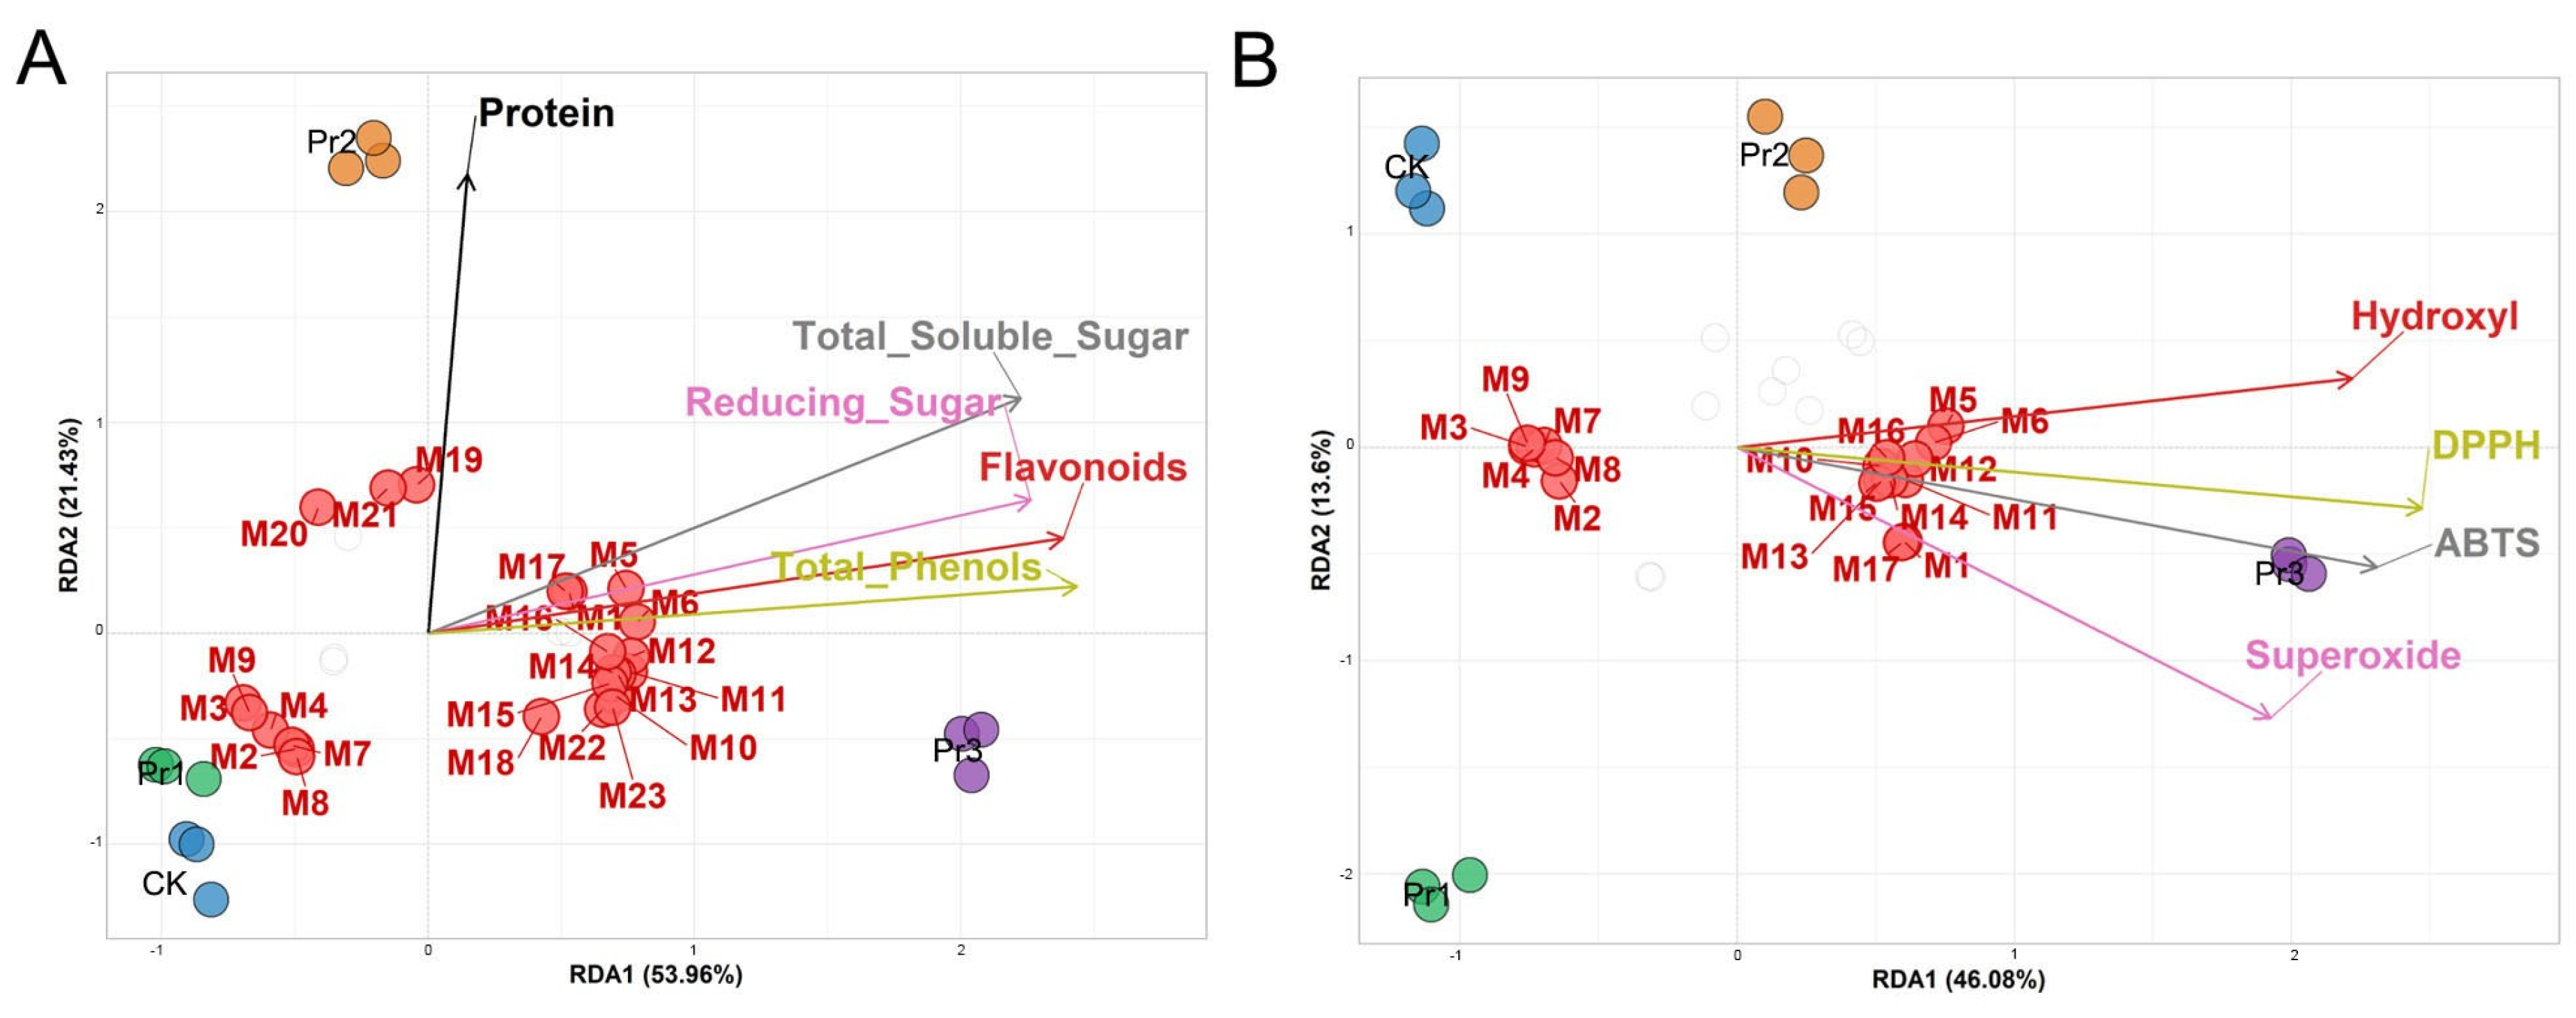

Disclaimer/Publisher’s Note: The statements, opinions and data contained in all publications are solely those of the individual author(s) and contributor(s) and not of MDPI and/or the editor(s). MDPI and/or the editor(s) disclaim responsibility for any injury to people or property resulting from any ideas, methods, instructions or products referred to in the content. |
© 2026 by the authors. Licensee MDPI, Basel, Switzerland. This article is an open access article distributed under the terms and conditions of the Creative Commons Attribution (CC BY) license.