


Highlights
What are the main findings?
- Lettuce growth can be divided into three stages based on critical leaf ages. Under the medium or somewhat above medium fertility level, leaf C, N and P show fixed stage-specific variations consistent with the homeostasis and allometric growth theories.
- Stage-specific ecological stoichiometric reference criteria for lettuce are established, while the universal terrestrial plant N:P threshold is inapplicable to lettuce cultivated under sufficient nutrients.
What is the implication of the main finding?
- Guide stage-based precise fertilization for lettuce to reduce fertilizer input while stabilizing yield and mitigating agricultural non-point source pollution.
- Simplify growth stage division by leaf age to realize standardized field management of lettuce.
- Rapidly diagnose plant nutrient imbalance via leaf stoichiometric ratios to timely adjust nutrient supply.
Abstract
This study analyzed the dynamic variation in leaf ecological stoichiometry of lettuce during the whole growth period under the two different fertility levels, and explored the potential application of ecological stoichiometry theory for precise fertilization management of lettuce under the evaluated experimental condition. Taking the two critical leaf ages of 10.39 and 24.25 as dividing points, the growth process of lettuce can be divided into three stages: the initial slow growth stage—S1, mid-rapid growth stage—S2, and subsequent slow growth stage—S3. With plant growth, the contents of carbon (C) and nitrogen (N) in leaves kept increasing, while phosphorus (P) content showed a trend of rising first and then decreasing. The leaf C:N ratio declined steadily, and the C:P and N:P ratios decreased first and then increased. Most stoichiometric indicators exhibited significant differences among different growth stages (p < 0.05). Compared with the medium fertility level treatment, the aboveground biomass of lettuce under the higher fertility level treatment slightly increased, but the contents of C, N, and P in leaves all decreased, and no significant differences in various ecological stoichiometric indicators were observed between the two fertility level treatments (p > 0.05). The dynamic variation patterns of leaf C, N, and P contents and their stoichiometric ratios of the tested lettuce under the designed experimental conditions were consistent with the Homeostasis Theory and Allometric Growth Theory of ecological stoichiometry. Based on the above results, this study established ecological stoichiometric reference criteria suitable for dynamic nutrient regulation of lettuce. Collectively, the present findings not only established targeted ecological stoichiometric reference criteria for dynamic nutrient regulation of the lettuce cultivar used in the study under the tested fertility conditions, but also this research idea may be extended to nutrient regulation of other lettuce cultivars or other crop species.
1. Introduction
The application of chemical fertilizers has played a significant role in increasing vegetable yields and farmers’ incomes. However, the continuous excessive application and inefficient utilization of chemical fertilizers not only lead to a decline in the quality of vegetables but also cause relatively serious environmental pollution [1,2,3,4]. Therefore, research on improving fertilizer utilization efficiency in the process of vegetable cultivation based on different theories is constantly emerging [5,6,7,8].
Ecological stoichiometry is a study that investigates the energy equilibrium and the equilibrium of multiple chemical elements (mainly carbon C, nitrogen N, and phosphorus P), and the effects of these equilibria on ecological interactions [9,10]. Homeostasis Theory and Allometric Growth Theory are the two theoretical cornerstones of constructing ecological stoichiometry [10]. Homeostasis Theory posits that organisms possess the capacity to uphold the relative stability of chemical substances within their bodies even in the face of a certain degree of environmental alterations. In other words, as the external environment varies, the levels of chemical substances like C, N, and P within organisms will neither remain completely static nor undergo drastic fluctuations. Instead, they will maintain relative stability within a narrow range [10]. Allometric Growth Theory posits that changes in the growth rate of organisms are driven by changes in their N:P ratios, and rapid growth in organisms corresponds to a lower N:P ratio within their bodies, while, conversely, slow growth in organisms corresponds to a higher N:P ratio within their bodies [11,12,13,14]. Ecological stoichiometric equilibrium is a dynamic equilibrium, which includes not only maintaining the homeostasis equilibrium of the contents of various elements within organisms but also maintaining the stoichiometric ratio equilibrium of the elements that drive the allometric growth of organisms [10]. The theory of ecological stoichiometric equilibrium holds that only when the ecological stoichiometric equilibrium of organisms is maintained can organisms grow normally. Conversely, failure to maintain nutrient stoichiometric homeostasis can lead to abnormal plant growth and even plant death [15,16,17]. On the basis of these classical theoretical foundations, the present study proposes the core hypothesis that ecological stoichiometry theory can potentially support the dynamic and precise regulation of N and P application rate, proportion, and timing for vegetable production across the entire growth period. This hypothesis is mainly derived from two theoretical rationales. First, according to the stoichiometric homeostasis theory, vegetable plants require N and P supplies that satisfy the threshold for maintaining internal nutrient homeostasis at each growth stage, which theoretically enables the determination of stage-specific N and P supply thresholds. Second, leafy vegetables typically exhibit a distinct slow–fast–slow growth rhythm throughout the growing season, which can be divided into three consistent growth stages: the initial slow growth stage (S1), the mid-rapid growth stage (S2), and the subsequent slow growth stage (S3). According to the Allometric Growth Theory, during the three growth stages with significantly different growth rates of vegetables, the supply ratio of N and P should be adjusted according to the change in the rhythm of the growth rate of vegetables [10]. Therefore, investigating ecological stoichiometric characteristics of crops at different growth stages facilitates precise regulation of nitrogen and phosphorus nutrients by implementing timely application, appropriate amount, and optimal N:P ratio, thereby offering new ideas and approaches for optimized nutrient management in agriculture.
In fact, in recent years, some scholars have already introduced ecological stoichiometry into the research in the field of agronomy [18,19,20]. However, these studies mainly focus on the influence of different fertilization methods on the ecological stoichiometric characteristics of some crops [18,19,20], and there have been no reports on research using the theory of ecological stoichiometry to guide fertilization optimization. The premise of fertilization optimization based on the theory of ecological stoichiometry is to obtain the ecological stoichiometric characteristics of crops in the equilibrium state during different growth stages (especially the critical stages) [18].
In the present paper, lettuce (Lactuca sativa L.) was used as the plant material, and it is currently the most widely cultivated leafy vegetable in the world. The optimization of N and P nutrients during the lettuce production process has always been one of the main research topics for horticulturists [21,22,23]. As a typical leafy vegetable, lettuce has clearly distinguishable three growth stages, S1, S2, and S3 [24], making it particularly suitable for investigating the dynamic regulation of nutrients by studying the ecological stoichiometric characteristics of its different growth stages.
Furthermore, lettuce is a vegetable with moderate nutrient requirements; it grows well in nutrient environments of medium fertility or higher fertility [25] (equivalent to or higher than the fourth-grade standards of the National Soil Survey of China). Therefore, in this present study, lettuce cultivation experiments were set up under two fertility levels of medium and somewhat above medium (20% increase). In this way, not only were the ecological stoichiometric characteristics at different fertility levels revealed, but the ecological stoichiometric characteristics of lettuce at an equilibrium state were also investigated, thereby providing potential theoretical guidance for the regulation of N and P nutrients throughout the whole growth period of lettuce.
2. Material and Methods
2.1. Plant Material and Growth Conditions
All experiments were conducted in a custom-built phytotron chamber at Jiangsu University, Zhenjiang, China, in 2025. The loose green leaf lettuce cultivar, Lvling (obtained from Nanjing Lvling Seed Co., Ltd., Nanjing, China), was used as plant material in the experiment, and this cultivar is widely cultivated throughout China at present. In the phytotron chamber, a photoperiod of 14/10 h (light/dark), temperature of 25/20 °C (day/night), light intensity levels of 600 μmol·m−2 s−1, and air relative humidity of 70% were maintained throughout the experiment. The cultivation experiments were conducted in two phases.
2.2. Experimental Design
First Phase. The uniform-sized seedlings of lettuce at the 6-leaf stage were transplanted into individual plastic pots filled with soil of moderate fertility (Table 1), and their fertility levels were determined using the measurement method provided by Bao [26]. One seedling was planted in each pot. The seedlings in pots were then transferred to the phytotron chamber. Throughout the whole growth period of lettuce, the leaf age index was measured and recorded at regular intervals; the cumulative growth dynamics of lettuce leaf age were then fitted using the Logistic Growth Equation:
where Nt is the cumulative growth amount of lettuce leaf age, t stands for growing days, r refers to the intrinsic growth rate, K represents the environmental carrying capacity, and a is the shape parameter. Then, the leaf age values corresponding to the two transition points were determined, namely the shift from S1 to S2 (30% of K) and from S2 to S3 (70% of K) [27]. Consequently, the three growth stages of S1, S2, and S3, which represent different growth rates, can be clearly distinguished.
Table 1.
Fertility levels under different cultivation treatments.
Second Phase. The cultivation experiments were set up under the two different fertility levels, namely T1 under a medium fertility level and T2 under a somewhat above medium fertility level with a 20% increase in all nutrients listed in Table 1. Both of the above soil fertility levels are sufficient to support normal growth of lettuce, ensuring that neither nutrient deficiencies nor excesses occur [25], and thus guaranteeing that the ecological stoichiometric characteristics of lettuce gained during different growth stages are representative of an equilibrium state. Following the method described above, the lettuce seedlings were transplanted into pots containing soil of varying fertility levels. Leaf lettuce leaves were used for elemental analysis. During the whole growth period of lettuce, three sampling points with distinct leaf ages were set for each of S1, S2 and S3, with three biological replicates at each point, and a total of 27 samples were collected in this experiment. All samples were measured separately without mixing. After oven-drying, the contents of organic carbon, total nitrogen and total phosphorus in the leaf samples were measured. Organic carbon was measured via the potassium dichromate oxidation-spectrophotometric method. Total nitrogen was analyzed by concentrated sulfuric acid digestion combined with the semi-automatic Kjeldahl method. Total phosphorus was determined using sodium hydroxide fusion–molybdenum-antimony anti-colorimetry [26]. In addition, the aboveground fresh biomass per lettuce plant was measured simultaneously with the final leaf sampling, and leaf photosynthetic physiological parameters including net photosynthetic rate (Pn), maximum PSII quantum yield (Fv/Fm), quantum yield of PSII photochemistry (ΦPSII), non-photochemical quenching (NPQ), and photochemical quenching (qP) were simultaneously measured, whereby Pn was determined using a LI-6400 Portable Photosynthesis System (LI-COR 6400, USA) [28], while Fv/Fm, ΦPSII, NPQ, and qP were determined using an imaging pulse-amplitude-modulated fluorometer (Heinz Walz, Effeltrich, Germany) [29].
2.3. Data Processing and Statistical Analysis
During data analysis, the mean value obtained from the three leaf-age sampling points within each growth stage was used to represent the lettuce elemental characteristics of that stage. Statistical processing of experimental data was performed using IBM SPSS Statistics (version 27, IBM Corp., Armonk, NY, USA). One-way analysis of variance (ANOVA) was performed on multi-group data, and multiple comparisons were conducted using Tukey’s HSD test method. Differences between two groups of samples were analyzed via an independent-samples t-test, and all figures were drawn using Origin 2022.
The coefficient of variation (CV) is a statistical measure equal to the ratio of the standard deviation to the mean of a data set, which quantifies the relative dispersion of data. It eliminates the interference of dimension and mean differences, enabling cross-group comparison of data volatility and intuitive evaluation of data stability. In the present paper, we calculated the CV of each ecological stoichiometric characteristic of lettuce under the two fertility treatments, with six independent observational values (3 biological replicates per treatment × 2 treatments) from the same growth stage adopted for calculation.
3. Results
3.1. Classification of Lettuce Growth Stages Based on Growth Rate
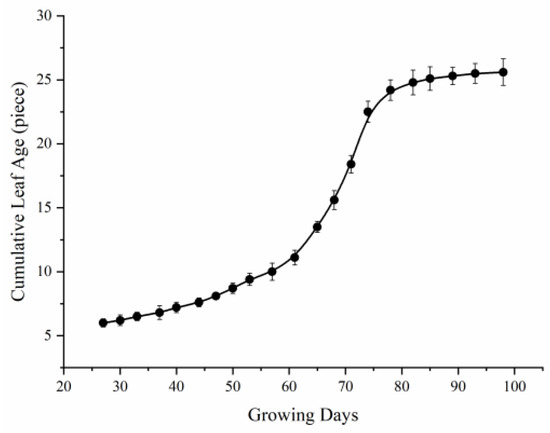
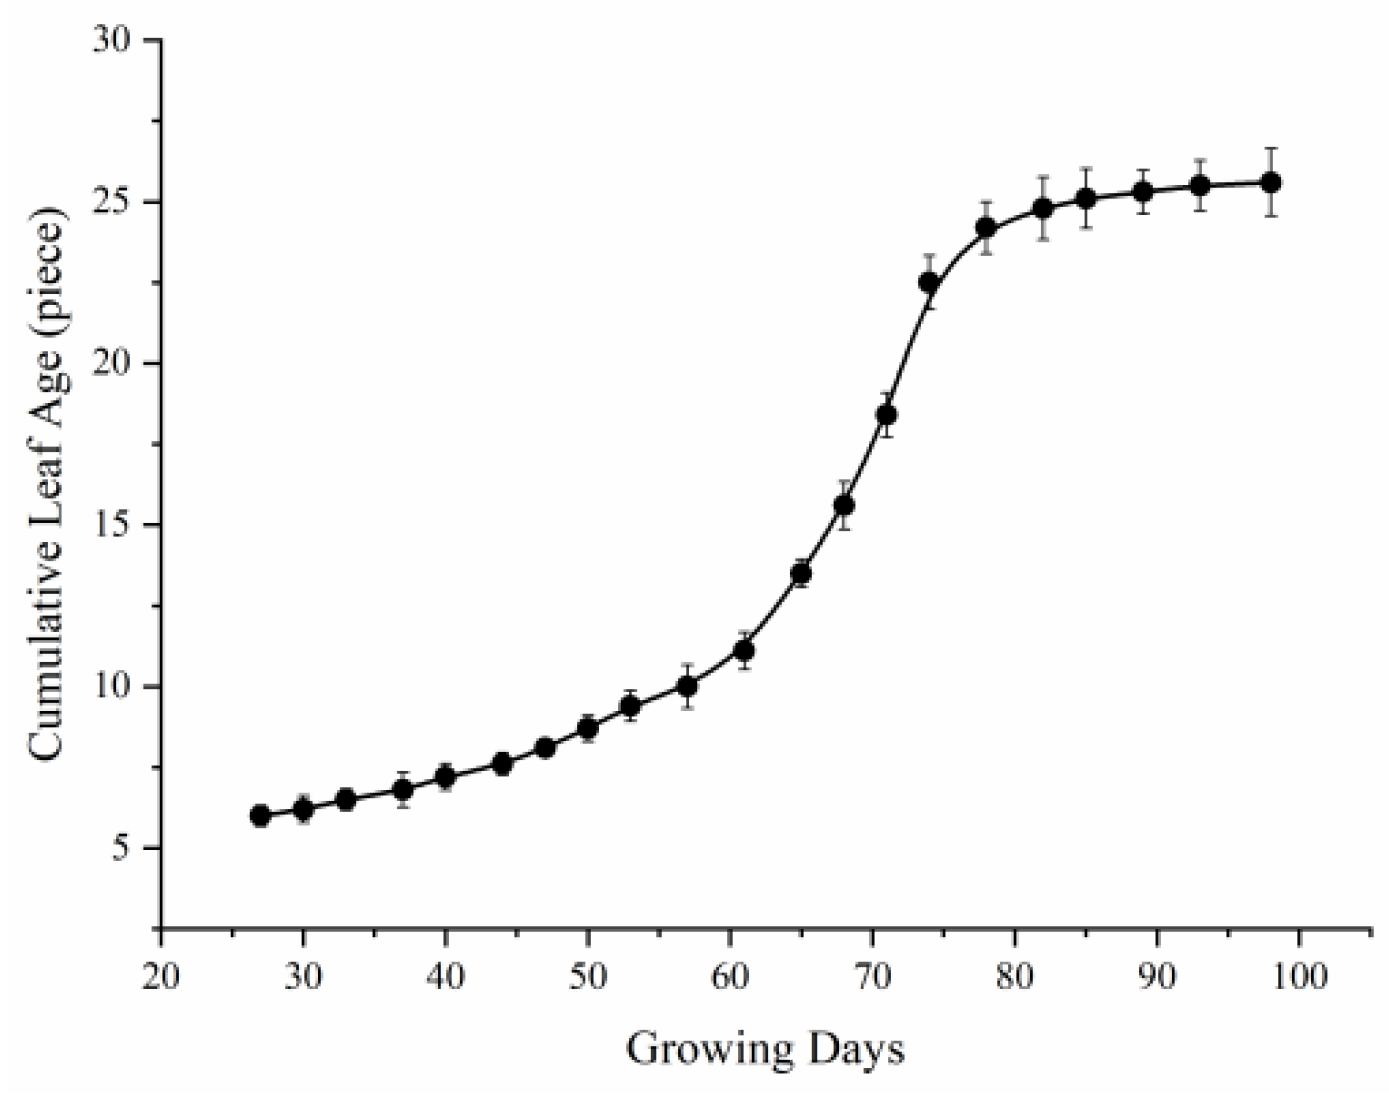
Due to the obvious simultaneous elongation relationship among plant organs, for leafy vegetable lettuce, the leaf growth rate (represented by leaf age) reflects the overall growth rate of the entire lettuce plant. As shown by the cumulative growth dynamics of lettuce leaf age of lettuce throughout its whole growth period (Figure 1), lettuce exhibits a distinct slow–fast–slow S-shaped growth curve, with three growth stages of differing growth rates clearly demarcated. After fitting a Logistic Growth Equation to the cumulative growth dynamics of leaf age throughout the whole growth period of lettuce, the following equation was obtained:
where t and Nt represent the number of days of growth of lettuce(d) and the leaf age value corresponding to t days of growth, respectively. Further calculations based on K of the environmental carrying capacity show that the leaf age values corresponding to the two transition points on the curve are 10.39 and 24.25, respectively.
Figure 1.
Cumulative growth curve of leaf age throughout the whole growth period of lettuce.
3.2. Aboveground Biomass and Photosynthetic Physiological Parameters of Lettuce
The aboveground biomass, Pn, Fv/Fm, ΦPSII, NPQ, and qP of crops have long been the most critical indicators for evaluating the performance of different cultivation practices, including regulation of fertilizer, as it reflects, to a certain extent, whether crops suffer environmental stress during growth and the severity of such stress if present [28,29,30]. In the present paper, the aboveground biomass and the leaf photosynthetic physiological parameters of lettuce under T1 and T2 were shown in Table 2. Judging from the parameters of aboveground biomass, Pn, ΦPSII, NPQ, and qP of lettuce, it was found that lettuce under both T1 and T2 achieved their yield potential and photosynthetic potential [28,29]. Meanwhile, Fv/Fm, as one of the most important fluorescence parameters, reflects the maximal photochemical efficiency of the active center of PSII, and under normal physiological conditions, the Fv/Fm values of the vast majority of C3 plants are in 0.8–0.84. When the Fv/Fm value of a plant is below this range, the plant is exposed to some environmental stresses [29]. In the present paper, Fv/Fm values of both T1 and T2 exceeded 0.81, which may imply that lettuce under the two fertility level treatments were free from nutrient stresses induced by nutrient deficiency or excess stress. The values of aboveground biomass per lettuce plant and photosynthetic physiological parameters for lettuce were comparable between T1 and T2 on the premise that nutrients increased by 20%, and the t-test indicated that there was no significant difference in any parameter between the two fertility level treatments (p > 0.05) (Table 2). This indicates that increasing fertilizer input exerts an extremely limited promoting effect on lettuce at medium fertility levels. According to the theory of ecological stoichiometry, normally growing plants maintain an internal stoichiometric equilibrium [10]. Taken together with our experimental results, it is highly likely that lettuces grown under the two fertility levels in this study maintained internal stoichiometric equilibrium status.
Table 2.
The aboveground biomass and per lettuce plant and its photosynthetic physiological parameters.
3.3. Ecological Stoichiometric Characteristics of Lettuce
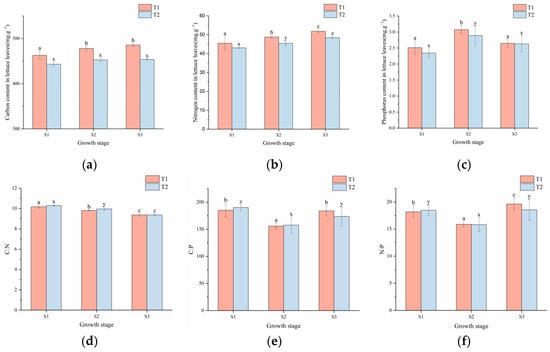
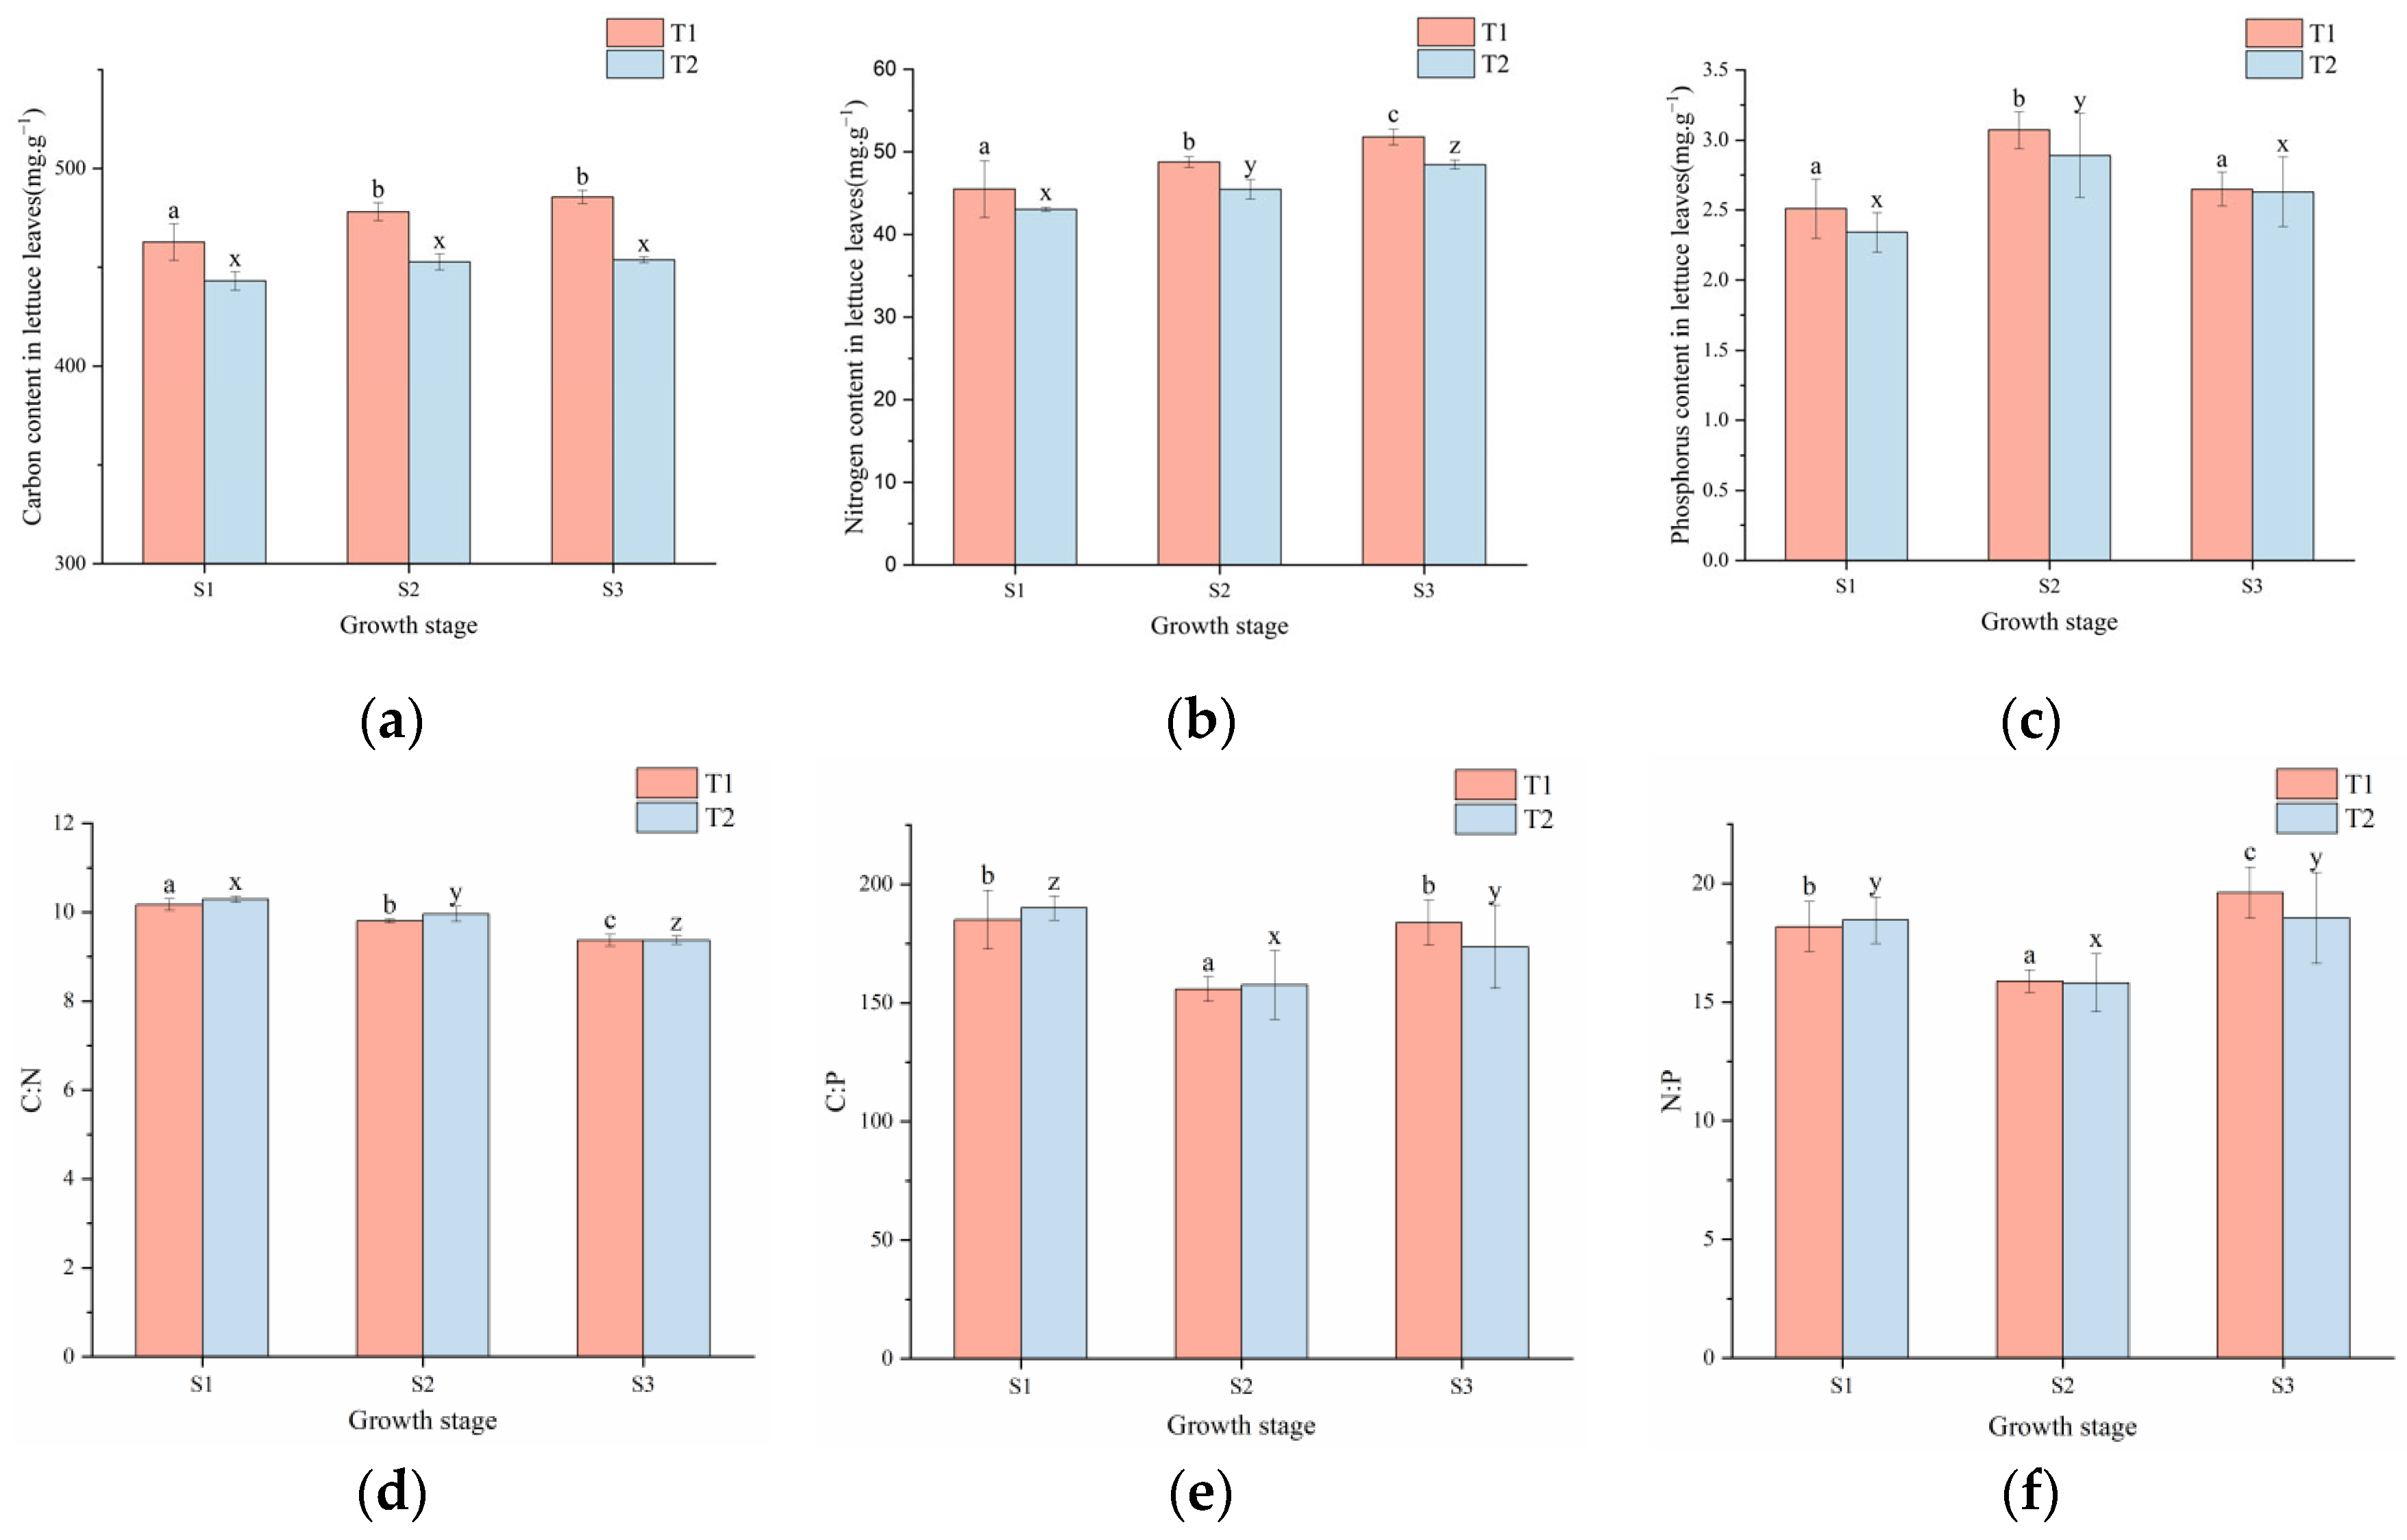
Based on the dynamic ecological stoichiometric characteristics of leaf C, N, and P contents as well as C:N, C:P, and N:P ratios under the two fertility levels (Figure 2), all leaf indicators exhibited consistent variation trends throughout the whole growth period. As lettuce grew, leaf C and N contents continuously accumulated and increased, while P content increased substantially at first and then declined gradually. Correspondingly, the leaf C:N ratio declined steadily, and both C:P and N:P ratios showed a trend of decreasing first and then increasing. In addition, the contents of leaf C, N, and P under T2 were somewhat lower than those under T1, which indicated that extra fertilization on the basis of medium fertility level failed to further boost the accumulation of relevant nutrients in lettuce leaves.
Figure 2.
Dynamic ecological stoichiometric characteristics of lettuce leaves under different fertility levels. (a) leaf carbon content; (b) leaf nitrogen content; (c) leaf phosphorus content; (d) leaf C:N ratio; (e) leaf C:P ratio; (f) leaf N:P ratio. Data represent means ± standard deviation (n = 3), and different letters indicate significant differences according to Tukey’s HSD test (p < 0.05). The above analysis of significant differences is limited to comparisons among different growth stages subjected to identical fertility level treatments.
3.3.1. Comparative Analysis Among the Different Growth Periods Under the Same Fertility Level
Compared with growth stage S1 (C: 462.80 ± 9.31 and 443.10 ± 4.61 mg g−1 under T1 and T2; N: 45.49 ± 3.42 and 43.04 ± 0.24 mg g−1 under T1 and T2; P: 2.51 ± 0.21 and 2.34 ± 0.14 mg g−1 under T1 and T2; C:N: 10.17 ± 0.13 and 10.29 ± 0.07 under T1 and T2; C:P: 185.06 ± 12.52 and 189.98 ± 5.03 under T1 and T2; and N:P: 18.18 ± 1.05 and 18.46 ± 0.98 under T1 and T2), leaf C contents increased by 3.31% (S2: 478.17 ± 4.55 mg g−1) and 4.94% (S3: 485.67 ± 3.41 mg g−1) under T1, and by 2.17% (S2: 452.72 ± 4.13 mg g−1) and 2.41% (S3: 453.81 ± 1.42 mg g−1) under T2, with the increases being significant or non-significant (p < 0.05 or >0.05), respectively. Leaf N contents increased by 7.21% (S2: 48.77 ± 0.66 mg g−1) and 13.81% (S3: 51.80 ± 0.96 mg g−1) under T1, and by 7.21% (S2: 45.46 ± 1.18 mg g−1) and 13.88% (S3: 48.45 ± 0.53 mg g−1) under T2, and all increases were statistically significant (p < 0.05). Leaf P contents increased by 22.31% (S2: 3.07 ± 0.13 mg g−1) and 5.44% (S3: 2.65 ± 0.12 mg g−1) under T1, and by 23.68% (S2: 2.89 ± 0.30 mg g−1) and 12.55% (S3: 2.63 ± 0.25 mg g−1) under T2. Across the two fertility level treatments, leaf P content at S2 was significantly higher than that at S1 and S3 (p < 0.05). Leaf C:N ratios decreased by 3.64% (S2: 9.80 ± 0.24) and 7.93% (S3: 9.37 ± 0.23) under T1, and by 3.21% (S2: 9.96 ± 0.37) and 9.00% (S3: 9.37 ± 0.19) under T2, and all reductions reached significant levels (p < 0.05). Leaf C:P ratios decreased by 15.83% (S2: 155.77 ± 5.20) and 0.07% (S3: 183.81 ± 9.54) under T1, and by 17.04% (S2: 157.60 ± 14.52) and 8.58% (S3: 173.67 ± 17.62) under T2, with significant or non-significant differences (p < 0.05 or >0.05). Leaf N:P ratios decreased by 12.65% (S2: 15.88 ± 0.48) and rose by 7.82% (S3: 19.61 ± 1.08) under T1, and decreased by 14.37% (S2: 15.81 ± 1.22) and slightly increased 0.47% (S3: 18.55 ± 1.92) under T2, showing significant or non-significant differences (p < 0.05 or >0.05).
3.3.2. Comparative Analysis Between the Two Fertility Levels Within the Same Growth Period
Compared with the medium fertility level treatment T1, the leaf C contents in T2 decreased by 4.26%, 5.31%, and 6.56% at the three growth stages S1, S2, and S3, respectively; the N contents declined by 5.37%, 6.78%, and 6.46%, and the P contents were reduced by 6.91%, 5.86%, and 0.63%, respectively. For stoichiometric ratios, leaf C:N ratios under T2 increased by 1.18%, 1.63%, and 0%, respectively; leaf C:P ratios rose by 2.66% and 1.18% at S1 and S2 and dropped by 5.51% at S3; and leaf N:P ratios went up by 1.52% and 0.48% at S1 and S2 and fell by 5.41% at S3. The t-test results revealed that the differences in leaf C, N, P contents as well as C:N, C:P, and N:P between the two fertility level treatments at the identical growth stage were all non-significant (p > 0.05) (see previous paragraph for stoichiometric characteristic values of lettuce at different growth periods under the two fertility level treatments).
At the three growth stages S1, S2 and S3, the CVs of leaf C, N and P between the two fertility level treatments were 2.54% (452.95 ± 11.53, n = 6), 3.15% (44.27 ± 1.39, n = 6), and 6.89% (2.42 ± 0.17, n = 6) at S1; 2.83% (465.43 ± 13.19, n = 6), 3.89% (47.11 ± 1.83, n = 6), and 6.99% (2.98 ± 0.21, n = 6) at S2; and 3.42% (469.74 ± 16.08, n = 6), 3.57% (50.13 ± 1.79, n = 6), and 6.13% (2.64 ± 0.16, n = 6) at S3. The CVs of C:N, C:P, and N:P ratios were 0.99% (10.23 ± 0.10, n = 6), 4.92% (187.52 ± 9.23, n = 6), and 4.67% (18.32 ± 0.86, n = 6) at S1; 1.31% (9.88 ± 0.13, n = 6), 5.72% (156.68 ± 8.95, n = 6), and 4.77% (15.85 ± 0.76, n = 6) at S2; and 0.99% (9.37 ± 0.09, n = 6), 7.06% (178.74 ± 12.63, n = 6), and 7.22% (19.08 ± 1.38, n = 6) at S3, respectively. The extremely low CV for each ecological stoichiometric characteristic value between the two fertility level treatments further indicates that changes in fertility environments within a certain range only trigger negligible fluctuations in these stoichiometric characteristic values.
3.4. Correlation Analysis of Ecological Stoichiometric Characteristic Parameters of Lettuce
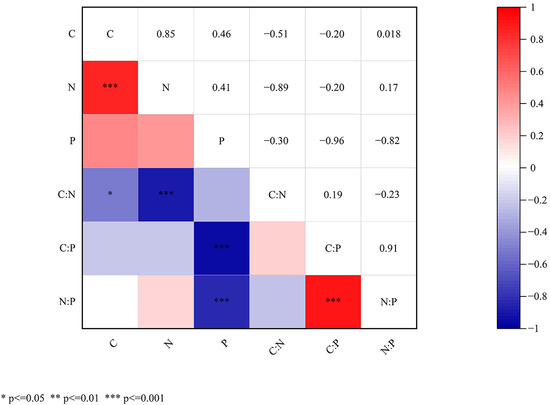
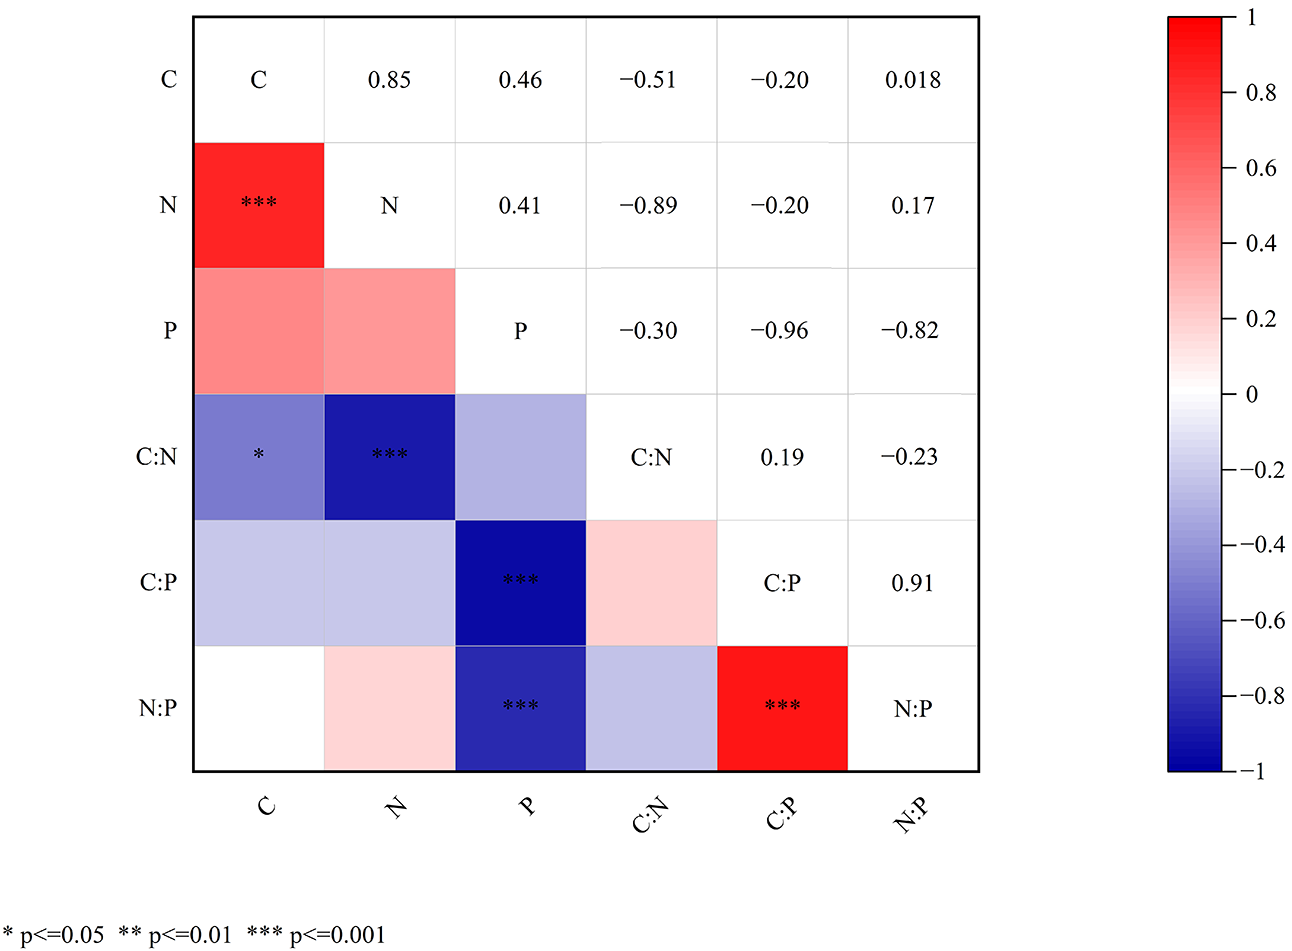
Correlations among various indicators can reveal their synergistic linkages under environmental changes. According to the correlation analysis of leaf C, N, P contents as well as C:N, C:P, and N:P ratios of lettuce at each growth stage under two fertility level treatments (Figure 3), the correlation coefficients between leaf C and N, and between N:P and C:P were 0.85 and 0.91, respectively, showing extremely significant positive correlations (p < 0.001). This was mainly attributed to the synchronous and coordinated accumulation of C and N throughout lettuce growth, which led to consistent variation trends of C:P and N:P ratios and, thus, an extremely strong positive correlation. The correlation coefficients of N vs. C:N, P vs. C:P, and P vs. N:P were −0.89, −0.96, and −0.82, respectively, all presenting extremely significant negative correlations (p < 0.001), which resulted from the comprehensive differences in the accumulation rates of C, N, and P in lettuce leaves. The correlation coefficient between leaf C and C:N was −0.51, indicating a significant negative correlation (p < 0.05). Although C and N accumulated synchronously during lettuce development, the accumulation rate of N was higher than that of C, leading to this negative relationship. Other pairs of ecological stoichiometric characteristics exhibited positive or negative correlations to varying degrees, yet none of these correlations were statistically significant (p > 0.05).
Figure 3.
Correlation coefficients of C, N, P and their stoichiometric ratios in lettuce leaves. Correlation heat map reflecting the associations among C, N, P and their stoichiometric ratios in lettuce leaves. C, carbon; N, nitrogen; P, phosphorus; C:N, carbon-to-nitrogen ratio; C:P, carbon-to-phosphorus ratio; N:P, nitrogen-to-phosphorus ratio. Asterisks indicate significant correlations: * p < 0.05, ** p < 0.01, and *** p < 0.001.
4. Discussion
In recent years, numerous studies have focused on the yield and quality of lettuce [30,31,32,33], while research on the division of lettuce growth stages remains relatively scarce, with inconsistent classification criteria. Gao et al. continuously monitored lettuce growth status via machine vision technology and divided the growth rhythm of lettuce into a “slow–fast–slow” pattern [24]. Lin et al. proposed a lettuce growth stage identification method based on the SAB-YOLO model [34]. Both approaches rely on complicated data acquisition procedures as prerequisites, making them difficult to be directly applied in practical lettuce cultivation.
To meet the research demands of ecological stoichiometry of lettuce, leaf age (piece), an indicator capable of characterizing lettuce growth rate, was selected as the staging marker in this study. By fitting the dynamic cumulative leaf age data throughout the whole growth period and constructing a Logistic Growth Equation, we calculated the critical leaf age thresholds corresponding to the two transition points of growth rate, namely the shift from S1 to S2, and from S2 to S3. On this basis, the growth process of the lettuce variety used in the experiment was divided into three stages: S1 (leaf age < 10.39), S2 (10.39 ≤ leaf age ≤ 24.25), and S3 (leaf age > 24.25). This staging standard is convenient and intuitive, and can be directly adopted in relevant scientific research and practical cultivation production.
In general, appropriate fertilization can increase nutrient contents in plants. However, raising the fertility level by 20% above the medium level reduced elemental contents of C, N, and P in lettuce in the present paper. This phenomenon implies that fast-growing leafy lettuce may possess an optimal nutrient threshold. When this threshold is exceeded, tissue nutrient contents no longer increase continuously. The reduction in element concentrations could be explained by excessive vegetative growth, nutrient antagonism and dilution effect [6]. From the perspective of agricultural production, cultivating lettuce under a medium fertility level might be more conducive to the accumulation of C, N, and P in leaves.
The average leaf C contents of lettuce under T1 and T2 were 475.53 mg·g−1 and 449.88 mg·g−1, respectively, both close to the global mean leaf C content of 461.00 mg·g−1 derived from 492 plant species. Significant differences in leaf C content were observed among different growth stages under the same fertility level, which was inconsistent with the dynamic patterns of leaf C content reported by Ye et al. for several plant species [35], possibly owing to the fast-growing trait of lettuce. The average leaf N and P contents under T1 were 48.68 mg·g−1 and 2.80 mg·g−1, while those under T2 were 45.65 mg·g−1 and 2.62 mg·g−1. Both values were markedly higher than the global average leaf N and P contents (20.60 mg·g−1 and 1.99 mg·g−1) [9]. On the one hand, this indicated that lettuce is a leafy vegetable rich in N and P; on the other hand, it demonstrated that lettuce suffered no nutrient deficiency during growth under T1, and additional fertilization exerted adverse effects on the accumulation of mineral nutrients in plants.
Leaves are the primary vegetative organs for plant photosynthesis. Leaf C:N and C:P ratios can characterize plants’ C assimilation capacity, and also reflect plant growth rates as well as N and P utilization efficiencies [36,37]. Leaf C:N ratio is negatively correlated with plant growth rate; a lower C:N ratio corresponds to faster leaf growth yet weaker carbon fixation capacity. In the present paper, the average leaf C:N ratios of lettuce under T1 and T2 were 9.78 and 9.87, and the average C:P ratios were 176.21 and 173.75, respectively. The leaf C:N and C:P values of both treatments were lower than the global average leaf C:N (22.50) and C:P (232) of terrestrial plants [9], which indicated that lettuce possessed higher nutrient utilization efficiency but weaker carbon fixation capacity. The N:P ratio can be used to judge whether plant growth is limited by N or P supply. In this study, leaf N:P exhibited an extremely significant negative correlation with P content (p < 0.001), while no significant correlation was observed between N:P and N content, suggesting that leaf N:P ratio was mainly determined by leaf P content. According to the N:P threshold proposed by Koerselman and Meuleman, plant growth is limited by N when N:P < 14, whereas P limitation tends to occur when N:P > 16 [38]. The average leaf N:P ratios of lettuce under the two fertility level treatments were 18.04 and 17.60, both higher than 16, which may suggest that lettuce growth is potentially restricted by P. Such inference seemingly conflicts with the observation that no nutrient deficiency symptoms appeared in lettuce in this study. This phenomenon may support the perspective proposed by Tian et al. [39], i.e., the traditional N:P threshold may fail to accurately diagnose nutrient limitation type under adequate N and P supply conditions.
Homeostasis Theory holds that organisms can maintain relatively stable ecological stoichiometric characteristics under variable nutrient environments [10]. In the present experiment, leaf C, N, and P contents of lettuce at all growth stages under T2 were lower than those under T1; the largest decline occurred for P concentration at stage S1, with a reduction rate of only 6.91%. The maximum CV for each element between the two fertility level treatments at the same growth stage was merely 3.51%, appearing in leaf N at S2 and leaf P at S3, respectively. This observation may imply that a 20% increase in fertility exerted minimal impacts on leaf C, N, and P contents of lettuce, which appears to align with the prediction of Homeostasis Theory. Allometric Growth Theory states that with the increase in plant growth rate, the N:P and C:P ratios in plants decline, while P concentration rises [10]. During the rapid growth period, cell division and new tissue formation proceed actively. P serves as a core component of nucleic acids, phospholipids and energy carrier ATP; it may support cell division, photosynthesis and carbohydrate transport, assist N transformation into proteins, and coordinate N metabolism [6,10]. P may also stimulate root development and facilitate nutrient absorption, potentially resulting in strong phosphorus demand during fast plant growth. Under the two fertility level treatments in this study, leaf C:P and N:P ratios of lettuce first decreased and then increased, reaching the minima at growth stage S2, when lettuce grew most rapidly. Leaf P contents rose initially and declined afterward, peaking at S2. Such changing patterns seem to partially agree with the expectations derived from ecological stoichiometric Allometric Growth Theory.
5. Conclusions
In the present paper, leaf age was adopted as the classification index to divide the growth process of the tested lettuce variety into three stages: the initial slow growth stage—S1 (leaf age < 10.39), the mid-rapid growth stage—S2 (10.39 ≤ leaf age ≤ 24.25), and the subsequent slow growth stage—S3 (leaf age > 24.25). This classification standard can be directly applied to scientific research and practical production.
As lettuce grew, leaf C and N contents continuously increased under the two fertility levels, while P contents rose at first and then decreased. Correspondingly, leaf C:N ratios declined steadily, and both C:P and N:P ratios decreased initially and increased afterwards, with most of these variations reaching significant levels. Although the above-ground biomass of lettuce slightly increased under the higher fertility level treatment, leaf C, N, and P contents all decreased. Moreover, the ranges of all these variations were limited and non-significant. Combined with the above results, the ecological stoichiometric characteristics of lettuce are consistent with the Homeostasis Theory and Allometric Growth Theory of ecological stoichiometry; therefore, these two theories can provide a theoretical basis for the regulation of lettuce fertilization.
Considering the similar lettuce yield and relatively stable ecological stoichiometric characteristics between the two fertility level treatments, the average values of each stoichiometric index under the two treatments may serve as the preliminary reference benchmarks for fertilizer regulation in lettuce cultivation. At growth stages S1, S2, and S3, leaf C, N, and P contents may tentatively be maintained at approximately 453, 465, and 470 mg·g−1, 44, 47, and 50 mg·g−1, and 2.4, 3.0, and 2.6 mg·g−1, respectively. The corresponding C:N, C:P, and N:P ratios are suggested to stay around 10.3, 9.9, and 9.4; 188, 155, and 181; and 18.3, 15.7, and 19.2, respectively. However, it should be noted that these reference values are obtained from a single pot experiment with specific soil conditions and a lettuce cultivar. Further multi-site and multi-cultivar field validations are necessary before these stoichiometric thresholds can be widely adopted for practical fertilizer management.
Author Contributions
Conceptualization, K.W. and W.F.; methodology, K.W.; software, K.W.; validation, K.W.; formal analysis, K.W.; investigation, K.W.; resources, W.F.; data curation, K.W.; writing—original draft preparation, K.W.; writing—review and editing, K.W. and W.F.; visualization, K.W.; supervision, W.F.; project administration, W.F.; funding acquisition, W.F. All authors have read and agreed to the published version of the manuscript.
Funding
This study was supported by the National Natural Science Foundation of China (Grant No. 32371574).
Data Availability Statement
The original contributions presented in this study are included in the article. Further inquiries can be directed to the corresponding author.
Conflicts of Interest
The authors declare no conflicts of interest.
Abbreviations
The following abbreviations are used in this manuscript:
| C | Carbon |
| N | Nitrogen |
| P | Phosphorus |
| S1 | Initial slow growth stage |
| S2 | Mid-rapid growth stage |
| S3 | Subsequent slow growth stage |
| CV | Coefficient of variation |
| Pn | Net photosynthetic rate |
| Fv/Fm | Maximum PSII quantum yield |
| ΦPSII | Quantum yield of PSII photochemistry |
| NPQ | Non-photochemical quenching |
| qP | Photochemical quenching |
References
- Wang, L.X.; Gao, J.M.; Qureshi, W.A. Evolution and Application of Precision Fertilizer: A Review. Agronomy 2025, 15, 1939. [Google Scholar] [CrossRef] [Scilit]
- Xu, Y.H.; Ma, Y.; Cayuela, M.L.; Sanchez-Monedero, M.A.; Wang, Q.J. Compost biochemical quality mediates nitrogen leaching loss in a greenhouse soil under vegetable cultivation. Geoderma 2020, 358, 113984. [Google Scholar] [CrossRef] [Scilit]
- Xu, Y.H.; Liu, X.H.; Jing, Y.P.; Luo, J.; Guo, D.J.; Ma, Y. Dissolved N and C leaching losses mitigated by optimized fertilization management in intensive greenhouse system: Insights from DOM characteristics via EEM-PARAFAC. J. Soils Sediments 2022, 23, 657–671. [Google Scholar] [CrossRef] [Scilit]
- Zhao, H.; Li, X.Y.; Jiang, Y. Response of Nitrogen Losses to Excessive Nitrogen Fertilizer Application in Intensive Greenhouse Vegetable Production. Sustainability 2019, 11, 1513. [Google Scholar] [CrossRef] [Scilit]
- Tang, P.; Li, H.; Issaka, Z.; Chen, C. Effect of manifold layout and fertilizer solution concentration on fertilization and flushing times and uniformity of drip irrigation systems. Agric. Water Manag. 2018, 200, 71–79. [Google Scholar] [CrossRef] [Scilit]
- García-Rodríguez, Á.F.; Moreno-Racero, F.J.; Álvarez, R.; Colmenero-Flores, J.M.; Knicker, H.; Rosales, M.A. Biochar enhances nitrogen use efficiency in lettuce by promoting its metabolic assimilation. Plant Soil 2025, 518, 299–317. [Google Scholar] [CrossRef] [Scilit] [PubMed]
- Ma, G.X.; Chen, X.; Liu, Y.; Hu, J.P.; Han, L.H.; Mao, H.P. Effects of Compound Biochar Substrate Coupled with Water and Nitrogen on the Growth of Cucumber Plug Seedlings. Agronomy 2022, 12, 2855. [Google Scholar] [CrossRef] [Scilit]
- Tunio, M.H.; Gao, J.M.; Mohamed, T.M.K.; Ahmad, F.; Abbas, I.; Shaikh, S.A. Comparison of nutrient use efficiency, antioxidant assay, and nutritional quality of butter-head lettuce (Lactuca sativa L.) in five cultivation systems. Int. J. Agric. Biol. Eng. 2023, 16, 95–103. [Google Scholar] [CrossRef] [Scilit]
- Elser, J.J.; Fagan, W.F.; Denno, R.F.; Dobberfuhl, D.R.; Folarin, A.; Huberty, A.; Interlandi, S.; Kilham, S.S.; McCauley, E.; Schulz, K.L.; et al. Nutritional constraints in terrestrial and freshwater food webs. Nature 2000, 408, 578–580. [Google Scholar] [CrossRef] [Scilit] [PubMed]
- Sterner, R.W.; Elser, J.J. Ecological Stoichiometry: The Biology of Elements from Molecules to the Biosphere; Princeton University Press: Princeton, NJ, USA, 2002. [Google Scholar]
- Chang, B.L.; Chen, W.; He, X.Y.; Yu, S.C. Characterization of carbon, nitrogen, and phosphorus stoichiometry of plant leaves in the riparian zone of Dahuofang Reservoir. Ecol. Evol. 2024, 148, e70152. [Google Scholar] [CrossRef] [Scilit] [PubMed]
- Shousha, S.; Maranger, R.; Lapierre, J.F. Decadal Changes in Anthropogenic Inputs and Precipitation Influence Riverine Exports of Carbon, Nitrogen, and Phosphorus, and Alter Ecosystem Level Stoichiometry. Glob. Biogeochem. Cycles 2023, 37, e2023GB007820. [Google Scholar] [CrossRef] [Scilit]
- Andersen, I.M.; Taylor, J.M.; Kelly, P.T.; Hoke, A.K.; Robbins, C.J.; Scott, J.T. Nitrogen fixation may not alleviate stoichiometric imbalances that limit primary production in eutrophic lake ecosystems. Ecology 2025, 106, e4516. [Google Scholar] [CrossRef] [Scilit] [PubMed]
- Ouyang, M.; Tian, D.; Niklas, K.J.; Yan, Z.; Han, W.Y.; Yu, Q.; Chen, G.X.; Ji, C.; Tang, Z.; Fang, J. The scaling of elemental stoichiometry and growth rate over the course of bamboo ontogeny. New Phytol. 2024, 241, 1088–1099. [Google Scholar] [CrossRef] [Scilit] [PubMed]
- Ren, G.Q.; Cui, M.M.; Yu, H.C.; Fan, X.; Zhu, Z.Q.; Zhang, H.Y.; Dai, Z.C.; Sun, J.F.; Yang, B.; Du, D.L. Global Environmental Change Shifts Ecological Stoichiometry Coupling Between Plant and Soil in Early-Stage Invasions. J. Soil Sci. Plant Nutr. 2024, 24, 2402–2412. [Google Scholar] [CrossRef] [Scilit]
- Liu, Y.; Sun, W.; Jia, T.; Su, T.H.; Wu, S.S.; Zhou, C.Y.; Mo, Y.X.; Qi, J.H.; Lu, Z.Y.; Li, S. Leaf Nutrient Resorption of Vascular Epiphytes Is Regulated by Stoichiometry and Nutrient Limitation Control Strategies. Plant Cell Environ. 2025, 48, 4550–4563. [Google Scholar] [CrossRef] [Scilit] [PubMed]
- Wang, J.H.; Chen, W.; Zhu, H. Ecological stoichiometry and invasive strategies of two alien species (Bidens pilosa and Mikania micrantha) in subtropical China. Ecol. Res. 2019, 34, 612–623. [Google Scholar] [CrossRef] [Scilit]
- Gong, L.; Li, H.L.; Liu, Y.T.; An, S.Q. Effects of nitrogen and phosphorus fertilizers on carbon, nitrogen, and phosphorus stoichiometry of oasis cotton in the upper reaches of Tarim River, Xinjiang, China. Acta Ecol. Sin. 2017, 37, 7689–7697. [Google Scholar] [CrossRef] [Scilit]
- Shi, Q.; Fu, W.G.; Li, Z.; Wang, F.K. Effects of stoichiometric traits of nitrogen and phosphorus in soil on photosynthetic characteristics of wheat. Commun. Soil Sci. Plant Anal. 2020, 51, 1204–1212. [Google Scholar] [CrossRef] [Scilit]
- Liang, J.Y.; Yin, J.D.; Hou, H.Z.; Xue, Y.G.; Guo, H.J.; Wang, S.; Zhao, Q.Z.; Zhang, X.C.; Xie, J.H. Effects of deep fertilization on ecological stoichiometric characteristics and photosynthetic carbon assimilation of flag leaves of spring wheat under drought conditions. Acta Agron. 2024, 50, 2078–2090. [Google Scholar] [CrossRef] [Scilit]
- Yan, Z.N.; Li, X.; Li, Z.X.; Qi, Y.; Song, J.X.; Cheng, F.; Dou, H.J.; Yang, Y.J. Partially Substituting Photosynthetic Photon Flux Density with Far-red Photons Differentially Alters Biomass Accumulation and Photochemical Efficiency of Greenhouse Lettuce. HortScience 2024, 59, 1691–1699. [Google Scholar] [CrossRef] [Scilit]
- Gao, H.Y.; Mao, H.P.; Ullah, I. Analysis of Metabolomic Changes in Lettuce Leaves under Low Nitrogen and Phosphorus Deficiencies Stresses. Agriculture 2020, 10, 406. [Google Scholar] [CrossRef] [Scilit]
- Tunio, M.H.; Gao, J.M.; Lakhiar, I.A.; Solangi, K.A.; Qureshi, W.A.; Shaikh, S.A.; Chen, J.D. Influence of Atomization Nozzles and Spraying Intervals on Growth, Biomass Yield, and Nutrient Uptake of Butter-Head Lettuce under Aeroponics System. Agronomy 2021, 11, 97. [Google Scholar] [CrossRef] [Scilit]
- Gao, H.Y.; Mao, H.P.; Ni, J.H.; Gong, L.Y.; Zhang, X.D. Effects of different fertilization on nutrient and growth of lettuce and models simulation. J. Drain. Irrig. Mach. Eng. 2020, 38, 1264–1269. [Google Scholar]
- Hong, J.; Xu, F.; Chen, G.; Huang, X.; Wang, S.; Du, L.; Ding, G. Evaluation of the Effects of Nitrogen, Phosphorus, and Potassium Applications on the Growth, Yield, and Quality of Lettuce (Lactuca sativa L.). Agronomy 2022, 12, 2477. [Google Scholar] [CrossRef] [Scilit]
- Bao, S.D. Soil and Agricultural Chemistry, 3rd ed.; China Agriculture Press: Beijing, China, 2000. [Google Scholar]
- Chen, Y.G. Stage division of urban growth based on logistic model of fractal dimension curves. Results Phys. 2023, 53, 106940. [Google Scholar] [CrossRef] [Scilit]
- Zhou, J.; Li, P.P.; Wang, J.Z. Effects of Light Intensity and Temperature on the Photosynthesis Characteristics and Yield of Lettuce. Horticulturae 2022, 8, 178. [Google Scholar] [CrossRef] [Scilit]
- Fu, W.G.; Li, P.P.; Wu, Y.Y. Effects of different light intensities on chlorophyll fluorescence characteristics and yield in lettuce. Sci. Hortic. 2012, 135, 45–51. [Google Scholar] [CrossRef] [Scilit]
- Li, W.G.; Zhang, C.B.; Ma, T.H.; Li, W. Estimation of summer maize biomass based on a crop growth model. Emir. J. Food Agric. 2021, 33, 742–750. [Google Scholar] [CrossRef] [Scilit]
- Yu, H.B.; Wang, P.Z.; Zhu, L.T.; Liu, Y.C.; Chen, M.C.; Zhang, S.; Sui, Y.Y. Optimizing light intensity and airflow for improved lettuce growth and reduced tip burn disease in a plant factory. Sci. Hortic. 2024, 338, 113693. [Google Scholar] [CrossRef] [Scilit]
- Liu, C.H.; Yu, H.Y.; Liu, Y.C.; Zhang, L.; Li, D.W.; Zhao, X.M.; Zhang, J.H.; Sui, Y.Y. Promoting Anthocyanin Biosynthesis in Purple Lettuce through Sucrose Supplementation under Nitrogen Limitation. Horticulturae 2024, 10, 838. [Google Scholar] [CrossRef] [Scilit]
- Sun, J.; Cong, S.L.; Mao, H.P.; Wu, X.H.; Yang, N. Quantitative detection of mixed pesticide residue of lettuce leaves based on hyperspectral technique. J. Food Process Eng. 2018, 41, e12654. [Google Scholar] [CrossRef] [Scilit]
- Lin, K.Y.; Wang, X.L.; Niu, C.Y.; Wu, J.H.; Chen, J.; Yang, X.J. Lettuce Growth Period Recognition Method Based on SAB-YOLO Model. Trans. Chin. Soc. Agric. Mach. 2026, 57, 290–299. [Google Scholar]
- Ye, L.X.; Zhang, Y.; Jiang, Z.L.; Lyu, A.H.; Wang, Z.; Zhou, B.Z.; Wang, X.X.; Wu, J.S. The stoichiometric characteristics of carbon, nitrogen and phosphorus in soil and leaves of different ages of Myrica rubra. J. Anhui Agric. Univ. 2019, 46, 454–459. [Google Scholar]
- Zhang, G.Q.; Zhang, P.; Chen, Y.M.; Peng, S.Z.; Cao, Y. Stoichiometric characteristics of Robinia pseudoacacia and Pinus tabuliformis plantation ecosystems in the Loess hilly-gully region, China. Acta Ecol. Sin. 2018, 38, 1328–1336. [Google Scholar] [CrossRef] [Scilit]
- Ren, S.J.; Yu, G.R.; Jiang, C.M.; Fang, H.J.; Sun, X.M. Stoichiometric characteristics of leaf carbon, nitrogen, and phosphorus of 102 dominant species in forest ecosystems along the North-South Transect of East China. Chin. J. Appl. Ecol. 2012, 23, 581–586. [Google Scholar]
- Koerselman, W.; Meuleman, A.F.M. The vegetation N:P ratio: A new tool to detect the nature of nutrient limitation. J. Appl. Ecol. 1996, 33, 1441–1450. [Google Scholar] [CrossRef] [Scilit] [PubMed]
- Tian, D.; Yan, Z.B.; Fang, J.Y. Review on characteristics and main hypotheses of plant ecological stoichiometry. Chin. J. Plant Ecol. 2021, 45, 682–713. [Google Scholar] [CrossRef] [Scilit]

Disclaimer/Publisher’s Note: The statements, opinions and data contained in all publications are solely those of the individual author(s) and contributor(s) and not of MDPI and/or the editor(s). MDPI and/or the editor(s) disclaim responsibility for any injury to people or property resulting from any ideas, methods, instructions or products referred to in the content. |
© 2026 by the authors. Licensee MDPI, Basel, Switzerland. This article is an open access article distributed under the terms and conditions of the Creative Commons Attribution (CC BY) license.