


Abstract
To investigate the effects of nitrogen application timing on photosynthetic traits and essential oil yield of Cinnamomum camphora var. linalooliferum coppice stands, an experiment was conducted with different nitrogen allocation ratios at coppicing, topdressing in June and August using a constant nitrogen amount of 270 kg·ha−1. Plant growth, photosynthetic traits, and total above-ground essential oil yield were measured dynamically. Nitrogen application timing significantly affected photosynthetic performance, biomass accumulation, and essential oil yield (p < 0.05), showing clear stage-specific responses. It was found that early growth favored higher basal nitrogen fertilization, whereas middle-to-late growth benefited from increased topdressing. Principal component analysis revealed strong coordination among photosynthesis, growth traits, and essential oil yield, with N5 closely associated with high essential oil yield per plant (TEOyp), plant height (PH), leaf area index (LAI), relative chlorophyll value (SPAD), and biomass traits. Correlation analysis further confirmed the stage-specific regulatory effects of photosynthetic traits and plant growth on essential oil yield. Nitrogen fertilization at coppicing mainly enhanced photosynthetic efficiency to support essential oil formation, whereas topdressing promoted vegetative growth and biomass accumulation to exploit yield potential. These findings will provide theoretical support and practical guidance for efficient nitrogen management in high-yield cultivation.
1. Introduction
Cinnamomum camphora (Lauraceae) is a large evergreen broad-leaved tree widely distributed in southern China, including Jiangxi, Fujian, Hunan, and Taiwan. As an important economic forest species, its leaves, branches, roots, and other organs are rich in essential oils. Among its varieties, C. camphora var. linalooliferum is characterized by an exceptionally high linalool content in leaf essential oil, often exceeding 90%, and exhibits favorable fragrance and physicochemical properties, making it highly valuable for the fragrance industry [1].
In recent years, the coppice cultivation system of C. camphora var. linalooliferum has been widely adopted in southern China due to its short rotation cycle, ease of management, and high essential oil yield per unit area [2]. Under this production model, improving cultivation practices to enhance essential oil yield and ensure a stable and efficient supply of raw materials has become a critical issue for both scientific research and industrial application.
Nitrogen is an essential macronutrient for plant growth and plays a central role in chlorophyll synthesis, maintenance of photosynthetic enzyme activity, and regulation of metabolic fluxes [3]. Adequate nitrogen supply can increase leaf area index (LAI) and photosynthetic efficiency, thereby promoting carbohydrate accumulation and providing carbon precursors for secondary metabolite biosynthesis [4]. Previous studies on peppermint (Mentha × piperita L., Lamiaceae) have demonstrated that appropriate nitrogen application significantly enhances chlorophyll content, vegetative growth, and essential oil accumulation [5], while also increasing essential oil yield and the proportion of major components [6].
Beyond the total nitrogen amount applied, nitrogen management is strongly influenced by application timing, which is a key factor regulating plant physiological processes. Staged nitrogen application has been shown to improve essential oil yield in lavender (Lavandula angustifolia Mill., Lamiaceae) and zippora (Ziziphora clinopodioides Lam., Lamiaceae) [7,8]. Photosynthesis, as the primary physiological basis for essential oil biosynthesis in C. camphora var. linalooliferum, directly affects carbon supply, biomass accumulation, and secondary metabolic fluxes. Nitrogen application timing can markedly influence photosynthetic rate carbon–nitrogen allocation, and metabolic balance, thereby shaping yield formation [9]. Adequate nitrogen availability during early growth favors physiological activity and vegetative organ development, providing a foundation for subsequent carbon assimilation [10]. In contrast, nitrogen topdressing at later growth stages may promote secondary metabolite accumulation by regulating carbon–nitrogen balance and metabolic partitioning [11]. However, nitrogen responses can be species- and stage-dependent; for example, although moderate nitrogen supply enhances essential oil yield in peppermint [12], topdressing at the flowering bud stage shows limited effects [6]. Therefore, optimizing nitrogen application timing to coordinate early vegetative growth and late-stage secondary metabolism is critical for achieving high yield and quality in aromatic plants [13].
Despite these advances, systematic studies examining nitrogen timing strategies under a constant total nitrogen input in C. camphora var. linalooliferum coppice stands remain scarce. In particular, the regulatory mechanisms linking nitrogen application timing with growth dynamics, photosynthetic traits, and essential oil accumulation have not been fully elucidated. Therefore, this study aimed to evaluate the effects of different nitrogen application timings on leaf photosynthetic characteristics under a fixed nitrogen supply and to further analyze their roles in regulating plant growth and essential oil yield formation in C. camphora var. linalooliferum coppice stands. The findings are expected to provide a scientific basis for efficient fertilization management and technical support for improving essential oil yield and quality in aromatic forest systems.
2. Materials and Methods
2.1. Subsection Study Site Overview
The study was conducted at the Jiangxi Provincial Engineering Research Center for Seed-breeding and Utilization of Camphor Trees of Nanchang Institute of Technology, located at 116°2′5.00′′ E to 116°2′7.55′′ E and 28°41′27.44″ N to 28°41′29.90″ N. The site has a subtropical humid monsoon climate, with an average annual temperature ranging from 17.1 °C to 17.8 °C, annual precipitation between 1600 and 1700 mm, and annual sunshine hours ranging from 1723 to 1820 h. The climate is mild, with abundant rainfall, distinct seasons, and sufficient sunlight. Monthly mean temperature and precipitation during the experimental period (June–December 2024) are presented in Table 1. The soil was primarily derived from Quaternary red clay and developed into red soil, classified as Ferrosols according to the FAO soil classification system and as Ultisols (Udults) according to the USDA Soil Taxonomy. The basic soil fertility included a pH of 6.6, organic matter content of 12.08 g·kg−1, total nitrogen content of 0.68 g·kg−1, alkali-hydrolyzable nitrogen of 0.08 g·kg−1, and available phosphorus of 0.02 g·kg−1.
Table 1.
Monthly mean temperature and precipitation from June to December 2024 at the experimental site.
2.2. Experimental Design
The superior variety of C. camphora var. linalooliferum named “Gan Fang No. 1” (Gan S-SC-CC-001-2020), a high-quality cultivar developed and released by the Jiangxi Provincial Forestry Variety Approval Committee, was used as experimental material. The experimental forest was established in the spring of 2022, with a planting density of 1 m × 1 m. After two years of growth, all stands were clear-cut, leaving stumps at a height of 20 cm above the ground. Based on this coppicing management practice, a nitrogen application timing experiment was conducted in C. camphora var. linalooliferum coppice stands.
In this study, a constant total nitrogen application amount of 270 kg·ha−1 was adopted. Nitrogen was applied as urea (46% N), phosphorus as calcium–magnesium phosphate (12% P2O5), and potassium as potassium chloride (60% K2O), and all fertilizers were commercially available. On this basis, five nitrogen treatments with different application timings and allocation ratios were established, while a non-fertilized treatment was used as the control (CK) (Table 2). These differentiated treatments were designed to evaluate the effects of nitrogen supply timing on growth, photosynthetic performance, and essential oil yield under the same total nitrogen input. Phosphorus and potassium fertilizers were applied at 180 kg·ha−1 for all treatments after clear-cutting. Irrigation, intertillage, weeding, and other field management practices were carried out in accordance with local agricultural practices.
Table 2.
Nitrogen application regimes and fertilization schedules under different nitrogen treatments.
From June to December 2024, morphological growth traits, photosynthetic parameters, and essential oil yield of C. camphora var. linalooliferum were systematically monitored every two months (in June, August, October, and December). Each treatment was replicated three times, and growth traits, photosynthetic traits, and essential oil yield accumulation in C. camphora var. linalooliferum coppice stands were investigated.
2.3. Measurement Indicators and Methods
2.3.1. Measurement of Morphological Growth Indicators
The plant height (PH) was determined by measuring the straight-line distance from the soil mark to the base of the apical bud of the selected plant. The basal diameter (BD) was determined by measuring the average value of two perpendicular directions at the soil mark. The canopy leaf area index (LAI) was measured using a Yaxin-1241 leaf area meter, and the single-plant leaf area was calculated based on the ratio of leaf area to biomass. The LAI was calculated as the ratio of single-plant leaf area to the land area occupied by a single plant (LAI = single-plant leaf area/land area occupied by a single plant).
The aboveground part of C. camphora var. linalooliferum was selected by cutting at a height of 20 cm above the ground, and the plant was divided into leaf and branch parts. The leaves and branches were heated at 105 °C for 30 min to inactivate enzymes and then dried at 80 °C until constant weight. The leaf biomass (Lb), branch biomass (Bb), and total aboveground biomass (Tb) were measured in unit of grams per plant (g·plant−1).
2.3.2. Measurement of Chlorophyll Value and Photosynthetic Characteristics
A handheld SPAD-502 chlorophyll meter (Konica Minolta, Tokyo, Japan) was used to measure the relative chlorophyll values (SPAD) of 30 mature leaves selected from different canopy positions and directions. On clear days between 9:00 and 11:00 AM, net photosynthetic rate (Pn, μmol CO2·m−2·s−1), stomatal conductance (Gs, mmol H2O·m−2·s−1), intercellular carbon dioxide concentration (Ci, μmol CO2·mol−1), and transpiration rate (Tr, mmol H2O·m−2·s−1) were measured using a LI-6400 portable photosynthesis system (LI-COR Biosciences, Lincoln, NE, USA) on leaves from the upper, middle, and lower canopy, all in the same direction. Measurements were conducted under artificial light with a photon flux density of 1000 μmol·m−2·s−1.
2.3.3. Measurement of Essential Oil Yield
Approximately 300 g of fresh leaves and 200 g of fresh branches were weighed separately and subjected to steam distillation for 1 h using a portable Cinnamomum camphora essential oil distiller. A subsample of each fresh sample was oven-dried to constant weight to determine the moisture fraction, which was used to convert essential oil content to a dry weight basis.
Essential oil content was expressed as leaf essential oil content (LEOc) and branch essential oil content (BEOc), calculated as follows:
In Equations (3) and (4), where ML and MB represented the moisture fractions of leaves and branches (g·g−1), respectively. Leaf essential oil content (LEOc) and branch essential oil content (BEOc) were expressed as percentages (%) on a dry weight basis.
Leaf and branch essential oil yields per-plant were calculated as:
LEOyp = Lb × LEOc
BEOyp = Bb × BEOc
Total aboveground essential oil yield per plant (TEOyp) was calculated as:
TEOyp = LEOyp + BEOyp
In Equations (5)–(7), leaf biomass per plant (Lb) and branch biomass per plant (Bb) denoted oven-dried biomass and were expressed in grams per plant (g·plant−1). Accordingly, leaf essential oil yield per plant (LEOyp), branch essential oil yield per plant (BEOyp), and total aboveground essential oil yield per plant (TEOyp) were expressed in g·plant−1.
2.4. Data Processing and Analysis
Data processing was performed using Microsoft Excel 2016. Statistical analysis was conducted using SPSS 26.0 software, with one-way analysis of variance (ANOVA), Duncan’s multiple range test, principal component analysis (PCA), and Pearson correlation analysis. Data visualization was carried out using Origin 2021 and R 4.3.1.
3. Results
3.1. Effect of Nitrogen Application Timing on the Growth of C. camphora var. linalooliferum Coppice Stands
3.1.1. Response of Growth Parameters of C. camphora var. linalooliferum Coppice Stands to Nitrogen Application Timing
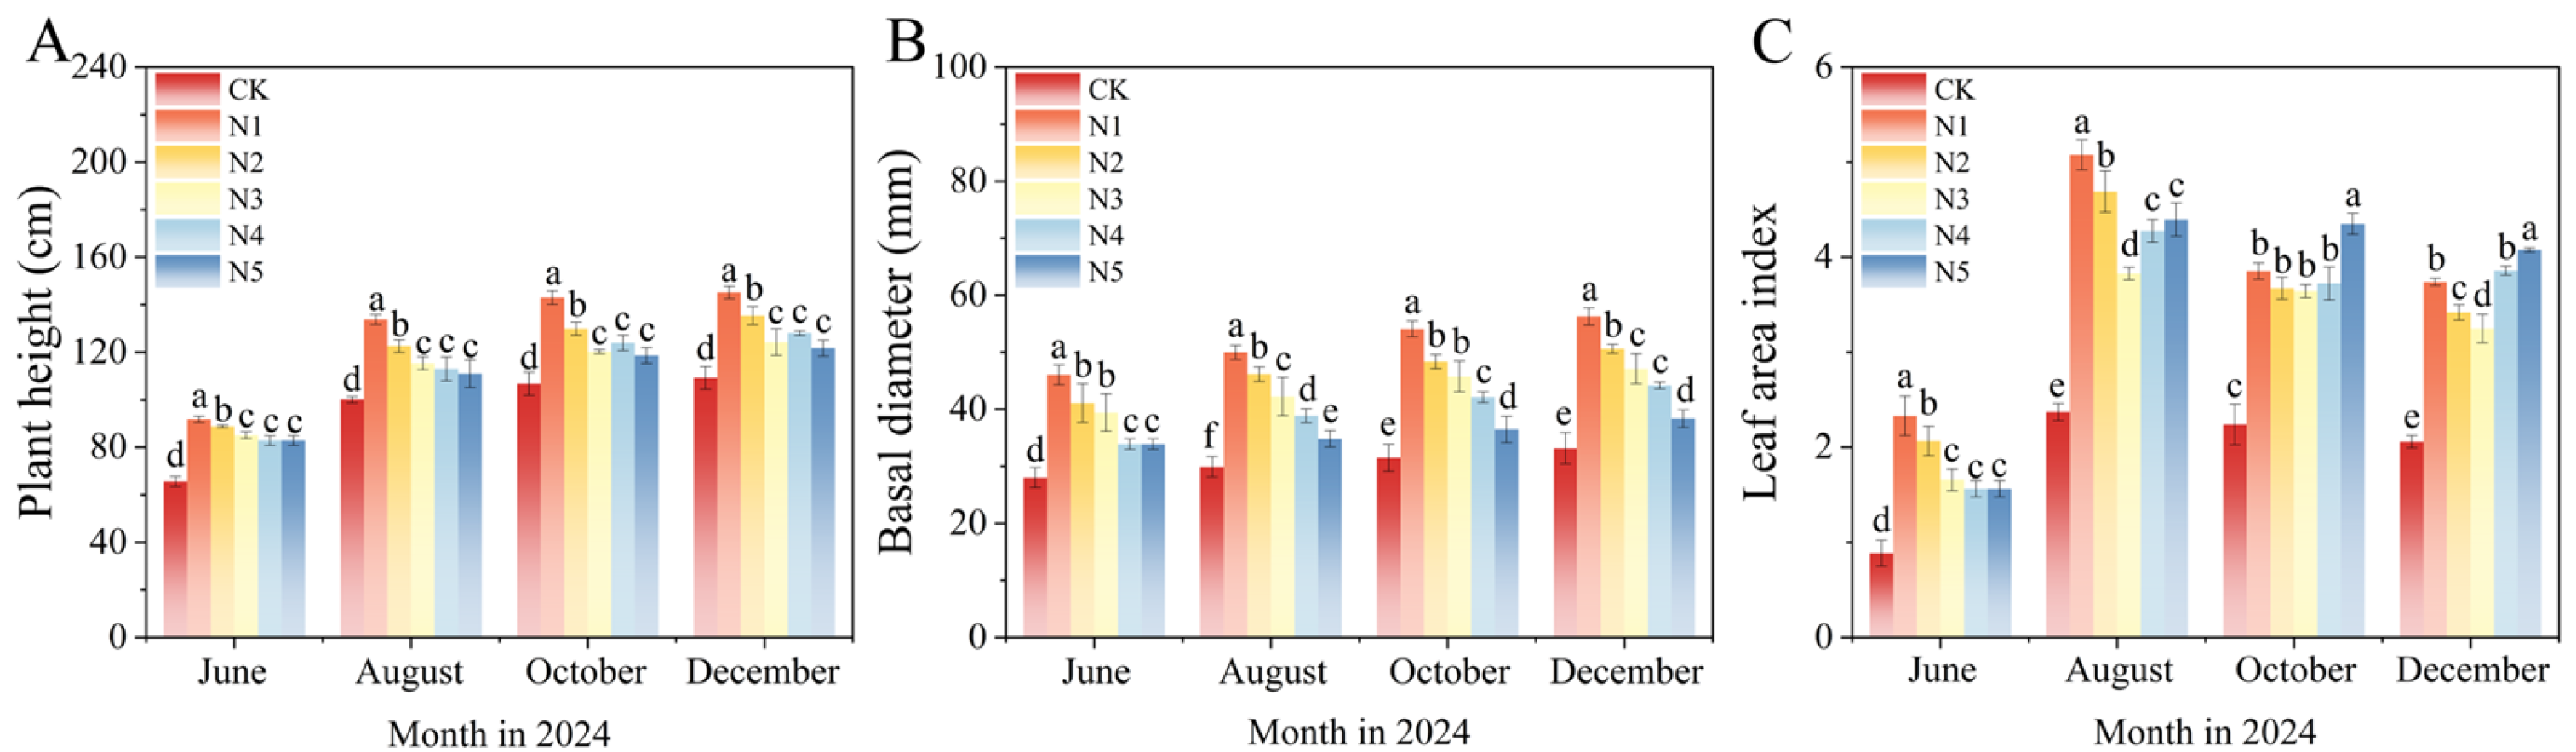
As shown in Figure 1, different nitrogen application timings significantly affected the growth parameters of Cinnamomum camphora var. linalooliferum coppice stands (p < 0.05). PH, BD, and LAI all increased gradually during the growth process, stabilizing between October and December. The differences between treatments exhibited distinct stage characteristics.
Figure 1.
Effect of nitrogen application timing on PH (A), BD (B), and LAI (C) of C. camphora var. linalooliferum. Different lowercase letters above the bars indicate significant differences among nitrogen treatments at the same sampling time based on one-way ANOVA followed by Duncan’s multiple range test (p < 0.05).
Each nitrogen treatment significantly promoted PH growth in different growth months (p < 0.05) (Figure 1A). Compared with CK, the PH under N1 and N2 treatments increased by 39.94% and 35.42%, respectively, in June. The impact of each nitrogen treatment on PH showed an increasing trend with the amount of basal fertilizer applied, with N1 performing best, significantly higher than the other treatments (p < 0.05), reflecting the sustained promoting effect of early nitrogen application on vertical growth. In June, N1 increased PH by 3.34%, 7.88%, 10.79%, and 10.79% compared to N2–N5 treatments, respectively.
The trend of BD changes was similar to that of PH. BD in all nitrogen treatments increased over time (Figure 1B). Compared with CK, each nitrogen treatment significantly promoted BD growth (p < 0.05). In June, N1, N2, and N3 treatments increased BD by 64.37%, 46.66%, and 40.66%, respectively, compared to CK. As the plants grew, the gap between nitrogen treatments and CK gradually widened. The impact of different nitrogen treatments on BD increased with the amount of basal fertilizer applied, with N1 consistently showing the highest increase, reflecting the sustained promoting effect of early concentrated nitrogen application on stem diameter growth. In June, N1 was significantly higher than N2–N5, with increases of 12.07%, 16.85%, 35.85%, and 35.85% (p < 0.05). In August, the differences between nitrogen treatments were most significant, with N1 showing an increase of 8.26–43.45% compared to N2–N5.
Each nitrogen treatment significantly increased LAI in different growth months (p < 0.05), with the dominant treatment changing over the growth stages, reflecting the effective regulation of canopy expansion by nitrogen application (Figure 1C). Compared with CK, N1 had the highest LAI in June and August, increasing by 162.84% and 114.16%, respectively. In October and December, N5 had the highest LAI, increasing by 94.14% and 97.99%, respectively, compared to CK, indicating the advantage of late-stage nitrogen application in maintaining leaf function. The impact of different nitrogen treatments on LAI showed a regular pattern with changes in nitrogen application timing, increasing with basal nitrogen amount in the early growth stage, and increasing with the amount and frequency of topdressing in the later stages. In August, LAI was highest overall, with N1 significantly higher than N2–N5, increasing by 8.25%, 32.62%, 18.71%, and 15.47% (p < 0.05). From October to December, N5 was significantly higher than N1–N4, with N5 in December significantly increasing by 5.63–25.45% compared to N1–N4, indicating that the regulatory effect of nitrogen application on LAI gradually shifted from early-stage dominance to mid- and late-stage dominance as the plants matured.
3.1.2. Response of Biomass Accumulation in C. camphora var. linalooliferum Coppice Stands to Nitrogen Application Timing
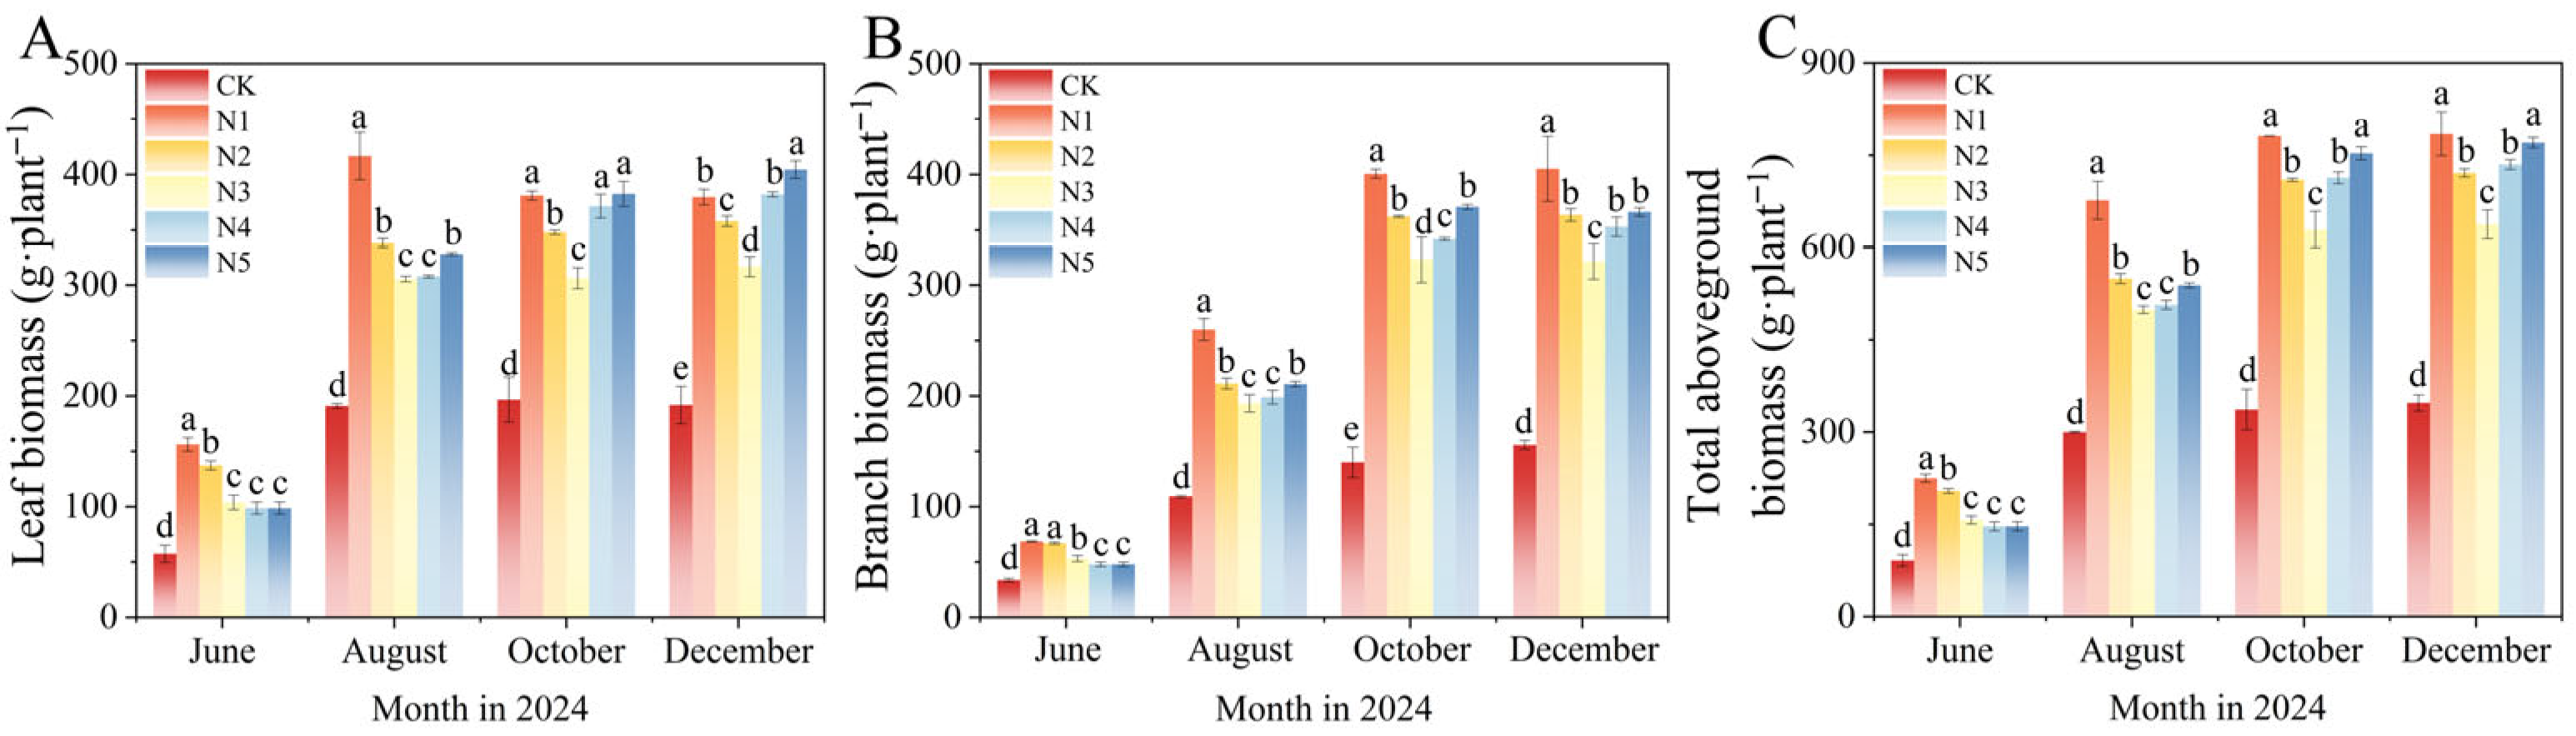
Overall, the changes in Lb, Bb, and Tb showed a pattern of initial increase followed by stabilization throughout the growing season (Figure 2). Compared with CK, different nitrogen treatments significantly promoted the accumulation of Lb, Bb, and Tb (p < 0.05). The change trends of Lb and Tb were consistent, while Bb followed a similar pattern to the former two until October, after which it showed different trends in October and December.
Figure 2.
Effect of nitrogen application timing on leaf (A), branch (B), and total aboveground biomass (C) of C. camphora var. linalooliferum. Different lowercase letters above the bars indicate significant differences among nitrogen treatments at the same sampling time based on one-way ANOVA followed by Duncan’s multiple range test (p < 0.05).
In June, compared to CK, Lb significantly increased in N1, N2, and N3 treatments by 172.04%, 138.94%, and 80.73%, respectively, while no significant difference was observed between N3 and N4. By December, Lb in all nitrogen treatments (N1–N5) was significantly higher than CK, with increases ranging from 65.14% to 111.01%, and Bb also showed significant increases of 106.50% to 160.27% compared to CK.
The regulation of biomass accumulation by nitrogen treatments showed stage-specific characteristics, with an increase in the early growth stage following the amount of basal nitrogen applied, and an increase in the late growth stage with the amount and frequency of topdressing. In June, N1 showed significantly higher Lb than N2 and N3, increasing by 13.86% and 50.53%, respectively (p < 0.05), with no significant differences among N3, N4, and N5. From August onwards, the compensatory effect of mid-stage multiple topdressings on biomass accumulation gradually became evident. In August, compared to N1, Lb in N4 and N5 showed a decrease by 26.14% and 21.30%, respectively, and no significant differences were observed among the three treatments in October. By December, compared to N1, Lb in N4 and N5 showed a slight increase by 0.64% and 6.55%, respectively, with significant differences between N1 and N5, as well as between N4 and N5 (p < 0.05).
The rational arrangement of nitrogen application timing can exert differential effects at different growth stages, thereby achieving long-term regulation of biomass accumulation.
3.2. Response of Photosynthetic Characteristics in C. camphora var. linalooliferum Coppice Stands to Nitrogen Application Timing
3.2.1. Response of SPAD Value in C. camphora var. linalooliferum Coppice Stands to Nitrogen Application Timing
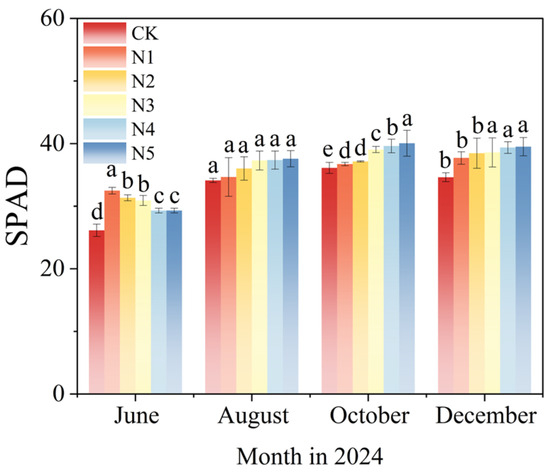
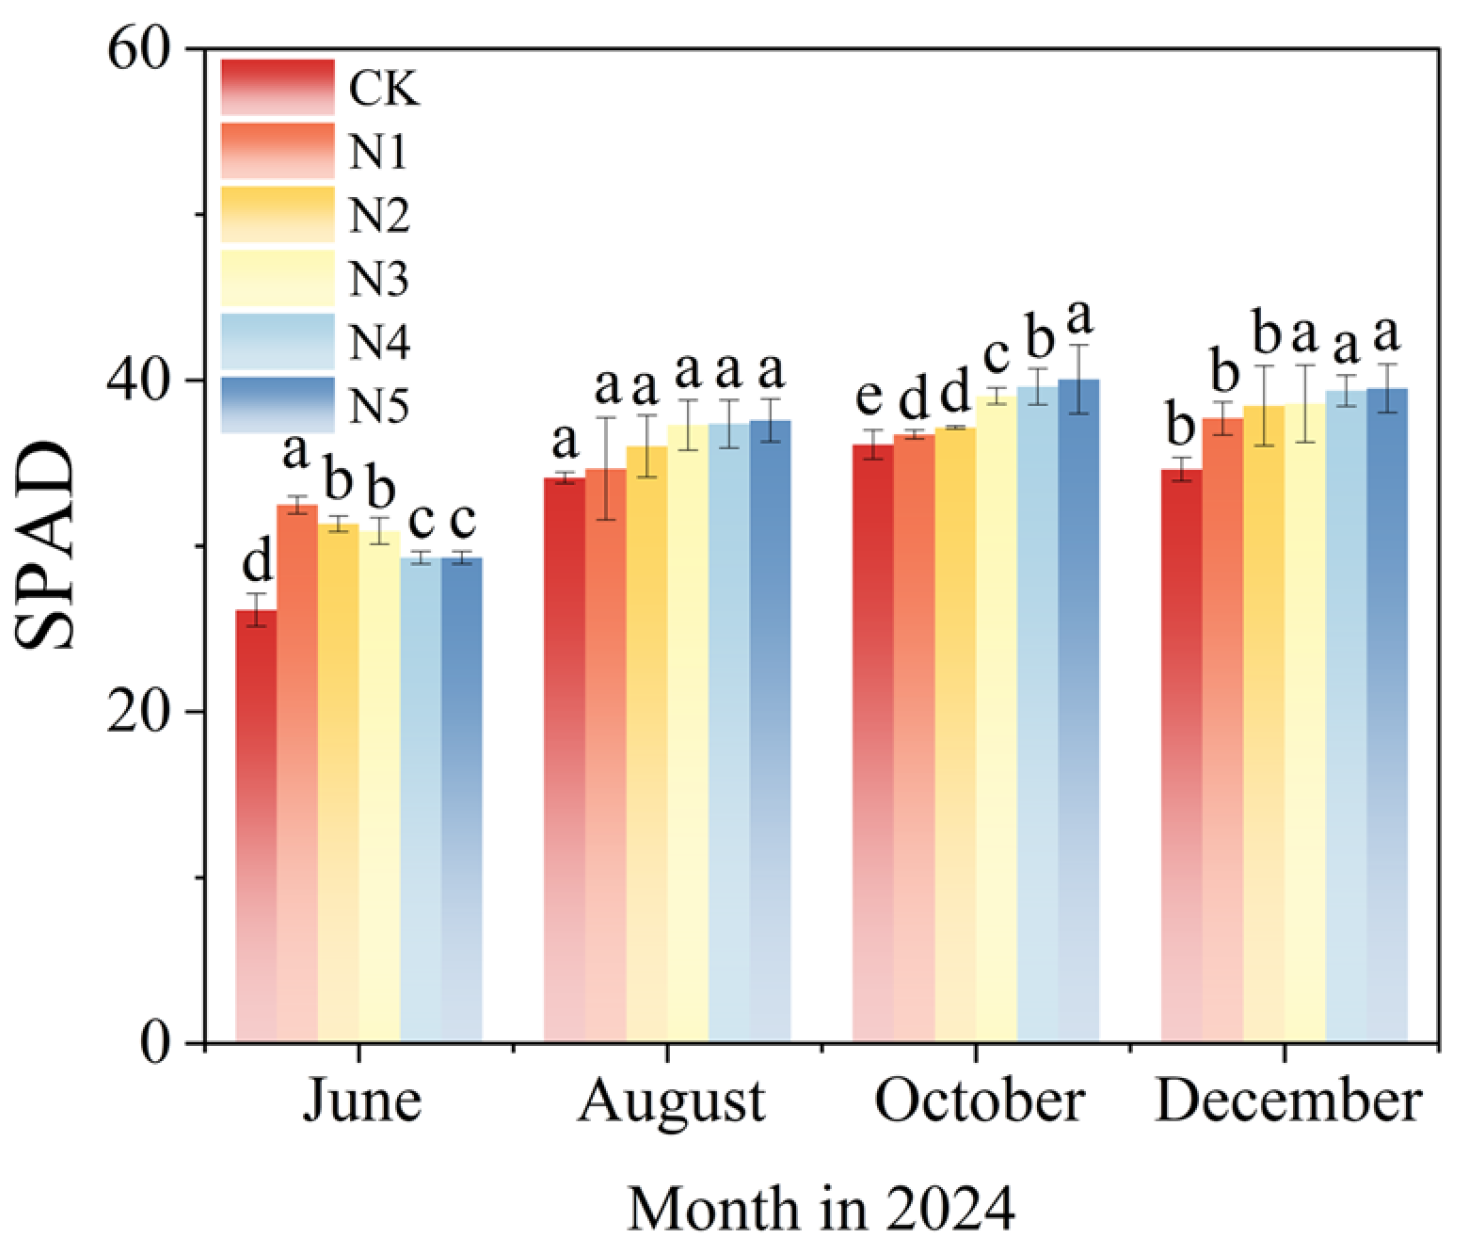
Throughout the growing season, the SPAD values of all nitrogen treatments showed an increasing trend with time, but slightly decreased in December (Figure 3). Compared with CK, the leaf SPAD value of C. camphora var. linalooliferum was significantly increased under nitrogen treatments in different growth months (p < 0.05). In June, the SPAD values of all nitrogen treatments were significantly higher than CK, with an average increase of 17.26%, and N1 showed the highest increase, improving by 24.20% compared to CK. October was the peak month for SPAD values, with nitrogen treatments N3, N4, and N5 increasing by 8.08%, 9.63%, and 10.85%, respectively, compared to CK (p < 0.05).
Figure 3.
Dynamic changes in leaf SPAD values of C. camphora var. linalooliferum coppice stands under different nitrogen application timings. Different lowercase letters above the bars indicate significant differences among nitrogen treatments at the same sampling time based on one-way ANOVA followed by Duncan’s multiple range test (p < 0.05).
The promoting effect of different nitrogen treatments on SPAD values showed distinct stages. In the early growth stage, the SPAD values of all treatments increased with the amount of basal nitrogen applied. In June, leaf SPAD value in N1 was the highest, with significant increases of 3.67%, 5.14%, 10.83%, and 10.83%, respectively, compared to N2–N5. No significant difference was observed between N2 and N3, but both were significantly higher than N4 and N5. After the mid-season topdressing in June, the differences in SPAD values among treatments were not significant by August, indicating that the mid-term topdressing compensated for the early nitrogen differences. From October to December, the SPAD values of all treatments increased with the increasing amount of late-season nitrogen application. The SPAD values in N3–N5 treatments were significantly higher than N1 and N2, showing the advantage of late nitrogen application in delaying leaf senescence and maintaining chlorophyll levels. Among these treatments, N5 had the highest SPAD values from August to December, particularly in October, where it was significantly higher than the other treatments, increasing by 9.05%, 7.83%, 2.56%, and 1.11% compared to N1–N4, respectively. Differences between N3–N5 treatments were significant in October, but were not significant in December.
3.2.2. Response of Photosynthetic Parameters in C. camphora var. linalooliferum Coppice Stands to Nitrogen Application Timing
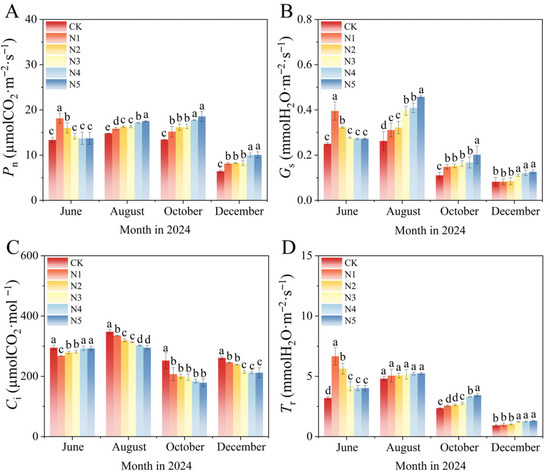
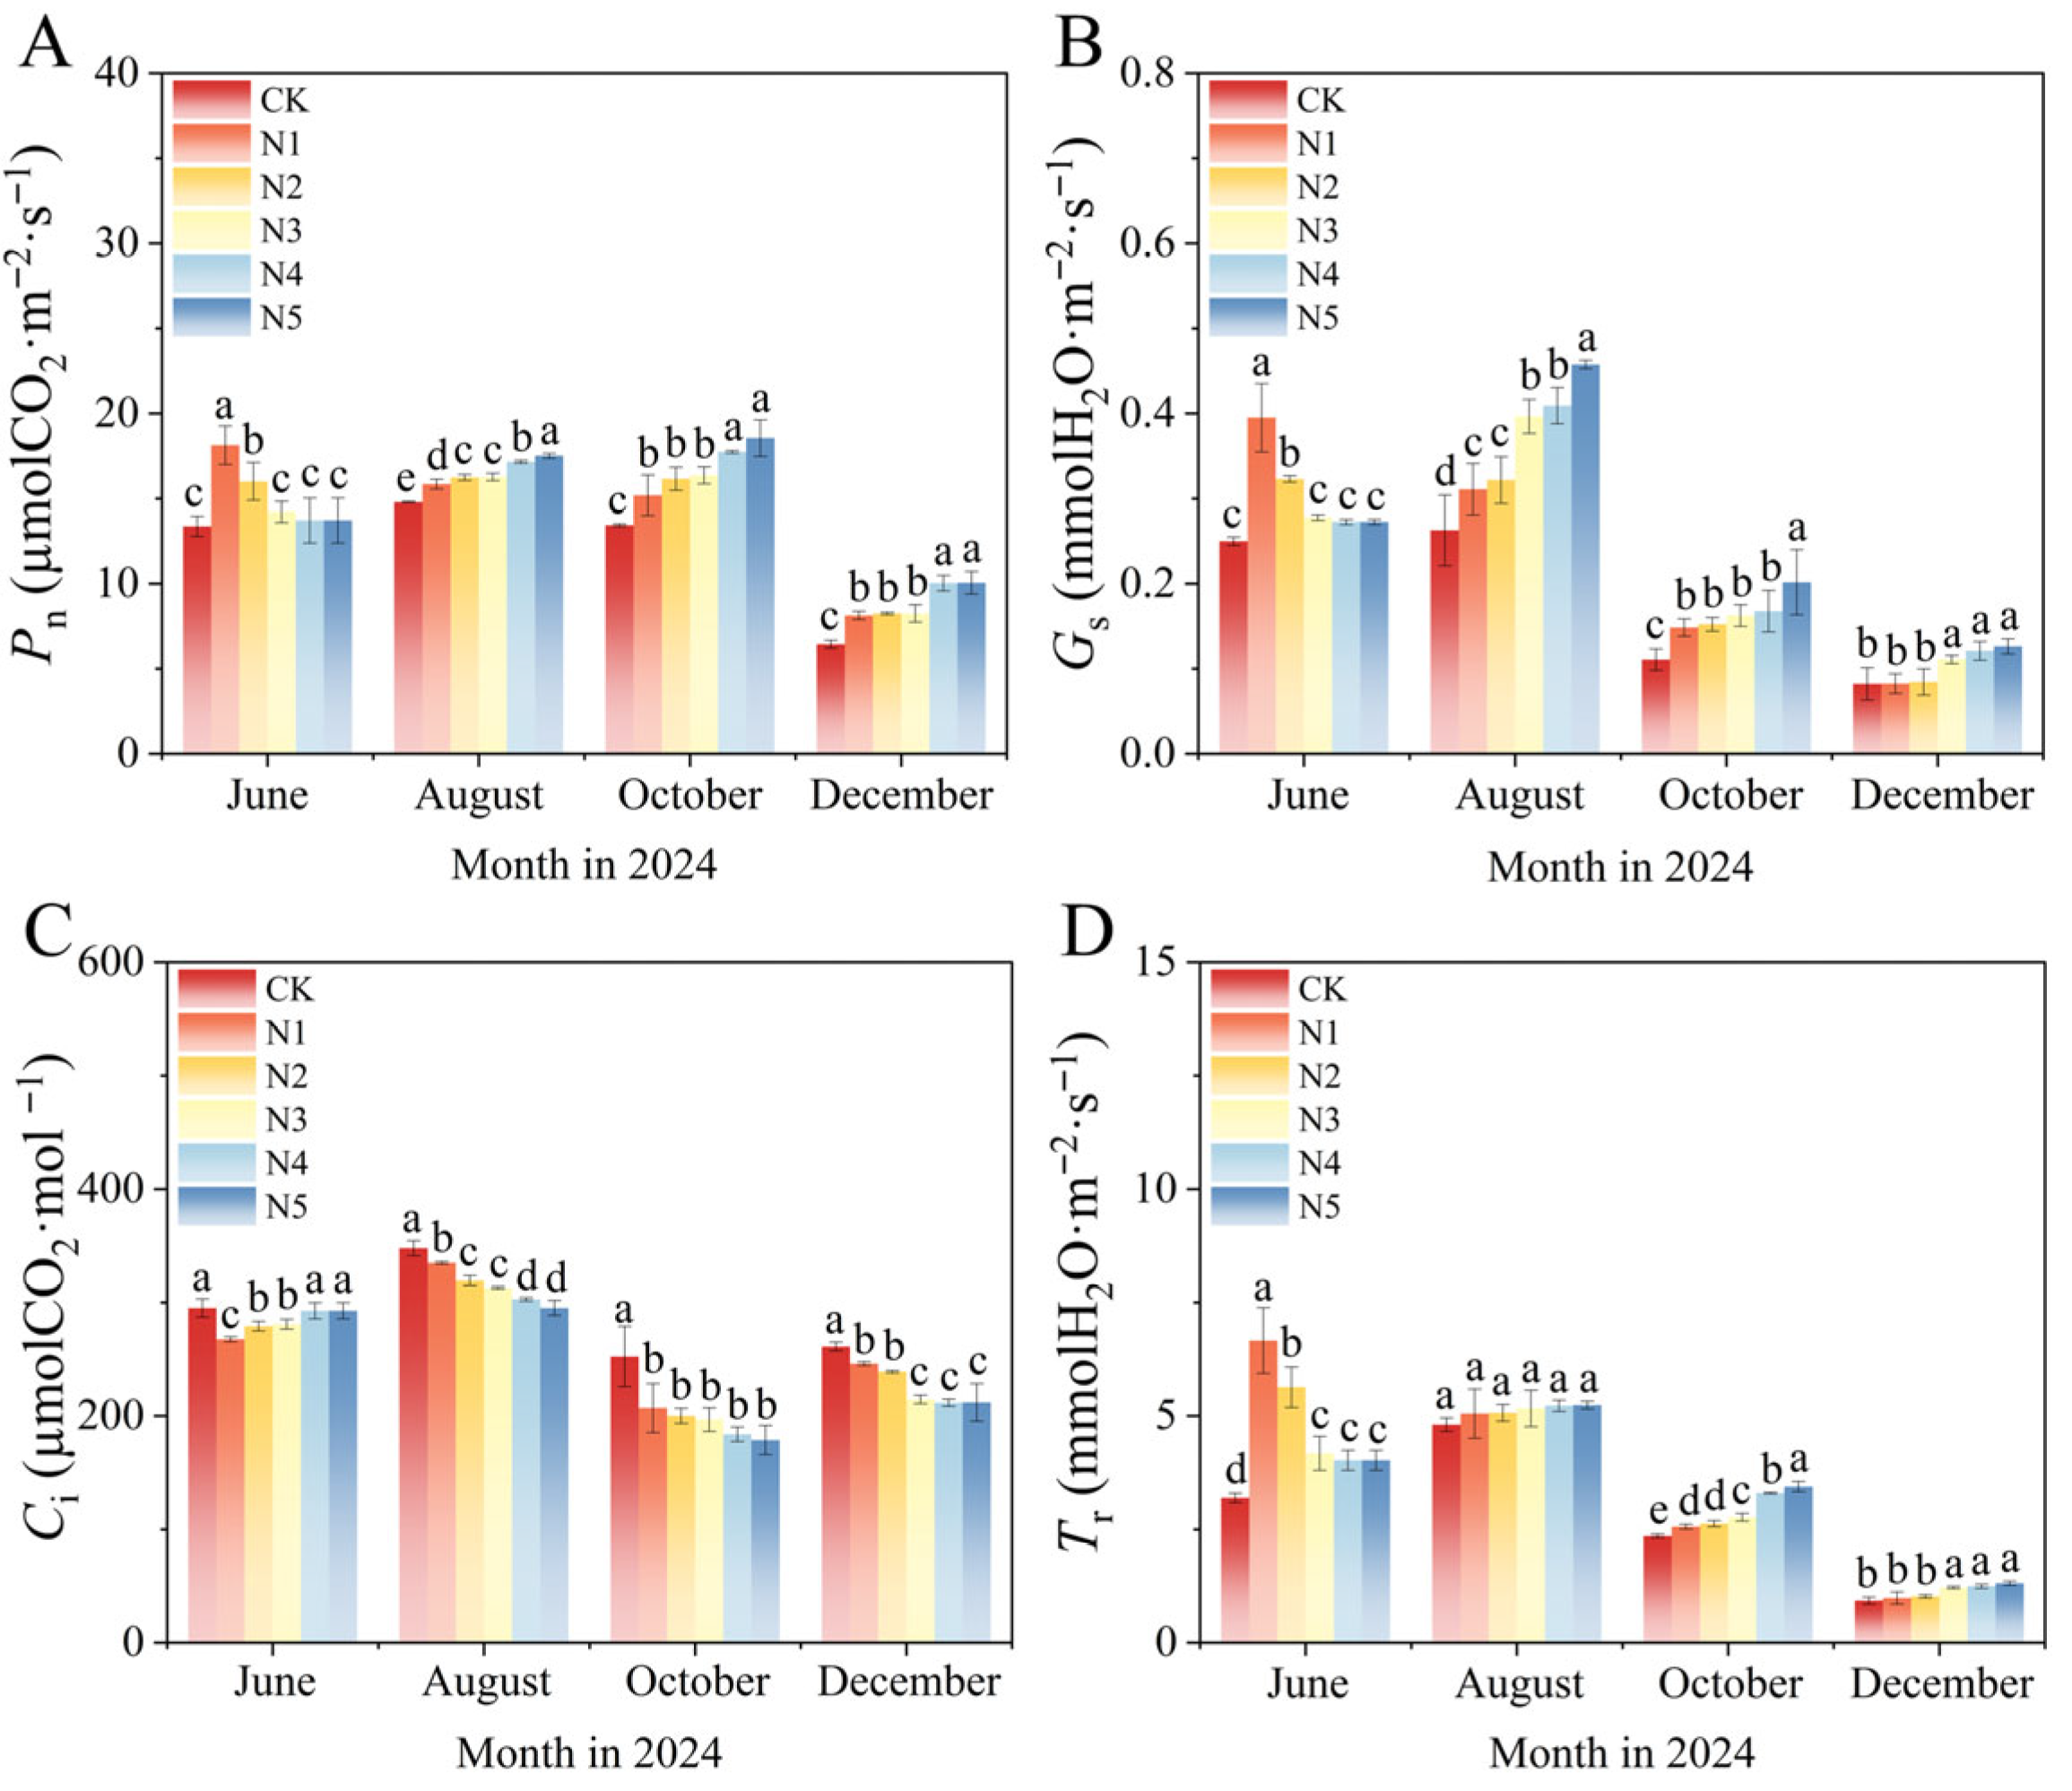
The photosynthetic parameters of all nitrogen treatments showed an overall trend of increase followed by decrease during the growing season (Figure 4), with the lowest values observed in December. Nitrogen application significantly affected the leaf photosynthetic characteristics of C. camphora var. linalooliferum (p < 0.05), primarily reflected in the dynamic changes of key parameters such as Pn, Gs, Ci, and Tr.
Figure 4.
Photosynthesis (A), stomatal conductance (B), intercellular CO2 concentration (C), and transpiration (D) of C. camphora var. linalooliferum coppice stands grown under different nitrogen application timings. Different lowercase letters above the bars indicate significant differences among nitrogen treatments at the same sampling time based on one-way ANOVA followed by Duncan’s multiple range test (p < 0.05).
Compared with CK, nitrogen application significantly enhanced leaf photosynthetic efficiency, gas exchange capacity, and transpiration rate of C. camphora var. linalooliferum, and the response patterns exhibited distinct stages throughout the growing season. In June, Pn in N1 and N2 was significantly increased by 35.76% and 19.83%, respectively, compared to CK, with no significant differences between N3, N4, and N5. Gs and Tr exhibited similar patterns, with N1 showing the highest values, significantly higher than other treatments, where Gs and Tr in N1 treatment increased by 58.20% and 108.65%, respectively, compared to CK. From August onwards, the advantage of N4 and N5 in photosynthetic efficiency gradually became more pronounced. In October, Pn peaked at 17.74 μmol CO2·m−2·s−1 and 18.55 μmol CO2·m−2·s−1 for N4 and N5, respectively, increasing by 32.08% and 38.11% compared to CK, demonstrating that timely nitrogen application can delay leaf senescence and maintain higher photosynthetic capacity. N5 showed the maximum stomatal function in August, with Gs increasing by 74.20% compared to CK. From October to December, N5 maintained a relative advantage in Tr, with increases of 46.18% and 41.35% compared to CK in October and December, respectively, showing the continuous promotion of leaf transpiration by late-stage nitrogen application. However, nitrogen application had the opposite effect on Ci, with all nitrogen treatments showing significantly lower values than CK at each growth stage (p < 0.05). In June, Ci in N1treatment was the lowest, with 10.29% lower than CK. In October, the average Ci of all nitrogen treatments was 193.28 μmol CO2·mol−1, 21.95–41.18% lower than CK, indicating that nitrogen-treated plants had higher CO2 fixation efficiency. In December, Ci remained significantly lower than CK, with N1–N5 treatments showing a decrease of 6.16–23.42% compared to CK.
The trends of Pn, Gs, and Tr were consistent across treatments, showing an increase in the early growth stage with the amount of basal nitrogen applied, and further increases in the late growth stage with topdressing amount and frequency. The trend for Ci was the opposite. In June, Pn, Gs, and Tr in N1 were significantly higher compared to N2–N5, with N1 showing an increase in Pn by 22.32–45.05% compared to other treatments. By October, Pn, Gs, and Tr in N5 were the highest, significantly higher than N1–N4, with N5 showing increases in Tr ranging from 4.31% to 34.43% compared to N1–N4, demonstrating that rational regulation of nitrogen application timing could lead to differentiated adjustment of photosynthetic potential.
3.3. Response of Essential Oil Yield in C. camphora var. linalooliferum Coppice Stands to Nitrogen Application Timing
3.3.1. Response of Leaf and Branch Essential Oil Contents in C. camphora var. linalooliferum Coppice Stands to Nitrogen Application Timing
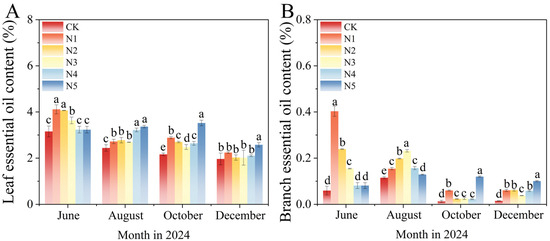
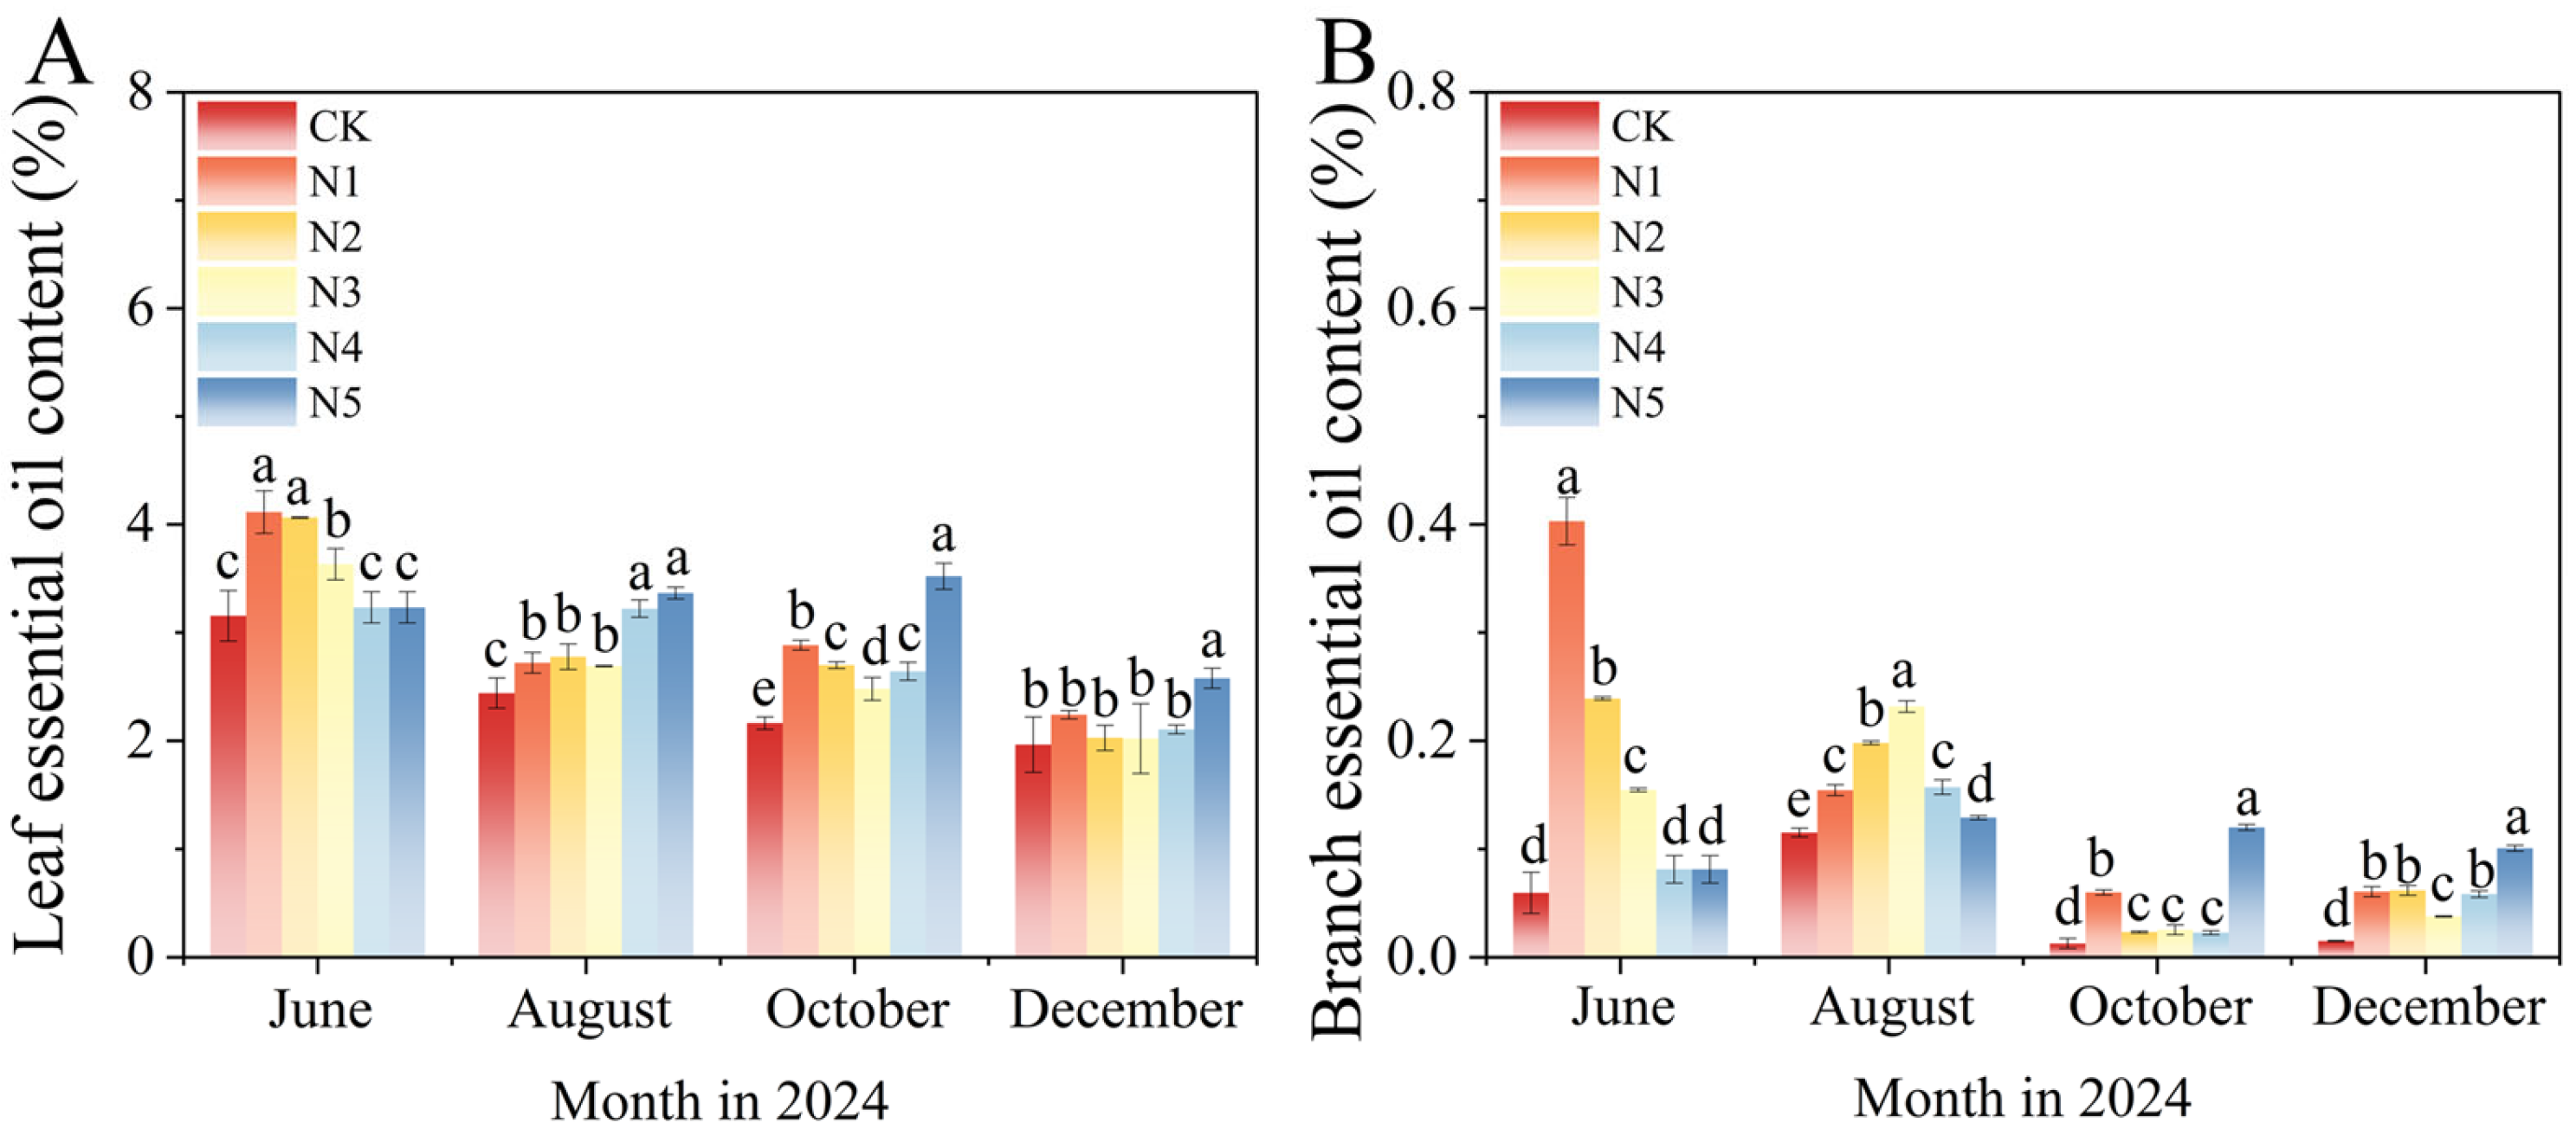
Different nitrogen application timings significantly regulated both LEOc and BEOc (p < 0.05), with clear temporal dynamic changes observed at different growth stages (Figure 5).
Figure 5.
Dynamic changes in essential oil content in leaves (A) and branches (B) of C. camphora var. linalooliferum coppice stands under different nitrogen application timings. Different lowercase letters above the bars indicate significant differences among nitrogen treatments at the same sampling time based on one-way ANOVA followed by Duncan’s multiple range test (p < 0.05).
The LEOc of all nitrogen treatments showed an overall slow decline throughout the growing season (Figure 5A). Compared to CK, nitrogen application effectively promoted the synthesis of leaf essential oil content at all growth stages. In June, the LEOc of N1 reached its highest value of 4.11%, an increase of 30.42% compared to CK. N2 and N3 were also significantly higher than CK, while the differences among N4, N5 and CK were not significant. Under the N5 treatment, LEOc was higher than CK in August, October, and December by 37.90%, 62.70%, and 31.19%, respectively, showing that late-stage nitrogen application promoted leaf essential oil synthesis. The differences in LEOc among different nitrogen treatments followed a staged pattern, increasing in the early stages with higher basal nitrogen application and later increasing with higher topdressing amount and frequency. In June, N1 showed the highest LEOc among all treatments, with significant differences from N3, N4, and N5 (p < 0.05). In August, N5 showed the highest LEOc, significantly higher than N1, N2, and N3 (p < 0.05). From October to December, N5 was significantly higher than N1–N4, with the largest difference in October, where N5 increased by 22.12%, 30.39%, 41.95%, and 33.22%, respectively, compared to N1–N4. This indicated that late-stage nitrogen application helped maintain stable leaf essential oil accumulation.
The BEOc followed an increase-then-decrease pattern (Figure 5B). Compared to CK, BEOc in all nitrogen treatments was significantly higher (p < 0.05). In June, N1 reached a peak of 0.40%, an increase of 577.07% compared to CK, showing that early nitrogen supply quickly activated branch essential oil synthesis. From October to December, BEOc declined overall, but in N5 treated plants, BEOc increased by 838.78% and 574.65% in October and December, respectively, showing that late-stage nitrogen application could maintain a certain level of branch essential oil synthesis. The differences among the nitrogen treatments showed a staged pattern similar to that of leaf essential oil content. In June, N1 was significantly higher than N2–N5, with increases ranging from 68.60% to 396.23%. In October, N5 was significantly higher than N1–N4, with increases ranging from 100.32% to 431.92%. This reflected the dynamic pattern of branch essential oil synthesis, where early nitrogen application (N1) dominated in the early growth stage, and N5 maintained the peak in the late growth stage, with early nitrogen supply having the most significant activating effect on essential oil synthesis.
3.3.2. Response of Leaf, Branch, and Total Essential Oil Yields per Plant in C. camphora var. linalooliferum Coppice Stands to Nitrogen Application Timing
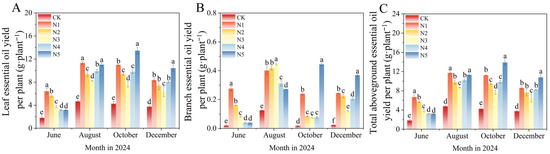
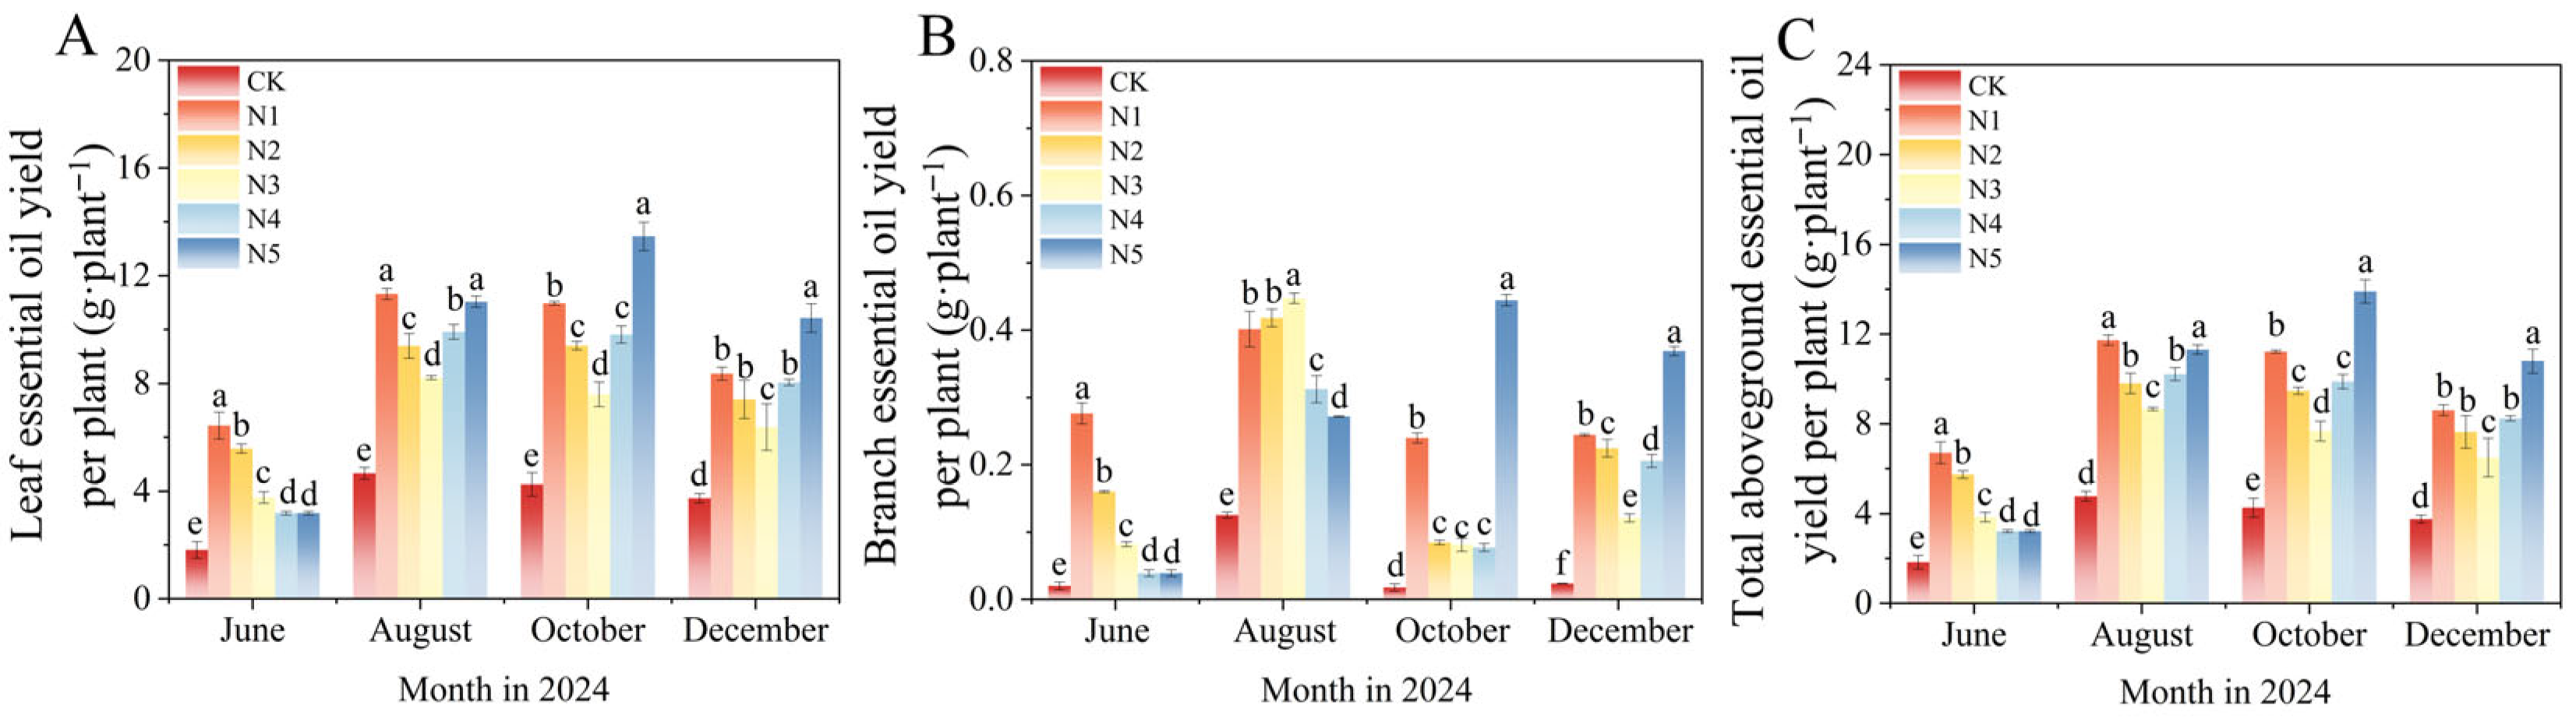
Nitrogen application timing significantly affected LEOyp, BEOyp, and TEOyp (p < 0.05). Overall, all nitrogen treatments resulted in higher LEOyp throughout the growth stages compared to CK, indicating that nitrogen application continuously promoted leaf essential oil accumulation. Although BEOyp was generally lower than LEOyp, it was also regulated by the timing of nitrogen application (Figure 6).
Figure 6.
Dynamic changes in leaf essential oil yield (A), branch essential oil yield (B), and total aboveground essential oil yield (C) per plant of C. camphora var. linalooliferum coppice stands under different nitrogen application timings. Different lowercase letters above the bars indicated significant differences among nitrogen treatments at the same sampling time based on one-way ANOVA followed by Duncan’s multiple range test (p < 0.05).
The LEOyp of all nitrogen treatments showed an overall trend of first increasing and then decreasing throughout the growing season (Figure 6A). Compared to CK, the LEOyp in all stages of nitrogen treatments was significantly higher (p < 0.05), showing the clear regulatory effect of nitrogen application on leaf essential oil yield. Under the N1 treatment, LEOyp was increased by 254.64% and 143.19% compared to CK in June and August, respectively, indicating that early nitrogen application could significantly promote leaf essential oil accumulation. Under the N5 treatment, LEOyp increased by 216.68% and 178.96% compared to CK in October and December, respectively, showing that late nitrogen application could effectively extend the period of leaf essential oil yield. The effects of different nitrogen treatments followed a staged pattern. In June, N1 was significantly higher than N2–N5. From October to December, N5 was significantly higher than N1–N4, with N5 increasing by 22.62–77.21% compared to N1–N4 in October. This reflected the combined effect of early nitrogen application on initiating oil accumulation and late nitrogen application on extending the oil production period.
The BEOyp showed a short-term peak in response to nitrogen treatments (Figure 6B). Compared to CK, BEOyp was significantly higher in all stages under nitrogen treatments (p < 0.05). In August, the average increase in BEOyp for all nitrogen treatments compared to CK was 195.18%. Under the N5 treatment, BEOyp increased by 2430.71% and 1487.69% compared to CK in October and December, respectively. The effects of different nitrogen treatments followed a staged pattern. In June, N1 was significantly higher than N2–N5, with increases of 72.40%, 236.78%, 611.48%, and 611.48%, respectively. From October to December, N5 significantly outperformed other nitrogen treatments, with N5 increasing by 85.39–476.79% compared to N1–N4 in October. Overall, the response of branch essential oil accumulation to nitrogen supply was primarily concentrated in the early to mid-growth stages.
Leaves were the main oil-producing organs, accounting for more than 90% of TEOyp, and the temporal dynamic changes in TEOyp were consistent with the leaf essential oil yield (Figure 6C). These changes were also regulated by nitrogen application timing. The performance of different nitrogen treatments at various stages reflected the promoting effect of nitrogen on plant essential oil yield and clear timing effects. Compared to CK, TEOyp was significantly higher under all nitrogen treatments (p < 0.05). Under the N1 treatment, TEOyp increased by 265.86% and 145.21% compared to CK in June and August, respectively. The differences in TEOyp between nitrogen treatments were significant across growth stages. From October to December, N5 was significantly higher than N1–N4, with N5 increasing by 23.96%, 46.67%, 81.13%, and 40.61%, respectively, compared to N1–N4 in October, indicating that late nitrogen application could effectively increase production.
3.4. Comprehensive Impact of Different Nitrogen Application Times on Multiple Indicators in C. camphora var. linalooliferum Coppice Stands
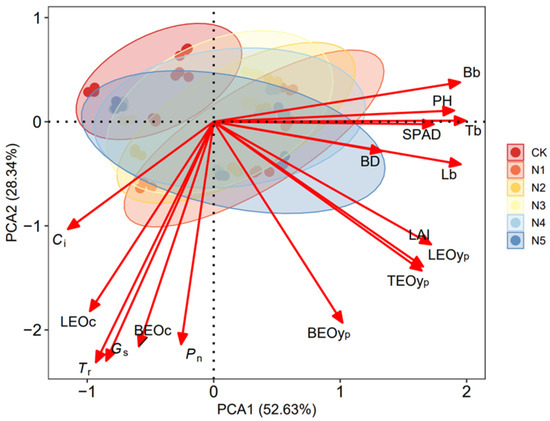
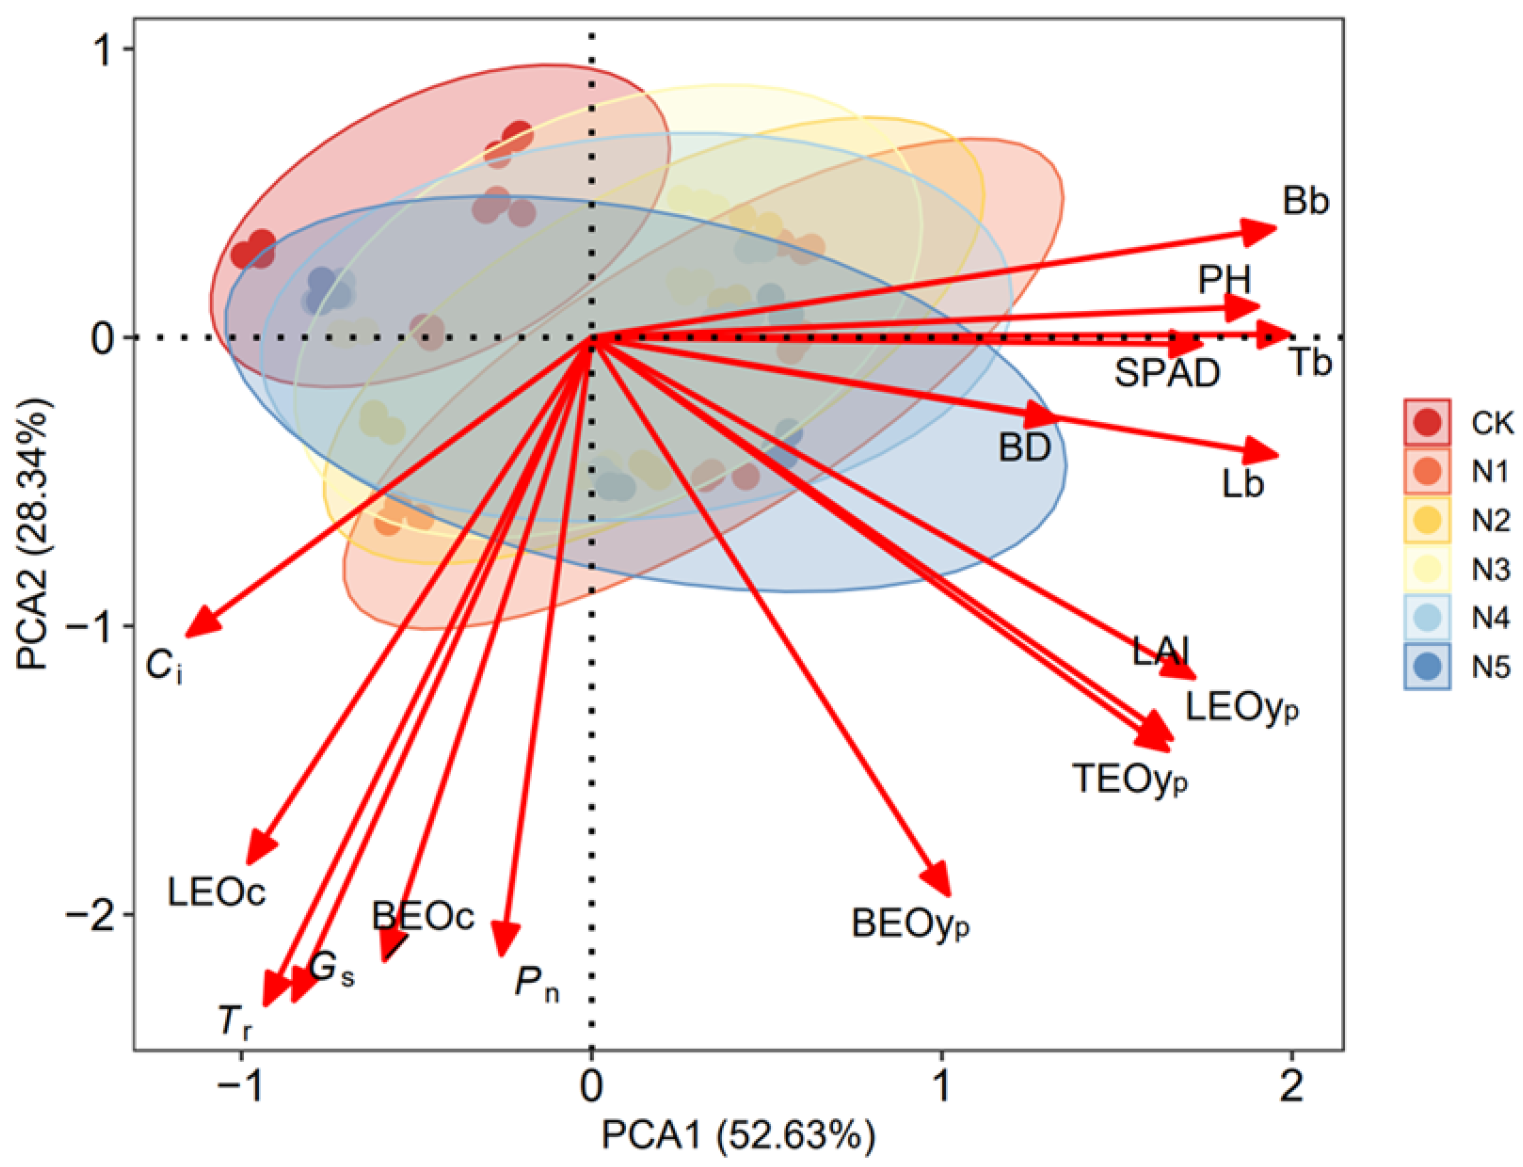
To systematically analyze the comprehensive effects of different nitrogen application times on the growth traits, photosynthetic characteristics, and essential oil yield of C. camphora var. linalooliferum coppice stands, 16 key indicators (PH, BD, LAI, SPAD, Pn, Gs, Ci, Tr, Lb, Bb, Tb, LEOc, BEOc, LEOyp, BEOyp, TEOyp) were selected for PCA (Figure 7). The results showed that the first two principal components, PC1 and PC2, explained 52.63% and 28.34% of the total variation, respectively, with a cumulative contribution rate of 80.97%. This indicated that the PCA model effectively captured the changes in the main traits under nitrogen treatment and their inherent structural relationships.
Figure 7.
PCA of main indices of C. camphora var. linalooliferum coppice stands under different nitrogen application timings. PCA was performed using the R statistical environment to explore the multivariate relationships among photosynthetic traits, growth characteristics, and essential oil yield.
As shown in the figure, the samples of different nitrogen treatments exhibited distinct distribution differences and clustering characteristics (Figure 7). The N5 treatment was mainly concentrated in the positive direction of PC1, significantly aligned with the vectors representing essential oil yield indicators (LEOyp, BEOyp, TEOyp) and growth traits (PH, BD, LAI, SPAD), indicating that late nitrogen application significantly promoted the enhancement of photosynthetic capacity and oil-producing ability in plants, showing a strong overall physiological advantage. The N5 treatment was closest to the essential oil yield-related indicator vectors, reflecting its higher resource conversion efficiency and essential oil synthesis potential under late-stage nitrogen application. In contrast, the N1 treatment samples were distributed towards the left side of the figure, close to the direction of photosynthetic parameters and essential oil content indicators. This showed its potential for photosynthetic capacity and oil synthesis, but it was negatively correlated with oil yield, indicating that under insufficient nitrogen supply or improper timing of nitrogen application, C. camphora var. linalooliferum maintained a certain level of photosynthetic activity and provided a material basis for essential oil synthesis but failed to effectively drive biomass accumulation, thereby affecting the final yield formation.
The essential oil production traits of C. camphora var. linalooliferum coppice stands were subject to the integrated regulation of multiple phenotypic indicators (Figure 7). From the relationship between growth indicators, photosynthetic characteristics, and essential oil yield, the vectors for LEOyp, BEOyp, and TEOyp were almost parallel and highly positively correlated, reflecting the inherent synergy in the oil-producing capacity of different organs in C. camphora var. linalooliferum. Meanwhile, the vectors for PH, BD, LAI, Lb, Bb, Tb, and SPAD were aligned with those for LEOyp, BEOyp, and TEOyp, indicating that the sustained performance of leaf photosynthetic area and photosynthetic capacity promoted plant growth and biomass accumulation, thus increasing essential oil yield. The vectors for photosynthetic characteristics such as Pn, Gs, and Tr, had an angle smaller than 90° with the vectors for essential oil yield indicators and the smallest angle with LEOc and BEOc, suggesting that photosynthetic rate could influence the accumulation and distribution of photosynthetic products, providing the material basis for essential oil synthesis and accumulation. The results further confirmed that appropriate nitrogen application timing could regulate photosynthetic characteristics and promote the favorable expression of growth indicators, thereby controlling the essential oil yield of C. camphora var. linalooliferum. Late nitrogen application (such as N5) helped maintain organ activity and the continuity of essential oil synthesis, showing significant regulatory advantages.
3.5. Dynamic Evolution of Correlation Networks Reveals the Stage-Specific Regulatory Mechanisms of Essential Oil Production in C. camphora var. linalooliferum
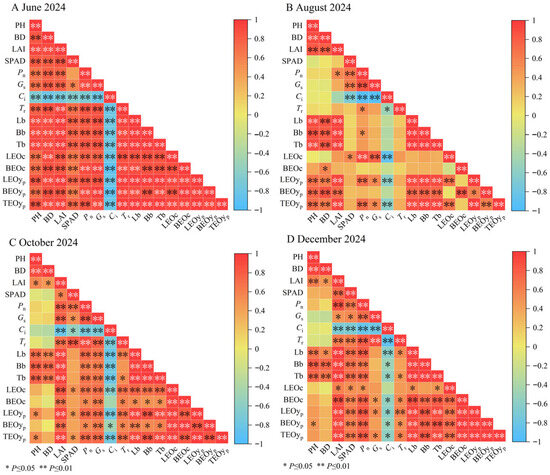
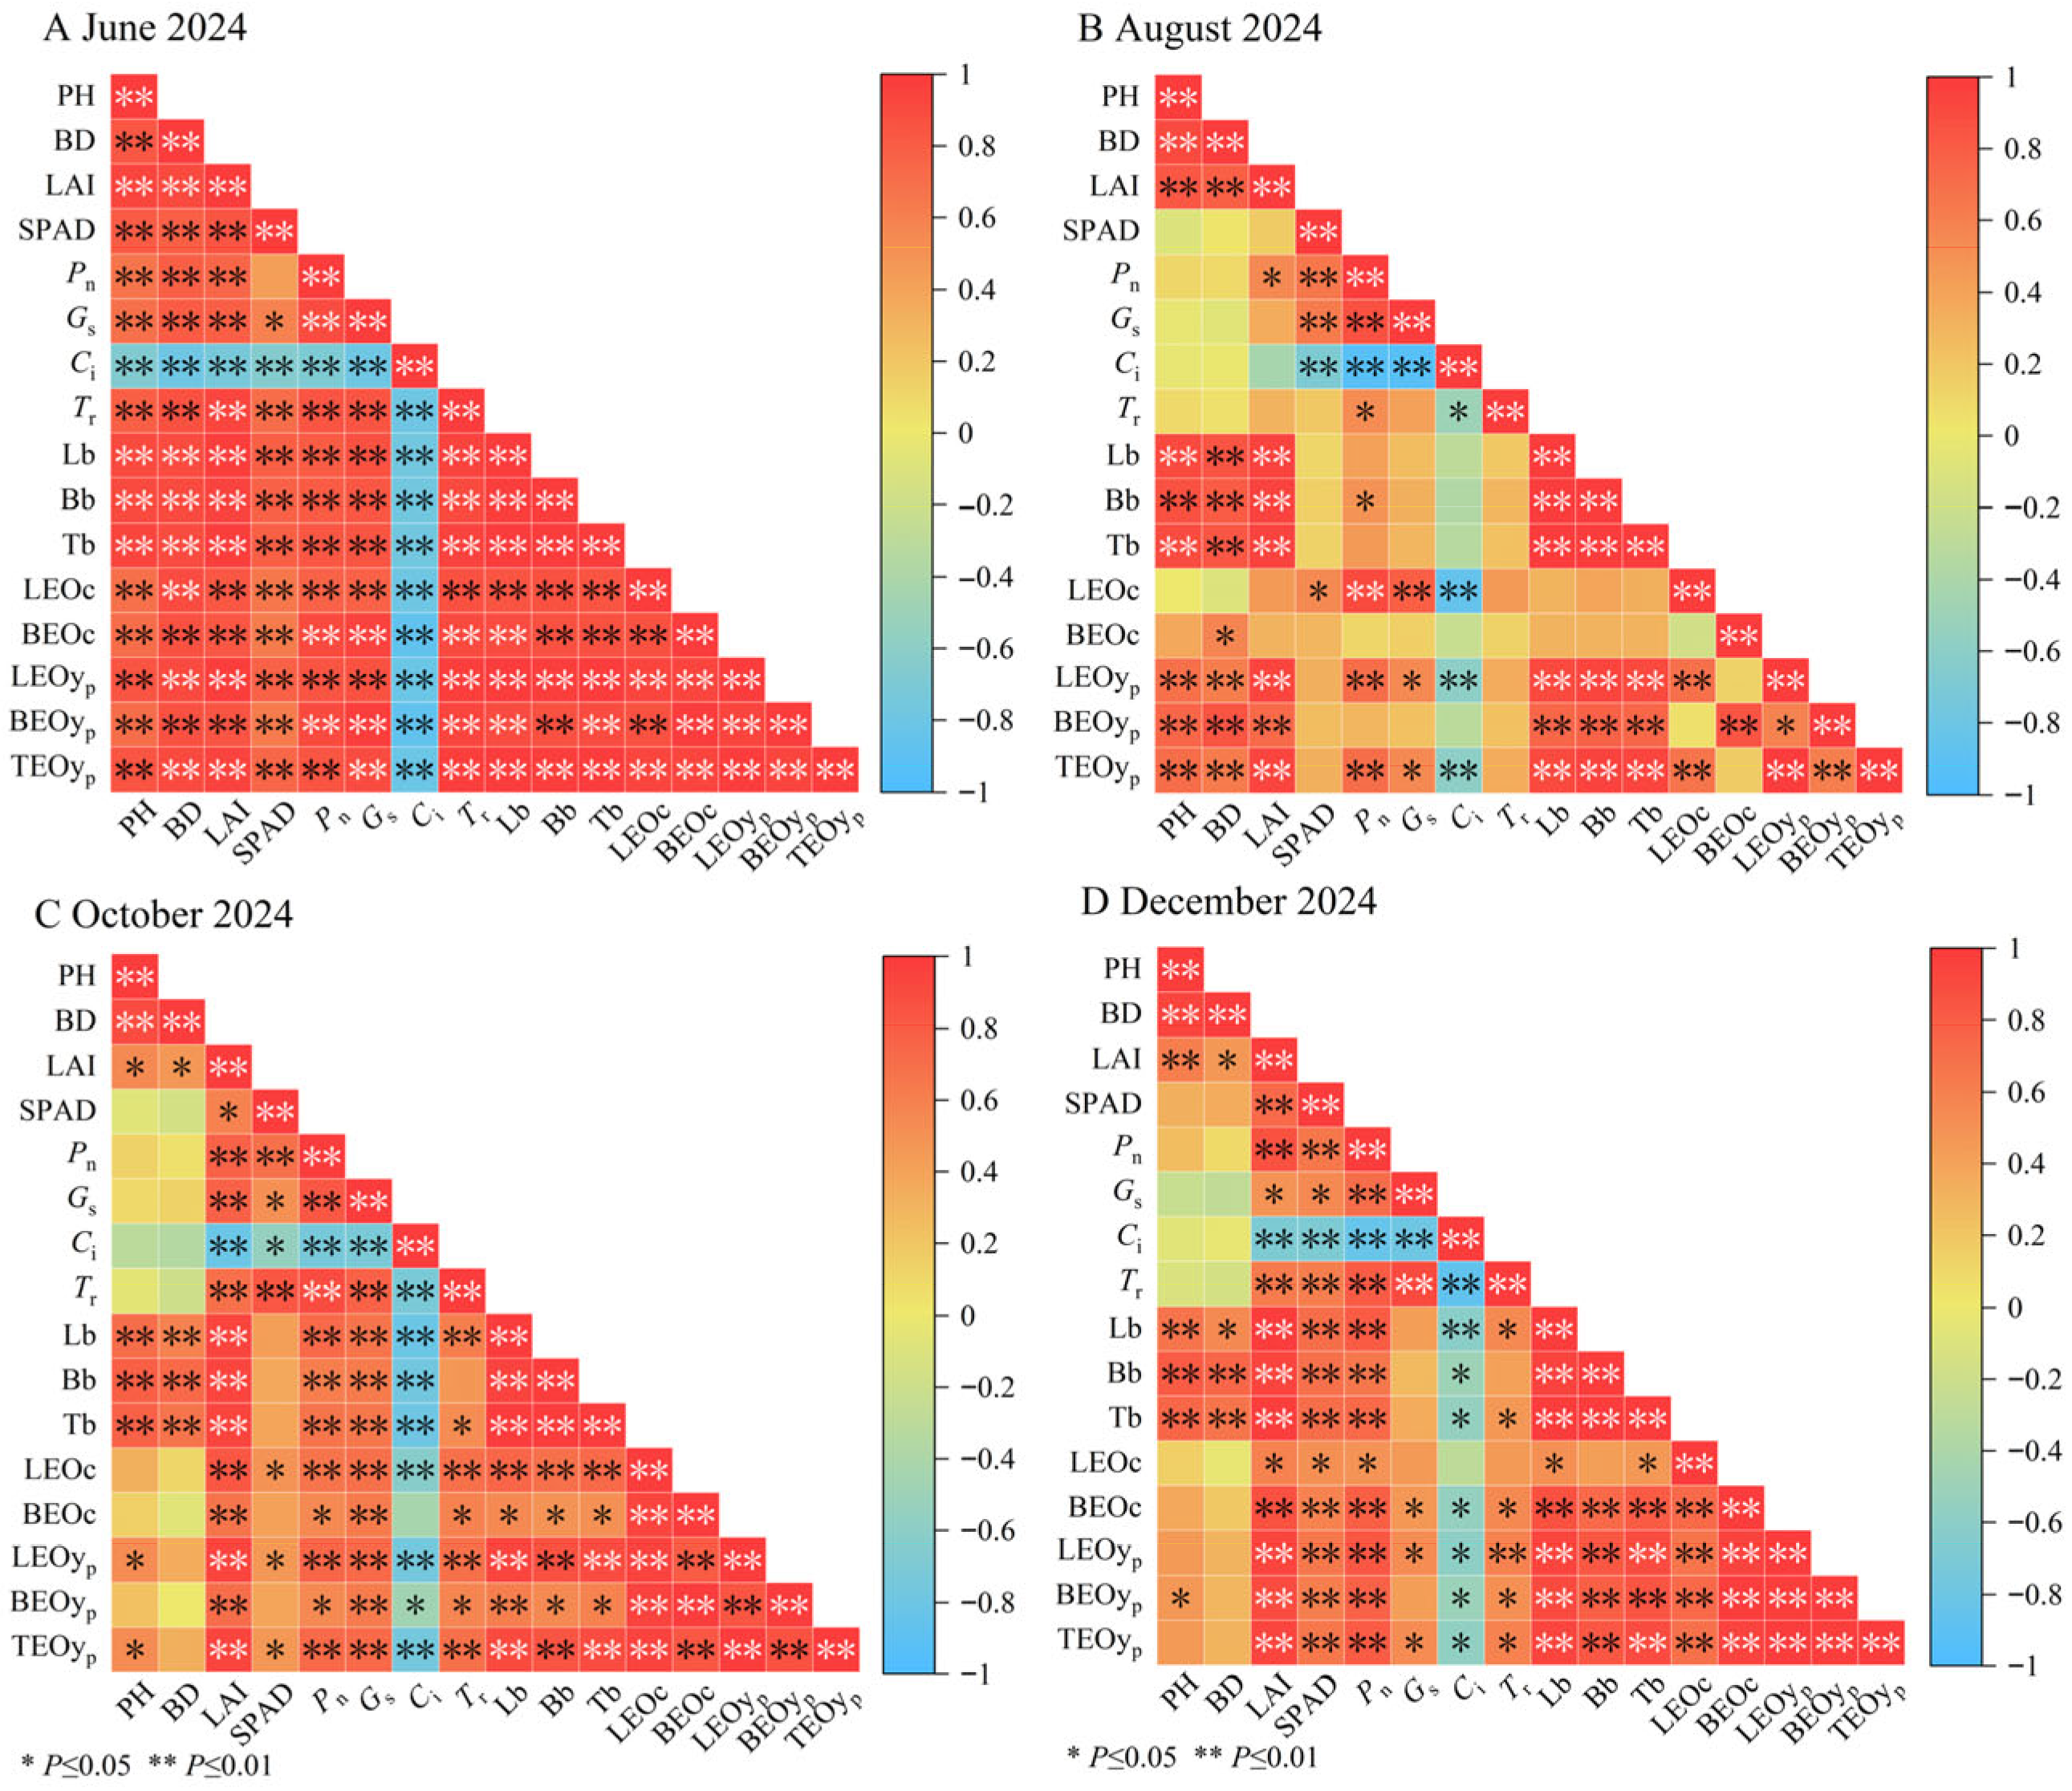
Through Pearson correlation analysis, this study systematically revealed the dynamic evolution of the relationships among growth traits, photosynthetic characteristics, and essential oil related indicators of C. camphora var. linalooliferum coppice stands at different growth stages (Figure 8). The results showed that the correlation network exhibited clear stage-specific characteristics, reflecting the time-dependent nature of plant trait regulation.
Figure 8.
Correlation heatmap of main physiological indices and essential oil yield of C. camphora var. linalooliferum coppice stands in different months (June, August, October, December). Pearson’s correlation coefficients were used to assess the relationships among variables. Color intensity represents the strength of the correlation, and significance levels were indicated as * p ≤ 0.05 and ** p ≤ 0.01.
In June, except for Pn, Gs, Ci, and SPAD, all other indicators exhibited highly significant positive correlations (p < 0.01), indicating a high level of coordination in growth and physiological activities, with the plants in a rapid growth phase. Ci was significantly negatively correlated with all other indicators (p < 0.01), reflecting that as photosynthetic activity and plant growth indicators increased, leaf Ci decreased, indicating more efficient CO2 fixation and enhanced photosynthetic efficiency. This suggested that plant had already achieved efficient carbon assimilation in the early growth phase, providing a sufficient carbon source for essential oil synthesis.
By August, the correlation strength between some indicators weakened significantly, and the relationships between photosynthetic parameters and growth indicators were no longer significant. This indicated that plant growth had transitioned from structural expansion to a phase dominated by secondary metabolite accumulation, with the allocation of photosynthetic products shifting toward essential oil synthesis. In October, the correlation strength of most indicators improved compared to August, with biomass showing highly significant positive correlations with Pn, Gs, and Tr (p < 0.01), while maintaining a highly significant negative correlation with Ci. This indicated that during this phase, the plant’s photosynthetic activity again became a driving force for organic matter accumulation, and more photosynthetic products were converted into structural biomass.
By December, the correlation between leaf essential oil content and photosynthetic parameters (Pn, Gs, Ci, Tr) and biomass (Lb, Bb, Tb) weakened significantly, indicating that as plant growth entered a slower phase, the impact of photosynthetic activity and structural buildup on essential oil accumulation diminished. There was a highly significant positive correlation between plant essential oil content and yield, suggesting that at this stage, the oil-producing capacity mainly depended on plant essential oil content rather than biomass accumulation.
In summary, the formation of essential oil yield in C. camphora var. linalooliferum was regulated by the coordination of multiple traits, with the regulatory mechanisms displaying clear stage-specific characteristics throughout the growth process. Early in the growth phase, photosynthetic-driven growth and structural development dominated. While in the middle phase, the focus shifted to the synthesis of secondary metabolites. And later in the growth cycle, photosynthesis and structural buildup resumed, with essential oil content becoming the key driver in the final stage.
4. Discussion
4.1. Response of Photosynthetic Characteristics to Nitrogen Application Timing in C. camphora var. linalooliferum
Photosynthetic capacity not only determines carbon assimilation efficiency but also reflects plant responses to nutrient availability, making it a key physiological indicator for evaluating the balance between nutrient supply and demand and the rationality of fertilization strategies [14,15]. Previous studies have shown that nitrogen supply significantly affects plant photosynthetic characteristics, with application timing playing a critical role in regulating photosynthetic efficiency [16]. In the present study, photosynthetic parameters (Pn, Gs, Ci, Tr) and SPAD values of C. camphora var. linalooliferum differed significantly (p < 0.05) under different nitrogen application timings, indicating a high sensitivity of photosynthetic traits to temporal variation in nitrogen availability. Similar timing-dependent responses have also been reported in crops such as soybean (Glycine max (L.) Merr., Fabaceae) and wheat (Triticum aestivum L., Poaceae) [17,18]. By systematically analyzing key growth stages, this study demonstrated that nitrogen-induced regulation of photosynthesis exhibited clear temporal patterns, which in turn influenced carbon assimilation efficiency, biomass accumulation, and subsequent essential oil synthesis [19].
Nitrogen supply significantly influenced photosynthetic processes and carbon allocation patterns, thereby regulating the accumulation of photosynthates and essential oil formation. Early-stage nitrogen application markedly increased Pn and SPAD values in June, indicating that sufficient nitrogen promoted chlorophyll synthesis and enhanced carbon fixation efficiency, thus supporting early vegetative growth [20,21,22]. The concurrent increases in Gs and Tr suggested that nitrogen enhanced stomatal function, improving gas exchange and facilitating water and energy fluxes [23,24]. These coordinated physiological responses promoted rapid accumulation of photosynthetic products, providing a material basis for subsequent biomass formation and the initiation of secondary metabolic pathways [25,26].
As growth progressed, mid-stage nitrogen application induced a second peak in photosynthetic activity by August, particularly in Pn and Gs, indicating strong stage-specific regulation of the photosynthetic system in C. camphora var. linalooliferum [27,28]. At this stage, appropriate nitrogen supply prolonged functional leaf lifespan and delayed declines in photosynthetic capacity, thereby maintaining continuous carbon input [29,30,31]. Meanwhile, relatively stable Ci values suggested that nitrogen-regulated photosynthe-sis was primarily limited by biochemical capacity rather than stomatal conductance [32]. Compared with other treatments, late-stage nitrogen application in October and December maintained higher SPAD and Pn levels, demonstrating enhanced photosynthetic maintenance and delayed leaf senescence. Supplemental nitrogen at later stages helped preserve chloroplast stability and optimize carbon–nitrogen coordination, allowing functional leaves to retain effective photosynthetic capacity and support essential oil accumulation during later developmental stages [29]. As leaves are the primary oil-producing organs in C. camphora var. linalooliferum, extending the duration of efficient photosynthesis is critical for maximizing essential oil yield [33,34].
Overall, the photosynthetic response of C. camphora var. linalooliferum to nitrogen application timing followed a clear temporal pattern characterized by activation, enhancement, and maintenance [35]. Early nitrogen supply mainly promoted rapid formation of functional leaves and activation of the photosynthetic system, whereas mid-stage application enhanced carbon sink strength and metabolic efficiency, facilitating secondary metabolite synthesis. Late-stage nitrogen application stabilized photosynthetic performance and delayed senescence, thereby sustaining carbon supply to oil-producing organs [22,29,31]. Coordinated changes in Ci and Tr further revealed nitrogen-mediated regulation of water use efficiency and carbon–nitrogen metabolic balance [36]. Collectively, these results indicated that nitrogen application timing dynamically regulates photosynthetic capacity and essential oil production potential through multi-stage physiological coordination. This regulation was achieved not through isolated changes in individual traits, but through synergistic interactions among multiple photosynthetic mechanisms across developmental stages, ultimately optimizing gas exchange and carbon fixation efficiency and promoting the conversion of secondary metabolites into essential oil yield [37].
4.2. Mechanism of Essential Oil Yield Response to Nitrogen Application Timing in C. camphora var. linalooliferu
Essential oil, the most economically valuable secondary metabolite of C. camphora var. linalooliferum forests, is regulated not only by genetic and environmental factors but also by the dynamic coordination between nitrogen supply timing and plant physiological metabolic status. Previous studies have shown that nitrogen application timing significantly affects essential oil yield in plants [38]. In the present study, nitrogen application timing significantly influenced the essential oil yield of C. camphora var. linalooliferum (p < 0.05), with yield variations exhibiting clear stage-specific dynamics and nitrogen regulatory effects. These results indicated that essential oil synthesis and accumulation are strongly regulated by nitrogen application timing [38,39].
Photosynthetic regulation in C. camphora var. linalooliferum leaves showed continuity in assimilate production, and its effects on essential oil yield differed significantly among nitrogen application timings (p < 0.05). For leaf essential oil yield, nitrogen treatments generally outperformed CK, with accumulation peaks observed in August. Treatments N1 and N5 reached 11.32 g·plant−1 and 11.03 g·plant−1, respectively, representing increases of more than 130% compared with CK. This pattern suggested that both early (N1) and late (N5) nitrogen application effectively promoted essential oil synthesis through distinct mechanisms. Early nitrogen application enhanced initial photosynthetic accumulation and functional leaf structure formation, providing sufficient carbon skeletons and energy reserves for oil synthesis. In contrast, late nitrogen application prolonged the oil production period by delaying leaf senescence and stabilizing enzyme activity, thereby conferring an advantage in sustaining oil production [40,41]. Under the N5 treatment, essential oil yield increased by 225.79% and 187.05% in October and December, respectively, compared with CK, further confirming that late nitrogen application sustained oil production potential during later growth stages. This highlights the importance of maintaining leaf physiological activity and nutrient supply to support oil synthesis in the late growth period [26].
Although branch essential oil yield was generally lower than that of leaves, its response pattern remained informative. In this study, branch oil yield peaked in June and August, with N1, N2, and N3 treatments significantly higher than CK in August. However, during the later growth stages (October and December), branch oil yield declined rapidly. As branches were not the primary organs for oil synthesis, their oil accumulation window was narrower and mainly concentrated in the early to mid-growth stages, exhibiting greater sensitivity to nitrogen stimulation [42]. The effect of late nitrogen supply on branch oil yield weakened, likely due to the stabilization of organ differentiation and the carbon allocation priority shifting to the leaves [43,44].
The temporal dynamics of total essential oil yield closely mirrored those of leaf yield, with production peaks occurring in August and October. In October, the total essential oil yield of C. camphora var. linalooliferum under the N5 treatment reached 13.90 g·plant−1, significantly higher than that of other treatments, with the leaf contribution rate generally exceeding 96%. This indicated that leaves were not only the primary organs for essential oil synthesis but also the key responsive sites for nitrogen regulation [43]. Differences in essential oil yield essentially reflected variations in leaf physiological status. Optimizing nitrogen application timing could enhance essential oil synthesis by prolonging the high-efficiency photosynthetic phase, maintaining structural integrity, and increasing the activity of enzymes related to oil biosynthesis, thereby improving oil yield per unit area [45].
Further analysis revealed that nitrogen regulation of essential oil yield reflected a coupling effect between physiological regulation and application timing [6]. Early nitrogen application enhanced leaf activity and assimilation rates, promoting early-stage oil synthesis, whereas late nitrogen application maintained metabolic activity and delayed functional decline, extending the oil production window and generating greater cumulative effects [40,41]. Correlation analysis showed that essential oil yield was significantly positively correlated with net photosynthetic rate, LAI, and biomass, indicating that carbon metabolism efficiency directly determines oil yield potential [43,46]. Therefore, improving essential oil yield can not be achieved through a single nitrogen application stage but requires a dynamic and integrated fertilization strategy that matches synthesis potential across growth stages [6]. In conclusion, the essential oil yield of C. camphora var. linalooliferum exhibited a multi-stage response to nitrogen application timing, and the initiation, enhancement, and maintenance of oil synthesis all depend on precise nitrogen regulation.
5. Conclusions
The underlying mechanism was systematically elucidated by examining how nitrogen application timing influenced biomass accumulation and essential oil yield through the regulation of photosynthetic physiological processes in C. camphora var. linalooliferum coppice forests. The results showed that early nitrogen application (N1) rapidly increased leaf Pn, Gs, and SPAD values during the early vegetative growth stage, thereby enhancing carbon assimilation and structural development and providing sufficient material and energy reserves for subsequent essential oil synthesis. In contrast, late nitrogen application (N5) prolonged the lifespan of functional leaves, maintained photosynthetic efficiency, and stabilized chloroplast structure, which extended the high-yield period and significantly increased total essential oil yield.
Comprehensive analysis further indicated that nitrogen application timing not only determined the availability of photosynthetic resources at different growth stages but also regulated the dynamic rhythm of essential oil synthesis and its distribution among plant organs. Among all treatments, N5 exhibited the best overall performance in terms of both yield and stability. This study will provide a theoretical basis for the development of efficient cultivation models for C. camphora var. linalooliferum forests and offers a practical and referenceable nitrogen management strategy for essential oil-oriented economic forestry.
Author Contributions
Conceptualization, J.M. and J.Z. (Jiao Zhao); methodology, J.M.; software, J.M., L.L.; validation, J.Z. (Jie Zhang), J.H. and C.X.; formal analysis, J.M. and J.H.; investigation, J.Z. (Jie Zhang); resources, J.Z. (Jiao Zhao); data curation, J.M.; writing—original draft preparation, J.M.; writing—review and editing, J.Z. (Jiao Zhao), J.M. and Q.L.; visualization, L.L. and J.M.; supervision, J.Z. (Jiao Zhao) and Q.L.; project administration, J.Z. (Jie Zhang); funding acquisition, J.Z. (Jiao Zhao). All authors have read and agreed to the published version of the manuscript.
Funding
This research was funded by the Scientific and Technological Research Project of Jiangxi Provincial Department of Education, grant number GJJ2201515; the Major Science and Technology R&D Special Project of Jiangxi Provincial Department of Science and Technology, grant number 20203ABC28W016; and the Educational Science Planning Project of the 14th Five-Year Plan of Jiangxi Province, grant number 22YB248. The APC was funded by the above-mentioned funding projects.
Data Availability Statement
The original contributions presented in this study are included in the article. Further inquiries can be directed at the corresponding author.
Acknowledgments
We thank the reviewers and editors for their helpful comments regarding the manuscript.
Conflicts of Interest
The authors declare no conflicts of interest.
References
- Wan, N.; Li, Y.; Huang, X.Y.; Li, Y.H.; Zheng, Q.; Wu, Z.F. A comparative evaluation of chemical composition and anti-microbial activities of essential oils extracted from different chemotypes of Cinnamomum camphora (L.) Presl. Grasas Aceites 2022, 73, e441. [Google Scholar] [CrossRef] [Scilit]
- Zhao, J. Dynamic changes of the contents of essential oil and nutrients of Cinnamomum camphora var. linaloolifera and their correlation. Sci. Silvae Sin. 2021, 57, 57–67. Available online: http://www.linyekexue.net/CN/10.11707/j.1001-7488.20211206 (accessed on 8 August 2025).
- Chen, C.C.; Huang, M.Y.; Lin, K.H.; Hsueh, M.T. The effects of nitrogen application on the growth, photosynthesis, and antioxidant activity of Amaranthus viridis. Photosynthetica 2022, 60, 420–429. [Google Scholar] [CrossRef] [Scilit] [PubMed]
- Tsialtas, J.T.; Maslaris, N. Nitrogen fertilization effects on leaf morphology and evaluation of leaf area and leaf area index prediction models in sugar beet. Photosynthetica 2008, 46, 346. [Google Scholar] [CrossRef] [Scilit]
- Keshavarz, H.; Modarres Sanavy, S.A.M. Yield and oil content of mint under different nitrogen fertilizer treatments. Not. Sci. Biol. 2018, 10, 92–96. [Google Scholar] [CrossRef] [Scilit]
- Zheljazkov, V.D.; Cantrell, C.L.; Astatkie, T.; Ebelhar, M.W. Peppermint productivity and oil composition as a function of nitrogen, growth stage, and harvest time. Agron. J. 2010, 102, 124–128. [Google Scholar] [CrossRef] [Scilit]
- Mavandi, P.; Abbaszadeh, B.; Emami Bistgani, Z.; Barker, A.V.; Hashemi, M. Biomass, nutrient concentration and the essential oil composition of lavender (Lavandula angustifolia Mill.) grown with organic fertilizers. J. Plant Nutr. 2021, 44, 3061–3071. [Google Scholar] [CrossRef] [Scilit]
- Hazrati, S.; Mousavi, Z.; Mollaei, S.; Sedaghat, M.; Mohammadi, M.; Pignata, G.; Nicola, S. Optimizing nitrogen fertilization to maximize yield and bioactive compounds in Ziziphora clinopodioides. Agriculture 2024, 14, 1690. [Google Scholar] [CrossRef] [Scilit]
- Pan, X.; Welti, R.; Wang, X. Quantitative analysis of major plant hormones in crude plant extracts by high-performance liquid chromatography–mass spectrometry. Nat. Protoc. 2010, 5, 986–992. [Google Scholar] [CrossRef] [Scilit]
- Xu, G.; Fan, X.; Miller, A.J. Plant nitrogen assimilation and use efficiency. Annu. Rev. Plant Biol. 2012, 63, 153–182. [Google Scholar] [CrossRef] [Scilit]
- Wang, Z.; Zhao, T.; Ma, L.; Chen, C.; Miao, Y.; Guo, L.; Liu, D. Mechanisms governing the impact of nitrogen stress on the formation of secondary metabolites in Artemisia argyi leaves. Sci. Rep. 2023, 13, 12866. [Google Scholar] [CrossRef] [Scilit] [PubMed]
- Tepecik, M.; Esetlili, B.Ç.; Öztürk, B.; Anaç, D. Effect of different fertilizers on peppermint-essential and non-essential nutrients, essential oils and yield. Ital. J. Agron. 2022, 17, 1921. [Google Scholar] [CrossRef] [Scilit]
- Jayasinghege, C.P.A.; Bineng, C.; Messiga, A.J. Effects of long-term nitrogen fertilization and application methods on fruit yield, plant nutrition, and soil chemical properties in highbush blueberries. Horticulturae 2024, 10, 1205. [Google Scholar] [CrossRef] [Scilit]
- Lankhorst, J.A.; de Boer, H.J.; Behling, D.C.; Drake, P.L.; Perkowski, E.A.; Rebel, K.T. Nutrient availability increases photosynthetic capacity without altering the cost of resource use for photosynthesis. AoB Plants 2025, 17, plaf061. [Google Scholar] [CrossRef] [Scilit]
- Mu, X.; Chen, Y. The physiological response of photosynthesis to nitrogen deficiency. Plant Physiol. Biochem. 2021, 158, 76–82. [Google Scholar] [CrossRef] [Scilit]
- Guo, P.; Ren, J.; Shi, X.; Xu, A.; Zhang, P.; Guo, F.; Feng, Y.; Zhao, X.; Yu, H.; Jiang, C. Optimized nitrogen application ameliorates the photosynthetic performance and yield potential in peanuts as revealed by OJIP chlorophyll fluorescence kinetics. BMC Plant Biol. 2024, 24, 774. [Google Scholar] [CrossRef] [Scilit]
- Qadeer, U.; Ahmed, M.; Hassan, F.; Akmal, M. Impact of nitrogen addition on physiological, crop total nitrogen, efficiencies and agronomic traits of the wheat crop under rainfed conditions. Sustainability 2019, 11, 6486. [Google Scholar] [CrossRef] [Scilit]
- Qiang, B.; Chen, S.; Fan, Z.; Cao, L.; Li, X.; Fu, C.; Zhang, Y.; Jin, X. Effects of nitrogen application levels on soybean photosynthetic performance and yield: Insights from canopy nitrogen allocation studies. Field Crops Res. 2025, 326, 109871. [Google Scholar] [CrossRef] [Scilit]
- Chen, Z.; Tao, X.; Khan, A.; Tan, D.K.Y.; Luo, H. Biomass accumulation, photosynthetic traits and root development of cotton as affected by irrigation and nitrogen-fertilization. Front. Plant Sci. 2018, 9, 173. [Google Scholar] [CrossRef] [Scilit]
- Zhou, Y.; Zhang, Y.; Wang, X.; Cui, J.; Xia, X.; Shi, K.; Yu, J. Effects of nitrogen form on growth, CO2 assimilation, chlorophyll fluorescence, and photosynthetic electron allocation in cucumber and rice plants. J. Zhejiang Univ. Sci. B 2011, 12, 126–134. [Google Scholar] [CrossRef] [Scilit]
- Krapp, A. Plant nitrogen assimilation and its regulation: A complex puzzle with missing pieces. Curr. Opin. Plant Biol. 2015, 25, 115–122. [Google Scholar] [CrossRef] [Scilit] [PubMed]
- Bassi, D.; Menossi, M.; Mattiello, L. Nitrogen supply influences photosynthesis establishment along the sugarcane leaf. Sci. Rep. 2018, 8, 2327. [Google Scholar] [CrossRef] [Scilit] [PubMed]
- Ding, L.; Lu, Z.; Gao, L.; Guo, S.; Shen, Q. Is nitrogen a key determinant of water transport and photosynthesis in higher plants upon drought stress? Front. Plant Sci. 2018, 9, 1143. [Google Scholar] [CrossRef] [Scilit]
- Wang, D.; Duan, H.; Zhao, Y.; Qiu, W.; Liu, X.; Wu, J.; Huang, G.; Liu, W. Antecedent moderate nitrogen fertilization alleviated the effects of drought on growth and leaf photosynthesis of Schima superba seedlings. BMC Plant Biol. 2025, 25, 917. [Google Scholar] [CrossRef] [Scilit]
- Wu, W.; Wu, H.; Liang, R.; Huang, S.; Meng, L.; Zhang, M.; Xie, F.; Zhu, H. Light regulates the synthesis and accumulation of plant secondary metabolites. Front. Plant Sci. 2025, 16, 1644472. [Google Scholar] [CrossRef] [Scilit]
- Stitt, M.; Zeeman, S.C. Starch turnover: Pathways, regulation and role in growth. Curr. Opin. Plant Biol. 2012, 15, 282–292. [Google Scholar] [CrossRef] [Scilit]
- Muhammad, I.; Shalmani, A.; Ali, M.; Yang, Q.-H.; Ahmad, H.; Li, F.B. Mechanisms regulating the dynamics of photosynthesis under abiotic stresses. Front. Plant Sci. 2021, 11, 615942. [Google Scholar] [CrossRef] [Scilit]
- Kumarathunge, D.P.; Medlyn, B.E.; Drake, J.E.; Tjoelker, M.G.; Aspinwall, M.J.; Battaglia, M.; Cano, F.J.; Carter, K.R.; Cavaleri, M.A.; Cernusak, L.A.; et al. Acclimation and adaptation components of the temperature dependence of plant photosynthesis at the global scale. New Phytol. 2019, 222, 768–784. [Google Scholar] [CrossRef] [Scilit]
- Wang, P.; Fu, C.; Wang, L.; Yan, T. Delayed autumnal leaf senescence following nutrient fertilization results in altered nitrogen resorption. Tree Physiol. 2022, 42, 1549–1559. [Google Scholar] [CrossRef] [Scilit]
- Echarte, L.; Rothstein, S.; Tollenaar, M. The response of leaf photosynthesis and dry matter accumulation to nitrogen supply in an older and a newer maize hybrid. Crop Sci. 2008, 48, 656–665. [Google Scholar] [CrossRef] [Scilit]
- Borrell, A.K.; Hammer, G.L. Nitrogen dynamics and the physiological basis of stay-green in sorghum. Crop Sci. 2000, 40, 1295–1307. [Google Scholar] [CrossRef] [Scilit]
- Flexas, J. Drought-inhibition of photosynthesis in C3 plants: Stomatal and non-stomatal limitations revisited. Ann. Bot. 2002, 89, 183–189. [Google Scholar] [CrossRef] [Scilit] [PubMed]
- Delfini, R.; Belgoff, C.; Fernández, E.; Fabra, A.; Castro, S. Symbiotic nitrogen fixation and nitrate reduction in two peanut cultivars with different growth habit and branching pattern structures. Plant Growth Regul. 2010, 61, 153–159. [Google Scholar] [CrossRef] [Scilit]
- Parkash, V.; Snider, J.L.; Sintim, H.Y.; Hand, L.C.; Virk, G.; Pokhrel, A. Differential sensitivities of photosynthetic processes and carbon loss mechanisms govern N-induced variation in net carbon assimilation rate for field-grown cotton. J. Exp. Bot. 2023, 74, 2638–2652. [Google Scholar] [CrossRef] [Scilit] [PubMed]
- Duan, H.; Wang, D.; Wei, X.; Huang, G.; Fan, H.; Zhou, S.; Wu, J.; Liu, W.; Tissue, D.T.; Wan, S. The decoupling between gas exchange and water potential of Cinnamomum camphora seedlings during drought recovery and its relation to ABA accumulation in leaves. J. Plant Ecol. 2020, 13, 683–692. [Google Scholar] [CrossRef] [Scilit]
- Zhang, Z.; Zhang, Y.; Shi, Y.; Yu, Z. Optimized split nitrogen fertilizer increase photosynthesis, grain yield, nitrogen use efficiency and water use efficiency under water-saving irrigation. Sci. Rep. 2020, 10, 20310. [Google Scholar] [CrossRef] [Scilit]
- Xing, J.; Cao, X.; Zhang, M.; Wei, X.; Zhang, J.; Wan, X. Plant nitrogen availability and crosstalk with phytohormones signalling and their biotechnology breeding application in crops. Plant Biotechnol. J. 2023, 21, 1320–1342. [Google Scholar] [CrossRef] [Scilit]
- Singh, M.; Rao, G. Effects of nitrogen, potassium and soil moisture regime on growth, herbage, oil yield and nutrient uptake of South American marigold (Tagetes minuta L.) in a semi-arid tropical climate. J. Hortic. Sci. Biotechnol. 2005, 80, 488–492. [Google Scholar] [CrossRef] [Scilit]
- Rao, E.V.S.P.; Puttanna, K.; Ramesh, S. Effect of nitrogen and harvest stage on the yield and oil quality of Tagetes minuta L. in tropical India. J. Herbs Spices Med. Plants 2000, 7, 19–24. [Google Scholar] [CrossRef] [Scilit]
- Rempel, H.G.; Strik, B.C.; Righetti, T.L. Uptake, partitioning, and storage of fertilizer nitrogen in red raspberry as affected by rate and timing of application. J. Am. Soc. Hortic. Sci. 2004, 129, 439–448. [Google Scholar] [CrossRef] [Scilit]
- Walia, S.; Kumar, R. Nitrogen and sulfur fertilization modulates the yield, essential oil and quality traits of wild marigold (Tagetes minuta L.) in the western Himalaya. Front. Plant Sci. 2021, 11, 631154. [Google Scholar] [CrossRef] [Scilit]
- Geng, S.; Cui, Z.; Huang, X.; Chen, Y.; Xu, D.; Xiong, P. Variations in essential oil yield and composition during Cinnamomum cassia bark growth. Ind. Crops Prod. 2011, 33, 248–252. [Google Scholar] [CrossRef] [Scilit]
- Tang, Z.; Xu, W.; Zhou, G.; Bai, Y.; Li, J.; Tang, X.; Chen, D.; Liu, Q.; Ma, W.; Xiong, G.; et al. Patterns of plant carbon, nitrogen, and phosphorus concentration in relation to productivity in China’s terrestrial ecosystems. Proc. Natl. Acad. Sci. USA 2018, 115, 4033–4038. [Google Scholar] [CrossRef] [Scilit]
- Duanmu, Z.; Zhu, Z.; Zhao, W.; Chen, A.; Wang, Z.; Cao, S.; Li, D.; Luo, Y.; Myneni, R.B. Changes in leaf and root carbon allocation of global vegetation simulated by the optimally integrated ecosystem models. Agric. For. Meteorol. 2025, 362, 110366. [Google Scholar] [CrossRef] [Scilit]
- Emami Bistgani, Z.; Ataollah Siadat, S.; Bakhshandeh, A.; Ghasemi Pirbalouti, A.; Hashemi, M.; Maggi, F.; Reza Morshedloo, M. Application of combined fertilizers improves biomass, essential oil yield, aroma profile, and antioxidant properties of Thymus daenensis Celak. Ind. Crops Prod. 2018, 121, 434–440. [Google Scholar] [CrossRef] [Scilit]
- Pallas, B.; Mialet-Serra, I.; Rouan, L.; Clement-Vidal, A.; Caliman, J.-P.; Dingkuhn, M. Effect of source/sink ratios on yield components, growth dynamics and structural characteristics of oil palm (Elaeis guineensis) bunches. Tree Physiol. 2013, 33, 409–424. [Google Scholar] [CrossRef] [Scilit]

Disclaimer/Publisher’s Note: The statements, opinions and data contained in all publications are solely those of the individual author(s) and contributor(s) and not of MDPI and/or the editor(s). MDPI and/or the editor(s) disclaim responsibility for any injury to people or property resulting from any ideas, methods, instructions or products referred to in the content. |
© 2026 by the authors. Licensee MDPI, Basel, Switzerland. This article is an open access article distributed under the terms and conditions of the Creative Commons Attribution (CC BY) license.