


Abstract
Increases in global temperatures, due to the climate change, are generating stress in most plant species. We hypothesize that young plants of Opuntia spp. adjust their Crassulacean acid metabolism (CAM) to the increase in nighttime temperature, allowing them to continue growing. The study was carried out in a greenhouse and laboratory of the Colegio de Postgraduados, Montecillo, Mexico. Three-month-old greenhouse-grown plants remained in a control environment with an average day/night temperature of 19.1/12.3 °C or were maintained in a chamber with increased nighttime temperatures averaging 19.1/18.9 °C day/night for 70 days. The experimental design was completely randomized with two treatments (control and high nighttime temperatures). After 70 days of high nighttime temperatures (HNT), at dawn (end of CAM phase I), plants had a 45% decrease in glucose (2.9 to 1.5 mg/100 mg dry tissue; dt) concentration and doubled and tripled fructose (0.43 to 0.95 mg/100 mg dt) and sucrose (0.47 to 0.09 mg/100 mg dt) concentrations. Glucose consumption may be related to the plant’s metabolic energy expenditure to overcome stress. The significant increase in fructose and sucrose is explainable by their function as signaling molecules among others. In contrast, photosynthetic efficiency, i.e., increased compared to the control, but the difference of acidity (end of phase I less phase III), the concentration of starch (1 mg/100 mg dt), free amino acids and soluble protein (1.2 mg/100 mg dt), wet and dry matter, stem height (60 cm) and width of the stem at dawn were not significantly affected. The adjustments in C and N metabolism and the non-significant effect on growth promoted by 70 HNT days may be related to adjustments in enzyme activities without changes in protein concentration. Young Opuntia spp. plants adjust their metabolism in response to increased nighttime temperatures, allowing them to maintain growth similar to that of the control. The results confirm the great potential of using the Opuntia genus in agriculture and genetic improvement in the face of the challenges posed by climatic change.
1. Introduction
Environmental changes that generate floods, droughts, extreme temperatures, and salinity have negative impacts on plant growth and yield. The increase in CO2 concentrations, from 317 to 422 ppm, from 1960 to the present [1], and other gases in the atmosphere have led to an increase in the average global temperature. The average temperature of the Earth is projected to increase by up to 4.5 °C by the end of the 21st century [2]. However, there have been events in which warming occurs asymmetrically, with greater increases in nighttime temperatures compared to daytime temperatures [3].
High temperatures throughout the day have an unequal impact on species depending on their photosynthetic metabolism [4]. Based on C metabolism, three major groups of plants have been identified, i.e., C3, C4 and CAM (Crassulacean acid metabolism; [5]). The latter photosynthetic specialization is identified in 35 plant families with 343 genera, representing 6% of higher plants [6,7]. Four phases are recognized in CAM photosynthesis. Phase I includes the nocturnal opening of stomata, allowing the fixation of CO2 in the cytosol by phosphoenolpyruvate carboxylase (pepc) and the formation of organic acids with four C (mainly malic acid), which are stored in the vacuole. At dawn, phase II is identified in a short period, which begins with the activation of a second carboxylase, ribulose 1,5 bisphosphate carboxylase/oxygenase (rubisco), inhibition of pepc and closure of stomata. During the day, in phase III organic acids are removed from the vacuole, decarboxylated by malate decarboxylase, and the CO2 is refixed by rubisco in the Calvin-Benson cycle, with the closure of stomata and a total or partial decrease in transpiration. At dusk, phase IV occurs, it is considered transitional like phase II, in which Rubisco inhibition begins, pepc is reactivated and stomata reopen [5]. In CAM plants diurnal changes in tissue acidity are related to nocturnal CO2 fixation as is assimilation [8,9]. CAM plants are tolerant to dry and hot environments, as they grow mainly in semi-arid environments (dry climate subtype), with rainfall less than 300 mm, and daily temperatures with oscillations of up to 20 °C between day and night [6,10,11]. Wild and cultivated populations of CAM plants may be affected by global warming [8], since the nocturnal increase in temperature in this metabolism negatively affects the partial or predominant incorporation of CO2 in the CAM phase I [5,11]. CAM plants acclimate diurnal and nocturnal photosynthetic processes to high temperatures differently [12]. Logic, increasing average temperatures will expand the latitudinal and altitudinal distribution limits of succulent species, similar to what has been reported for Agave salmiana [11]. CO2 fixation in phase I decreased in Agave tequilana, cultivated in regions outside its natural distribution, with increasing nighttime temperatures (>15 °C) [13]. High nighttime temperatures (HNT; 30/28 to 30/37 °C day/night) decreased or completely inhibited carboxylation in Kalanchoe pinnata and Ananas comosus (pineapple) [14]. CO2 assimilation in Opuntia polyacantha depends on daytime and nighttime temperatures; warm days (35 °C) favor assimilation in CAM phases I, and at the end of phase IV if the nights are cold (15 °C); however, water stress inhibits the gas exchange favored by cold night-time temperatures [15]. Drennan and Nobel [16] pointed out that the optimal temperature for the growth of CAM plants is higher than the temperature for nocturnal CO2 assimilation. Based on gas exchange, it was shown that in cacti, gas exchange is optimal between 12 and 20 °C [9] and that night-time temperatures above 15 °C decreased CO2 fixation in Agave tequilana [13]. Regarding enzymatic activity, in CAM species from arid and semi-arid regions, the stabilization of the active form of pepc and carboxylation are optimized at low night-time temperatures, while high temperatures favor decarboxylation [10].
The Opuntia genus includes 189 species, 83 of which are native to Mexico and 29 are distributed in the Southern Plateau, in the north-central part of the country [17]. This great wealth of Opuntia species and variants is commonly grouped into populations called “nopaleras” (localities of prickly pears). The environment where they are located and the uses given to the nopaleras determine the number, proportion, and abundance of Opuntia species that comprise them. There are nopaleras composed of a single species and others with up to 10 species [18]. Wild, semi-domesticated, and domesticated species of the genus Opuntia are a food source for humans and wildlife; in addition, some are used as forage, protect against erosion, primarily in arid and semi-arid zones (where they are abundant), and provide raw materials for the food, pharmaceutical, cosmetic, and other industries [19]. Opuntia plants are tolerant of high ambient temperatures and prolonged and severe moisture restriction, environmental factors exacerbated by climate change, making them candidates for cultivation. Part of this tolerance is due to the fact that the stems, known as cladodes, of these plants are photosynthetic and function as water storage, ensuring productivity in extreme drought conditions [19,20]. The Opuntia genus is characterized by its adaptation to semi-desert and desert climates due to its CAM photosynthesis [20]. For example, O. ficus-indica is tolerant of diurnal temperatures up to 65 °C [21]. The cladodes and fruits of this genus acclimate to high temperatures based on age and long-term, possibly cumulative, developmental changes, expressed as increases in the concentration of solutes such as glucose, fructose, sucrose, free amino acids, and low-molecular-weight proteins, and alterations in membrane integrity [21]. This is so for mature cladodes of O. megacantha, in which proline concentrations increase in response to heat stress [22].
The objective of this study was to evaluate the effect of HNT for 70 days on the biochemical, physiological, and growth characteristics of young prickly pear (Opuntia spp.) plants in a simulated “nopalera”. The hypothesis was that these plants adjust their metabolism to HNT, allowing them to continue growing.
2. Materials and Methods
2.1. Study Site and Growth Conditions
The study was conducted in a greenhouse and in the Biophysics and Physiology Laboratory of the Graduate Program in Botany at the Colegio de Postgraduados, Montecillo campus, Texcoco, State of Mexico (19°27′38″ N, 98°54′11″ W, and 2250 m above sea level).
The photoperiod during seed germination and plant growth was 10:14 with a light intensity average of 2755.11 µmol m−2 s−1 in the greenhouse during high-light period (between 12:00 and 4:00 p.m.).
Germination was conducted with saturated irrigation every 4–5 days. Field saturation irrigation was applied twice a week during plant growth.
A chamber for plant growth was constructed with Styrofoam walls and a removable roof inside the greenhouse.
2.2. Plant Material and Seed Germination
Opuntia ficus-indica (L.) Mill. and O. streptacantha Lem. seeds were donated by the CRUCEN-UACh Germplasm Bank (Centro Regional Universitario Centro Norte de la Universidad Autónoma de Chapingo), El Orito, Zacatecas, Mexico. Opuntia joconostle A. Web. seeds were obtained from fruits collected in a commercial crop field in San Martín de las Pirámides, Estado de México, Mexico.
One hundred seeds of each of the three species were soaked in distilled water for 24 h and disinfected with a commercial sodium hypochlorite solution in water (5% v:v). The seeds were placed in plastic boxes (with lids), with filter paper inside, and humidified daily with ozonated water (0.58 mg L−1); the boxes were kept in a germinator at 32 °C for 50 days [23]. Germination was 25, 24, and 44% for O. ficus-indica, O. joconostle, and O. streptacantha between 18 and 23 days. The germinated seeds were placed in pots (20 cm diameter × 20 cm height) with peat (Peat moss®) and kept in a greenhouse for the next 90 days. To simulate a “nopalera” prickly pear plantation [18], the surviving plants were divided into two groups; each group included nine, eight, and 15 plants of O. ficus-indica, O. joconostle, and O. streptacantha.
2.3. Experimental Design
The study was conducted using a completely randomized design with a two-factor factorial arrangement, and began on 30 August 2022. One factor was plant age, with three levels: 90, 125, and 160 days; the other factor was nighttime temperature, with two levels: temperature inside the greenhouse (group one or control) and inside a chamber with nighttime temperature increase (group two). The experimental unit was a single plant; seven replicates (each group, i.e., different species, randomly assigned) were analyzed in the first sampling (90 days old) and ten in subsequent samplings, randomly selected from each group.
The plant groups were randomly assigned to the greenhouse environment and the chamber with HNT. Biochemical, physiological, and growth characteristics were evaluated in 90-day-old (initial control), 125-day-old, and 160-day-old plants.
Ten experimental units from each treatment were kept in the pot to quantify substrate and shoot temperatures at the end of phase I and photosynthetic efficiency of photosystem II at noon (CAM phase III).
2.4. Morphological Data Collections
At each sampling, soil residues from the plants were removed with water; the plants were sectioned between the root and shoot. Stem spines were removed with a knife and tweezers. The tissues were frozen in an ultra-freezer (MIDEA® MFCD09P2NABW, Beijiao, China) and lyophilized (Labconco® Free Zone 6 freeze-dryer, Kansas City, MO, USA).
To quantify plant height, shoot width at half the height, wet and dry mass, plants were harvested at 7:00 a.m. (end of CAM phase I). The dehydrated weight was obtained after freeze-drying the plants. Shoot height was measured from the base to the apex, and mid-shoot width were measured using an electronic digital vernier caliper (Ronix®, Mod. 89157, Neuss, Germany). The wet and dry mass of the spineless shoot was recorded on an analytical balance.
2.5. Physiological and Biochemical Measurements
To quantify total acidity and the concentration of glucose, fructose, sucrose, starch, free amino acids, and soluble protein, plants were harvested at 7:00 a.m. (end of CAM phase I). In addition, acidity was also quantified at 4:00 p.m. (CAM phase III). For all these determinations, the plants were freeze-dried and ground.
Acidity was quantified in 25 mg of tissue using the method described by the Association of Official Analytical Chemists [24]. The concentration of soluble sugars and starch was quantified in 25 mg of tissue using the method described by Padilla-Chacón et al. [25]. The conversion factor for calculating starch content was 0.90 [26].
The concentration of free amino acids was determined in 25 mg of tissue using the method described by Jones et al. [27]. The concentration of soluble protein was quantified in an aqueous extract containing 20 to 30 mg of tissue, using the method proposed by Bradford [28], in a microplate with a spectrometer (Multiskan FC, Thermo Fisher Scientific Inc., Waltham, MA, USA).
The Fv/Fm ratio (photochemical efficiency of photosystem II) was obtained at noon in plants previously kept in darkness for 30 min. This determination was performed using a closed-chamber fluorometer (FluorCam, Photon Systems Instruments, Drásov, Czech Republic) and FluorCam 6.0 software.
2.6. Environmental Monitoring
Inside the chamber, the temperature increase was programmed from 11:00 p.m. to 7:00 a.m. using an electric grill and a digital timer (HOBO®; Data Logger HOBO U12-012, GALK, Born, MA, USA). During the night, the chamber remained covered (with its roof), and during the day, from 7:00 a.m. to 7:00 p.m., it remained uncovered and the heat source was turned off.
The ambient temperature of the greenhouse and the chamber was recorded for 24 h using automated, programmable temperature meters (HOBO®; Data Logger HOBO U12-012, GALK, USA) placed inside and outside the chamber during the study.
Substrate and shoot temperatures were measured at dawn using a digital infrared thermometer (Model DT8380. OAKTON, Guelders, The Netherlands). The thermometer was held approximately 30 cm from the midsection of the plant or the substrate surface.
2.7. Statistical Analysis
Results were analyzed using ANOVA, Tukey’s multiple comparison of means test (p ≤ 0.05), and Pearson’s correlation coefficient using the R-studio 3.6.3. (RStudio Inc., Boston, MA, USA; [29]) and SigmaPlot by Jandel Scientific (version 12.0) software package.
3. Results
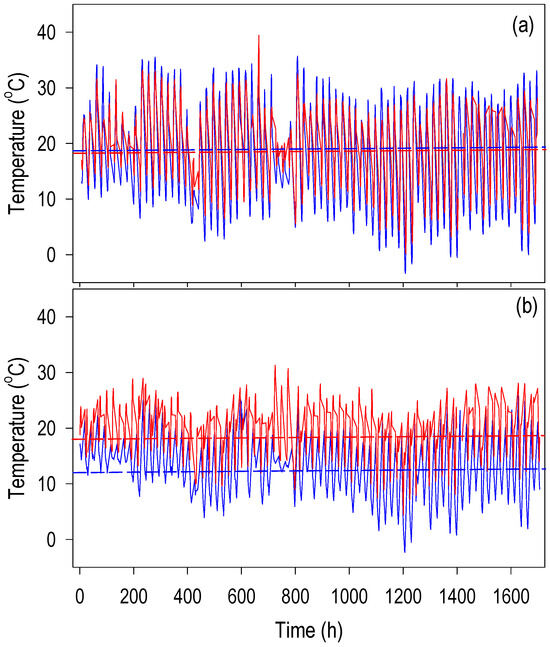
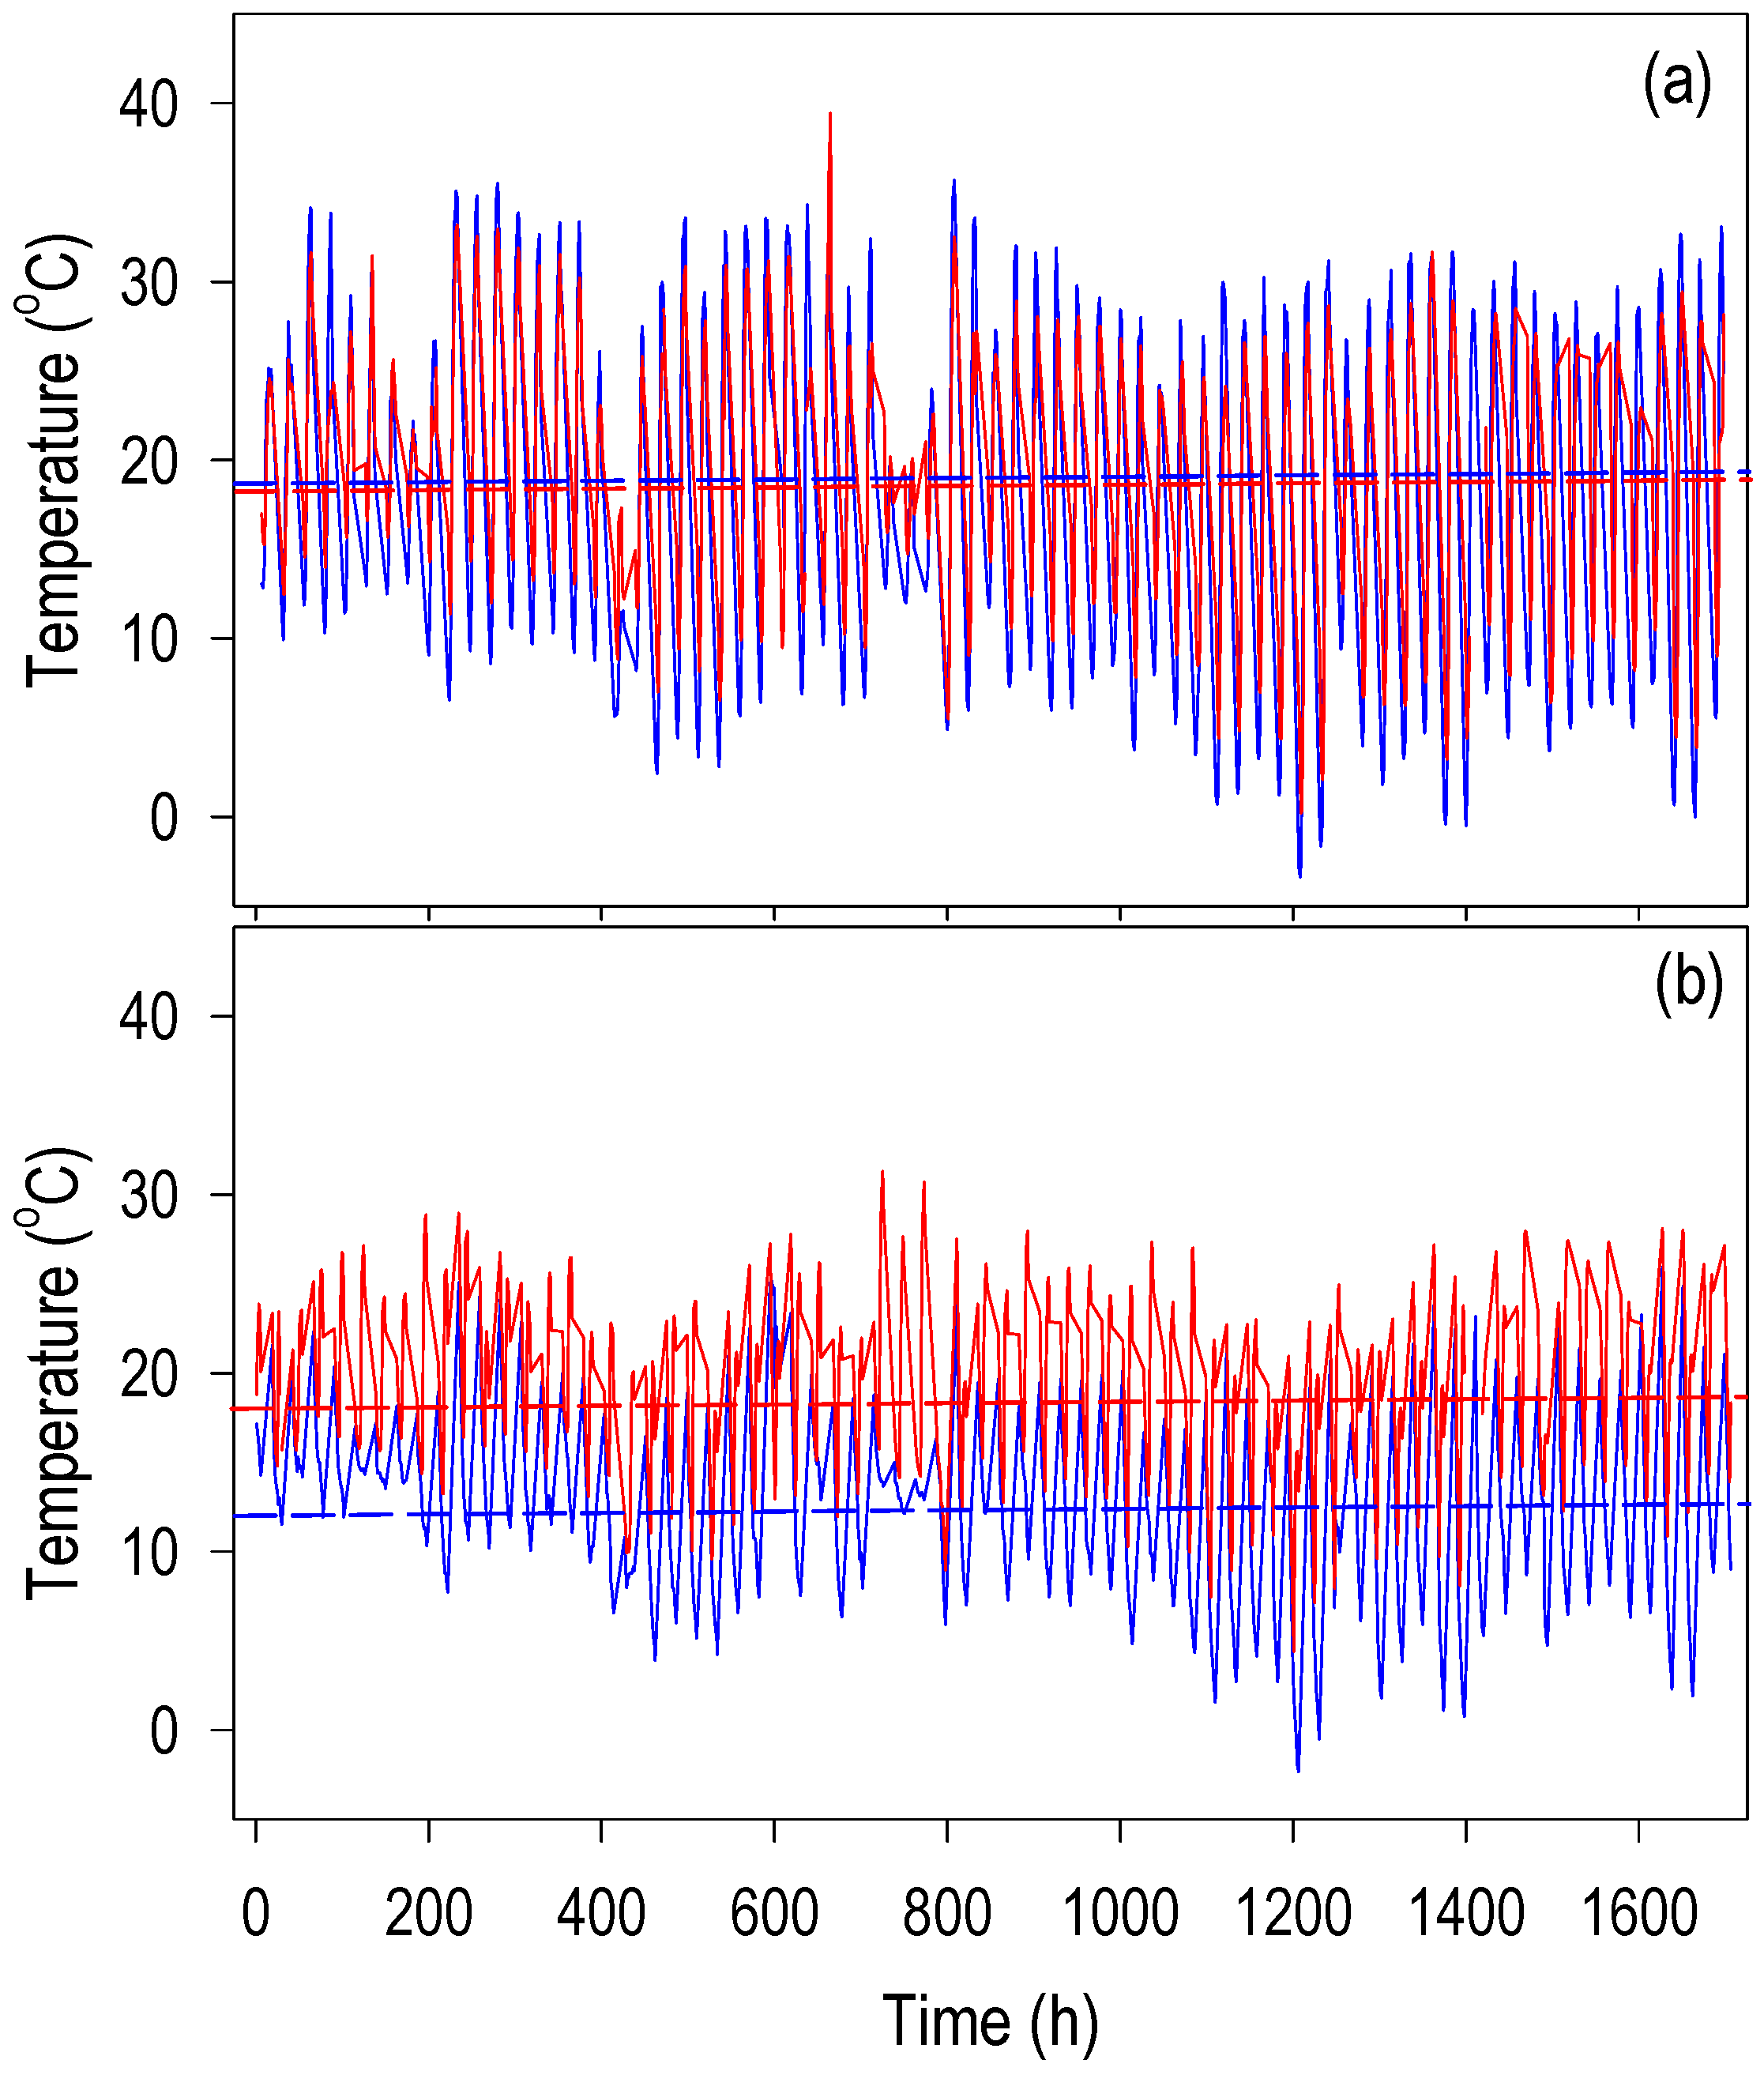
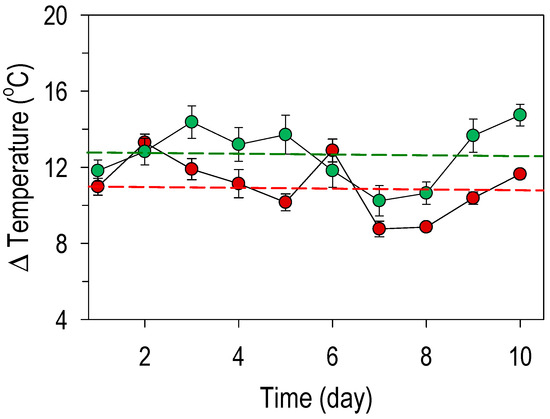
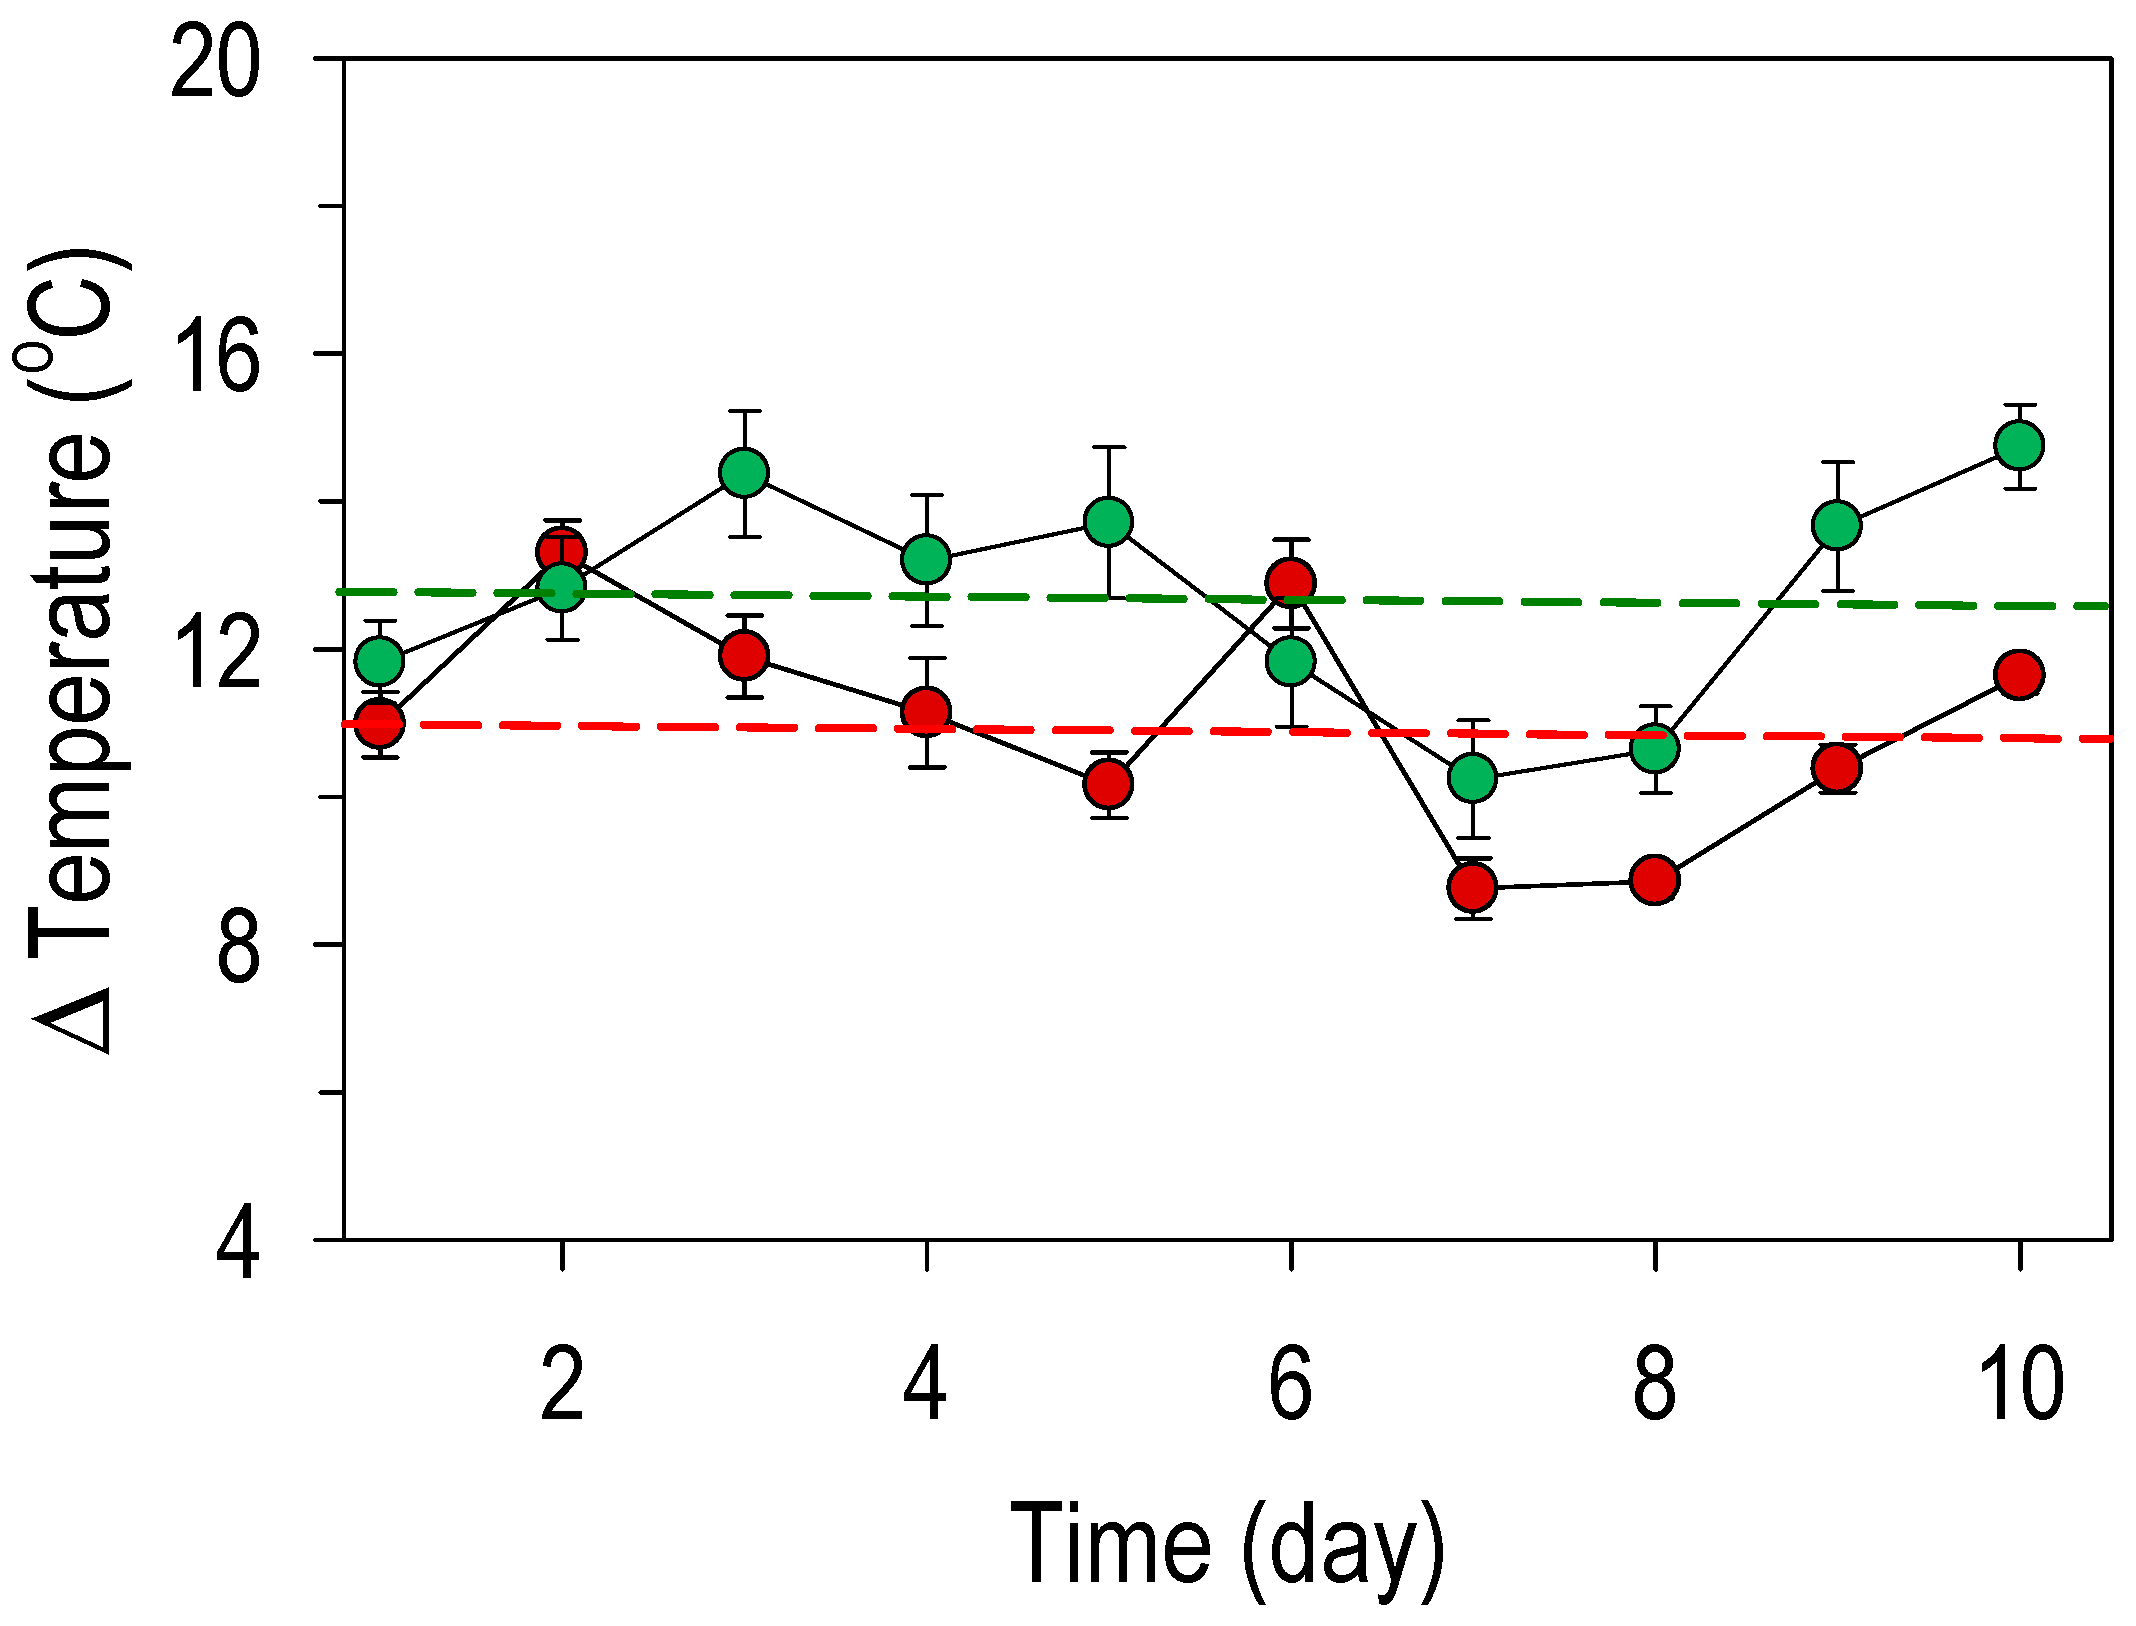
During the 70-day evaluation, daytime (7 a.m. to 7 p.m.) and nighttime (7 p.m. to 7 a.m.) temperatures in the greenhouse and the chamber with higher nighttime temperatures (HNT) followed similar patterns. Although daytime fluctuations HNT were greater in the greenhouse, the average daytime temperature was similar in both sites; however, nighttime temperatures were higher in the chamber, and the average daytime/nighttime temperature was 19.1/12.3 °C in the greenhouse and 19.1/18.9 °C in the chamber (Figure 1a,b). These values indicate that the thermoperiod was not inverted in the chamber, and plants grew, on average, with 6.6 °C HNT compared to the greenhouse. The Δ temperature at dawn indicated that in the experimental units within the chamber, the substrate and plants maintained an average of 11.0 °C and 12.7 °C, respectively, above the control (Figure 2).
Figure 1.
Daytime ambient temperature (7 a.m. to 7 p.m.) in the greenhouse (blue line) and in the chamber (red line) (a) and nighttime temperature (7 p.m. to 7 a.m.) in the greenhouse (blue line) and in the chamber with temperature increase during this time-period (red line) (b). The horizontal lines indicate the respective average temperatures.
Figure 2.
Temperature (Δ ± s.e.) of the substrate inside the chamber at high nighttime temperatures minus that of the substrate in the greenhouse (red circles) and temperature delta (Δ ± s.e.) of the plants inside the chamber minus that of the plants in the greenhouse (green circles). The horizontal lines indicate the respective average temperatures (n = 10).
Regardless of the group, plant age (sampling date) significantly affected (p ≤ 0.05) all variables evaluated, i.e., (1) plant height, (2) shoot width, (3) plant wet mass, (4) plant dry mass, (5) daytime acidity, (6) evening acidity, (7) glucose concentration, (8) fructose, (9) sucrose, (10) starch, (11) free amino acids, (12) soluble protein, (13) Fv/Fm ratio, (14) shoot temperature, and (15) substrate temperature. In contrast, temperature had a significant (p ≤ 0.05) effect only on variables (7), (13), (14), and (15); and the temperature x plant age interaction was significant (p ≤ 0.05) for variables (7), (8), (9), (13), (14), and (15) (Appendix A (Table A1)).
3.1. Plant Growth
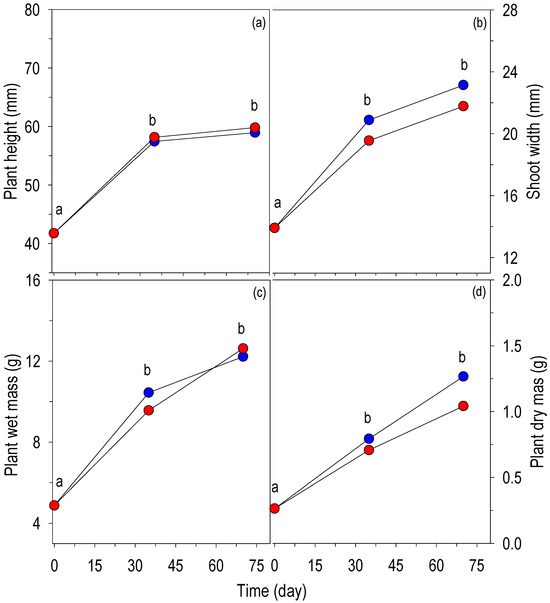
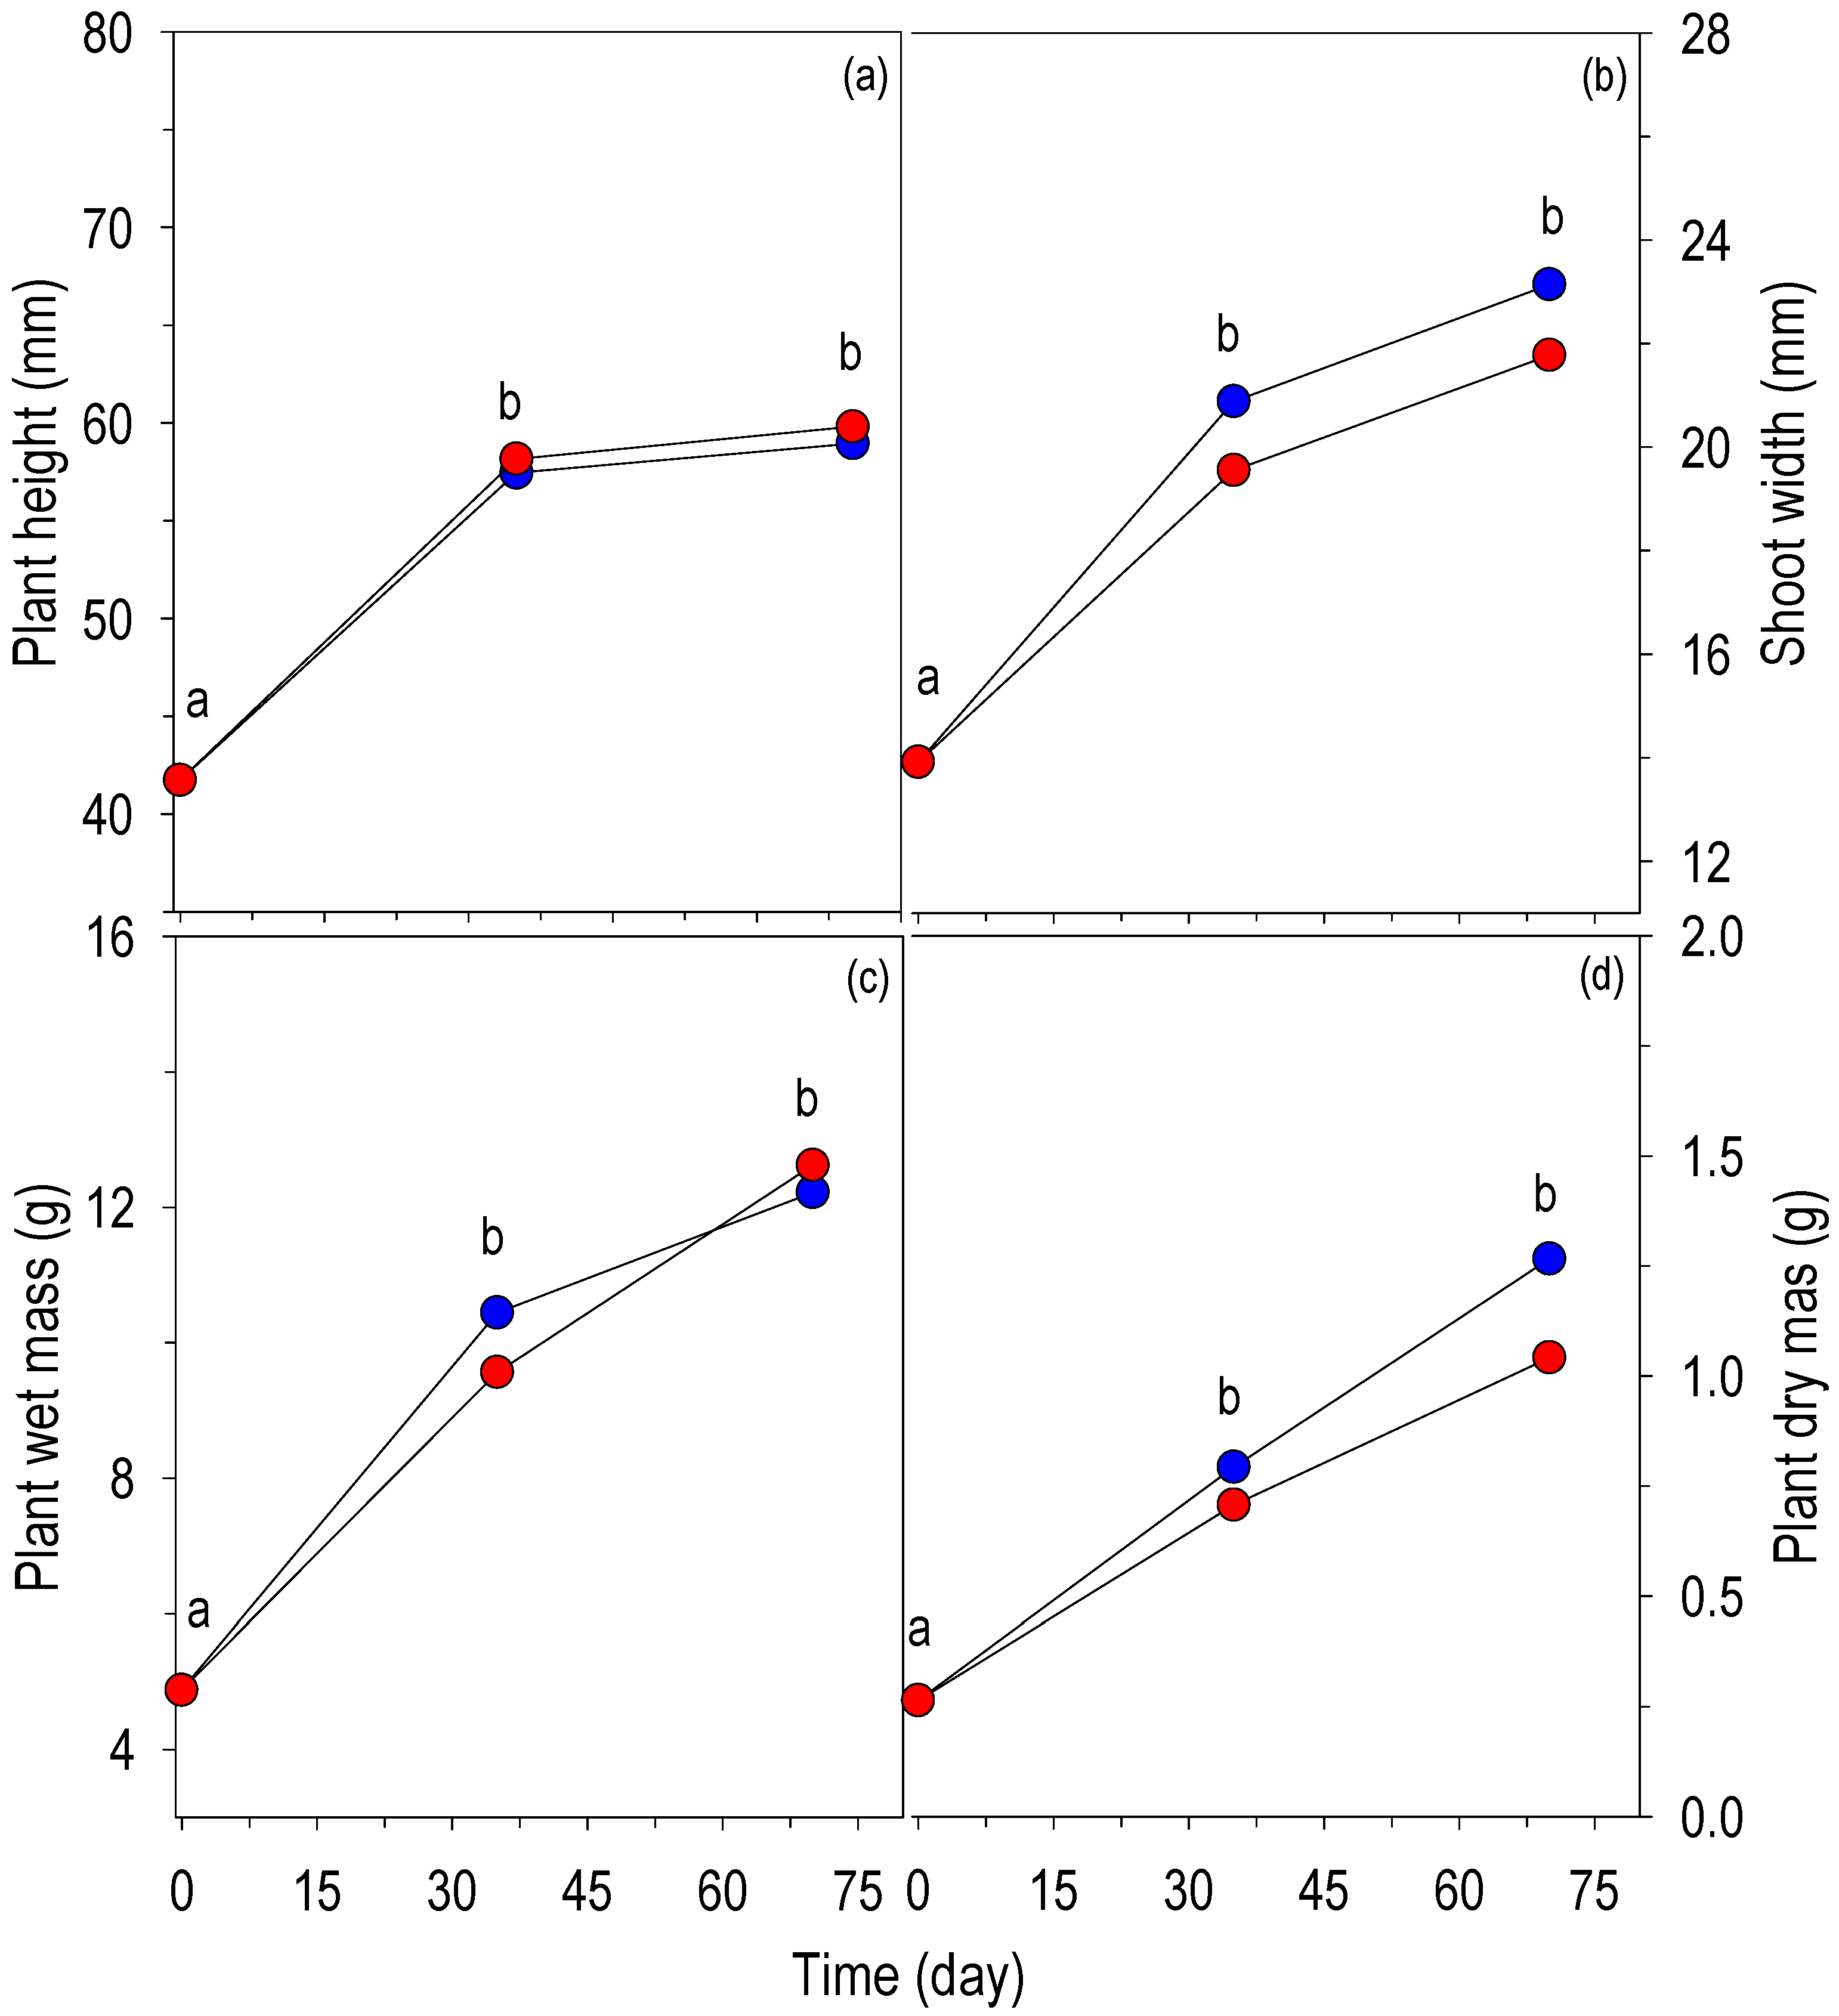
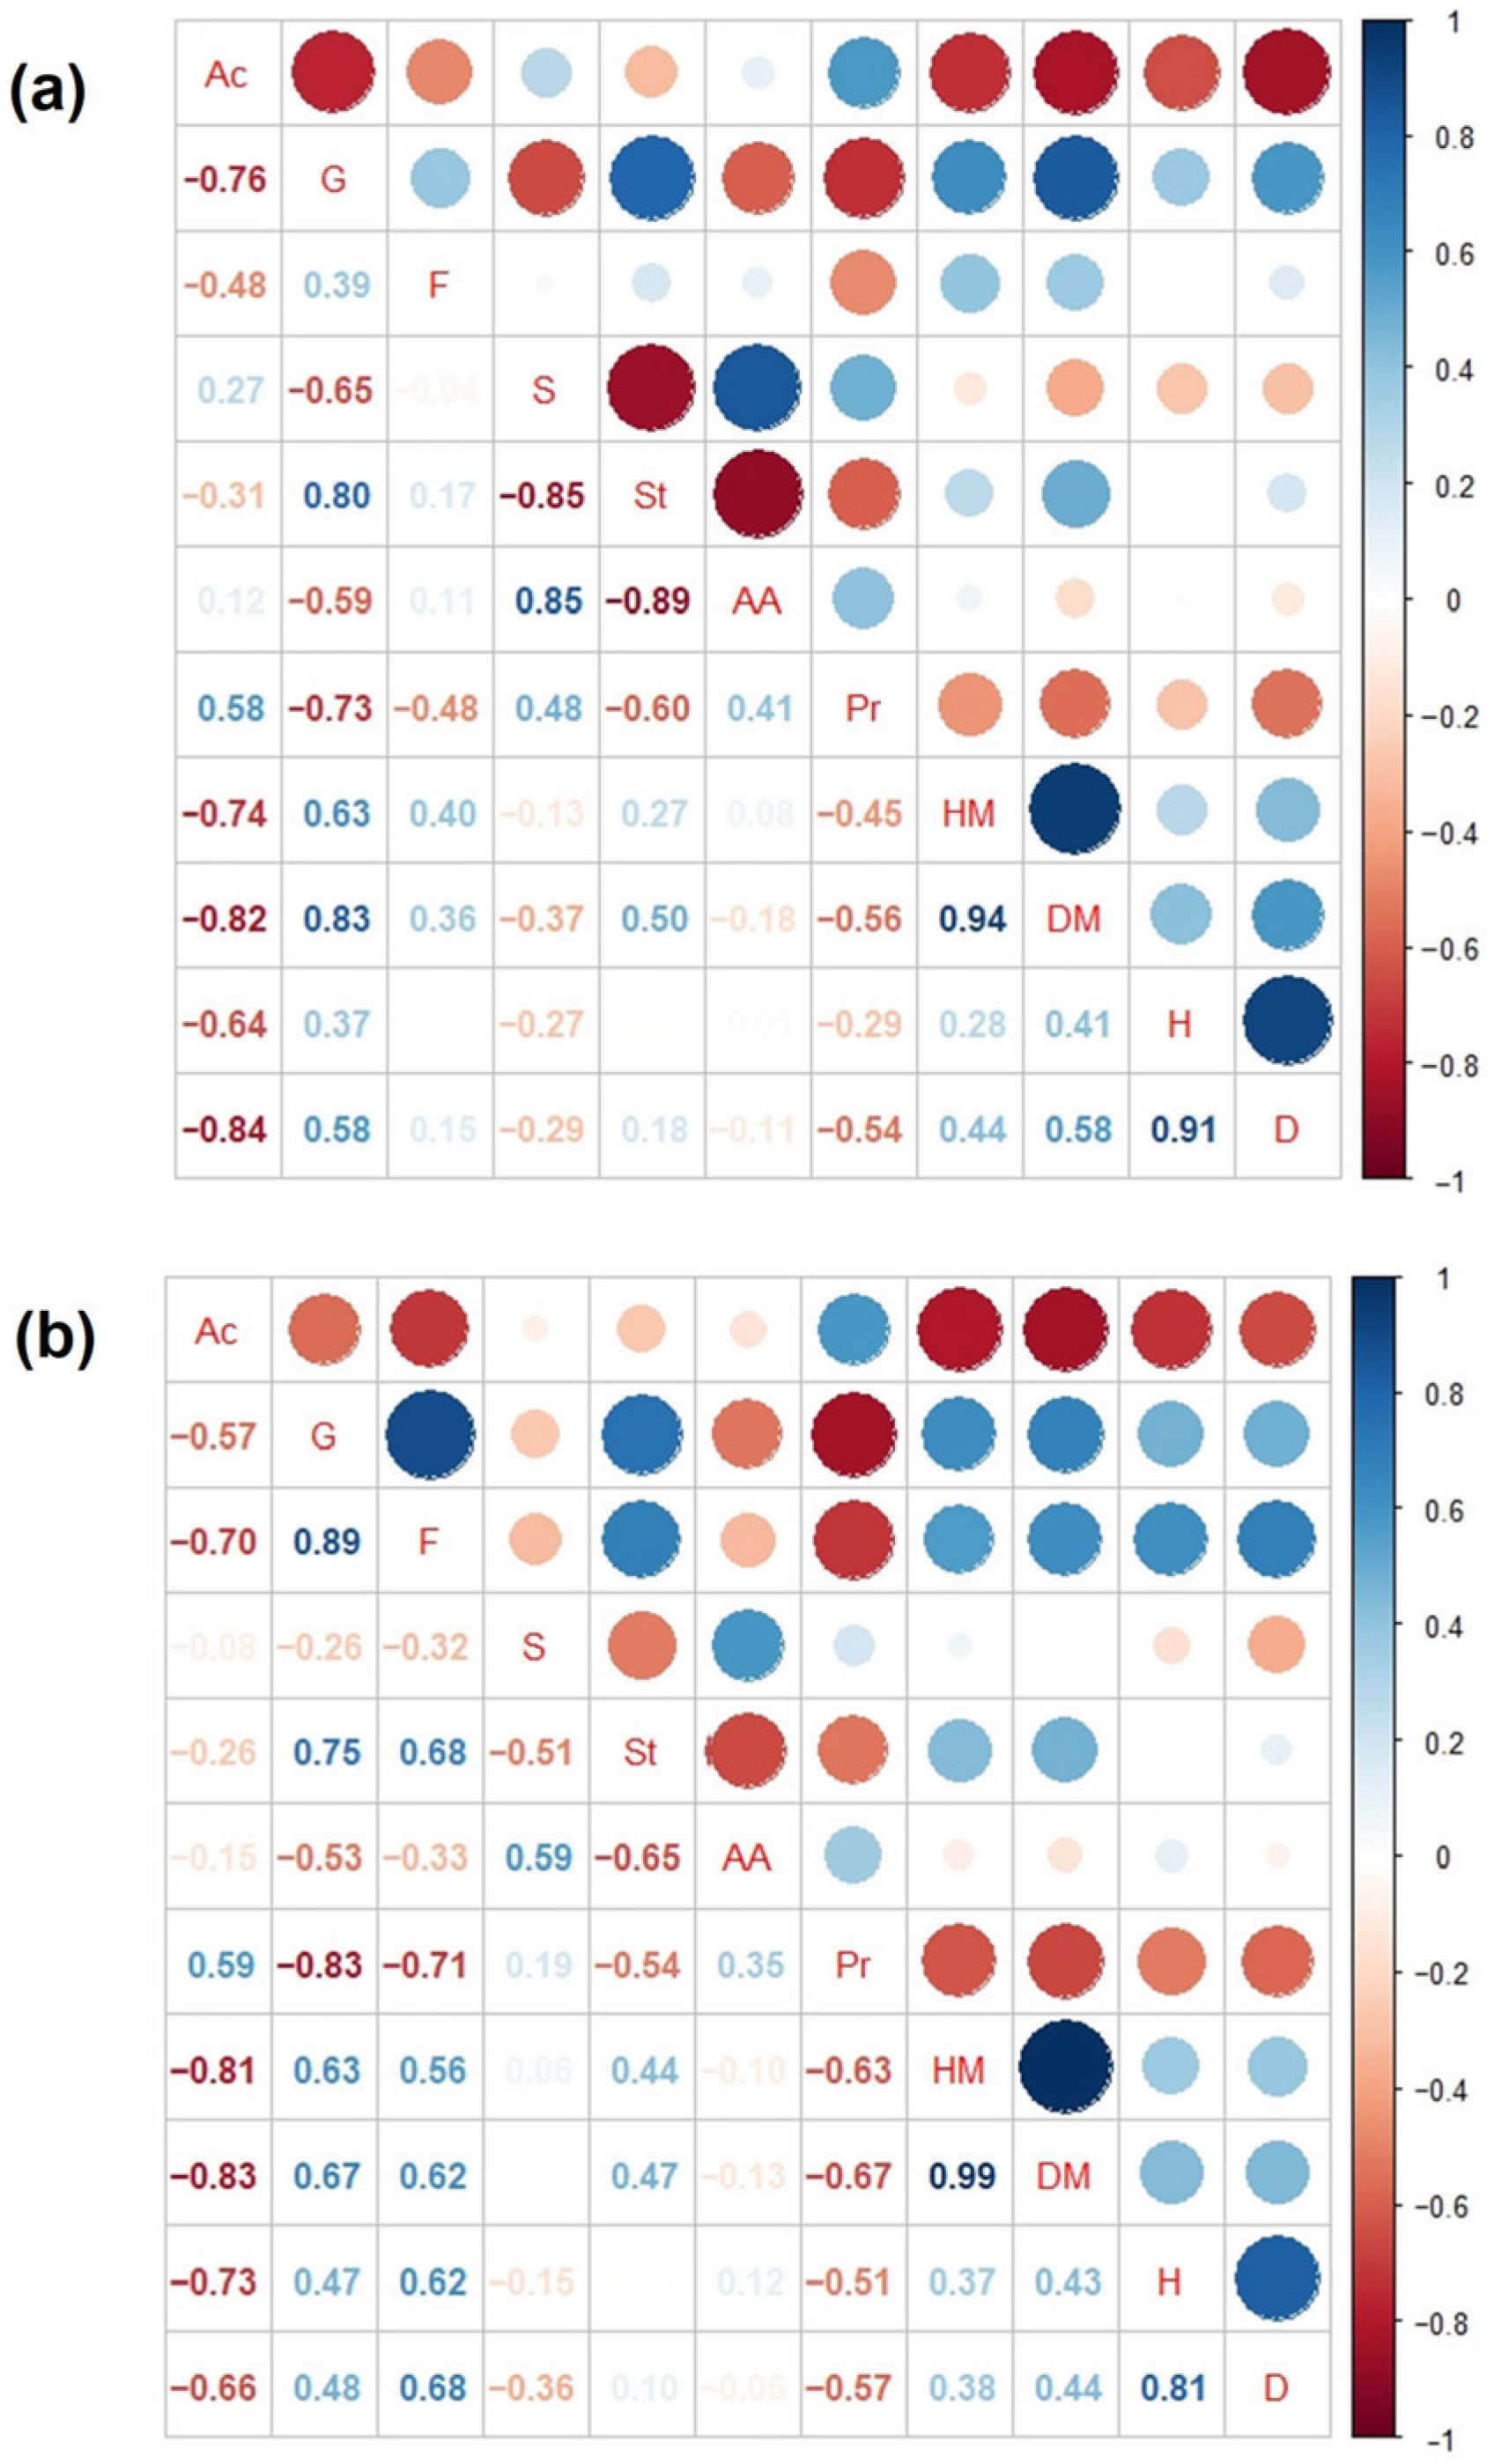
Plant growth in both treatments was evident throughout the 70-day evaluation period. During this period, height increased (p ≤ 0.05) from 42 to 60 cm; however, the increase was not significant (p > 0.05) between 125 and 160 days of age. Plant height did not change due to the effect of HNT compared to control plants during these 70 days (Figure 3a). The correlation between plant height in the control treatment and acidity was strongly negative. In contrast, the height of plants in the HNT treatment, in addition to its strong negative correlation with acidity and soluble protein concentration, also correlated positively with glucose and fructose concentrations (Figure 4a,b).
Figure 3.
Plant height (a), stem width (b), wet matter (c) and dry matter (d) of Opuntia spp. plants at 90, 125 and 170 days of age (assessment at initial time and after 35 and 70 days), in a greenhouse (blue circles) and inside a chamber with induced night heat (red circles). Values followed by different letters between treatments and dates, in each variable, are significantly different (p ≤ 0.05). Different letters on the values of each variable are significantly different (p ≤ 0.05) among plant ages and treatments.
Figure 4.
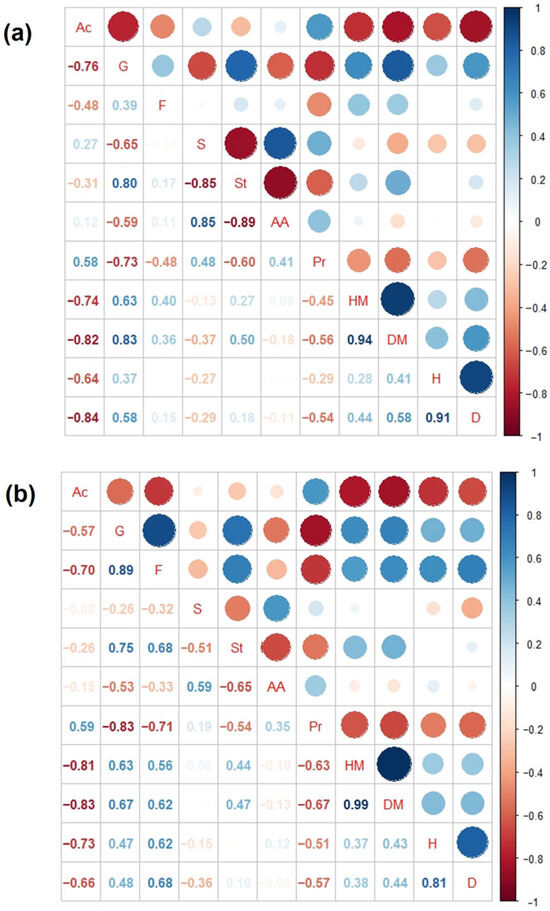
Pearson correlation matrix of physiological and growth variables of Opuntia plants (a) in a greenhouse (19.1:12.3 °C) or (b) in a chamber with an increase in night temperature (19.1/18.9 °C). Ac: Δ of acidity, G: glucose, F: fructose, S: sucrose, St: starch, AA: amino acids, Pr: soluble protein, HM: wet mass, DM: dry mass, H: height, and D: width.
Shoot width increased significantly (p ≤ 0.05) in both treatments during the 70-day evaluation. The greatest increase was observed between 90 and 125 days of plant age; this corresponded to 50% of the initial value in the control and 40% in the HNT treatment; in the following 35 days, the increase represented between 56 and 66% compared to the initial value, with no significant differences between treatments (Figure 3b). In the control, shoot width correlated positively or negatively with Δ acidity, glucose and soluble protein concentrations, and wet and dry matter and plant height (Figure 4a). The shoot width with HNT correlated significantly with the same variables as the control and positively with fructose concentration (Figure 4b).
The wet matter of plants in both treatments increased, on average, from 5 to 12.5 g over the 70-day evaluation period; although the increase was continuous, the greatest weight gain occurred during the first 35 days. HNT during 35 and 70 days did not affect plant wet matter compared to the control (Figure 3c). In control plants the correlations between wet matter and glucose concentration was significant and weak with fructose and its correlation was significant and negative with Δ acidity and weakly with protein concentration (Figure 4a). The correlation of wet matter of plants with HNT was significant and positive within glucose, fructose and starch addition it correlated negatively with Δ acidity and starch concentration (Figure 4b).
Plant dry matter increased linearly over the 70-day evaluation period in both treatments. Although HNT tended to decrease more than 19% dry matter relative to the control, the difference was not significant (Figure 3d). The dry matter of the control correlated significantly and directly with wet matter and glucose and starch concentrations, and with fructose concentration; also correlated inversely with Δ acidity and protein concentrations and weakly with sucrose (Figure 4a). The dry matter of HNT plants correlated significantly and directly with wet matter, glucose, fructose and starch concentration and its correlation was negative with Δ acidity and protein concentration (Figure 4b).
3.2. Acidity
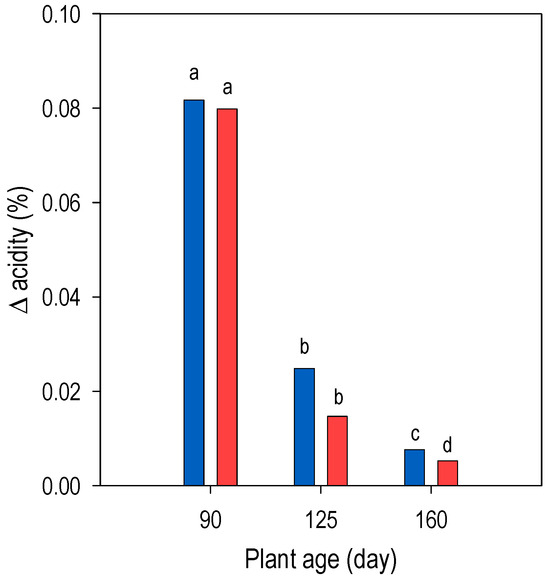
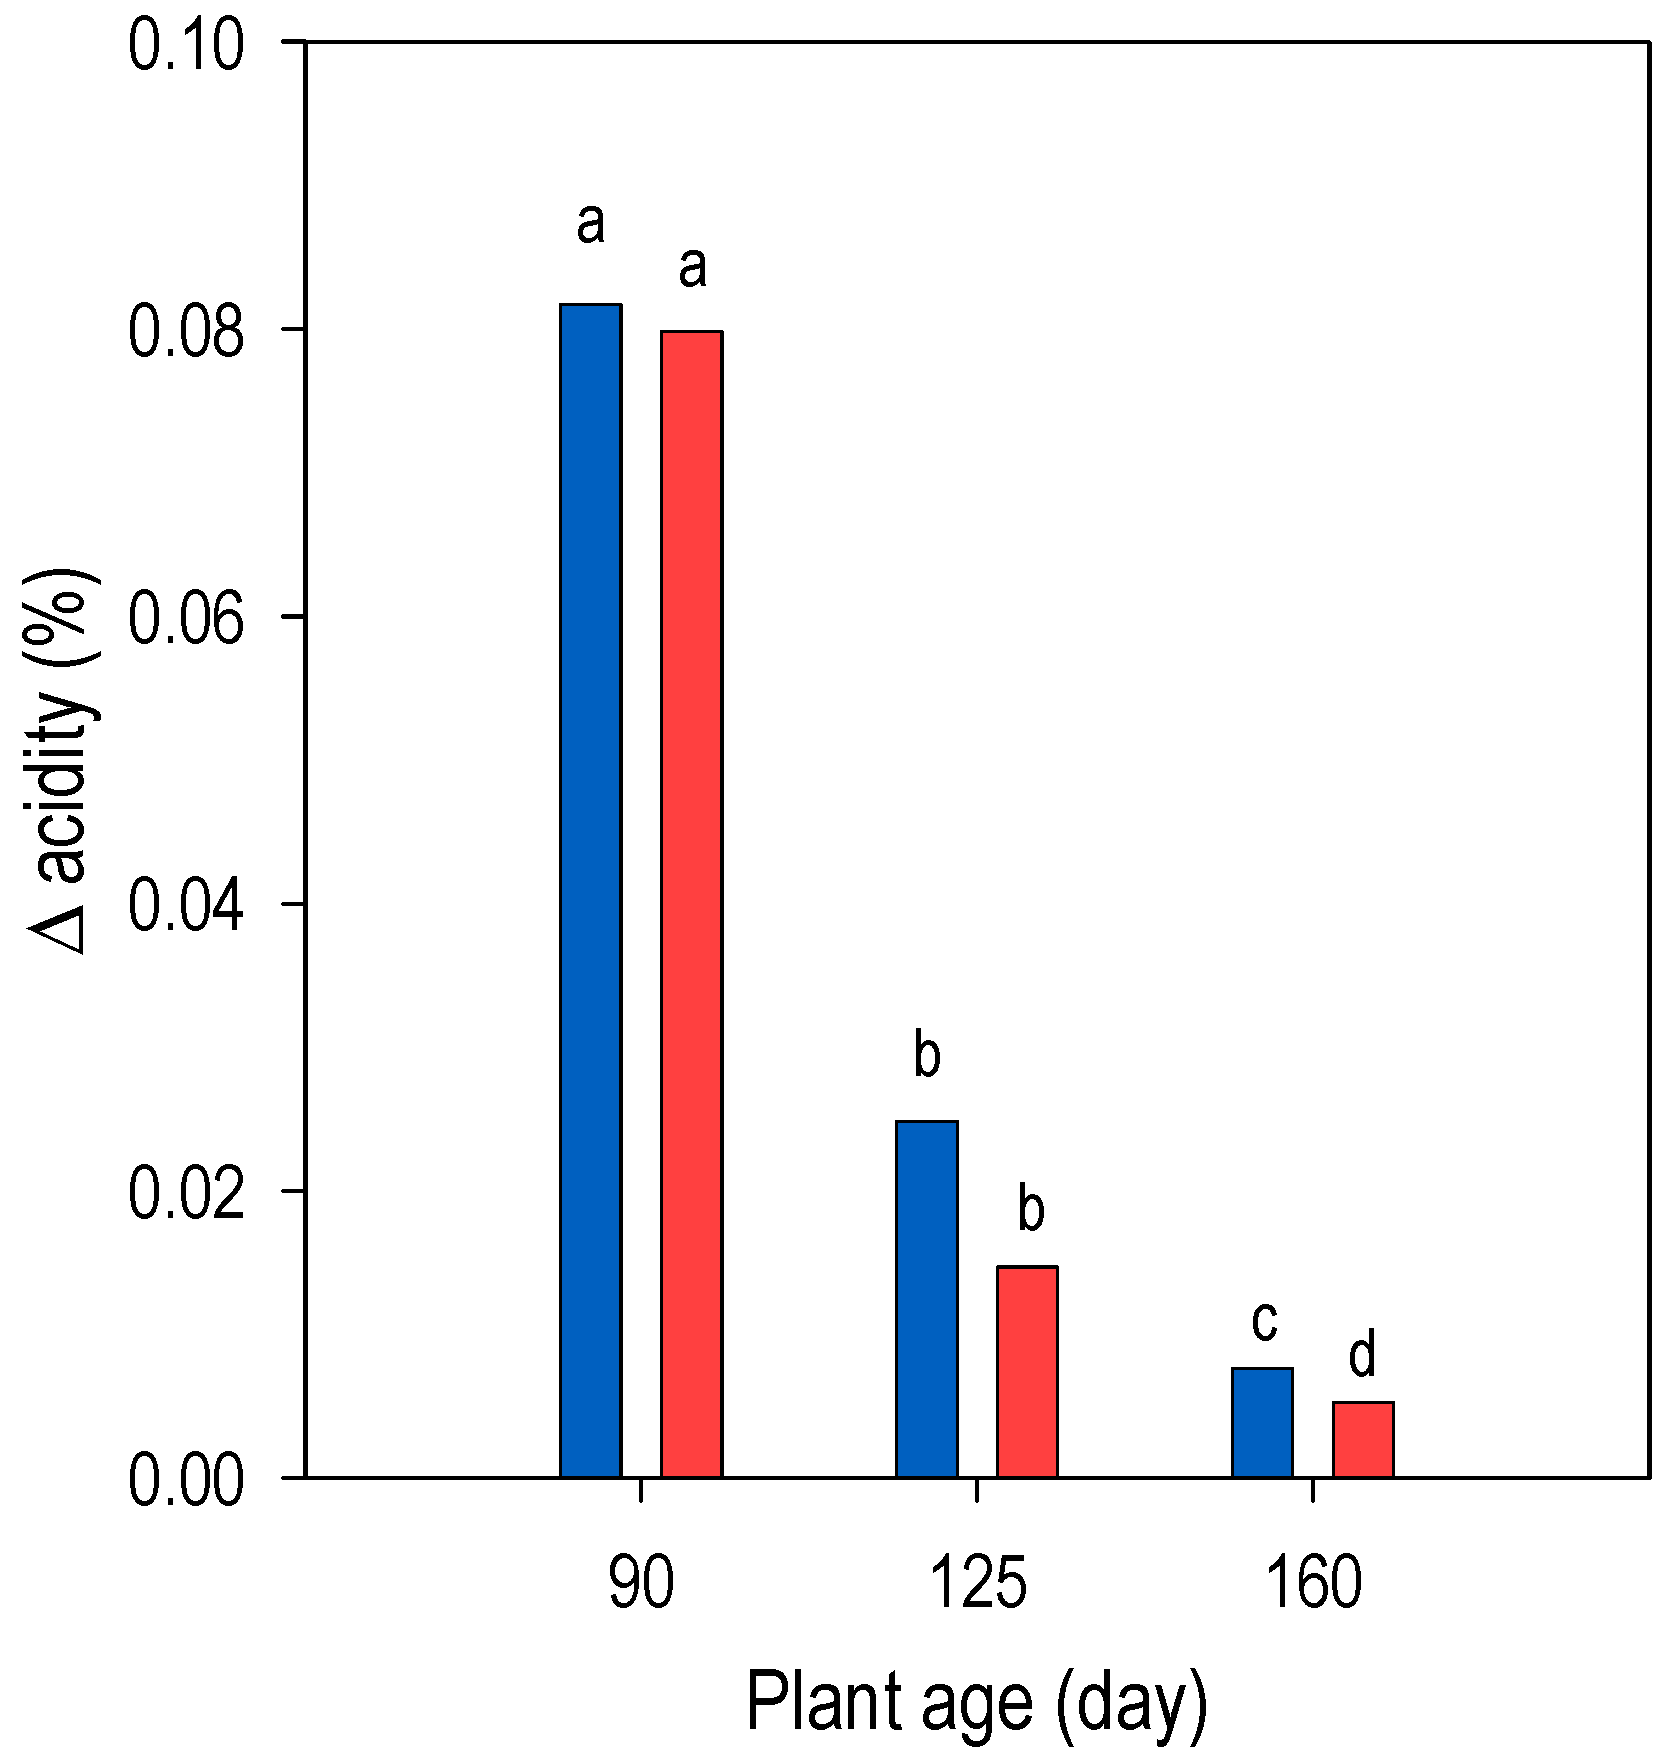
The acidity at the end of phase I decrease significantly (p ≤ 0.05) with plant age (on average from 0.095 to 0.0114%) in both treatments without significant differences (p > 0.05) between these. A similar trend was observed in phase III; however, acidity at the end of phase I amounted three to ten times more than phase III. To know the net acid production in plants the Δ acidity (end of phase I minus phase III) was calculated; it decreased significantly with plant age. The differences in Δ acidity between 125- and 160-day-old plants from the HNT treatment decreased (p > 0.05) by an average of 39% compared to the control (Figure 5).
Figure 5.
Δ acidity (end of phase I minus phase III) of Opuntia spp. plants with 90, 125 y 160 days of age in greenhouse (blue bars; 19.1/12.3 °C) or in a chamber with high increased night-time temperature (red bars; 19.1/18.9 °C). Different letters on the values of the variable are significantly different (p ≤ 0.05) among plant ages and treatments.
3.3. Soluble Sugars
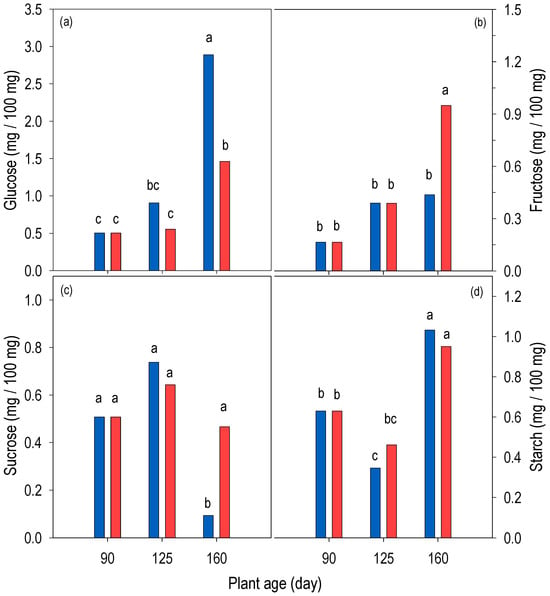
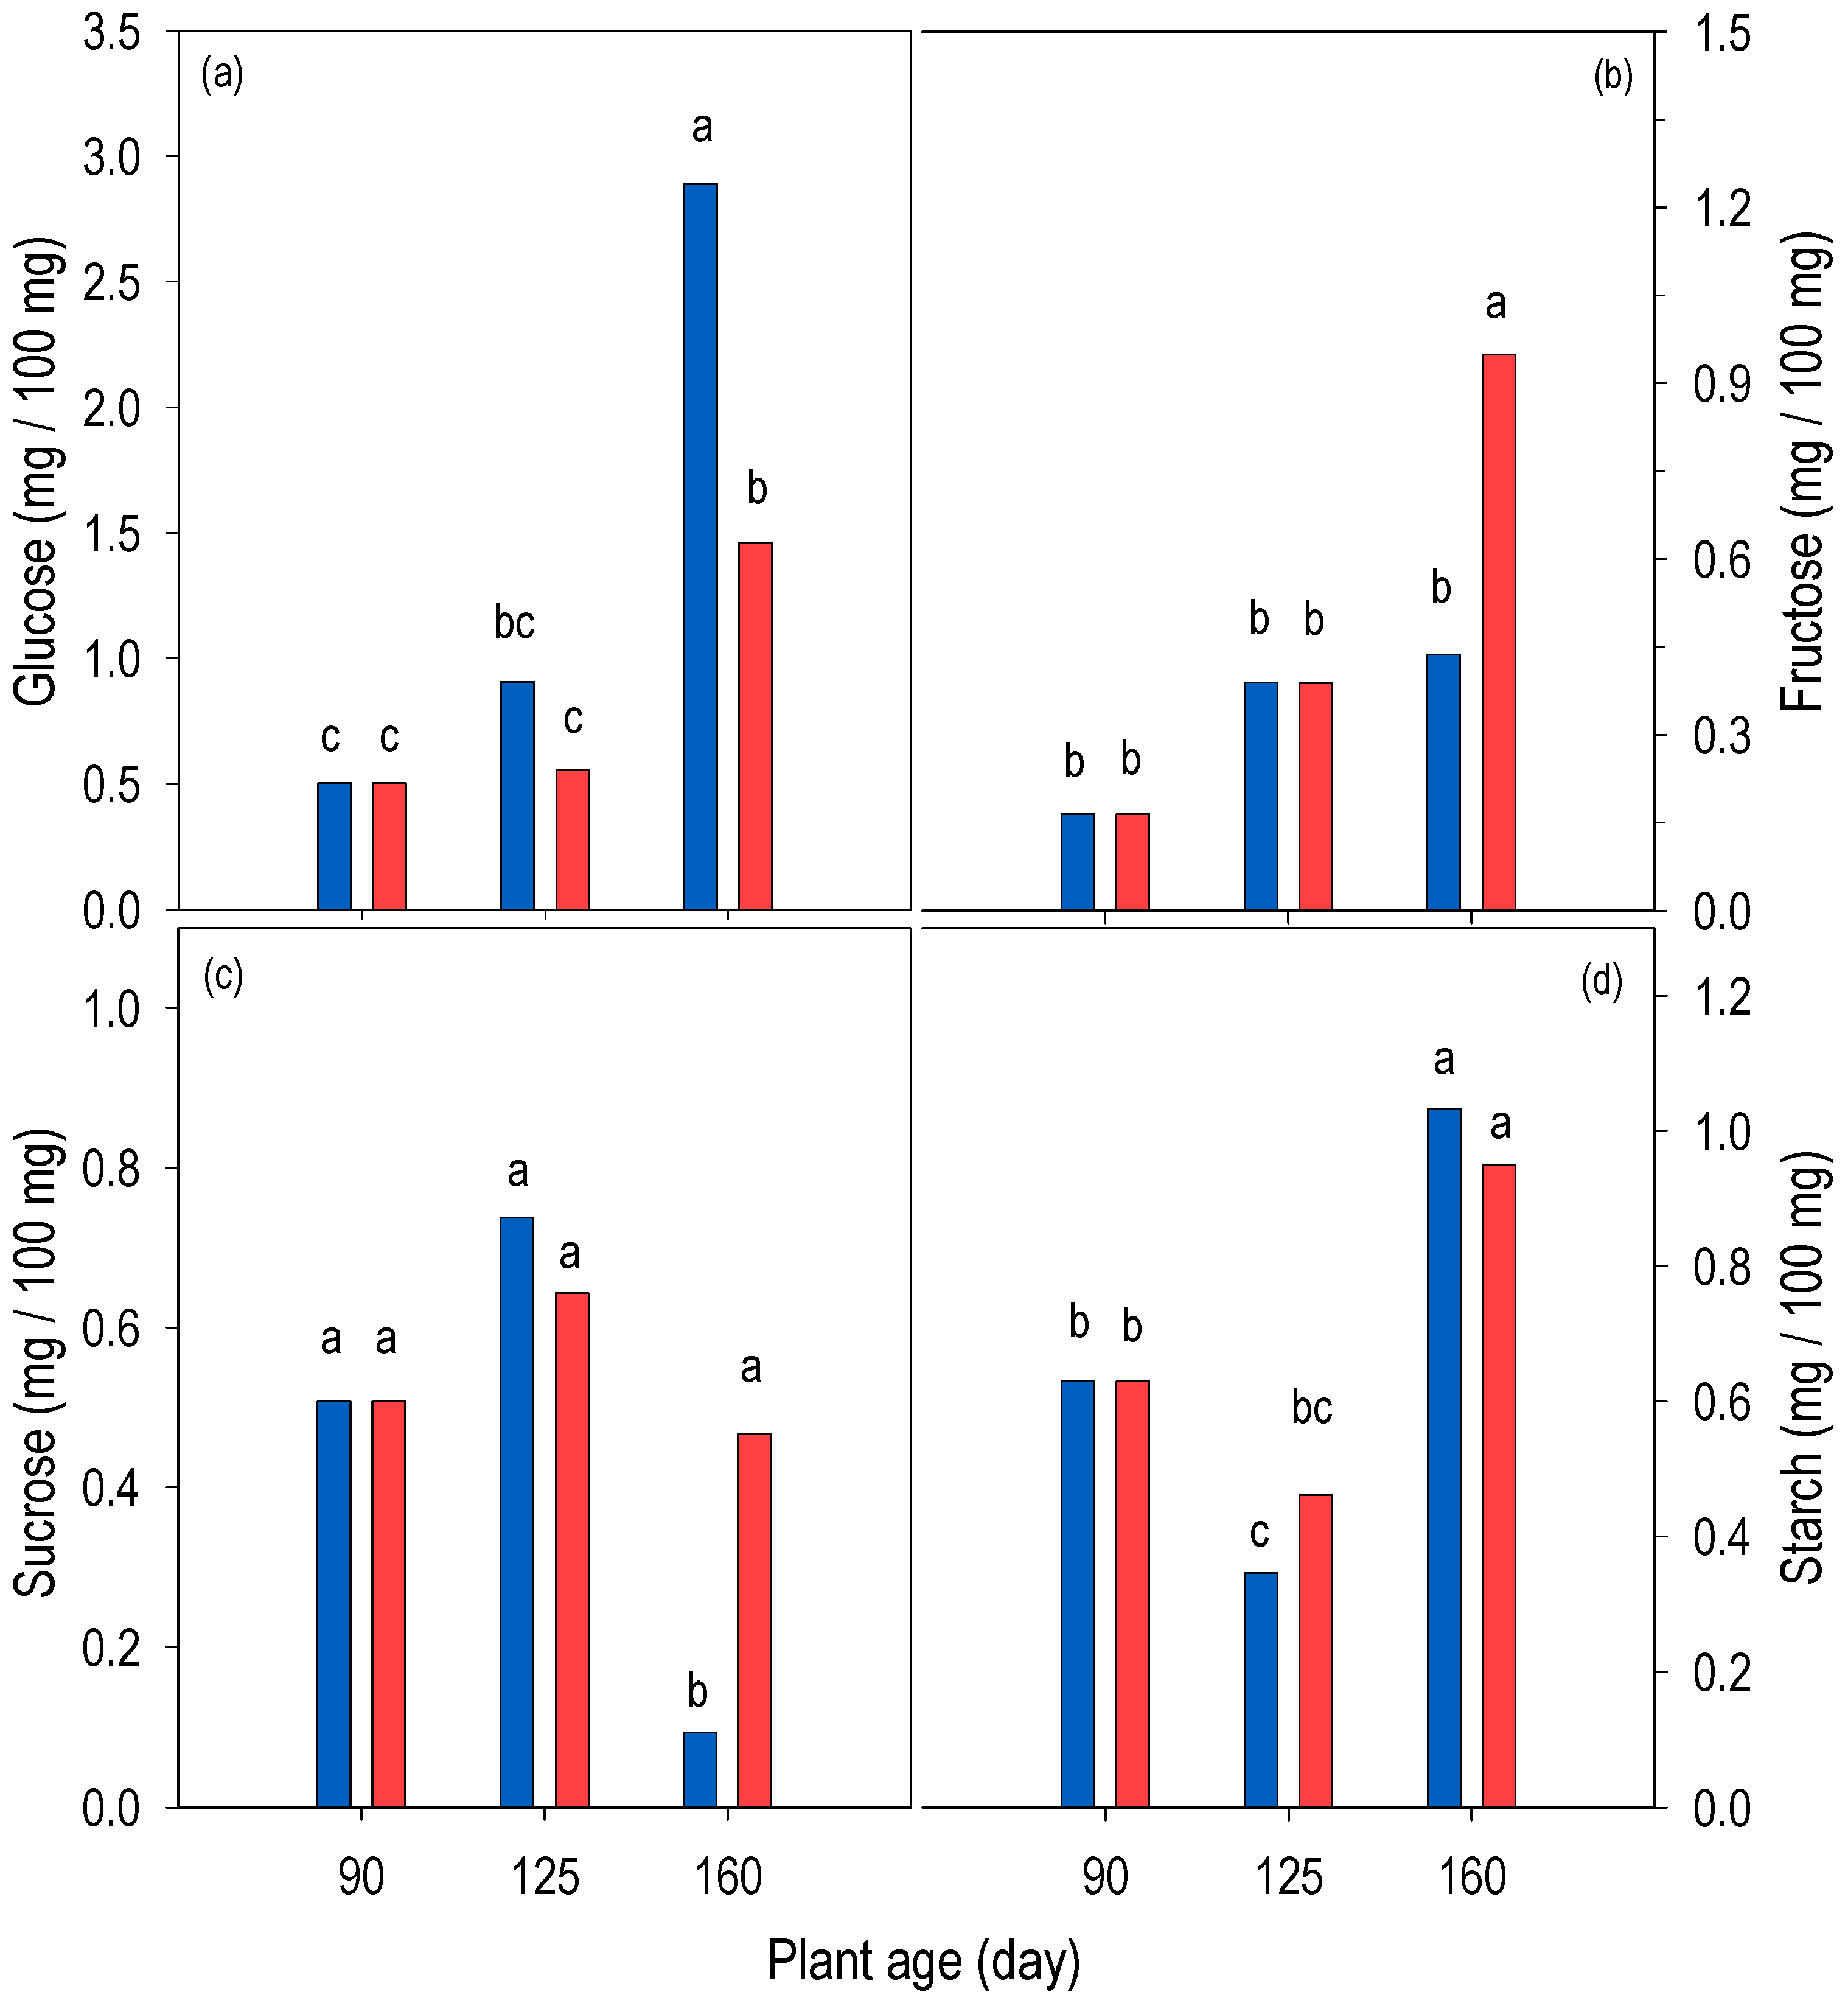
The plants accumulated glucose with increasing age. The increase in the 160-day-old control represented about five times the concentration in 90-day-old plants. In plants with HNT glucose concentration increased only at 160 days of age and was about 50% less than in the control plants (Figure 6a). Glucose concentration correlated significantly and negatively with Δ acidity in the control (Figure 4a); the correlation between these both variables, although significant, was weak in the plants with HNT (Figure 4b).
Figure 6.
Concentration of (a) glucose, (b) fructose, (c) sucrose and (d) starch at dawn (end of CAM phase I) of Opuntia spp. plants in a greenhouse (blue bars; 19.1/12.3 °C) or in a chamber with increased night-time temperature (red bars; 19.1/18.9 °C). Values of each variable with different lowercase letters are significantly different (p ≤ 0.05), based on Tukey’s HSD test, among plant ages and treatments (n = 7).
The increase in fructose concentration between the ages of the control plants was not significant. In contrast, the concentration of this monosaccharide increased (p ≤ 0.05) nearly fivefold after 70 days of HNT in 160-day-old plants compared to 90-day-old plants. Therefore, the difference in fructose concentration between treatments was significant only in 160-day-old plants; plants in the HNT treatment doubled (p ≤ 0.05) the fructose concentration compared to control of the same age (Figure 6b). Fructose concentration correlated significantly with HNT, and both negatively and positively, with Δ acidity and glucose concentration, respectively (Figure 4b).
Changes in sucrose concentration between 90- and 125-day-old plants were not significant (p > 0.05), regardless of night temperature. But, sucrose concentration decreased significantly (more than 90%) in the control with increasing age from 125 to 160 days. Because of this decrease, the difference in sucrose concentration in 160-day-old plants, due to the HNT, was six times greater (p ≤ 0.05) than in control plants of the same age (Figure 6c). The correlation between sucrose and glucose concentration was significant and negative only in plants from the control treatment (Figure 4a,b).
3.4. Starch
Starch concentration fluctuated without a unique pattern with plant age in both treatments. In the control, a nearly 50% decrease in starch concentration from 90 to 125 days of age was followed by a significant (p ≤ 0.05) more than threefold increase at 160 days of age. At HNT the decrease in starch concentration from 90 to 125 days of age represented one-third of the original concentration, but this decrease was not significant (p > 0.05) compared to 90 days of age. In the following 35 days HNT significantly increased starch concentration, nearly twofold, compared to 125-day-old plants. Changes in starch concentration due to HNT were not significant compared to the control. Although after the first 35 days HNT increased the polysaccharide concentration by 20% compared to the control, this increase was not significant, and after 70 days of this treatment, the concentrations tended to equalize (Figure 6d). Starch concentration in the control plants correlated significantly, both positively and negatively, with glucose and sucrose concentrations, respectively (Figure 4a). HNT partially modified the correlations, as it remained significant and positive with glucose, but the negative correlation with sucrose weakened; furthermore, the positive relationship with fructose was significant (Figure 4b).
3.5. Free Amino Acids
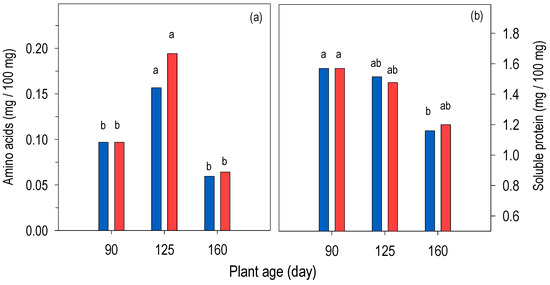
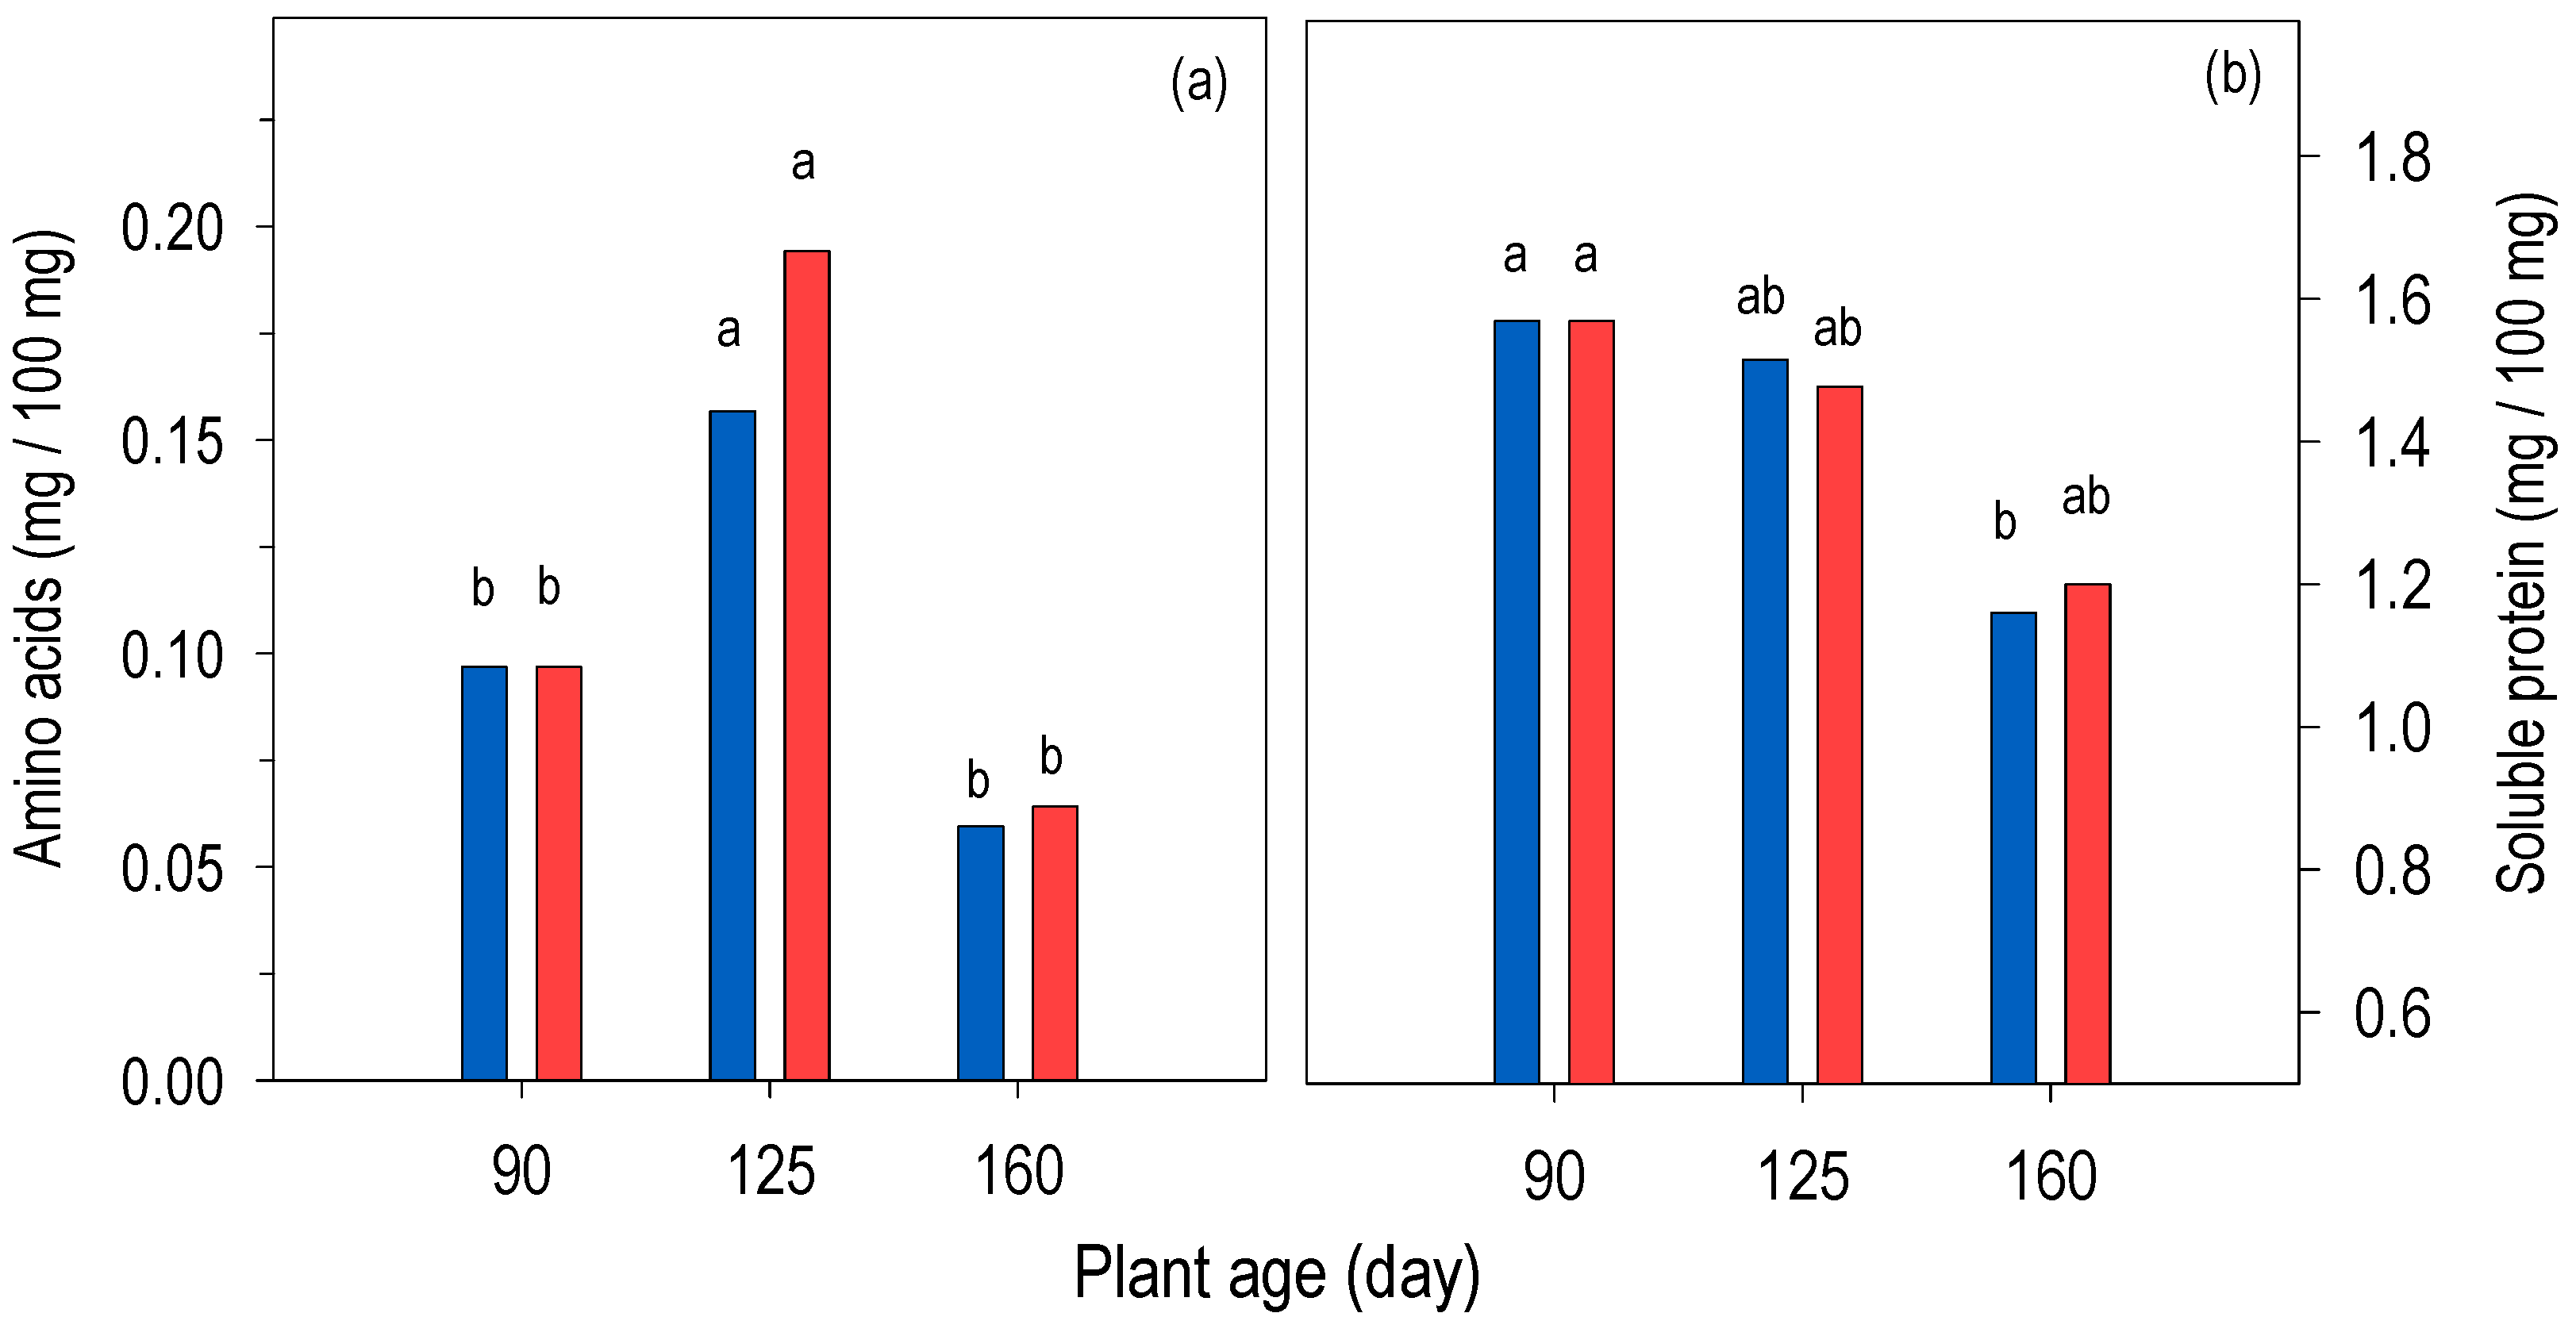
The concentration of free amino acids changed significantly with plant age in both treatments; in both, the highest concentrations corresponded to 125 days of age and the lowest to 160 days of age (p ≤ 0.05). In the control, free amino acids increased by 61% over the 90- to 125-day growth period; in contrast, at the next interval, from 125 to 160 days of age, the concentration decreased by 90% (p ≤ 0.05). At HNT, changes in free amino acid concentration, although greater, followed the same trend as in the control (p ≤ 0.05); from 90 to 125 days of age, the concentration almost doubled compared to the initial concentration; in contrast, another 35 days of nighttime heat (160-day-old plants) decreased the concentration by about two-thirds compared to 125-day-old plants. HNT after 35 or 70 days did not modify (p > 0.05) the free amino acid concentration compared to the control plants (Figure 7a). The concentration of free amino acids in the control correlated negatively and significantly with glucose and starch concentrations and positively with sucrose (Figure 4a). At HNT the correlation of free amino acid concentrations, as in the control, was negatively and significantly with glucose and starch and positively with sucrose, although in this case it was weak (Figure 4a,b).
Figure 7.
(a) Concentration of free amino acids and (b) soluble protein at dawn (end of CAM phase I) of Opuntia spp. plants grown in a greenhouse (blue bars; 19.1:12.3 °C) or in a chamber with increased night-time temperature (red bars; 19.1/18.9 °C). Values of each variable with different lowercase letters are significantly different (p ≤ 0.05), based on Tukey’s HSD test, among plant ages and treatments (n = 7).
3.6. Soluble Protein
Soluble protein concentration decreased (p ≤ 0.05) with increasing plant age in both treatments; however, the decrease was significant only in the control (Figure 7b). In the control plants, the correlation of soluble protein concentration was significant and positive with Δ of acidity, sucrose and amino acids concentrations, although the latter were moderate, and the correlation with glucose, fructose, and starch concentrations was negative (Figure 4a). The correlations changed partially due to the effect of HNT, since the correlation of soluble protein concentration with amino acid was very weak and it was not significant with sucrose (Figure 4b).
3.7. Maximum Quantum Efficiency of Photosystem II
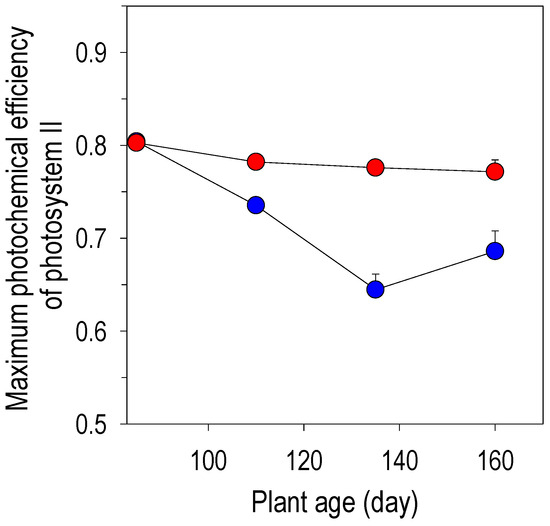
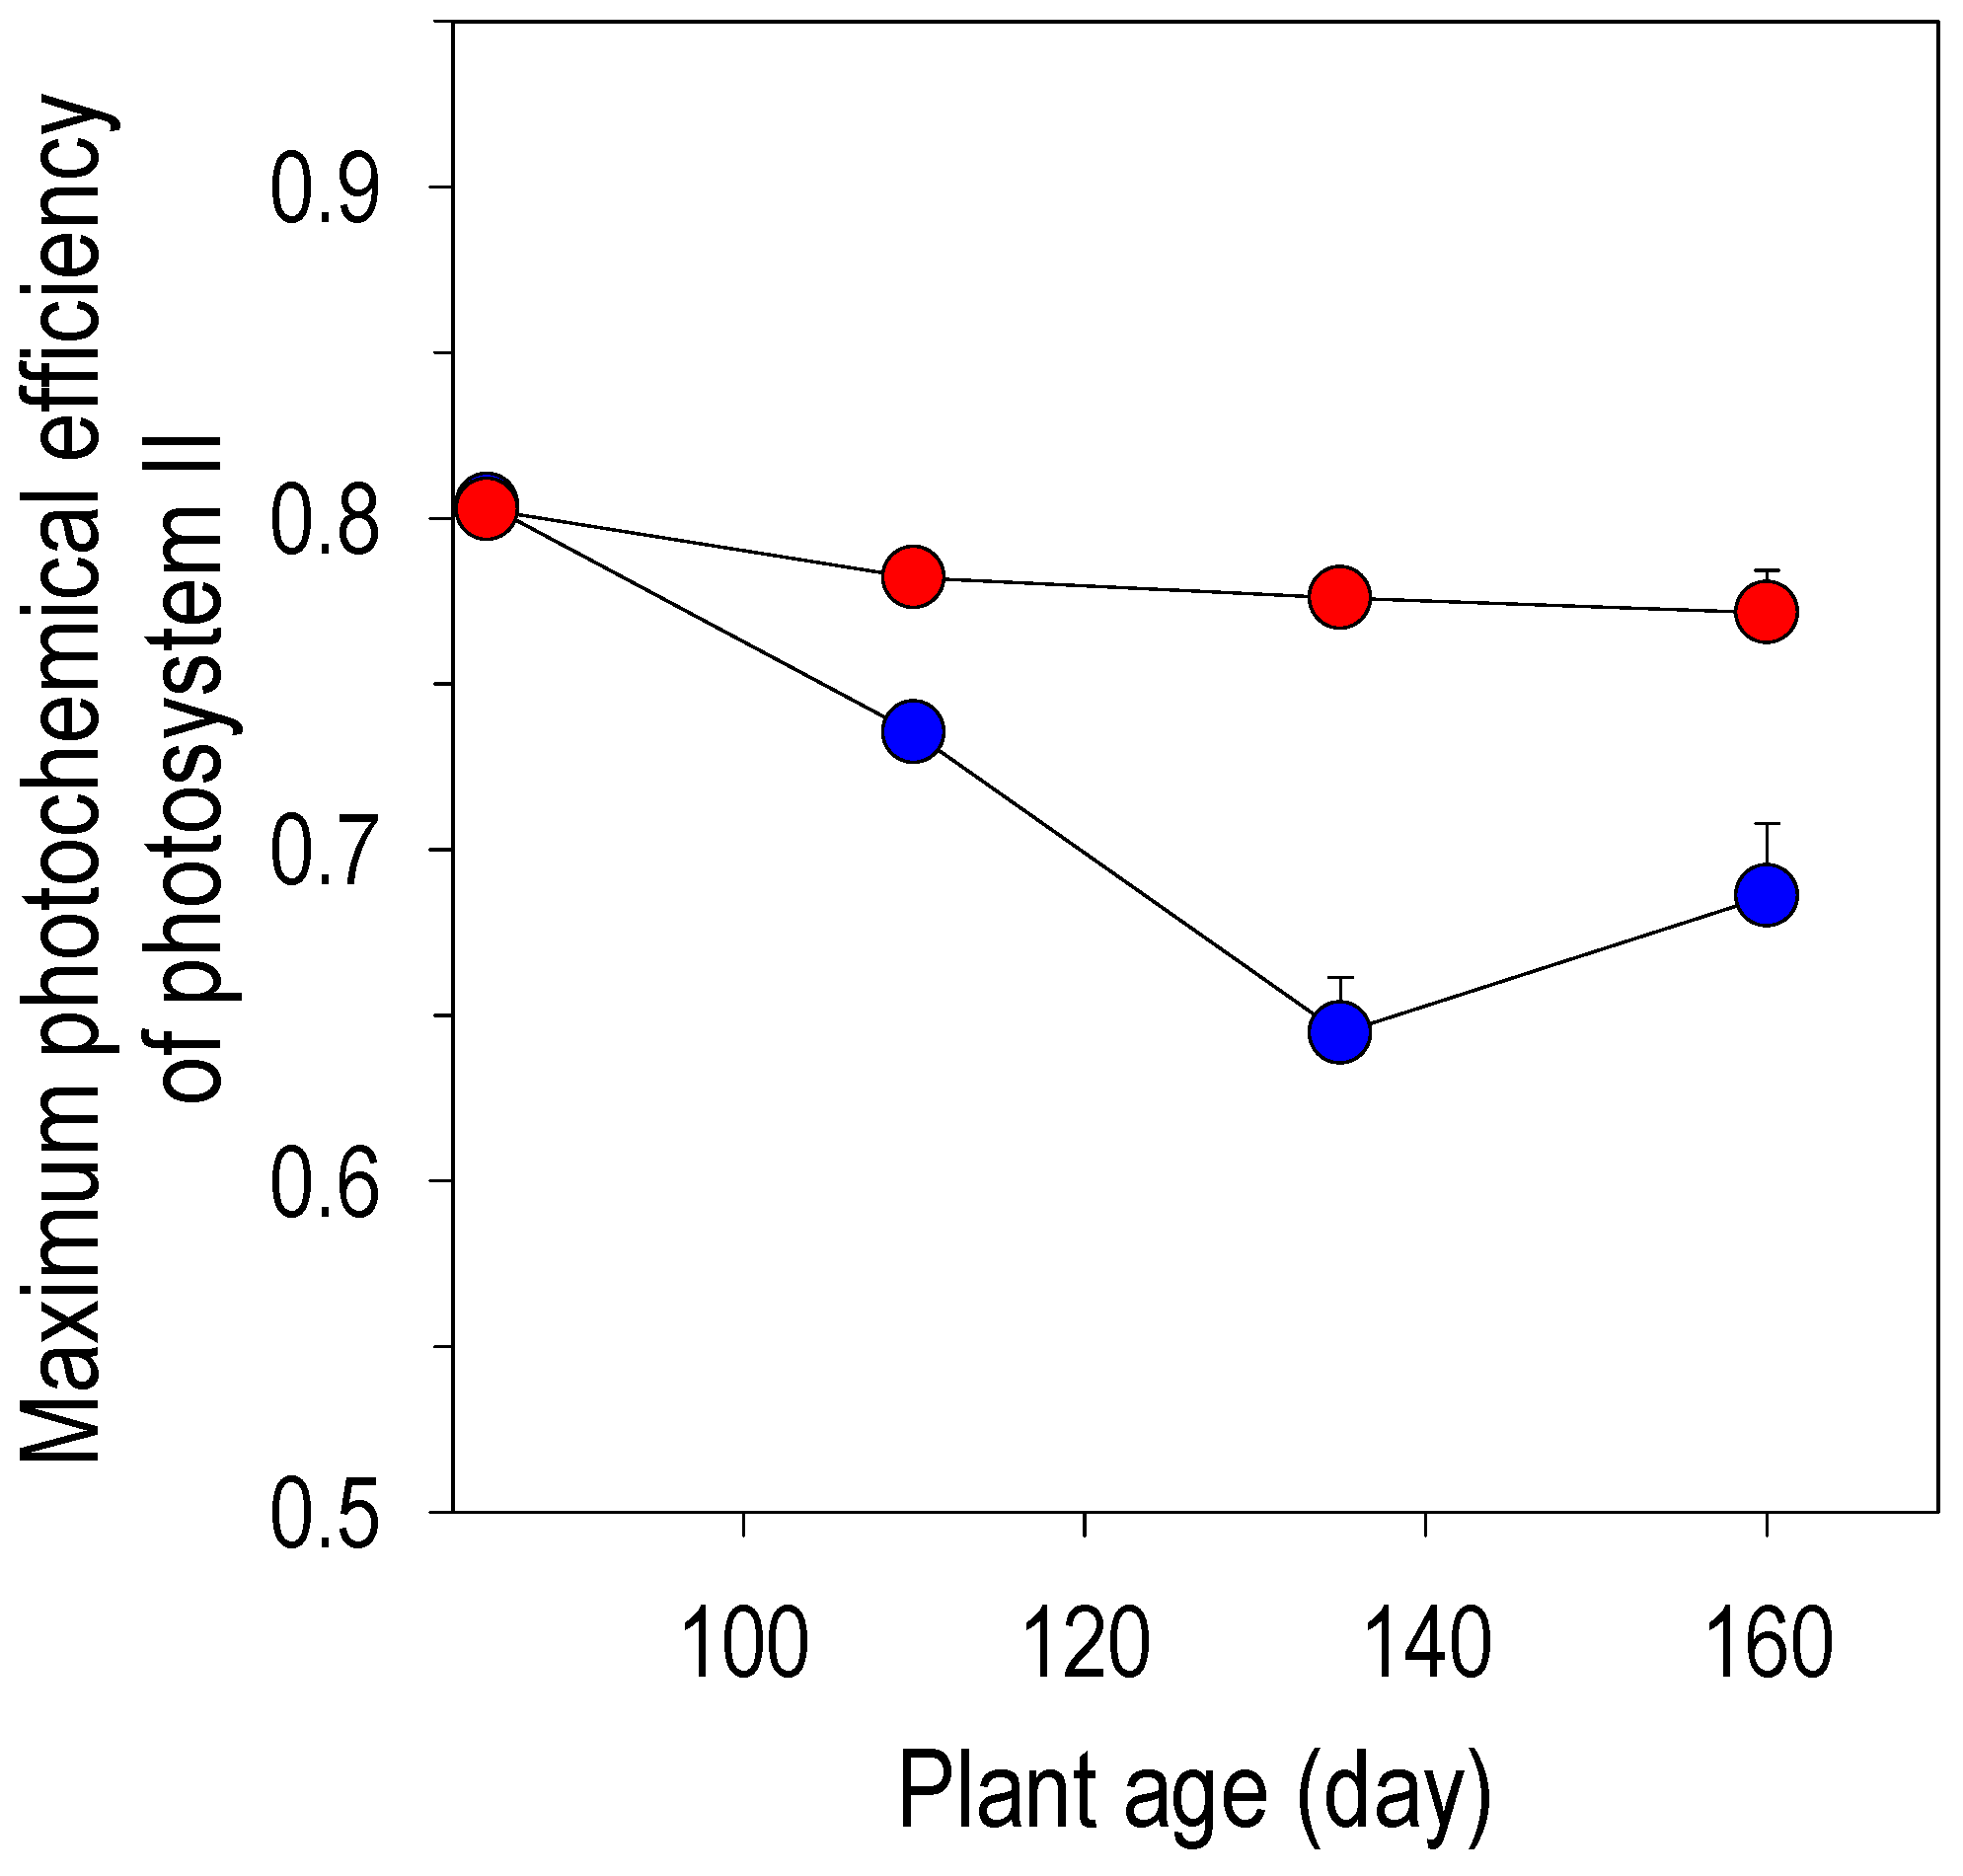
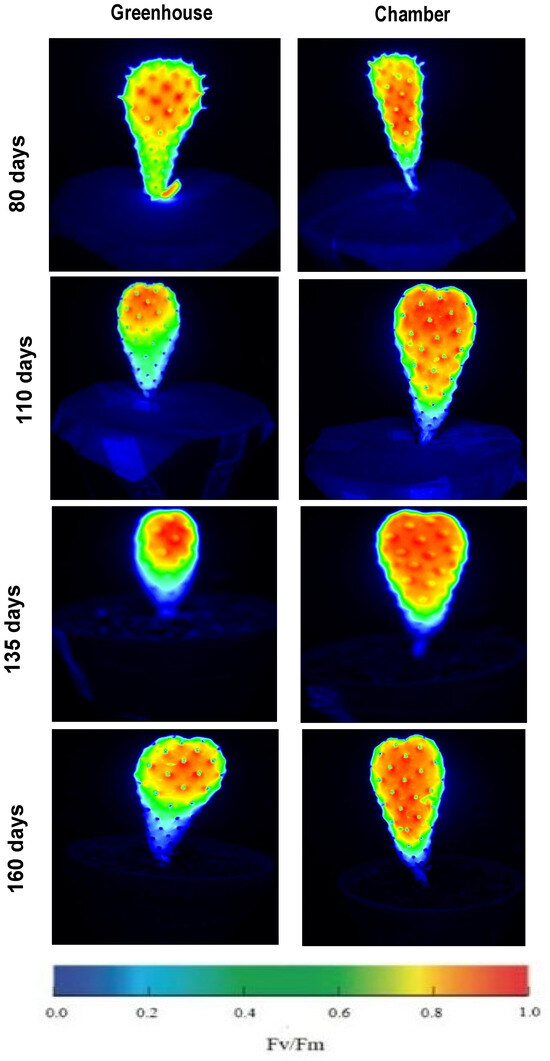
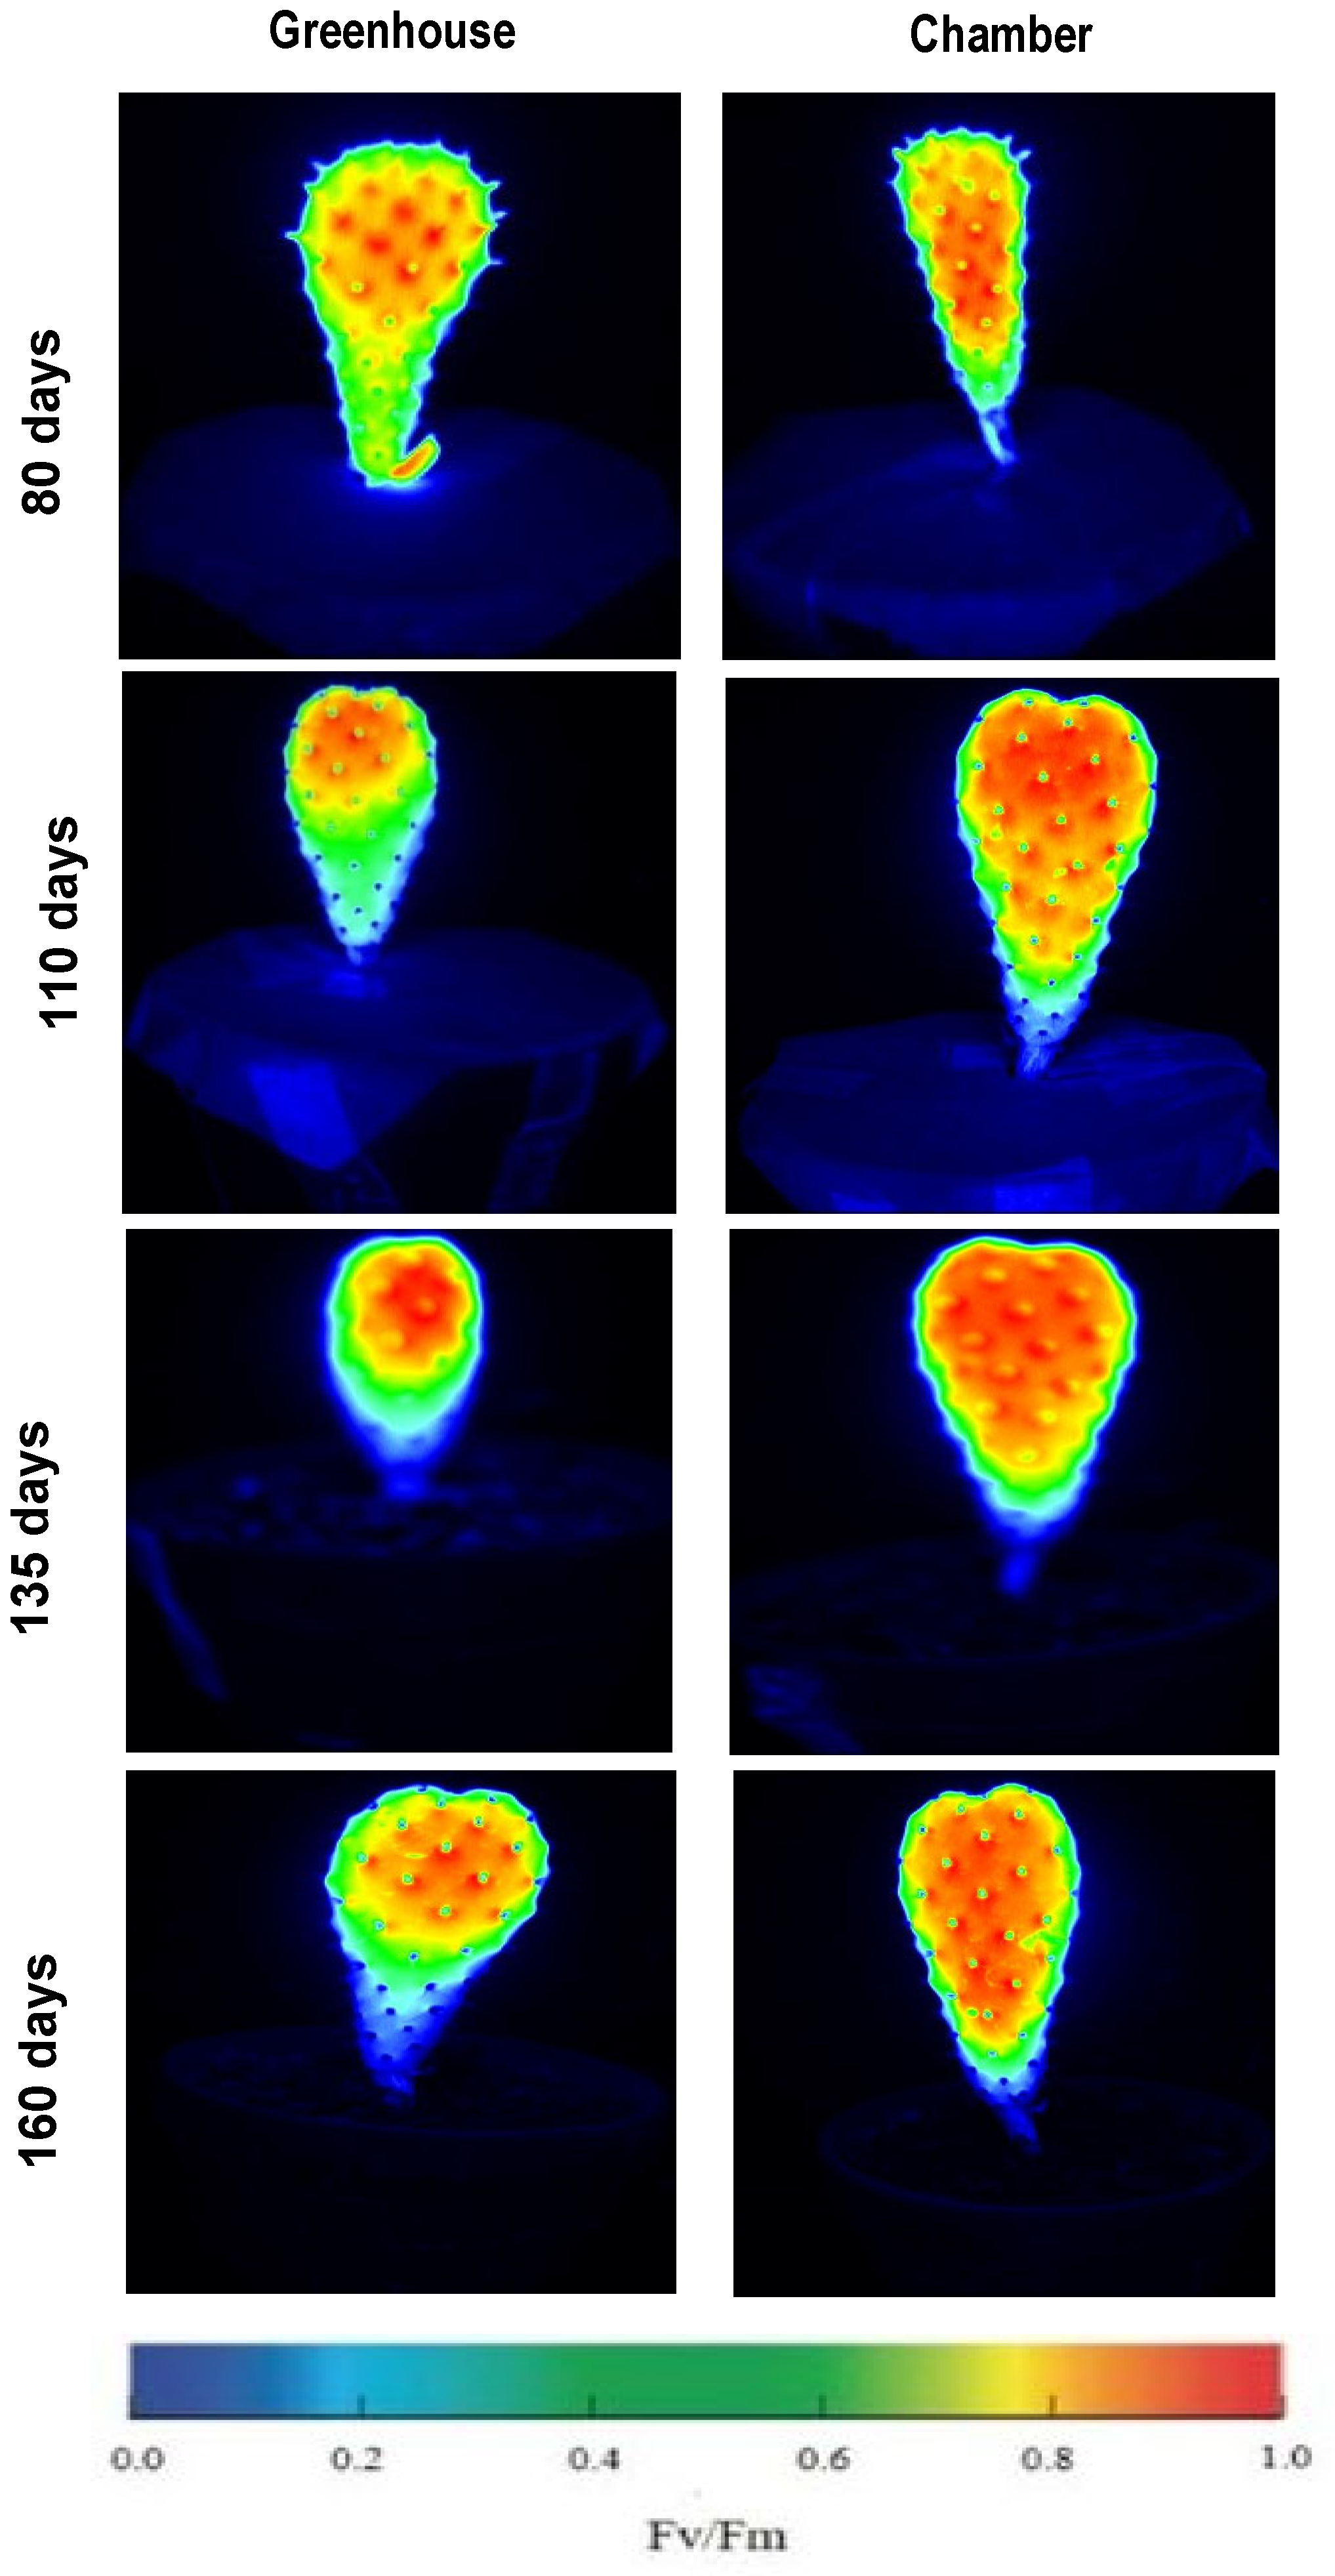
The Fv/Fm ratio during the 70 days of evaluation changed significantly with plant age in both treatments. In the control, the initial value of 0.80 decreased (p ≤ 0.05) to 0.65 from 90 to 135 days of age; in the following 25 days (in 160-day-old plants), the Fv/Fm ratio partially recovered to 0.69. At HNT the decrease in the Fv/Fm ratio between 90 and 160 days of plant age was less pronounced compared to the control plants, ranging from 0.80 to 0.77; however, these changes were significant compared to the initial value at 90 days of plant age and compared to the control (Figure 8 and Figure 9).
Figure 8.
Quantum efficiency of photosystem II, Fv/Fm. (+s.e.) in the CAM III phase of Opuntia spp. plants in a greenhouse (blue circles; 19.1:12.3 °C) or in a chamber with increased night-time temperature (red circles; 19.1/18.9 °C) (n = 10).
Figure 9.
Chlorophyll a fluorescence images of Opuntia spp. plants of 90 to 160 days old, at CAM phase III, growing in a greenhouse (19.1:12.3 °C) or in a chamber with increased nighttime temperature (19.1/18.9 °C). The bar represents the quantum efficiency of photosystem II (Fv/Fm) on a heat scale.
Chlorophyll fluorescence images revealed differences between treatments from day 90 onwards. Control plants showed proportionally larger yellow/green areas (Fv/Fm values between 0.4 and 0.7) from the periphery towards the center and base of the plants compared to the visible area exposed to nighttime heat. Conversely, the central areas and the apex of plants exposed to nighttime heat showed a more intense orange/red color (Fv/Fm values between 0.75 and 1.0). These differences persisted until day 160 (Figure 9).
4. Discussion
Although young plants were used in this study, variability in growth (longitudinal and transversal, and accumulated matter) was evident. However, the use of young plants in studies such as this one is recommended. Oputia plants are succulent, perennial, shrubby plants that grow rapidly when moisture is not restricted, reaching a height of 3–5 m. They form branches composed of morphologically modified stems (photosynthetic structures) with a flattened shape, called cladodes. The cladodes that emerge from the vegetative buds of older cladodes are the young photosynthetic organs. Therefore, in order to evaluate the effect of HNT on photosynthesis in these plants, we considered including young plants in this study. This would eliminate the potential effect of older cladodes. Furthermore, handling plants with variable morphology and size (with different numbers of branches and cladodes) in the induced heat chamber could also include errors in the interpretation of the results.
4.1. Impact of HNT in Soluble Sugars and Plant Growth
The concentrations of glucose, fructose, and sucrose at the end of phase I were modified by the effect of HNT during 70 days compared to the control. Glucose decreased by 48%; in contrast, fructose increased twofold and sucrose increased up to fivefold during that period. The decrease in glucose concentration may be a result of glycolysis, which generates energy for cellular metabolism and intermediate molecules for the synthesis of metabolites that allow plants to overcome stress [4]. In CAM plants, HNT may affect CO2 assimilation, alter sugar production and increase respiration [30]. The significant changes in sugar concentrations suggest alterations in general carbohydrate metabolism due to the chronic effect of HNT, which could decrease plant growth. In the present study, the differences in dry matter were not significant, although there was a tendency for growth to decrease due to the effect of HNT, with a 10% drop after 35 days and nearly 20% after 70 days. Similar increases were observed in shoot transverse growth. The trend projection of the biomass accumulation indicated that at 220 days of age, the control plant could accumulate 1.83 g, while the HNT treatment would accumulate 20% less (1.47 g); this means that HNT significantly affect dry matter of young Opuntia plants up to seven months later.
Since the metabolic functions of sugars are numerous and diverse throughout the entire life cycle of plants, the presence of high concentrations of fructose and sucrose may have contributed to mitigating the effects of temperature on Opuntia plants. Sugars such as sucrose, glucose, and fructose are signaling molecules in various plant stress events [31]. The role of sugars in metabolism depends on their concentration and cellular and tissue transport, and is, in turn, conditioned by the plant’s physiological activity, developmental stage, circadian rhythms, and the environment [32,33]. The functions of sucrose and hexoses are dual in genetic regulation, as it is positive with genes related to growth and negative with those related to stress [34]. Specifically, fructose can be related to the synthesis of specialized metabolites, such as phenolic compounds, some non-proteinogenic amino acids and even lignin [34]. In relation to this, Singh et al. [35] pointed out that sugars such as glucose, fructose, sucrose or trehalose can participate in the protection of cell membranes and the reduction or elimination of the effects of reactive oxygen species during biotic and abiotic stress in plants [36]. Therefore, the significant increase in fructose and sucrose in Opuntia plants, in the present study, is explainable by their function as signaling molecules and other functions referred to by Singh et al. [36]. In this regard, the significant increase in the concentration of sugars such as glucose, fructose, sucrose and raffinose in wheat ears (Triticum aestivum) due to the effect of HNT (23 °C) during four days, compared to 15 °C was interpreted as a protective mechanism of cell membranes against damage caused by HNT [37].
Sugar homeostasis is a dynamic process in which starch and sucrose interconvert according to cellular requirements [36]. The synthesis of sucrose and starch is strictly controlled and affected by the 3-phosphoglyceric acid/phosphate ratio; furthermore, sucrose and starch are considered key molecules, but their homeostasis is severely affected by adverse environmental stresses, including drought, salinity, osmotic stress, and high and low temperatures [38]. Therefore, the increased concentration of sucrose appears to have played some of the multiple roles in the Opuntia plants treated with HNT, e.g., as a carbon source, osmoprotective molecule, and signaling molecule. HNT did not significantly modify starch concentration compared to the control; this indicates that, under the study conditions, the Opuntia plants maintained polysaccharide homeostasis. Evidence of the self-regulation events that supported the maintenance of homeostasis, which allowed for plant growth (longitudinal, transverse, and mass accumulation similar to the control) even after 70 days of thermoperiod alteration, are the differences in the significant correlations between the biochemical and physiological growth variables of the treatments. The HNT treatment showed more positive or negative significant dependence between metabolic and growth variables compared to the control. E.g., fructose correlated significantly and strongly with six variables, but in the control those correlations were very weak or not significant.
4.2. Impact of HNT in Acidity
The increase in acidity in the photosynthetic tissues of CAM plants, such as Opuntia cladodes, is proportional to the concentration of organic acids, primarily malic acid, in the cell vacuoles. This is because for every CO2 molecule fixed in these tissues, one acid molecule and two hydrogen ions are produced [9]. In CAM plants, nocturnal stomatal opening allows for CO2 fixation in CAM phase I; therefore, the acid concentration is significantly higher compared to that during the daytime period, under full light (phase III) [5,12]. In the present study, the Δ acidity of the shoot (acidity at the end of phase I minus that of phase III) was calculated to indirectly assess net CO2 fixation. It indicated that acidity at the end of phase I remained several times higher than in phase III. That is, plants maintained their CAM trait regardless of 70 days of exposure to HNT. A different response was documented in Kalanchoë pinnata plants, in which increasing the constant temperature from 30 °C day/night to 30/34 or 30/37 °C day/night shifted their CAM photosynthetic metabolism to C3 [14]. The response of the Opuntia plants in the present study was similar to that of the Ananas comosus plants, as they maintained their CAM trait with increasing nighttime temperatures [14]. In the present study, the Δ acidity in plants with HNT decreased by 19% (p > 0.05) and 27% (p ≤ 0.05) after these 35 and 70 days compared to the control. The decrease in acidity due to high temperature has been linked to increased mitochondrial oxidative activity, which decreases the availability of PEP for nocturnal CO2 fixation catalyzed by PEP carboxylase [30]. Respiratory activity was not assessed in the present study; therefore, this evaluation is a target for future research.
The effects of increasing nighttime temperatures on carbon fixation among CAM species are diverse and depend on the species, photosynthetic tissue evaluated, thermoperiod, time interval evaluated, and other factors [14,21,39]. In seven-month-old O. streptacantha plants kept day-night at 40 °C for 5, 10, and 15 days, nocturnal acidity (assessed at dawn) decreased significantly, approximately 34 ± 50%; furthermore, daytime acid consumption (assessed before dusk) also decreased compared to plants kept at 25 °C [39]. The authors noted that, despite the high tolerance to extreme temperatures described for Opuntia, young O. streptacantha individuals suffered photosynthetic impairment that led to growth inhibition. The results of the present study contrast markedly with those of Ojeda-Pérez et al. [39]; however, although both studies included Opuntia plants a few months old, in that study the elevated temperature was maintained continuously day and night for 5 to 15 days. Furthermore, the same authors pointed out that under natural conditions, these plants grow under the variable daily temperature cycles to which they are adapted and do not grow with constant day-night temperatures of 40 °C. In eight-month-old Agave americana plants with a nighttime temperature of 36 °C for 8 d, nocturnal CO2 fixation was inhibited, and therefore, acidity total decreased; furthermore, changing the thermoperiod from 25/15 to 25/36 °C reversed the rate of stomatal opening, and this change allowed only one-third of the nocturnal carboxylation compared to the control (25/15 °C) [40].
The acidity results of the present study may be influenced by plant irrigation. In some Opuntia species, adequate availability of moisture favors CO2 assimilation and water stress cancels temperature regulation in CO2 assimilation [5,15]. The Δ acidity decreased between 90 and 160 days of age in both treatments; however, the decrease represented up to 90% of the initial value (90 days of age) in the control, and in the HNT treatment decrease reached 94% of the initial value. Acidity decrease could be a seasonal effect, since the evaluations were carried out between winter and spring (February to May). A similar effect was documented in populations of O. erinacea [41]. In those populations, the variation in CAM activity, determined by changes in total shoot acidity over 15 months, showed minimum values in winter and maximum values in summer. The authors concluded that acidity fluctuations are mostly correlated with seasonal temperature. In relation to this effect, the positive and highly significant correlation between stage I acidity and stage III acidity in both treatments was noteworthy in the present study, demonstrating their dependence on each other. That is, under the conditions tested, it appears that acidity at the beginning and end of the dark period varied proportionally.
4.3. Impact of HNT in Free Amino Acids and Soluble Proteins
Free proteinogenic amino acids, such as proline, aspartic acid, and glutamic acid, and non-proteinogenic such as glycine betaine, as well as sugars, have been identified having roles in cellular balance and accumulate due to the high temperature stress [20,42]. In this regard, López et al. [20] pointed out that the accumulation of free amino acids in stressed young cladodes of Opuntia depends more on the level of domestication of the Opuntia species and little or not at all on environmental conditions of growth. This explains why the concentration of free amino acids did not differ between treatments. Furthermore, these results made it possible to continue this line of study in wild and domesticated Opuntia species separately instead of evaluations in the simulated “nopalera” as in this study. However, the first results of the chronic effect of high night-time temperature, alone and in combination with humidity deficit, on O. ficus-indica show similar tolerance to that of the plants in the present study (unpublished results from our own group).
The concentration of total or soluble protein in plant tissues is directly associated with their overall metabolic activity [43] dependent on the environment, including temperature, daily light/dark cycle, and water availability [20], which modulate protein synthesis in Opuntia [44]. It has been estimated that half of the soluble proteins in Opuntia correspond to metabolic processes such as glycolysis and photosynthesis, and protein expression in plants depends on intrinsic (genetic), extrinsic (environmental) factors, and their interaction [20,45].
The adjustments in C metabolism and the non-significant effect on growth promoted by chronic nighttime heat may be related to adjustments in enzyme activities without changes in protein concentration. In this sense, with HNT, the four growth variables correlated significantly and negatively with protein concentration, which partially differed from the control. In the control plants, soluble protein concentration correlated significantly and positively with acidity in both CAM phases and negatively with glucose, starch, dry matter, and shoot width.
4.4. Impact of HNT in Maximum Quantum Efficiency of Photosystem II
The Fv/Fm ratio is used as a proxy for the maximum efficiency with which absorbed radiation is converted into chemical energy by the antenna pigments of photosystem II [46,47]. In the present study, the Fv/Fm ratio of both treatments decreased significantly with plant age, between 90 and 160 days; however, the decrease over the entire interval was greater, 0.63 to 0.8, in the control plants, with some recovery at 160 days. Values between 0.69 and 0.83 of this index in crops are frequently related to stress caused by various factors, including moisture and nitrogen deficiencies, among others; however, the Fv/Fm indices of six-month-old Agave salmiana and A. mapisaga plants grown under a 12 h/12 h thermoperiod (25/15 °C; control) were in this range, with values around 0.7 [48]. In A. angustifolia subsp. tequilana plants maintained for three months without stress at 28.1 °C (control), the Fv/Fm index was even lower, between 0.67 and 0.69 [49]. In these plants, the diurnal increase in temperature over three months generated an average temperature of 36.1 °C and kept the Fv/Fm index practically unchanged; this allowed the authors to identify the photosynthetic apparatus of A. angustifolia subsp. tequilana as sufficiently robust to maintain its photosynthetic activity unaltered by the effect of high temperature stress. Based on the stability of the Fv/Fm indices, Jimenez-Torres et al. [48] reported similar tolerance to daytime heat stress in A. mapisaga plants and in two biotypes of A. salmiana; however, these authors observed a significant increase in the Fv/Fm index due to the effect of increased temperature in a third biotype of A. salmiana. The results of the Opuntia plants coincided with this response, with a higher value of this index in the treatment with nighttime temperatures similar to the daytime one.
The effect from species on the Fv/Fm index was evaluated by Jardim et al. [50]. They observed significant differences in light use efficiency among the species. Since the Fv/Fm index varied between 0.75 in O. atropes Rose, 0.76 in O. larreyi F.A.C. Weber ex Coult., 0.80 in O. stricta (Haw.) Haw. Africana and 0.87 in O. stricta Mexicana. With one exception, the values of this index in the present study are within the range documented in other Opuntia species.
Changes in the Fv/Fm ratio in CAM plants can be, as in other traits, fluctuations that depend on temperature and seasonal light intensity; furthermore, the HNT relative to the natural environment for these species, which are frequently assessed after several weeks, can generate changes in the lipid composition of the thylakoids. These changes are interpreted as heat acclimation [12] and may allow greater stability and functionality of FSII, which is manifested, in turn, as stability of the maximum quantum efficiency of photosystem II, which would not occur in the control.
5. Conclusions
Increasing nighttime temperature, from 12.3 to 18.9 °C for 70 days, did not alter the growth or CAM of young Opuntia spp. plants. The significant decrease in glucose as a result of increased nighttime temperature during this period may be evidence of adjustments in glycolysis in the cytosol, plastids, or both subcellular regions.
The significant increase in fructose and sucrose concentrations due to HNT, compared to control plants, indicates the regulatory role of these sugars as signaling molecules in young Opuntia plants; therefore, adjustments in sugar metabolism specifically are what allow them to maintain their growth. This latter effect is confirmed by the stability of other components of primary and specialized metabolism, such as the concentration of starch and free amino acids.
High nighttime temperatures appear to positively affect photosynthetic membranes, allowing young Opuntia plants to overcome the decline in Fv/Fm ratio caused by plant age, seasonal environmental changes, or a combination of these factors.
The results confirm the great potential of using the Opuntia genus in agriculture and genetic improvement in the face of the challenges posed by climatic change.
Author Contributions
Investigation, C.R.B.; conceptualization, C.B.P.-V.; formal analysis, C.R.B. and C.B.P.-V.; methodology, C.R.B., C.B.P.-V. and D.P.-C.; supervision, D.P.-C., A.S.V. and M.V.S.; writing—original draft preparation, C.R.B. and C.B.P.-V.; writing—review and editing, C.R.B., C.B.P.-V., D.P.-C., A.S.V. and M.V.S. All authors have read and agreed to the published version of the manuscript.
Funding
This research received no external funding.
Data Availability Statement
The original contributions presented in this study are included in the article. Further inquiries can be directed to the corresponding author.
Acknowledgments
Claudia Reyes Buendía was a PhD student in the Postgraduate Program in Botany at the Colegio de Postgraduados, Mexico, and received a CONAHCYT scholarship. The authors would like to thank David Midmore for his critical review and improvement of the manuscript.
Conflicts of Interest
The authors declare no conflicts of interest.
Appendix A
Table A1.
Analysis of variance of variables of Opuntia spp. plants aged 90, 125 and 160 days, grown in a greenhouse (19.1/12.3 °C) or in a chamber with high nighttime temperatures (19.1/18.9 °C) during 35 and 70 d.
References
- NASA, National Aeronautics and Space Administration. Carbon Dioxide; National Aeronautics and Space Administration: Washington, DC, USA, 2024. Available online: https://climate.nasa.gov/vital-signs/carbon-dioxide/?intent=121 (accessed on 5 January 2024).
- Raza, A.; Razzaq, A.; Mehmood, S.S.; Zou, X.; Zhang, X.; Lv, Y.; Xu, J. Impact of climate change on crops adaptation and strategies to tackle its outcome: A review. Plants 2019, 8, 34. [Google Scholar] [CrossRef] [Scilit]
- Schaarschmidt, S.; Lawas, L.M.F.; Kopka, J.; Jagadish, S.V.K.; Zuther, E. Physiological and molecular attributes contribute to high night temperature tolerance in cereals. Plant Cell Environ. 2021, 44, 2034–2048. [Google Scholar] [CrossRef] [Scilit]
- Kohila, S.; Gomathi, R. Adaptive physiological and biochemical response of sugarcane genotypes to high-temperature stress. Indian J. Plant Physiol. 2018, 23, 245–260. [Google Scholar] [CrossRef] [Scilit]
- Osmond, C.B. Crassulacean acid metabolism: A curiosity in context. Annu. Rev. Plant Physiol. 1978, 29, 379–414. [Google Scholar] [CrossRef] [Scilit]
- Smith, J.A.C.; Winter, K. (Eds.) Taxonomic distribution of crassulacean acid metabolism. In Crassulacean Acid Metabolism: Biochemistry, Ecophysiology and Evolution; Springer: Berlin, Germany, 1996; pp. 427–436. [Google Scholar] [CrossRef] [Scilit]
- Silvera, A.K.; Neubig, K.M.; Whitten, W.M.; Williams, N.H.; Winter, K.; Cushman, J.C. Evolution along the crassulacean acid metabolism continuum. Funct. Plant Biol. 2010, 37, 995–1010. [Google Scholar] [CrossRef] [Scilit]
- Andrade, J.L.; De la Barrera, E.; Reyes-García, C.; Ricalde, F.; Vargas-Soto, G.; Cervera, J.C. El metabolismo ácido de las crasuláceas: Diversidad, fisiología ambiental y productividad. Bol. Soc. Bot. México 2007, 81, 37–50. [Google Scholar] [CrossRef] [Scilit]
- Nobel, P.S. Environmental Biology of Agaves and Cacti; Cambridge University Press: New York, NY, USA, 1988. [Google Scholar]
- Lüttge, U. Ecophysiology of Crassulacean Acid Metabolism (CAM). Ann. Bot. 2004, 93, 629–652. [Google Scholar] [CrossRef] [Scilit]
- Drennan, P.M. Temperature influences on plant species of arid and semi-arid regions with emphasis on CAM succulents. In Perspectives in Biophysical Plant Ecophysiology: A Tribute to Park S. Nobel; De la Barrera, E., Smith, W.K., Eds.; Universidad Nacional Autónoma de México: Mexico City, Mexico, 2009; pp. 57–94. [Google Scholar]
- Yamori, W.; Hikosaka, K.; Way, D.A. Temperature response of photosynthesis in C3, C4, and CAM plants: Temperature acclimation and temperature adaptation. Photosynth. Res. 2014, 119, 101–117. [Google Scholar] [CrossRef] [Scilit]
- Pimienta-Barrios, E.; Robles-Murguia, C.; Nobel, P.S. Net CO2 uptake for Agave tequilana in a warm and a temperate environment. Biotropica 2001, 33, 312–318. [Google Scholar] [CrossRef] [Scilit]
- Lin, Q.; Abe, S.; Nose, A.; Sunami, A.; Kawamitsu, Y. Effects of high night temperature on Crassulacean Acid Metabolism (CAM) photosynthesis of Kalanchoë pinnata and Ananas comosus. Plant Prod. Sci. 2006, 9, 10–19. [Google Scholar] [CrossRef] [Scilit]
- Gerwick, B.C.; Williams, G.J., III. Temperature and water regulation of gas exchange of Opuntia polyacantha. Oecologia 1978, 35, 149–159. [Google Scholar] [CrossRef] [Scilit] [PubMed]
- Drennan, P.M.; Nobel, P.S. Root growth dependence on soil temperature for Opuntia ficus-indica: Influences of air temperature and doubled CO2 concentration. Funct. Ecol. 1998, 12, 959–964. [Google Scholar] [CrossRef] [Scilit]
- Majure, L.; Puente, R. Phylogenetic relationships and morphological evolution in Opuntia s. str. and closely related members of tribe Opuntieae. Succul. Plant Res. 2014, 8, 9–30. [Google Scholar]
- CONABIO, Comisión Nacional Para el Conocimiento y uso de la Biodiversidad. Nopales. Comisión Nacional Para el Conocimiento y uso de la Biodiversidad. Ciudad de México. Available online: https://www.biodiversidad.gob.mx/diversidad/alimentos/nopales (accessed on 2 May 2021).
- Jorge, A.O.S.; Costa, A.S.G.; Oliveira, M.B.P.P. Adapting to climate change with Opuntia. Plants 2023, 12, 2907. [Google Scholar] [CrossRef] [Scilit] [PubMed]
- López, N.M.C.; Peña-Valdivia, C.B.; Trejo, C.; Padilla, C.D.; García, N.R.; Martínez, B.E. Interaction between species, time-of-day, and soil water potential on biochemical and physiological characteristics of cladodes of Opuntia. Plant Physiol. Biochem. 2021, 162, 185–195. [Google Scholar] [CrossRef] [Scilit] [PubMed]
- Nobel, P.S.; De la Barrera, E. Tolerances and acclimation to low and high temperatures for cladodes, fruits and roots of a widely cultivated cactus, Opuntia ficus-indica. New Phytol. 2003, 157, 271–279. [Google Scholar] [CrossRef] [Scilit]
- Flores-Hernández, A.; Murillo-Amador, B.; García-Hernández, J.L.; Fraga-Palomino, H.C. Concentración de prolina en brotes de cultivares de nopal (Opuntia megacantha) sometidos a estrés por calor. Phyton 2001, 2001, 15–24. [Google Scholar]
- Monroy, V.M.E.; Peña-Valdivia, C.B.; García, J.R.; Solano, E.; Campos, H.; García, E. Chemical scarification and ozone in seed dormancy alleviation and seedlings growth of wild and domesticated Opuntia, Cactaceae. Ozone Sci. Eng. 2017, 39, 104–114. [Google Scholar] [CrossRef] [Scilit]
- AOAC, Association of Official Analytical Chemists. Official Methods of Analysis, 15th ed.; Association of Official Analytical Chemists: Washington, DC, USA, 1990. [Google Scholar]
- Padilla-Chacón, D.; Martínez-Barajas, E.; García-Esteva, A.; Leal-Delgado, R.; Kohashi-Shibata, J.; Peña-Valdivia, C.B. Biomass remobilization in two common bean (Phaseolus vulgaris L.) cultivars under water restriction. S. Afr. J. Bot. 2017, 112, 79–88. [Google Scholar] [CrossRef] [Scilit]
- Peña-Valdivia, C.B.; Ortega-Delgado, M.L. Non-structural carbohydrate partitioning in Phaseolus vulgaris after vegetative growth. J. Sci. Food Agric. 1991, 55, 563–577. [Google Scholar] [CrossRef] [Scilit]
- Jones, D.L.; Owen, A.G.; Farrar, J.F. Simple method to enable the high resolution determination of total free amino acids in soil solution and soil extracts. Soil Biol. Biochem. 2002, 34, 1893–1902. [Google Scholar] [CrossRef] [Scilit]
- Bradford, M.M. A rapid and sensitive method for the quantification of microgram quantities of protein utilizing the principle of protein-dye binding. Anal. Biochem. 1976, 72, 248–254. [Google Scholar] [CrossRef] [PubMed]
- R Core Team. R: A Language and Environment for Statistical Computing; R Foundation for Statistical Computing: Vienna, Austria, 2021. Available online: https://www.R-project.org/ (accessed on 15 May 2023).
- Lüttge, U. Stem CAM in arborescent succulents. Trees 2008, 22, 139–148. [Google Scholar] [CrossRef] [Scilit]
- Ciereszko, I. Regulatory roles of sugars in plant growth and development. Acta Soc. Bot. Poloniae 2018, 87, 3583. [Google Scholar] [CrossRef] [Scilit]
- Lemoine, R.; La Camera, S.; Atanassova, R.; Dédaldéchamp, F.; Allario, T.; Pourtau, N.; Bonnemain, J.-L.; Laloi, M.; Coutos-Thévenot, P.; Maurousset, L.; et al. Source-to-sink transport of sugar and regulation by environmental factors. Front. Plant Sci. 2013, 4, 272. [Google Scholar] [CrossRef] [Scilit]
- Jeandet, P.; Formela-Luboinska, M.; Labudda, M.; Morkunas, I. The role of sugars in plant responses to stress and their regulatory function during development. Int. J. Mol. Sci. 2022, 23, 5161. [Google Scholar] [CrossRef] [Scilit]
- Rosa, M.; Prado, C.; Podazza, G.; Interdonato, R.; González, J.A.; Hilal, M.; Prado, F.E. Soluble sugars-metabolism, sensing and abiotic stress. Plant Signal. Behav. 2009, 4, 388–393. [Google Scholar] [CrossRef] [Scilit] [PubMed]
- Singh, M.; Kumar, J.; Singh, S.; Singh, V.P.; Prasad, S.M. Roles of osmoprotectants in improving salinity and drought tolerance in plants: A review. Rev. Environ. Sci. Biotechnol. 2015, 14, 407–426. [Google Scholar] [CrossRef] [Scilit]
- Saddhe, A.; Manuka, R.; Penna, S. Plant sugars: Homeostasis and transport under abiotic stress in plants. Physiol. Plant. 2020, 171, 739–755. [Google Scholar] [CrossRef] [Scilit]
- Impa, S.M.; Vennapusa, A.R.; Bheemanahalli, R.; Sabela, D.; Boyle, D.; Walia, D.; Jagadish, S.V.K. High night temperature induced changes in grain starch metabolism alters starch, protein, and lipid accumulation in winter wheat. Plant Cell Environ. 2019, 43, 431–447. [Google Scholar] [CrossRef] [Scilit]
- Thalmann, M.; Santelia, D. Starch as a determinant of plant fitness under abiotic stress. New Phytol. 2017, 214, 943–951. [Google Scholar] [CrossRef] [Scilit]
- Ojeda-Pérez, Z.Z.; Jiménez-Bremont, J.F.; Delgado-Sánchez, P. Continuous high and low temperature induced a decrease of photosynthetic activity and changes in the diurnal fluctuations of organic acids in Opuntia streptacantha. PLoS ONE 2017, 12, e0186540. [Google Scholar] [CrossRef] [Scilit] [PubMed]
- Neales, T.F. The effect of night temperature on CO2 assimilation, transpiration, and water use efficiency in Agave americana L. Aust. J. Biol. Sci. 1973, 26, 705–714. [Google Scholar] [CrossRef] [Scilit]
- Littlejohn, R.O.; Williams, G.J., III. Diurnal and seasonal variations in activity of crassulacean acid metabolism and plant water status in a northern latitude population of Opuntia erinacea. Oecologia 1983, 59, 83–87. [Google Scholar] [CrossRef] [Scilit]
- Kovács, Z.; Simon-Sarkadi, L.; Vashegyi, I.; Kocsy, G. Different accumulation of free amino acids during short- and long-term osmotic stress in wheat. Sci. World J. 2012, 2012, 216521. [Google Scholar] [CrossRef] [Scilit] [PubMed]
- Nobel, P.S. Nutrient levels in cacti–relation to nocturnal acid accumulation and growth. Am. J. Bot. 1983, 70, 1244–1253. [Google Scholar] [CrossRef] [Scilit]
- Drennan, P.M.; Nobel, P.S. Responses of CAM species to increasing atmospheric CO2 concentrations. Plant Cell Environ. 2000, 23, 767–781. [Google Scholar] [CrossRef] [Scilit]
- Neilson, E.H.; Goodger, J.Q.D.; Woodrow, I.E.; Møller, B.L. Plant chemical defense: At what cost? Trends Plant Sci. 2013, 18, 250–258. [Google Scholar] [CrossRef] [Scilit]
- Maxwell, K.; Johnson, G.N. Chlorophyll fluorescence—A practical guide. J. Exp. Bot. 2000, 51, 659–668. [Google Scholar] [CrossRef]
- Roháček, K. Chlorophyll fluorescence parameters: The definitions, photosynthetic meaning, and mutual relationships. Photosynthetica 2002, 40, 13–29. [Google Scholar] [CrossRef] [Scilit]
- Jimenez-Torres, J.A.; Peña-Valdivia, C.B.; Padilla-Chacón, D.; García-Nava, R. Physiological and biochemical responses of Agave to temperature and climate of their native environment. Flora 2021, 278, 151797. [Google Scholar] [CrossRef] [Scilit]
- Aragón-Gastelum, J.L.; Ramírez-Benítez, J.E.; González-Durán, E.; González-Salvatierra, C.; Ramírez-Tobías, H.M.; Flores, J.; Gutiérrez-Alcántara, E.J.; Méndez-Guzmán, E.; Jarquín-Gálvez, R. Photochemical activity in early-developmental phases of Agave angustifolia subsp. tequilana under induced global warming: Implications to temperature stress and tolerance. Flora 2020, 263, 151535. [Google Scholar] [CrossRef] [Scilit]
- Jardim, A.M.R.F.; Bentzen Santos, H.R.; Nunes Alves, H.K.M.; Ferreira-Silva, S.L.; Bastos de Souza, L.S.; Araújo Júnior, G.N.; da Sá Souza, M.; Leal de Araújo, G.G.; Alves de Souza, C.A.; Freire da Silva, T.G. Genotypic differences relative photochemical activity, inorganic and organic solutes and yield performance in clones of the forage cactus under semi-arid environment. Plant Physiol. Biochem. 2021, 162, 421–430. [Google Scholar] [CrossRef] [Scilit] [PubMed]
Disclaimer/Publisher’s Note: The statements, opinions and data contained in all publications are solely those of the individual author(s) and contributor(s) and not of MDPI and/or the editor(s). MDPI and/or the editor(s) disclaim responsibility for any injury to people or property resulting from any ideas, methods, instructions or products referred to in the content. |
© 2026 by the authors. Licensee MDPI, Basel, Switzerland. This article is an open access article distributed under the terms and conditions of the Creative Commons Attribution (CC BY) license.