


Abstract
Nectar is a complex and sugar-rich fluid secreted by floral nectaries. It serves as an attractant for pollinators and represents a primary reward that angiosperms offer to insect pollinators. Tilia mandshurica is an important nectar-producing tree species that yields high-quality linden honey characterized by its pure white color and great nutritional value, conferring considerable development potential. To dissect the molecular mechanisms governing sugar fluctuation during nectar secretion in T. mandshurica, we quantified starch, sucrose, glucose and fructose contents and generated transcriptome datasets for flowers across seven developmental stages. We found that nectar secretion occurred exclusively from S4 to S6, with the maximum nectar volume detected at S6. According to sugar-profiling results, we identified 42 differentially expressed genes (DEGs) involved in sugar metabolism, 24 DEGs encoding SWEET transporters, and five CWINV DEGs within sugar-metabolic pathways. Furthermore, a total of thirteen transcription factor genes potentially linked to flowering and nectar secretion were predicted via gene co-expression network construction. Collectively, this study provides insights into the molecular mechanisms responsible for sugar-content variation during nectar secretion in T. mandshurica. Our results lay a basis for screening and cloning key regulatory genes for nectar secretion, and offer valuable references for genetic-engineering-assisted breeding of T. mandshurica.
1. Introduction
Flowering is a pivotal developmental event in the plant life cycle, underpinning plant reproduction and species continuation [1,2,3]. Floral nectar, a specialized secretion produced by floral nectaries, is a sugar-rich complex fluid that serves as a core reward for pollinators and plays an indispensable role in mediating plant-pollinator mutualisms. Nectar effectively attracts flower-visiting animals to forage, and pollinators in turn facilitate plant cross-pollination, conferring reproductive fitness advantages to host plants. Accordingly, nectar secretion is widely recognized as an adaptive resource investment strategy in plants.
Nectar secretion is a dynamic and developmentally regulated process with distinct pre- and post-secretion characteristics, representing a critical adaptive trait for plants to coordinate with environmental conditions and pollinator activity rhythms [4,5]. Considerable interspecific variation in nectar secretion patterns has been documented across plant taxa, and intraspecifically, nectar yield and composition also fluctuate substantially throughout successive floral developmental stages [6,7]. To optimize resource utilization and avoid unnecessary energy consumption, plants have evolved sophisticated molecular regulatory networks to precisely control nectar biosynthesis, secretion, and reabsorption.
Deciphering the molecular mechanisms governing nectar secretion not only advances our fundamental understanding of plant reproductive developmental biology but also provides valuable theoretical guidance for the conservation, utilization, and high-yield breeding of nectar-producing plant species. Core components of the canonical nectar secretion pathway have been identified in model plants and cash crops. Functional studies have demonstrated that the sugars will eventually be exported by transporter 9 (SWEET9) and the sucrose phosphate synthase gene (SPS) are indispensable for nectar production: SWEET9 knockout completely abolishes nectar secretion in Arabidopsis thaliana, turnip, and tobacco, while SWEET9 overexpression significantly increases nectar volume and glucose concentration. Similarly, silencing of SPS effectively blocks nectar secretion [8,9].
The established canonical nectar secretion model proposes a sequential metabolic and transport cascade: photosynthates accumulate as starch in nectary parenchyma cells prior to flowering; upon initiation of secretion, starch is hydrolyzed, and the resulting metabolites are converted to sucrose via SPS and sucrose phosphatase (SPP); sucrose is subsequently exported to the apoplast by SWEET9, and further hydrolyzed into glucose and fructose by cell wall invertase 4 (CWINV4) [10,11]; the resulting osmotic gradient drives water influx to form mature nectar, followed by programmed nectar reabsorption [8]. This core regulatory module has been validated in pumpkin, confirming the conserved functions of SPS and SWEET9 in dicot nectar production [12]. In cotton, abundant endoplasmic reticulum and high transcript levels of SWEET9 and CWINV4 during active nectar secretion suggest that cotton nectar secretion depends on the synergy of dual secretory pathways [13]. Notably, a study in pineapple revealed that monocots lack functional SWEET9 homologs and secrete sucrose via active transport or exocytosis, complementing and refining the universal nectar secretion model [14].
Tilia species are economically and ecologically important woody nectar-producing trees. Linden honey is renowned for its pure texture, pleasant flavor, and high commercial value. Tilia mandshurica is a dominant nectar-producing tree in northern China, yet the large-scale cultivation and industrial application of its nectar-producing forests are restricted by insufficient understanding of its nectar secretion characteristics. Investigating the floral development and nectar secretion mechanisms of T. mandshurica can deepen our insights into plant-pollinator co-evolutionary ecology and provide theoretical support for the genetic improvement, yield enhancement, and quality optimization of T. mandshurica nectar resources.
Despite extensive research on nectar secretion mechanisms in model herbs and annual cash crops, the molecular and physiological basis of nectar production in woody tree species remains poorly characterized. The sugar metabolic and transport pathways underlying nectar secretion in woody plants are largely unelucidated. In this study, we systematically quantified dynamic changes in sugar components and contents across seven consecutive floral developmental stages of T. mandshurica and performed transcriptome sequencing. The objectives were to screen key structural genes and transcription factors (TFs) regulating sugar accumulation and transport during nectar secretion, investigate the molecular basis of dynamic sugar fluctuations, and provide a theoretical foundation for genetic breeding and nectar yield improvement, and sustainable cultivation of T. mandshurica. as a valuable woody nectar crop.
2. Materials and Methods
2.1. Plant Materials
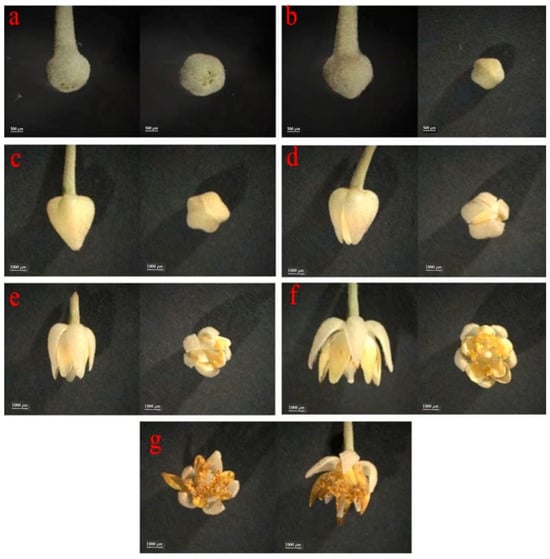
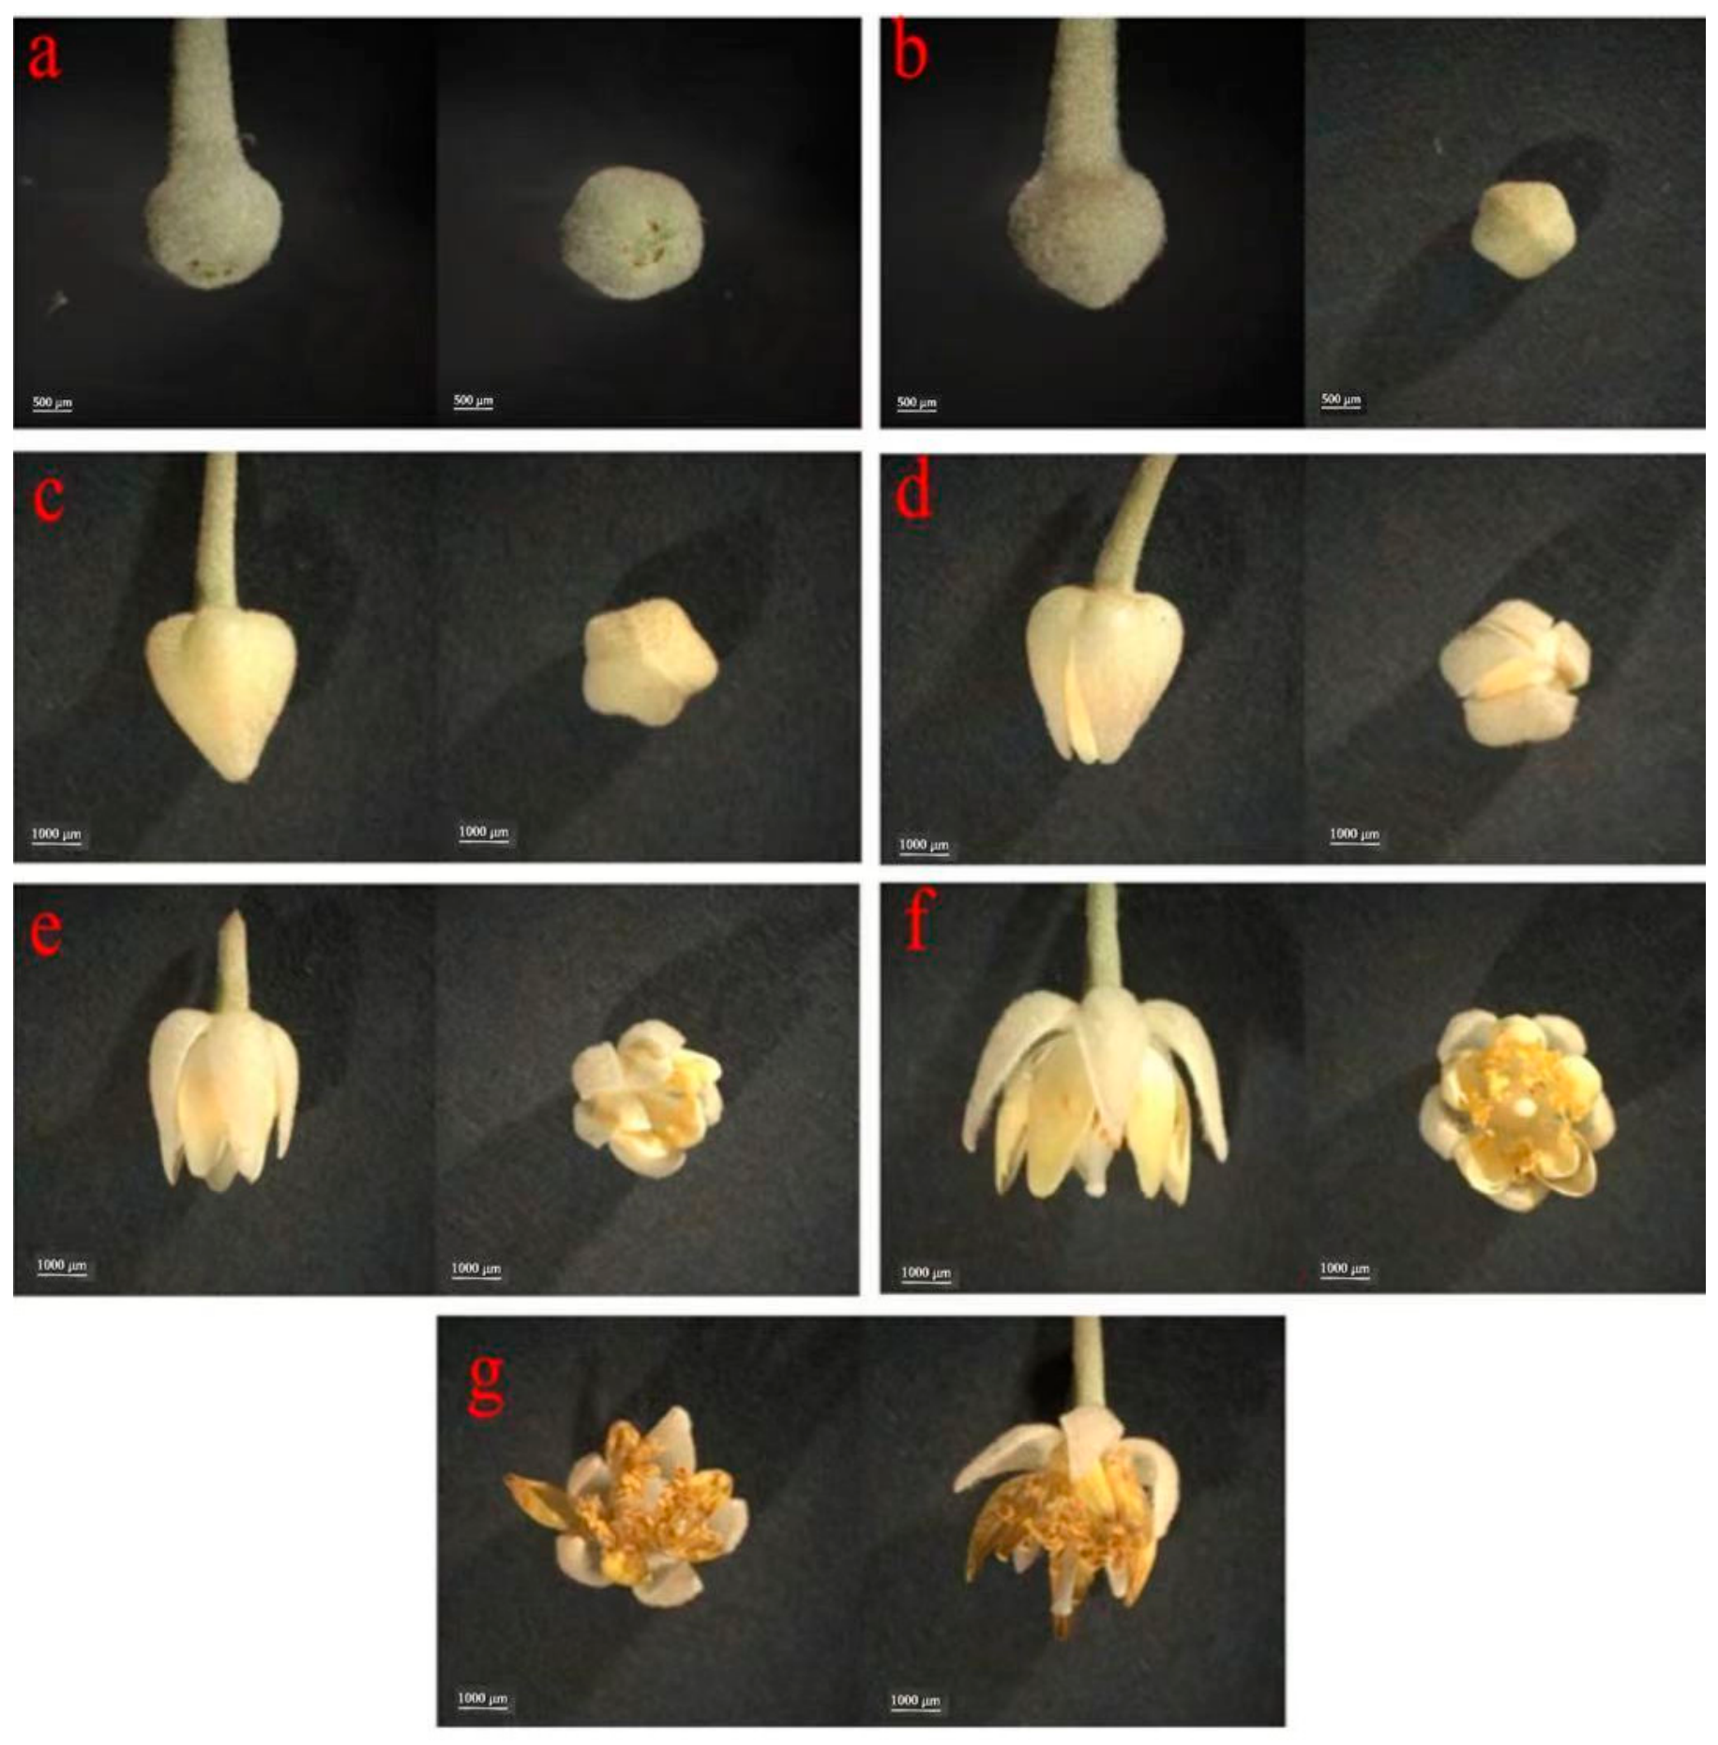
A twenty-year-old healthy T. mandshurica tree with consistent growth status was selected as the experimental material, grown in the campus of Beihua University, Jilin City, China (43.83° N, 126.60° E). To eliminate pollinator interference with nectar collection, flower buds were bagged with nylon mesh bags (13 cm × 18 cm; Shouguang Kunlan Plastic Products Factory, Weifang, China) during the early bud developmental stage in mid-May 2024. Floral samples were collected at seven distinct developmental stages (S1–S7). Owing to the small and compact floral architecture of T. mandshurica, anther dehiscence and nectary morphology cannot be reliably distinguished by visual inspection alone. Floral staging was defined by combining diagnostic external morphological traits and scale-bar-calibrated transverse and longitudinal floral dimensions (μm) obtained from microscopic images. Detailed morphological descriptions and quantitative dimensional cutoffs for each stage are provided in the legend of Figure 1. Morphological status of the perianth served as the primary diagnostic trait, and calibrated floral dimensions acted as auxiliary objective criteria for repeatable sampling.
Figure 1.
Floral morphological characteristics of Tilia mandshurica at seven consecutive developmental stages. (a) Pre-bud stage 1 (S1: tightly closed bud, transverse ca. 1700–2000 μm, longitudinal ca. 1300–1500 μm); (b) Pre-bud stage 2 (S2: closed bud, transverse ca. 2200–2600 μm, longitudinal ca. 1800–2000 μm) (c) Bud stage (S3: swollen bud, transverse ca. 3100–3500 μm, longitudinal ca. 4300–4500 μm); (d) Early-blooming stage (S4: slightly separated perianth, transverse ca. 3700–4000 μm, longitudinal ca. 4700–5000 μm); (e) Half-blooming stage (S5: partially open flower, transverse ca. 4000–4300 μm, longitudinal ca. 4000–4500 μm); (f) Full-blooming stage (S6: peak nectar secretion, fully expanded perianth, transverse ca. 4300–4600 μm, longitudinal ca. 3500–4000 μm); (g) Senescence stage (S7: wilting flower, transverse ca. 4000–4200 μm, longitudinal ca. 3200–3500 μm). Floral transverse and longitudinal dimensions (μm) were calibrated by the scale bar. Scale bars: 500 μm (S1–S2) and 1000 μm (S3–S7).
All samples were harvested between 8:00 and 9:00 a.m. to minimize diurnal fluctuations in carbohydrate metabolism and nectar secretion. Three within-tree biological replicates were prepared for each stage; each replicate was sampled from separate, spatially independent branches of the same individual T. mandshurica tree. This sampling design was chosen to minimize confounding genetic variation between individuals and focus on the developmental dynamics of nectar secretion and gene expression across floral stages within a single genotype. For single-flower nectar volume, 30 intact healthy flowers were collected per developmental stage in each biological replicate, resulting in 210 flowers per replicate across all seven stages and a total of 630 flowers for the three replicates. Fresh floral subsamples were immediately used to measure single-flower nectar volume after harvesting. For each replicate used in physiological and molecular assays, a sufficient number of healthy, intact flowers were randomly collected and pooled. All physiological and molecular assays, including carbohydrate quantification and transcriptome sequencing, were conducted using whole-flower tissues. Samples intended for sugar quantification, transcriptome sequencing, and qRT-PCR validation were snap-frozen in liquid nitrogen and stored at −80 °C until further analysis (Figure 1).
2.2. Single-Flower Nectar Volume Measurement
For each floral developmental stage, 30 intact and healthy flowers were randomly collected from experimental trees for single-flower nectar quantification, with a total of 630 flowers measured. Nectar was collected using glass capillary tubes (inner diameter = 0.3 mm; Yitai Glass Instrument Co., Ltd., Nantong, China). Single-flower nectar volume was calculated based on the length of the nectar liquid column in capillaries, following the formula established by Hermann and Parker [15]:
V = S × L
2.3. Carbohydrate Quantification
The contents of three soluble sugars (fructose, glucose, sucrose) and starch in whole floral tissues across seven developmental stages (S1–S7) were determined via colorimetric assays, with three biological replicates per stage. For each carbohydrate assay, 0.1 g of whole flower tissue ground in liquid nitrogen was used.
For glucose quantification: 0.1 g ground sample was mixed with 0.5 mL distilled water and incubated in a 95 °C water bath for 10 min. After cooling to room temperature, the mixture was centrifuged at 8000× g for 10 min. A 50 μL aliquot of the supernatant was mixed with 10 μL 6 mol/L HCl and incubated at 80 °C for 30 min. An additional 10 μL 6 mol/L HCl and 30 μL of distilled water were added and mixed. Then, 50 μL of the mixture was combined with 50 μL DNS reagent. (The DNS reagent was prepared as follows: 6.3 g of 3,5-dinitrosalicylic acid and 262 mL of 2 mol/L NaOH solution were added to 500 mL hot aqueous solution containing 185 g potassium sodium tartrate, followed by addition of 5 g crystalline phenol and 5 g sodium nitrite. After cooling, the solution was brought to a final volume of 1000 mL with distilled water and stored in a brown bottle at ambient temperature. The mixture was incubated in a boiling water bath for 5 min, cooled to room temperature, diluted with 200 μL distilled water, and absorbance was recorded at 540 nm using a spectrophotometer (Thermo Fisher Scientific, Waltham, DE, USA). Glucose content was calculated based on the pre-established standard curve.
For total starch quantification: 0.1 g ground tissue was mixed with 1 mL anhydrous diethyl ether, shaken thoroughly, and centrifuged at 8000× g at room temperature for 10 min; the supernatant was discarded. The pellet was homogenized in 1 mL 80% (v/v) ethanol and incubated at 80 °C for 30 min, followed by centrifugation at 8000× g for 10 min at room temperature. The supernatant was discarded. The pellet was mixed with 0.5 mL distilled water and boiled for 15 min. After cooling, 0.5 mL 6 mol/L HCl was added and the mixture was incubated at 95 °C for 1 h. Complete starch hydrolysis was verified using iodine reagent. The mixture was then centrifuged at 8000× g for 10 min at room temperature. The supernatant was diluted with distilled water. A 50 μL aliquot of diluted supernatant was transferred into a 1.5 mL EP tube, followed by the addition of 50 μL 6 mol/L NaOH for neutralization. Then 50 μL DNS reagent was added. The reaction mixture was boiled for 5 min, cooled, supplemented with 200 μL distilled water, and absorbance was measured at 540 nm. Total starch content was calculated using the standard curve with a conversion factor from glucose to starch.
For fructose quantification: 0.1 g ground sample was extracted with 0.5 mL 80% (v/v) ethanol at 80 °C for 40 min, with shaking every 10 min during incubation. After cooling, the mixture was centrifuged at 4000× g for 10 min. Then 5 mg activated charcoal was added to the supernatant for decolorization at 80 °C for 30 min, followed by centrifugation at 4000× g for 10 min. A 60 μL aliquot of supernatant was mixed with 60 μL 30% (w/v) HCl and 120 μL 0.1% (w/v) resorcinol. The mixture was incubated at 80 °C for 10 min, cooled, and absorbance was detected at 480 nm. Fructose concentration was calculated using the corresponding standard curve.
For sucrose quantification: 0.1 g ground whole flower tissue was homogenized in 0.5 mL 80% (v/v) ethanol and extracted at 80 °C for 40 min with shaking 3–5 times during incubation. After cooling, the sample was centrifuged at 4000× g for 10 min. The supernatant was decolorized using 5 mg activated charcoal at 80 °C for 30 min and re-centrifuged at 4000× g. A 40 μL aliquot of supernatant was mixed with 20 μL 2 mol/L NaOH and boiled for 5 min. After cooling, 280 μL 30% (w/v) HCl and 80 μL 0.1% (w/v) resorcinol were added. The mixture was incubated at 80 °C for 10 min, cooled, and absorbance was recorded at 480 nm. Sucrose content was quantified using its standard curve.
Standard curves were constructed with serial dilutions of authentic sugar standards. For glucose, a 5 mg/mL stock solution was diluted to 1.2, 1.0, 0.6, 0.5, 0.4, 0.2, and 0.1 mg/mL. For starch quantification, a 5 mg/mL glucose stock was diluted to 1.0, 0.9, 0.8, 0.6, 0.4, 0.2, and 0.1 mg/mL. For fructose, a 10 mg/mL stock was diluted to 1.0, 0.8, 0.6, 0.5, 0.3, 0.2, 0.1, and 0.0 mg/mL. For sucrose, a 5 mg/mL stock was diluted to 1.0, 0.8, 0.5, 0.4, 0.3, 0.2, 0.1, and 0.0 mg/mL. Standard solutions were assayed in parallel with samples to establish the linear calibration curves.
All metabolite contents were normalized to fresh weight and expressed as mg g−1. Details of the standard curves, including linear equations and R2 values, are summarized in Supplementary Table S1.
2.4. Transcriptome Sequencing and Bioinformatic Analysis
Total RNA was extracted from whole floral tissues (entire flowers) using the RNA Pure Plant Kit (Tiangen Biotech, Beijing, China). RNA purity and concentration were determined with a NanoDrop 2000 spectrophotometer (Thermo Fisher Scientific, DE, USA), and RNA integrity was verified using an Agilent 2100 Bioanalyzer (Agilent Technologies, Santa Clara, CA, USA). Qualified RNA samples (1 μg per sample) were used for cDNA library construction. mRNA with poly(A) tails was enriched using oligo(dT) magnetic beads, and fragmented randomly in fragmentation buffer. First-strand and second-strand cDNA were subsequently synthesized. The protruding ends were converted into blunt ends by T4 DNA polymerase. After adenylation of the 3′ ends of DNA fragments, NEBNext hairpin adapters were ligated. Library fragments were purified with AMPure XP beads (Beckman Coulter, Beverly, CA, USA). The mixture was incubated with 3 μL USER Enzyme (NEB, Ipswich, MA, USA) at 37 °C for 15 min, followed by heating at 95 °C for 5 min prior to PCR amplification. High-fidelity DNA polymerase, universal PCR primers and index primers were used for PCR. Purified PCR products were assessed using the Agilent 2100 Bioanalyzer. Library concentration was quantified with a Qubit 3.0 fluorometer (Thermo Fisher Scientific, Waltham, DE, USA), and accurate quantification was performed via qPCR (QS5, Thermo Fisher Scientific, Waltham, DE, USA). Libraries with effective concentrations higher than 2 × 10⁻⁹ mol/L were sequenced on the Illumina NovaSeq platform to generate 150 bp paired-end reads.
Raw RNA-seq reads were deposited in the NCBI Sequence Read Archive (SRR38740801–SRR38740821). Raw reads were trimmed using Trimmomatic v0.39 to remove adapters and low-quality sequences. Reads containing adapters, reads with >10% ambiguous N bases, and reads with over 50% bases with Q-score ≤ 10 were discarded to obtain clean reads. Q20, Q30, GC content, and sequence duplication level were calculated for the clean dataset. Clean reads were aligned to the T. mandshurica reference genome (PRJNA1438970) using HISAT2 v2.0.4. StringTie v2.2.1 was used for transcript assembly [16,17]. Gene-level raw read counts were quantified from mapped reads. Gene expression abundance was calculated as FPKM (Fragments Per Kilobase of transcript per Million mapped reads) [18]. TPM values were additionally calculated exclusively for correlation analysis between RNA-seq and qRT-PCR validation. The raw read count matrix and FPKM expression matrix for all genes are provided in Supplementary Tables S2 and S3.
Differential expression analysis was performed using DESeq2 based on a negative binomial model, with gene-level raw integer read counts as input [19]. To control for false positives resulting from multiple testing, the Benjamini–Hochberg algorithm was applied to adjust original p-values for the false discovery rate (FDR). Genes with |log2(fold change)| ≥ 1.0 (fold change ≥ 2) and FDR < 0.01 were defined as differentially expressed genes (DEGs).
2.5. Weighted Gene Coexpression Network Analysis (WGCNA)
WGCNA was performed on filtered FPKM gene expression data using the ShawnLearnBioinfo WGCNA shiny plugin (v0.0.6.230118) in TBtools (v1.120). The expression matrix was pre-filtered in two sequential steps: (1) genes with FPKM < 1 in more than 90% of samples were discarded; (2) the remaining genes were ranked by median absolute deviation (MAD), and the top 8000 genes with the highest MAD values were retained for network construction. No additional log-transformation or scaling was applied to FPKM values before analysis. Carbohydrate quantification was conducted on identical matched biological samples used for RNA-seq (n = 21 samples in total). The plugin follows the native WGCNA workflow, with no undocumented normalization or value capping applied to the adjacency matrix. A soft-thresholding power of 24 was selected based on scale-free topology fit index (R2) and mean connectivity diagnostics; the diagnostic plots for power selection were supplied as Supplementary Figure S1. Gene modules were identified via dynamic tree cutting with the parameters: minimum module size = 30, merge cut height = 0.25. Pearson correlation analysis was used to assess associations between module eigengenes and four key carbohydrate traits (starch, fructose, glucose, sucrose). Modules with |r| ≥ 0.8 and p < 0.01 were defined as strongly trait-associated modules, while modules with 0.6 ≤ |r| < 0.8 and p < 0.01 were defined as moderately trait-associated modules. Hub genes were screened separately according to module-trait association strength: strongly associated modules (turquoise and blue) used thresholds of KME ≥ 0.90 and GS ≥ 0.90; moderately associated modules (brown, green and red) used thresholds of KME ≥ 0.80 and GS ≥ 0.80.
2.6. Quantitative RT-PCR Validation
Total RNA from seven floral developmental stages (S1–S7) was reverse-transcribed into first-strand cDNA. Nine candidate genes associated with sugar metabolism and regulation were selected for qRT-PCR verification using TB Green Premix Ex Taq II (Tli RNaseH Plus, Takara Bio, Shiga, Japan) on a 7500 Fast Real-Time PCR System (Thermo Fisher Scientific, USA). The primer pairs were originally designed and validated in our previous study, including specificity verification by melting curve and agarose electrophoresis, and amplification efficiency determination using serially diluted cDNA. TmActin was used as the internal reference gene for qRT-PCR normalization, as its stable expression during flower development of this species has been validated in our previous study [20]. The qRT-PCR reaction was performed in a 20 μL system containing 10 μL of 2 × TB Green Premix Ex Taq II, 0.4 μL of forward primer (10 μM), 0.4 μL of reverse primer (10 μM), 1 μL of cDNA template, and 8.2 μL of RNase-free water. The amplification program was as follows: initial denaturation at 95 °C for 3 min, followed by 40 cycles of denaturation at 95 °C for 10 s, annealing at 58 °C for 30 s, and extension at 72 °C for 30 s. Melting curve analysis was conducted from 60 °C to 95 °C to confirm specific amplification. Relative gene expression levels were calculated via the 2−∆∆Ct method, using S1 as the calibrator sample. Three biological replicates were performed for each developmental stage. All primer sequences are listed in Supplementary Table S4. Pearson correlation analysis was performed to evaluate the correlation between qRT-PCR and RNA-seq TPM values (Supplementary Figure S2).
2.7. Data Analysis
Data analysis was performed using SPSS (v27.0, IBM, Armonk, NY, USA). One-way analysis of variance (ANOVA) was carried out for phenotypic and carbohydrate data across floral developmental stages, and Duncan’s multiple range test was used for post hoc multiple comparisons. The linear model for ANOVA was:
Yij = μ + αi + eij
Pearson’s correlation analysis was performed in SPSS (v27.0, IBM, Armonk, NY, USA) to evaluate pairwise associations among sugar contents, functional genes and transcription factors. Seven observations corresponding to the seven floral developmental stages (S1–S7) were included for each pairwise correlation test. Pairs with |r| ≥ 0.5 and p ≤ 0.05 were considered to have suggestive associations.
3. Results
3.1. Dynamic Characteristics of Single-Flower Nectar Secretion
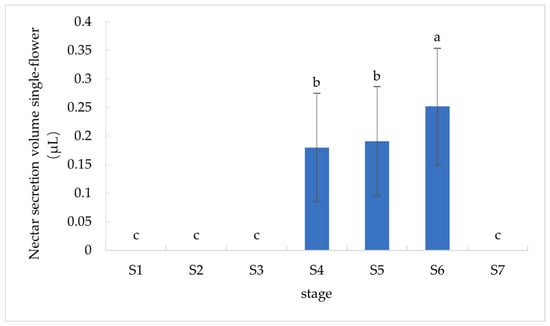
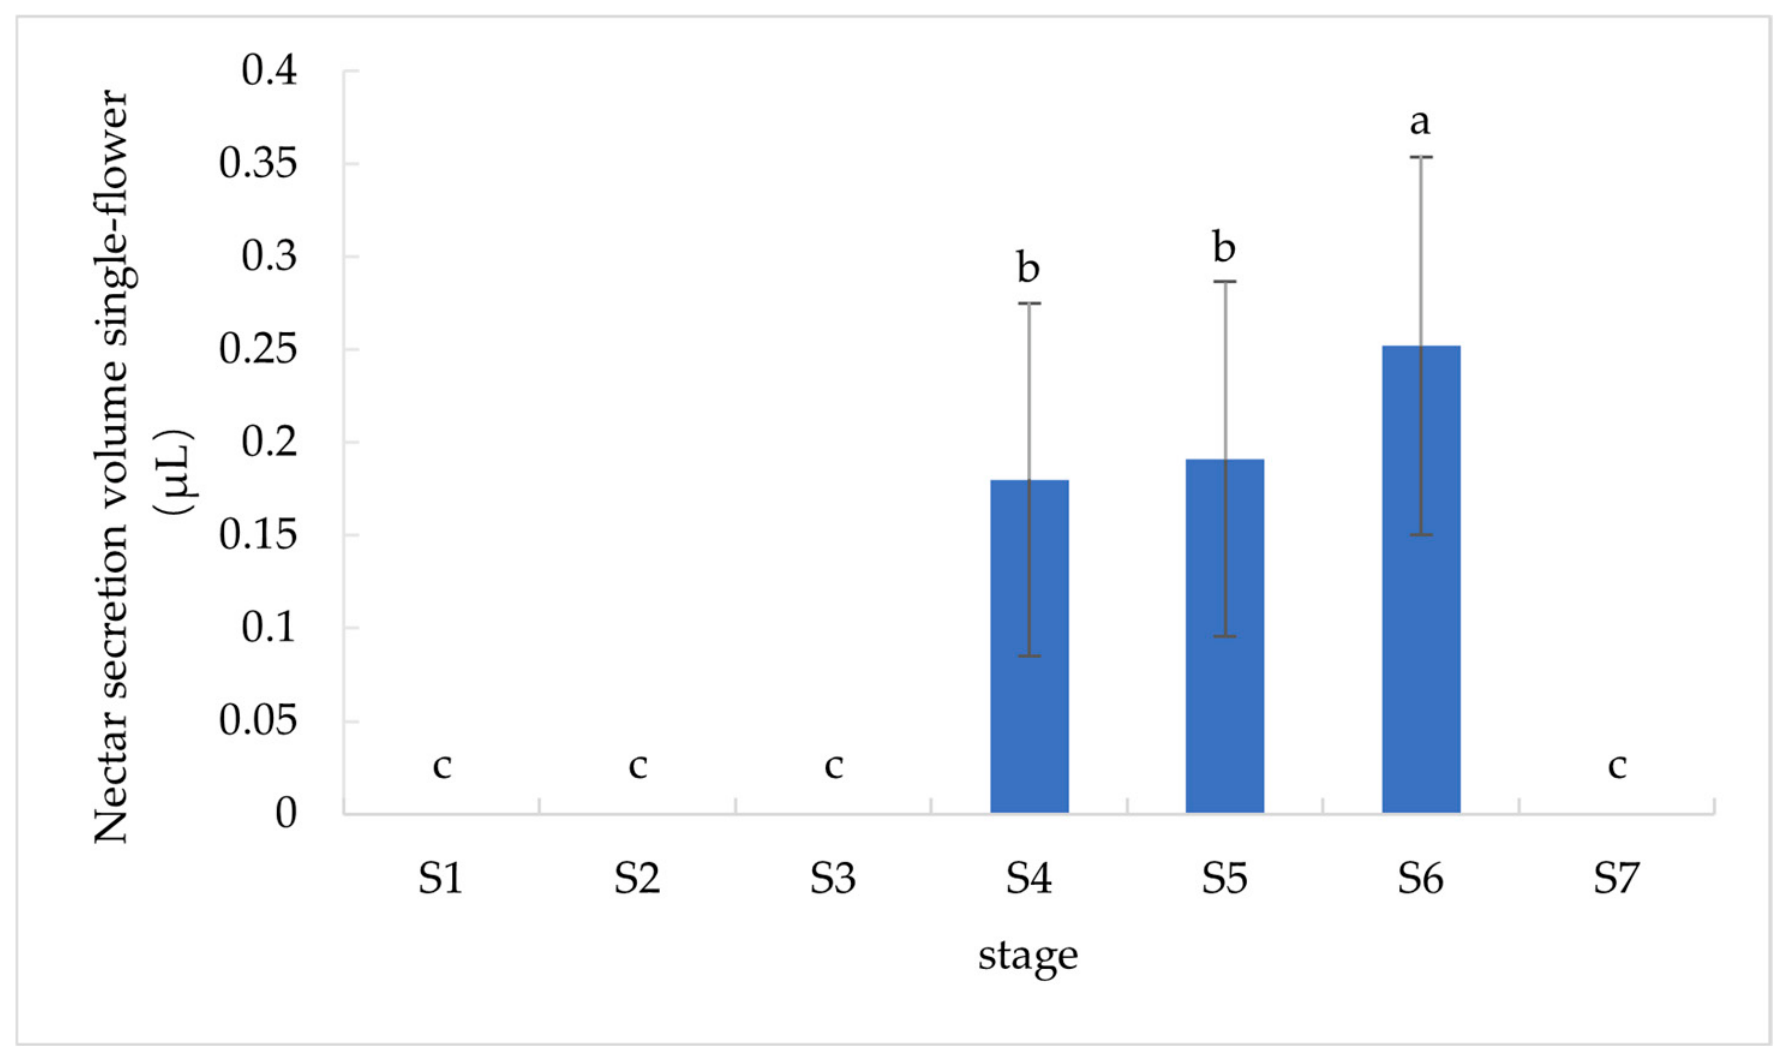
Quantitative analysis of single-flower nectar secretion across consecutive floral developmental stages revealed stage-specific secretory patterns in T. mandshurica. No detectable nectar was produced during the pre-bud and bud stages (S1–S3) and senescence stage (S7). Nectar secretion was exclusively initiated at the early-blooming stage (S4) and persisted until the full-blooming stage (S6), with an overall increasing trend in nectar volume during this period. Statistical analysis showed no significant difference in nectar yield between S4 and S5, while the S6 stage exhibited significantly higher single-flower nectar volume. The average nectar secretion volumes of S4, S5, and S6 were 0.180 ± 0.095 μL, 0.191 ± 0.096 μL, and 0.252 ± 0.102 μL per flower, respectively (Figure 2).
Figure 2.
Dynamic changes in single-flower nectar secretion volume of T. mandshurica across different floral developmental stages (S1–S7: pre-bud to senescence stage). The x-axis represents floral developmental stages, and the y-axis denotes single-flower nectar secretion volume. Error bars represent standard deviation (SD). Different lowercase letters above bars indicate significant differences determined by one-way ANOVA followed by Duncan’s multiple range test (p < 0.05).
3.2. Dynamic Changes in Sugar Components During Floral Development
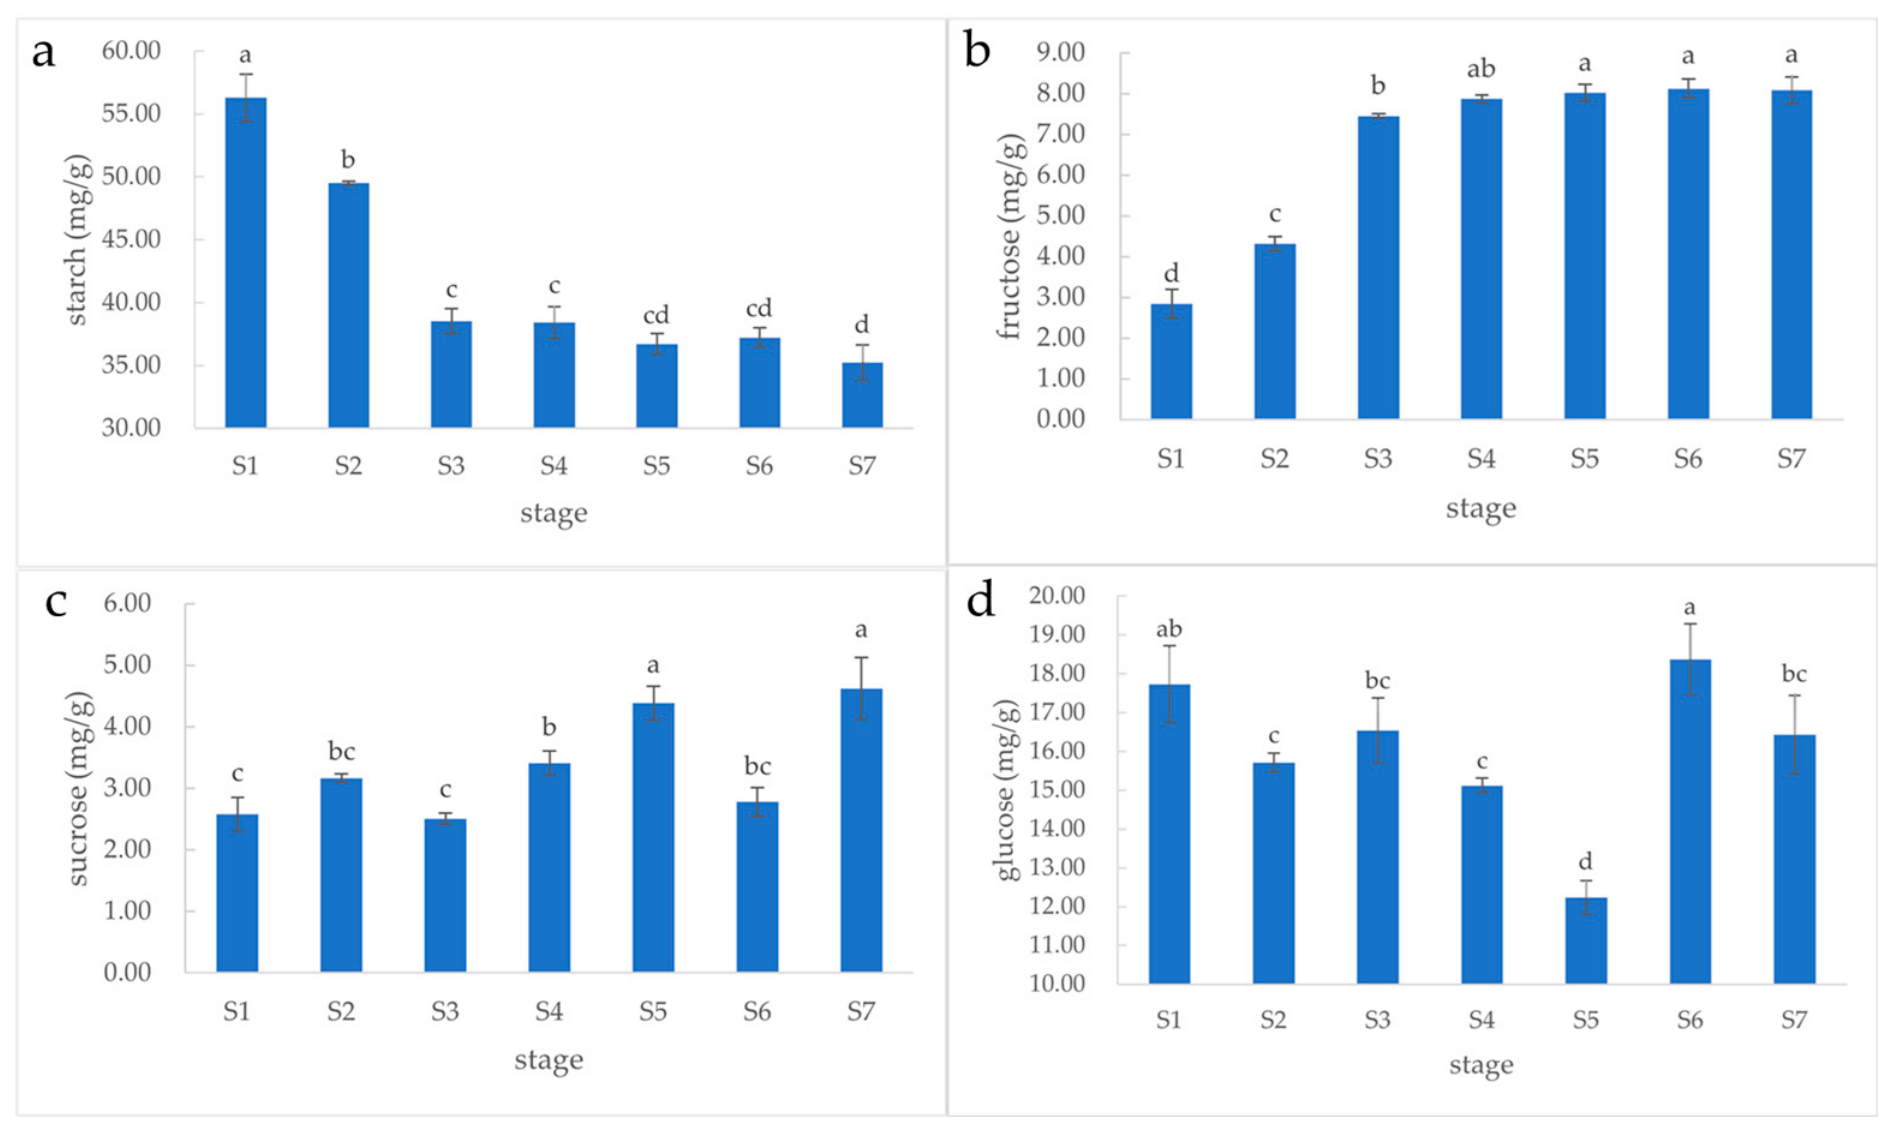
Starch acts as the primary precursor for nectar sugar synthesis, while sucrose, glucose, and fructose are the major soluble sugar components in nectar. Significant stage-specific differences in the contents of the four carbohydrates were observed during floral development, whereas no significant variation was detected among individual experimental trees.
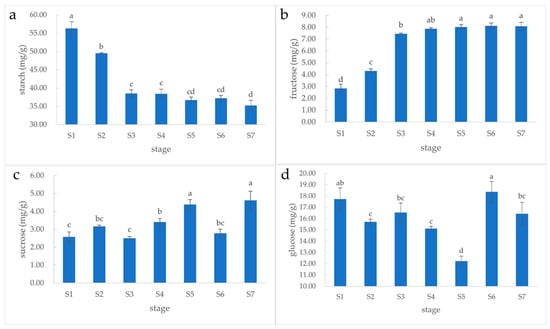
Starch content peaked at the S1 stage, decreased continuously during pre-bud and bud stages (S1–S3), and remained relatively stable in subsequent stages. Fructose content exhibited an opposite variation trend, with a sharp increase from S1 to S3 followed by stable accumulation. Sucrose content remained unchanged during S1–S3, increased significantly from S3 to S5, declined at S6, and rebounded at the senescence stage (S7). By contrast, glucose content showed an inverse pattern relative to sucrose: stable at S1–S3, continuously decreased from S3 to S5, reached the maximum level at S6, and declined at S7 (Figure 3).
Figure 3.
Variations in floral carbohydrate contents of T. mandshurica during seven successive developmental stages (S1–S7: pre-bud to senescence stage). Subplots show (a) starch, (b) fructose, (c) sucrose, and (d) glucose contents. The x-axis represents floral developmental stages, and the y-axis denotes carbohydrate content. Error bars represent standard deviation (SD). Different lowercase letters indicate significant differences determined by one-way ANOVA followed by Duncan’s multiple range test (p < 0.05).
3.3. Transcriptome Sequencing Quality Assessment
A total of 129.30 Gb of clean data was obtained from 21 floral samples, with 5.87–7.56 Gb of clean data per sample. The Q30 base ratio of all samples exceeded 97%, and the GC content ranged from 42.69% to 43.26% (Supplementary Table S5). The read alignment efficiency against the reference genome ranged from 94.51% to 96.23%, and the exon mapping ratio was 88.35–91.02% (Supplementary Tables S6 and S7), confirming high-quality and reliable transcriptome data for subsequent analysis.
FPKM density distribution, gene expression boxplots, and sample correlation heatmaps further verified the reproducibility and uniformity of transcriptome data. All samples exhibited consistent gene expression distribution patterns, and the median expression levels were highly uniform across samples. The correlation coefficients of within-tree biological replicates within each group were greater than 0.82, indicating excellent experimental reproducibility for this specific genotype (Supplementary Figure S2).
3.4. Differential Expression Gene Analysis Across Developmental Stages
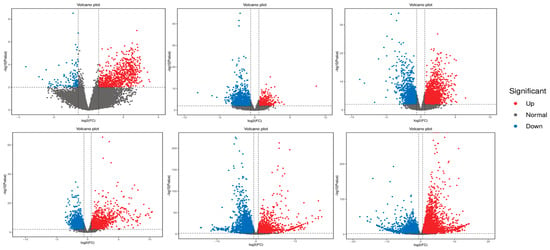
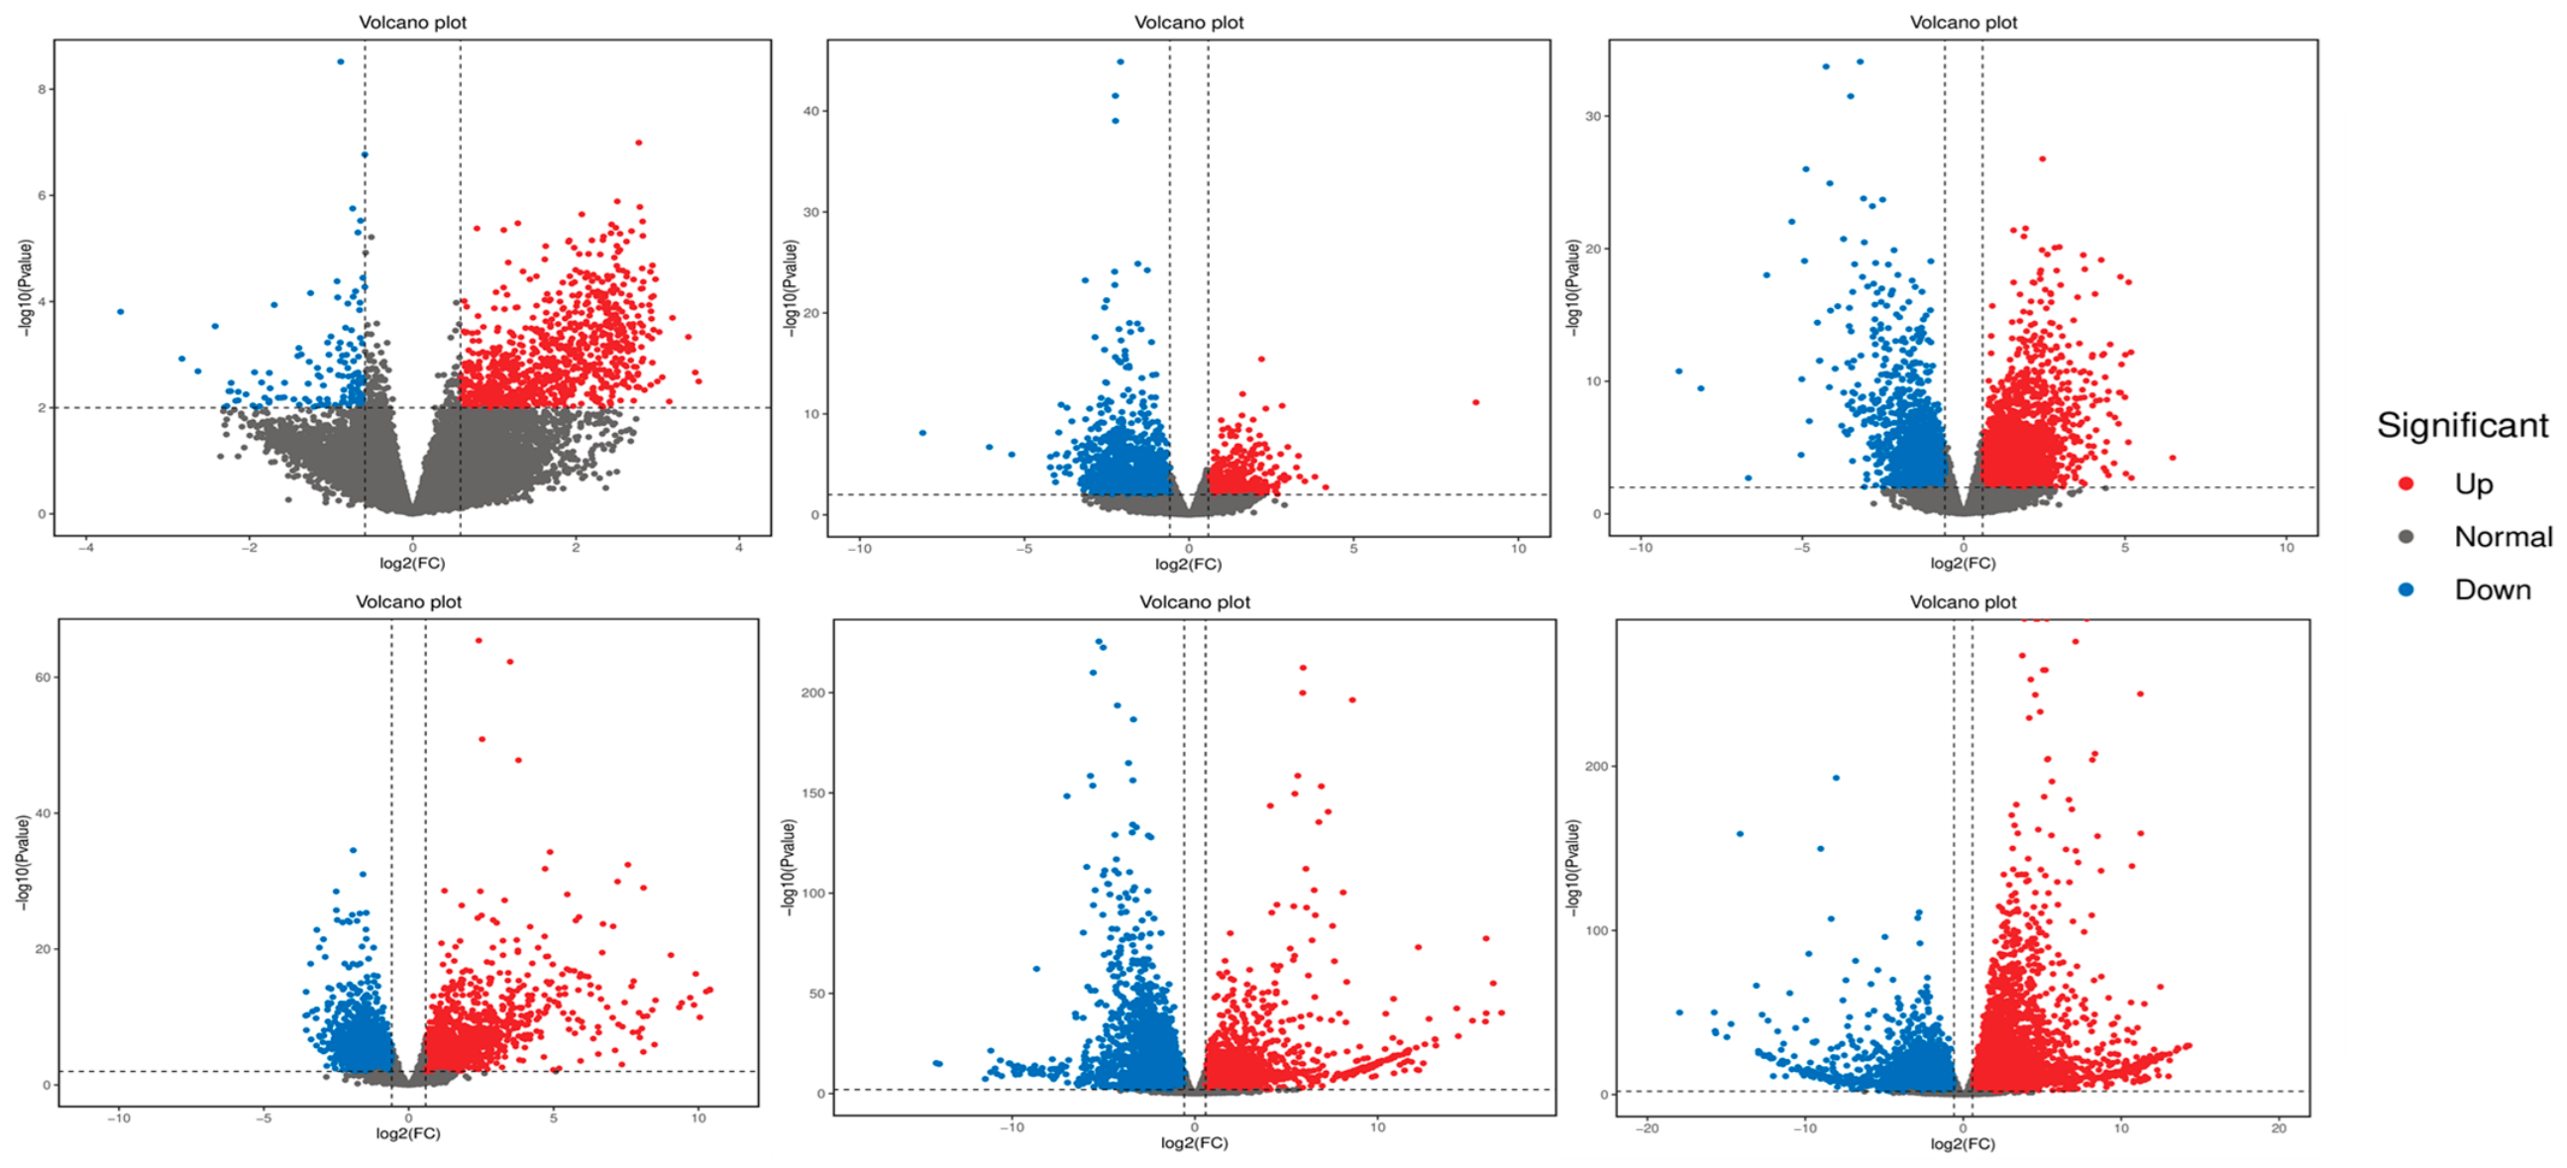
Pairwise DEG comparison revealed stage-specific gene expression patterns throughout floral development within this sequenced individual: 7930 DEGs (3249 upregulated, 4681 downregulated) in S1 vs. S2; 16390 DEGs (8117 upregulated, 8273 downregulated) in S2 vs. S3; 4809 DEGs (2804 upregulated, 2005 downregulated) in S3 vs. S4; 1887 DEGs (585 upregulated, 1302 downregulated) in S4 vs. S5; 1005 DEGs (877 upregulated, 128 downregulated) in S5 vs. S6; and 5079 DEGs (2440 upregulated, 2639 downregulated) in S6 vs. S7 (Figure 4). The most drastic transcriptomic changes occurred during the bud-to-flower transition (S2–S3), implying extensive transcriptional reprogramming underlying floral development and nectar precursor accumulation in this genotype (Figure 4).
Figure 4.
Volcano plots illustrating DEGs derived from pairwise comparisons of successive floral stages (S1 vs. S2, S2 vs. S3, S3 vs. S4, S4 vs. S5, S5 vs. S6, S6 vs. S7). The x-axis represents log2(fold change), and the y-axis denotes −log10(FDR). Vertical dashed lines mark the threshold of log2(fold change ≥ 1.0, and the horizontal dashed line indicates the FDR threshold of 0.01. Red dots represent significantly upregulated DEGs, blue dots indicate significantly downregulated DEGs, and grey dots correspond to genes without significant expression changes.
3.5. Weighted Gene Coexpression Network Analysis Identified Sugar-Related Core Modules
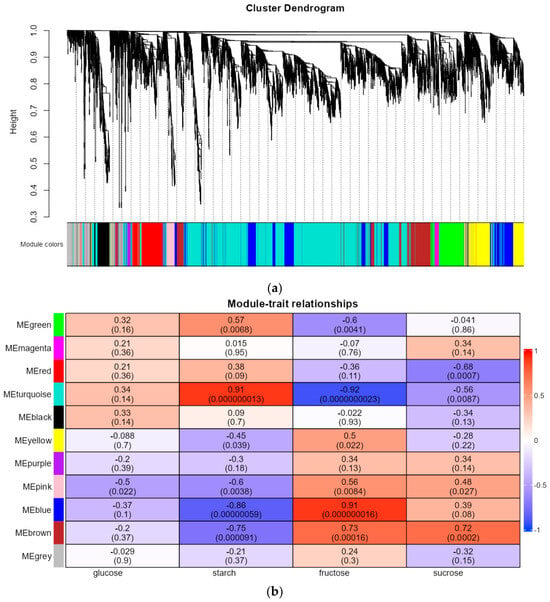
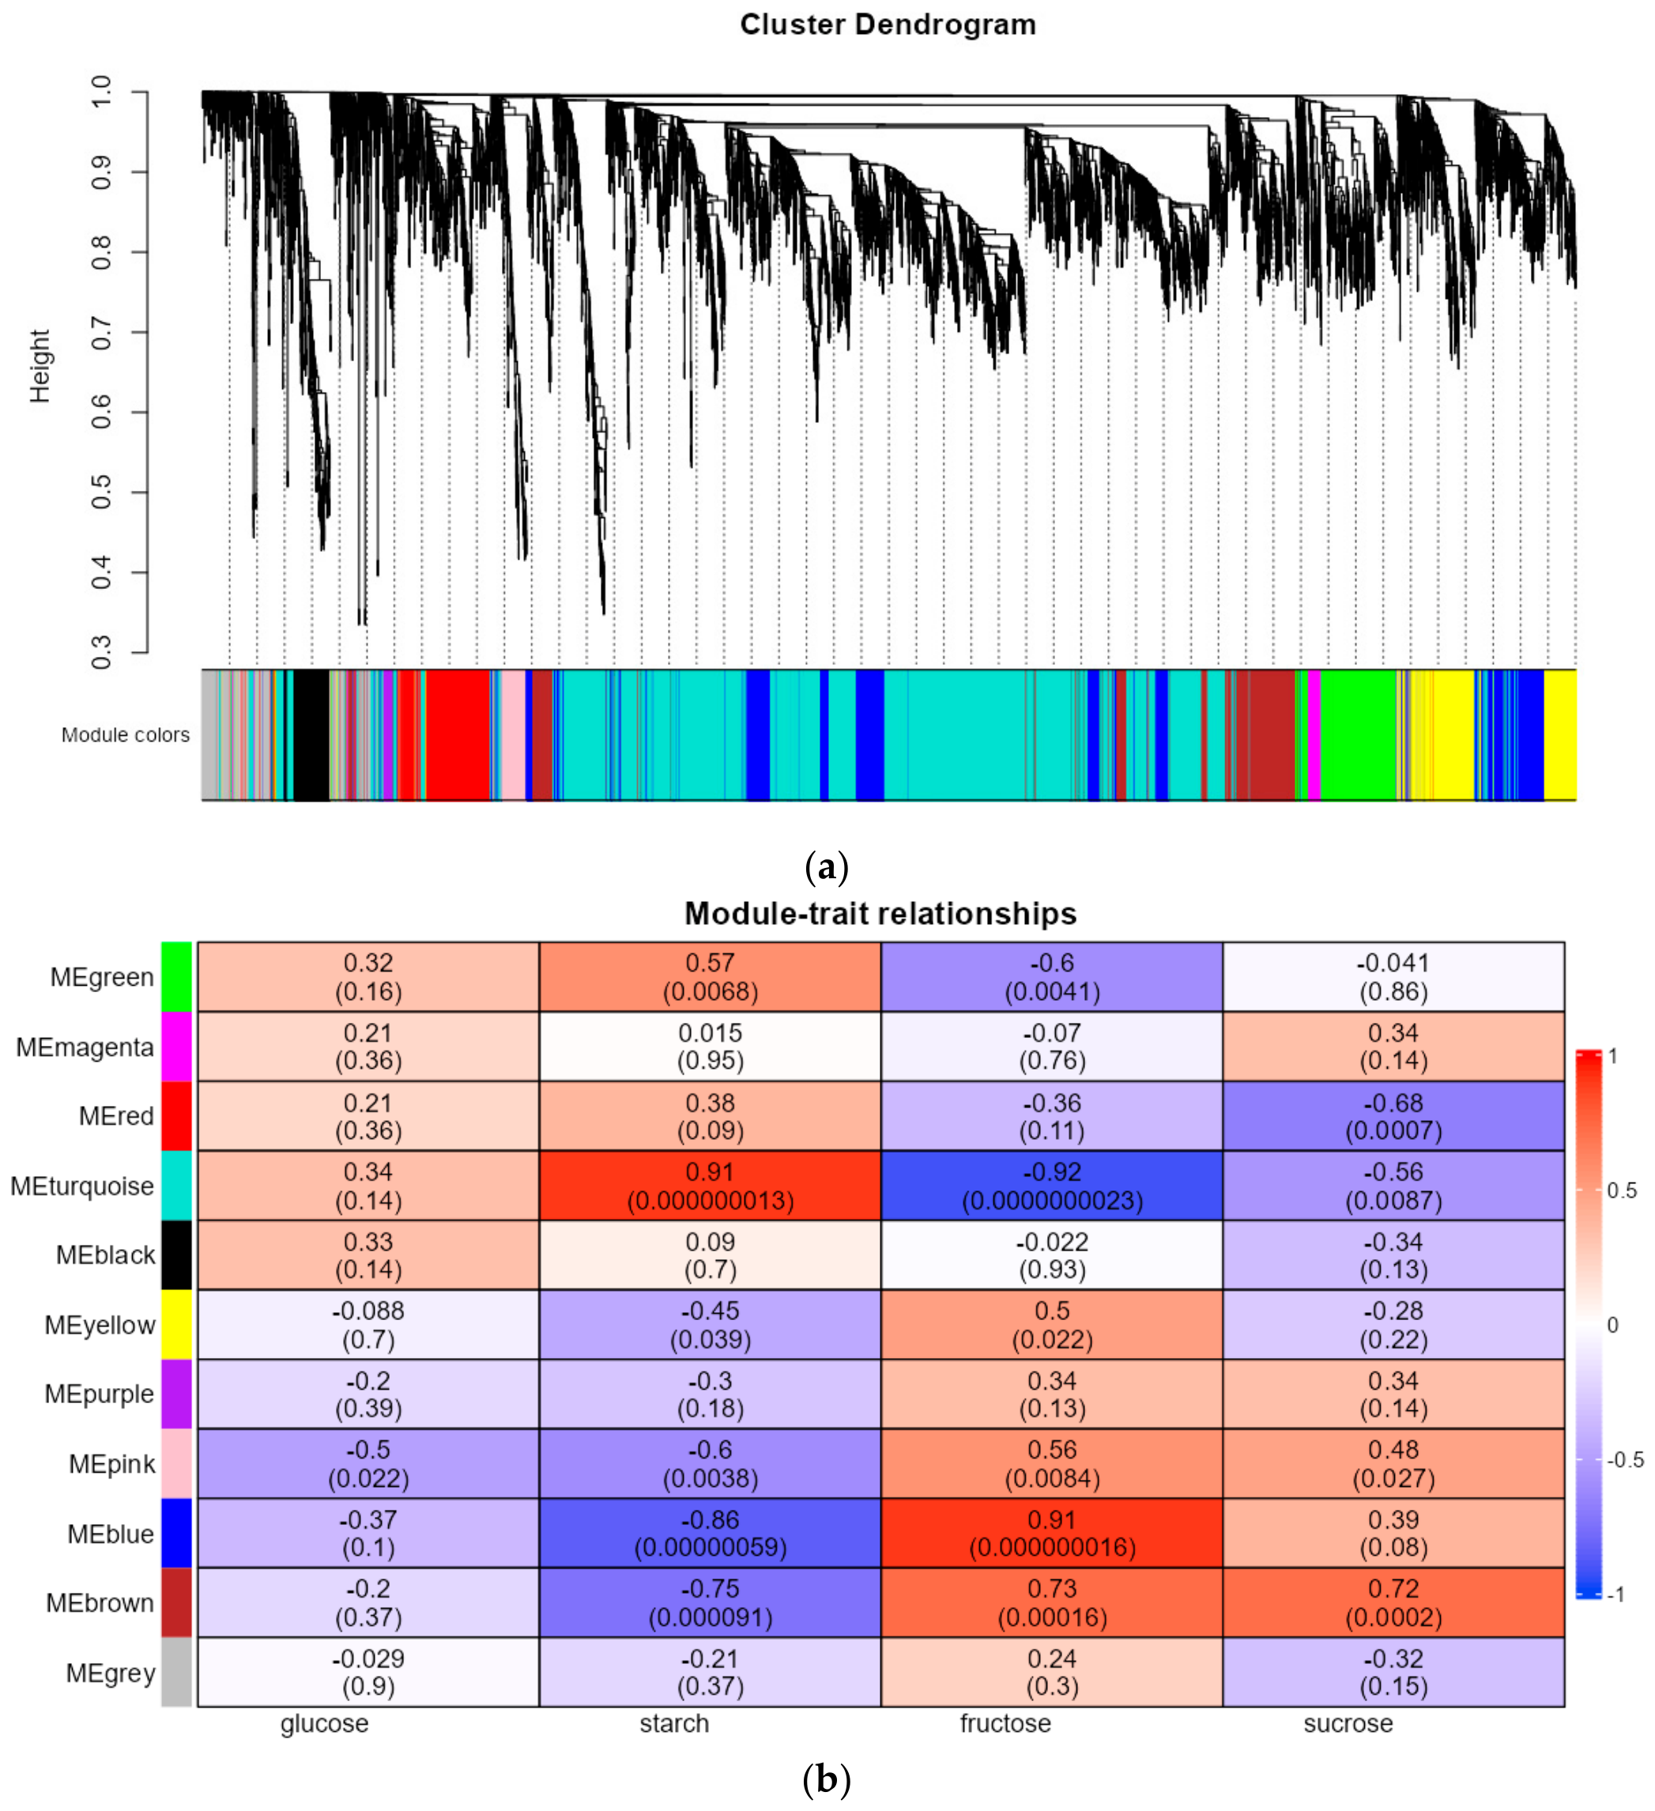
WGCNA clustered the top 8000 expressed genes into 11 distinct co-expression modules (Figure 5a). Correlation analysis between module eigengenes and sugar traits identified six core modules closely associated with sugar dynamics (Figure 5b). The green and turquoise modules were significantly positively correlated with starch content (r = 0.57, 0.91) and negatively correlated with fructose content (r = −0.60, −0.92), indicating their potential roles in starch degradation and fructose accumulation. The pink, blue, and brown modules showed negative correlations with starch (r = −0.60, −0.86, −0.75) and positive correlations with fructose (r = 0.56, 0.91, 0.73). Additionally, the brown module was positively correlated with sucrose content (r = 0.72), while the red module was negatively correlated with sucrose (r = −0.68), suggesting their potential associations with metabolic processes in sucrose metabolism.
Figure 5.
Weighted gene co-expression network analysis (WGCNA) of floral transcriptomes across seven floral developmental stages (S1–S7: pre-bud stage to senescence stage). (a) Hierarchical cluster dendrogram showing co-expression gene modules. The dendrogram at the top illustrates hierarchical clustering of genes based on pairwise expression dissimilarity; the y-axis represents clustering height. The horizontal color bar below the dendrogram shows the assigned co-expression module for each gene, with distinct colors representing individual modules. (b) Correlation matrix heatmap between co-expression modules and four key sugar phenotypic traits (starch, fructose, glucose, sucrose). Rows represent module eigengenes (ME) of different co-expression modules, and columns correspond to four carbohydrate traits: glucose, starch, fructose, and sucrose contents. The values within each cell show the Pearson correlation coefficient, with the corresponding p-value given in parentheses. The color scale denotes the correlation coefficient, ranging from −1 (dark blue, strong negative correlation) to 1 (dark red, strong positive correlation). This heatmap identifies co-expression modules significantly associated with carbohydrate dynamic changes during flower development.
3.6. Screening of Hub Genes and Transcription Factors
Herein, hub genes with high intramodular connectivity were screened from the six core modules according to the criteria listed in Table 1. In total, 627 hub genes were associated with starch and fructose dynamics, and eight hub genes were specifically correlated with sucrose metabolism. Further functional annotation against the NR database identified thirteen TF genes within these hub candidates, which were subsequently classified into eight families via Plant TFDB annotation, including WRKY, Trihelix, TFIIE, GATA, bHLH, ERF, HSF, and NF-YC (Supplementary Table S8). These TFs represent promising hypothetical upstream regulatory candidates that may modulate sugar metabolic and transport processes during T. mandshurica nectar secretion.
Table 1.
Screening parameters for hub genes identified from core co-expression modules via WGCNA.
3.7. Identification of Sugar Metabolism-Related DEGs
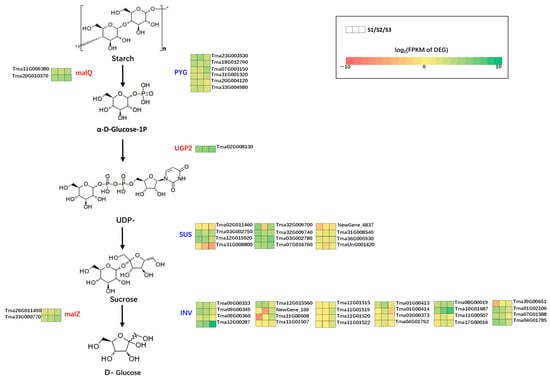
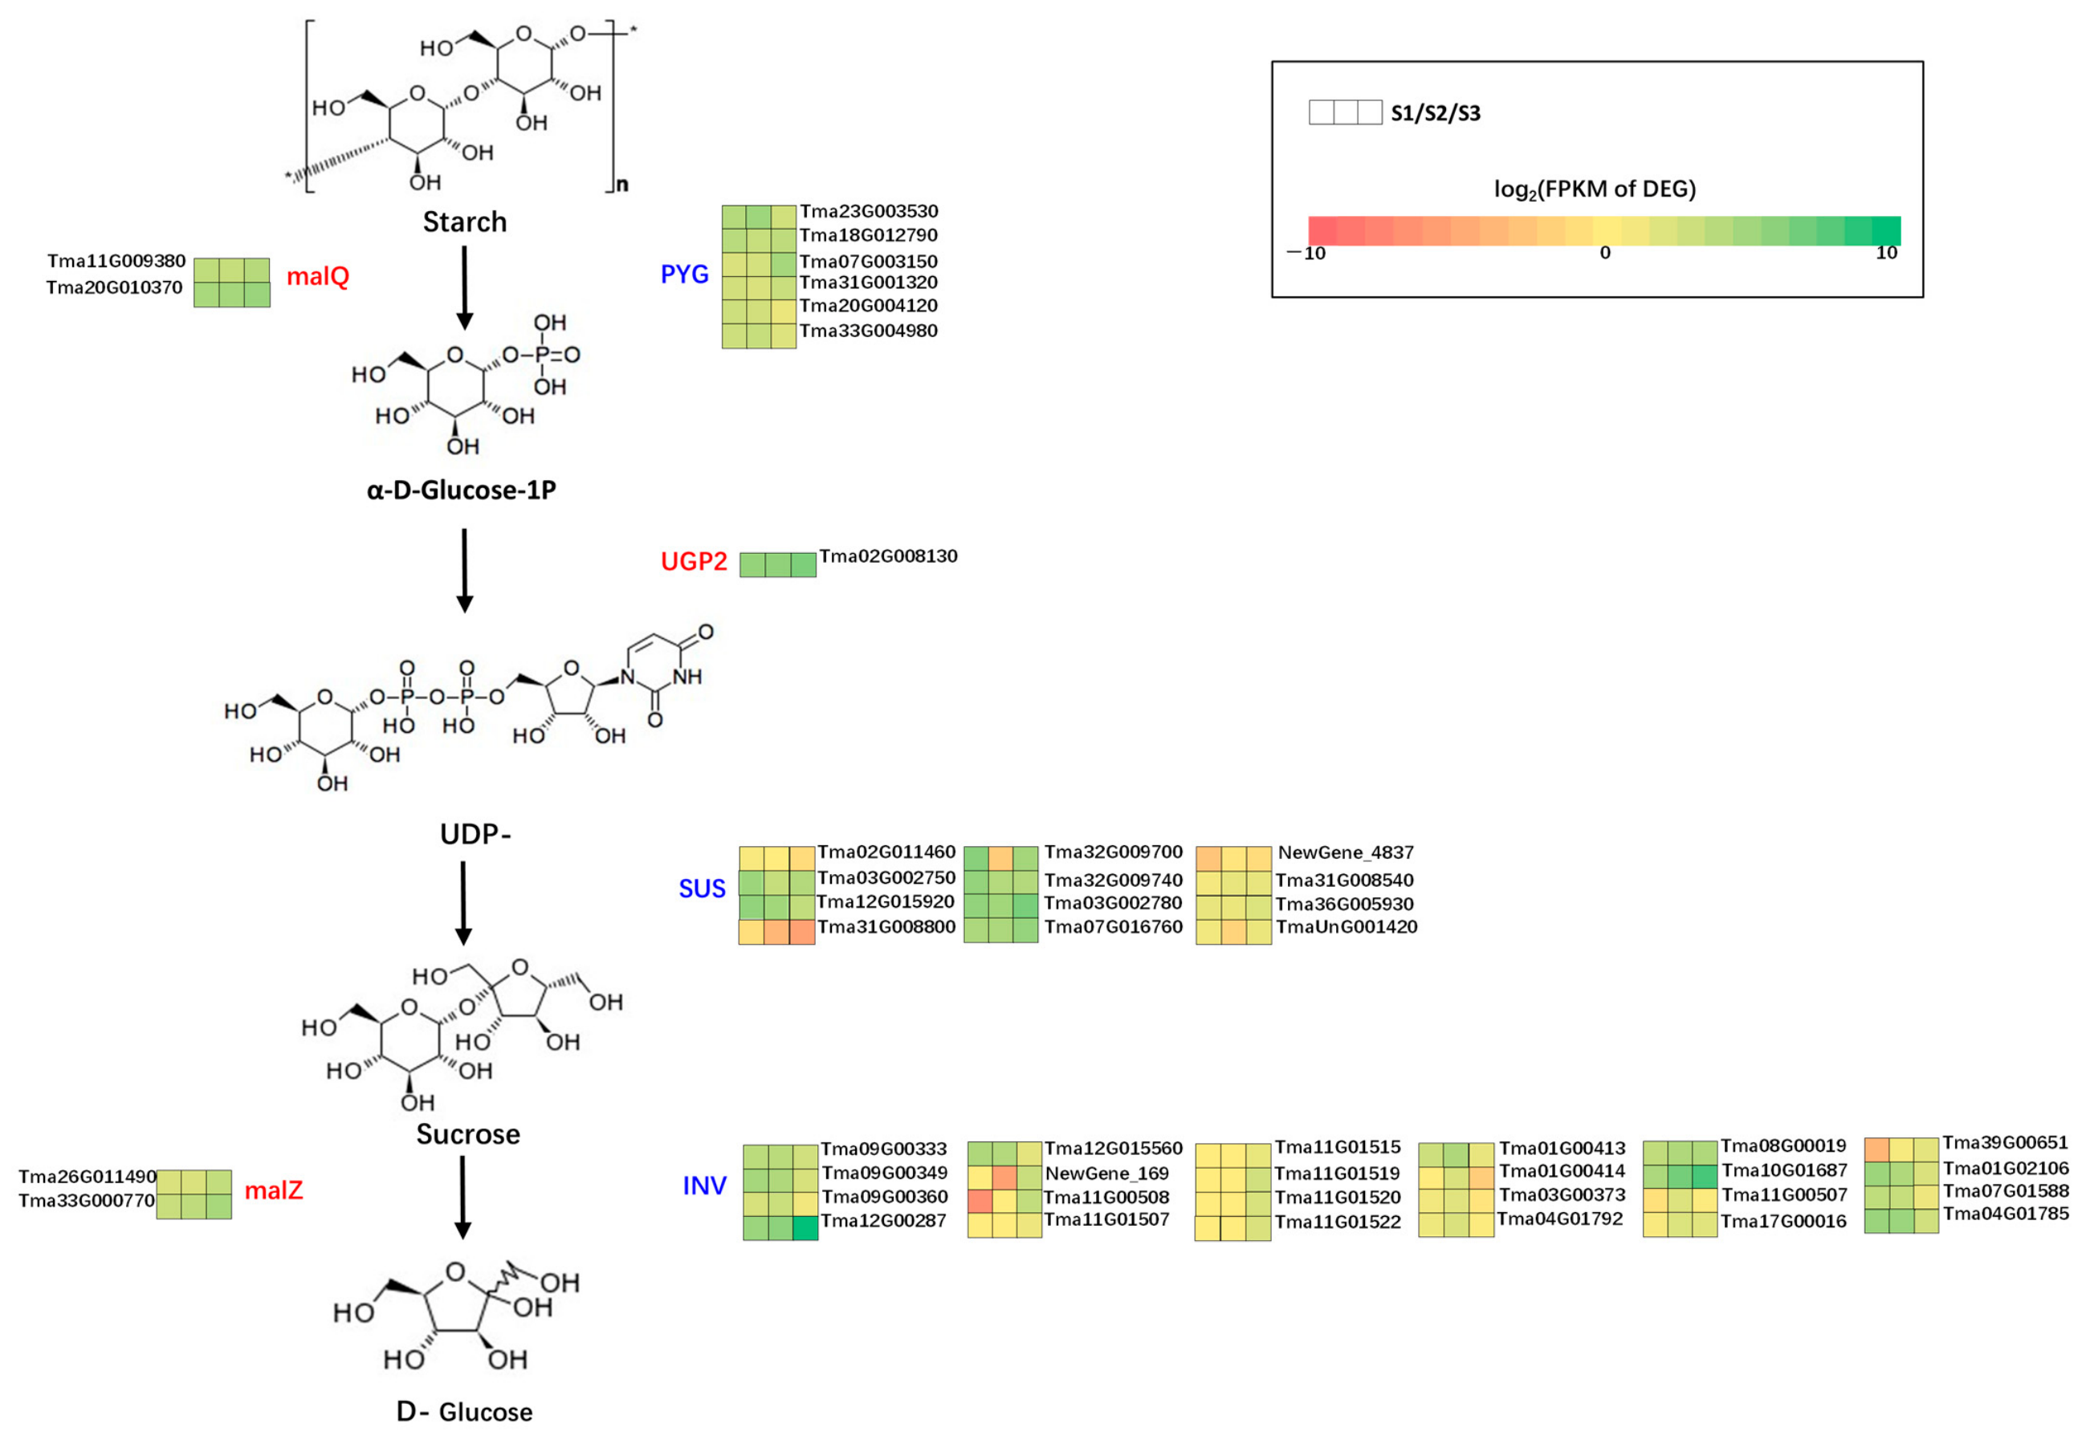
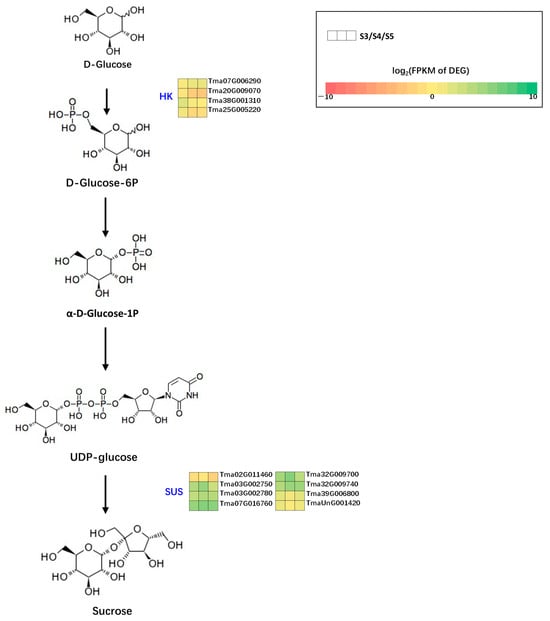
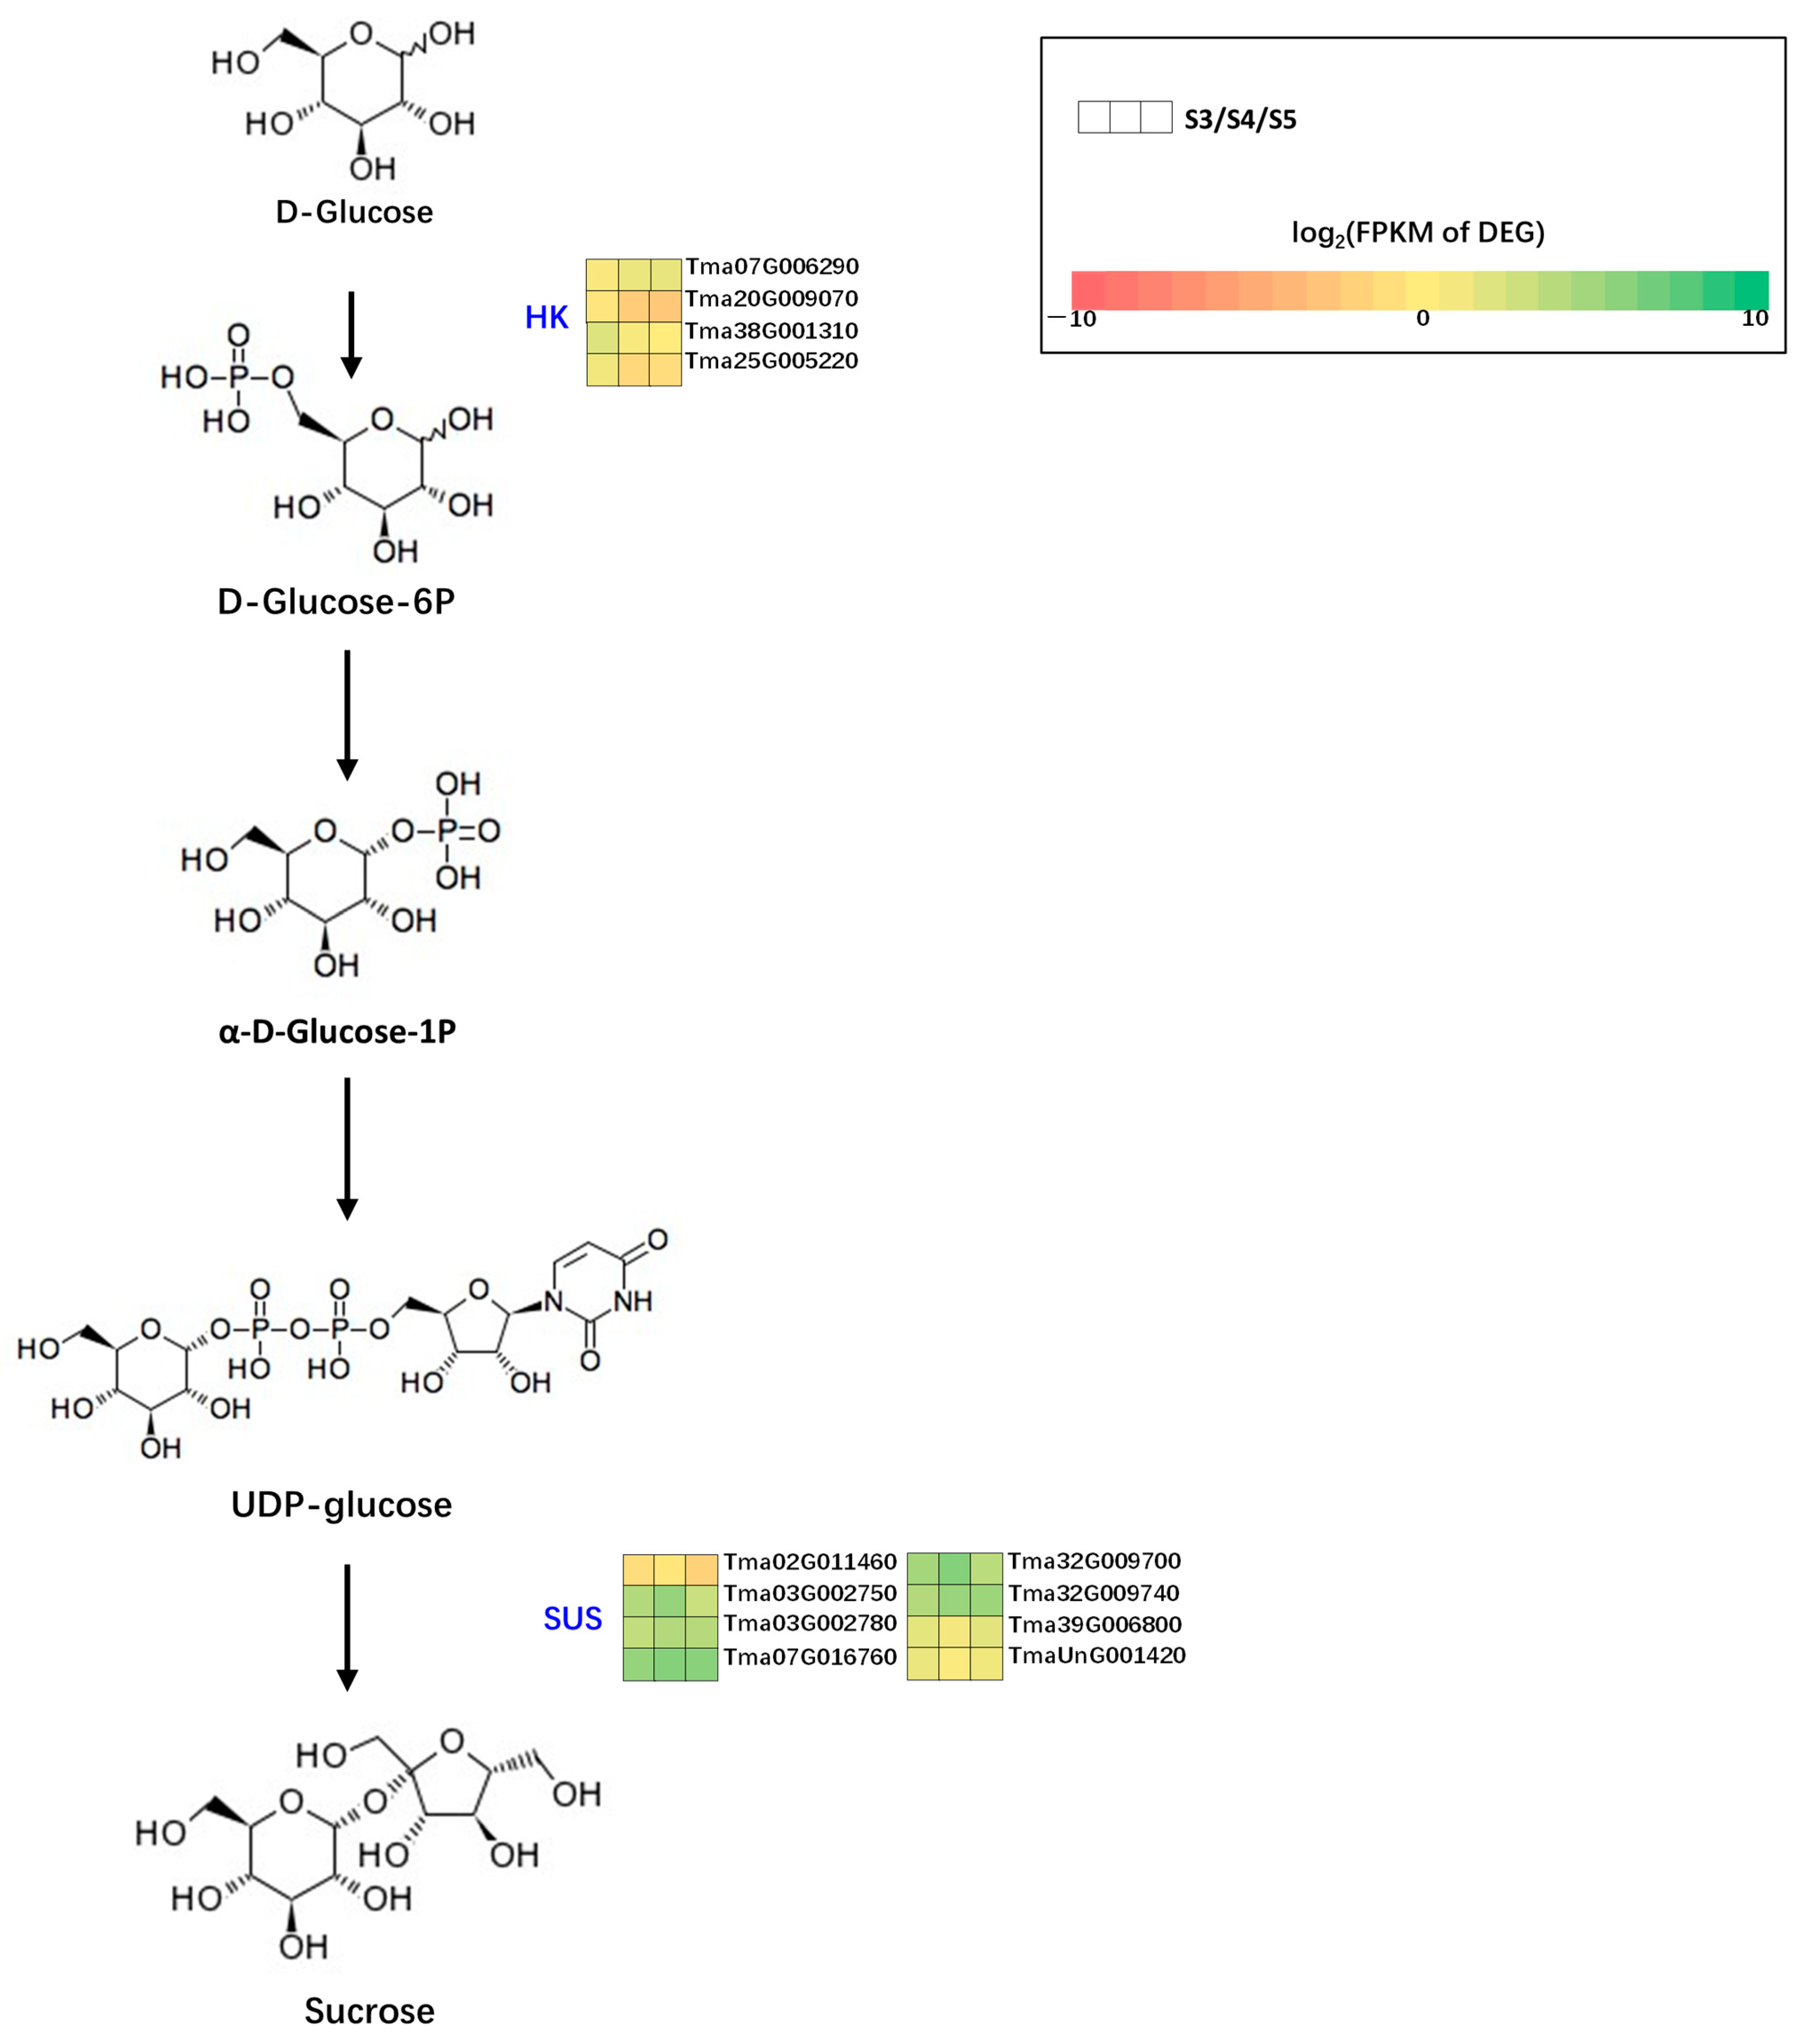
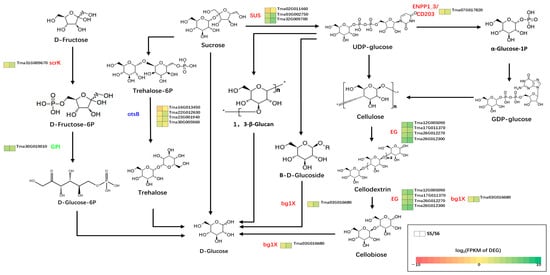
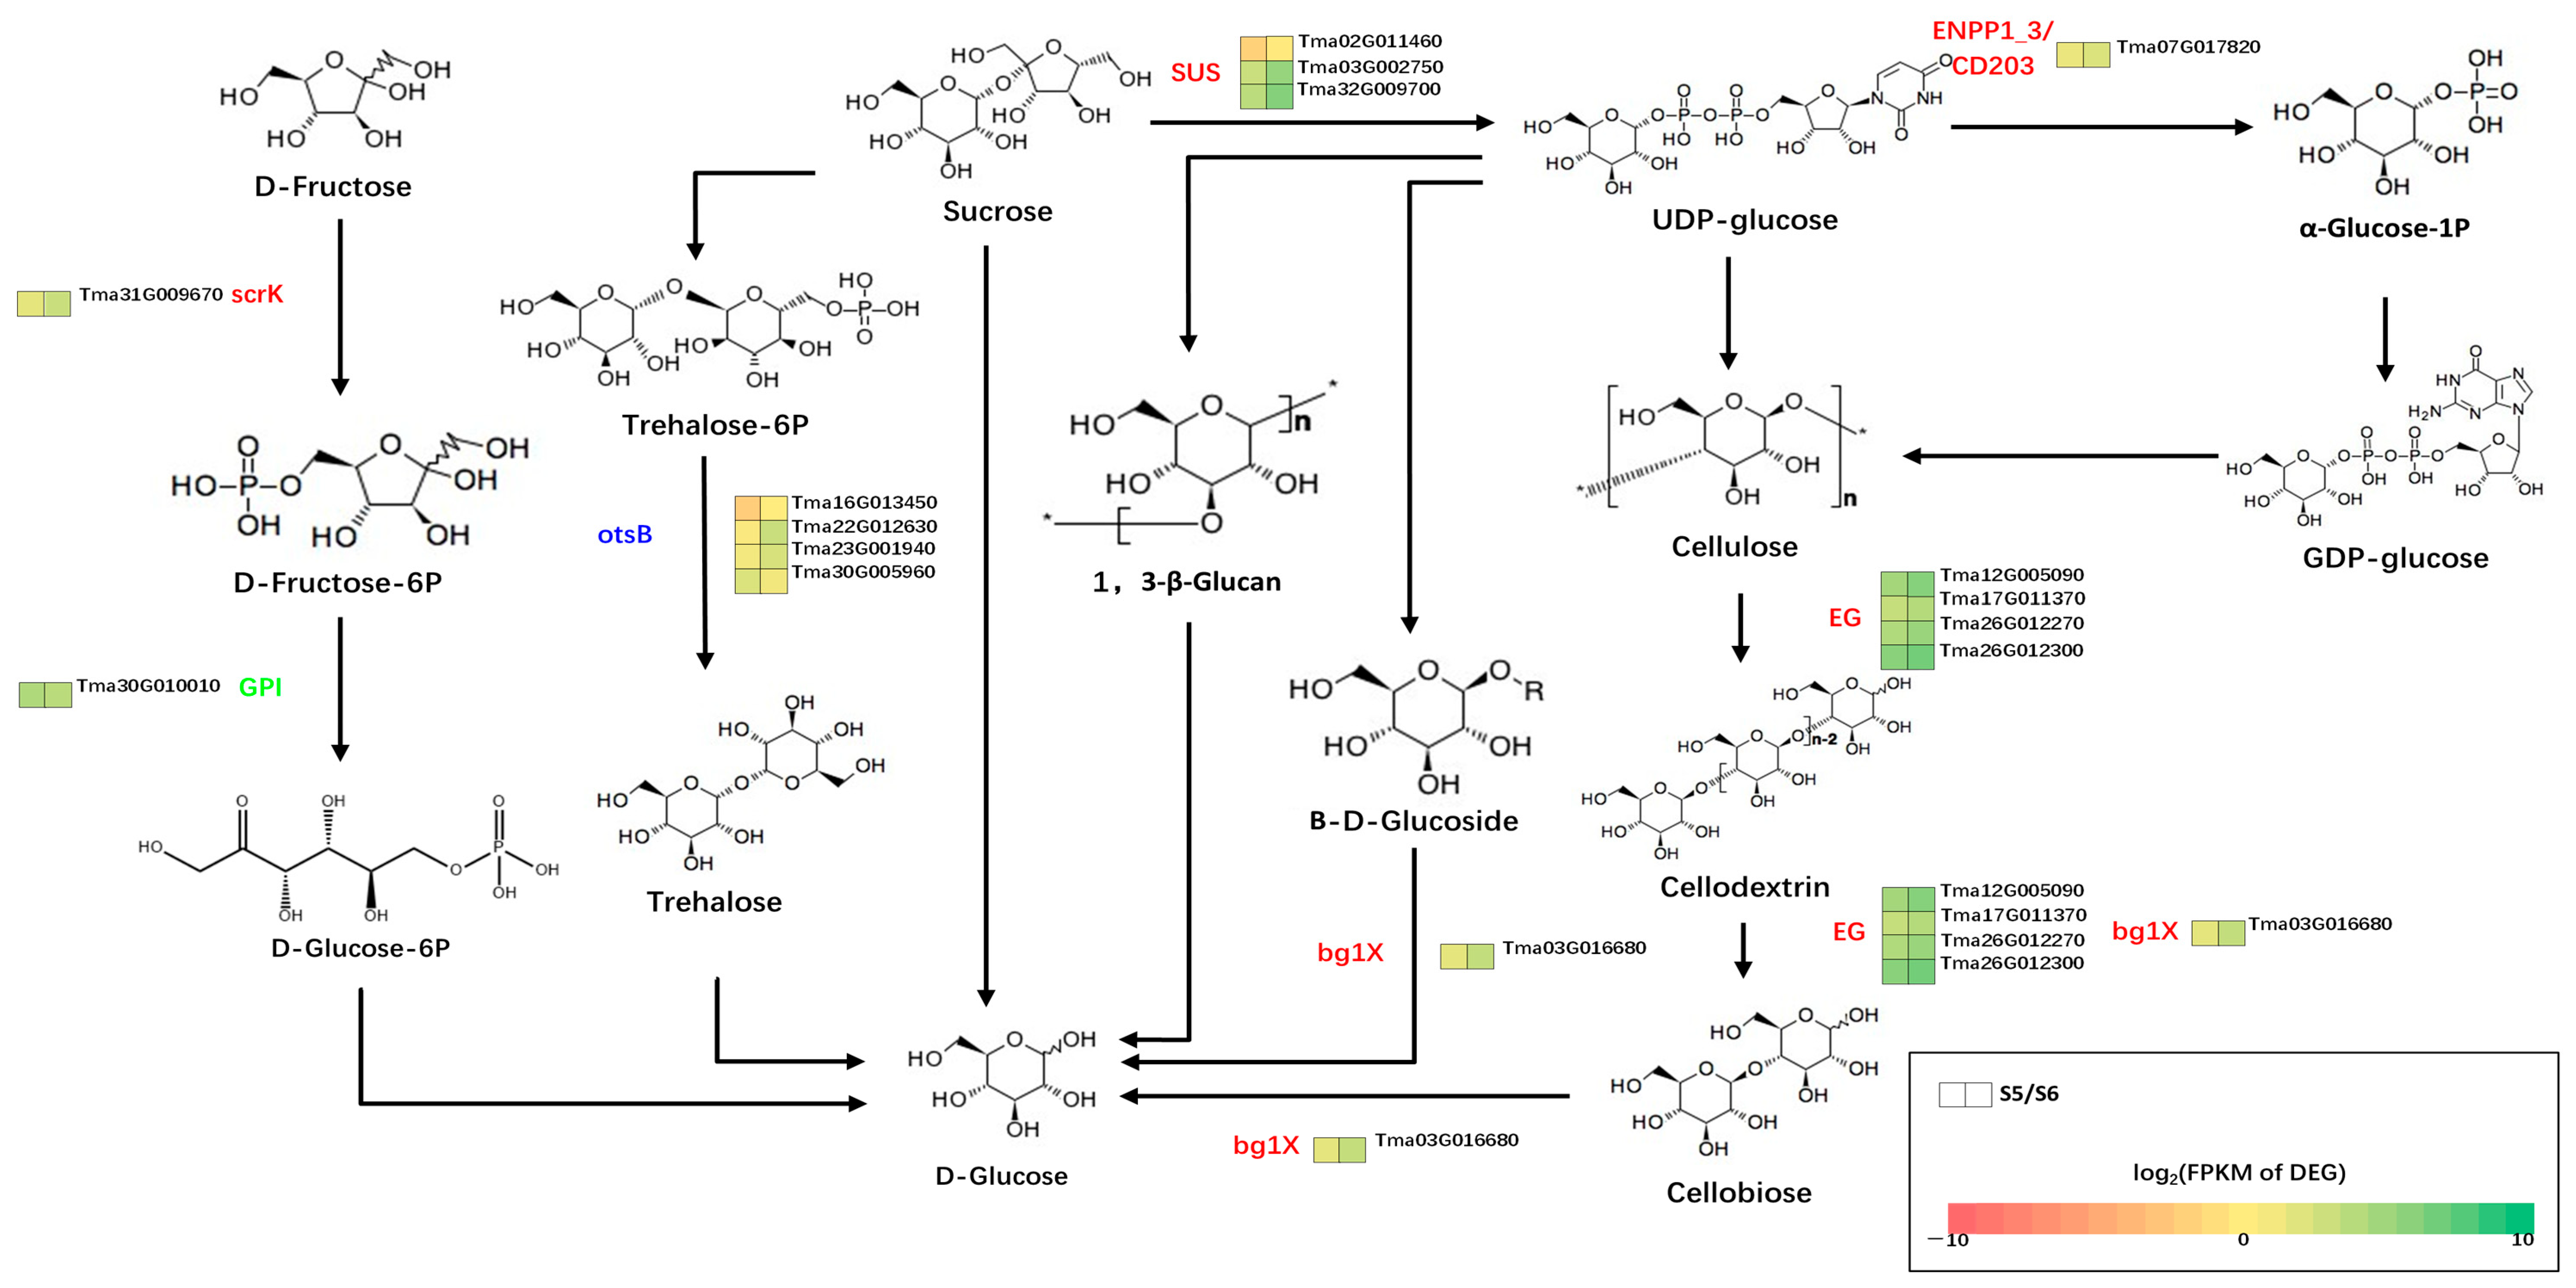
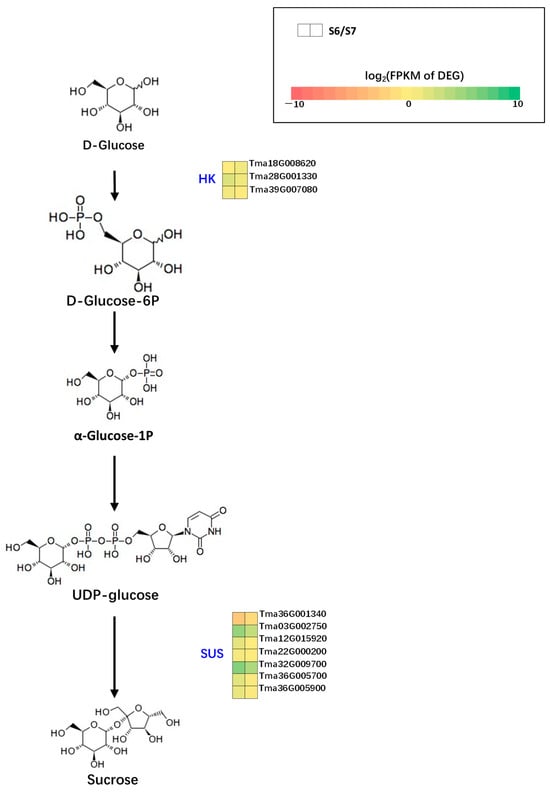
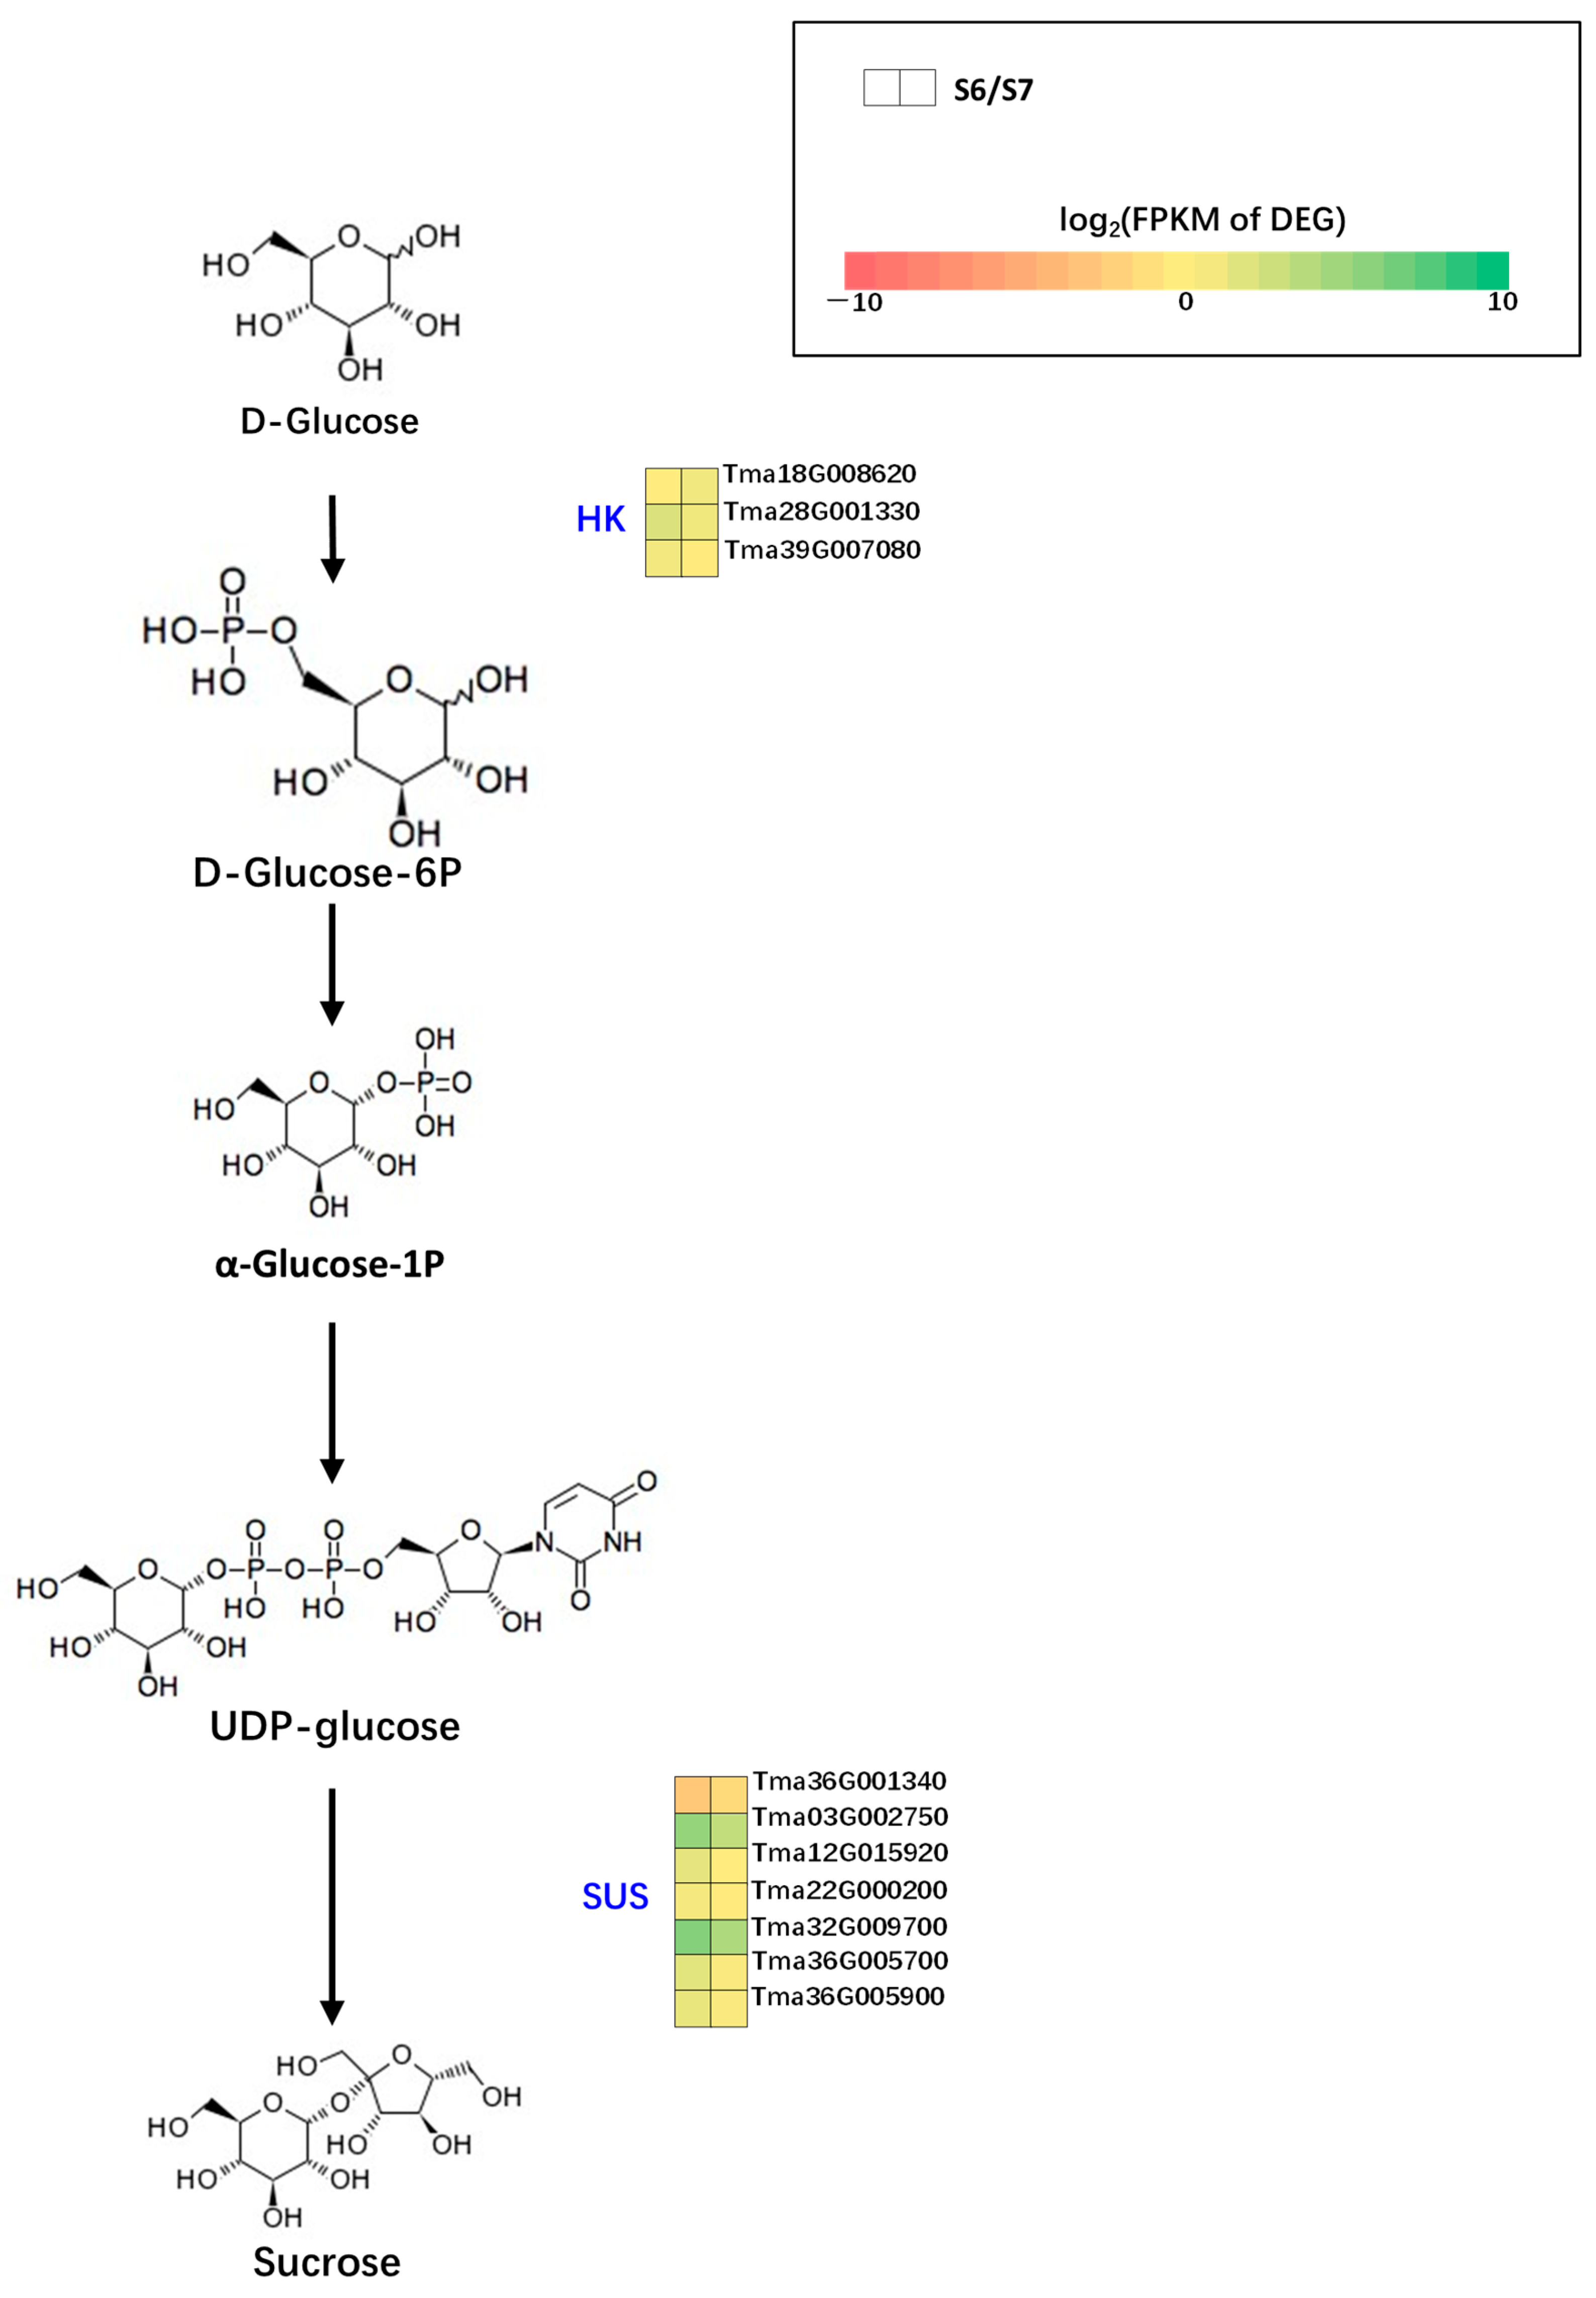
Based on dynamic sugar changes, we constructed a stage-specific sugar metabolic pathway model. During the pre-bud and bud stages (S1–S3), 47 DEGs were enriched in the starch-to-fructose conversion pathway, potentially driving continuous starch degradation and fructose accumulation. From the bud stage to the half-blooming stage (S3–S5), twelve DEGs were involved in the glucose-to-sucrose biosynthesis pathway, corresponding to sucrose accumulation and glucose consumption. At the full-blooming stage (S5–S6), fifteen DEGs regulated sucrose hydrolysis into glucose, consistent with sucrose reduction and glucose elevation. During the senescence stage (S6–S7), ten DEGs mediated glucose reconversion to sucrose, supporting sugar reabsorption (Figure 6, Figure 7, Figure 8 and Figure 9; Supplementary Tables S9–S12).
Figure 6.
Differentially expressed genes (DEGs) involved in the starch-to-fructose metabolic pathway during the pre-bud to bud stages (S1–S3). Each small heatmap shows the expression pattern (FPKM) of the corresponding gene across seven floral developmental stages. Color intensity represents the relative expression level of each gene. * represent the attachment point of repeating unit.
Figure 7.
Differentially expressed genes (DEGs) associated with the glucose-to-sucrose biosynthesis pathway during the bud stage to the half-blooming stage (S3–S5). Each small heatmap shows the expression pattern (FPKM) of the corresponding gene across seven floral developmental stages. Color intensity represents the relative expression level of each gene.
Figure 8.
Differentially expressed genes (DEGs) mediating the sucrose-to-glucose hydrolysis pathway during the half-blooming stage to the full-blooming stage (S5–S6). Each small heatmap shows the expression pattern (FPKM) of the corresponding gene across seven floral developmental stages. Color intensity represents the relative expression level of each gene. * represent the attachment point of repeating unit.
Figure 9.
Differentially expressed genes (DEGs) involved in glucose-to-sucrose reconversion during the full-blooming stage to the senescence stage (S6–S7). Each small heatmap shows the expression pattern (FPKM) of the corresponding gene across seven floral developmental stages. Color intensity represents the relative expression level of each gene.
3.8. Identification of Sugar Transport-Related DEGs
A total of 29 DEGs encoding nineteen SWEET family sugar transporter proteins (with multiple DEGs assigned to a single protein) exhibited distinct stage-specific expression patterns: twelve DEGs in S1 vs. S2, eighteen in S2 vs. S3, eight in S3 vs. S4, six in S4 vs. S5, two in S5 vs. S6, and nine in S6 vs. S7 (Supplementary Table S13). The highest SWEET differential expression occurred during the bud developmental transition (S2–S3), indicating putative active sugar transport preparation before flowering.
Seven DEGs encoding three CWINV proteins (with multiple DEGs assigned to a single protein) were screened in T. mandshurica. CWINV DEGs were mainly differentially expressed during early floral development and senescence: two DEGs in S1 vs. S2, five in S2 vs. S3, two in S3 vs. S4, two in S4 vs. S5, none in S5 vs. S6, and two in S6 vs. S7 (Supplementary Table S14). These results suggest that CWINV-mediated sucrose hydrolysis is primarily activated before full blooming and participates in post-secretion sugar recycling during senescence.
3.9. Correlation Analysis Between Sugar Contents and Functional Genes
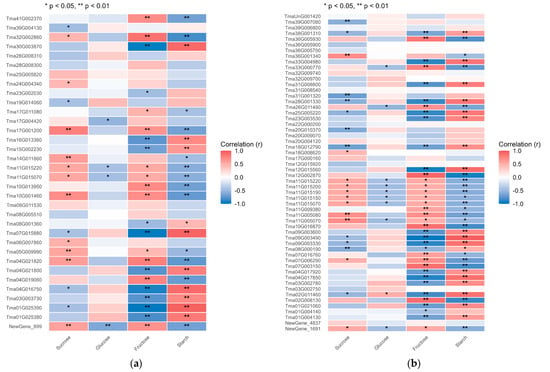
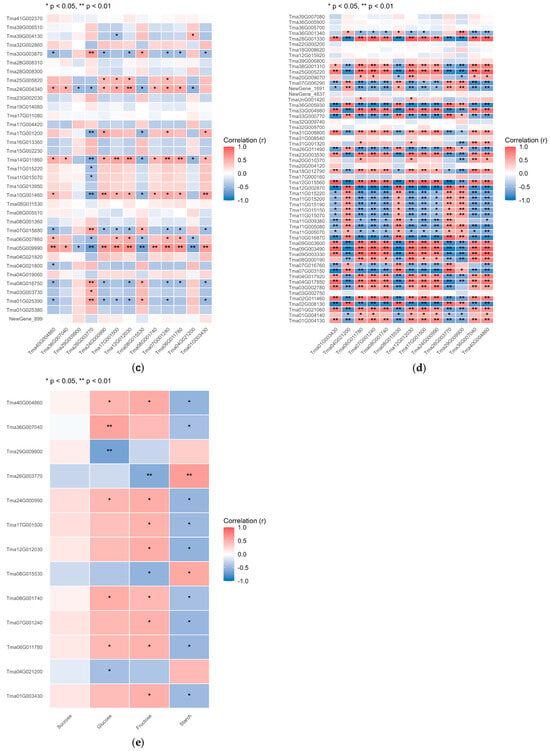
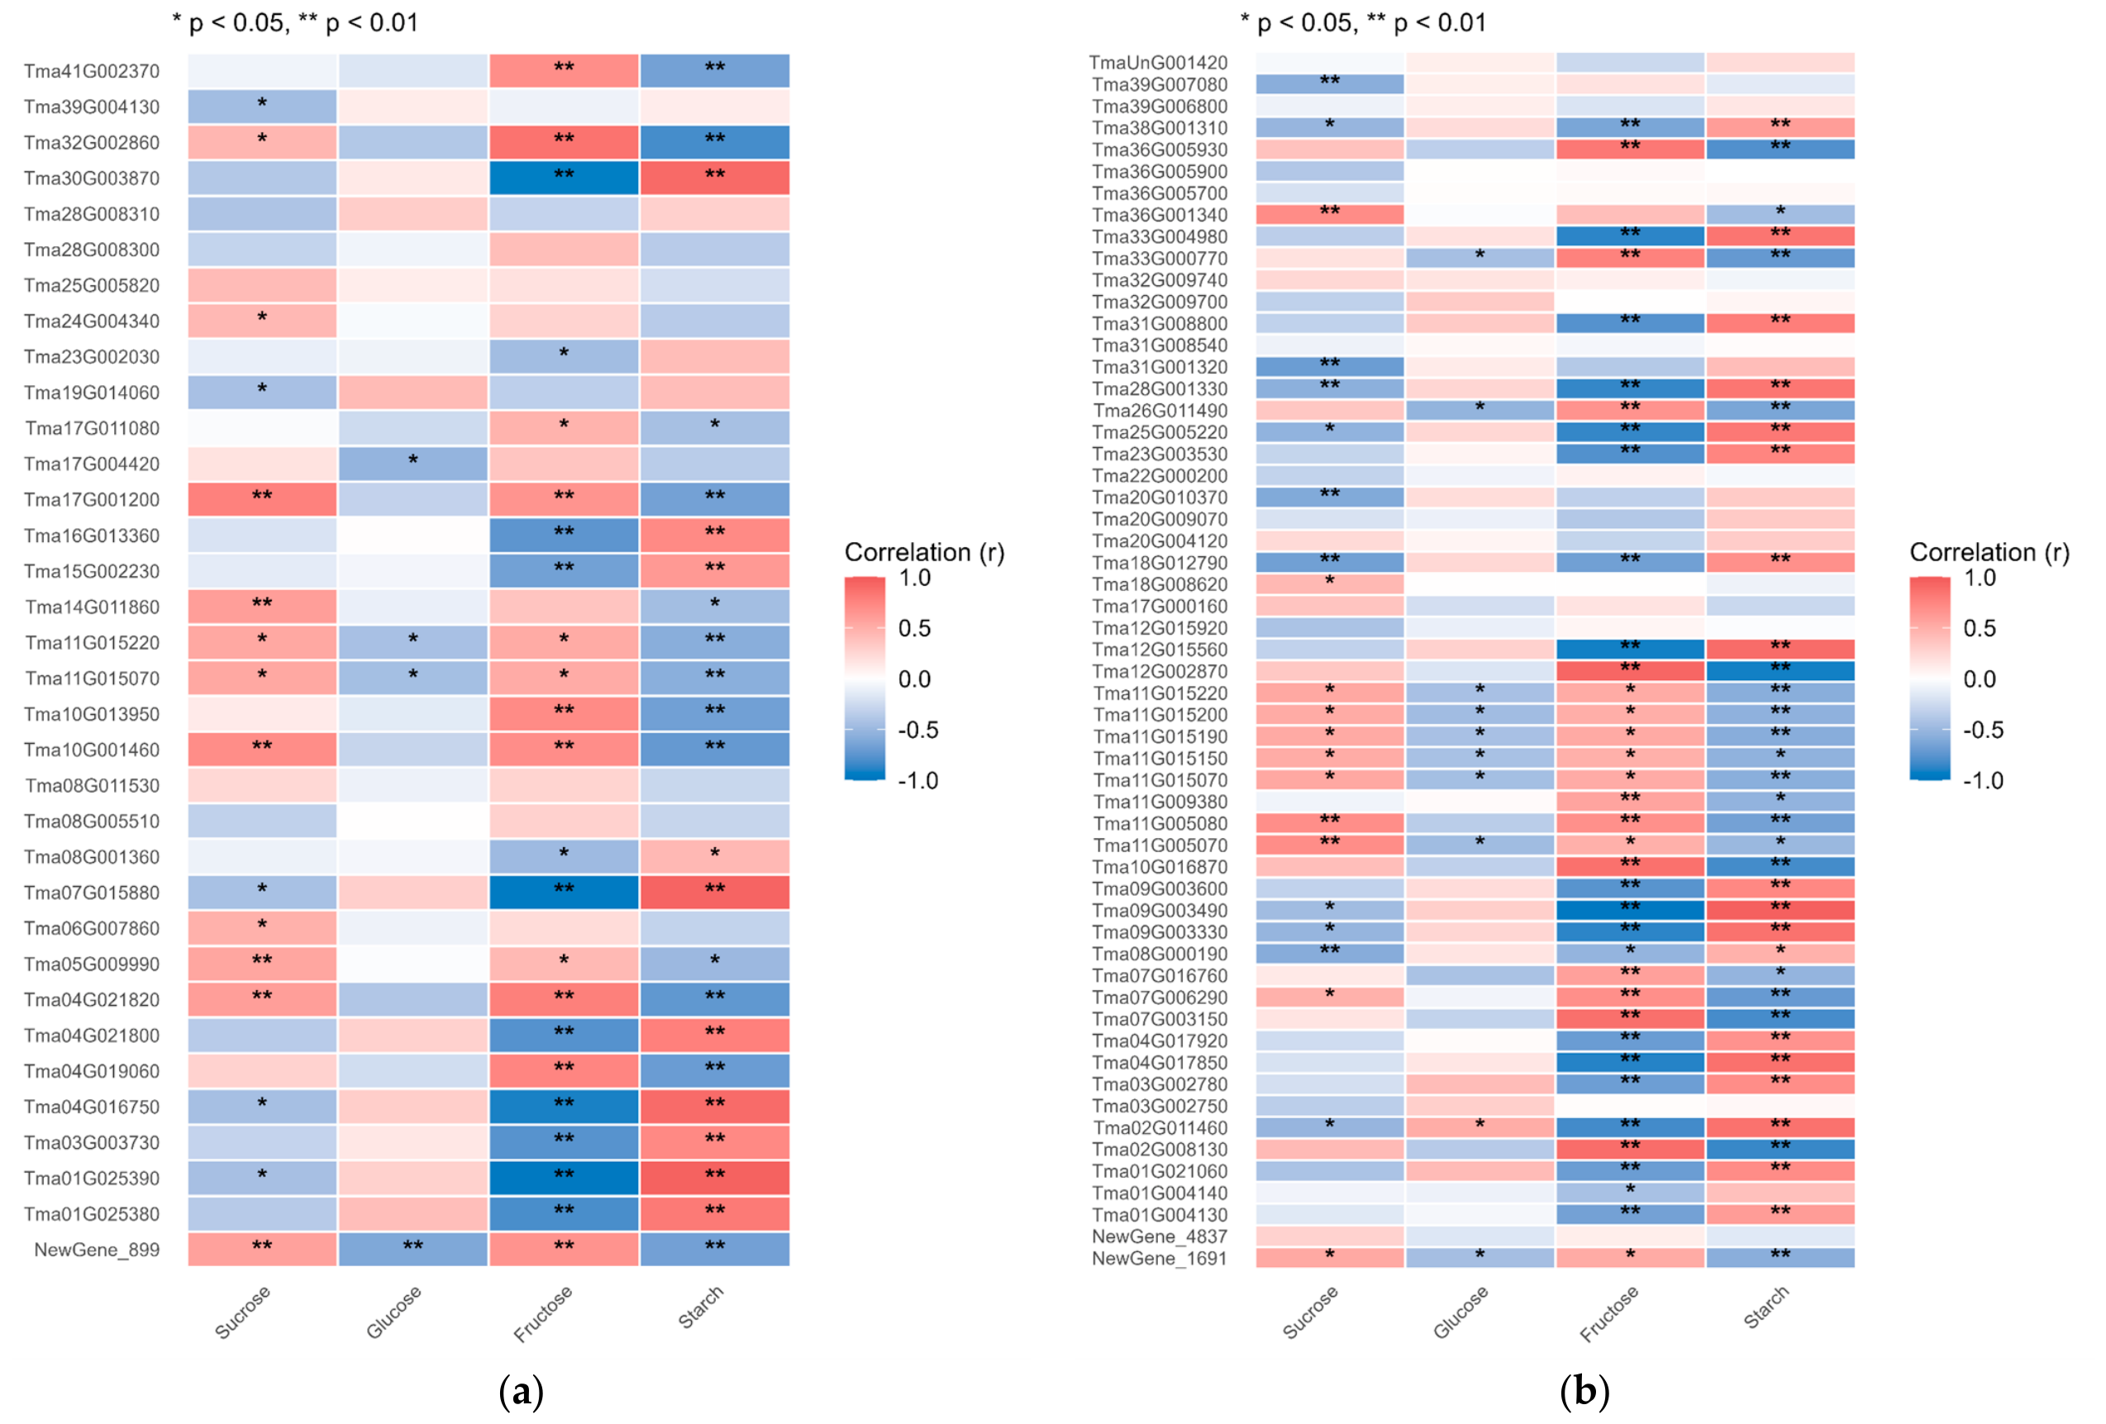
With the screening threshold of |r| ≥ 0.5 and p ≤ 0.05, exploratory associations were identified between sugar component dynamics and 42 sugar metabolism-related DEGs, 24 SWEET DEGs, and five CWINV DEGs. Among metabolism-related genes, sixteen genes show negative associations with starch content, nine positive and nine negative associations with sucrose content, sixteen positive and eighteen negative associations with fructose content, and one gene each with positive and negative associations with glucose content.
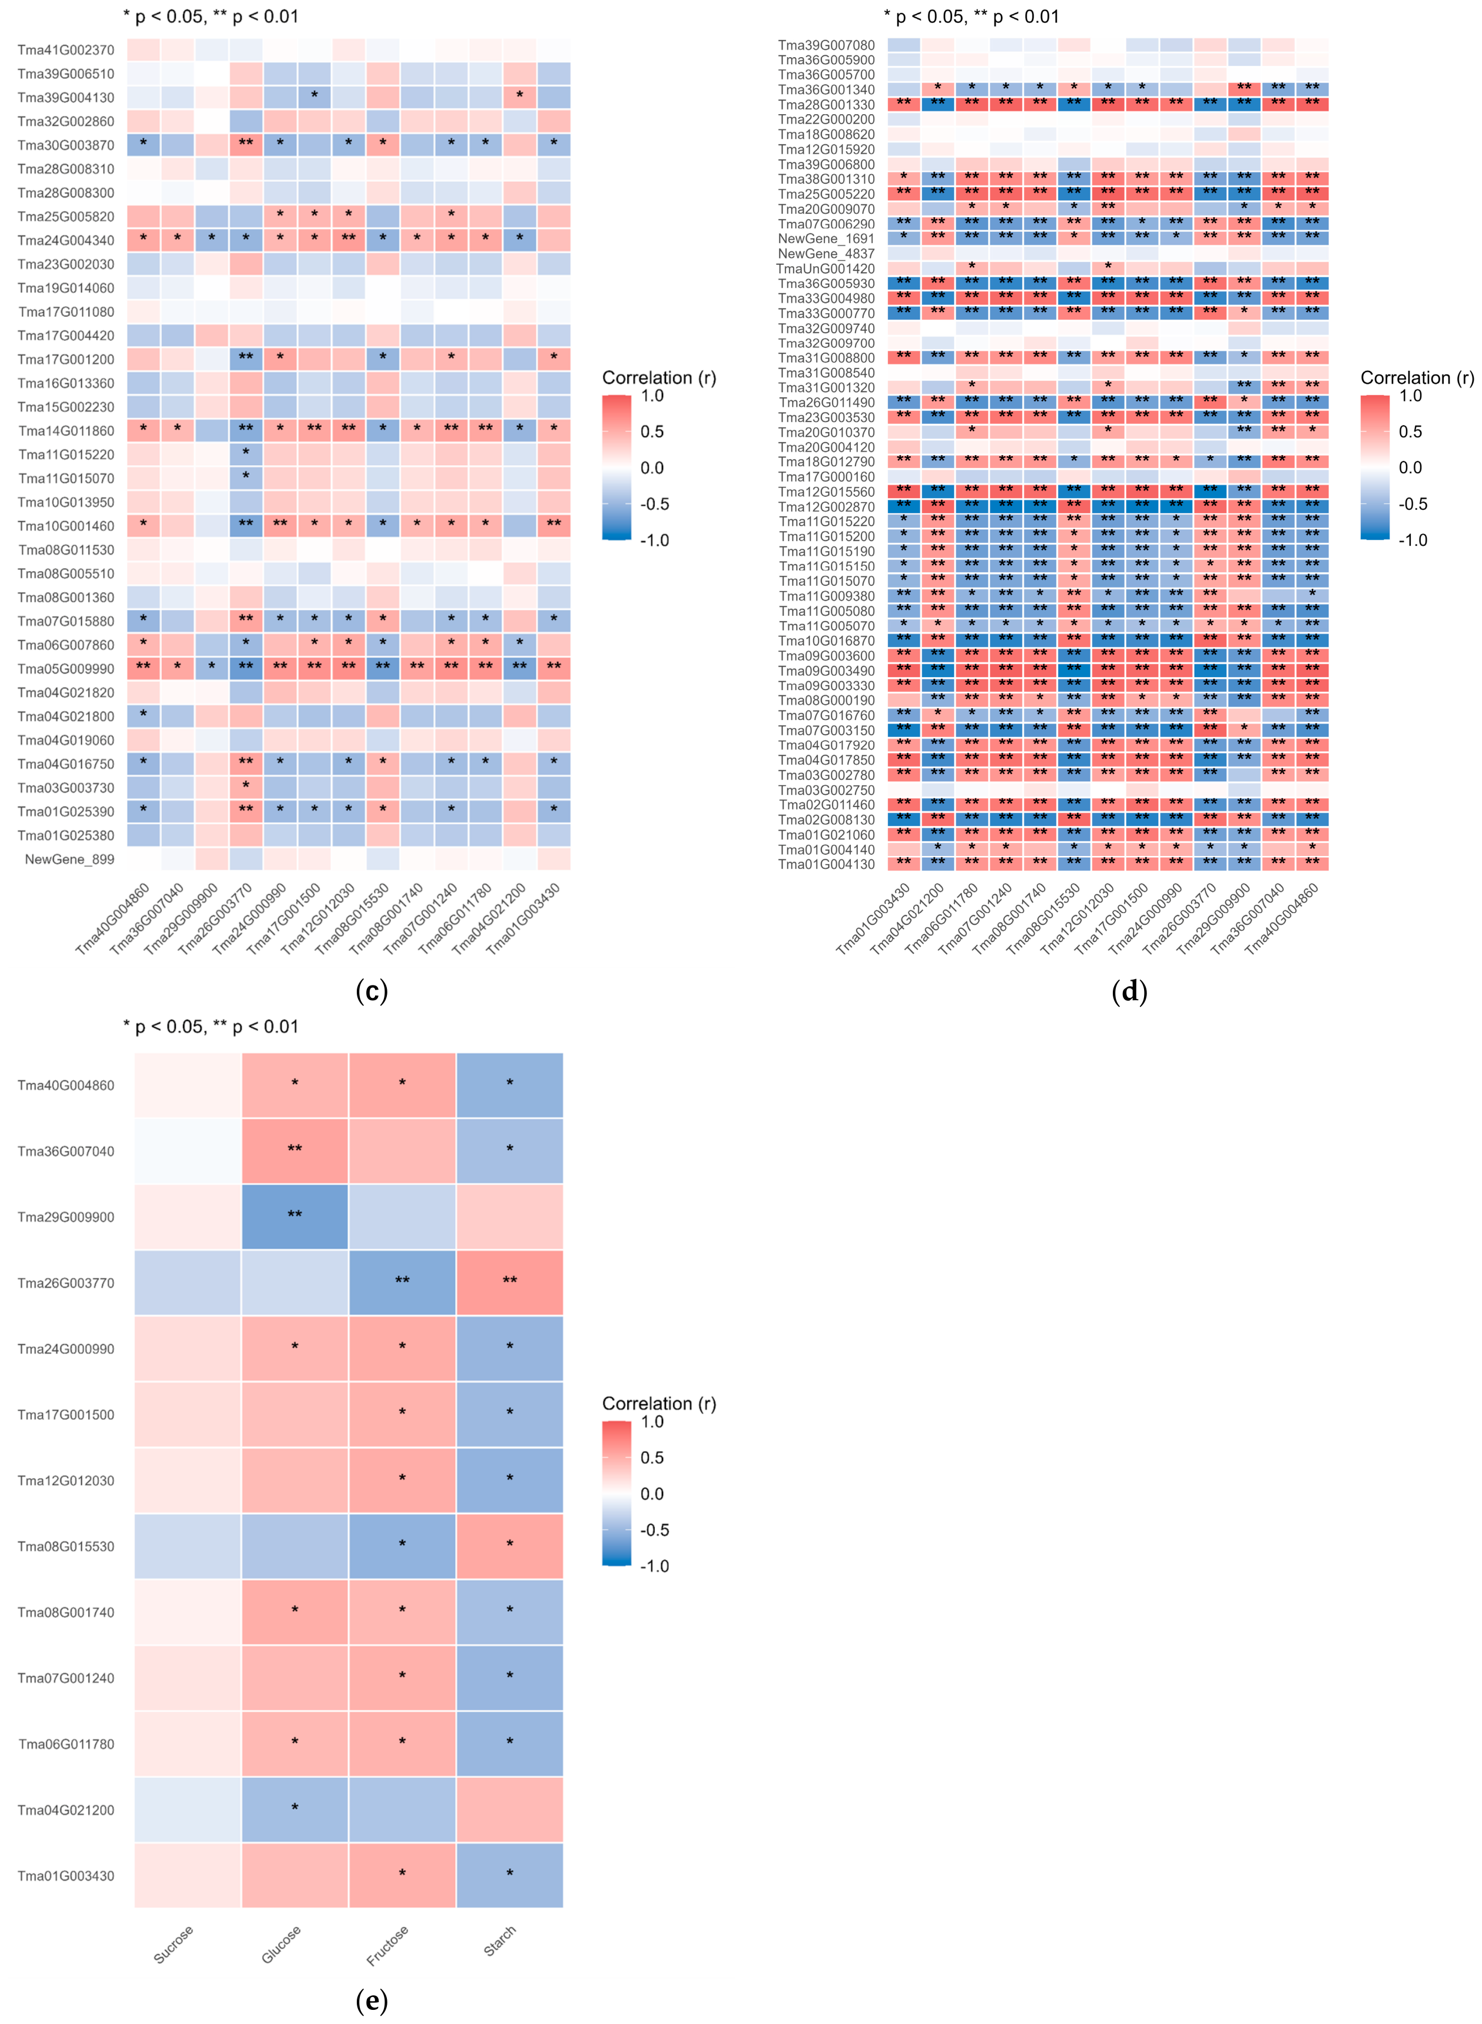
Further exploratory association analysis between thirteen core TFs and functional genes revealed distinct regulatory patterns. WRKY, Trihelix, and TFIIE were positively associated with starch hydrolysis, sucrose hydrolysis, and fructose synthesis genes but negatively associated with glucose synthesis genes. In contrast, GATA, bHLH, ERF, and HSF showed the opposite trend. NF-YC exhibited bidirectional associations with sugar metabolic and transport genes (Figure 10), forming a putative transcriptional regulatory network underlying nectar sugar dynamics.
Figure 10.
Correlation analysis of key functional genes and sugar traits. (a) Correlation heatmap of sugar transporter genes and sugar contents; (b) Correlation heatmap of sugar metabolism-related genes and sugar contents; (c) Correlation heatmap of transcription factors (TFs) and sugar transporter genes; (d) Correlation heatmap of TFs and structural functional genes; (e) Correlation heatmap of TFs and floral sugar contents. Rows represent hub gene IDs, and columns indicate four carbohydrate traits (sucrose, glucose, fructose, starch). The color scale represents the Pearson correlation coefficient (r), red indicates positive correlation, blue indicates negative correlation, ranging from r = 1.0 to r = −1.0.
3.10. qRT-PCR Validation of Transcriptome Data
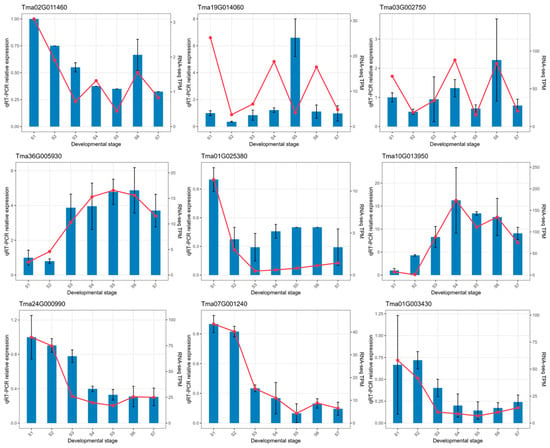
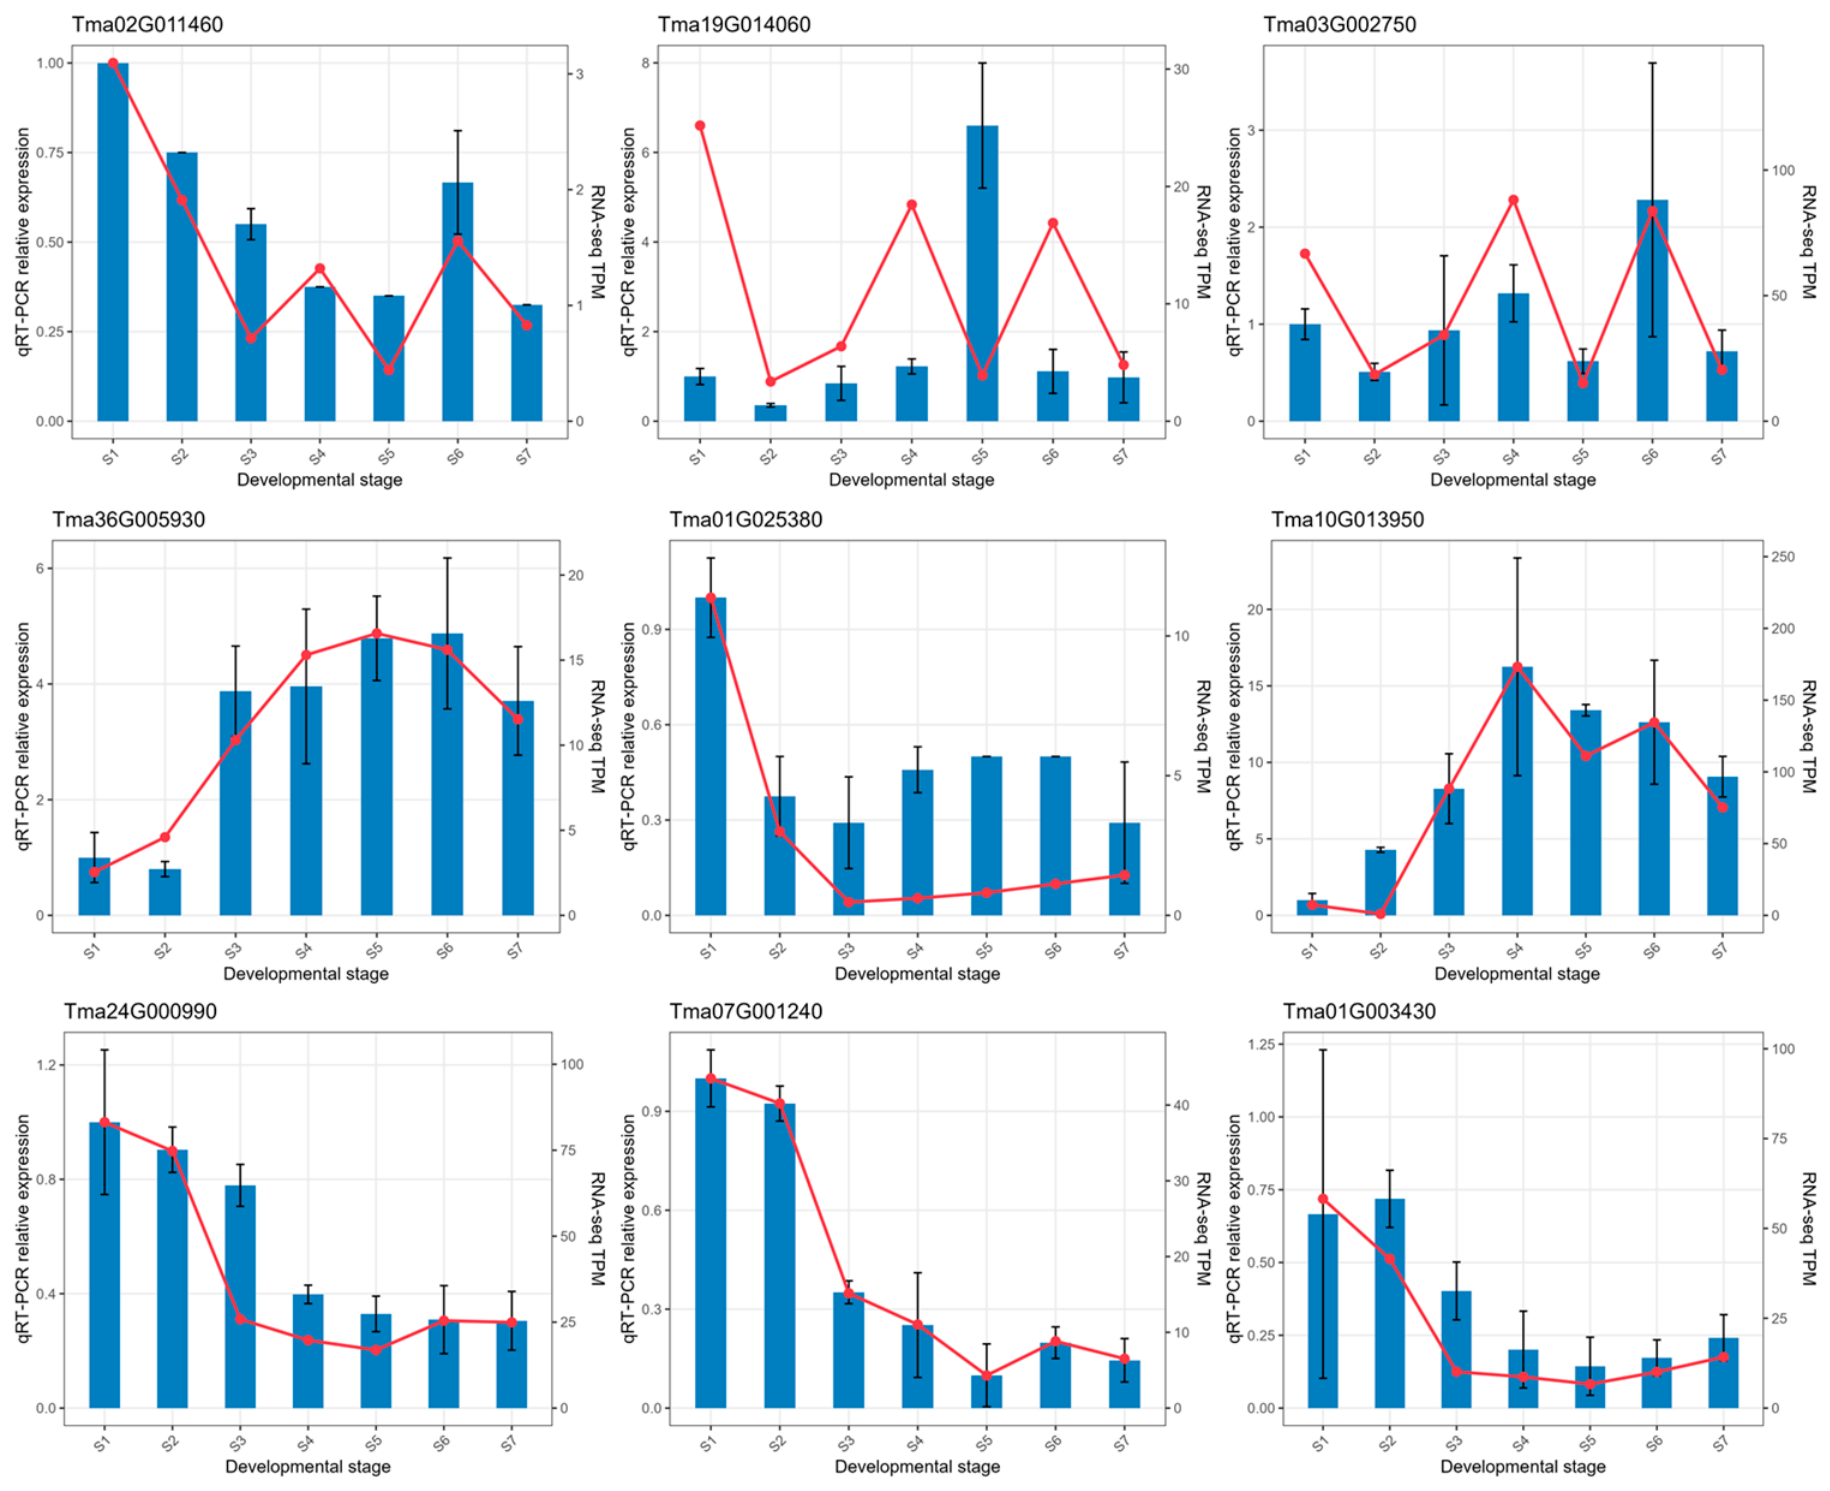
Nine key genes, including structural metabolic genes, transporter genes, and TFs, were selected for qRT-PCR verification across seven developmental stages. We calculated Pearson correlation coefficients between qRT-PCR log2-transformed relative expression values and RNA-seq TPM values for each gene (Supplementary Materials Figure S2). The trends detected by qRT-PCR were largely consistent with the RNA-seq TPM profiles, and no opposite expression patterns were observed (Figure 11). This concordance supports the expression trends of these selected candidate genes obtained from our transcriptome analysis.
Figure 11.
qRT-PCR validation of the expression patterns of nine candidate genes involved in sugar metabolism and regulation during T. mandshurica floral development. The blue bars represent relative expression levels determined by qRT-PCR, and the red lines indicate TPM values from RNA-seq. Error bars denote standard deviation (SD). S1–S7 represent successive floral developmental stages from pre-bud to senescence stage. qRT-PCR, quantitative real-time polymerase chain reaction; TPM, transcripts per million.
4. Discussion
4.1. Changes in Sugar Content in Flowers at Different Developmental Stages
Nectar secretion is a precisely programmed physiological process dependent on ordered sugar metabolism and transport [8,12]. Consistent with the canonical nectar secretion model in Arabidopsis, starch may serve as the primary sugar reserve for nectar production in T. mandshurica. Starch accumulates to its maximum level at the pre-bud stage 1 (S1) and is then rapidly degraded throughout the subsequent bud developmental stages (S2–S3), which may provide carbon precursors that could support subsequent nectar synthesis. Concomitant with starch degradation, fructose accumulates continuously, while glucose remains stable, suggesting that hydrolyzed glucose is rapidly consumed via respiratory metabolism or converted into other carbohydrates during early floral development. The bud to half-blooming stages (S3–S5) is characterized by active sucrose biosynthesis: sucrose content increases significantly with the consumption of glucose, which may reflect the conversion of starch-derived monosaccharides into sucrose, the core sugar component for nectar secretion. During the half- and full-blooming stages (S5–S6), sucrose content decreases sharply while glucose accumulates massively, potentially attributable to the activation of sucrose efflux and extracellular hydrolysis, corresponding to the peak period of nectar secretion. During flower senescence (S6–S7), sucrose content rebounds and glucose content declines significantly, suggesting the possible occurrence of nectar sugar reabsorption and recycling, a conserved energy-saving strategy in flowering plants [21,22,23]. Overall, the sugar dynamic pattern of T. mandshurica is highly consistent with the classic dicot nectar secretion model, with unique stage-specific fine-tuning during floral development. It should be noted that carbohydrate quantification in this study was performed on whole floral tissues using colorimetric assays. Although this approach is appropriate for high-throughput screening of carbohydrate dynamics across seven floral developmental stages, it exhibits two key limitations: first, the measurements reflect carbohydrate concentrations in bulk whole flowers and cannot distinguish sugars stored in floral tissues from those directly present in secreted nectar; second, this method has lower analyte specificity relative to chromatographic techniques including HPLC, HPAEC, and GC. Accordingly, our data primarily reflect relative changes in carbohydrate pools within floral tissues to provide physiological support for transcriptomic findings, rather than direct measurements of nectar sugar composition. Future investigations adopting chromatographic platforms and separate sampling of nectar and floral tissues will enable more precise absolute quantification and discrimination of carbohydrate constituents. A limitation of this study is that all samples were obtained from a single T. mandshurica individual, with replicates taken from different branches of this tree (within-tree replicates). Although this design minimizes genetic noise and matches our genome resource from the same tree, our results cannot be generalized to the whole species. Further sampling of multiple independent individuals is required to confirm these sugar-metabolism regulatory patterns.
4.2. Core Functional Genes Regulating Sugar Metabolism
Starch degradation and fructose accumulation during pre-bud and bud stages (S1–S3) may be supported by the coordinated expression of key metabolic enzymes. In this stage, starch degradation-related genes (PYG, malQ, malZ) are significantly upregulated, while fructose metabolism inhibitory genes are suppressed, which could contribute to massive starch hydrolysis and fructose enrichment. This expression pattern is comparable with previous studies in pumpkin [12], hinting at a potentially conserved starch mobilization mechanism in dicot nectar-producing plants. SUS and HK are core enzymes shaping sucrose-hexose conversion balance throughout floral development. SUS catalyzes reversible sucrose synthesis and hydrolysis, while HK mediates glucose phosphorylation to provide substrates for sugar metabolism [24,25,26,27,28,29,30]. The dynamic expression of SUS and HK may coordinate sugar conversion at different stages: upregulated SUS and downregulated HK during S3–S4 could promote sucrose accumulation for nectar preparation; stage-specific SUS activation during full-blooming stage may facilitate sucrose hydrolysis to maintain nectar sugar composition; and SUS re-upregulation during senescence may drive glucose reconversion to sucrose for sugar recycling. The synergistic expression changes in SUS and HK potentially help maintain intracellular sugar homeostasis and support stage-specific nectar secretion characteristics.
4.3. SWEET and CWINV Mediate Sugar Transport During Nectar Secretion
Sugar transporters and cell wall invertases are key candidate executive components of nectar formation. SWEET family genes exhibit development-dependent expression patterns in T. mandshurica. Substantial differential expression of SWEET genes during S2–S3 indicates the possible preparation of sugar transport machinery before flowering. Those SWEET genes with high expression levels and strong module–trait correlations in WGCNA coexpression modules, hereafter referred to as core SWEET members, exhibited expression profiles temporally consistent with sucrose content changes from early to full blooming stages, suggesting their potential involvement in sucrose efflux and nectar formation, in line with the conserved function of SWEET genes reported in plant nectar secretion systems [31,32,33,34]. CWINV genes, especially CWINV2, are promising candidates for sucrose hydrolysis during nectar secretion. CWINV2 is specifically activated during the blooming stage and peaks at the half-blooming stage, potentially catalyzing irreversible hydrolysis of apoplastic sucrose into glucose and fructose to shape mature nectar components. In contrast, CWINV1 is mainly downregulated during key secretory stages, implying possible synergistic actions between different CWINV isoforms. The stage-specific expression changes in SWEET and CWINV genes coincide temporally with the temporal rhythm of nectar secretion in T. mandshurica.
4.4. Transcription Factors Orchestrate the Regulatory Network of Nectar Secretion
The eight identified TF families represent promising upstream candidates that may coordinate sugar metabolism and transport during floral development based on co-expression evidence. GATA TFs show co-expression with starch-degradation-related and SWEET genes, consistent with documented functions of GATA homologs in regulating plant sugar metabolism and floral development in maize and Arabidopsis [10,35,36,37,38,39]. WRKY TFs, known as potential regulators of SWEET and CWINV genes in multiple plant species [40,41,42,43,44,45,46], are co-expressed with genes for starch hydrolysis and fructose accumulation in T. mandshurica. ERF and bHLH TFs are implicated in nectary development and sugar transport regulation in other systems. ERF TFs are co-expressed with SWEET and CWINV genes in our dataset, suggesting possible involvement in sucrose-metabolism processes, as reported for cotton and citrus nectar secretion [47,48,49,50]. bHLH TFs may interact with other TFs to modulate sucrose synthesis and accumulation [51,52,53]. HSF and Trihelix TFs are co-associated with sucrose anabolism and nectar-secretion- related modules, while NF-YC TFs show bidirectional co-expression patterns with genes for starch and sucrose metabolism [54,55,56,,57,58,59,60,61,62]. These TFs exhibit two distinct expression patterns corresponding to floral-carbon-allocation transitions: nine TFs with high expression at the early bud stage may participate in starch accumulation and carbon fixation, while four TFs with gradually increased expression during blooming could contribute to carbon mobilization and sugar efflux. This dual-pattern co-expression profile provides a hypothetical framework for the ordered switch from sugar-reserve accumulation to nectar secretion during floral development.
4.5. Integrated Regulatory Mechanism of Nectar Sugar Dynamics
This study identified pronounced starch degradation and fructose accumulation during T. mandshurica pre-bud to bud stages (S1–S3), while sucrose and glucose contents remained stable. Starch hydrolysis may provide energy and carbon resources for floral organ development [63,64]. Accumulated fructose could increase cellular osmotic pressure to enhance cell turgor, thereby potentially promoting bud expansion and flowering transition [65,66,67]. Plant starch catabolism generates abundant UDP-glucose for sucrose synthesis, and sucrose can be further hydrolyzed into glucose and fructose. The steady glucose level in buds indicates that starch-derived glucose is rapidly consumed via respiration or other physiological pathways. Molecular analysis revealed significant upregulation of starch catabolic genes PYG and malQ during this stage. Their expression peaks, together with elevated HK transcription, coincided with active bud development, suggesting activated starch mobilization and high hexose demand during early floral development.
The bud stage to half-blooming stage (S3–S5) was characterized by increased sucrose and decreased glucose contents, which may reflect active nectary sucrose biosynthesis in preparation for nectar secretion, with glucose consumed for sugar synthesis and basal respiration. Transcriptomic dynamics were highly consistent with these physiological changes. Four SUS genes were markedly upregulated from S3 to S4. Since SUS catalyzes sucrose formation using UDP-glucose and fructose-6-phosphate, SUS induction could partly account for sucrose accumulation and glucose reduction. By contrast, HK expression declined after S3, potentially due to negative feedback triggered by early-stage HK protein activity saturation. Most SWEET genes were activated during S3–S4, with SWEET5, SWEET7, and SWEET9 peaking at S4, while CWINV2 reached its maximum expression at S5. The coordinated upregulation of SWEET and CWINV2 points to the possible initiation of the nectar secretion program, which starts with sucrose efflux and subsequent extracellular hydrolysis. This molecular pattern aligns with our phenotypic observation of nectar secretion onset in early-blooming flowers (S4).
The half-blooming stage to full-blooming stage (S5–S6) represents the peak nectar secretion period. The substantial sucrose reduction indicates that pre-activated SWEET and CWINV genes maintain high expression and may drive continuous nectar formation from pre-accumulated sucrose. One SUS gene was also significantly upregulated at this stage, potentially partially explaining glucose accumulation in full-blooming flowers. Notably, not all floral sucrose is exported for nectar synthesis; a portion is degraded to sustain floral metabolism. The specific accumulation of glucose rather than fructose implies that fructose may be diverted into alternative pathways, which requires further investigation.
During the full-blooming stage to senescence stage (S6–S7), nectar secretion terminates alongside nectary degeneration. Residual glucose is converted to sucrose, and apoplastic sucrose is reabsorbed, resulting in increased sucrose and decreased glucose contents at S7. These physiological changes are strongly correlated with transcriptomic data. Three SUS genes were upregulated during senescence, with one key isoform reaching peak expression. Meanwhile, six SWEET genes were induced, among which SWEET10 and SWEET15 exhibited the highest transcript abundance at S7, suggesting their potential roles in post-secretion sugar recycling.
In summary, this study revealed the coordinated changes between sugar dynamics and stage-specific gene expression during T. mandshurica floral development and nectar secretion. Integrating physiological and transcriptomic evidence, we proposed a hypothetical regulatory network governing sequential sugar metabolism and transport across floral developmental stages. These findings provide a fundamental basis for further deciphering carbon allocation mechanisms underlying plant nectar secretion.
5. Conclusions
This study systematically investigated the physiological and molecular correlates of nectar secretion across seven key floral developmental stages of T. mandshurica through sugar component quantification and transcriptome analysis. Our results reveal a precise staged carbon allocation pattern associated with woody plant nectar secretion: (1) The per-bud stage 1and 2 is characterized by active starch degradation, which potentially provides essential carbon precursors for subsequent nectar synthesis; (2) The bud stage to half-blooming stage (S3–S5) is closely associated with sucrose biosynthesis and sugar transport program, which are potentially modulated by the coordinated expression of SUS, HK, and SWEET genes; (3) The high nectar secretion activity at the full-blooming stage is correlated with sustained SWEET-mediated sucrose efflux and CWINV-catalyzed sucrose hydrolysis; (4) The senescence stage exhibit sugar reabsorption and recycling processes that may optimize floral resource utilization. We further identified eight core TF families and a series of key structural genes that form a potential regulatory network linked to nectar sugar metabolism and transport. Collectively, these findings provide novel insights into the molecular regulatory framework of nectar secretion in woody Tilia species, complement the current nectar secretion models predominantly established for herbaceous plants, and identify valuable candidate genes and metabolic pathways for future functional validation. This study also offers a solid theoretical basis for the genetic improvement, high-yield cultivation, and nectar quality optimization of T. mandshurica and other nectar-producing woody plants.
Supplementary Materials
The following supporting information can be downloaded at: https://www.mdpi.com/article/10.3390/horticulturae12111448/s1. Table S1: Carbohydrate raw measurement data and corresponding standard-curve information; Table S2: Gene-level raw read counts from RNA-seq across seven floral developmental stages of Tilia mandshurica; Table S3: Gene-level FPKM expression values across seven floral developmental stages of Tilia mandshurica; Table S4: Primer sequences used for qRT-PCR validation; Table S5: Overview of transcriptome data for Tilia mandshurica flowers across different developmental stages; Table S6: Statistics of sequencing-read alignment efficiency against the T. mandshurica reference genome; Table S7: Proportions of reads mapped to exonic, intronic and intergenic regions of the reference genome; Table S8: Transcription factors associated with sugar metabolism and transport in T. mandshurica; Table S9: Sugar-metabolism-related DEGs of T. mandshurica during the bud-swelling stage; Table S10: Sugar-metabolism-related DEGs of T. mandshurica at the pre-flowering stage; Table S11: Sugar-metabolism-related DEGs of T. mandshurica during the full-blooming stage; Table S12: Sugar-metabolism-related DEGs of T. mandshurica during the flower-senescence stage; Table S13: SWEET family DEGs identified across floral developmental stages of T. mandshurica; Table S14: CWINV family DEGs identified across floral developmental stages of T. mandshurica; Figure S1: Identification of soft threshold power used in WGCNA; Figure S2. Global assessment of transcriptome data quality profiles of T. mandshurica across seven floral developmental stages (S1–S7: pre-bud to flower senescence). Figure S3: Correlation between RNA-seq (TPM) and qRT-PCR expression values for nine candidate genes.
Author Contributions
Conceptualization, H.M. and L.L.; methodology, J.D. and H.M.; software, L.C.; validation, L.Y., L.C., and F.X.; formal analysis, F.X.; investigation, L.Y. and L.C.; resources, Z.X.; data curation, J.D. and Z.X.; writing—original draft preparation, J.D.; writing—review and editing, H.M. and L.L.; visualization, J.D. and Z.X.; supervision, F.X.; project administration, H.M. and L.L.; funding acquisition, H.M. and L.L. All authors have read and agreed to the published version of the manuscript.
Funding
This research was funded by a grant from the Science and Technology Development Program of Jilin Province (20260402005ZP) and the Graduate Innovation Program of Beihua University (2025017).
Data Availability Statement
The data presented in this study are available on request from the corresponding authors due to the confidentiality constraints.
Acknowledgments
We thank Beihua University for the support related to the plant material.
Conflicts of Interest
The authors declare no conflicts of interest.
References
- Amasino, R. Seasonal and developmental timing of flowering. Plant J. 2010, 61, 1001–1013. [Google Scholar] [CrossRef] [Scilit] [PubMed]
- Heil, M. Nectar: Generation, regulation and ecological functions. Trends Plant Sci. 2011, 16, 191–200. [Google Scholar] [CrossRef] [Scilit] [PubMed]
- Brandenburg, A.; Dell’Olivo, A.; Bshary, R.; Kuhlemeier, C. The sweetest thing: Advances in nectar research. Curr. Opin. Plant Biol. 2009, 12, 486–490. [Google Scholar] [CrossRef] [Scilit] [PubMed]
- Roy, R.; Schmitt, A.J.; Thomas, J.B.; Carter, C.J. Review: Nectar biology: From molecules to ecosystems. Plant Sci. 2017, 262, 148–164. [Google Scholar] [CrossRef] [Scilit] [PubMed]
- Ollerton, J. Pollinator diversity: Distribution, ecological function, and conservation. Annu. Rev. Ecol. Evol. Syst. 2017, 48, 353–376. [Google Scholar] [CrossRef] [Scilit]
- Niu, L.J.; Hou, Y.Y.; Wen, S.J.; Zhang, H.P.; Qubi, A.Q.; Fu, Y.S.; Wang, H.; Ren, Z.X. Secretory behavior, production cost, and regulation of nectar. Biodivers. Sci. 2025, 33, 243–258. [Google Scholar]
- Ye, Z.M.; Jin, X.F.; Wang, Q.F.; Yang, C.F.; Inouye, D.W. Nectar replenishment maintains the neutral effects of nectar robbing on female reproductive success of Salvia przewalskii (Lamiaceae), a plant pollinated and robbed by bumble bees. Ann. Bot. 2017, 119, 1053–1069. [Google Scholar] [CrossRef] [Scilit] [PubMed]
- Lin, I.W.; Sosso, D.; Chen, L.Q.; Gase, K.; Kim, S.G.; Kessler, D.; Klinkenberg, P.M.; Gorder, M.K.; Hou, B.H.; Qu, X.Q. Nectar secretion requires sucrose phosphate synthases and the sugar transporter SWEET9. Nature 2014, 508, 546–549. [Google Scholar] [CrossRef] [Scilit] [PubMed]
- Worrell, A.C.; Bruneau, J.M.; Summerfelt, K.; Boersig, M.; Voelker, T.A. Expression of a maize sucrose phosphate synthase in tomato alters leaf carbohydrate partitioning. Plant Cell 1991, 3, 1121–1130. [Google Scholar] [CrossRef] [Scilit] [PubMed]
- Ruhlmann, J.M.; Kram, B.W.; Carter, C.J. CELL WALL INVERTASE 4 is required for nectar production in Arabidopsis. J. Exp. Bot. 2010, 61, 395–404. [Google Scholar] [CrossRef] [Scilit] [PubMed]
- Lunn, J.E.; Ashton, A.R.; Hatch, M.D.; Heldt, H.W. Purification, molecular cloning, and sequence analysis of sucrose-6F-phosphate phosphohydrolase from plants. Proc. Natl. Acad. Sci. USA 2000, 97, 12914–12919. [Google Scholar] [CrossRef] [Scilit] [PubMed]
- Solhaug, E.M.; Roy, R.; Chatt, E.C.; Klinkenberg, P.M.; Mohd-Fadzil, N.A.; Hampton, M.; Nikolau, B.J.; Carter, C.J. An integrated transcriptomics and metabolomics analysis of the Cucurbita pepo nectary implicates key modules of primary metabolism involved in nectar synthesis and secretion. Plant Direct 2019, 3, e00120. [Google Scholar] [CrossRef] [Scilit] [PubMed]
- Chatt, E.C.; Mahalim, S.N.; Mohd-Fadzil, N.A.; Roy, R.; Klinkenberg, P.M.; Horner, H.T.; Hampton, M.; Carter, C.J.; Nikolau, B.J. Nectar biosynthesis is conserved among floral and extrafloral nectaries. Plant Physiol. 2021, 185, 1595–1616. [Google Scholar] [CrossRef] [Scilit] [PubMed]
- Gttlinger, T.; Pirritano, M.; Simon, M.; Fu, J.; Lohaos, G. Metabolic and transcriptomic analyses of nectaries reveal differences in the mechanism of nectar production between monocots (Ananas comosus) and dicots (Nicotiana tabacum). BMC Plant Bio 2024, 24, 940. [Google Scholar] [CrossRef] [Scilit] [PubMed]
- Cruden, R.W.; Hermann, S.M.; Peterson, S. Patterns of nectar production and plant-pollinator coevolution. In The Biology of Nectaries; Bentley, B., Elias, T., Eds.; Columbia University Press: New York, NY, USA, 1983; pp. 80–125. [Google Scholar]
- Ewing, B.; Hillier, L.; Wendl, M.C.; Green, P. Base-calling of automated sequencer traces using phred. I. Accuracy assessment. Genome Res. 1998, 8, 175–185. [Google Scholar] [CrossRef] [Scilit] [PubMed]
- Pertea, M.; Pertea, G.M.; Antonescu, C.M.; Chang, T.C.; Mendell, J.T.; Salzberg, S.L. StringTie enables improved reconstruction of a transcriptome from RNA-seq reads. Nat. Biotechnol. 2015, 33, 290–295. [Google Scholar] [CrossRef] [Scilit] [PubMed]
- Trapnell, C.; Williams, B.A.; Pertea, G.; Mortazavi, A.; Garzon, R.; Salzberg, S.L.; Pachter, L. Transcript assembly and quantification by RNA-Seq reveals unannotated transcripts and isoform switching during cell differentiation. Nat. Biotechnol. 2010, 28, 511–515. [Google Scholar] [CrossRef] [Scilit] [PubMed]
- Love, M.I.; Huber, W.; Anders, S. Moderated estimation of fold change and dispersion for RNA-seq data with DESeq2. Genome Biol. 2014, 15, 550. [Google Scholar]
- Lin, L.; Du, J.Y.; Li, Q.S.; Yu, C.; Chen, L.; Li, W.Z.; Xia, F.C.; Mu, H.Z. Chromosome-level genome assembly of Tilia mandshurica reveals divergence of duplicated TPP genes associated with fructose-rich nectar formation. Tree Physiol. 2026, 46, tpag151. [Google Scholar] [CrossRef] [Scilit] [PubMed]
- Nepi, M.; Guarnieri, M.; Pacini, E. Nectar secretion, reabsorption, and sugar composition in male and female flowers of Cucurbita pepo. Int. J. Plant Sci. 2001, 162, 353–358. [Google Scholar] [CrossRef] [Scilit] [PubMed]
- Zhang, H.P.; Wen, S.J.; Wang, H.; Ren, Z.X. Floral nectar reabsorption and a sugar concentration gradient in two long-spurred Habenaria species (Orchidaceae). BMC Plant Biol. 2023, 23, 331. [Google Scholar] [CrossRef] [Scilit] [PubMed]
- Dong, K.; Dong, Y.; Su, R.; Zhang, J.L.; Qing, Z.; Yang, X.C.; Ren, X.X.; Ma, Y.B.; He, S.Y. Effect of nectar reabsorption on plant nectar investment in Cerasus cerasoides. Curr. Sci. 2016, 110, 251–256. [Google Scholar] [CrossRef] [Scilit]
- Nicolson, S.W. Sweet solutions: Nectar chemistry and quality. Philos. Trans. R. Soc. Lond. B Biol. Sci. 2022, 377, 20210163. [Google Scholar] [CrossRef] [Scilit] [PubMed]
- Liu, Y.; Dunker, S.; Durka, W.; Dominik, C.; Heuschele, J.M.; Honchar, H.; Hoffmann, P.; Musche, M.; Paxton, R.J.; Settele, J.; et al. Eco-evolutionary processes shaping floral nectar sugar composition. Sci. Rep. 2024, 14, 13856. [Google Scholar] [CrossRef] [Scilit] [PubMed]
- Granot, D.; Kelly, G.; Stein, O.; David-Schwartz, R. Substantial roles of hexokinase and fructokinase in the effects of sugars on plant physiology and development. J. Exp. Bot. 2014, 65, 809–819. [Google Scholar] [CrossRef] [Scilit] [PubMed]
- Eom, S.H.; Kim, E.; Hyun, T.K. HXK, SnRK1, and TOR signaling in plants: Unraveling mechanisms of stress response and secondary metabolism. Sci. Prog. 2024, 107, 1–19. [Google Scholar] [CrossRef] [Scilit] [PubMed]
- Aguilera-Alvarado, G.P.; Sánchez-Nieto, S. Plant hexokinases are multifaceted proteins. Plant Cell Physiol. 2017, 58, 1151–1160. [Google Scholar] [CrossRef] [Scilit] [PubMed]
- Stein, O.; Granot, D. An overview of sucrose synthases in plants. Front. Plant Sci. 2019, 10, 95. [Google Scholar] [CrossRef] [Scilit] [PubMed]
- Li, J.; Hu, Y.; Hu, J.; Xie, Q.; Chen, X.; Qi, X. Sucrose synthase: An enzyme with multiple roles in plant physiology. J. Plant Physiol. 2024, 303, 154352. [Google Scholar] [CrossRef] [Scilit] [PubMed]
- Wang, J.; Wu, Y.D.; Yang, Y.J.; Wang, X.C.; Wang, L. SWEET family sugar transporters in plants and their upstream regulatory factors. Acta Physiol. Sin. 2024, 60, 597–605. [Google Scholar]
- Chen, L.Q.; Qu, X.Q.; Hou, B.H.; Sosso, D.; Osorio, S.; Fernie, A.R.; Frommer, W.B. Sucrose efflux mediated by SWEET proteins as a key step for phloem transport. Science 2012, 335, 207–211. [Google Scholar] [CrossRef] [Scilit] [PubMed]
- Chardon, F.; Bedu, M.; Calenge, F.; Klemens, P.W.; Spinner, L.; Clement, G.; Chietera, G.; Léran, S.; Ferrand, M.; Lacombe, B.; et al. Leaf fructose content is controlled by the vacuolar transporter SWEET17 in Arabidopsis. Curr. Biol. 2013, 23, 697–702. [Google Scholar] [CrossRef] [Scilit] [PubMed]
- Zhou, Y.; Liu, L.; Huang, W.; Yuan, M.; Zhou, F.; Li, X.; Lin, Y. Overexpression of OsSWEET5 in rice causes growth retardation and precocious senescence. PLoS ONE 2014, 9, e94210. [Google Scholar] [CrossRef] [Scilit] [PubMed]
- Minami, A.; Kang, X.; Carter, C.J. A cell wall invertase controls nectar volume and sugar composition. Plant J. 2021, 107, 1016–1028. [Google Scholar] [CrossRef] [Scilit] [PubMed]
- Li, H.; Liu, T.; Wang, B.; Li, H. Genome-wide characterization and expression analysis of GATA transcription factors in response to methyl jasmonate in Salvia miltiorrhiza. Genes 2022, 13, 822. [Google Scholar] [CrossRef] [Scilit] [PubMed]
- Zhao, F.; Li, X.; Chen, Z.; Guo, C. Pan-genome-wide investigation and expression analysis of GATA gene family in maize. Plants 2025, 14, 1693. [Google Scholar] [CrossRef] [Scilit] [PubMed]
- Wang, J.; Lan, H.Y. Advances in research on the regulation of plant development and stress response by GATA transcription factors. Acta Phytophysiol. Sin. 2016, 52, 1785–1794. [Google Scholar]
- Xu, Z.; Casaretto, J.A.; Bi, Y.M.; Rothstein, S.J. Genome-wide binding analysis of AtGNC and AtCGA1 demonstrates their cross-regulation and common and specific functions. Plant Direct 2017, 1, e00016. [Google Scholar] [CrossRef] [Scilit] [PubMed]
- Huang, J.L.; Tong, S.M.; Hou, H.S. A review of studies on the WRKY transcription factor family in plants. Anhui Agric. Sci. Bull. 2012, 18, 19. [Google Scholar]
- Huang, T.; Yu, D.; Wang, X. VvWRKY22 transcription factor interacts with VvSnRK1.1/VvSnRK1.2 and regulates sugar accumulation in grape. Biochem. Biophys. Res. Commun. 2021, 554, 193–198. [Google Scholar] [CrossRef] [Scilit] [PubMed]
- Fan, X.; Chen, M.; Zhang, H.; Liu, Y.; Yang, M.; Ye, C.; Gu, H.; Xu, K.; Wu, B. Systematic identification and analysis of WRKY transcription factors reveals the role of MrWRKY14 in Myrica rubra. Front. Plant Sci. 2025, 16, 1602750. [Google Scholar] [CrossRef] [Scilit] [PubMed]
- Li, X.; Guo, W.; Li, J.; Yue, P.; Bu, H.; Jiang, J.; Liu, W.; Xu, Y.; Yuan, H.; Li, T.; et al. Histone acetylation at the promoter for the transcription factor PuWRKY31 affects sucrose accumulation in pear fruit. Plant Physiol. 2020, 182, 2035–2046. [Google Scholar] [CrossRef] [Scilit] [PubMed]
- Zhang, X.; Liu, W.; Yin, Y.; Zhang, J.; Li, J.; Tan, X.; Wu, L. WRKY transcription factors participate in abiotic stress responses mediated by sugar metabolism. Front. Plant Sci. 2025, 16, 1646357. [Google Scholar] [CrossRef] [Scilit] [PubMed]
- Chen, D.; Shi, Y.; Zhang, P.; Xie, W.; Li, S.; Xiao, J.; Yuan, M. Deletion of the sugar importer gene OsSWEET1b accelerates sugar starvation-promoted leaf senescence in rice. Plant Physiol. 2024, 195, 2176–2194. [Google Scholar] [CrossRef] [Scilit] [PubMed]
- Liu, H.; Ma, J.; Li, H. Transcriptomic and microstructural analyses in Liriodendron tulipifera Linn. reveal candidate genes involved in nectary development and nectar secretion. BMC Plant Biol. 2019, 19, 531. [Google Scholar] [CrossRef] [Scilit] [PubMed]
- Feng, K.; Hou, X.L.; Xing, G.M.; Liu, J.X.; Duan, A.Q.; Xu, Z.S.; Li, M.Y.; Zhuang, J.; Xiong, A.S. Advances in AP2/ERF super-family transcription factors in plant. Crit. Rev. Biotechnol. 2020, 40, 750–776. [Google Scholar] [CrossRef] [Scilit] [PubMed]
- Shi, W.; Song, Y.; Liu, T.; Ma, Q.; Yin, W.; Shen, Y.; Liu, T.; Jiang, C.; Zhang, K.; Lv, D.; et al. StRAP2. 3, an ERF-VII transcription factor, directly activates StInvInh2 to enhance cold-induced sweetening resistance in potato. Hortic. Res. 2021, 8, 82. [Google Scholar] [CrossRef] [Scilit] [PubMed]
- Hu, X.; Li, S.; Lin, X.; Fang, H.; Shi, Y.; Grierson, D.; Chen, K. Transcription factor CitERF16 is involved in citrus fruit sucrose accumulation by activating CitSWEET11d. Front. Plant Sci. 2021, 12, 809619. [Google Scholar] [CrossRef] [Scilit] [PubMed]
- Lu, L.; Delrot, S.; Fan, P.; Zhang, Z.; Wu, D.; Dong, F.; Garcia-Caparros, P.; Li, S.; Dai, Z.; Liang, Z. The transcription factors ERF105 and NAC72 regulate expression of a sugar transporter gene and hexose accumulation in grape. Plant Cell 2025, 37, koae326. [Google Scholar] [CrossRef] [Scilit] [PubMed]
- Fan, Y.; Yang, H.; Lai, D.; He, A.; Xue, G.; Feng, L.; Chen, L.; Cheng, X.B.; Ruan, J.; Yan, J.; et al. Genome-wide identification and expression analysis of the bHLH transcription factor family and its response to abiotic stress in sorghum [Sorghum bicolor (L.) Moench]. BMC Genom. 2021, 22, 415. [Google Scholar] [CrossRef] [Scilit] [PubMed]
- Wei, L.; Mao, W.; Jia, M.; Xing, S.; Ali, U.; Zhao, Y.; Chen, Y.; Cao, M.; Dai, Z.; Zhang, K.; et al. FaMYB44. 2, a transcriptional repressor, negatively regulates sucrose accumulation in strawberry receptacles through interplay with FaMYB10. J. Exp. Bot. 2018, 69, 4805–4820. [Google Scholar] [CrossRef] [Scilit] [PubMed]
- Xin, Y.; Chen, X.; Liang, J.; Wang, S.; Pan, W.; Wu, J.; Zhang, M.; Zaccai, M.; Yu, X.; Zhang, X.; et al. Auxin regulates bulbil initiation by mediating sucrose metabolism in Lilium lancifolium. Hortic. Res. 2024, 11, uhae054. [Google Scholar] [CrossRef] [Scilit] [PubMed]
- Stephen, K.; Beena, R.; Kira, A.G.; Shanija, S.; Saravanan, R. Changes in physiological traits and expression of key genes involved in sugar signaling pathway in rice under high temperature stress. 3 Biotech 2022, 12, 183. [Google Scholar] [CrossRef] [Scilit] [PubMed]
- Lou, H.; Li, S.; Shi, Z.; Zou, Y.; Zhang, Y.; Huang, X.; Yang, D.; Yang, Y.; Li, Z.; Xu, C. Engineering source-sink relations by prime editing confers heat-stress resilience in tomato and rice. Cell 2025, 188, 530–549. [Google Scholar] [CrossRef] [Scilit] [PubMed]
- Brewer, P.B.; Howles, P.A.; Dorian, K.; Griffith, M.E.; Ishida, T.; Kaplan-Levy, R.N.; Kilinc, A.; Smyth, D.R. PETAL LOSS, a trihelix transcription factor gene, regulates perianth architecture in the Arabidopsis flower. Development 2004, 131, 4035–4045. [Google Scholar] [CrossRef] [Scilit] [PubMed]
- Escalante-Pérez, M.; Heil, M. Nectar secretion: Its ecological context and physiological regulation. In Secretions and Exudates in Biological Systems, 1st ed.; Springer: Berlin/Heidelberg, Germany, 2012; Volume 12, pp. 187–219. [Google Scholar]
- Li, S.; Cui, Y.; Liu, Y.; Yang, M.; Wu, X.; Chen, Q.; Zhao, Y. The GmGT-2F, a trihelix transcription factor, regulates seed oil content by directly activating GmAGAL transcription in soybean. J. Integr. Plant Biol. 2026, 68, 1794–1814. [Google Scholar] [CrossRef] [Scilit] [PubMed]
- Tokutsu, R.; Fujimura-Kamada, K.; Matsuo, T.; Yamasaki, T.; Minagawa, J. The CONSTANS flowering complex controls the protective response of photosynthesis in the green alga Chlamydomonas. Nat. Commun. 2019, 10, 4099. [Google Scholar] [CrossRef] [Scilit] [PubMed]
- Xu, H.; Li, S.; Bello, B.K.; Ajadi, A.A.; Luo, J.; Yin, M.; Liu, X.; Chen, L.; Ying, J.; Tong, X.; et al. Five rice seed-specific NF-YC genes redundantly regulate grain quality and seed germination via interfering gibberellin pathway. Int. J. Mol. Sci. 2022, 23, 8382. [Google Scholar] [CrossRef] [Scilit] [PubMed]
- Gazzarrini, S.; Song, L. LAFL factors in seed development and phase transitions. Annu. Rev. Plant Biol. 2024, 75, 459–488. [Google Scholar] [CrossRef] [Scilit] [PubMed]
- Bello, B.K.; Hou, Y.; Zhao, J.; Jiao, G.; Wu, Y.; Li, Z.; Wang, Y.; Tong, X.; Wang, W.; Yuan, W.; et al. NF-YB1-YC12-bHLH144 complex directly activates Wx to regulate grain quality in rice (Oryza sativa L.). Plant Biotechnol. J. 2019, 17, 1222–1235. [Google Scholar] [CrossRef] [Scilit] [PubMed]
- Hedhly, A.; Vogler, H.; Schmid, M.W.; Pazmino, D.; Gagliardini, V.; Santelia, D.; Grossniklaus, U. Starch turnover and metabolism during flower and early embryo development. Plant Physiol. 2016, 172, 2388–2402. [Google Scholar] [CrossRef] [Scilit] [PubMed]
- MacNeill, G.J.; Mehrpouyan, S.; Minow, M.A.A.; Patterson, J.A.; Tetlow, I.J.; Emes, M.J. Starch as a source, starch as a sink: The bifunctional role of starch in carbon allocation. J. Exp. Bot. 2017, 68, 4433–4453. [Google Scholar] [CrossRef] [Scilit] [PubMed]
- Yamada, K.; Norikoshi, R.; Suzuk, K.; Imanishi, H.; Ichimura, K. Determination of subcellular concentrations of soluble carbohydrates in rose petals during opening by nonaqueous fractionation method combined with infiltration-centrifugation method. Planta 2009, 230, 1115–1127. [Google Scholar] [CrossRef] [Scilit] [PubMed]
- Pattaravayo, R.; Ketsa, S.; Van Doorn, W.G. Sucrose feeding of Cut Dendrobium inflorescences promotes bud opening, inhibits abscission of open flowers, and delays tepal senescence. Postharvest Biol. Technol. 2013, 77, 7–10. [Google Scholar] [CrossRef] [Scilit]
- Su, X.; Zhang, L.; Zhao, Y.; Li, F.; Wang, Y.; Li, Y.; Yang, J. Integrated morphological, metabolomic, and transcriptomic analysis unravels the mechanism of floral blooming in Lonicera japonica cultivars. Sci. Hortic. 2026, 363, 114891. [Google Scholar] [CrossRef] [Scilit]

Disclaimer/Publisher’s Note: The statements, opinions and data contained in all publications are solely those of the individual author(s) and contributor(s) and not of MDPI and/or the editor(s). MDPI and/or the editor(s) disclaim responsibility for any injury to people or property resulting from any ideas, methods, instructions or products referred to in the content. |
© 2026 by the authors. Licensee MDPI, Basel, Switzerland. This article is an open access article distributed under the terms and conditions of the Creative Commons Attribution (CC BY) license.