


Highlights
What are the main findings?
- •
- At 0 °C, polyethylene liners limited week-16 root mass loss to 1.4–2.6%, versus 32.5–39.5% in woven polypropylene sacks.
- •
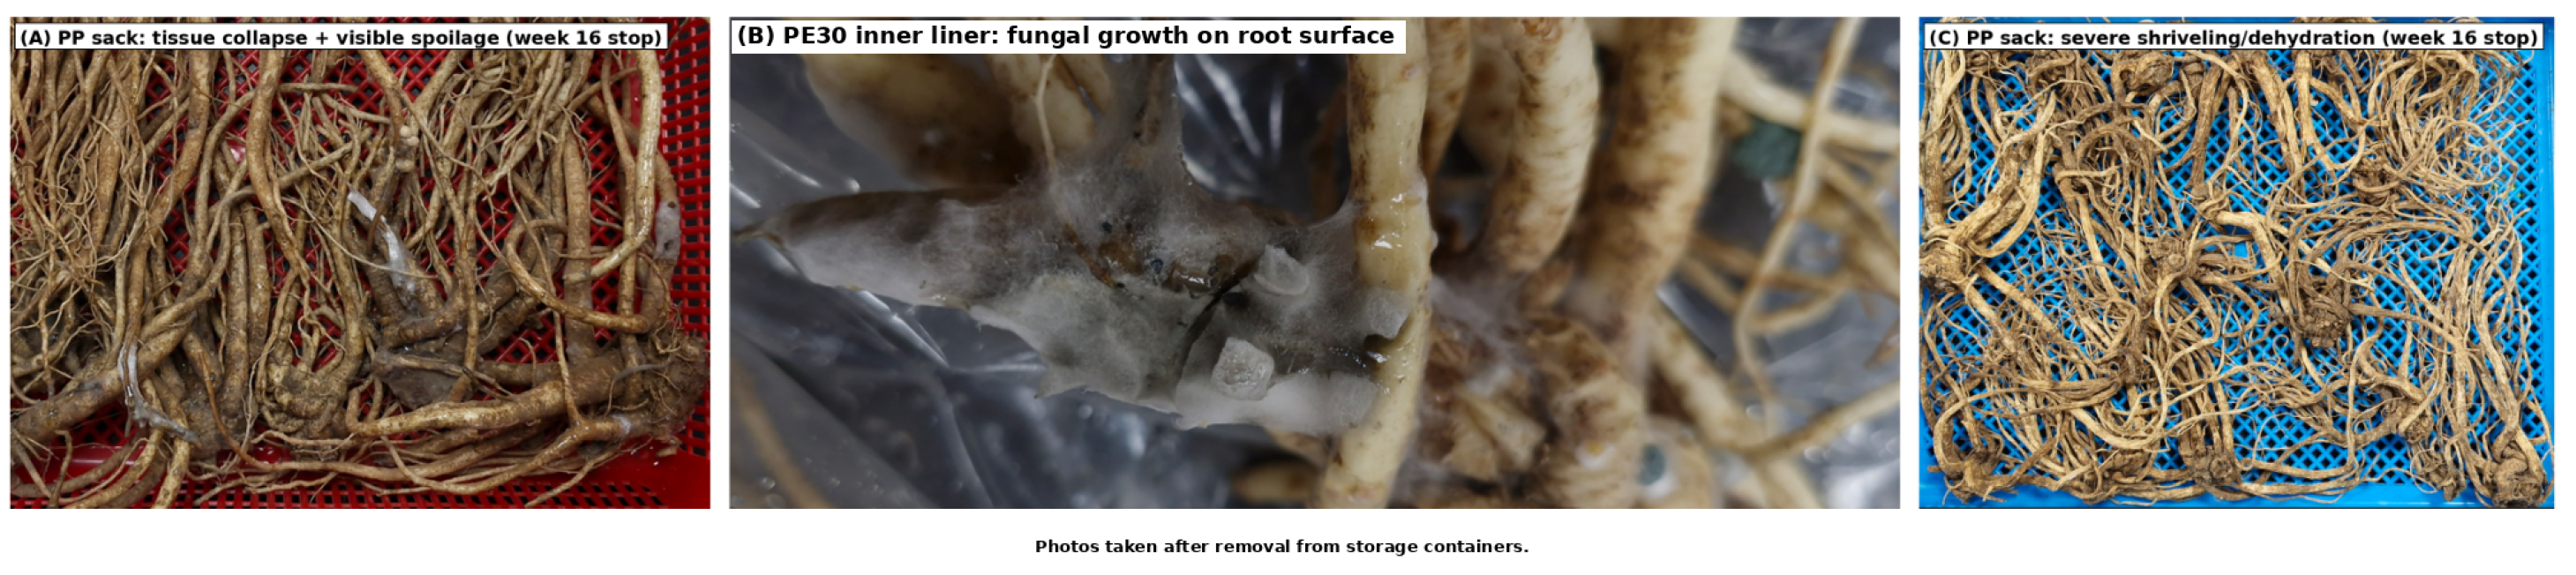
- Polypropylene storage ended through severe dehydration, despite low visible decay; decay constrained the polyethylene sound-root endpoint.
- •
- The polyethylene treatment-mean time to 20% visible decay ranged from 5.5 to 18.0 weeks across the tested lot and washing combinations.
What are the implications of the main findings?
- •
- Package-unit assessment of retained mass and visible decay identifies the principal observed constraint in each package system.
- •
- Reporting the stopping criterion alongside storage duration makes comparisons between dehydration-limited and decay-limited storage interpretable.
Abstract
Fresh-market balloon flower (Platycodon grandiflorus) roots were evaluated at 0 °C to distinguish dehydration- and decay-limited storage. A 30 μm polyethylene liner (PE30) and woven polypropylene (PP) sacks were compared with and without washing, using three packages per combination in each of two commercial source lots. Package-unit mass loss and visible decay were summarized over 16 weeks using defect-specific endpoints and the marketable-mass retention index (MMRI). PE30 mass loss was 1.4–2.6%, compared with 32.5–39.5% under PP, which reached the dehydration stopping rule. PE30 treatment-mean times to 20% visible decay were 5.5–18.0 weeks, interpolated between fortnightly observations; these differ from PP dehydration endpoints. In one lot, week-16 PE30 decay averaged 15% after washing versus 75% without washing, but statistical support was model-dependent. Descriptive week-16 ΔE, firmness and total phenolic content ranged from 5.21–14.31, 22.56–33.72 N and 46.13–56.73 mg GAE g−1 dry weight, respectively. MMRI combined retained mass and sound-root counts, but did not measure saleable mass. PE30 consistently reduced dehydration under the tested conditions, whereas washing did not show a consistently supported decay benefit. Package-unit assessment distinguishes the dominant failure mode when each endpoint retains its specific criterion.
1. Introduction
Fresh-market balloon flower (Platycodon grandiflorus) roots must retain usable mass and a visibly sound condition during storage. Quality assessment is closely linked to the intended product: value-chain analysis has documented variation across balloon-flower origins and processing stages [1], while work on root slices has examined moisture removal and physicochemical changes during microwave-vacuum drying [2]. For roots marketed fresh, preserving hydration and appearance are central storage objectives. Evaluating physical retention and visible deterioration together, therefore, connects product quality with the handling system and its intended use [3,4].
Packaging and pre-packaging washing are practical decisions that can influence these outcomes. At 0 °C, washed wintering radish in polyethylene-lined boxes retained better appearance and marketability than roots in flexible bulk bags, with washing and packaging assessed as combined treatments [5]. In carrots, sanitizer and package choices jointly affected microbial quality and physical deterioration [6], and processing-related microbiological changes have also been documented in balloon flower [7]. These findings place washing within the complete handling sequence. Process-water studies further emphasize the influence of water condition and control on microbial removal and transfer [8,9]. For fresh balloon-flower roots, the storage response to potable-water washing can therefore be considered, alongside the choice of package.
Recent packaging studies have examined moisture retention, together with other forms of deterioration. Liner perforation affected moisture loss, condensation and decay in pomegranate [10]; carrot responses varied with starting batches and temperature abuse [11]; and early high-humidity treatment and cooling regimes affected subsequent carrot disease [12]. Radish black-spot research connected packaging responses with physiological and molecular measurements [13], while an okra study combined LED illumination and modified-atmosphere packaging and assessed mass loss, wilting, texture and package gases under simulated cold-chain logistics [14]. Recent syntheses of water loss and high-humidity preservation, likewise, describe interactions among the product, package and storage environment [15,16]. These studies support evaluating the balance between water retention and deterioration in the particular crop and handling system of interest.
The present study compared a 30 μm polyethylene inner liner (PE30) with the supplying grower’s woven polypropylene (PP) sack for fresh-market balloon flower, at 0 °C. Reduced-scale root packages used the grower’s materials and closure practices, with washing included as a second treatment factor. The comparison focused on package-unit mass loss, visible decay and the point at which each observed defect constrained continued storage. This empirical assessment complements process-based work on respiration, transpiration, gas exchange and moisture transport in packaged produce [17,18].
The objectives were to quantify package-unit mass loss and visible decay, describe defect-specific operational failure times, and summarize retained mass and the sound-root fraction over a common 16-week window. We hypothesized that PE30 would reduce mass loss relative to PP and that visible decay would become the principal observed constraint in the liner system. Washing responses were evaluated separately, within the two commercial source lots. Time-to-unmarketability criteria and MMRI/AUMRI16 summarized the observed outcomes, while microclimate and supporting quality profiles provided descriptive context. Failure times defined by different defects were not treated as interchangeable estimates of commercial shelf life.
2. Materials and Methods
2.1. Plant Material, Treatments, and Storage Design
Fresh roots of a Korean local landrace of balloon flower (Platycodon grandiflorus) were obtained from a commercial farm at 484 Bongbal-ri, Yeonghyeon-myeon, Goseong-gun, Gyeongsangnam-do, Republic of Korea. After transport by vehicle, the experiment began on 21 March 2025, the following day. Mechanically damaged or visibly diseased roots were excluded. Two commercial harvest lots were supplied as 2-year and 3-year roots. Each age class was represented by one lot, so age and source-lot effects were inseparable. Treatment comparisons were conducted separately within the two lots. The supplied age labels identify the source lots, and do not support a replicated comparison of root ages.
Within each lot, washing (washed or unwashed) and packaging (PE30 or woven PP) formed a 2 × 2 randomized complete block layout. Three spatial blocks represented the front, middle and rear of one cold-storage room; each block contained one package of every treatment, giving 12 packages per lot and 24 packages overall. Excel RAND values were sorted within block to assign treatment packages to predefined positions. The package was the storage experimental unit, and the same packages were followed over time. Each package initially contained 20 roots and 148–190 g in the 2-year lot, or 12 roots and 155–213 g in the 3-year lot.
Washed roots were rinsed with potable water, without sanitizer, using a commercial root washing/drying line, drained and air-dried at ambient temperature for 15 h until no free surface water was visible. Independent washing/drying runs for the three packages per treatment were not documented. Thus, the three packages replicated subsequent storage units, rather than documenting independent repetitions of the washing/drying operation. Washing contrasts describe the preparation sequences used for these source lots; package replication alone cannot establish repeatable process-level washing effects.
The PE30 system used a commercial 30 μm polyethylene inner liner (30 × 40 cm). The reference was the supplying grower’s woven polypropylene sack. Both were tested as reduced-scale multi-root packages using farm materials and cable-tie closure. PP dimensions and weave density were not retained in the records; material permeability, storage-package headspace volume and closure leakage were not measured. The comparison therefore concerns the assembled package systems under the stated loading and handling conditions (Table 1), rather than an isolated polymer or permeability effect. Recorded specifications and unmeasured reporting items are consolidated in Table S1.
Table 1.
Core experimental design and packaging information. Detailed reporting items are provided in Supplementary Table S1.
Packages were assessed every 2 weeks. Root mass was recorded before opening, and roots temporarily removed for visual or instrumental assessment, including penetration testing, were returned to their original package before reclosure with a new cable tie. Destructive moisture, total phenolic content (TPC) and liquid-chromatography (LC) measurements used a separate analytical sampling set. Package-linked records supported weight loss, visible decay and their derived endpoints. Measurements without retained package identity were summarized descriptively; root subsamples did not add storage replicates.
2.2. Storage Microclimate Monitoring
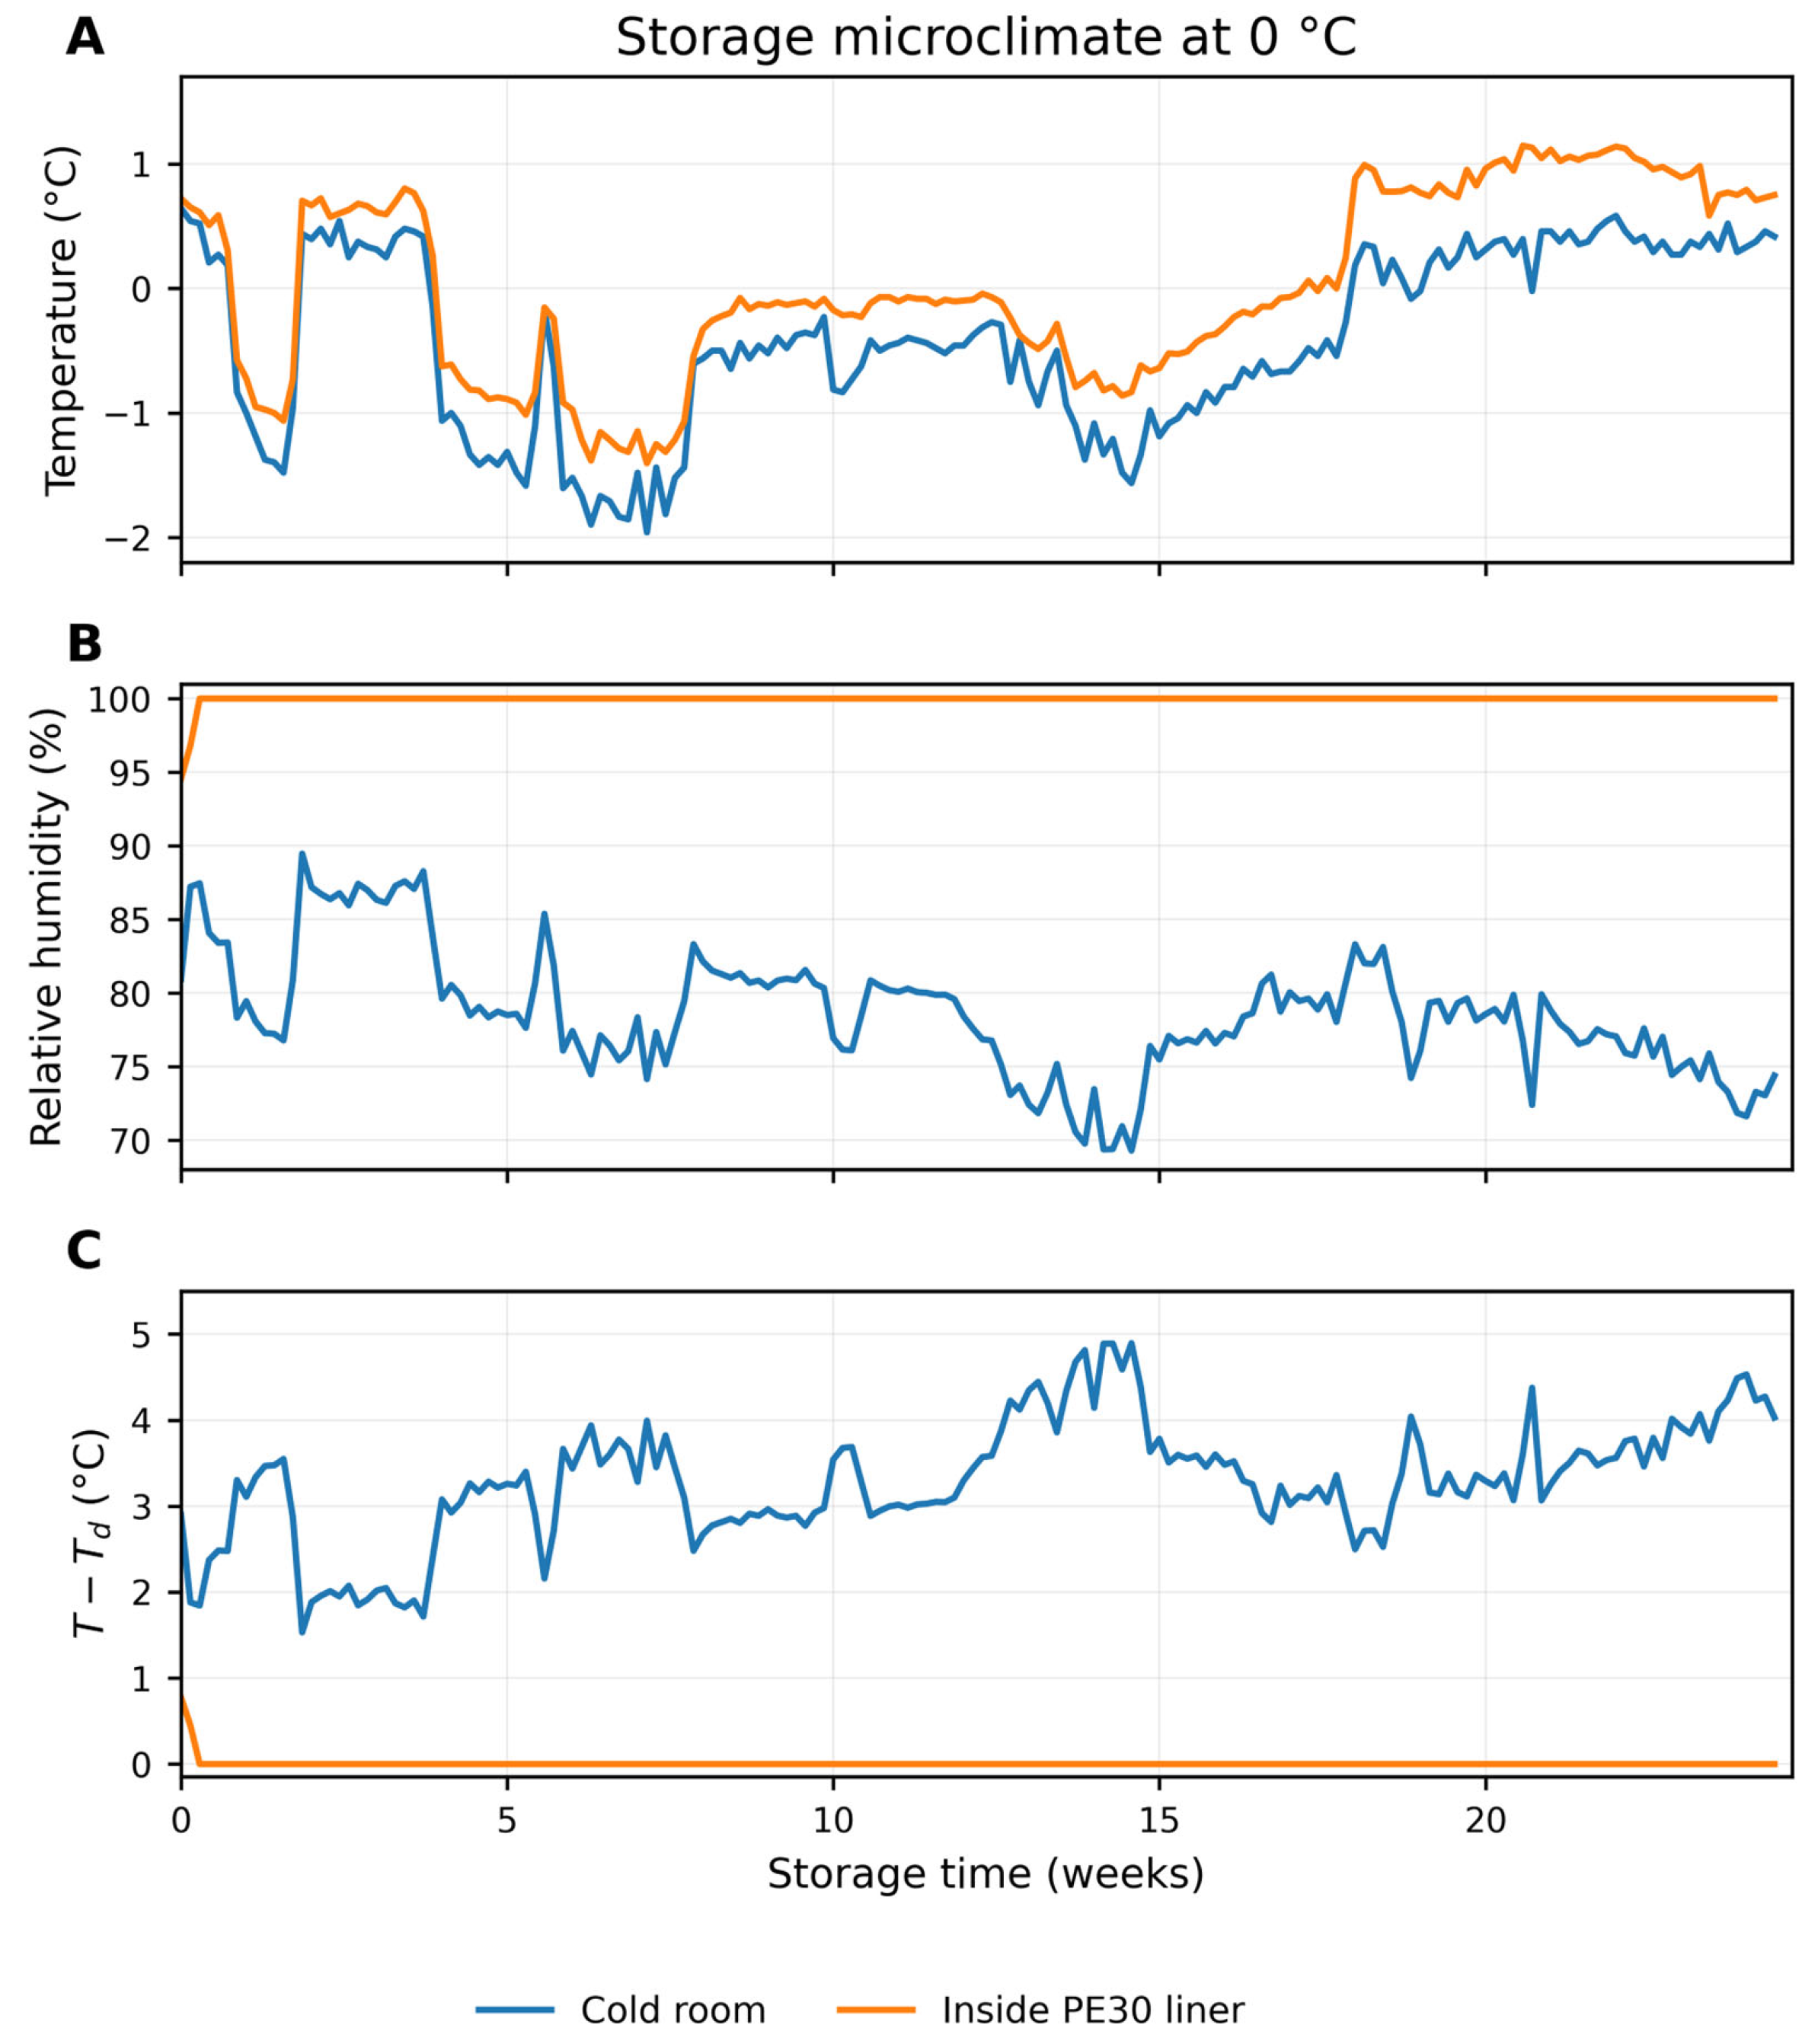
Temperature and relative humidity (RH) were recorded with WatchDog B-Series loggers (Spectrum Technologies Inc., Aurora, IL, USA; B102, item 3621WD; stated accuracy ±0.6 °C and ±5% RH). One exported series described central cold-room free air adjacent to PP sacks; it was not a PP-headspace measurement. Three representative loggers were placed centrally across selected PE30 units, including washed and unwashed groups, without touching roots. The available PE30 readings were averaged at each timestamp. The cold-room and representative PE30 series contained 4093 and 4094 timestamp records, respectively; daily means are plotted in Figure 1. Because individual packages were not independently instrumented, these process records were not subjected to treatment tests or included as package-level covariates.
Figure 1.
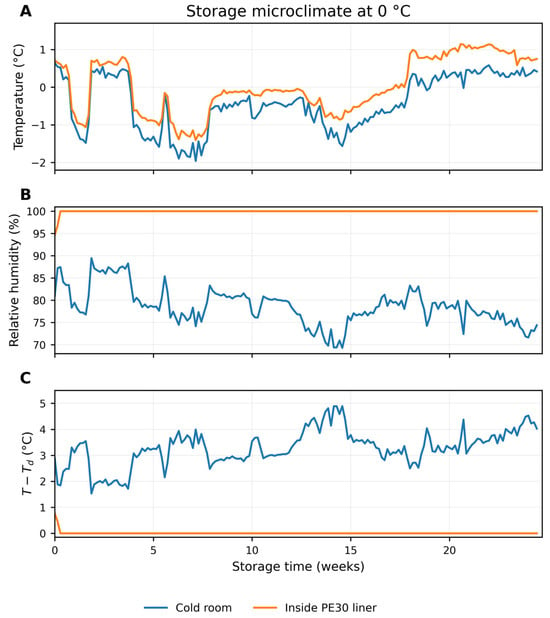
Storage microclimate during 0 °C storage, shown as daily means from timestamp-level logger records. (A) Temperature. (B) Relative humidity. (C) Dew-point depression (T − Td); values near zero indicate that air temperature was close to its dew point. “Cold room” denotes free air adjacent to PP sacks, and “Inside PE liner” denotes representative PE30 headspace. The logger series describe process conditions rather than independently replicated package means.
Dew-point temperature (Td) was calculated using the Magnus relation (a = 17.62; b = 243.12 °C), and dew-point depression was T − Td. Air vapor-pressure deficit was calculated at each timestamp as VPDair = es(T)(1 − RH/100), where es(T) = 0.6112 exp [17.62T/(243.12 + T)] kPa [19]. Calculations for PE30 used the representative mean series. Their SD describes temporal variation in air conditions.
2.3. Calculation of Package-Unit Weight Loss
Cumulative weight loss (%) was calculated for each package unit, relative to its initial package-unit root mass:
where PW0 is the total root mass of the package unit at week 0 and PWt is the mass of the same package unit at storage time t. Weight-loss analysis used three storage-package units per treatment; this replication is distinct from independent preparation runs (Section 2.1).
Weight loss (%) = ((PW0 − PWt)/PW0) × 100
2.4. Visible Decay and Operational Endpoints
Visible decay was scored for each assessed root as absence (0) or presence (1) of fungal growth and/or soft rot. Incidence was the number of affected roots divided by the number assessed, multiplied by 100: 20 roots per package in the 2-year lot and 12 in the 3-year lot [20]. Follow-up ended when severe dehydration, collapse or extensive decay prevented routine sampling and measurement of most roots. PP treatments reached the dehydration stopping rule at week 16; PE30 treatments were followed for up to 30 weeks (Figure S1).
2.4.1. Time-to-Unmarketability
Time-to-unmarketability (TTU) denoted the first scheduled assessment at which the operational stopping rule was met. For PP, dehydration-driven termination occurred at week 16, when severe shriveling and collapse prevented routine assessment of most roots. A separate PE30 endpoint, TTU80, was calculated by linear interpolation between adjacent observations when the treatment-mean sound-root proportion first reached 80% (20% visible decay). The mean was formed before interpolation, so this is the crossing of the treatment-mean curve, not the mean of package-specific crossing times. The 20% cutoff is an interpretable operational benchmark for sound-root counts, not a buyer- or sensory-validated commercial rejection threshold. Sensitivity calculations used 10%, 20% and 30% decay (Table S13A). Each interpolated TTU80 is reported with its bracketing observation weeks and the corresponding observed decay values (Table S13B); package-specific crossings are provided to show variability (Table S13C). The brackets are observation intervals, not confidence intervals, and interpolation does not provide sub-fortnightly measurement precision. PP stopping and PE30 decay-threshold times retain different definitions, and are not directly comparable shelf-life estimates.
2.4.2. Marketable-Mass Retention Index
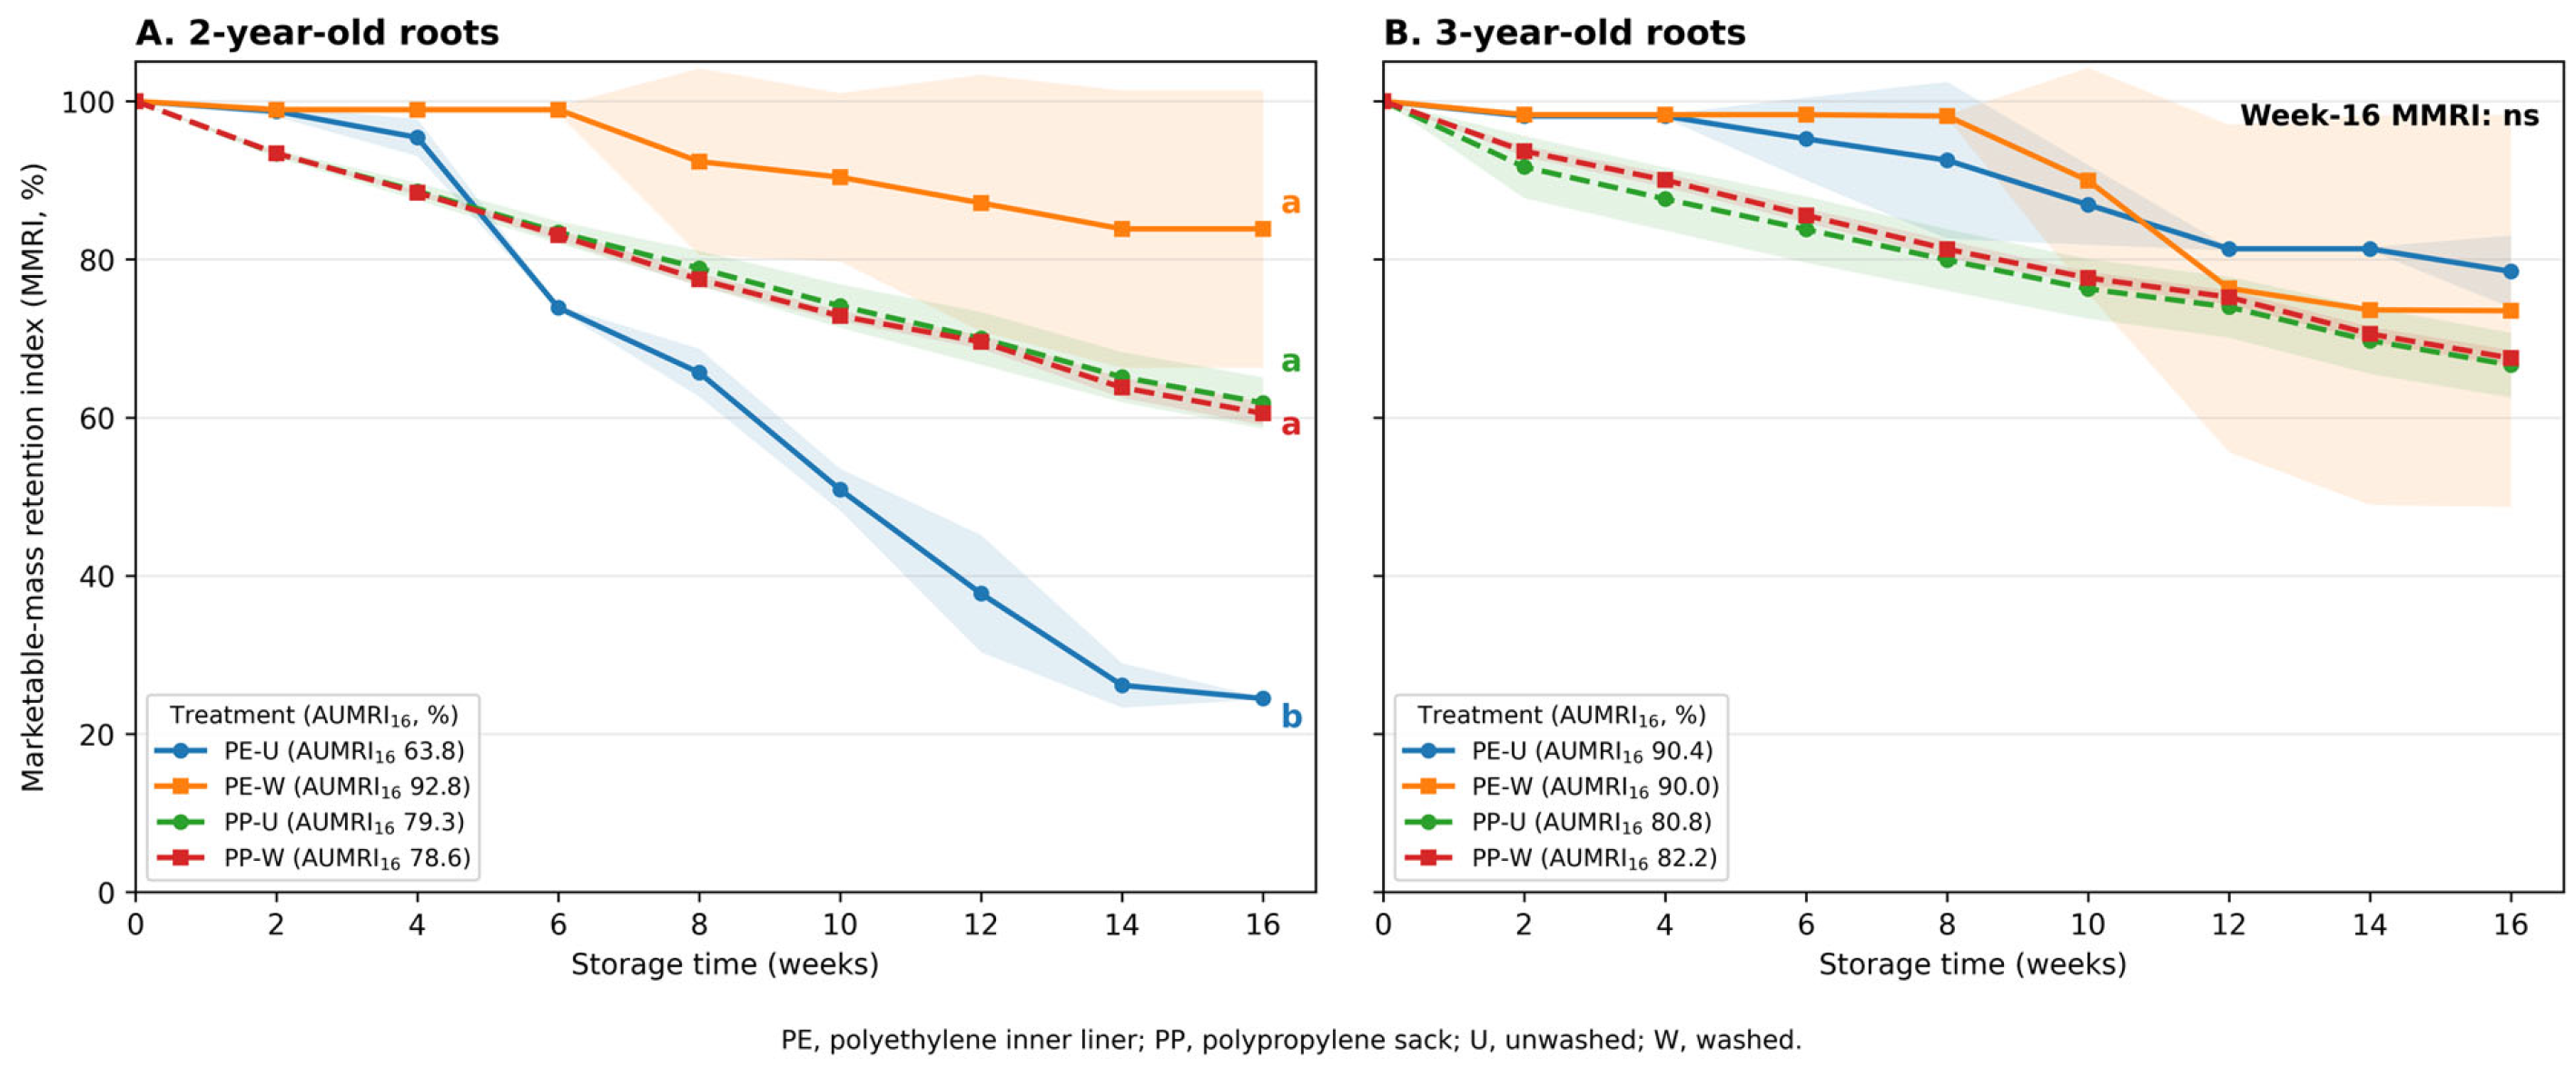
The marketable-mass retention index (MMRI, %) was calculated for each package as ((100 − weight loss%)/100) × ((100 − visible decay%)/100) × 100. The count-based sound-root fraction approximates a sound-mass fraction only if sound and visibly decayed roots have similar mean remaining mass. These fractions were not weighed separately, so the assumption could not be checked. MMRI is therefore an operational count-adjusted retained-mass proxy, not directly measured marketable mass. It assigns zero marketable contribution to roots classified as decayed, but does not directly penalize shriveling, firmness deterioration or other commercial quality defects. MMRI was interpreted alongside the observed failure mode. The trapezoidal area under each package’s MMRI trajectory over weeks 0–16, divided by 16, gave AUMRI16, which inherits the same assumptions. Treatment summaries used the three package values. Weight loss and visible decay were also displayed jointly for all 24 packages at week 16.
2.5. Supporting Quality Measurements
2.5.1. Surface Color and Firmness
Surface color was measured using a white-tile-calibrated Chroma Meter CR-400 (Konica Minolta, Tokyo, Japan) and expressed as CIE L*, a* and b* [21,22]. Total color change, ΔE = [(L*t − L*0)2 + (a*t − a*0)2 + (b*t − b*0)2]1/2, was calculated between treatment-series mean color vectors, and expresses the magnitude of color departure from baseline. Firmness was the maximum penetration force (N) with a 2 mm probe at 2 mm s−1 to 10 mm depth [23]. Root-subsample means and SD provided descriptive quality profiles; package identity was not retained. Detailed protocols and profiles are provided in Supplementary Methods S1.4 and Figures S4 and S9.
2.5.2. Tissue Moisture
Tissue moisture (%) was calculated from fresh and freeze-dried mass as (FW − DW)/FW × 100 after 1 week of lyophilization to constant mass. Only treatment-level means and SD were retained, so moisture was a descriptive supporting profile, excluded from inference and multivariate analyses (Supplementary Methods S1.3; Figure S8).
2.5.3. Total Phenolic Content
TPC was measured using the Folin–Ciocalteu assay [24] on aqueous extracts of freeze-dried powder and expressed as mg gallic-acid equivalent (GAE) g−1 dry weight. Standards covered 0–1000 μg mL−1; the calibration was A760 = 0.0018276C + 0.0849 (R2 = 0.997927). Extraction, reaction conditions and the mass/volume conversion are provided in Supplementary Methods S1.7 and Table S2. The assay measures reducing capacity, rather than a compound-specific phenolic profile [25]. Extract-level observations lacked retained package identity, and were summarized descriptively (Figure S5).
2.5.4. Targeted Platycoside E LC Analysis
A targeted LC peak assigned to platycoside E was monitored by HPLC-PDA at 210 nm after extraction of freeze-dried powder with 70% methanol [26,27]. Extraction and chromatographic conditions are detailed in Supplementary Methods S1.6. Same-batch standards covered 125–1000 μg mL−1 (R2 = 0.991289). Sample responses exceeded the demonstrated calibration range in 430 of 439 observations, with no retained dilution or within-range reinjection record. Results were, therefore, reported as the integrated target-peak area and semiquantitative relative response against the lot-specific week-0 mean (Table S2C; Figures S7 and S10).
2.5.5. Qualitative Incubation-Chamber CO2 Index
Final CO2 in a separate 3400 mL incubation chamber was assessed after 1 h at 20.5 °C [28,29]. This assay was performed outside the storage packages. Neither O2 nor CO2 was monitored inside the PE30 or PP packages during 0 °C storage. Initial chamber CO2 and blanks were not archived, and 407 of 440 derived concentrations were below the lowest non-zero standard (0.25%). The chamber response was therefore retained only as a qualitative supporting index; it is neither a validated net respiration rate, nor a measurement of the storage-package atmosphere (Supplementary Methods S1.2; Figure S8). It was excluded from treatment inference and multivariate analyses.
2.6. Statistical Analysis
Analyses were conducted within each commercial lot, using package as the experimental unit (n = 3 per treatment) and spatial block as a fixed nuisance term. The common comparison window was weeks 0–16; unavailable PP observations after dehydration termination were not imputed. Week-16 weight loss, decay and MMRI, and one trajectory-integrated AUMRI16 value per package, were analyzed as endpoint ~ block + packaging × washing. Each treatment term had 1 df, block 2 df and residual error 6 df. ANOVA and partial η2 summarized continuous endpoints. Decay F tests were treated as model-based reference analyses because of bounded, zero-heavy observations. Tukey HSD comparisons of continuous endpoints used the block-adjusted residual mean square and 6 error df after a relevant omnibus effect (Table 2 and Tables S8 and S9).
Table 2.
Block-adjusted endpoint ANOVA and global randomization sensitivity results within each commercial lot. All factorial F tests have 1 and 6 df; the global treatment F has 3 and 6 df. Values in parentheses are model-based p values.
Randomization sensitivity analyses distinguished the null hypothesis being tested. The global sharp null of no treatment effect was assessed using treatment F(3,6) across all (4!)3 = 13,824 within-block allocations. Factor-specific F statistics over these same allocations were retained only as global-null reference screens, not exact isolated main-effect or interaction tests [30]. For decay, a conditional washing screen preserved packaging and block and exchanged washing labels within six packaging × block pairs (64 allocations), using the joint washing-plus-interaction F(2,6). A separate within-PE30 paired contrast used eight possible washing-label allocations. Enumerated p values included the observed assignment, and counted statistics at least as extreme as observed (Table S10). Interpretation of these label-enumeration screens assumes exchangeability of the storage-package outcomes under the relevant null. The retained allocation record concerns package positions; independent preparation runs were not documented. The screens therefore assess sensitivity within the package-level analysis, and cannot establish independent washing-process replication.
Repeated storage time was modeled within package over nine assessments through week 16. Supportive maximum-likelihood random-intercept models used weight loss ~ block + (t + t2) × packaging × washing, with t = week/16 and PackageID as the random intercept. Denominator-weighted binomial GEE used logit(mean decay) ~ block + t × packaging × washing, PackageID clustering and exchangeable working correlation [31]. For GEE stabilization only, 0.5 was added to both decayed and sound counts; plots and endpoint analyses used uncorrected counts. Robust and Mancl–DeRouen bias-reduced covariance were examined because each lot had only 12 clusters [32]. Model specifications, coefficients and diagnostics are provided with the data; Table S4 reports these supportive trajectory analyses. Original analyses used Python 3.12.13 with NumPy, pandas and SciPy. The additional threshold sensitivity and joint endpoint plot used the retained package-linked records without altering observations.
Supporting profiles were analyzed at their recorded level. PCA used 72 centered and scaled treatment × week means for weight loss, decay, absolute firmness deviation from baseline, and ΔE (Figure S11). MMRI was excluded to avoid duplication of its component outcomes; CO2 and moisture were excluded because of their analytical or archival limitations. For exploratory correlations, washing was pooled within lot × packaging to form 36 group × week means. Variable ranks were residualized against week, and pairwise correlations of residual ranks were reported with Benjamini–Hochberg adjustment across six pairs [33] (Figure S12). These aggregated serial observations were used for visualization, not independent package-level treatment tests or causal inference.
3. Results
Table 2 summarizes the package-level endpoint analyses. Weight loss and visible decay were compared over the common 0–16-week window, with extended PE30 follow-up describing subsequent decay. Representative microclimate records provide the storage context, and supporting quality profiles are presented in the Supplementary Materials.
3.1. Package Microclimate
The representative PE30 series remained close to the RH sensor ceiling (~100%), whereas cold-room free-air RH averaged 78.62 ± 7.51%. Mean temperatures were 0.017 ± 0.789 °C and −0.427 ± 0.994 °C, respectively (Figure 1). Calculated air VPD averaged approximately 0.125 ± 0.040 kPa in the cold room, and was near zero in the representative PE30 series; PE30 dew-point depression was, likewise, close to zero. These descriptive process records characterize the room and representative liner environments. The sensor configuration did not support statistical comparisons among packages or use of microclimate as a package-level covariate.
3.2. Package-Unit Weight Loss
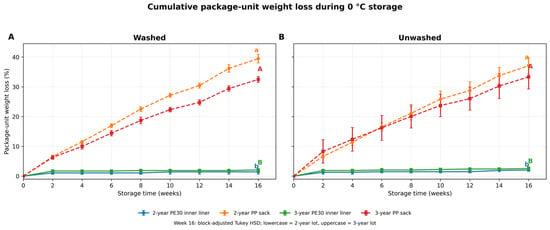
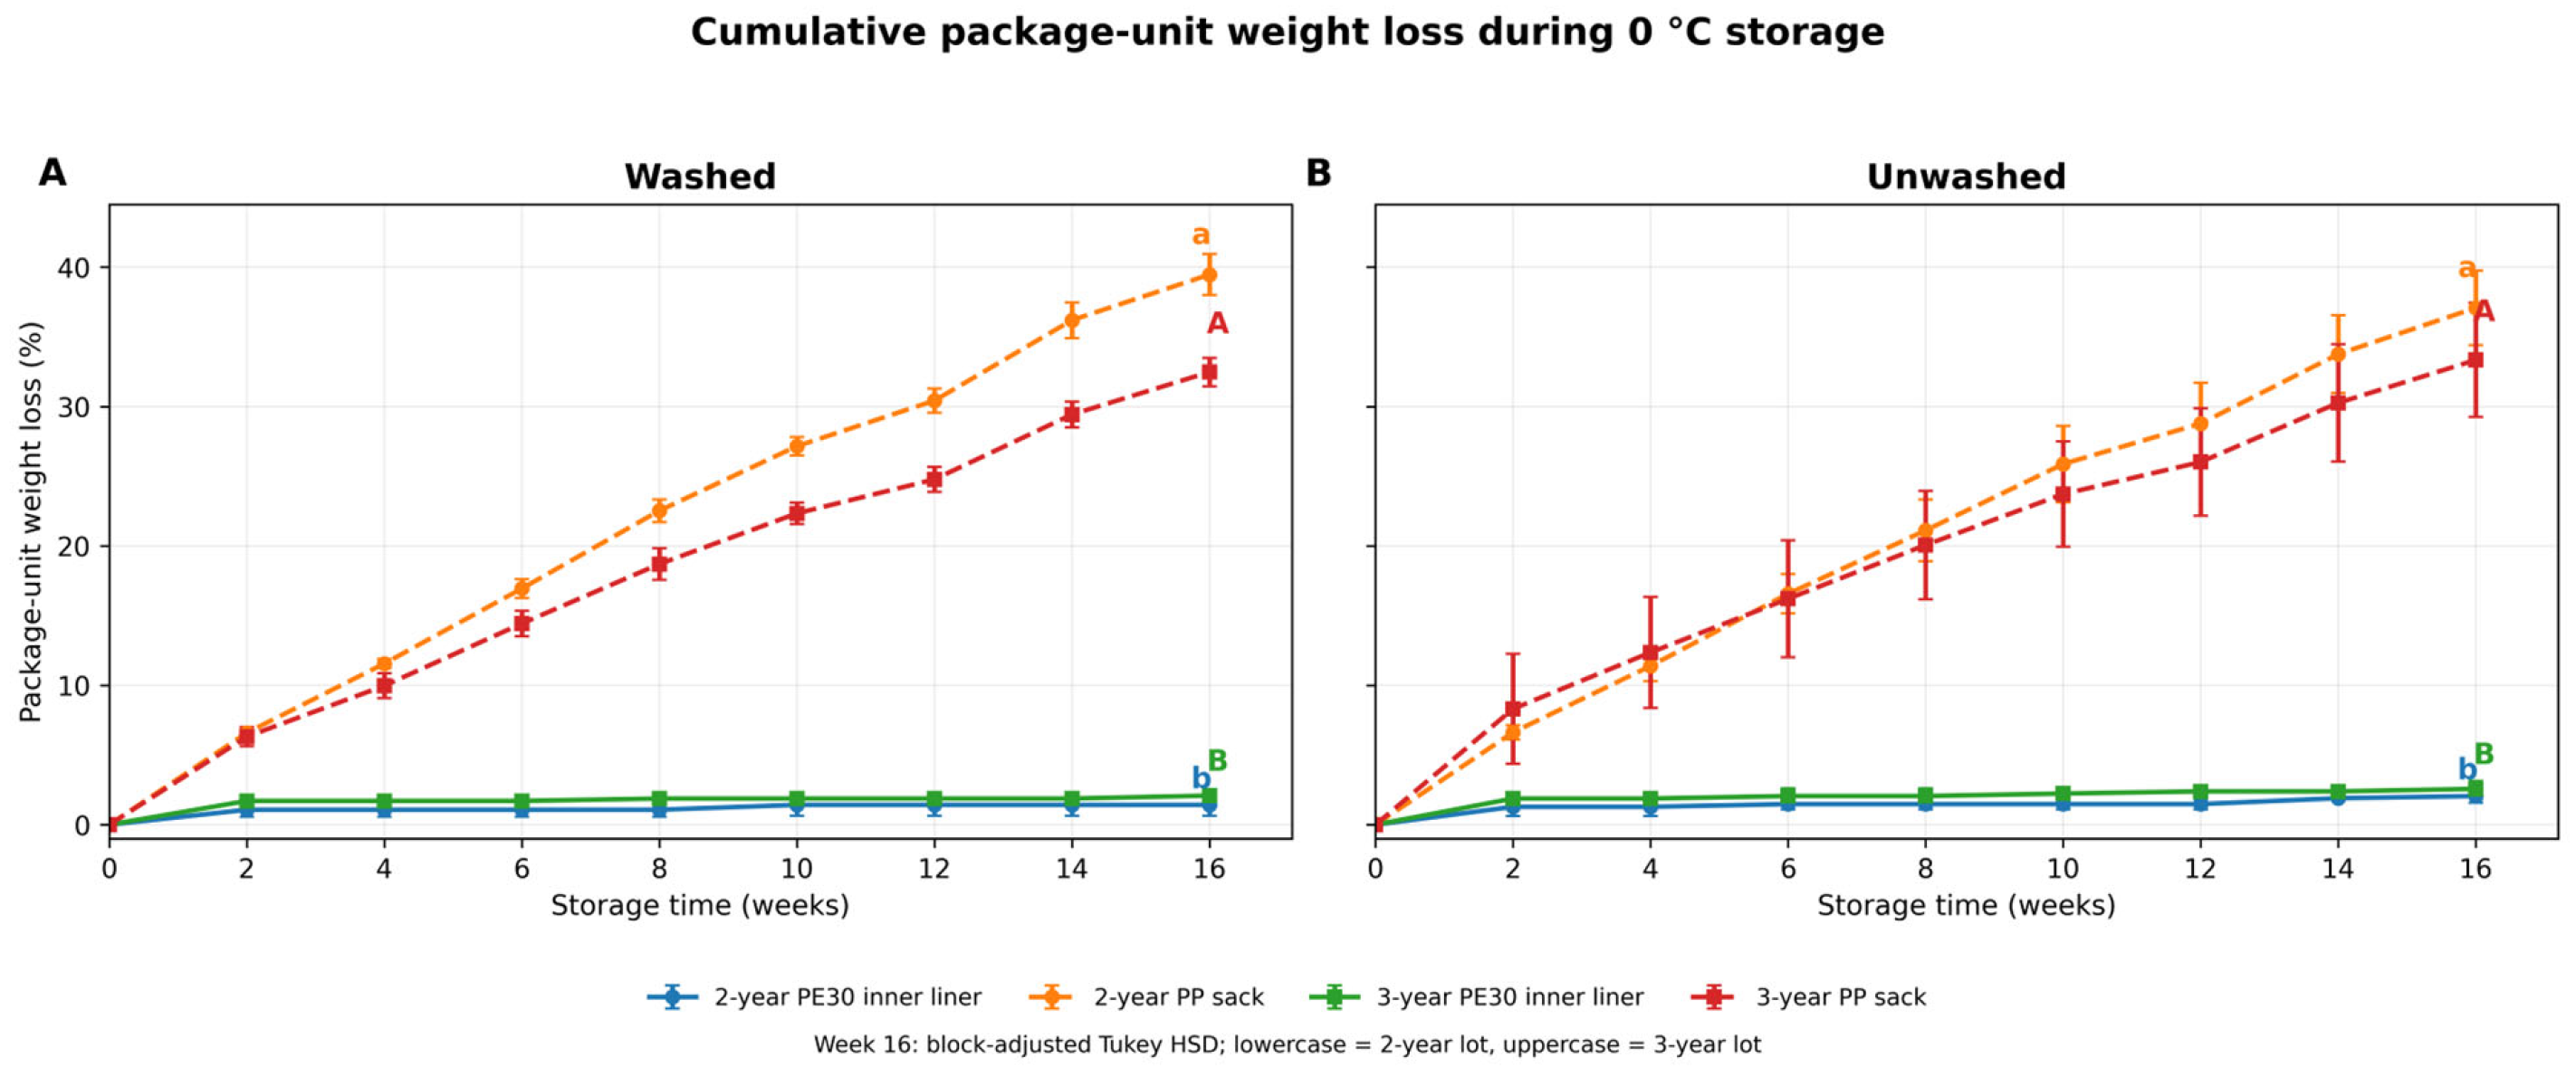
By week 16, PP-sack weight loss reached 32.5–39.5%, compared with 1.42–2.57% under PE30 (Figure 2). PP cumulative losses corresponded to 2.0–2.5 percentage points per week when divided by elapsed time, whereas PE30 loss reached 1.07–1.88% at week 2 and increased by only 0.35–0.77 percentage points thereafter. The liner trajectory, therefore, flattened after the first interval, without showing complete cessation of mass loss. The model-based packaging contrast was large in both lots (2-year: F(1,6) = 1218.18, p = 3.69 × 10⁻⁸; 3-year: F(1,6) = 516.94, p = 4.74 × 10⁻⁷). Block-adjusted Tukey comparisons separated both PE30 treatments from both PP treatments within each lot; washing and its interaction with packaging were not detected for this outcome (Table 2; Table S9). PP follow-up ended at week 16 because severe shriveling prevented continued routine assessment.
Figure 2.
Cumulative package-unit weight loss (%) during 0 °C storage. (A) Washed and (B) unwashed roots, with both source lots shown in each panel. Points show means ± SD across three storage-package units, one per spatial block. PP treatments ended at week 16 because of dehydration. Different lowercase letters (2-year lot) or uppercase letters (3-year lot) at week 16 denote block-adjusted Tukey HSD groups among the four washing × packaging treatments (p < 0.05; RCBD error df = 6; Table S9). Block-adjusted quadratic-time random-intercept LMM results are provided in Table S4.
Comparing the washed and unwashed series in Figure 2A and Figure 2B, respectively, week-16 PE30 losses in the 2-year lot were 1.42 ± 0.77% and 2.05 ± 0.48%, while PP losses were 39.47 ± 1.48% and 37.09 ± 2.68% (mean ± SD). In the 3-year lot, washed and unwashed PE30 losses were 2.09 ± 0.44% and 2.57 ± 0.58%, and corresponding PP losses were 32.48 ± 1.02% and 33.35 ± 4.09%. Washing-associated differences were small, relative to the packaging contrast, and changed direction between lots under PP. The washing and packaging × washing terms for week-16 loss were not significant in either lot (Table 2); this does not establish equivalence between preparation sequences.
3.3. Visible Decay and Washing Response
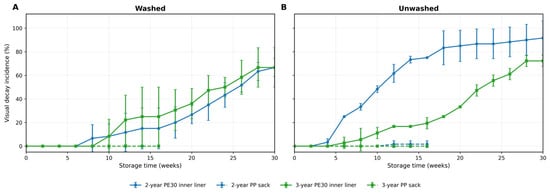
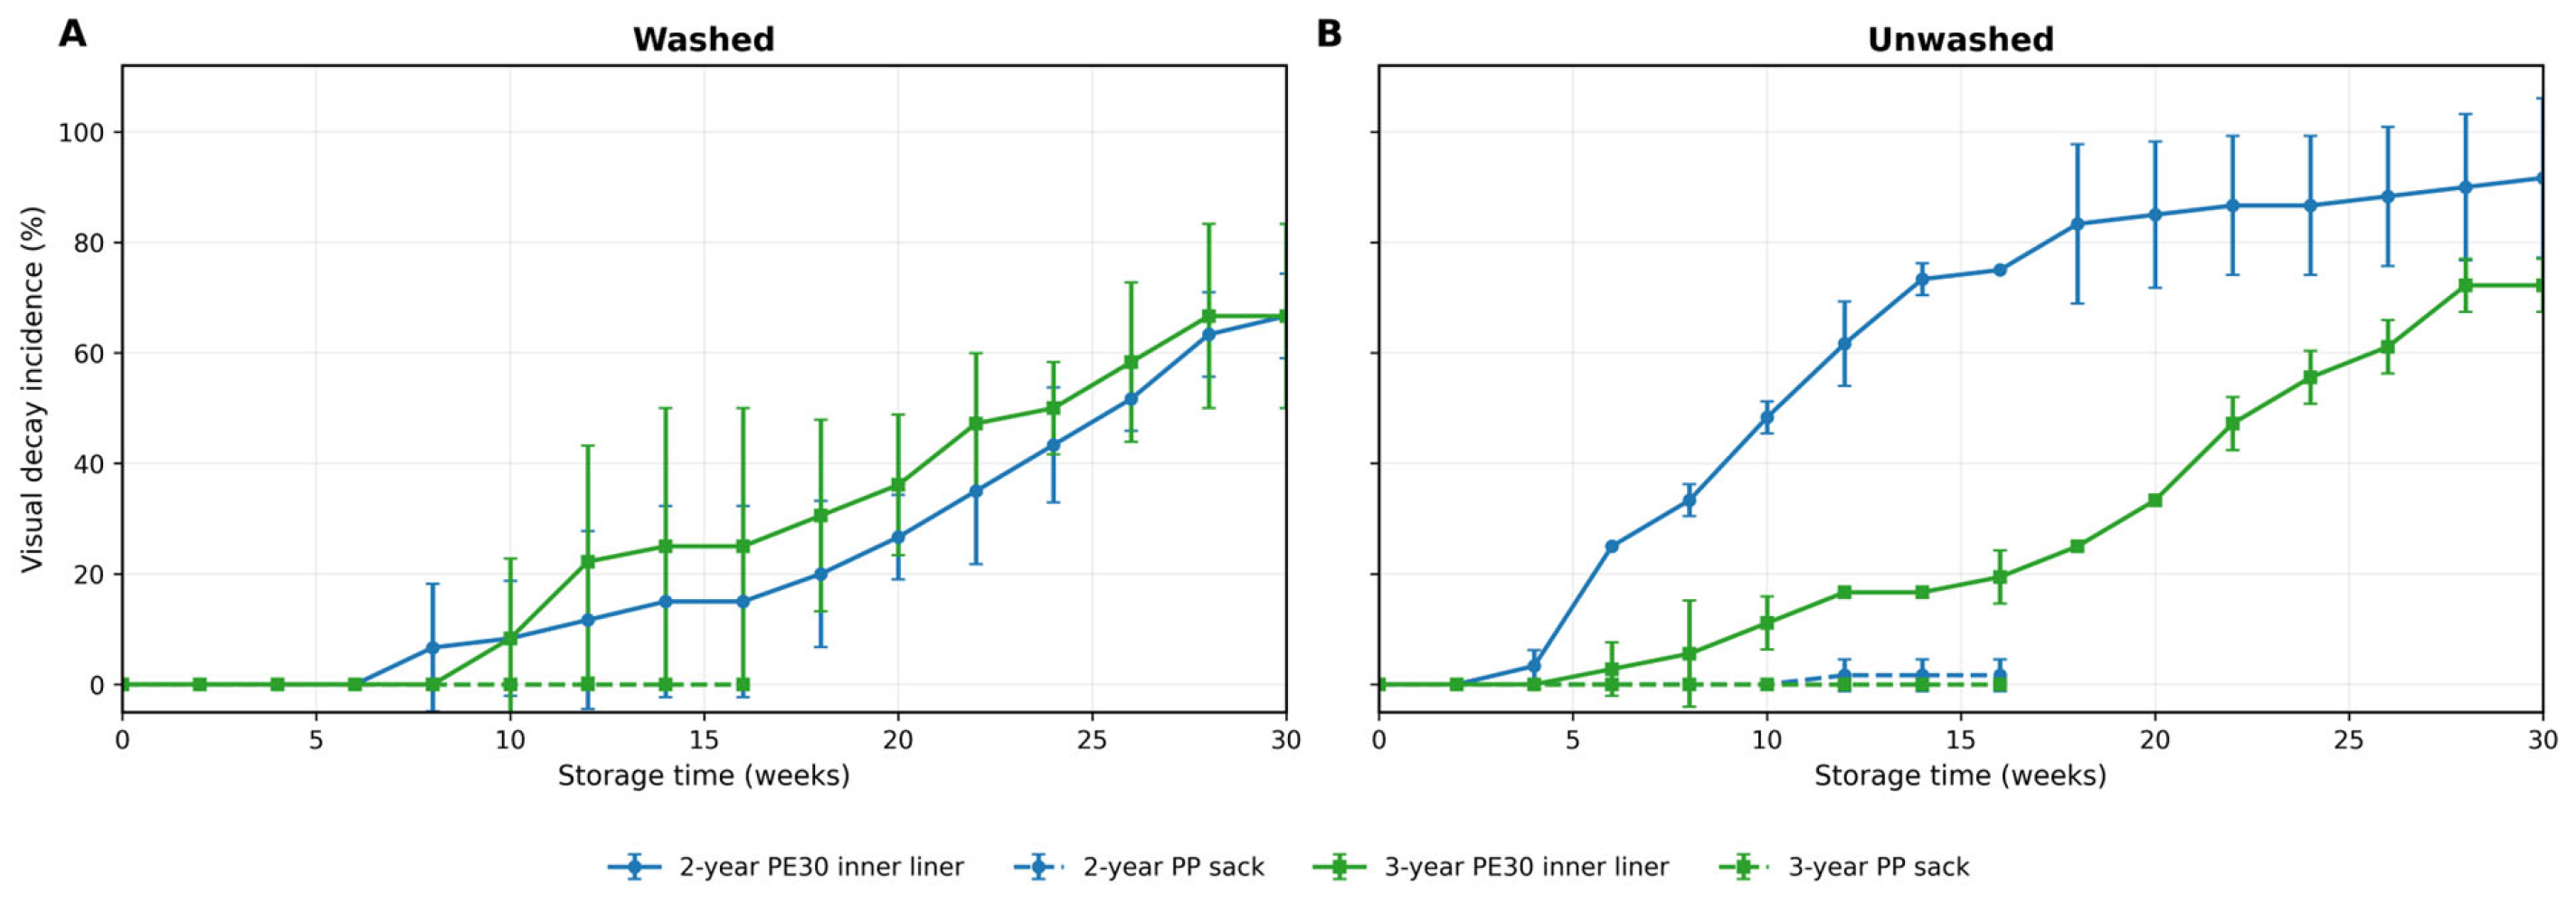
PE30 retained package mass while visible decay increased (Figure 3). At week 16, the 2-year source lot had 75.0 ± 0.0% mean decay in unwashed PE30 and 15.0 ± 17.3% in washed PE30 (mean ± SD, n = 3 packages); corresponding 3-year-lot means were 19.4 ± 4.8% and 25.0 ± 25.0%. The global within-block enumeration distinguished the four treatments in the 2-year lot (p = 0.0139), but not in the 3-year lot (p = 0.1042). Model-reference packaging × washing tests gave F(1,6) = 31.41 (p = 0.0014) and F(1,6) = 0.16 (p = 0.7030), respectively. Conditional washing screens preserving packaging and block gave p = 0.2500 and 0.7500; the within-PE30 paired screens gave the same respective values (Table 2 and Table S10). With only eight label allocations in the latter screen, 0.25 is the smallest attainable two-sided p value. Thus, the 60-percentage-point contrast in the first lot is an observed difference with model-dependent support, not an established general washing benefit; nonsignificance, also, does not establish equivalence. Supportive GEE terms depend on the trajectory and covariance specification (Table S4), and do not resolve the absence of documented independent washing/drying runs.
Figure 3.
Package-unit visible decay incidence during 0 °C storage. (A) Washed and (B) unwashed roots, with both source lots shown in each panel. Points and error bars show means ± SD of three packages per treatment, one per block. Annotations distinguish the global sharp-null randomization p value, model-reference packaging × washing ANOVA p value, and conditional washing randomization p value at week 16 (Table 2 and Tables S8 and S10). These tests have different null hypotheses. GEE supplied only a supportive repeated-trajectory screen. No treatment-wise compact letters were assigned. PP treatments ended at week 16, through dehydration.
3.4. Storage-Life and Marketable-Mass Endpoints
The two package systems reached different operational limits. PP treatments stopped at the week-16 scheduled assessment because severe dehydration prevented routine assessment, despite low visible decay. PE30 suppressed comparable mass loss over weeks 0–16, but loss of visibly sound roots constrained its decay-based endpoint. Table 3 keeps the observed PP stopping assessment separate from the interpolated PE30 benchmark. These times describe different defects, and cannot rank the two packages on a common shelf-life scale; direct packaging comparisons instead use mass loss and decay over the shared 0–16-week interval.
Table 3.
Criterion-specific interpretation of observed storage endpoints. PE30 = 30 μm polyethylene liner; PP = woven polypropylene sack. TTU80 is the interpolated first crossing of 20% visible decay on a treatment-mean curve. Parenthesized weeks bracket that crossing between consecutive assessments; they are not confidence intervals. PP stopping is a different, observation-based endpoint.
At the 20% decay cutoff, PE30 treatment-mean TTU80 values were 5.5 and 18.0 weeks for unwashed and washed packages in the 2-year lot, with crossings bracketed by the week-4/6 and week-16/18 observations, respectively. In the 3-year lot, values were 16.2 and 11.7 weeks, bracketed by weeks 16/18 and 10/12 (Table 3 and Table S13B; Figure S6). These observation brackets are not confidence intervals. Package-specific interpolated crossings varied from 5.5–5.6 and 8.0–20.0 weeks in the respective 2-year PE30 groups, and 14.8–16.8 and 9.6–18.8 weeks in the 3-year groups (Table S13C). The washed 2-year mean-curve crossing of 18.0 weeks, therefore, does not imply that all three packages remained below the benchmark until that time. In the 3-year lot, unwashed and washed mean-curve estimates were 9.6 and 10.2 weeks at 10% decay, but 19.2 and 17.8 weeks at 30% (Table S13A), showing dependence on the selected cutoff.
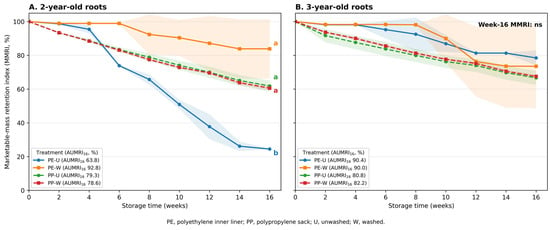
The secondary MMRI/AUMRI16 summaries quantified how retained mass and the sound-root fraction combined over time (Figure 4; Table 4). In the 2-year lot, AUMRI16 was 92.8% for washed PE30, 78.6–79.3% for PP treatments and 63.8% for unwashed PE30. Unwashed PE30 had the lowest week-16 MMRI under model-based comparisons. In the 3-year lot, the model-based packaging term for AUMRI16 gave F(1,6) = 9.60 (p = 0.0211), but the global randomization test gave p = 0.0677, and none of the four-treatment Tukey comparisons was significant (Table 2 and Tables S9 and S10). PP MMRI remained 60.5–67.5% at dehydration termination, illustrating that this mass/soundness index does not incorporate a separate shriveling rejection rule.
Figure 4.
Package-unit marketable-mass retention index (MMRI) trajectories during the common 0–16-week window for (A) 2-year and (B) 3-year roots. MMRI = ((100 − weight loss%)/100) × ((100 − decay incidence%)/100) × 100. Points show means and shaded bands show SD across three package units. In panel (A), different letters at week 16 indicate Tukey HSD differences among the four packaging × washing treatments (p < 0.05). Panel (B) is marked ns because no week-16 MMRI omnibus term was significant. AUMRI16 values are shown in the legends; AUMRI16 Tukey groups are reported in Table S9.
Table 4.
Marketable-mass retention index (MMRI) and time-averaged area under the MMRI curve through week 16 (AUMRI16) over the common 0–16-week comparison window.
The joint display of all week-16 package observations (Figure 5) makes the practical trade-off visible without an index: PP combined lower retained mass with low decay, whereas PE30 retained mass but showed lot- and washing-associated variation in decay. The observed stopping criterion must therefore accompany any retained-mass or sound-root summary.
Representative archived photographs show the observed PP dehydration/collapse and PE30 surface fungal growth (Figure 6). They illustrate the defects used in the narrative, without adding treatment replication.
Figure 5.
Joint week-16 outcomes for all 24 storage packages: retained package-unit root mass (100 − package-unit weight loss, %) versus visible decay incidence. Panels show the commercial source lots supplied as (A) 2-year and (B) 3-year roots; each treatment contains three packages, one per spatial block. Points are individual package observations, without jitter, interpolation or GEE count correction; coincident observations may overlap. PP packages had reached the dehydration stopping rule, despite low visible decay.
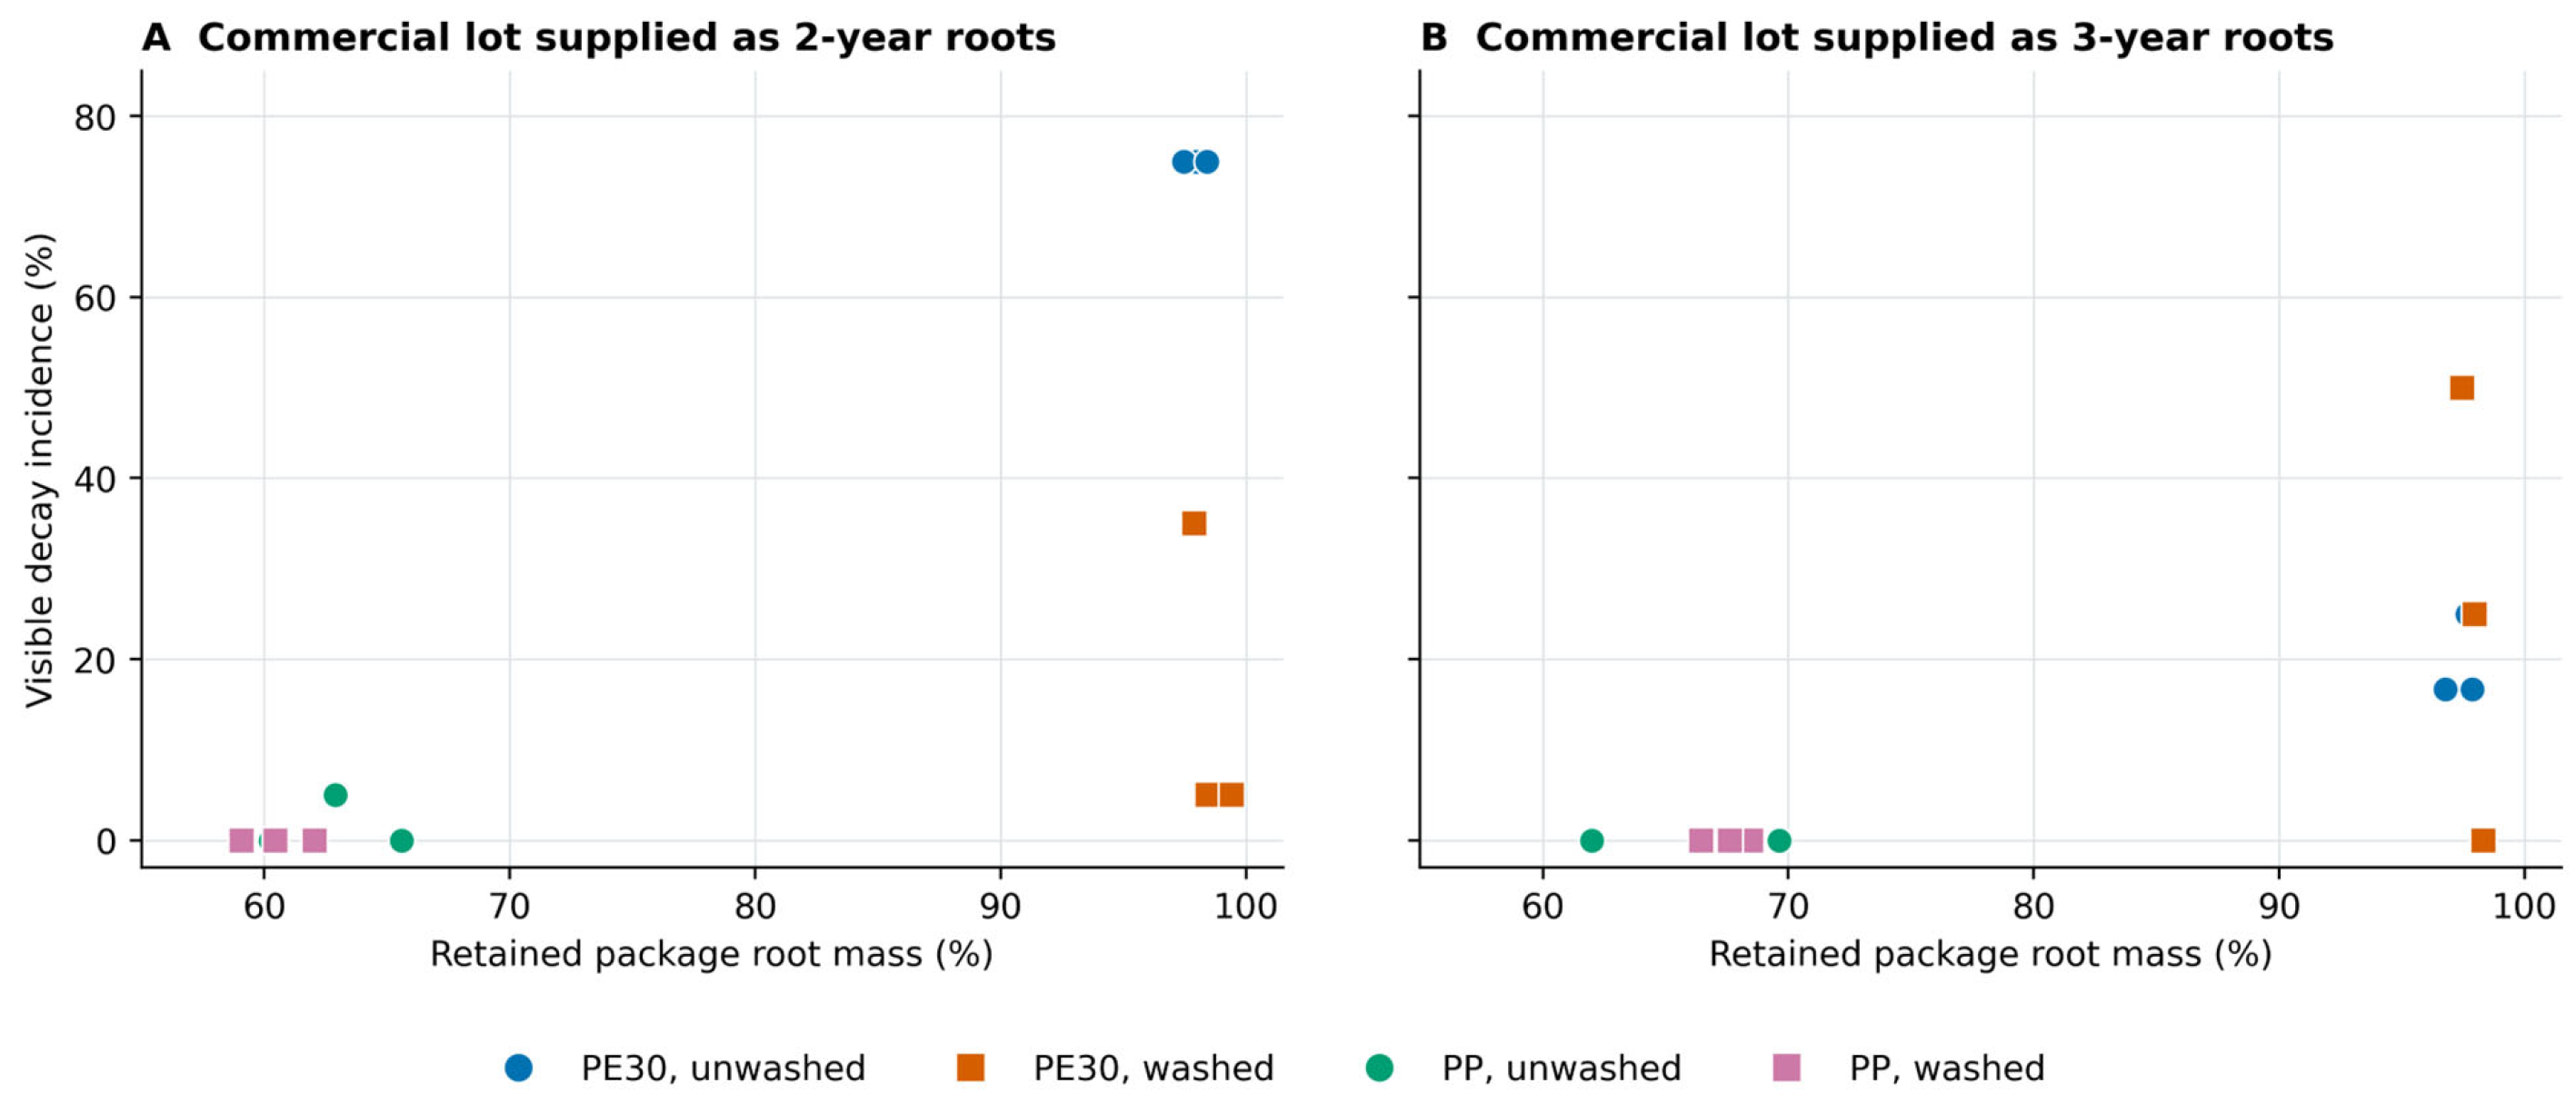
Figure 6.
Representative observed deterioration of balloon-flower roots after removal from storage packages. (A) Tissue collapse and visible deterioration in the woven polypropylene (PP) system at the week-16 stopping assessment. (B) Visible fungal growth on a root stored in a 30 μm polyethylene (PE30) liner; its sampling week was not retained in the photographic record. (C) Severe shriveling and dehydration in PP at the week-16 stopping assessment. These archived photographs illustrate defects, rather than a matched washing-treatment comparison or a storage-time series. The same original photographic plate is retained as Supplementary Figure S1.
3.5. Supporting Quality Profiles
Surface color changes did not follow a monotonic trajectory: all eight treatment series showed at least one reversal in ΔE over weeks 0–16 (Table S11; Figure S9). In the 2-year commercial lot, week-16 ΔE was 7.04 and 14.31 for unwashed and washed PE30, respectively, and 5.21 and 12.33 for the corresponding PP treatments. In the 3-year lot, the corresponding values were 8.51 and 10.76 under PE30 and 14.04 and 6.89 under PP. Thus, washing was associated with a larger week-16 departure from baseline color in three of the four lot × packaging combinations, whereas the opposite pattern occurred in PP from the 3-year lot. ΔE quantifies the magnitude of color departure, and does not identify a particular direction, such as browning.
Firmness also varied non-monotonically in all eight series (Figure S4). The archived baseline means were 28.62 N in the 2-year lot and 25.27 N in the 3-year lot. At week 16, PE30 means were 27.57–28.69 N and 25.42–25.52 N in the two lots, respectively. PP means were 31.91–33.72 N in the 2-year lot, but 22.56–24.52 N in the 3-year lot. Washed roots had lower week-16 mean penetration force than unwashed roots within each lot × packaging combination, but the differences and temporal trajectories were not uniform (Table S14). The higher PP penetration forces in the 2-year lot coincided with severe package-level dehydration, and should not be equated with better marketability.
TPC, likewise, showed treatment-specific patterns (Figure S5; Table S14). Against a shared lot-specific baseline of 47.37 mg GAE g−1 dry weight in the 2-year lot, week-16 means were 51.80 and 46.62 under unwashed and washed PE30, and 52.93 and 56.73 under unwashed and washed PP, respectively. Washing, therefore, had opposite week-16 rankings under the two packaging systems in this lot. In the 3-year lot, all four week-16 means (46.13–51.90 mg GAE g−1 dry weight) exceeded the shared baseline mean of 34.39, although their intervening trajectories differed. These color, firmness and TPC summaries describe archived root or analytical observations; they are not independent package-level treatment estimates or evidence of an isolated root-age effect.
Tissue-moisture summaries declined under PP and remained comparatively high under PE30 (Figure S8). The semiquantitative LC response assigned to platycoside E also varied over time: week-16 relative mean peak areas ranged from 78.5 to 137.3% in the 2-year lot and from 72.8 to 107.5% in the 3-year lot (Table S12; Figure S10). The separate incubation-chamber CO2 profile is presented in Figure S8; it does not represent the gas composition inside the storage packages.
Exploratory PCA separated a dehydration/color-change direction (PC1, 38.3% of variance) from a predominantly firmness-deviation direction (PC2, 25.2%) (Figure S11; Table S7). The week-adjusted rank correlation between weight loss and decay was −0.813; associations of firmness deviation with other descriptors were weak (|ρ| ≤ 0.146) (Figure S12; Table S6). These aggregated profiles visualize the contrasting quality trajectories of the two package systems.
4. Discussion
PE30 substantially improved mass retention during 0 °C storage in both commercial lots. Week-16 losses remained approximately 1–3%, compared with approximately one-third of initial mass under PP sacks, where severe dehydration ended routine assessment. The liner packages instead showed variation in visible decay, which explained why their joint retention indices differed among the tested treatments. Early decay in unwashed PE30 from the 2-year lot was particularly influential. Considering mass retention and sound-root retention together, therefore, identifies the dominant observed limitation of each package and explains the treatment trajectories more clearly than either measurement alone.
4.1. Interpreting the Mass-Retention Benefit of PE30
The large package-unit mass-loss contrast is consistent with the humidity conditions recorded during storage (Table 2; Figure 2). Representative PE30 headspace remained near the RH sensor ceiling, with calculated air vapor-pressure deficit close to zero, whereas cold-room free air had a VPD of about 0.125 kPa. This pattern is consistent with reduced evaporative demand in the liner and with studies of liner moisture dynamics and product–package water transfer [10,34,35]. The environmental records thus provide physical context for the replicated package-weight response. As emphasized in water-loss research, the consequences of a given mass loss also depend on the commodity and its condition [15,36]; in the present PP packages, the recorded losses coincided with severe shriveling.
After the initial 1.07–1.88% loss at week 2, PE30 lost only another 0.35–0.77 percentage points through week 16. This flattening accords with the humid package environment described in liner and condensation studies [10,37]. The representative logger first reached its RH ceiling after 18 h, so the fortnightly weight measurements should be read as cumulative storage responses, including any early cooling and handling exposure. The response applies to the tested liner, loading and closure. Gas transmission is a separate dimension of film performance [38]; radish studies have assessed packaging alongside physical quality retention [39,40], and fresh-cut cherry-radish work has linked film transmission, package gases and microbial growth with quality outcomes [41]. Mushroom film-plus-light research has similarly evaluated film mechanical and surface-wetting properties, alongside product moisture loss, color, and hardness [42]. These studies place the present mass-retention result within the broader interaction between packaging and product quality.
Washing was associated with only small mass-retention differences, relative to packaging (Figure 2). Washed PE30 had 0.63 and 0.48 percentage points less week-16 mass loss than unwashed PE30 in the 2-year and 3-year lots, respectively, whereas PP differences changed direction. The endpoint models did not detect a washing effect or washing × packaging interaction for mass loss. These observations support the dominant package-system contrast, rather than a reproducible mass-retention benefit from washing. Surface damage, residual water or physiological effects cannot be assigned as mechanisms because they were not quantified, and independent preparation runs were not documented.
4.2. Retaining Water While Managing Decay
Mass retention and visible decay followed different courses in PE30: dehydration remained low, while the proportion of affected roots increased. Similar distinctions occur in the packaging literature. Perforated pomegranate liners reduced condensation and decay [10], whereas some high-humidity wound-healing and cooling treatments reduced subsequent disease in carrots [12]. Product condition, injury, temperature history and moisture exposure can, therefore, modify the outcome of humid storage. High-humidity preservation and condensation management address related aspects of package performance [16,43]. In the present experiment, the joint mass-loss and decay records identify the storage outcome, while the representative RH series describes its environmental context.
The practical objective for this type of package is to retain the mass-loss benefit, while managing visible deterioration. Moisture-absorbing trays have been modeled and experimentally assessed [44], including applications to mushrooms [45], and tray and pad studies describe moisture-uptake kinetics relevant to their use in produce packages [46,47]. Perforation, moisture absorption and drainage are thus established approaches in the wider packaging literature. Coupled gas–moisture models describe the processes involved [17,18], and pallet-scale packaging studies show how these questions extend to commercial loading [48]. The present results provide two direct outcome measures—mass retention and visible decay—for assessing such package options in fresh roots.
4.3. Washing Responses Within the Tested Lots
Washed and unwashed PE30 packages showed their largest descriptive difference in the 2-year source lot, where week-16 decay averaged 15% and 75%, respectively. The second lot showed 25.0% and 19.4%, so the first pattern did not recur. This large first-lot difference warrants testing under independently replicated preparation runs, but its magnitude alone does not demonstrate transferable washing efficacy. The limited package sample, model-dependent support and undocumented independent washing/drying runs restrict inference to the observed preparation and storage conditions (Section 3.3). The supplied age labels identify the lots: between-lot differences cannot separate root age from source-lot characteristics. Initial microbial burden, morphology, injury and moisture remaining after the 15 h dry-down are possible explanations, rather than measured mechanisms. Radish and carrot studies, likewise, evaluate washing within a complete handling system [5,6]; their treatment combinations, including sanitizers in the carrot study, illustrate why process context matters.
The wider washing literature distinguishes produce decontamination from wash-water disinfection [49]. Commercial washing-line studies demonstrate the importance of process-water condition [50], while reviews describe how product condition and process factors influence washing performance [51,52]. Strawberry work after simulated transport has also examined mildew, together with spoilage-fungal responses and host defense-related compounds and enzymes [53]. These findings provide biological and process context for differences in subsequent deterioration. Here, the visible-decay trajectories show how the tested washing and drying preparation was associated with storage performance in each source lot.
4.4. What the Operational Endpoints Add to the Package Comparison
The operational endpoints connect the two observed deterioration patterns to their practical consequences. PP packages met the dehydration stopping rule at week 16, while showing little visible decay; PE30 retained most of its mass, and the operational 80% sound-root threshold was reached at different times among the four lot-by-washing combinations (Table 3). The week-16 package plot displays retained mass and visible decay directly (Figure 5), while MMRI and AUMRI16 summarize their combined course over the common window (Figure 4; Table 4). In unwashed PE30 from the 2-year lot, these summaries capture how early decay offset the mass-retention advantage. Keeping the criterion attached to each reported endpoint preserves the distinction between dehydration termination and a decay-threshold crossing.
MMRI is useful as a joint summary of retained mass and visible decay, provided that its count-to-mass assumption is retained. PP values of 60.5–67.5% at week 16 coexisted with severe shriveling and the dehydration stopping rule, directly showing that the index alone cannot certify acceptable market quality. Sound and decayed roots were not weighed separately, and the formula does not grade shriveling or texture; AUMRI16 inherits these limitations. Validation as a market-quality measure would require separate weighing of accepted and rejected roots, and a defined acceptance assessment. Process-based strawberry models link measured respiration and transpiration with shelf life [54], and physiological and molecular measurements have been used to investigate radish-packaging responses [13]. The present operational approach organizes recorded package outcomes under explicit criteria, consistent with connecting postharvest quality to the intended fresh product and handling chain [55].
Threshold sensitivity shows that the apparent timing advantage depends on the criterion (Table S13A). In the 3-year lot, washed PE30 crossed 10% decay slightly later than unwashed PE30, but crossed 20% and 30% earlier. Moreover, linear interpolation assumes a linear change between two-week observations, and summarizes only three packages. For washed PE30 in the 2-year lot, the individual interpolated crossings were 8.0, 19.0 and 20.0 weeks, whereas the curve of their means crossed at 18.0 weeks (Table S13B,C). Reporting the observation brackets and package variability makes the temporal resolution explicit; decimal estimates should not be interpreted as precisely observed biological failure times or validated commercial shelf lives.
PCA and week-adjusted correlations offer a descriptive overview of these trajectories (Figures S11 and S12). High-mass-loss PP observations and higher-decay PE30 observations occupied different regions of the PCA space, while firmness deviation contributed mainly to a second component. This pattern brings the physical-quality profiles into the same visual summary as the package outcomes. The inverse weight-loss–decay association, similarly, describes the contrast between the observed storage trajectories, complementing the separate mass-loss and decay curves.
4.5. Supporting Quality Profiles and Their Interpretation
The supporting profiles describe quality attributes beyond mass retention and visible soundness. Surface color and penetration force varied non-monotonically through storage (Figures S9 and S4). Penetration force can reflect hydration and tissue structure, as well as local test injury [23], and the Folin–Ciocalteu assay records reducing capacity across responsive compounds [25]. Carrot research, likewise, shows that compositional responses, sensory rejection and microbial outcomes can follow different patterns [56]. These observations help explain why the supporting traits contribute product-quality context, while mass loss and visible decay remain the principal storage outcomes.
The relative LC response assigned to platycoside E adds a crop-specific analytical profile (Figure S10; Table S12). It is interpreted on the target-peak response scale defined in Section 2.5.4, alongside the calibration information in the Supplementary Information Document. Published platycoside methods and analytical-validation guidance provide the basis for distinguishing chromatographic response from validated concentration [27,57]. The separate incubation-chamber CO2 archive provides only qualitative supporting context. Because package O2 and CO2 were not measured during storage, neither modified-atmosphere conditions nor gas-mediated mechanisms can be established from this assay. These profiles document additional quality attributes, without replacing the package-linked mass and decay evidence.
4.6. Practical Scope of the Package Comparison
The comparison applies to two commercial source lots, three packages per treatment, and reduced-scale loading in one room, at 0 °C. PE30 consistently reduced mass loss in this setting, while washing-related decay patterns were less certain. Each nominal age class was represented by one source lot, so no general age effect can be inferred. Independent washing/drying runs were not documented, and neither model fitting nor package-label enumeration can supply that missing process replication. PP construction, material transmission properties, headspace volume and closure leakage were incompletely characterized; the result concerns the tested assembled systems, not a quantified permeability mechanism or commercial loading configuration.
Packages were opened and reclosed every two weeks, and assessed roots, including penetration-tested roots, were returned. Venting, handling and test injury could influence subsequent loss and decay; without an unopened, uninjured comparison, their contributions cannot be separated. The results, therefore, describe periodically assessed package systems. Representative temperature/RH records provide descriptive environmental context, not independent package-level evidence of a mechanism.
For practical storage assessment, the results support recording retained mass and visibly sound roots together, and stating the criterion used to end storage. This approach identifies whether a package is limited primarily by dehydration or by visible deterioration, and keeps the treatment comparison connected to product condition. The influence of starting material and temperature history in carrot-packaging trials [11] further supports interpreting the outcome in relation to the incoming lot and its handling conditions.
5. Conclusions
Under the tested 0 °C conditions, PE30 limited week-16 package-unit mass loss to 1.4–2.6%, compared with 32.5–39.5% under woven PP sacks, supporting the hypothesized dehydration-control benefit. Joint mass-loss and visible-decay records distinguished dehydration-dominated PP deterioration from decay-limited PE30 storage. PP stopped at the week-16 dehydration assessment; PE30 treatment-mean crossings of 20% visible decay were 5.5–18.0 weeks, and must be read with their two-week observation brackets. These are different operational endpoints, not directly comparable commercial shelf lives. MMRI and AUMRI16 summarize retained mass and sound-root counts, but do not measure saleable mass or replace assessment of shriveling and texture. Washing-related decay differences varied between the source lots and had model-dependent support, providing no general washing recommendation or isolated root-age effect. The results support package-unit, criterion-specific assessment under the tested reduced-scale and repeated-opening conditions; broader recommendations require confirmation across independently prepared batches, source lots and commercial storage systems.
Supplementary Materials
The following supporting information can be downloaded at: https://www.mdpi.com/article/10.3390/horticulturae12111349/s1. Supplementary Methods S1; Tables S1–S14, including package specifications, calibration details, operational endpoints, model and randomization results, color and LC summaries, threshold sensitivity and observation brackets, package-specific crossings, and supporting-quality summaries; Figures S1–S12, including archived photographs, sound-root proportions, quality profiles, calibration records, PCA and correlations.
Author Contributions
Conceptualization, D.-G.P. and J.-H.C.; methodology, D.-G.P., D.-S.K., Y.-E.Y. and J.-H.C.; formal analysis, D.-G.P. and S.L.; investigation, D.-G.P., D.-S.K., S.L., N.K., Y.-E.Y., J.H.L., Y.J.J. and J.L.; resources, J.L. and J.-H.C.; data curation, D.-G.P., D.-S.K., S.L. and N.K.; writing—original draft preparation, D.-G.P.; writing—review and editing, D.-G.P., D.-S.K., S.L. and J.-H.C.; visualization, D.-G.P.; supervision, J.-H.C.; project administration, J.-H.C.; funding acquisition, J.-H.C. All authors have read and agreed to the published version of the manuscript.
Funding
This research was funded by the Cooperative Research Program for Agriculture Science and Technology Development, Rural Development Administration, Republic of Korea, grant number PJ01737105, and by the 2026 RDA Fellowship Program of the National Institute of Horticultural and Herbal Science, Rural Development Administration, Republic of Korea.
Institutional Review Board Statement
Not applicable.
Informed Consent Statement
Not applicable.
Data Availability Statement
The original data presented in the study are openly available at https://doi.org/10.5281/zenodo.21753517.
Conflicts of Interest
The authors declare no conflict of interest. The funders had no role in the design of the study; in the collection, analyses, or interpretation of data; in the writing of the manuscript; or in the decision to publish the results.
References
- Jiang, L.; Niu, H.; Chen, Y.; Li, X.; Zhao, Y.; Zhang, C.; Li, M. Quality control of Platycodon grandiflorum (Jacq.) A. DC. based on value chains and food chain analysis. Sci. Rep. 2023, 13, 14048. [Google Scholar] [CrossRef] [Scilit]
- Liu, Y.-y.; Sun, W.-h.; Li, B.-z.; Wang, Y.; Lv, W.-q.; Shang, N.; Li, D.; Wang, L.-j. Dehydration characteristics and evolution of physicochemical properties of Platycodon grandiflorum (Jacq. A.DC.) roots (PGR) during pulse-spouted microwave vacuum drying (PSMVD). Ind. Crops Prod. 2022, 177, 114449. [Google Scholar] [CrossRef] [Scilit]
- Florkowski, W.J.; Shewfelt, R.L.; Brueckner, B.; Prussia, S.E. (Eds.) Postharvest Handling: A Systems Approach, 3rd ed.; Academic Press: Cambridge, MA, USA, 2014. [Google Scholar] [CrossRef] [Scilit]
- Mahajan, P.V.; Caleb, O.J.; Singh, Z.; Watkins, C.B.; Geyer, M. Postharvest treatments of fresh produce. Philos. Trans. R. Soc. A 2014, 372, 20130309. [Google Scholar] [CrossRef] [Scilit]
- Lee, J.-S. Washing and Packaging Methods to Prolong Storage and Maintain Quality of ‘Meosjinmasdongmu’ Wintering Radish. J. Agric. Life Environ. Sci. 2022, 34, 37–49. [Google Scholar] [CrossRef]
- Amin, M.N.; Gulandaz, M.A.; Sabuz, A.A.; Islam, M.N.; Miaruddin, M.; Uddin, M.A.; Mamun, M.A.A.; Bari, M.L. Use of non-chlorine sanitizer and low-cost packages enhancing microbial safety and quality of commercial cold-stored carrots. J. Food Process. Preserv. 2021, 45, e15065. [Google Scholar] [CrossRef] [Scilit]
- Park, K.M.; Jeong, M.; Park, K.J.; Koo, M. Change in microbiological quality and dominant bacterial communities during processing and storage of Platycodi radix (Doraji). Korean J. Food Preserv. 2018, 25, 417–427. [Google Scholar] [CrossRef] [Scilit]
- López-Gálvez, F.; Allende, A.; Gil, M.I. Recent progress on the management of the industrial washing of fresh produce with a focus on microbiological risks. Curr. Opin. Food Sci. 2021, 38, 46–51. [Google Scholar] [CrossRef] [Scilit]
- Possas, A.; Pérez-Rodríguez, F. New insights into cross-contamination of fresh-produce. Curr. Opin. Food Sci. 2023, 49, 100954. [Google Scholar] [CrossRef] [Scilit]
- Lufu, R.; Ambaw, A.; Opara, U.L. The influence of internal packaging (liners) on moisture dynamics and physical and physiological quality of pomegranate fruit during cold storage. Foods 2021, 10, 1388. [Google Scholar] [CrossRef] [Scilit]
- Larsen, H.; Wold, A.B. Optimising package perforation and headspace gas atmosphere in carrot packages stored under chilled and abused temperature conditions. Acta Hortic. 2024, 1386, 183–190. [Google Scholar] [CrossRef] [Scilit]
- Heltoft, P.; Torp, T.; Wold, A.-B.; Edelenbos, M.; Thomsen, M.G. Effect of temperatures strategies in the early storage period on weightloss, respiration rate and disease development in carrot (Daucus carota subsp. sativus). Postharvest Biol. Technol. 2026, 231, 113911. [Google Scholar] [CrossRef] [Scilit]
- Lin, Z.; Feng, B.; Fang, S.; Pang, X.; Liang, H.; Yuan, S.; Xu, X.; Zuo, J.; Yue, X.; Wang, Q. The mechanism by which oriented polypropylene packaging alleviates postharvest ‘Black Spot’ in radish root (Raphanus sativus). J. Adv. Res. 2025, 72, 1–15. [Google Scholar] [CrossRef] [Scilit]
- Huang, J.; Zhang, M.; Mujumdar, A.S.; Rui, L. Synergistic effect of red-white LED and modified atmosphere packaging on okra quality maintenance and its mechanism in simulated cold chain logistics. Postharvest Biol. Technol. 2024, 216, 113059. [Google Scholar] [CrossRef] [Scilit]
- Gidado, M.J.; Nagoor Gunny, A.A.; Gopinath, S.C.B.; Ali, A.; Wongs-Aree, C.; Mohd Salleh, N.H. Challenges of postharvest water loss in fruits: Mechanisms, influencing factors, and effective control strategies—A comprehensive review. J. Agric. Food Res. 2024, 17, 101249. [Google Scholar] [CrossRef] [Scilit]
- Zuo, X.; Wang, J.; Li, Y.; Zhang, J.; Wu, Z.; Jin, P.; Cao, S.; Zheng, Y. Recent advances in high relative humidity strategy for preservation of postharvest fruits and vegetables: A comprehensive review. Food Chem. 2025, 481, 144130. [Google Scholar] [CrossRef] [Scilit]
- Rashvand, M.; Matera, A.; Altieri, G.; Genovese, F.; Fadiji, T.; Opara, U.L.; Mohammadifar, M.A.; Feyissa, A.H.; Di Renzo, G.C. Recent advances in the potential of modeling and simulation to assess the performance of modified atmosphere packaging (MAP) systems for the fresh agricultural product: Challenges and development. Trends Food Sci. Technol. 2023, 136, 48–63. [Google Scholar] [CrossRef] [Scilit]
- Jalali, A.; Linke, M.; Mahajan, P.V. Model for simulation of gas, moisture and condensation dynamics in packaged fresh produce. Acta Hortic. 2021, 1311, 263–272. [Google Scholar] [CrossRef] [Scilit]
- Vömel, H. Water Vapor Pressure Formulations. NSF NCAR Earth Observing Laboratory. Updated 20 July 2026. 2025. Available online: https://www.eol.ucar.edu/data-software/conventions-and-standards/water-vapor-pressure-formulations (accessed on 16 September 2026). [CrossRef]
- Alegbeleye, O.; Odeyemi, O.A.; Strateva, M.; Stratev, D. Microbial spoilage of vegetables, fruits and cereals. Appl. Food Res. 2022, 2, 100122. [Google Scholar] [CrossRef] [Scilit]
- Commission Internationale de l’Éclairage. Colorimetry, 4th ed.; CIE 015:2018; CIE: Vienna, Austria, 2018. [Google Scholar] [CrossRef] [Scilit]
- Pathare, P.B.; Opara, U.L.; Al-Said, F.A.-J. Colour measurement and analysis in fresh and processed foods: A review. Food Bioprocess Technol. 2013, 6, 36–60. [Google Scholar] [CrossRef] [Scilit]
- Bourne, M.C. Texture, viscosity, and food. In Food Texture and Viscosity: Concept and Measurement, 2nd ed.; Academic Press: San Diego, CA, USA, 2002; pp. 1–32. [Google Scholar] [CrossRef] [Scilit]
- Singleton, V.L.; Orthofer, R.; Lamuela-Raventós, R.M. Analysis of total phenols and other oxidation substrates and antioxidants by means of Folin–Ciocalteu reagent. Methods Enzymol. 1999, 299, 152–178. [Google Scholar] [CrossRef] [Scilit]
- Everette, J.D.; Bryant, Q.M.; Green, A.M.; Abbey, Y.A.; Wangila, G.W.; Walker, R.B. Thorough study of reactivity of various compound classes toward the Folin–Ciocalteu reagent. J. Agric. Food Chem. 2010, 58, 8139–8144. [Google Scholar] [CrossRef] [Scilit]
- Nyakudya, E.; Jeong, J.H.; Lee, N.K.; Jeong, Y.S. Platycosides from the roots of Platycodon grandiflorum and their health benefits. Prev. Nutr. Food Sci. 2014, 19, 59–68. [Google Scholar] [CrossRef] [Scilit]
- Choi, Y.E.; Choi, S.I.; Han, W.H.; Men, X.; Jang, G.W.; Kwon, H.Y.; Park, B.W.; Kim, J.J.; Lee, O.H. Validation of analytical method for platycoside E and platycodin D in fermented Platycodon grandiflorum root extract. J. Agric. Life Environ. Sci. 2020, 32, 116–126. [Google Scholar] [CrossRef]
- Fonseca, S.C.; Oliveira, F.A.R.; Brecht, J.K. Modelling respiration rate of fresh fruits and vegetables for modified atmosphere packages: A review. J. Food Eng. 2002, 52, 99–119. [Google Scholar] [CrossRef] [Scilit]
- Waghmare, R.B.; Mahajan, P.V.; Annapure, U.S. Modelling the effect of time and temperature on respiration rate of selected fresh-cut produce. Postharvest Biol. Technol. 2013, 80, 25–30. [Google Scholar] [CrossRef] [Scilit]
- Wu, J.; Ding, P. Randomization tests for weak null hypotheses in randomized experiments. J. Am. Stat. Assoc. 2021, 116, 1898–1913. [Google Scholar] [CrossRef] [Scilit]
- Liang, K.-Y.; Zeger, S.L. Longitudinal data analysis using generalized linear models. Biometrika 1986, 73, 13–22. [Google Scholar] [CrossRef]
- Mancl, L.A.; DeRouen, T.A. A covariance estimator for GEE with improved small-sample properties. Biometrics 2001, 57, 126–134. [Google Scholar] [CrossRef] [Scilit]
- Benjamini, Y.; Hochberg, Y. Controlling the false discovery rate: A practical and powerful approach to multiple testing. J. R. Stat. Soc. Ser. B 1995, 57, 289–300. [Google Scholar] [CrossRef] [Scilit]
- Bovi, G.G.; Caleb, O.J.; Linke, M.; Rauh, C.; Mahajan, P.V. Transpiration and moisture evolution in packaged fresh horticultural produce and the role of integrated mathematical models: A review. Biosyst. Eng. 2016, 150, 24–39. [Google Scholar] [CrossRef] [Scilit]
- Wills, R.B.H.; Golding, J.B. Postharvest: An Introduction to the Physiology and Handling of Fruit and Vegetables, 6th ed.; CABI: Wallingford, UK, 2016. [Google Scholar] [CrossRef] [Scilit]
- Hasan, M.U.; Singh, Z.; Shah, H.M.S.; Kaur, J.; Woodward, A. Water loss: A postharvest quality marker in apple storage. Food Bioprocess Technol. 2024, 17, 2155–2180. [Google Scholar] [CrossRef] [Scilit]
- Linke, M.; Geyer, M. Condensation dynamics in plastic film packaging of fruit and vegetables. J. Food Eng. 2013, 116, 144–154. [Google Scholar] [CrossRef] [Scilit]
- Nur Hanani, Z.A.; Sonawane, A.D.; Mahajan, P.V. Impact of humidity, temperature and condensation on O2 and CO2 transmission rate of modified atmosphere packages. Food Packag. Shelf Life 2023, 39, 101132. [Google Scholar] [CrossRef] [Scilit]
- Chu, C.-L.G.; Liu, W.T.; Ma, J. Individual wrapping of radishes with food packaging film. Int. J. Food Sci. Technol. 2005, 40, 879–883. [Google Scholar] [CrossRef] [Scilit]
- Chandra, D.; Lee, J.-S.; Choi, H.J.; Kim, J.G. Effects of packaging on shelf life and postharvest qualities of radish roots during storage at low temperature for an extended period. J. Food Qual. 2018, 2018, 3942071. [Google Scholar] [CrossRef] [Scilit]
- Sun, M.; Chen, D.; Liu, L.; Wang, T.; Guo, Y.; Xie, Y.; Yao, W.; Yu, H. Effects of O2/CO2 transmission rate of BOPA/LDPE or PE film on shelf life and quality attributes of fresh-cut cherry radish. Food Biosci. 2023, 51, 102171. [Google Scholar] [CrossRef] [Scilit]
- Zhang, L.; Zhang, M.; Mujumdar, A.S.; Guo, Z. Preparation and characterization of TiO2 photocatalyst films and their application for preservation of Agaricus bisporus in combination with blue-violet LEDs. Food Biosci. 2024, 59, 103860. [Google Scholar] [CrossRef] [Scilit]
- Mahajan, P.V.; Lee, D.S. Modified atmosphere and moisture condensation in packaged fresh produce: Scientific efforts and commercial success. Postharvest Biol. Technol. 2023, 198, 112235. [Google Scholar] [CrossRef] [Scilit]
- Jalali, A.; Rux, G.; Linke, M.; Geyer, M.; Pant, A.; Sängerlaub, S.; Mahajan, P.V. Application of humidity absorbing trays to fresh produce packaging: Mathematical modeling and experimental validation. J. Food Eng. 2019, 244, 115–125. [Google Scholar] [CrossRef] [Scilit]
- Rux, G.; Mahajan, P.V.; Geyer, M.; Linke, M.; Pant, A.; Saengerlaub, S.; Caleb, O.J. Application of humidity-regulating tray for packaging of mushrooms. Postharvest Biol. Technol. 2015, 108, 102–110. [Google Scholar] [CrossRef] [Scilit]
- Rux, G.; Mahajan, P.V.; Linke, M.; Pant, A.; Sängerlaub, S.; Caleb, O.J.; Geyer, M. Humidity-regulating trays: Moisture absorption kinetics and applications for fresh produce packaging. Food Bioprocess Technol. 2016, 9, 709–716. [Google Scholar] [CrossRef] [Scilit]
- Bovi, G.G.; Caleb, O.J.; Klaus, E.; Tintchev, F.; Rauh, C.; Mahajan, P.V. Moisture absorption kinetics of FruitPad for packaging of fresh strawberry. J. Food Eng. 2018, 223, 248–254. [Google Scholar] [CrossRef] [Scilit]
- Olveira-Bouzas, V.; Pita-Calvo, C.; Vázquez-Odériz, M.L.; Romero-Rodríguez, M.A. Evaluation of a modified atmosphere packaging system in pallets to extend the shelf-life of the stored tomato at cooling temperature. Food Chem. 2021, 364, 130309. [Google Scholar] [CrossRef] [Scilit]
- Gil, M.I.; Selma, M.V.; López-Gálvez, F.; Allende, A. Fresh-cut product sanitation and wash water disinfection: Problems and solutions. Int. J. Food Microbiol. 2009, 134, 37–45. [Google Scholar] [CrossRef] [Scilit]
- López-Gálvez, F.; Tudela, J.A.; Allende, A.; Gil, M.I. Microbial and chemical characterization of commercial washing lines of fresh produce highlights the need for process water control. Innov. Food Sci. Emerg. Technol. 2019, 51, 211–219. [Google Scholar] [CrossRef] [Scilit]
- Olaimat, A.N.; Holley, R.A. Factors influencing the microbial safety of fresh produce: A review. Food Microbiol. 2012, 32, 1–19. [Google Scholar] [CrossRef] [Scilit]
- Murray, K.; Wu, F.; Shi, J.; Xue, S.J.; Warriner, K. Challenges in the microbiological food safety of fresh produce: Limitations of post-harvest washing and the need for alternative interventions. Food Qual. Saf. 2017, 1, 289–301. [Google Scholar] [CrossRef] [Scilit]
- Zhang, L.; Zhang, M.; Mujumdar, A.S.; Ma, Y. Intermittent high voltage electrostatic field and static magnetic field assisted modified atmosphere packaging alleviate mildew of postharvest strawberries after simulated transportation by activating the phenylpropanoid pathway. Food Chem. 2024, 434, 137444. [Google Scholar] [CrossRef] [Scilit]
- Jalali, A.; Linke, M.; Geyer, M.; Mahajan, P.V. Shelf life prediction model for strawberry based on respiration and transpiration processes. Food Packag. Shelf Life 2020, 25, 100525. [Google Scholar] [CrossRef] [Scilit]
- Yahia, E.M. (Ed.) Postharvest Technology of Perishable Horticultural Commodities; Woodhead Publishing: Cambridge, UK, 2019. [Google Scholar] [CrossRef] [Scilit]
- Alegria, C.; Gonçalves, E.M.; Moldão-Martins, M.; Abreu, M. Multi-Target Alternative Approaches to Promoting Fresh-Cut Carrots’ Bioactive and Fresh-like Quality. Foods 2022, 11, 2422. [Google Scholar] [CrossRef] [Scilit]
- Taverniers, I.; De Loose, M.; Van Bockstaele, E. Trends in quality in the analytical laboratory. II. Analytical method validation and quality assurance. TrAC Trends Anal. Chem. 2004, 23, 535–552. [Google Scholar] [CrossRef] [Scilit]

Disclaimer/Publisher’s Note: The statements, opinions and data contained in all publications are solely those of the individual author(s) and contributor(s) and not of MDPI and/or the editor(s). MDPI and/or the editor(s) disclaim responsibility for any injury to people or property resulting from any ideas, methods, instructions or products referred to in the content. |
© 2026 by the authors. Licensee MDPI, Basel, Switzerland. This article is an open access article distributed under the terms and conditions of the Creative Commons Attribution (CC BY) license.