


Abstract
Flower color is a core ornamental trait. Jasminum sambac (L.) Ait., a famous raw material for jasmine tea and fragrance, produces white flowers with extremely low seed-setting, which limits its hybrid breeding. Jasmine petals naturally accumulate pigments under biotic/abiotic stress or senescence, while relevant studies on its regulatory mechanism are limited. Here, we established a stable artificial system to reproduce petal coloration, defined four petal developmental stages, and identified cyanidin 3-rutinoside as the main pigment. At 0 h, petal abscisic acid (ABA) was at a relatively high level, and salicylic acid (SA) and ethylene (ETH) peaked at 12 h. Cyanidin 3-rutinoside initiated accumulation at 24 h and peaked at 36 h. By integrating transcriptomic and metabolomic datasets, we uncovered the regulatory TF-gene-metabolite network linked to pigment formation and pinpointed two key structural genes, dihydroflavonol 4-reductase gene (DFR) and anthocyanidin synthase gene (ANS), whose expression surged over five-fold and tightly correlated with pigment accumulation, highlighting their core functions in anthocyanin biosynthesis. JsWRKY70 and two MYBs were further identified as potential regulators of flavonoid and anthocyanin pathways. These findings deepen the understanding of jasmine petal coloration at metabolic and transcriptional levels, and reveal the molecular basis of its flavonoid and anthocyanin biosynthesis.
1. Introduction
Jasmine [Jasminum sambac (L.) Ait.] presents single-(SP), double-(DP), and multi-petal (MP) phenotypes. The jasmine double-petal (DP) phenotype, which is the leading commercial germplasm, is cultivated worldwide for its sweetly fragrant flowers [1]. It is used to extract essential oils on a commercial scale and make jasmine tea, boasting significant economic value as well as considerable aesthetic and garden fragrance enhancement potential. Jasmine, characterized by its pure white blossoms, owing to its monochromatic flowers and low natural fruit-setting rate (0.17%) [2], poses challenges for variety improvement and the implementation of cross-breeding programs aimed at diversifying flower colors. Consequently, the DP jasmine, the traditional variety employed in jasmine tea and essential oils production, is currently predominantly utilized for garden ornamentation [3], which significantly constrains its comprehensive utilization and the exploration of its ornamental value in the garden. In natural environments, jasmine buds exhibit a purple hue as a result of biotic or abiotic factors, and white petals turn purple during the wilting process under certain environmental conditions. This lays a necessary material foundation for jasmine flower color breeding. However, at present, documentation on the phenomenon of purpling flower is solely found within the context of jasmine disease and pest prevention and control. Fu Zibi has conducted relatively systematic statistical analyses and documented the natural causes of this phenomenon, attributing them to diseases, insect pests, and untimely harvesting, with a notable peak in incidence occurring from October to November [4]. Due to the instability and low occurrence rate of the purpling flower phenomenon under natural conditions, and its little impact on yield, the majority of research on jasmine has primarily centered on aroma components, with few studies on the phenotypic observation, pigment types, metabolic mechanisms, and molecular mechanisms underlying the biosynthesis of this phenomenon in jasmine.
There are three principal categories of plant pigments: flavonoids/anthocyanins, carotenoids, and betacyanin compounds. Flavonoids, which belong to the phenylpropanoid class of compounds, mainly comprise anthocyanins and flavonols. Both of them are water-soluble, synthesized in the cytoplasm, and stored within vacuoles, displaying hues ranging from light yellow to blue [5]. Flavonols function as significant co-pigments for anthocyanins [6]. Carotenoids, classified under the isoprenoid group, are lipid-soluble compounds, synthesized in chloroplasts, presenting colors from yellow to red [5,7,8,9,10,11,12,13,14,15,16]. Betacyanin, a nitrogen-containing compound derived from tyrosine, is also water-soluble and stored in vacuoles, exhibiting colors spanning from yellow to red. It is uniquely found in plants of the order Caryophyllales, with the exception of those belonging to the families Caryophyllaceae, Molluginaceae, Macarthuriaceae, and Kewaceae. To date, no plant species has been identified that contains both betacyanin and anthocyanin simultaneously [6,17,18,19].
Pigments specifically accumulate in petals, exhibiting visual colors and being detectable through ultraviolet imaging, primarily serving the purpose of attracting pollinators. Flavonoid compounds manifest as white and yellow in visual perception, while appearing as dark regions in ultraviolet imaging owing to their absorption of ultraviolet light [20]. For flowering plants, the importance of pigments on petals resides in their ability to attract specific pollinators. Concurrently, the abrupt alterations in petal color observed in some flowering plants post-flowering or post-pollination illustrate how these plants optimize pollination efficiency through floral color changes [21,22]. After pollination, the color of the vexillum (banner petal) patches in Wisteria floribunda turn from bright yellow to pale yellow [23], whereas the throat patches of Weigela middendorffiana shift from yellow to red [24]. This phenomenon enhances the frequency of pollinator visits to unpollinated flowers, thereby improving pollination efficiency. The flower color of Quisqualis indica L. transitions from white to red during the blooming process, concomitant with a shift in pollinators from hawkmoths to bees and butterflies, aimed at enhancing the pollination rate [25]. Subsequent research elucidates that the alteration in flower color of Q. indica is induced by light rather than successful pollination [26]. In the absence of light, the flower color remains constant irrespective of pollination success. Currently, research on the molecular mechanisms underlying the rapid accumulation of large quantities of anthocyanin compounds during flower opening, which results in flower color changes, remains scarce. In the case of Viola cornuta cv. Yesterday, Today and Tomorrow, the anthocyanin content increases by 210.9-fold, and the expression level of anthocyanidin synthase gene (ANS) is up-regulated by 302% during flowering. Cloning, identification, and evolutionary analysis of chalcone synthase genes (CHS) demonstrated that only ChsA-type genes were expressed throughout the three critical stages of flower color change [27,28,29].
The synthesis of anthocyanins in plants is regulated directly or indirectly by endogenous plant hormones. In non-climacteric fruits or flowers, abscisic acid (ABA) plays a role in the synthesis of anthocyanins associated with ripening and senescence [30,31]. The silencing of the FaNCED1 and ABA receptor genes results in the inhibition of ABA and anthocyanin synthesis in strawberry fruits [31]. In apples and grapes, jasmonic acid (JA) may influence anthocyanin synthesis through its interaction with ethylene synthesis pathways [32,33]. Plant hormones participate in the transcriptional regulation of the MBW complex [34]. Ethylene inhibits the transcriptional activity of the MBW and promotes the expression of AtMYBL2, a negative regulator of anthocyanins, thereby suppressing sugar-induced anthocyanin accumulation [35]. Research on the ethylene-insensitive mutant (ein2-1 Arabidopsis mutant) reveals that, with sucrose induction, the mutant accumulates more anthocyanins with up-regulation of AtPAP1 (MYB). In Arabidopsis thaliana leaves, the ethylene signaling pathway negatively modulates sucrose-induced anthocyanin accumulation. Ethylene-induced leaf senescence suppresses anthocyanin accumulation by downregulating AtPAP1 expression. However, it may differ significantly in petals, as senescence in petals is often accompanied by anthocyanin accumulation. The underlying mechanism warrants further investigation [36,37,38]. JA influences anthocyanin biosynthesis in A. thaliana through the interaction between JAZ, a negative regulator in the jasmonic acid signaling pathway, and the MBW complex [39].
Currently, the in-depth exploration of pigment compositions, transcription factors (TFs), and the structural genes that regulate pigment metabolism in jasmines remains limited. To further investigate pigment accumulation and clarify the coloration mechanism of purple jasmine petals, it is necessary to conduct a more extensive study on the physiological and transcriptomic profiles. In this study, we analyzed both the physiological and transcriptomic data obtained from flower buds to fully open flowers of jasmine petals. We conducted a comparison of the expression levels of structural genes and transcription factors associated with anthocyanin metabolism and plant hormone signal transduction while assessing the accumulation contents of flavonoids and plant hormones at various stages. Furthermore, we investigated gene-to-metabolite linkages related to flavonoids and plant hormones in jasmines. This study aims to elucidate the physiological and molecular mechanisms underlying flower color variation in jasmines and provide a theoretical foundation for the genetic breeding of ornamental plants for desired flower colors.
2. Materials and Methods
2.1. Plant Materials
Two-year-old potted plants of J. sambac (DP phenotype) were obtained through cutting propagation in a nursery at Fujian Agriculture and Forestry University, Fuzhou, China (26°5′22′′ N, 119°13′48′′ E). In the second year, the plants were pruned to maintain uniform growth status and plant height to ensure uniform blooming, then moved to a climate chamber (Ningbo Jiangnan Instrument Factory, Ningbo, China). After undergoing a 5-day acclimatization period, the plants were subsequently utilized for the assessment of experimental indexes.
Cultivation conditions included a light intensity of 312 μmol·m−2·s−1, a photoperiod of 16 h of light followed by 8 h of darkness, day/night temperatures maintained at 28/22 °C, and a relative humidity ranging from 75% to 80%.
Cultivation management involved the weekly application of 1 g/L of the commercial fertilizer Hyponex (10-30-20, N-P-K), with irrigation conducted based on the moisture status of the substrate within the pots.
2.2. Phenotypic Observation During the Senescence of Jasmine Petals
Based on the photoperiod settings in the climate chamber, flower phenotypes were observed 6 h prior to the onset of the dark period. Plump, swollen buds with a milky-white and glossy appearance, which were destined to bloom during the current dark period, were selected to be labelled. We designated the commencement of the dark period as time zero (0 h). Subsequently, at 2 h intervals, 10 plants and 5 labeled buds with uniform phenotypes on each plant were chosen to photograph their opening status until 48 h. We repeatedly observed and recorded the phenotypic alterations of the labeled buds over 6 photoperiods.
2.3. Analysis of Coloration Pigment Types During the Senescence of Jasmine Petals
Five plants were used, and 3 labeled flowers with typical phenotypes on each plant at 0 h and 36 h were chosen as the test materials. Three labeled flowers of each time point from each plant were mixed as a biological replicate. The petals (0.2 g) were weighed and ground separately into fine powder using 10 mL of petroleum ether, 10% hydrochloric acid, and 30% ammonia water. Subsequently, the color of the resulting extracts was observed and documented. Each sample consisted of five biological replicates.
2.4. Analysis of Anthocyanin Components During the Senescence of Jasmine Petals
The anthocyanin components were analyzed by Ultra-Performance Liquid Chromatography-Quadrupole Time-of-Flight Mass Spectrometry (UPLC-QTOF-MS).
2.4.1. Sample Preparation
Three plants were used and 3 labeled flowers with typical phenotypes on each plant at 0 h and 36 h were chosen as the test materials. Three labeled flowers of each time point from each plant were mixed as a biological replicate and ground into a fine powder using liquid nitrogen, and 200 mg of the resulting sample was accurately weighed. Subsequently, 4.0 mL of extraction solvent (methanol: water: formic acid = 70:27:3, v/v/v) was added, and the mixture was thoroughly vortexed. Ultrasonic extraction was then carried out at a power of 300 W and 4 °C for 20 min, followed by centrifugation at 12,000 rpm and 4 °C for 5 min. This extraction procedure was replicated twice. The combined supernatants were diluted 10-fold with the extraction solvent, filtered through a 0.22 μm membrane filter, and analyzed by UPLC-QTOF-MS.
2.4.2. Analysis via UPLC-QTOF MS
Measurement was conducted utilizing a Waters Acquity UPLC-QTOF I-class/SYNAPT G2-Si HDMS system (Waters, Manchester, UK).
UPLC Conditions: Chromatographic Column: Acquity UPLC HSS T3 column (2.1 × 100 mm, 1.8 μm, Waters, Manchester, UK); Column Temperature: 40 °C; PDA Detection Wavelength Range: 190–800 nm. Mobile Phase: Phase A consisted of 0.1% formic acid in water, while Phase B comprised acetonitrile with 0.1% formic acid. Gradient Elution Program: 0–11 min, 93–82% A; 11–11.5 min, 82–10% A; 11.5–13.1 min, 10–93% A; 13.1–19 min, 93–1% A; 19–24 min, 1–99% A. Injection Volume: 5 μL; Flow Rate: 0.3 mL/min.
Q-TOF/MS Parameters: Ion source: electrospray ionization (ESI); Detection mode: ESI+; Capillary voltage: 2.5 kV; Ion source temperature: 100 °C; Desolvation temperature: 350 °C; Desolvation gas flow rate: 800 L/h; Cone gas flow rate: 50 L/h; Cone voltage: 40 V; Collision energy: 4 eV; MSE collision energy ramp: 10–50 eV; Mass scan range: 50–1200 Da.
2.4.3. Data Processing and Analysis
MassLynx software, version 4.1, was used.
2.5. Determination of the Content of Cyanidin 3-Rutinoside and Flavonol Compound During the Senescence Process of Jasmine Petals
The quantification of cyanidin 3-rutinoside and rutin contents was conducted using UPLC-MS/MS. The determination of flavonol compound content was carried out via UPLC-PDA, employing rutin as the reference standard.
2.5.1. Sample Preparation
Five plants were used, and 3 labeled flowers with typical phenotypes on each plant at 0 h, 12 h, 24 h, 28 h, 32 h, and 36 h were chosen as the test materials. Petals of 3 labeled flowers at each time point from each plant were mixed as a biological replicate. These petals were ground into a fine powder using liquid nitrogen, and 200 mg of the powdered sample was accurately weighed and transferred into a tube containing 4.0 mL of extraction solution (methanol: water: formic acid = 70:27:3, v/v/v). The mixture was thoroughly vortexed and then subjected to ultrasonic extraction for 30 min at a power of 300 W and a temperature of 4 °C. Subsequently, it was centrifuged at 12,000 rpm for 5 min at 4 °C, and this extraction procedure was repeated twice. The combined supernatants were filtered through a 0.22 μm filter membrane prior to analysis. Each sample was analyzed with three technical replicates.
2.5.2. Quantitative Analysis via UPLC-MS/MS
The analysis was conducted using an Acquity UPLC system coupled with a Xevo TQ-S mass spectrometer (Waters, Milford, MA, USA). The chromatographic conditions were as follows: the chromatographic column employed was a Waters BEH C18 column (100 mm × 2.1 mm, 1.7 μm); the column temperature was maintained at 40 °C. The mobile phase consisted of Phase A, which was 1% formic acid, and Phase B, which was acetonitrile containing 1% formic acid. Gradient elution was performed according to the following program: 0–12 min, 95–83% A; 12–12.1 min, 83–0% A; 12.1–15 min, 0–0% A; 15–15.1 min, 0–95% A; and 15.1–17 min, 95–95% A. The injection volume was set at 2 μL, and the flow rate was 0.3 mL/min.
Mass spectrometry was conducted using electrospray ionization (ESI), with the source operating in multiple reaction monitoring (MRM) mode, with a full scan range; the specific condition parameters are detailed in Table 1. The MRM mode parameters for mass spectrometry of the two substances are listed in Table 2.
Table 1.
Mass spectrometry conditions.
Table 2.
MRM model parameters of mass spectrometry (* indicates the quantitative ion).
2.5.3. Quantitative Analysis via UPLC-PDA
The analysis was conducted utilizing an Acquity UPLC system coupled with a Xevo TQ-S mass spectrometer (Waters, Milford, MA, USA). The chromatographic conditions were as follows: the chromatographic column employed was a Waters BEH C18 column (100 mm × 2.1 mm, 1.7 μm); the column temperature was maintained at 40 °C. The PDA detection wavelength range was set at 350 nm. The mobile phase consisted of Phase A, which was 0.1% formic acid, and Phase B, which was acetonitrile containing 0.1% formic acid; the Gradient Elution Program was as follows: 0–12 min, 95–83% A; 12–12.1 min, 83–0% A; 12.1–15 min, 0–0% A; 15–15.1 min, 0–95% A; and 15.1–17 min, 95–95% A. The injection volume was 2 μL, and the flow rate was 0.3 mL/min.
2.5.4. Data Processing and Analysis
MassLynx software, version 4.1, was used.
2.6. Determination of pH and Moisture Content During the Senescence Process of Jasmine Petals
2.6.1. Determination of pH
We draw upon the methodologies outlined by Walter Verweij [40] and Cornelis Spelt et al. [41], with minor modifications. Five plants were used, and 3 labeled flowers with typical phenotypes on each plant at 0 h, 12 h, 24 h, and 36 h were chosen as the test materials. Petals of 3 labeled flowers at each time point from each plant were mixed as a biological replicate. Specifically, 500 mg of petals were precisely weighed and homogenized using 4 mL of double-distilled water (sterilized at 121 °C for 30 min to eliminate CO2). To preclude any interference from atmospheric CO2 absorption by the extraction solution, which could potentially skew the measurement outcomes, the pH value of the extraction solution was promptly assessed using a pH meter (OHAUS Corporation, Parsippany, NJ, USA). Each sample was analyzed with three technical replicates.
2.6.2. Determination of Moisture Content
Five plants were used, and 3 labeled flowers with typical phenotypes on each plant at 0 h, 12 h, 24 h, and 36 h were chosen as the test materials. Petals of 3 labeled flowers at each time point from each plant were mixed as a biological replicate. Upon collection, the petals were promptly weighed using an analytical balance (Sartorius Lab Instruments GmbH & Co. KG, Germany), with the initial weight recorded as W1. Subsequently, the petals were rapidly frozen in liquid nitrogen and then subjected to lyophilization at −45 °C using a freeze dryer (Labconco Corporation, Kansas City, MO, USA) for a duration of 48 h until complete desiccation was achieved. Following lyophilization, the petals were weighed again, and this weight was recorded as W2. The moisture content (%) was determined using the formula (W1–W2) × 100/W1. Each sample was analyzed with three technical replicates.
2.7. Determination of Hormone Content During the Senescence Process of Jasmine Petals
The concentrations of the endogenous hormones gibberellin (GA3), ABA, indole-3-acetic acid (IAA), salicylic acid (SA), JA, and trans Zeatin (tZ) were quantified using UPLC-MS/MS, utilizing isotopically labeled analogs of each hormone as internal standards. Ethylene (ETH) levels were measured via photoacoustic detection.
2.7.1. Sample Preparation
Twelve plants were used, and 3 labeled flowers with typical phenotypes on each plant at 0 h, 6 h, 12 h, 18 h, 24 h, and 36 h were chosen as the test materials. Petals of 3 labeled flowers at each time point from each plant were mixed as a biological replicate. Samples for the quantification of GA3, ABA, IAA, SA, JA, and tZ concentrations were finely ground into powder using liquid nitrogen. Subsequently, 100 mg of each sample was accurately weighed and transferred into a tube containing 900 μL of 70% methanol and 100 μL of isotopic internal standard solution. The mixture was thoroughly vortexed, followed by ultrasonic extraction at 300 W and 4 °C for 30 min, and then incubated at −20 °C for 20 h. After another round of thorough vortexing, the mixture underwent a second ultrasonic extraction at 300 W and 4 °C for 20 min, and was then centrifuged at 12,000 rpm and 4 °C for 3 min. The resulting supernatant was carefully transferred to a 2 mL centrifuge tube. The precipitate was resuspended in 0.5 mL of 70% methanol and subjected to an additional extraction step. The combined supernatants were then transferred to a 2 mL centrifuge tube. The supernatant was concentrated by centrifugation (Cold-trap centrifuge vacuum concentrator, Labconco Corporation, Kansas City, MO, USA) to a final volume of 300 μL. Subsequently, 700 μL of 1% formic acid was added, and the mixture was thoroughly vortexed and incubated at −20 °C for 3 h. After thawing, the supernatant was centrifuged at 12,000 rpm and 4 °C for 10 min, and solid-phase extraction was performed using an Oasis MCX column. The column membrane was sequentially conditioned with 2 mL of 70% methanol, 2 mL of 0.1 M hydrochloric acid, and 2 mL of 1% formic acid, with the conditioning solutions being discarded after each step. The supernatant was then loaded onto the column membrane, followed by elution with 2 mL of 1% formic acid and 2 mL of 70% methanol to collect the extraction solution for the determination of GA3, ABA, IAA, SA, and JA. Subsequently, the column membrane was further eluted with 2 mL of 70% methanol and 2 mL of methanol containing 5% NH4OH to collect the extraction solution for the determination of tZ. The extraction solutions were concentrated to dryness by centrifugation, redissolved in 200 μL of 70% methanol by thorough vortexing, filtered through a 0.22 μm membrane, and then analyzed. For hormones with low tissue concentrations, three biological replicates for GA3 and five biological replicates for tZ were used for statistical analysis. Each sample was analyzed with three technical replicates.
Upon harvesting ethylene (ETH) samples, 5 plants were used, and 5 labeled flowers with typical phenotypes on each plant at 0 h, 6 h, 12 h, 18 h, 24 h, and 36 h were chosen as the test materials. Petals of 5 labeled flowers at each time point from each plant were mixed as a biological replicate. Then 1.5 g of mechanically undamaged, intact petals was promptly weighed and transferred into the sample chamber for in vivo analysis. Each sample was analyzed with three technical replicates.
2.7.2. Quantitative Analysis via UPLC-MS/MS
The analysis was conducted utilizing an Acquity UPLC system coupled with a Xevo TQ-S mass spectrometer (Waters, Milford, MA, USA).
Chromatographic conditions: Column: Waters BEH C18 column (100 mm × 2.1 mm, 1.7 μm); column oven temperature: 40 °C. Mobile phase: Phase A consisted of 5 mM aqueous ammonium formate solution, while Phase B was methanol. Gradient elution was performed as follows: 0–13 min, 95–0% A; 13–17 min, 0–0% A; 17–17.01 min, 0–95% A; and 17.01–20 min, 95–95% A. The injection volume was 5 μL, and the flow rate was set at 0.3 mL/min.
Mass spectrometry was conducted utilizing an ESI source operating in MRM mode, with a full scan range; the specific condition parameters are detailed in Table 3. The parameters for the MRM mode of mass spectrometry are outlined in Table 4.
Table 3.
Mass spectrometry conditions.
Table 4.
MRM model parameters of mass spectrometry (* indicates the quantitative ion).
Data processing and analysis: MassLynx software, version 4.1, was used.
2.7.3. Quantitative Analysis via Photoacoustic Detection Method
Measurements were performed utilizing an ETD-300 ethylene monitor (Sensor Sense, Sense B·V., Nijmegen, The Netherlands).
Measurement Mode: Accumulation measurement mode (Stop and Flow). Measurement Duration: 8 min per sample chamber. Gas Flow Rate: A CAT-1 hydrocarbon decomposer (Sensor Sense, Sense B·V., Nijmegen, The Netherlands) was utilized to catalyze the oxidative decomposition of hydrocarbons into H2O and CO2 through platinum particle catalysis, thereby supplying the detection system with hydrocarbon-free sample air. The gas flow rate was set at 3 L/h. Sample Introduction Process: The activation of the sample chambers was regulated by a VC-6 valve control box (Sensor Sense, Sense B·V., Nijmegen, The Netherlands), which sequentially activated sample chamber No. 1 to No.6, with chamber No.1 designated as the reference cuvette. Prior to entering the ETD-300 detector for the quantification of the absolute ethylene concentration in the sample, the sample gas within the chamber was treated to remove CO2 using soda lime and H2O using CaCl2.
Data Processing: The Valve Controller was employed for data acquisition and processing. Data obtained from the second round of measurements were used to calculate ethylene production. The initial 48-min phase of the first round of measurements was designated for system warm-up and gas replacement, thereby rendering the actual accumulation time for each sample chamber as 40 min. The integral fitting approach employed the Numerical Integration method.
2.8. Statistical Analysis of Physiological Data
Three technical replicates were averaged for a biological replicate before statistical analysis. When appropriate, one-way ANOVA and the Tukey–Kramer test on the means of the biological replicates were conducted using SPSS 19.0. Pearson correlation coefficients were calculated using SPSS 19.0 to measure linear correlations between variables, with statistical significance set at a two-tailed p < 0.05.
2.9. Transcriptome Analysis
2.9.1. Sample Preparation
Based on the noticeable alterations in petal color during jasmine flower senescence, the process was categorized into four phenotypes as shown in Figure 1: white-colored petals of flower buds at 0 h (0 h, FB_0W), white-colored petals of the open flower at 12 h (12 h, OF_12W), color-changed petals of the open flower at 24 h (24 h, OF_24C), and purple-colored petals of the open flower at 36 h (36 h, OF_36P). The biological replicate was defined as an independent pool of 10 labeled flowers with typical phenotypes at each time point of 0 h, 12 h, 24 h, and 36 h from three plants. Three such independent pools were generated for each time point to serve as biological replicates, and rapidly frozen in liquid nitrogen, stored at a temperature of −80 °C for downstream analysis.
Figure 1.
Four developmental stages of J. sambac flowers.
2.9.2. RNA Extraction, cDNA Library Construction and RNA-Seq
The total RNA from jasmine petals was isolated using the Trizol reagent (Thermo fisher Scientific, Waltham, MA, USA). The integrity of the RNA was detected on an Agilent 2100 Bioanalyzer (Agilent Technologies, CA, USA) and visualized on a 1% agarose gel. The purity and concentration of the RNA were checked using a NanoDrop micro-spectrophotometer (IMPLEN Inc., Westlake Village, CA, USA). Following total RNA extraction, mRNA was enriched utilizing Oligo(dT) beads. Subsequently, the enriched mRNA was fragmented into shorter fragments using a fragmentation buffer and reverse transcribed with random primers to generate cDNA. Purification of the cDNA library fragments was performed, followed by end repair, addition of poly(A), and ligation to Illumina sequencing adapters. The ligated products were then subjected to polymerase chain reaction (PCR) amplification prior to sequencing on an Illumina HiSeqTM 4000 platform (Novogene, Tianjin, China).
2.9.3. RNA-Seq Analysis
After the sequencing data were obtained, the raw data were deposited in the National Center for Biotechnology Information (NCBI) Sequence Read Archive (SRA) under accession number PRJNA1528473. The raw data (raw reads) in FASTQ format were first processed through in-house Perl scripts. In this step, clean data (clean reads) were obtained by removing reads containing adapters, reads containing poly-N, and low-quality reads from the raw data. At the same time, Q20, Q30, GC content, and sequence duplication level of the clean data were calculated. All the downstream analyses were based on clean data with high quality. These clean reads were then mapped to the reference genome sequence. For reference transcriptome sequencing, double-petal jasmine (J. sambac) was employed as the source for the reference genome [3]. Only reads with a perfect match or one mismatch were further analyzed and annotated based on the reference genome. Hisat2 v2.0.4. tools soft were used to map to the reference genome. For novel transcript prediction, the StringTie Reference Annotation Based Transcript (RABT) assembly method was used to construct and identify both known and novel transcripts from Hisat2 alignment results. Gene function was annotated based on the following databases: NCBI non-redundant protein sequences (Nr); Protein family (Pfam); Clusters of Orthologous Groups of proteins (KOG/COG); a manually annotated and reviewed protein sequence database (Swiss-Prot); KEGG Ortholog database (KO); and Gene Ontology (GO). Quantification of gene expression levels was estimated by fragments per kilobase of transcript per million fragments mapped (FPKM). BMKCloud (https://www.biomarker.com.cn/biocloud/fenxi, accessed on 25 November 2025) was used to analyze differentially expressed genes (DEGs) through DESeq2 v1.30.1., with a false discovery rate (FDR) threshold of 0.05 and a fold change (FC) of 2.0 as the criterion for significance. Subsequently, GO enrichment analysis of DEGs was conducted using the clusterProfiler R package with the hypergeometric test to identify GO terms that are significantly enriched compared to the entire genomic background. Kobas was utilized for enrichment analysis of DEGs within KEGG pathways. Additionally, we used the clusterProfiler R package to identify KEGG pathways that are significantly enriched compared to the entire genomic background.
2.9.4. Integrative Analysis of Physiological and Transcriptomic Data
The Pearson correlation coefficients were calculated using individual biological replicates to perform a comprehensive analysis of the physiological and transcriptomic data. Correlations with a coefficient |r| greater than 0.9 and a p-value less than 0.05 were deemed statistically significant. Physiological and transcriptomic data from four stages were integrated for network analysis and visualized using Cytoscape software (version 3.10.4).
3. Results
3.1. Phenotypic Observation of the Senescence Process in Jasmine Petals
Based on observations of phenotypic changes in jasmine flowers during their opening and senescence processes across six photoperiods, particularly the complete lifecycle of three successive rounds of jasmine flowers from blooming to wilting, as depicted in Figure S1, under stable artificial climate conditions, the jasmine flower displayed relatively consistent and reproducible typical phenotypic characteristics of petal senescence throughout its blooming and aging process. It was evident that 6 h prior to the onset of the dark period, the flower buds exhibited a plump and swollen morphology, with petals displaying a creamy white and glossy appearance, signifying that these buds were poised to bloom during the ensuing dark phase. At the commencement of the dark period (0 h), the petals started to loosen with aroma emission, marking the initial blooming phase of a single jasmine flower. By 12 h, the flowers reached full bloom, representing the peak flowering phase of an individual jasmine blossom. At the onset of the second dark cycle (24 h), the petals commenced exhibiting pronounced pigment accumulation, concomitant with petal abscission, thereby initiating the critical stage for petal purpling. Subsequently, after an additional 24 h, a substantial number of petals underwent abscission. However, this phenomenon did not impede the formation and accumulation of petal pigments. By 36 h, most of the open flowers had shed, indicating the terminal flowering phase of a single jasmine flower. Consequently, the petal developmental stages were categorized into four phenotypes: white-colored petals of flower buds at 0 h (FB_0W), white-colored petals of the open flower at 12 h (OF_12W), color-changed petals of the open flower at 24 h (OF_24C), and purple-colored petals of the open flower at 36 h (OF_36P). Petals were collected at 0 h, 12 h, 24 h, and 36 h as representative samples for studying the jasmine petal pigment accumulation process, as illustrated in Figure 1.
3.2. Analysis of Coloration Pigment Types During the Senescence of Jasmine Petals
As indicated in Table 5, white petals (0 h) and purple petals (36 h) appeared colorless in petroleum ether extracts, suggesting the absence of carotenoid pigments within them. Similarly, white petals remained colorless in a 10% hydrochloric acid extract, indicating a lack of anthocyanin pigments, whereas purple petals exhibited a pink hue, signifying that anthocyanins constituted the primary pigment type in these petals. In a 30% NH3·H2O extract, both white and purple petals turned yellow, indicating the presence of flavonols. Further full-wavelength scanning (Figure S2) of the 3% formic acid methanol extract from purple petals revealed a maximum absorption peak at 518 nm within the visible light spectrum and significant absorption at 279 nm in the ultraviolet range, which were characteristic absorption peaks of anthocyanins. Consequently, it could be preliminarily concluded that the pigments in jasmine purple petals were primarily anthocyanins, with flavonols serving as important co-pigments.
Table 5.
Analysis of jasmine petal pigment type.
3.3. Analysis of Anthocyanin Components During the Senescence of Jasmine Petals
As depicted in Figure S3B, analysis of the pigment extract derived from purple petals (36 h) through UPLC-PDA revealed the presence of a single compound at 520 nm, characterized by a retention time (Rt) of 6.47 min. Further examination of the full-waveband scan of this compound (Figure S4B) disclosed a maximum absorption peak at 517 nm within the visible light spectrum and a notable absorption at 279 nm in the ultraviolet range, which were characteristic absorption peaks of anthocyanins. Consequently, this compound was tentatively identified as an anthocyanin. Subsequent analysis of the Q-TOF/MS mass spectrum of this compound (Figure 2) confirmed the presence of a molecular ion with an m/z of 595.1592[M]+ and a fragment ion with an m/z of 287.0564[Y0]+. The m/z value of 287 corresponded to the characteristic mass-to-charge ratio of the cyanidin aglycone, and the discrepancy of 308.1028 (the characteristic mass-to-charge ratio of rutinose or coumaroylhexose) between the molecular ion m/z 595.1592[M]+ and the fragment ion m/z 287.0564[Y0]+ was attributed to the presence of either rutinose or coumaroylhexose. The A440/Avis-max ratio of 31.03% (approximately 30%) indicated that this compound is likely a cyanidin 3-glycoside, while the A310/Avis-max ratio of 17.24% (less than 20%) was attributed to the absence of acetyl groups. Therefore, it was inferred to be cyanidin 3-rutinoside. Further comparison with the UPLC-PDA peak chromatogram (Figure S3A, RT = 6.44 min), full-waveband scan (Figure S4A), and Q-TOF/MS mass spectrum (Figure 2) of the cyanidin 3-rutinoside standard revealed that the pigment from jasmine purple petals shared identical peak retention times, maximum absorption peaks in the visible light spectrum, molecular ions, and fragment ions with the cyanidin 3-rutinoside standard. Hence, it was conclusively determined that the pigment from jasmine purple petals was cyanidin 3-rutinoside.
Figure 2.
Q-TOF/MS spectrum of cyanidin 3-rutinoside standard and anthocyanin in purpling jasmine petals in ESI+. (A) Q-TOF/MS spectrum of cyanidin 3-rutinoside standard; (B) anthocyanin in purpling jasmine petals.
3.4. Alterations in the Content of Cyanidin 3-Rutinoside, Rutin, and Flavonols During the Senescence Process of Jasmine Petals
As depicted in Figure 3A, the concentration of cyanidin 3-rutinoside exhibited a marked increase after 24 h (p < 0.05). Notably, its presence was undetectable in the samples at 0 h and 12 h. The accumulation of cyanidin 3-rutinoside commenced in jasmine petals at 24 h, with its content escalating by 8.45-fold at 28 h and by 20.74-fold at 36 h, both relative to the 24 h level. Throughout the senescence process of petals, rutin emerged as the predominant co-pigment among flavonols (Figure 3B). Its variation pattern closely paralleled those of cyanidin 3-rutinoside and total flavonol content (Figure 3C), with all three demonstrating a significant surge in concentration post-24 h (p < 0.05). Specifically, the rutin content increased by 1.64 times at 36 h compared to the 24 h level, while the total flavonol content rose by 1.31 times at 24 h relative to the 12 h level.
Figure 3.
The variation of main pigments in jasmine petals during senescence. (A) The variation of cyanidin 3-rutinoside, η2 = 0.96; (B) the variation of rutin, η2 = 0.87; (C) the variation of total flavonols, η2 = 0.62. Each data point is the mean ± SE, n = 5. Based on one-way ANOVA and the Tukey–Kramer test, different lowercase letters indicate significant differences at p < 0.05, the same as below.
3.5. Alterations in pH and Water Content During the Senescence Process of Jasmine Petals
As depicted in Figure 4A, the pH levels of jasmine petals exhibited a slightly acidic nature, demonstrating a declining trend during the senescence process. A notable decrease (p < 0.05) was observed after 24 h, with a further reduction of 1.12% at 36 h compared to 0 h.
Figure 4.
(A) The variation of pH, η2 = 0.48, and (B) moisture content, η2 = 0.89, in jasmine petals during senescence. Each data point is the mean ± SE, n = 5.
As illustrated in Figure 4B, during the blooming and fragrance-emitting phase of jasmine flowers, the moisture content in the petals exhibited a significant increase (p < 0.05), with a 2.14% rise observed at 12 h relative to 0 h. Conversely, during the senescence and purpling stage, the moisture content in the petals demonstrated a notable decrease (p < 0.05), dropping by 4.49% at 36 h compared to 12 h.
3.6. Alterations in Hormone Levels During the Senescence Process of Jasmine Petals
As depicted in Figure 5, during the senescence of jasmine petals, the levels of IAA, GA3, and tZT remained consistently low, all below 10 ng/g FW. Although JA levels did not exhibit significant fluctuations, they consistently exceeded 40 ng/g FW, with a 74.74% increase at 18 h relative to 0 h, followed by a 47.84% decrease at 36 h compared to 18 h. ABA levels remained stable from 0 h to 18 h but then underwent a significant decline (p < 0.05) after 18 h, with a 75.02% reduction at 36 h relative to 18 h. Both SA and ETH demonstrated similar trends, peaking at 12 h before declining, and showing significant differences (p < 0.05) when compared to 0 h, 24 h, and 36 h.
Figure 5.
The variation of endogenous hormones in jasmine petals during senescence. (A) The variation of GA3, η2 = 0.64; (B) IAA, η2 = 0.09; (C) tZ, η2 = 0.53; (D) JA, η2 = 0.19; (E) SA, η2 = 0.57; (F) ABA, η2 = 0.75; and (G) ETH, η2 = 0.88. Each data point is the mean ± SE; (A) n = 3, (C) n = 5, (B,D–F) n = 12.
3.7. Analysis of Correlations and Cluster Heatmap Visualization of Key Physiological Indicators During the Senescence Process of Jasmine Petals
As depicted in Figure 6, and considering the actual content and the statistical significance of variations in each indicator, the levels of cyanidin 3-rutinoside, rutin, and flavonols demonstrated a highly significant negative correlation with ABA content. Notably, cyanidin 3-rutinoside and rutin exhibited a significant negative correlation with pH levels and an even more pronounced negative correlation with moisture content. Additionally, moisture content showed a significant positive correlation with SA, JA, ABA, and ETH levels. Concurrently, SA, JA, and ETH levels were highly significantly positively correlated with each other.
Figure 6.
Correlation analysis of main physiological indexes during jasmine petal senescence. * indicates significant difference p < 0.05, ** indicates p < 0.01, legend indicates Pearson’s correlation index.
As illustrated in Figure 7, based on Euclidean distance metrics, cyanidin 3-rutinoside clustered with hormones such as SA, JA, and ETH. Furthermore, these hormones exhibited consistent co-expression patterns across four critical stages, suggesting a strong correlation between the accumulation of cyanidin 3-rutinoside and the elevated levels of hormones, including SA, JA, and ETH during the senescence of jasmine petals.
Figure 7.
Cluster heatmap of main physiological indexes during jasmine petal senescence. The heatmap with hierarchical clustering (distance measure using Euclidean, clustering algorithm using Ward D.), using MetaboAnalyst 5.0, after being log10-transformed.
3.8. Summary of Transcriptome Sequencing of the Jasmine Petals
The RNA, extracted from the petals of jasmine flowers at four different developmental stages, was sequenced using the Illumina HiSeqTM 4000 platform. A total of 592,006,296 paired-end high-quality clean reads were obtained through RNA-seq analysis, with 152,325,910 reads for the FB_0W sample, 137,206,194 reads for the OF_12W sample, 163,460,364 reads for the OF_24C sample, and 139,013,828 reads for the OF_36P sample (Table S1). A total of approximately 88.80 Gb of clean data were generated, averaging approximately 6.02 Gb per sample. The Q30 value was 92.61%, while the average GC content was approximately 43.31% (Table S1). Notably, more than 89% of these reads were mapped to reference sequences derived from J. sambac in all 12 samples (Table S2).
We evaluated the relative abundance values by calculating FPKM. The correlation and principal component analysis (PCA) analyses indicated that the samples had good repeatability, stable operation, and reliable sequencing data (Figure S5).
All genes were analyzed based on Blastx (E-value ≤ 10−5) searches against the public database to predict the function of these genes. According to the results of eight database annotations (Figure 8A, Table S3), up to 25,815 genes (84.1%) were annotated for function. The number of genes assigned to these eight databases ranged from 8303 (27.1%, COG) to 25,684 (83.7%). As shown in Figure 8B, Olea europaea had the highest similarity to J. sambac with 18,628 homologous genes (60.7%), followed by Sesamum indicum (5.21%) and Handroanthus impetiginosus (2.46%). We allocated 21,105 genes (68.8%) to the GO database, which were distributed across three main categories: cellular anatomical entity of biological process (53.59%), cellular process of cellular component (45.29%), and binding of molecular function (52.38%) clusters, and further classified them into 47 subcategories (Figure 8C). In addition, 13,683 genes (44.6%) were allocated to the Eukaryotic Clusters of Orthologous Groups (KOG) database (Figure 8D). Among the 25 KOG categories, general function prediction only represented the largest group (3217 genes, 23.51%), followed by posttranslational modification, protein turnover, chaperones (1620, 11.84%) and signal transduction mechanisms (1412, 10.32%).
Figure 8.
All gene annotations of J. sambac. (A) Diagram of the genes against eight public databases. (B) Distribution and statistics of genes in each sample species (only the first nine are shown). (C) Diagram of GO function classification. (D) Diagram of KOG function classification.
3.9. Identification of DEGs During the Senescence Process of Jasmine Petals
A thorough comparative analysis was performed to investigate the DEGs across three stage combinations (FB_0W vs. OF_12W, OF_12W vs. OF_24C, and OF_24C vs. OF_36P), which indicated notable alterations in petal color. There were 7186 DEGs, 3382 DEGs, and 2193 DEGs specifically in these three comparisons, respectively (Figure 9). In the FB_0W vs. OF_12W comparison, 3509 DEGs were up-regulated and 3677 DEGs were down-regulated. In OF_12W vs. OF_24C, 1786 DEGs were up-regulated, and 1596 DEGs were down-regulated. In the comparison between OF_24C vs. OF_36P, a total of 1167 DEGs were up-regulated, and 1026 DEGs were down-regulated (Figure 9A). These findings indicate that during floral opening of J. sambac, there is a relatively higher number of up-regulated DEGs compared to down-regulated ones. A total of 589 genes exhibit significant changes across all comparison groups, indicating that these genes play an important regulatory role in the senescence process and pigment accumulation of petals. Among the three comparison groups, there are 4599, 1161, and 686 DEGs, respectively, which potentially exert unique functions at developmental stages.
Figure 9.
Analysis of DEGs among the FB_0W vs. OF_12W, OF_12W vs. OF_24C, and OF_24C vs. OF_36P groups. (A) Statistical analysis of DEGs at different developmental stages of J. sambac. (B) Venn diagram showing the distribution of DEGs.
The 9782 DEGs obtained from the three comparisons were classified into three distinct Gene Ontology (GO) categories (biological process, cellular component, and molecular function) (Figure S6). Functional analysis of these DEGs revealed enrichment in 22 primary biological processes, such as cellular process, metabolic process, and bioregulation process. Within the cellular component category, these DEGs showed enrichment in three major groups, such as cellular anatomical, intracellular, and protein-containing complex. In terms of the molecular function category, most of the DEGs displayed enrichment in catalytic activity, binding, transporter activity, and transcription regulator activity.
KEGG analysis revealed that circadian rhythm-plant and glycolysis/gluconeogenesis were the two primary enriched pathways in the FB_0W vs. OF_12W comparison (Figure 10). This finding suggests that as the petals gradually unfold, circadian rhythm proteins may enhance their roles in the floral blooming cycle, while the glycolysis and sugar metabolic synthesis pathways are enriched to support the expansion of petal cells. Meanwhile, flavonoid biosynthesis, circadian rhythm-plant, anthocyanin biosynthesis, and monoterpenoid biosynthesis were the main enriched pathways in the OF_12W vs. OF_24C comparison, suggesting that these enriched pathways potentially play crucial roles during the transformation process of petal pigments and the rhythm of aroma release. Additionally, circadian rhythm-plant, flavonoid biosynthesis, anthocyanin biosynthesis, and stilbenoid, diarylheptanoid, and gingerol biosynthesis were the main enriched pathways in the OF_24C vs. OF_36P comparison, suggesting that these metabolic pathways may be closely linked to the synthesis of petal pigments and the rhythm of aroma release during the senescence process of jasmine petals.
Figure 10.
KEGG pathway enrichment analysis of DEGs. The Top 20 pathways with the most significant q-value among the FB_0W vs. OF_12W, OF_12W vs. OF_24C, and OF_24C vs. OF_36P comparisons.
3.10. Identification of DEGs Related to Flavonoid Biosynthetic Pathway
There were 25 DEGs encoding 9 enzymes and three main accumulated metabolites, total flavonols, rutin, and cyanidin 3-rutinoside, associated with the flavonoid biosynthetic pathway (Figure 11). Only one CHS (DJ12994) was significantly down-regulated in the naringenin formation step; the other 24 DEGs were remarkably up-regulated in the petals, positively correlating with total flavonols, rutin, and cyanidin 3-rutinoside during the senescence process of jasmine petals. Compared with the OF_12W stage, a notable increase in cyanidin 3-rutinoside was observed at the OF_24C stage. Meanwhile, there was a marked up-regulation of CHS (DJ16956), Chalcone isomerase gene (CHI, DJ05376), dihydroflavonol 4-reductase gene (DFR, NewGene_5622), and ANS (DJ01349) in the petals during this stage, with more than a five-fold increase.
Figure 11.
Analysis of DEGs involved in the flavonoid biosynthesis pathway in J. sambac. In the metabolic pathways, the enzymes marked in red and bold indicate that their coding genes are differentially expressed. The heatmap of DEGs encoding each enzyme is shown near the enzymes. The gene expression is based on the log2(FPKM + 1). FPKM is the mean of three biological replicates, the same as below.
3.11. Identification of DEGs Related to Plant Hormone Signal Transduction Pathway
There were 65 DEGs encoding 18 enzymes and TFs associated with the related plant hormone biosynthetic and plant hormone signal transduction pathways (Figure 12). In cysteine and methionine metabolism, the expression levels of one ACC synthase gene (ACS) and two ACC oxidase genes (ACO) were consistent with the change in ethylene content. In the ethylene signal transduction pathway, the expression levels of one ethylene receptor (ETR), one constitutive triple response 1 (CTR1), and two EIN3-binding F-box protein1/2s (EBF1/2) were consistent with the change in ethylene content. The expression levels of two ETRs, two CTR1s, two SIMKKs, one ethylene-insensitive 2 gene (EIN2), and one ethylene-responsive factor 1/2 (ERF1/2) were down-regulated, positively correlating with the accumulation of cyanidin 3-rutinoside. Conversely, two ETRs, one CTR1, one SIMKK, and one MPK6 were significantly down-regulated. In alpha-linolenic acid metabolism, the expression levels of two ACAA1s were significantly down-regulated, positively correlating with JA content change. In jasmonic acid signal transduction, expression patterns of two MYC2s were consistent with the changes in JA content. Meanwhile, the expression trends of one jasmonate resistant 1 (JAR1), four COI1s, one jasmonate ZIM-domain (JAZ), and five MYC2s were consistent with the accumulation trend of cyanidin 3-rutinoside, showing significant up-regulation. In phenylalanine, tyrosine, and tryptophan biosynthesis, three phenylalanine ammonia-lyase genes (PAL) were down-regulated. In salicylic acid signal transduction, the expression pattern of one nonexpresser of pathogenesis-related gene 1 (NPR1) was basically consistent with SA content change. One NPR1, four TGAs, and five pathogenesis-related protein 1s (PR-1) were significantly up-regulated, positively correlating with the accumulation trend of cyanidin 3-rutinoside. The above results indicate that the jasmine petal senescence process and pigment accumulation are accompanied by the activation of ethylene, jasmonic acid, and salicylic acid signal transduction, which may contribute to downstream gene expression and be associated with the accumulation of anthocyanins.
Figure 12.
Analysis of DEGs involved in plant hormone signal transduction pathway in J. sambac.
3.12. Identification and Analysis of TFs During the Senescence Process of Jasmine Petals
Previous studies have demonstrated that TFs, including AP2/ERF, MYB, bHLH, WD40, and WRKY, play a crucial role in regulating the accumulation of flavonoids and anthocyanins in flowers. In this study, these families of differentially expressed TFs include 258 genes observed during the petal color change (Figure 13). These DEGs included 60 AP2/ERFs, 67 MYBs, 48 bHLHs, 44 WD40s, and 39 WRKYs. In FB_0W vs. OF_12W, the expression levels of eight AP2/ERFs (DJ00395, DJ00396, DJ11463, DJ19683, DJ19804, DJ24137, DJ27912, and DJ23228), two MYBs (DJ08403 and DJ17637), one WD40 (DJ16158) and two WRKYs (DJ00191 and DJ29999) were significantly up-regulated more than three-fold, while one AP2/ERF (DJ01335) and four MYBs (DJ06890, DJ08092, DJ08889, and DJ13429) were remarkably down-regulated over three-fold. Moreover, in OF_12W vs. OF_24C, one AP2/ERF (DJ19577), five MYBs (DJ04949, DJ08092, DJ08889, DJ16191, and NewGene_12573), two bHLHs (DJ08305 and DJ09246), and two WRKYs (DJ02029 and DJ23411) were significantly up-regulated more than two-fold, while four AP2/ERFs (DJ00395, DJ00396, DJ11463, and DJ25737), one MYB (DJ17637), one bHLH (NewGene_6283), one WD40 (DJ16158) and one WRKY (DJ15664) were remarkably down-regulated over two-fold. Additionally, the expression levels of 20 WRKYs in jasmine petals exhibited a significant increase in OF_36P, compared to FB_0W, positively correlating with cyanidin 3-rutinoside accumulation. Furthermore, three WRKYs (DJ02029, DJ13747, and DJ27554) exhibited more than five-fold up-regulation observed among these WRKYs. In summary, these differentially expressed TFs are potential candidate genes involved in regulating anthocyanin metabolism and petal senescence in jasmine.
Figure 13.
Heatmaps illustrating DEGs based on log2(FPKM + 1) values for TFs during the senescence process of jasmine petals.
3.13. Network Analysis
Based on the aforementioned experimental results, it was noticed that the variation in plant hormone content emerged as the primary factor influencing the color variation of jasmine petals, followed by the variation in flavonoid content. To understand the regulation of the plant hormone and flavonoid pathway, the metabolic pathway-related genes, TFs, and metabolites were screened based on Pearson correlation analysis. The Pearson correlation analysis was conducted to examine the association between genes and metabolites, with a strong correlation defined as p < 0.05 and |r| > 0.9. The interactive networks among DEGs, metabolites, and TFs were constructed. According to the differential expression levels and annotation of TFs, 30 TFs were chosen to investigate their correlations with the structural genes related to pigment metabolism. The diagram in Figure 14A illustrates that 36 transcripts (six flavonoid biosynthesis-related genes and 30 TFs) and two metabolites (cyanidin 3-rutinoside and rutin) exhibited strong correlations in the flavonoid biosynthetic pathway. In Figure 14A, it can be noticed that a network comprising 38 nodes and 60 edges is interconnected. The two metabolites in the flavonoid pathway network served as hub nodes, with 60 pairs exhibiting positive correlations. Specifically, four MYBs, three bHLHs, and three WRKYs were strongly correlated with the two metabolites. Additionally, Figure 14B reveals correlations between 31 TFs and five flavonoid-related structural genes from all four stages. As depicted in Figure 14B, a network consisting of 36 nodes and 423 edges was constructed, with 423 pairs exhibiting a positive correlation; two MYBs (DJ31166, DJ24142) and three WRKYs (DJ22440, DJ10749, and DJ13747) were strongly correlated with flavonoid-related structural genes and TFs, respectively.
Figure 14.
Network interaction diagrams of the flavonoid pathway in jasmines. (A) Connection network between DEGs and metabolites. (B) Connection network between TFs and flavonoid-related genes. Circles represent flavonoid-related metabolites.  represents flavonoid-related genes.
 represents bHLHs.
 represents MYBs.
 represents WRKYs. Red lines and green lines represent positive and negative correlations, respectively, as determined by a Pearson correlation coefficient |r| > 0.9.
represents flavonoid-related genes. represents bHLHs. represents MYBs. represents WRKYs. Red lines and green lines represent positive and negative correlations, respectively, as determined by a Pearson correlation coefficient |r| > 0.9.
In the plant hormone signal transduction pathway, the analysis revealed that 23 transcripts (two cysteine and methionine metabolism-related genes and 21 TFs) exhibited significant correlation coefficients with three plant hormone metabolites. As depicted in Figure 15A, a network consisting of 26 nodes and 55 edges was constructed. All three plant hormone metabolite networks were identified as hub nodes, with five pairs exhibiting negative correlations and 50 pairs exhibiting positive correlations. Specifically, one ACS, one ACO, three AP2/ERFs, one TGA, and one WRKY were positively correlated with three metabolites. Additionally, Figure 15B reveals correlations between 30 TFs and four plant hormone-related structural genes from all four stages. As depicted in Figure 15B, a network consisting of 34 nodes and 203 edges was constructed, with 169 pairs exhibiting a positive correlation and 34 pairs exhibiting a negative correlation. Three AP2/ERFs (DJ27912, NewGene_2146, and NewGene_7758), one EBF1/2 (DJ30087), one MYC2 (DJ24112), one TGA (DJ17787), and one WRKY (DJ00439) were strongly correlated with plant hormone-related structural genes and TFs, respectively.
Figure 15.
Network interaction diagrams of the plant hormone biosynthetic and plant hormone signal transduction pathways in jasmines. (A) Connection network between DEGs and metabolites. (B) Connection network between TFs and plant hormone signal transduction-related genes. Circles represent plant hormone metabolites. represents ethylene-related genes.  represents JA-related genes.
 represents SA-related genes. represents WRKYs. Red lines and green lines represent positive and negative correlations, respectively, as determined by a Pearson correlation coefficient |r| > 0.9.
represents ethylene-related genes. represents JA-related genes. represents SA-related genes. represents WRKYs. Red lines and green lines represent positive and negative correlations, respectively, as determined by a Pearson correlation coefficient |r| > 0.9.
4. Discussion
4.1. Physiological Inferences of Pigment Accumulation During the Senescence Process of Jasmine Petals
The senescence of floral organs in ornamental plants is typically accompanied by a reduction in petal water content, an elevation in soluble sugar levels, an increase in pH, and the degradation of anthocyanins [42]. In the petal senescence of red rose cultivars, protein hydrolysis results in an augmented ammonia content, thereby elevating the cytosolic pH. This, in turn, prompts cyanidin 3,5-O-glucoside to form a complex with the co-pigment quercetin derivatives, causing the petals to exhibit a bluish hue [43,44]. In contrast to ornamental plants such as roses, which experience anthocyanin degradation during petal senescence [45,46], certain plants that accumulate anthocyanins during this process, including hibiscus [47,48], pansy (Viola cornuta L. cv. Yesterday, Today and Tomorrow) [28], and evening primrose (Oenothera tetraptera), demonstrate a decline in pH, aligning with findings in jasmine. Consequently, the senescence of jasmine petals is predominantly marked by anthocyanin synthesis. Furthermore, due to the increased concentration of the flavonol rutin in the later stages, coupled with the influence of co-pigments, loss of water, and a decrease in pH of petal tissue, jasmine petals undergo a color transition from light pink at 24 h to purple at 36 h.
For ethylene-sensitive flowers, such as carnations and petunias, the ABA content increases as the flowers bloom, concomitant with the accumulation of endogenous ethylene. ABA exerts an inductive effect on ethylene synthesis [49,50,51,52,53]. In comparison with previously reported data [49,52,53], jasmine flowers exhibited a high ABA content upon blooming in this study. During the transition from blooming to wilting, there was no upward trend. Instead, a notable decrease occurred after 18 h. Concurrently, the ethylene content rose significantly from nearly undetectable levels at the onset of blooming to a peak at 12 h. This suggests that a relatively high ABA content in the petals during the early stages of blooming significantly correlates with the production of endogenous ethylene. Regarding ethylene production, the peak ethylene production in jasmine is markedly lower than that in petunias, carnations, and roses [54,55,56,57,58,59,60,61]. After reaching its peak, ethylene production rapidly declined and remained at a low level from petal wilting (24 h) to senescence (36 h). Therefore, ethylene likely serves as a signaling molecule that induces the senescence process of petals, rather than inhibiting anthocyanin synthesis, and ensures that the anthocyanins accumulated in vacuoles are not degraded by ethylene.
Additionally, JA and SA were present in relatively high concentrations, exhibiting variation trends consistent with those of ethylene in this study. Nevertheless, the precise mechanisms by which JA and SA induce or inhibit ethylene remain elusive [62,63,64,65,66]. Presently, the exogenous application of MeJA to petunias, dendrobiums, and phalaenopses has been shown to elevate 1-aminocyclopropane-1-carboxylic acid (ACC) activity, subsequently enhancing endogenous ethylene synthesis and expediting petal senescence [66]. Conversely, the application of SA helps maintain petal membrane stability and antioxidant enzyme activity, thereby mitigating lipid peroxidation and retarding petal senescence [62,63,64,65]. In jasmine, a highly significant positive correlation existed among JA, SA, and ETH, and they clustered together with cyanidin 3-rutinoside accumulation in cluster analysis, suggesting a potential link between their content variations and jasmine anthocyanin accumulation, warranting further in-depth investigation.
By integrating physiological studies on the variations in anthocyanin content during petal senescence across other species, the physiological mechanism of jasmine petal coloration is postulated as follows. During the initial stage of flower opening (0 h), a relatively high concentration of ABA in petals may contribute to the production of endogenous ethylene, thereby expediting the senescence process. Additionally, functioning as a signaling molecule, ETH is associated with flavonol synthesis. Cyanidin 3-rutinoside is modulated by co-pigments, and under conditions of lower pH and a reduction in moisture content of petal tissue, the color of jasmine petals shifts from light pink (24 h) to purple (36 h).
4.2. Differentially Expressed Transcripts Reveal Flavonoid Regulation in Jasmine Petals
At present, the genomes of SP jasmine (PRJNA795621, PRJCA006739) [3,67], DP jasmine (PRJCA006739) [3], and MP jasmine (PRJNA723725) have been sequenced and made publicly available, offering valuable insights for further elucidating the biosynthesis and regulatory mechanisms of anthocyanins in jasmine. Nevertheless, there remains a scarcity of detailed annotation files and comprehensive gene function studies. The genomic and transcriptomic analyses conducted in related studies [67,68,69] used samples with durations not exceeding the 14 h timeframe employed in this study, primarily focusing on the processes of fragrance emission involved in jasmine tea production. Notably, these samples were collected in vitro and thus failed to adequately capture the transcriptional regulatory dynamics of jasmine petals throughout their natural lifecycle, encompassing normal blooming, fragrance release, and senescence-induced pigment accumulation. In this study, we successfully induced a consistent and reproducible phenotypic progression of jasmine petal senescence, from blooming to senescence, under controlled artificial climate conditions within a climate chamber. Additionally, we constructed a transcriptome of jasmine petals, thereby enhancing our comprehension of the intricate dynamic processes underlying jasmine’s normal blooming, fragrance release, and senescence-induced pigment accumulation.
Anthocyanins, classified as flavonoid compounds, are synthesized via the flavonoid pathway. When compared with the transcriptome data from ornamental plants reported to accumulate substantial anthocyanins in their flowers (or leaves) during petal (or leaf) development, the DEGs involved in the flavonoid pathway in peony (Paeonia lactiflora ‘Coral Sunset’) [70], lily (Lilium brownii cv. Vivian) [71], honeysuckle (Lonicera japonica) [72], and Acer mandshuricum [73] displayed distinct expression profiles that exhibited low concordance with phenotypic variations. In contrast, the expression pattern of the flavonoid pathway in jasmine petals closely mirrored the phenotypic manifestation of petal pigment accumulation. Notably, the majority of DEGs annotated in the flavonoid pathway at 24–36 h demonstrated a singular, significantly up-regulated expression pattern, underscoring its uniqueness. Research on petunias has elucidated that the competitive interaction between the flavonol synthase gene (FLS) and DFR for substrates plays a pivotal role in determining the biosynthesis of flavonols and anthocyanins, consequently influencing flower coloration. This study revealed no significant disparity in the expression patterns of FLS and DFR in jasmine petals. However, the expression patterns of DFR (NewGene_5622) and ANS (DJ01349) aligned with the accumulation trend of cyanidin 3-rutinoside, with their expression levels surging more than five-fold, inferring their crucial roles as structural genes in jasmine anthocyanin biosynthesis. Analogous to roses, no differentially expressed F3′5′H was detected, potentially accounting for the absence of delphinidin- and pelargonidin-based anthocyanins in jasmine.
4.3. Differentially Expressed Transcripts Reveal Plant Hormone Signal Transduction in Jasmine Petals
ACC undergoes catalysis by ACO to synthesize ethylene. Ethylene receptors (ETR) are localized on the endoplasmic reticulum (ER) membrane. At low ethylene concentrations, the receptor binds to the N-terminus of CTR1, which in turn phosphorylates the C-terminus of EIN2, thereby inhibiting downstream signal transduction. Concurrently, within the nucleus, the transcription factor EIN3 undergoes degradation via the ubiquitin-proteasome system (UPS), mediated by EBF1/2, rendering the ethylene signaling pathway silent or inactive. As ethylene concentration rises, ethylene molecules bind to ETR, leading to the inactivation of CTR1 and preventing it from phosphorylating EIN2. The N-terminus of the dephosphorylated EIN2 is cleaved and then transported from the ER to the nucleus, where it stabilizes and facilitates the accumulation of the transcription factor EIN3, consequently regulating the expression of ethylene-responsive genes [74,75,76,77,78,79]. The endogenous ethylene content in jasmine petals exhibited a high degree of synchronization with the expression levels of ACOs. Prior to the peak in endogenous ethylene content, elevated CTR1 expression inhibited downstream signal transduction. Following the peak in endogenous ethylene content, downstream signaling genes EIN2 (DJ08120) and ERF1/2 (DJ24137) demonstrated up-regulated expression, with their expression trends aligning with the accumulation pattern of cyanidin 3-rutinoside.
Under conditions without jasmonic acid (JA) treatment, CsJAZ1-1 and CsJAZ1-2 repress the expression of downstream genes by binding to CsMYC2, a positive regulator involved in flavan-3-ol biosynthesis, thereby inhibiting the synthesis of flavan-3-ol in tea plants. When JA is present, CsJAZ1-1 and CsJAZ1-2 interact with JA-Ile to form a complex, which subsequently triggers their ubiquitination and degradation. The liberated CsMYC2 then binds to gene promoters within the flavan-3-ol biosynthesis pathway, activating the biosynthesis of flavan-3-ol in tea plants [80]. Analogous phenomena are observed in jasmine petals, where JA levels remained consistently high without significant fluctuations, and the expression of JAR1, COI1, and MYC2 was up-regulated. It is hypothesized that JAR catalyzes the conversion of JA to JA-Ile, forming a complex with jasmine JAZ proteins, and the released MYC2 (DJ24112) may activate the expression of genes associated with the flavonoid pathway in jasmine.
The SA signal transduction pathway comprises both NPR1-dependent and NPR1-independent pathways [62,64]. The expression profile of jasmine NPR1 aligned with the fluctuations in SA content within petals, inferring that its signal transduction mechanism was NPR1-dependent. Within the NPR1-dependent pathway, NPR1 is identified as a protein harboring a WD40 domain. Upon SA induction, the cellular reducing potential escalates, swiftly reducing the disulfide bonds of the NPR1 protein, which initially exists in a complex oligomeric form, thereby forming monomers. This process is subsequently associated with the expression of TGA (DJ17787) and PR-1.
4.4. Transcription Factors in Jasmine Petals
Recent studies have demonstrated that TFs, including MYB, bHLH, AP2/ERF, and WRKY, can modulate a variety of metabolic and developmental pathways in plants [53,60]. In this study, a total of 3095 TFs were predicted and categorized into 92 transcription factor families. The expression of structural genes of anthocyanin biosynthesis is governed by MBW, a protein complex composed of MYB, bHLH, and WDR (WD-repeat) proteins [67]. This study identified 67 differentially expressed MYB/MYB-related families, 48 members of the bHLH family, and 44 members of the WDR family. Through network analysis, two MYBs (DJ31166, DJ24142) were identified as being closely associated with jasmine anthocyanin metabolism. MYBs constitute one of the largest transcription factor families in plants and play a pivotal role in regulating the biosynthesis of secondary metabolites such as phenylpropanoids, flavonoids, and anthocyanins [66]. For instance, SmMYB98 and SmMYB1 can enhance the accumulation of phenolic acids, including tanshinone and salvianolic acid, by upregulating the expression of genes involved in the phenolic acid biosynthesis pathway [81,82]. Another transcription factor family, bHLH, also participates in the regulation of flavonoid biosynthesis and typically interacts with MYB proteins [83]. Furthermore, AP2/ERF, EBF, and WRKY transcription factors are implicated in the biosynthesis of secondary metabolites such as flavonoids [84].
Recent studies have demonstrated that WRKY transcription factors play a role in regulating anthocyanin synthesis. However, research on jasmine WRKYs has predominantly focused on the screening of differentially expressed WRKYs in samples associated with the aroma release process, with a dearth of functional studies [85,86]. The WRKY proteins AtTTG2 and PhPH3 influence flavonoid biosynthesis through their interaction with the MBW complex [40]. In Arabidopsis thaliana, AtWRKY75 responds to low phosphorus (Pi) stress by suppressing anthocyanin biosynthesis [87]. The rosette leaves of AtWRKY41 mutants exhibit an increased anthocyanin content [88]. Overexpression of Gossypium hirsutum WRKY1 in A. thaliana showed a positive correlation with anthocyanin accumulation [89]. In pear and apple, numerous WRKY proteins have been identified to interact with MBW and participate in the regulation of the anthocyanin synthesis pathway [87,88,90,91,92,93,94,95,96]. In apple, MdWRKY40 plays a pivotal role in wound-induced anthocyanin synthesis [96]. In pear, PyWRKY26 and PybHLH3 regulate anthocyanin biosynthesis by jointly targeting the PyMYB114 promoter [97]. PbWRKY75 promotes the expression of PbMYB10b, PbDFR, and PbUFGT by activating their promoters, thereby inducing anthocyanin synthesis in pear [87]. In grape, both VvMYB15 and VvWRKY40 can bind to the promoter regions of VvF3′5′H and VvUFGT, as well as regulate the expression of VvF3′5′H and VvUFGT, further activating them through the formation of heterodimers between VvMYB15 and VvWRKY40 [98]. Although it has been reported that WRKYs can regulate anthocyanin synthesis, the mechanism underlying the induction of anthocyanin synthesis in jasmine petals remains elusive. This study revealed that the jasmine WRKY family comprised 70 members, with only 39 members exhibiting differential expression at jasmine petal developmental stages. Through network analysis, three WRKYs (DJ22440, DJ10749, and DJ13747) were initially identified as being strongly correlated with flavonoid-related structural genes and TFs. One WRKY (DJ00439) showed a strong correlation with plant hormone-related structural genes and TFs, respectively. Among these, DJ00439 exhibited a high degree of similarity to AtWRKY70. AtWRKY70 is implicated in plant defense via signaling pathways mediated by SA and JA, and its mutants demonstrate elevated levels of anthocyanins, suggesting its role as a negative regulator in Arabidopsis [99], broccoli [100], and dendrobium [101]. In contrast, StWRKY70 acts as a positive regulator in tuber flesh pigmentation in potatoes, via the stimulating expression of StDFR and StANS [102]. Consequently, we hypothesize that JsWRKY70 (DJ00439) may participate in the regulation of flavonoid metabolism in jasmine petals.
4.5. Limitations
Several limitations of this study should be noted. First, physiological indexes related to anthocyanin synthesis, especially hormones such as SA, JA, and ETH, have only been measured for their endogenous levels, lacking verification through exogenous treatments. Secondly, preliminary transcriptome data analysis, combined with the conclusions of published papers, has identified relevant candidate genes. However, there is still a lack of verification methods such as qPCR, functional verification of candidate structural genes, and experimental verification of candidate TFs activating the promoter region of structural genes (using dual-luciferase reporter genes, EMSA, and ChIP). Despite these limitations, our results provide insights into anthocyanin biosynthesis for petal color formation during the senescence process of jasmine petals. Future studies with physiological and molecular validation are needed to confirm these findings.
5. Conclusions
Our research findings indicate that the coloration of jasmine petals can be stably reproduced under artificial conditions. The pigment responsible for the purple hue in jasmine petals undergoing color change is cyanidin 3-rutinoside, while rutin acts as a co-pigment. Key candidate structural genes, along with major TFs implicated in the anthocyanin pathways, which were found in this study, may contribute to regulating anthocyanin levels during flower color transitions. In this study, we offer novel insights into the mechanisms underlying coloration in jasmines through an integrative analysis of physiological and transcriptomic data. These findings establish a foundation for further exploration of the mechanism of coloration in jasmine petals and furnish valuable information for the molecular breeding of ornamental plants exhibiting specific flower color changes during blooming.
Supplementary Materials
The following supporting information can be downloaded at: https://www.mdpi.com/article/10.3390/horticulturae12111322/s1. Figure S1. The phenotype of J. sambac during petal senescence. The time in () corresponds to the time outdoors during autumn in Fuzhou;  indicates the dark cycle in a climatic room;
 indicates the light cycle in a climatic room; Figure S2. Full spectrum scan of jasmine purpling petal pigment extract; Figure S3. Anthocyanin in purpling jasmine petals and the standard of cyanidin 3-rutinoside analyzed by UPLC-PDA at 520 nm. (A) is the peak appearance of the standard of cyanidin 3-rutinoside at 520 nm, analyzed by UPLC-PDA, with RT of 6.44 min; (B) is the peak appearance of the pigment extract of purpling jasmine petals at 520 nm, analyzed by UPLC-PDA, with RT of 6.47 min; Figure S4. Spectrum results of cyanidin 3-rutinoside standard and anthocyanin in purpling jasmine petals. (A) is the spectrum result of cyanidin 3-rutinoside standard, and (B) is the result of anthocyanin in purpling jasmine petals; Figure S5. Correlation analysis (A) and principal component analysis (PCA) (B) among samples. (A) Heat map of the correlation coefficient between 12 samples; Figure S6. GO classification of DEGs. GO significant enrichment analysis of up- and down- regulated DEGs between the three comparisons: FB_0W vs. OF_12W, OF_12W vs. OF_24C and OF_24C vs. OF_36P; Figure S7. TF family distribution in J. sambac; Table S1. Overview of the transcriptome sequencing data obtained using Illumina technology; Table S2. Number of reads of the 12 samples mapped to the reference sequences; Table S3. Function annotation of genes in J. sambac.
indicates the dark cycle in a climatic room; indicates the light cycle in a climatic room; Figure S2. Full spectrum scan of jasmine purpling petal pigment extract; Figure S3. Anthocyanin in purpling jasmine petals and the standard of cyanidin 3-rutinoside analyzed by UPLC-PDA at 520 nm. (A) is the peak appearance of the standard of cyanidin 3-rutinoside at 520 nm, analyzed by UPLC-PDA, with RT of 6.44 min; (B) is the peak appearance of the pigment extract of purpling jasmine petals at 520 nm, analyzed by UPLC-PDA, with RT of 6.47 min; Figure S4. Spectrum results of cyanidin 3-rutinoside standard and anthocyanin in purpling jasmine petals. (A) is the spectrum result of cyanidin 3-rutinoside standard, and (B) is the result of anthocyanin in purpling jasmine petals; Figure S5. Correlation analysis (A) and principal component analysis (PCA) (B) among samples. (A) Heat map of the correlation coefficient between 12 samples; Figure S6. GO classification of DEGs. GO significant enrichment analysis of up- and down- regulated DEGs between the three comparisons: FB_0W vs. OF_12W, OF_12W vs. OF_24C and OF_24C vs. OF_36P; Figure S7. TF family distribution in J. sambac; Table S1. Overview of the transcriptome sequencing data obtained using Illumina technology; Table S2. Number of reads of the 12 samples mapped to the reference sequences; Table S3. Function annotation of genes in J. sambac.Author Contributions
Conceptualization, Q.C. and W.W.; methodology, Q.Y. and Y.Y.; software, Q.Y. and Q.X.; validation, W.W. and R.R.; formal analysis, Q.X.; investigation, Q.Y. and R.R.; resources, Q.C., Y.Y. and Q.X.; data curation, Q.X. and W.W.; writing—original draft preparation, W.W.; writing—review and editing, Q.C. and W.W.; visualization, W.W. and Q.X.; supervision, Q.C. and Q.X.; project administration, Q.C.; funding acquisition, Q.C. and W.W. All authors have read and agreed to the published version of the manuscript.
Funding
This research was funded by the Transverse Science and Technology Innovation Fund Program of Fujian Agriculture and Forestry University (grant number KHF200005), and the National Natural Science Foundation of China (grant number nr. 31902050).
Data Availability Statement
The original contributions presented in this study are included in the article/Supplementary Material. Further inquiries can be directed to the corresponding authors.
Acknowledgments
We thank Binghua Wu, Meiling Nv, and Miao Miao for their help during the experiment.
Conflicts of Interest
The authors declare no conflicts of interest.
Abbreviations
The following abbreviations are used in this manuscript:
| ABA | Abscisic acid |
| ACC | 1-aminocyclopropane-1-carboxylic acid |
| ACO | ACC oxidase |
| ACS | ACC synthase |
| ANS | Anthocyanidin synthase |
| BZ1 | Anthocyanidin 3-O-glucosyltransferase |
| CHI | Chalcone isomerase |
| CHS | Chalcone synthase |
| COG | Clusters of Orthologous Groups of proteins |
| CTR1 | Constitutive triple response 1 |
| DEG | Differentially expressed gene |
| DFR | Dihydroflavonol 4-reductase |
| EBF | EIN3-binding F-box protein |
| EIN | Ethylene-insensitive |
| ER | Endoplasmic reticulum |
| ERF | Ethylene-responsive factor |
| ESI | Electrospray ionization |
| ETH | Ethylene |
| ETR | Ethylene receptor |
| F3H | Flavanone 3-hydroxylase |
| F3′H | Flavonoid 3′-monooxygenase |
| F3′5′H | Flavonoid-3′,5′-hydroxylase |
| FC | Fold change |
| FDR | False discovery rate |
| FLS | flavonol synthase |
| FPKM | Fragments per kilobase of transcript per million fragments mapped |
| GA3 | Gibberellin |
| GO | Gene ontology |
| IAA | Indole-3-acetic acid |
| JA | Jasmonic acid |
| JAR1 | Jasmonate resistant 1 |
| JAZ | Jasmonate ZIM-domain |
| KEGG | the Kyoto encyclopedia of genes and genomes |
| KO | KEGG Ortholog database |
| KOG | Eukaryotic Clusters of Orthologous Groups |
| MRM | Multiple reaction monitoring |
| MW | Molecular weight |
| NCBI | National Center for Biotechnology Information |
| NPR1 | Nonexpresser of pathogenesis-related gene 1 |
| Nr | Non-redundant protein |
| PAL | Phenylalanine ammonia-lyase |
| PCA | Principal component analysis |
| PCR | Polymerase chain reaction |
| Pi | Phosphorus |
| Pfam | Protein family |
| PR-1 | Pathogenesis-related protein 1 |
| RABT | Reference Annotation Based Transcript |
| RT | Retention time |
| SA | Salicylic acid |
| SMRT | Single-molecule real-time |
| SRA | Sequence Read Archive |
| Swiss-Prot | A manually annotated and reviewed protein sequence database |
| TF | Transcription factor |
| tZ | trans Zeatin |
| UPLC-QTOF-MS | Ultra-Performance Liquid Chromatography-Quadrupole Time-of-Flight Mass Spectrometry |
| UPS | Ubiquitin-proteasome system |
| WDR | WD-repeat |
References
- Raven, P.H.; Zhang, L.; Al-Shehbaz, I.A. Flora of China; Science Press & Missouri Botanical Garden Press: Beijing, China; St. Louis, MO, USA, 2008. [Google Scholar]
- Lai, M. The Species Characteristics and Propogation of Taiwanese Species of Arabian Jasmine. J. Fujian Agric. Univ. 1995, 3, 291–294. [Google Scholar] [CrossRef]
- Wang, P.; Fang, J.; Lin, H.; Yang, W.; Yu, J.; Hong, Y.; Jiang, M.; Gu, M.; Chen, Q.; Zheng, Y.; et al. Genomes of single-and double-petal jasmines (Jasminum sambac) provide insights into their divergence time and structural variations. Plant Biotechnol. J. 2022, 20, 1232–1234. [Google Scholar] [CrossRef] [Scilit] [PubMed]
- Fu, Z.; Ruan, L.; Wang, J. Purple jasmine flower and its prevention and eradication measures. Fujian Tea 1997, 32–34. [Google Scholar]
- Tanaka, Y.; Sasaki, N.; Ohmiya, A. Biosynthesis of plant pigments: Anthocyanins, betalains and carotenoids. Plant J. 2008, 54, 733–749. [Google Scholar] [CrossRef] [Scilit] [PubMed]
- Li, Y. Plant Anthocyanins; Chemical Industry Press: Beijing, China, 2013; pp. 150–151. [Google Scholar]
- Giuliano, G. Plant carotenoids: Genomics meets multi-gene engineering. Curr. Opin. Plant Biol. 2014, 19, 111–117. [Google Scholar] [CrossRef] [Scilit] [PubMed]
- Giuliano, G.; Tavazza, R.; Diretto, G.; Beyer, P.; Taylor, M.A. Metabolic engineering of carotenoid biosynthesis in plants. Trends Biotechnol. 2008, 26, 139–145. [Google Scholar] [CrossRef] [Scilit] [PubMed]
- Hannoufa, A.; Hossain, Z. Regulation of carotenoid accumulation in plants. Biocatal. Agric. Biotechnol. 2012, 1, 198–202. [Google Scholar] [CrossRef] [Scilit]
- Hirschberg, J. Carotenoid biosynthesis in flowering plants. Curr. Opin. Plant Biol. 2001, 4, 210–218. [Google Scholar] [CrossRef] [Scilit] [PubMed]
- Nisar, N.; Li, L.; Lu, S.; Khin, N.C.; Pogson, B.J. Carotenoid Metabolism in Plants. Mol. Plant 2015, 8, 68–82. [Google Scholar] [CrossRef] [Scilit] [PubMed]
- Ohmiya, A. Qualitative and quantitative control of carotenoid accumulation in flower petals. Sci. Hortic. 2013, 163, 10–19. [Google Scholar] [CrossRef] [Scilit]
- Rodriguez-Concepcion, M.; Stange, C. Biosynthesis of carotenoids in carrot: An underground story comes to light. Arch. Biochem. Biophys. 2013, 539, 110–116. [Google Scholar] [CrossRef] [Scilit] [PubMed]
- Shumskaya, M.; Wurtzel, E.T. The carotenoid biosynthetic pathway: Thinking in all dimensions. Plant Sci. 2013, 208, 58–63. [Google Scholar] [CrossRef] [Scilit] [PubMed]
- Sun, T.; Yuan, H.; Cao, H.; Yazdani, M.; Tadmor, Y.; Li, L. Carotenoid Metabolism in Plants: The Role of Plastids. Mol. Plant 2018, 11, 58–74. [Google Scholar] [CrossRef] [Scilit] [PubMed]
- Zhu, C.; Bai, C.; Sanahuja, G.; Yuan, D.; Farré, G.; Naqvi, S.; Shi, L.; Capell, T.; Christou, P. The regulation of carotenoid pigmentation in flowers. Arch. Biochem. Biophys. 2010, 504, 132–141. [Google Scholar] [CrossRef] [Scilit] [PubMed]
- Gandía-Herrero, F.; García-Carmona, F. Biosynthesis of betalains: Yellow and violet plant pigments. Trends Plant Sci. 2013, 18, 334–343. [Google Scholar] [CrossRef] [Scilit] [PubMed]
- Jain, G.; Gould, K.S. Are betalain pigments the functional homologues of anthocyanins in plants? Environ. Exp. Bot. 2015, 119, 48–53. [Google Scholar] [CrossRef] [Scilit]
- Polturak, G.; Aharoni, A. “La Vie en Rose”: Biosynthesis, Sources, and Applications of Betalain Pigments. Mol. Plant 2018, 11, 7–22. [Google Scholar] [CrossRef] [Scilit] [PubMed]
- Miller, R.; Owens, S.J.; Rørslett, B. Plants and colour: Flowers and pollination. Opt. Laser Technol. 2011, 43, 282–294. [Google Scholar] [CrossRef] [Scilit]
- Lippi, M.M.; Giuliani, C.; Gonnelli, T.; Bini, L.M. Floral color changes in Boswellia sacra Flueck. (Burseraceae): A dialogue between plant and pollinator. Flora-Morphol. Distrib. Funct. Ecol. Plants 2011, 206, 821–826. [Google Scholar] [CrossRef] [Scilit]
- Willmer, P.; Stanley, D.A.; Steijven, K.; Matthews, I.M.; Nuttman, C.V. Bidirectional Flower Color and Shape Changes Allow a Second Opportunity for Pollination. Curr. Biol. 2009, 19, 919–923. [Google Scholar] [CrossRef] [Scilit] [PubMed]
- Ohashi, K.; Makino, T.T.; Arikawa, K.; Kudo, G. Floral colour change in the eyes of pollinators: Testing possible constraints and correlated evolution. Funct. Ecol. 2015, 29, 1144–1155. [Google Scholar] [CrossRef] [Scilit]
- Ida, T.Y.; Kudo, G. Floral color change in Weigela middendorffiana (Caprifoliaceae): Reduction of geitonogamous pollination by bumble bees. Am. J. Bot. 2003, 90, 1751–1757. [Google Scholar] [CrossRef] [Scilit] [PubMed]
- Yan, J.; Wang, G.; Sui, Y.; Wang, M.; Zhang, L. Pollinator responses to floral colour change, nectar and scent promote reproductive fitness in Quisqualis indica (Combretaceae). Sci. Rep. 2016, 6, 24408. [Google Scholar] [CrossRef] [Scilit] [PubMed]
- Yan, J.; Wang, M.; Zhang, L. Light induces petal color change in Quisqualis indica (Combretaceae). Plant Divers. 2018, 40, 28–34. [Google Scholar] [CrossRef] [Scilit] [PubMed]
- Farzad, M.; Griesbach, R.; Hammond, J.; Weiss, M.R.; Elmendorf, H.G. Differential expression of three key anthocyanin biosynthetic genes in a color-changing flower, Viola cornuta cv. Yesterday, Today and Tomorrow. Plant Sci. 2003, 165, 1333–1342. [Google Scholar] [CrossRef] [Scilit]
- Farzad, M.; Griesbach, R.; Weiss, M.R. Floral color change in Viola cornuta L. (Violaceae) a model system to study regulation of anthocyanin production. Plant Sci. 2002, 162, 225–231. [Google Scholar] [CrossRef] [Scilit]
- Farzad, M.; Soria-Hernanz, D.F.; Altura, M.; Hamilton, M.B.; Weiss, M.R.; Elmendorf, H.G. Molecular evolution of the chalcone synthase gene family and identification of the expressed copy in flower petal tissue of Viola cornuta. Plant Sci. 2005, 168, 1127–1134. [Google Scholar] [CrossRef] [Scilit]
- Koyama, K.; Sadamatsu, K.; Goto-Yamamoto, N. Abscisic acid stimulated ripening and gene expression in berry skins of the Cabernet Sauvignon grape. Funct. Integr. Genom. 2009, 10, 367–381. [Google Scholar] [CrossRef] [Scilit] [PubMed]
- Jia, H.-F.; Chai, Y.-M.; Li, C.-L.; Lu, D.; Luo, J.-J.; Qin, L.; Shen, Y.-Y. Abscisic Acid Plays an Important Role in the Regulation of Strawberry Fruit Ripening. Plant Physiol. 2011, 157, 188–199. [Google Scholar] [CrossRef] [Scilit] [PubMed]
- Fan, X.; Mattheis, J.P.; Fellman, J.K. A role for jasmonates in climacteric fruit ripening. Planta 1998, 204, 444–449. [Google Scholar] [CrossRef] [Scilit]
- Rudell, D.R.; Fellman, J.K.; Mattheis, J.P. Preharvest Application of Methyl Jasmonate to “Fuji” Apples Enhances Red Coloration and Affects Fruit Size, Splitting, and Bitter Pit Incidence. HortScience 2005, 40, 1760–1762. [Google Scholar] [CrossRef] [Scilit]
- Jaakola, L. New insights into the regulation of anthocyanin biosynthesis in fruits. Trends Plant Sci. 2013, 18, 477–483. [Google Scholar] [CrossRef] [Scilit] [PubMed]
- Jeong, S.-W.; Das, P.K.; Jeoung, S.C.; Song, J.-Y.; Lee, H.K.; Kim, Y.-K.; Kim, W.J.; Park, Y.I.; Yoo, S.-D.; Choi, S.-B.; et al. Ethylene Suppression of Sugar-Induced Anthocyanin Pigmentation in Arabidopsis. Plant Physiol. 2010, 154, 1514–1531. [Google Scholar] [CrossRef] [Scilit] [PubMed]
- Kwon, Y.; Oh, J.E.; Noh, H.; Hong, S.-W.; Bhoo, S.H.; Lee, H. The ethylene signaling pathway has a negative impact on sucrose-induced anthocyanin accumulation in Arabidopsis. J. Plant Res. 2010, 124, 193–200. [Google Scholar] [CrossRef] [Scilit] [PubMed]
- Das, P.K.; Shin, D.H.; Choi, S.-B.; Park, Y.-I. Sugar-Hormone Cross-Talk in Anthocyanin Biosynthesis. Mol. Cells 2012, 34, 501–508. [Google Scholar] [CrossRef] [Scilit] [PubMed]
- Meng, L.-S.; Xu, M.-K.; Wan, W.; Yu, F.; Li, C.; Wang, J.-Y.; Wei, Z.-Q.; Lv, M.-J.; Cao, X.-Y.; Li, Z.-Y.; et al. Sucrose Signaling Regulates Anthocyanin Biosynthesis Through a MAPK Cascade in Arabidopsis thaliana. Genetics 2018, 210, 607–619. [Google Scholar] [CrossRef] [Scilit] [PubMed]
- Qi, T.; Song, S.; Ren, Q.; Wu, D.; Huang, H.; Chen, Y.; Fan, M.; Peng, W.; Ren, C.; Xie, D. The Jasmonate-ZIM-Domain Proteins Interact with the WD-Repeat/bHLH/MYB Complexes to Regulate Jasmonate-Mediated Anthocyanin Accumulation and Trichome Initiation in Arabidopsis thaliana. Plant Cell 2011, 23, 1795–1814. [Google Scholar] [CrossRef] [Scilit] [PubMed]
- Verweij, W.; Spelt, C.E.; Bliek, M.; de Vries, M.; Wit, N.; Faraco, M.; Koes, R.; Quattrocchio, F.M. Functionally Similar WRKY Proteins Regulate Vacuolar Acidification in Petunia and Hair Development in Arabidopsis. Plant Cell 2016, 28, 786–803. [Google Scholar] [CrossRef] [Scilit] [PubMed]
- Spelt, C.; Quattrocchio, F.; Mol, J.; Koes, R. ANTHOCYANIN1 of Petunia Controls Pigment Synthesis, Vacuolar pH, and Seed Coat Development by Genetically Distinct Mechanisms. Plant Cell 2002, 14, 2121–2135. [Google Scholar] [CrossRef] [Scilit] [PubMed]
- van Doorn, W.G.; Woltering, E.J. Physiology and molecular biology of petal senescence. J. Exp. Bot. 2008, 59, 453–480. [Google Scholar] [CrossRef] [Scilit] [PubMed]
- Michal Oren-Shamir, M.O.; Gal Dela, G.D.; Rinat Ovadia, R.O.; Ada Nissim-Levi, A.N.; Sonia Philosoph-Hadas, S.P.; Shimon Meir, S.M. Differentiation between petal blueing and senescence of cut ‘Mercedes’ rose flowers. J. Hortic. Sci. Biotechnol. 2015, 76, 195–200. [Google Scholar] [CrossRef] [Scilit]
- Schmitzer, V.; Veberic, R.; Osterc, G.; Stampar, F. Color and Phenolic Content Changes during Flower Development in Groundcover Rose. J. Am. Soc. Hortic. Sci. 2010, 135, 195–202. [Google Scholar] [CrossRef] [Scilit]
- Rasouli, O.; Ahmadi, N.; Rashidi Monfared, S. Molecular characterization and expression pattern of RhPAR, RhMYB1 and RhANS genes involving in scent and color production in Rosa damascena. Sci. Hortic. 2020, 272, 109399. [Google Scholar] [CrossRef] [Scilit]
- Vaknin, H.; Bar-Akiva, A.; Ovadia, R.; Nissim-Levi, A.; Forer, I.; Weiss, D.; Oren-Shamir, M. Active anthocyanin degradation in Brunfelsia calycina (yesterday–today–tomorrow) flowers. Planta 2005, 222, 19–26. [Google Scholar] [CrossRef] [Scilit] [PubMed]
- Chan, E.W.C.; Wong, S.K.; Chan, H.T. A Review on the Phytochemistry and Pharmacology of two Hibiscus Species with Spectacular Flower Colour Change: H. tiliaceus and H. mutabilis. Int. J. Pharmacogn. Phytochem. Res. 2016, 8, 1200–1208. [Google Scholar]
- Kim, J.H.; Okubo, H.; Fujieda, K.; Uemoto, S. Changes of Petal Colors during Senescence in Hibiscus syriacus. J. Fat. Agr. Kyushu Univ. 1989, 33, 259–265. [Google Scholar] [CrossRef] [Scilit] [PubMed]
- Ketsa, S.; Rugkong, A. Senescence of Dendrobium ‘Pompadour’ flowers following pollination. J. Hortic. Sci. Biotechnol. 2015, 74, 608–613. [Google Scholar] [CrossRef] [Scilit]
- Ma, N.; Ma, C.; Liu, Y.; Shahid, M.O.; Wang, C.; Gao, J. Petal Senescence: A Hormone View. J. Exp. Bot. 2018, 69, 719–732. [Google Scholar] [CrossRef] [Scilit] [PubMed]
- Savin, K.W.; Baudinette, S.C.; Graham, M.W.; Michael, M.Z.; Nugent, G.D.; Lu, C.-Y.; Chandler, S.F.; Cornish, E.C. Antisense ACC Oxidase RNA Delays Carnation Petal Senescence. Hortscience 1995, 30, 970–972. [Google Scholar] [CrossRef] [Scilit]
- Trivellini, A.; Vernieri, P.; Ferrante, A.; Serra, G. Physiological Characterization of Flower Senescence in Long Life and Ephemeral Hibiscus (Hibiscus rosa-sinensis L.). In ISHS Acta Horticulturae 755: International Conference on Quality Management in Supply Chains of Ornamentals; International Society for Horticultural Science (ISHS): Leuven, Belgium, 2007; pp. 457–464. [Google Scholar] [CrossRef] [Scilit]
- Wojciechowska, N.; Sobieszczuk-Nowicka, E.; Bagniewska-Zadworna, A.; Weber, A. Plant organ senescence-regulation by manifold pathways. Plant Biol. 2018, 20, 167–181. [Google Scholar] [CrossRef] [Scilit] [PubMed]
- Abdoalla, H. Efficiency of salicylic acid delay petal senescence and extended quality of cut spikes of Gladiolus grandiflora cv ‘wing’s sensation’. Afr. J. Agric. Res. 2012, 7, 540–545. [Google Scholar] [CrossRef] [Scilit]
- Ferrante, A.; Vernieri, P.; Tognoni, F.; Serra, G. Changes in abscisic acid and flower pigments during floral senescence of petunia. Biol. Plant. 2006, 50, 581–585. [Google Scholar] [CrossRef] [Scilit]
- Jones, M.L.; Larsen, P.B.; Woodson, W.R. Ethylene-regulated expression of a carnation cysteine proteinase during flower petal senescence. Plant Mol. Biol. 1995, 28, 505–512. [Google Scholar] [CrossRef] [Scilit] [PubMed]
- Khunmuang, S.; Kanlayanarat, S.; Wongs-Aree, C.; Meir, S.; Philosoph-Hadas, S.; Oren-Shamir, M.; Ovadia, R.; Buanong, M. Ethylene Induces a Rapid Degradation of Petal Anthocyanins in Cut Vanda ‘Sansai Blue’ Orchid Flowers. Front. Plant Sci. 2019, 10, 1004. [Google Scholar] [CrossRef] [Scilit] [PubMed]
- Lü, P.; Zhang, C.; Liu, J.; Liu, X.; Jiang, G.; Jiang, X.; Khan, M.A.; Wang, L.; Hong, B.; Gao, J. RhHB1 mediates the antagonism of gibberellins to ABA and ethylene during rose (Rosa hybrida) petal senescence. Plant J. 2014, 78, 578–590. [Google Scholar] [CrossRef] [Scilit] [PubMed]
- Reid, M.S.; Wu, M.-J. Ethylene and flower senescence. Plant Growth Regul. 1992, 11, 37–43. [Google Scholar] [CrossRef] [Scilit]
- Rogers, H.J. From models to ornamentals: How is flower senescence regulated? Plant Mol. Biol. 2012, 82, 563–574. [Google Scholar] [CrossRef] [Scilit] [PubMed]
- Wang, H.; Chang, X.; Lin, J.; Chang, Y.; Chen, J.-C.; Reid, M.S.; Jiang, C.-Z. Transcriptome profiling reveals regulatory mechanisms underlying corolla senescence in petunia. Hortic. Res. 2018, 5, 16. [Google Scholar] [CrossRef] [Scilit] [PubMed]
- Bahrami, S.N.; Zakizadeh, H.; Hamidoghli, Y.; Ghasemnezhad, M. Salicylic acid retards petal senescence in cut lisianthus (Eustoma grandiflorum ‘Miarichi Grand White’) flowers. Hortic. Environ. Biotechnol. 2014, 54, 519–523. [Google Scholar] [CrossRef] [Scilit]
- Gerailoo, S.; Ghasemnezhad, M. Effect of Salicylic Acid on Antioxidant Enzyme Activity and Petal Senescence in ‘Yellow is Land’ Cut Rose Flowers. J. Fruit Ornam. Plant Res. 2011, 19, 183–193. [Google Scholar] [CrossRef] [Scilit] [PubMed]
- Kazemi, M.; Hadavi, E.; Hekmati, J. Role of Salicylic Acid in Decreases of Membrane Senescence in Cut Carnation Flowers. Am. J. Plant Physiol. 2011, 6, 106–112. [Google Scholar] [CrossRef] [Scilit]
- Singh, A.K.; Barman, K.; Sisodia, A.; Pal, A.; Padhi, M.; Saurabh, V. Effect of salicylic acid and nitric oxide on postharvest quality and senescence of cut gerbera flowers. J. Pharmacogn. Phytochem. 2018, 7, 715–719. [Google Scholar]
- Zhang, S.; Zhao, Q.; Zeng, D.; Xu, J.; Zhou, H.; Wang, F.; Ma, N.; Li, Y. RhMYB108, an R2R3-MYB transcription factor, is involved in ethylene- and JA-induced petal senescence in rose plants. Hortic. Res. 2019, 6, 131. [Google Scholar] [CrossRef] [Scilit] [PubMed]
- Zhou, C.; Zhu, C.; Tian, C.; Xie, S.; Xu, K.; Huang, L.; Wen, S.; Zhang, C.; Lai, Z.; Lin, Y.; et al. The chromosome-scale genome assembly of Jasminum sambac var. unifoliatum provides insights into the formation of floral fragrance. Hortic. Plant J. 2023, 9, 1131–1148. [Google Scholar] [CrossRef] [Scilit]
- Li, Y.-H.; Zhang, W.; Li, Y. Transcriptomic Analysis of Flower Blooming in Jasminum sambac through De Novo RNA Sequencing. Molecules 2015, 20, 10734–10747. [Google Scholar] [CrossRef] [Scilit] [PubMed]
- Zhou, C.; Zhu, C.; Tian, C.; Xu, K.; Huang, L.; Shi, B.; Lai, Z.; Lin, Y.; Guo, Y. Integrated volatile metabolome, multi-flux full-length sequencing, and transcriptome analyses provide insights into the aroma formation of postharvest jasmine (Jasminum sambac) during flowering. Postharvest Biol. Technol. 2022, 183, 111726. [Google Scholar] [CrossRef] [Scilit]
- Guo, L.; Wang, Y.; da Silva, J.A.T.; Fan, Y.; Yu, X. Transcriptome and chemical analysis reveal putative genes involved in flower color change in Paeonia ‘Coral Sunset’. Plant Physiol. Biochem. 2019, 138, 130–139. [Google Scholar] [CrossRef] [Scilit] [PubMed]
- Yin, X.; Lin, X.; Liu, Y.; Irfan, M.; Chen, L.; Zhang, L. Integrated metabolic profiling and transcriptome analysis of pigment accumulation in diverse petal tissues in the lily cultivar ‘Vivian’. BMC Plant Biol. 2020, 20, 446. [Google Scholar] [CrossRef] [Scilit] [PubMed]
- Xia, Y.; Chen, W.; Xiang, W.; Wang, D.; Xue, B.; Liu, X.; Xing, L.; Wu, D.; Wang, S.; Guo, Q.; et al. Integrated metabolic profiling and transcriptome analysis of pigment accumulation in Lonicera japonica flower petals during colour-transition. BMC Plant Biol. 2021, 21, 98. [Google Scholar] [CrossRef] [Scilit] [PubMed]
- Zhang, S.; Zhan, W.; Sun, A.; Xie, Y.; Han, Z.; Qu, X.; Wang, J.; Zhang, L.; Tian, M.; Pang, X.; et al. Combined transcriptome and metabolome integrated analysis of Acer mandshuricum to reveal candidate genes involved in anthocyanin accumulation. Sci. Rep. 2021, 11, 23148. [Google Scholar] [CrossRef] [Scilit] [PubMed]
- Gunasekaran, D.; Tahir, N.I.; Akbar, M.A.; Basir, S.; Ismail, I.; Talip, N.; Ramzi, A.B.; Baharum, S.N.; Noor, N.M.; Bunawan, H. Discovery of Anthocyanin Biosynthetic Pathway in Cosmos caudatus Kunth. Using Omics Analysis. Agron. 2021, 11, 661. [Google Scholar] [CrossRef] [Scilit]
- Khaskheli, A.J.; Ahmed, W.; Ma, C.; Zhang, S.; Liu, Y.; Li, Y.; Zhou, X.; Gao, J. RhERF113 Functions in Ethylene-Induced Petal Senescence by Modulating Cytokinin Content in Rose. Plant Cell Physiol. 2018, 59, 2442–2451. [Google Scholar] [CrossRef] [Scilit] [PubMed]
- Reeves, P.H.; Ellis, C.M.; Ploense, S.E.; Wu, M.-F.; Yadav, V.; Tholl, D.; Chételat, A.C.; Haupt, I.; Kennerley, B.J.; Hodgens, C.; et al. A Regulatory Network for Coordinated Flower Maturation. PLoS Genet. 2012, 8, e1002506. [Google Scholar] [CrossRef] [Scilit] [PubMed]
- Shibuya, K. Molecular Mechanisms of Petal Senescence in Ornamental Plants. J. Jpn. Soc. Hort. Sci. 2012, 81, 140–149. [Google Scholar] [CrossRef] [Scilit]
- Tripathi, S.K.; Tuteja, N. Integrated Signaling in Flower Senescence. Plant Signal. Behav. 2014, 2, 437–445. [Google Scholar] [CrossRef] [Scilit] [PubMed]
- Tsanakas, G.F.; Manioudaki, M.E.; Economou, A.S.; Kalaitzis, P. De novo transcriptome analysis of petal senescence in Gardenia jasminoides Ellis. BMC Genom. 2014, 15, 554. [Google Scholar] [CrossRef] [Scilit] [PubMed]
- Zhu, J.; Yan, X.; Liu, S.; Xia, X.; An, Y.; Xu, Q.; Zhao, S.; Liu, L.; Guo, R.; Zhang, Z.; et al. Alternative splicing of CsJAZ1 negatively regulates flavan-3-ol biosynthesis in tea plants. Plant J. 2022, 110, 243–261. [Google Scholar] [CrossRef] [Scilit] [PubMed]
- Hao, X.; Pu, Z.; Cao, G.; You, D.; Zhou, Y.; Deng, C.; Shi, M.; Nile, S.H.; Wang, Y.; Zhou, W.; et al. Tanshinone and salvianolic acid biosynthesis are regulated by SmMYB98 in Salvia miltiorrhiza hairy roots. J. Adv. Res. 2020, 23, 1–12. [Google Scholar] [CrossRef] [Scilit] [PubMed]
- Zhou, W.; Shi, M.; Deng, C.; Lu, S.; Huang, F.; Wang, Y.; Kai, G. The methyl jasmonate-responsive transcription factor SmMYB1 promotes phenolic acid biosynthesis in Salvia miltiorrhiza. Hortic. Res. 2021, 8, 10. [Google Scholar] [CrossRef] [Scilit] [PubMed]
- Tanaka, Y.; Ohmiya, A. Seeing is believing: Engineering anthocyanin and carotenoid biosynthetic pathways. Curr. Opin. Biotechnol. 2008, 19, 190–197. [Google Scholar] [CrossRef] [Scilit] [PubMed]
- Allan, A.C.; Espley, R.V. MYBs Drive Novel Consumer Traits in Fruits and Vegetables. Trends Plant Sci. 2018, 23, 693–705. [Google Scholar] [CrossRef] [Scilit] [PubMed]
- Fang, J.; Zhuang, Y.; Wang, J.; Lin, Y.; Lan, T.; Huang, X. Beyond the single reference: Pangenomic perspective on WRKY structural diversity and its role in trait adaptation across Oleaceae. Ann. Bot. 2026, 137, 2041–2054. [Google Scholar] [CrossRef] [Scilit] [PubMed]
- Lu, Z.; Wang, X.; Mostafa, S.; Noor, I.; Lin, X.; Ren, S.; Cui, J.; Jin, B. WRKY Transcription Factors in Jasminum sambac: An Insight into the Regulation of Aroma Synthesis. Biomolecules 2023, 13, 1679. [Google Scholar] [CrossRef] [Scilit] [PubMed]
- Cong, L.; Qu, Y.; Sha, G.; Zhang, S.; Ma, Y.; Chen, M.; Zhai, R.; Yang, C.; Xu, L.; Wang, Z. PbWRKY75 promotes anthocyanin synthesis by activating PbDFR, PbUFGT, and PbMYB10b in pear. Physiol. Plant. 2021, 173, 1841–1849. [Google Scholar] [CrossRef] [Scilit] [PubMed]
- Duan, S.; Wang, J.; Gao, C.; Jin, C.; Li, D.; Peng, D.; Du, G.; Li, Y.; Chen, M. Functional characterization of a heterologously expressed Brassica napus WRKY41-1 transcription factor in regulating anthocyanin biosynthesis in Arabidopsis thaliana. Plant Sci. 2018, 268, 47–53. [Google Scholar] [CrossRef] [Scilit] [PubMed]
- Xu, L.; Jin, L.; Long, L.; Liu, L.; He, X.; Gao, W.; Zhu, L.; Zhang, X. Overexpression of GbWRKY1 positively regulates the Pi starvation response by alteration of auxin sensitivity in Arabidopsis. Plant Cell Rep. 2012, 31, 2177–2188. [Google Scholar] [CrossRef] [Scilit] [PubMed]
- An, J.P.; Zhang, X.W.; You, C.X.; Bi, S.Q.; Wang, X.F.; Hao, Y.J. MdWRKY40 promotes wounding-induced anthocyanin biosynthesis in association with MdMYB1 and undergoes MdBT2-mediated degradation. New Phytol. 2019, 224, 380–395. [Google Scholar] [CrossRef] [Scilit] [PubMed]
- Hu, J.; Fang, H.; Wang, J.; Yue, X.; Su, M.; Mao, Z.; Zou, Q.; Jiang, H.; Guo, Z.; Yu, L.; et al. Ultraviolet B-induced MdWRKY72 expression promotes anthocyanin synthesis in apple. Plant Sci. 2020, 292, 110377. [Google Scholar] [CrossRef] [Scilit] [PubMed]
- Liu, W.; Wang, Y.; Yu, L.; Jiang, H.; Guo, Z.; Xu, H.; Jiang, S.; Fang, H.; Zhang, J.; Su, M.; et al. MdWRKY11 Participates in Anthocyanin Accumulation in Red-Fleshed Apples by Affecting MYB Transcription Factors and the Photoresponse Factor MdHY5. J. Agric. Food Chem. 2019, 67, 8783–8793. [Google Scholar] [CrossRef] [Scilit] [PubMed]
- Mao, Z.; Jiang, H.; Wang, S.; Wang, Y.; Yu, L.; Zou, Q.; Liu, W.; Jiang, S.; Wang, N.; Zhang, Z.; et al. The MdHY5-MdWRKY41-MdMYB transcription factor cascade regulates the anthocyanin and proanthocyanidin biosynthesis in red-fleshed apple. Plant Sci. 2021, 306, 110848. [Google Scholar] [CrossRef] [Scilit] [PubMed]
- Wang, N.; Liu, W.; Zhang, T.; Jiang, S.; Xu, H.; Wang, Y.; Zhang, Z.; Wang, C.; Chen, X. Transcriptomic Analysis of Red-Fleshed Apples Reveals the Novel Role of MdWRKY11 in Flavonoid and Anthocyanin Biosynthesis. J. Agric. Food Chem. 2018, 66, 7076–7086. [Google Scholar] [CrossRef] [Scilit] [PubMed]
- Zhang, J.; Wang, Y.; Mao, Z.; Liu, W.; Ding, L.; Zhang, X.; Yang, Y.; Wu, S.; Chen, X.; Wang, Y. Transcription factor McWRKY71 induced by ozone stress regulates anthocyanin and proanthocyanidin biosynthesis in Malus crabapple. Ecotoxicol. Environ. Saf. 2022, 232, 113274. [Google Scholar] [CrossRef] [Scilit] [PubMed]
- Zhang, T.; Xu, H.; Yang, G.; Wang, N.; Zhang, J.; Wang, Y.; Jiang, S.; Fang, H.; Zhang, Z.; Chen, X. Molecular mechanism of MYB111 and WRKY40 involved in anthocyanin biosynthesis in red-fleshed apple callus. Plant Cell Tissue Organ Cult. 2019, 139, 467–478. [Google Scholar] [CrossRef] [Scilit]
- Li, C.; Wu, J.; Hu, K.-D.; Wei, S.-W.; Sun, H.-Y.; Hu, L.-Y.; Han, Z.; Yao, G.-F.; Zhang, H. PyWRKY26 and PybHLH3 cotargeted the PyMYB114 promoter to regulate anthocyanin biosynthesis and transport in red-skinned pears. Hortic. Res. 2020, 7, 37. [Google Scholar] [CrossRef] [Scilit] [PubMed]
- Li, D.; Wang, Z.; Sun, S.; Xiao, K.; Cao, M.; Li, X.; Ma1, C.; Zhang, C.; Wang, L.; Lian, H.; et al. VvMYB15 and VvWRKY40 Positively Co-regulated Anthocyanin Biosynthesis in Grape Berries in Response to Root Restriction. Front. Plant Sci. 2021, 12, 789002. [Google Scholar] [CrossRef] [Scilit] [PubMed]
- Li, J.; Brader, G.; Kariola, T.; Tapio Palva, E. WRKY70 modulates the selection of signaling pathways in plant defense. Plant J. 2006, 46, 477–491. [Google Scholar] [CrossRef] [Scilit] [PubMed]
- Liu, C.; Yao, X.; Li, G.; Huang, L.; Xie, Z. Transcriptomic profiling of purple broccoli reveals light-induced anthocyanin biosynthetic signaling and structural genes. PeerJ 2020, 8, e8870. [Google Scholar] [CrossRef] [Scilit] [PubMed]
- Kim, J.; Lee, S.H.; Ryu, J.; Kim, J.H.; Kim, D.-G.; Kim, W.J.; Ha, T.H.; Kim, S.H. Deciphering differentially expressed genes and a flavonoid analysis reveal that the metabolic flux shift of flavonoids lightens flower coloration in γ-irradiation-induced Dendrobium hybrid mutants. BMC Plant Biol. 2026, 26, 832. [Google Scholar] [CrossRef] [Scilit] [PubMed]
- Zhang, Y.; Pu, Y.; Zhang, Y.; Li, K.; Bai, S.; Wang, J.; Xu, M.; Liu, S.; Zhou, Z.; Wu, Y.; et al. Tuber transcriptome analysis reveals a novel WRKY transcription factor StWRKY70 potentially involved in potato pigmentation. Plant Physiol. Biochem. 2024, 213, 108792. [Google Scholar] [CrossRef] [Scilit] [PubMed]
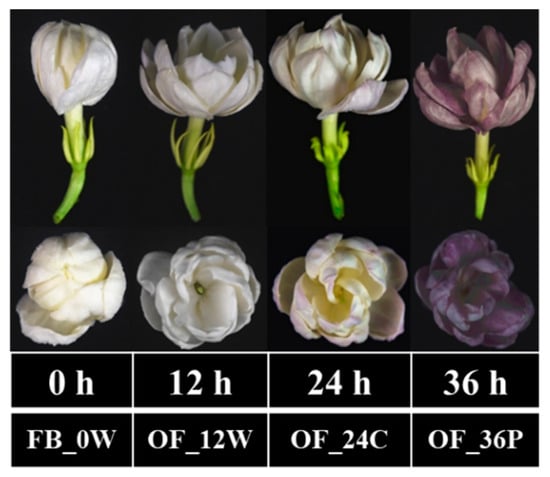
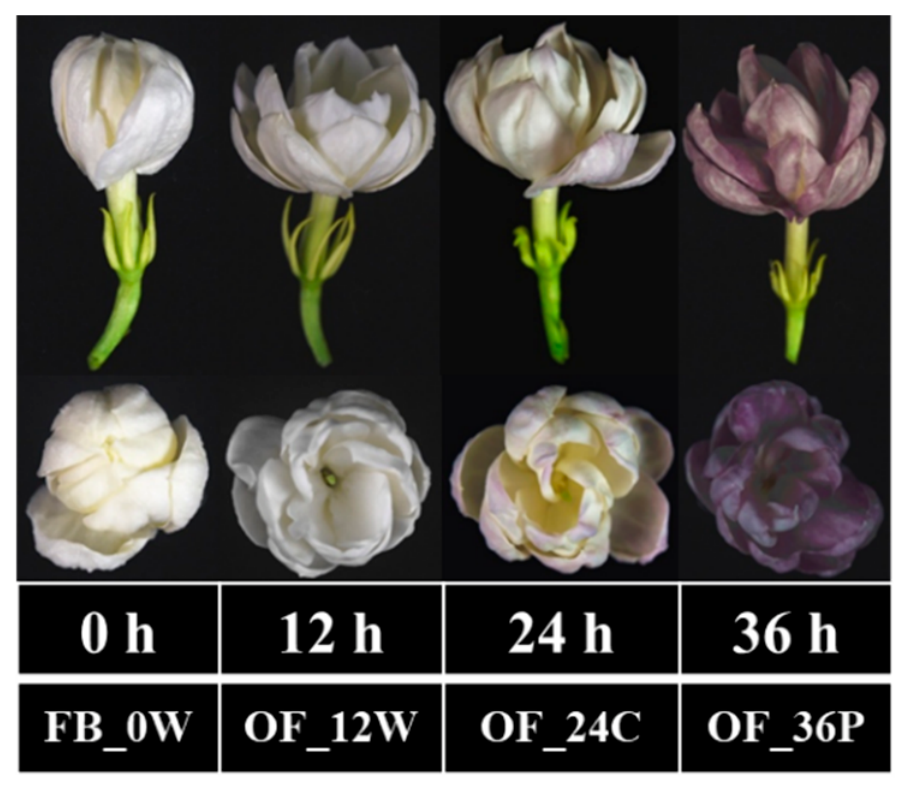
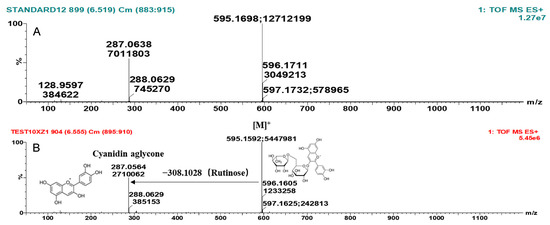
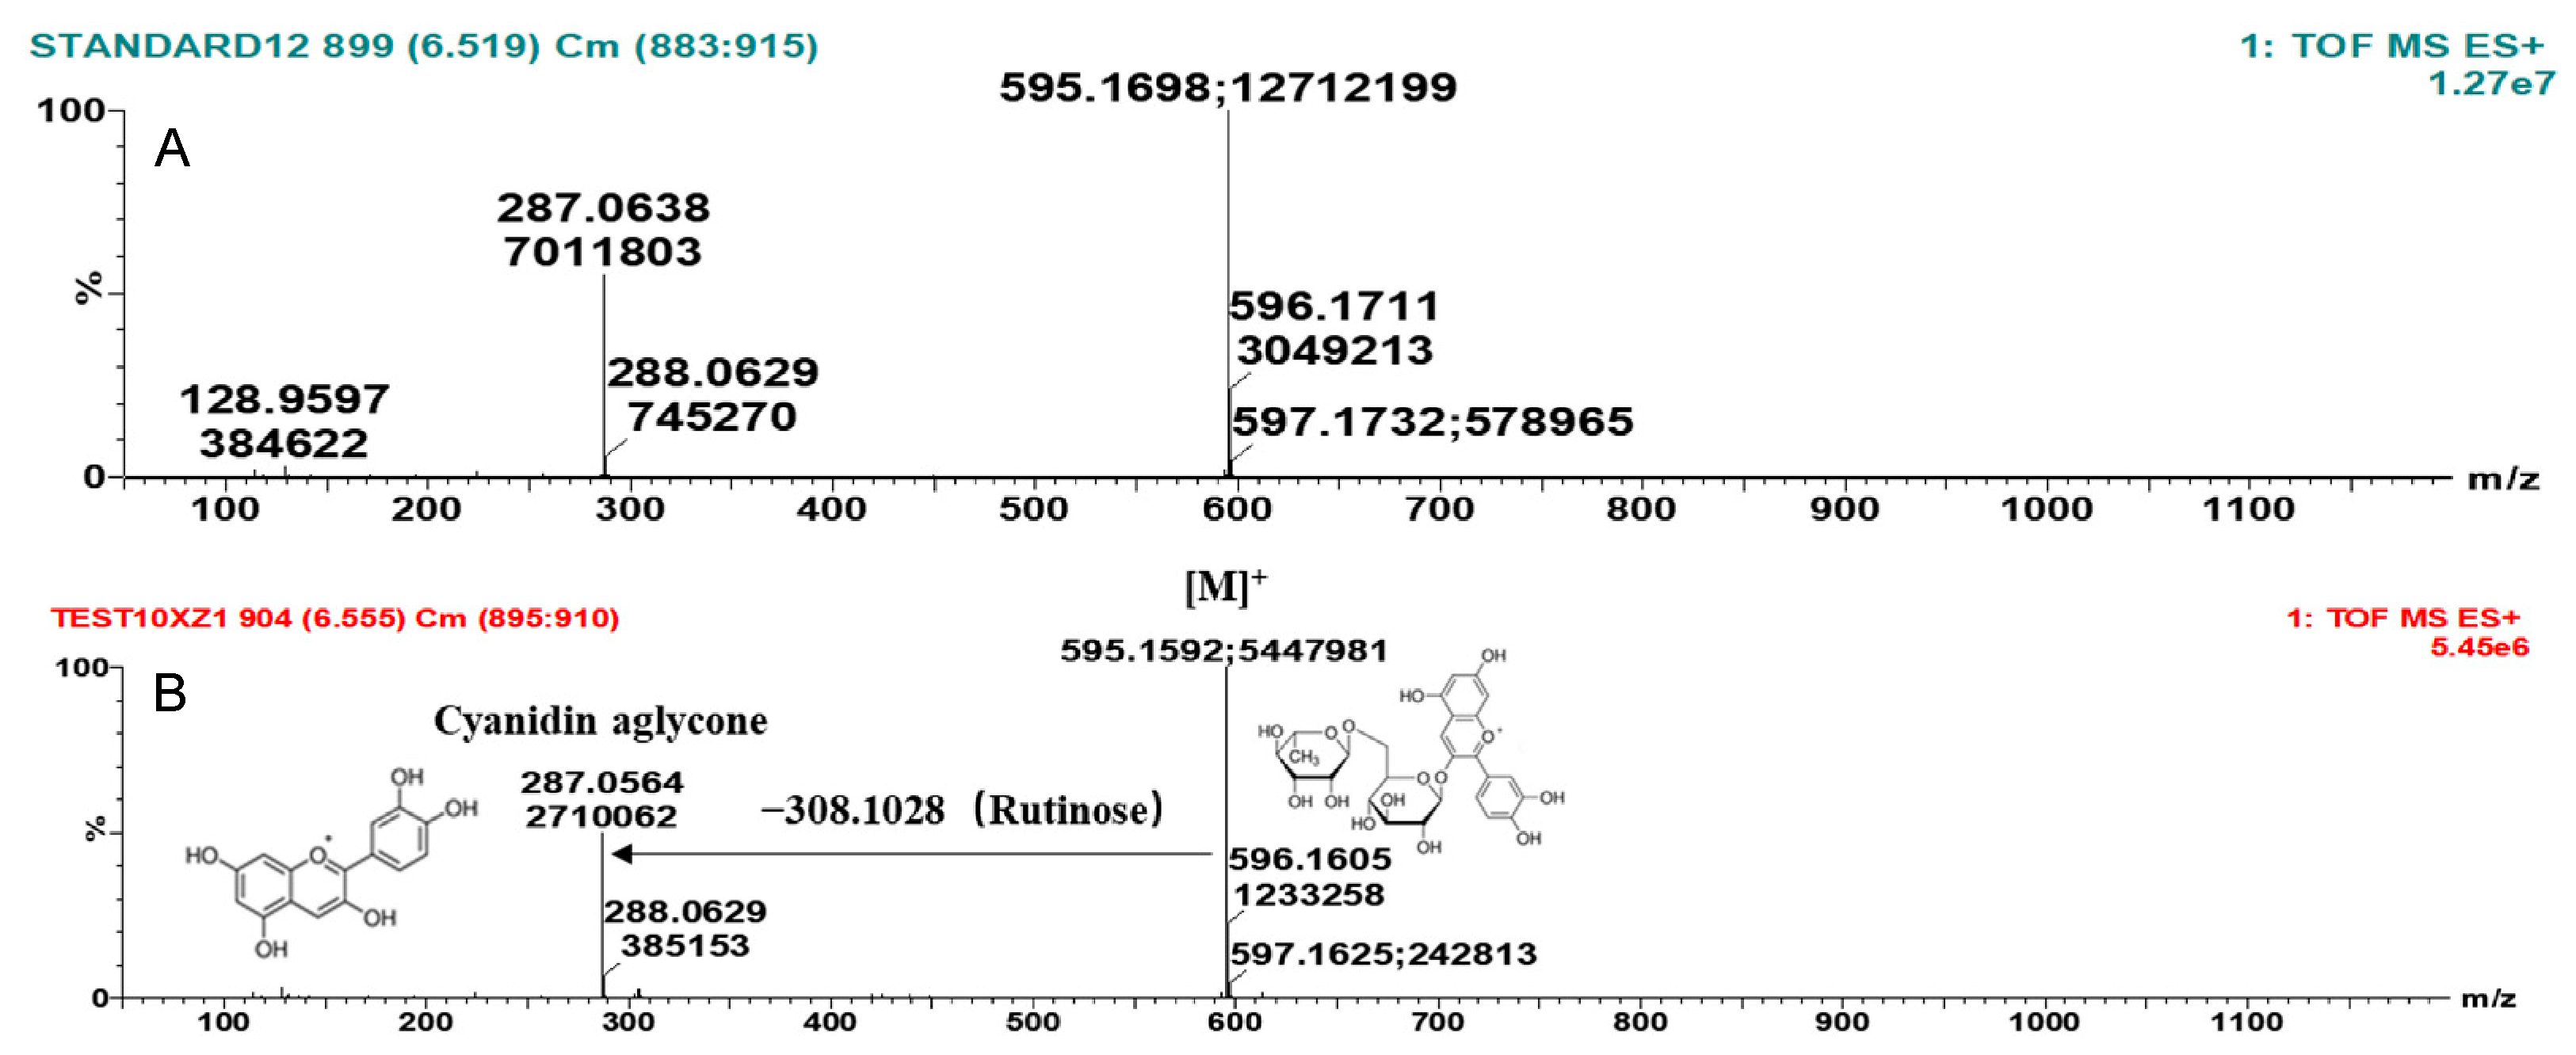
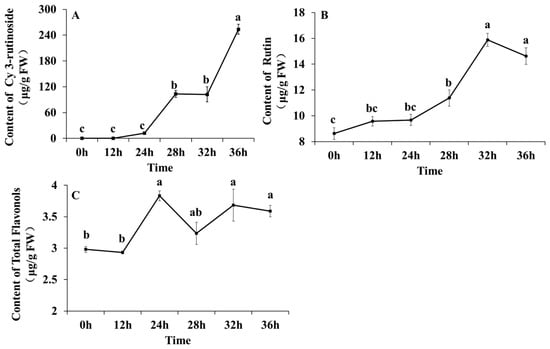
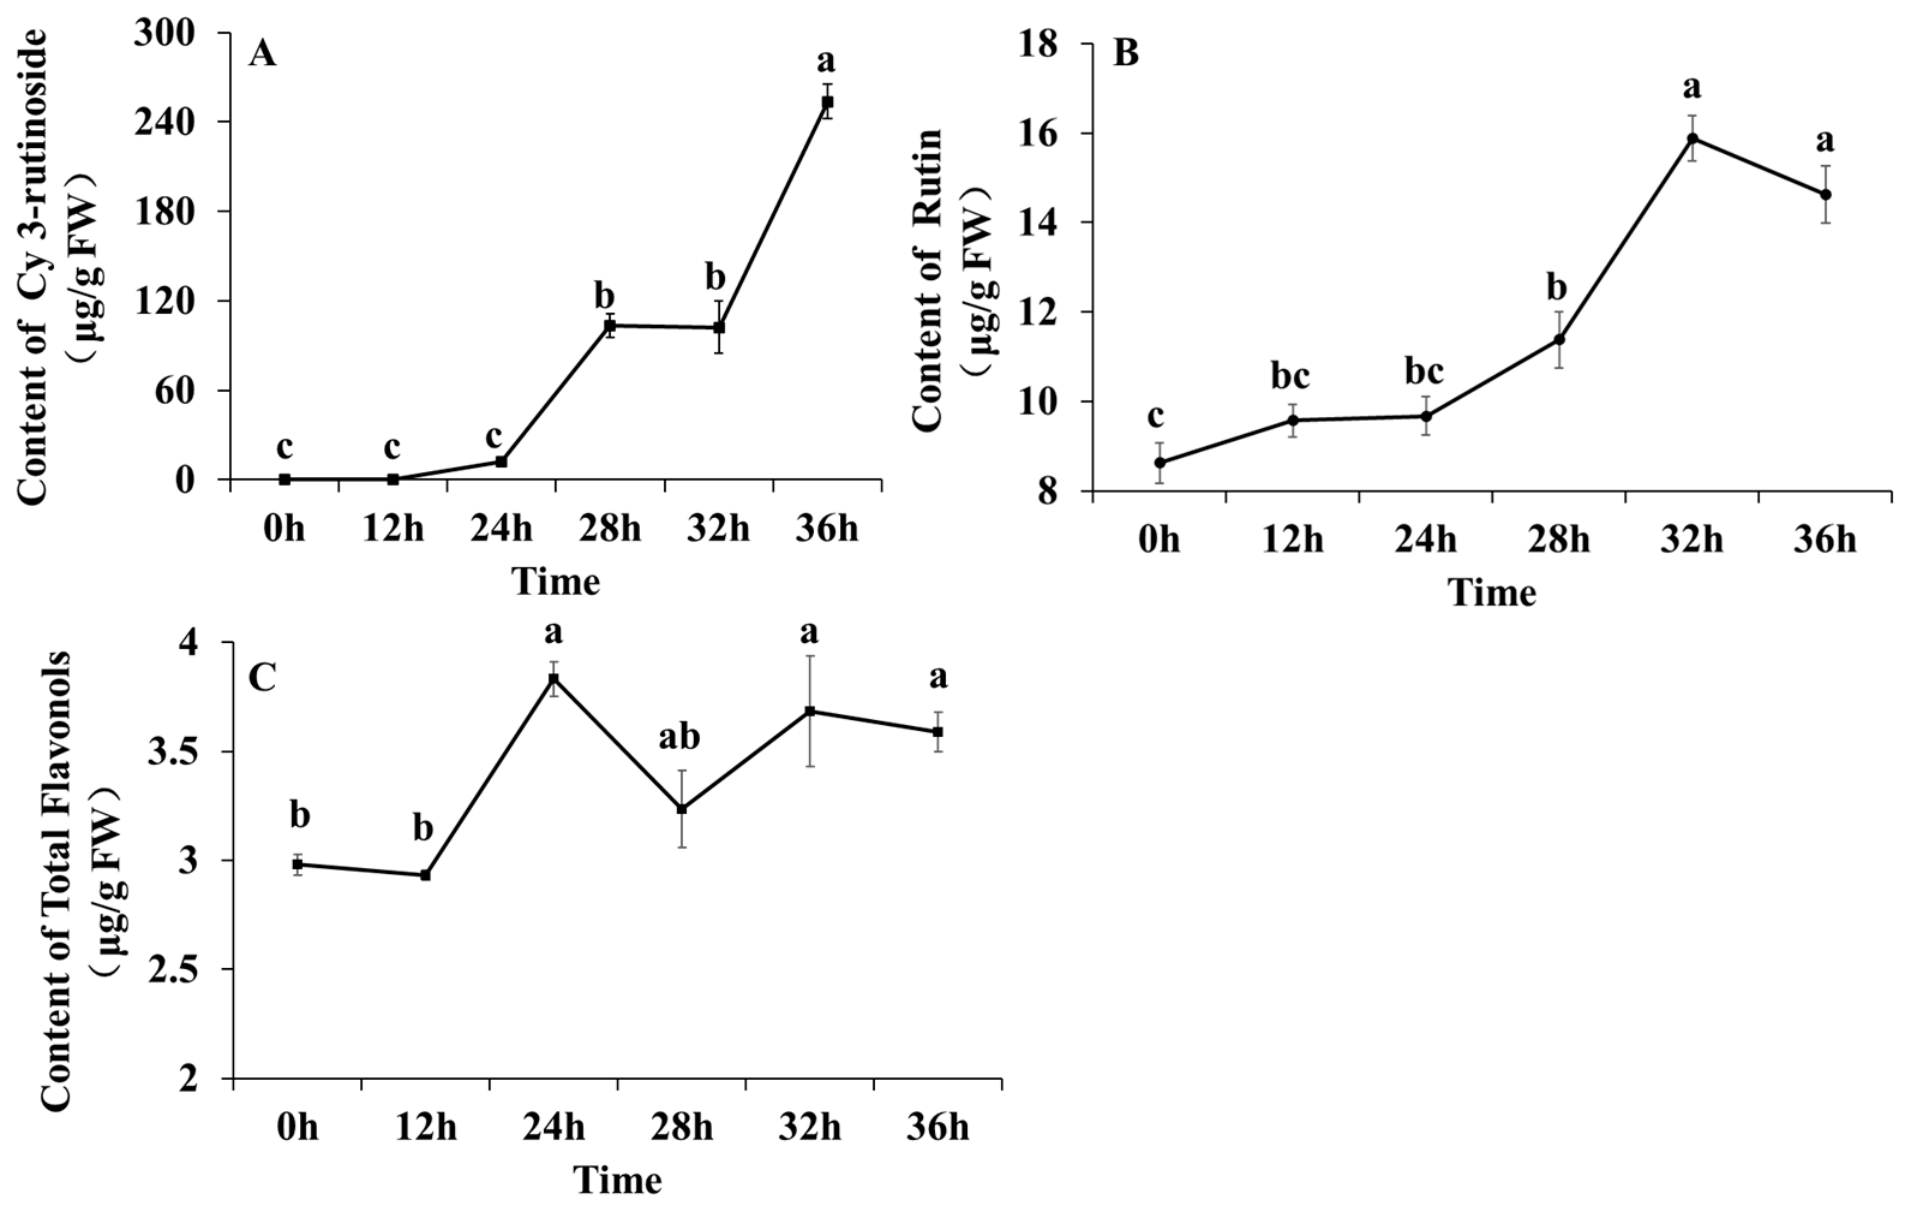
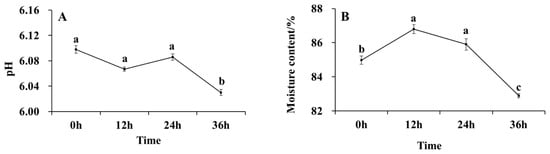
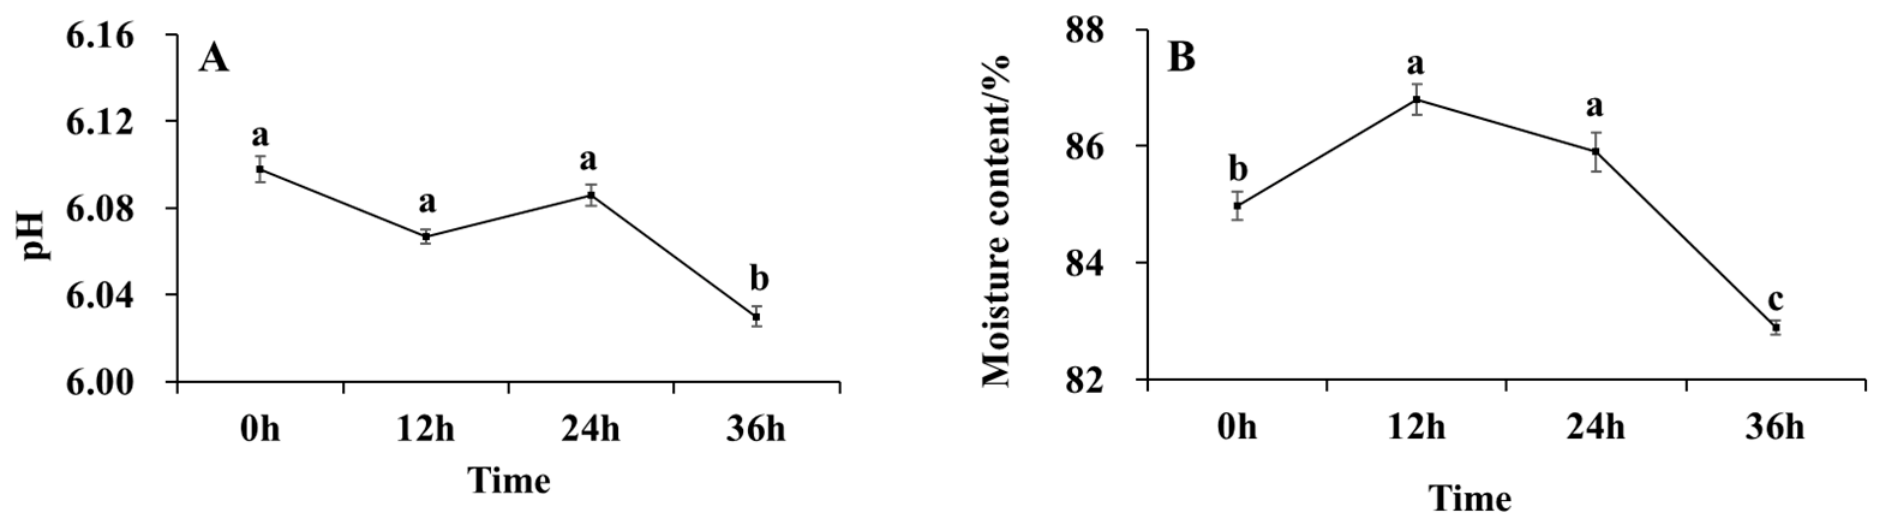
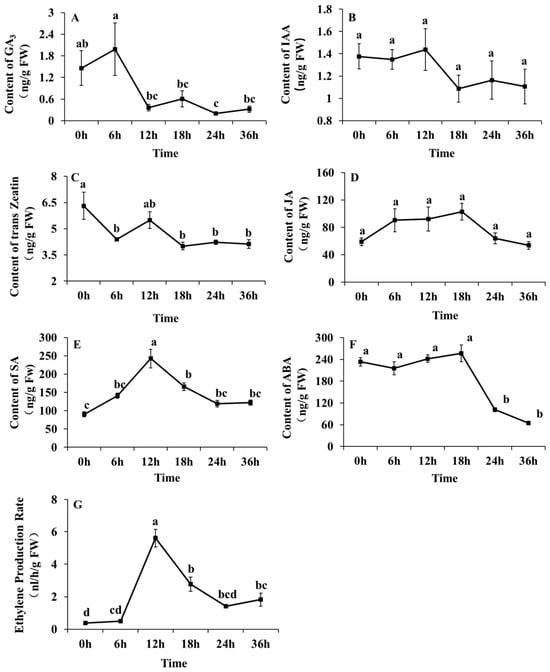
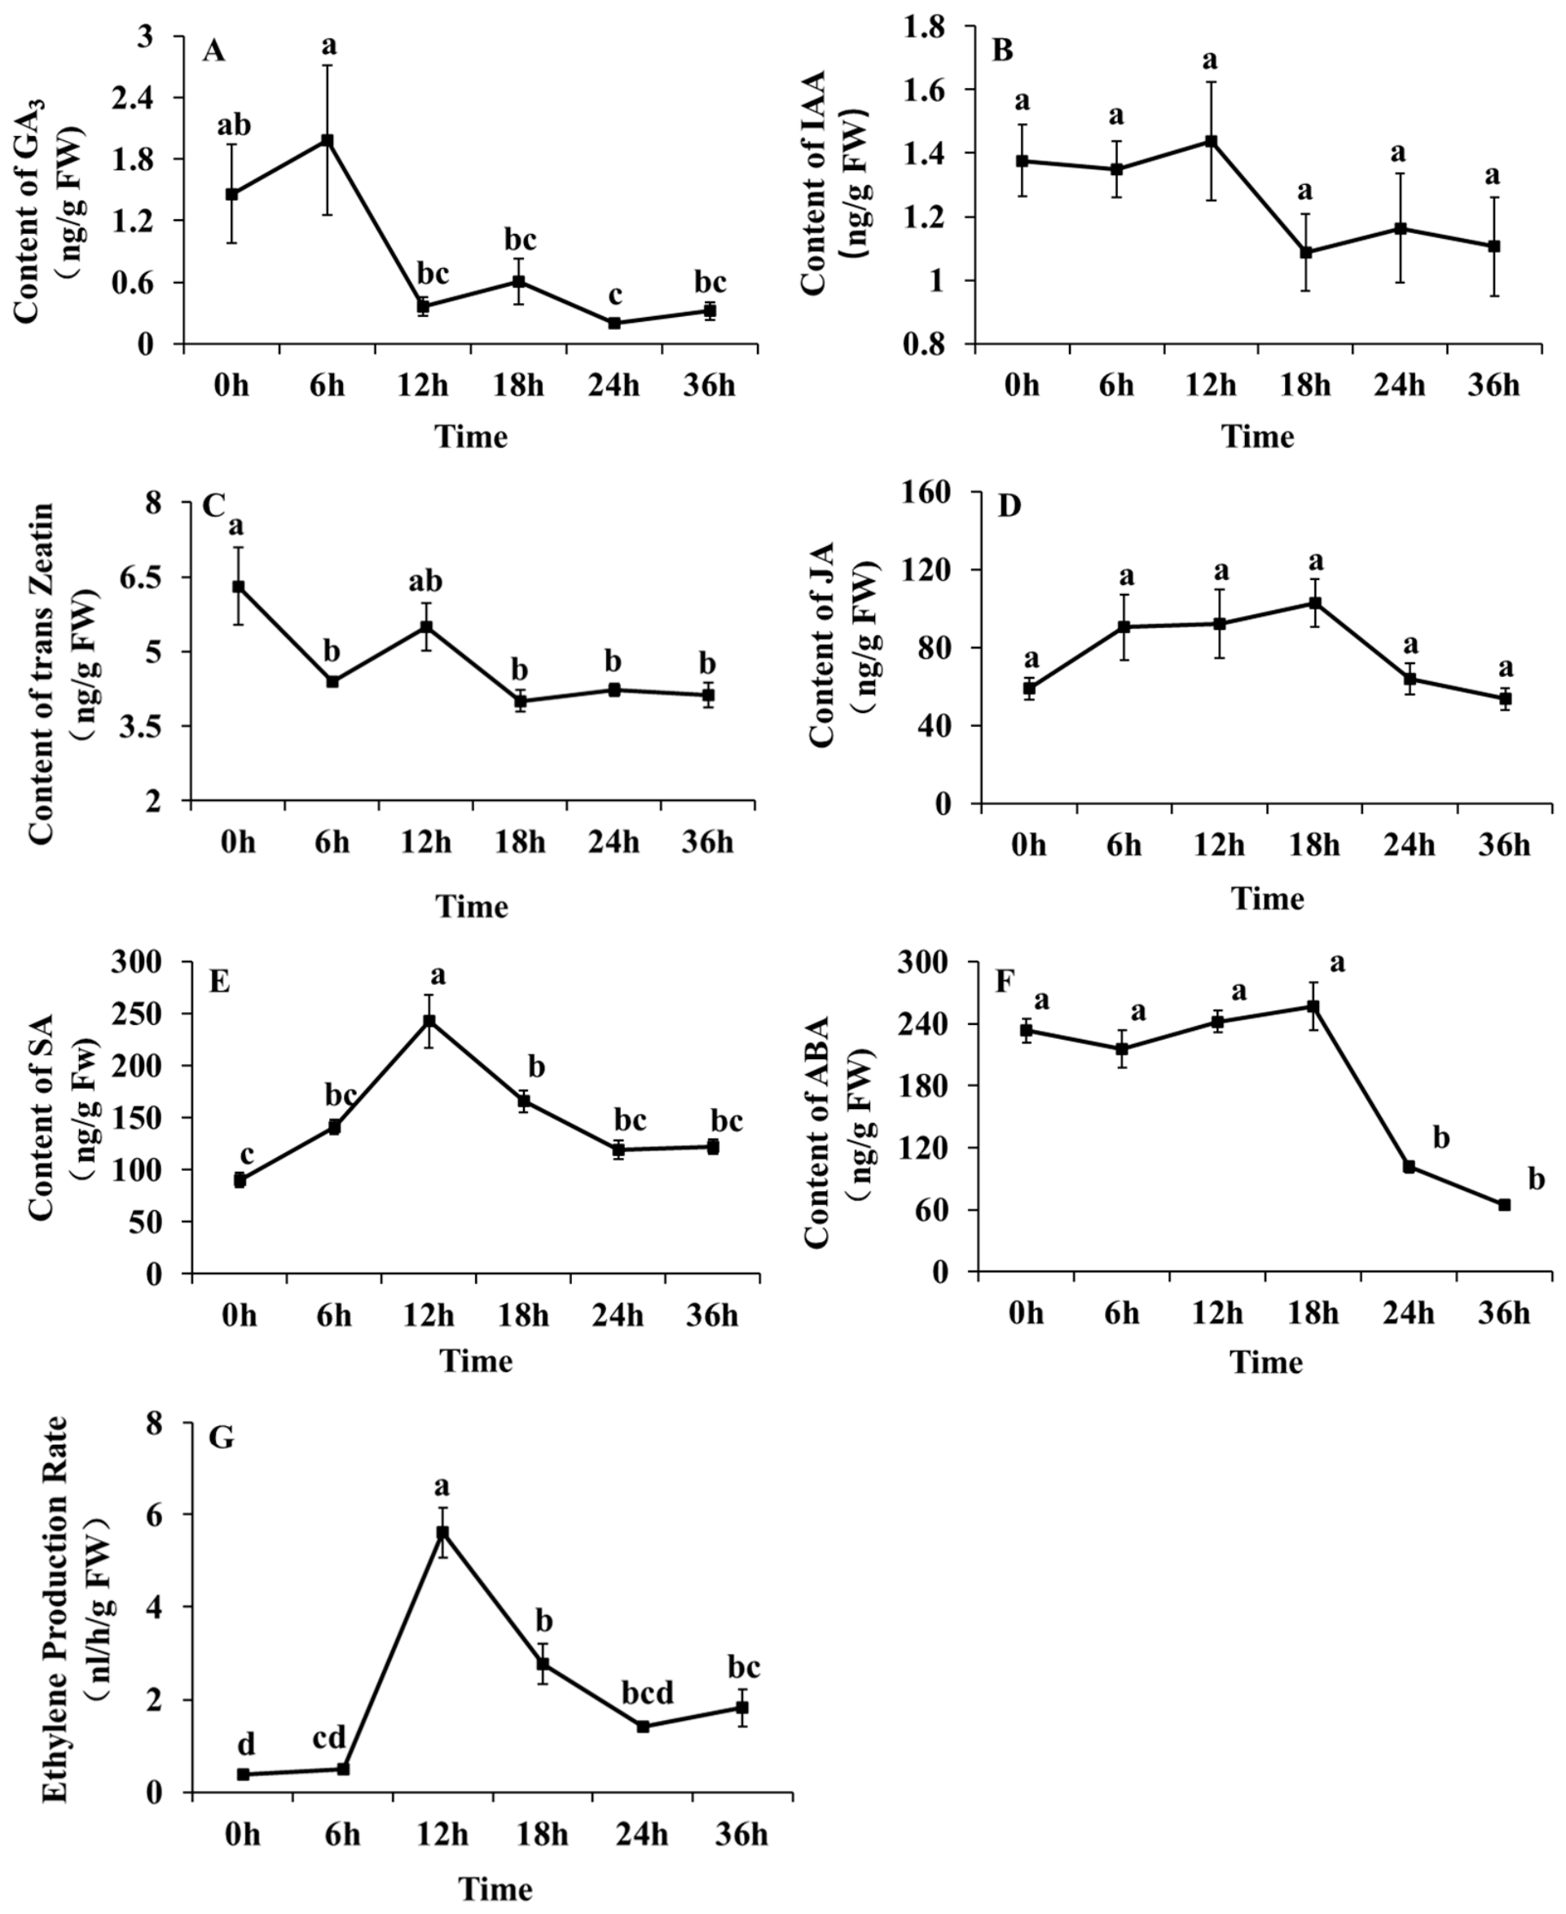
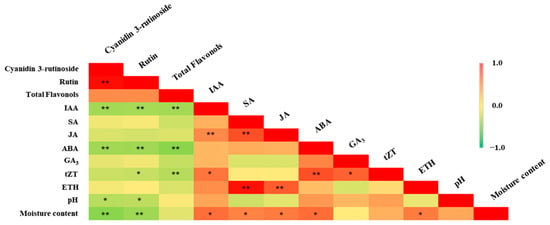
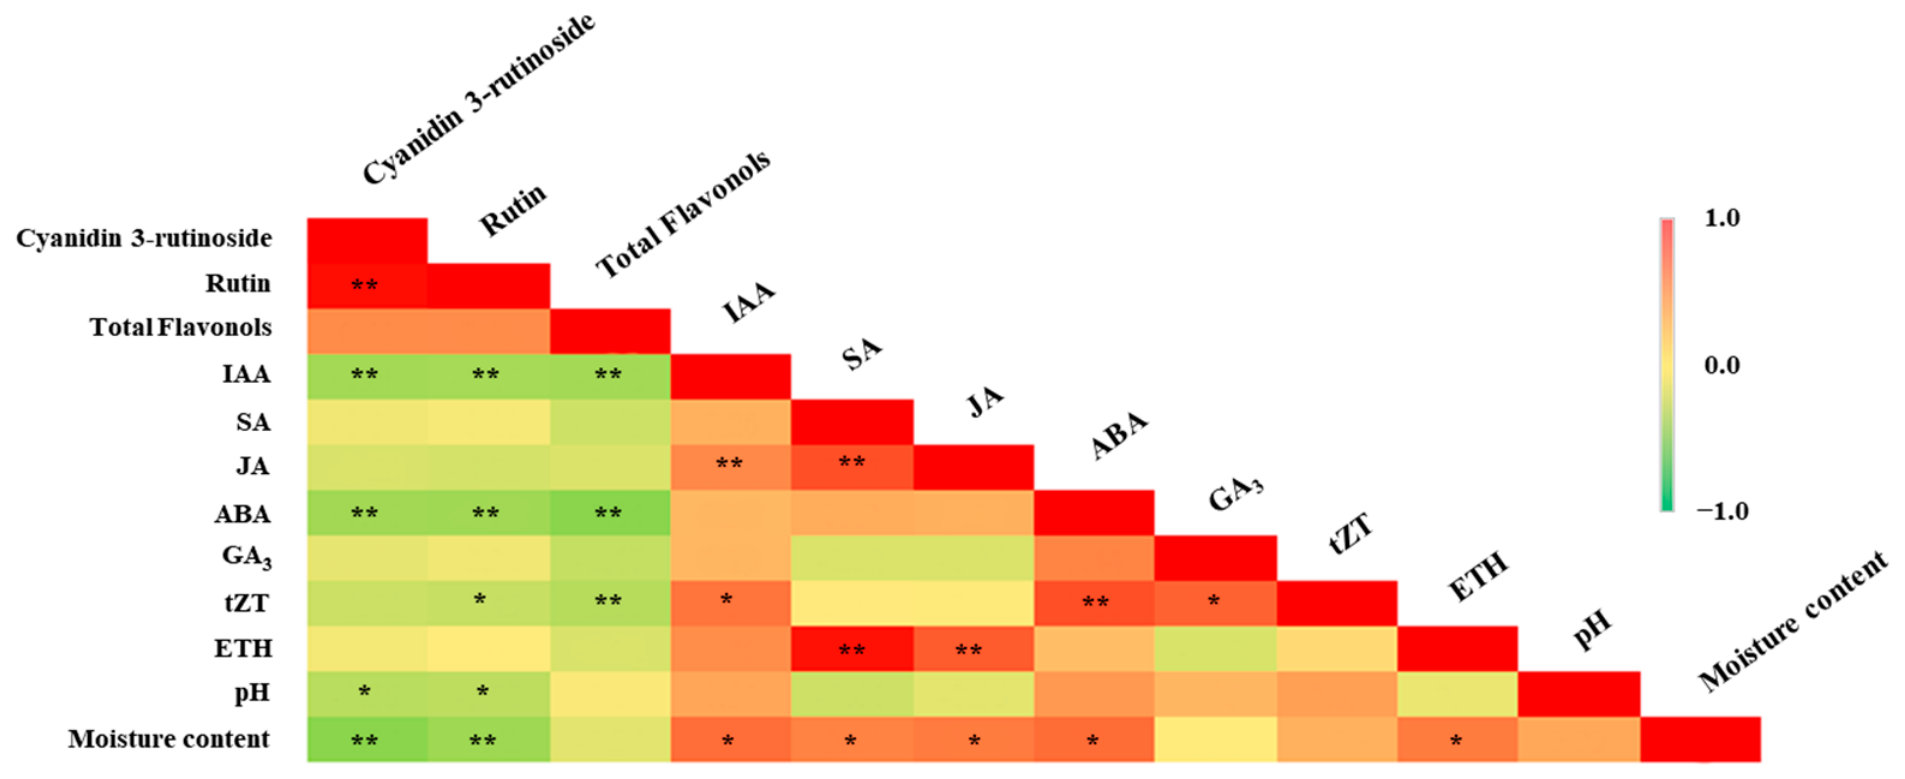
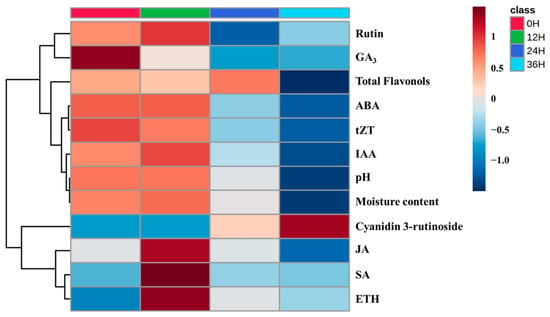
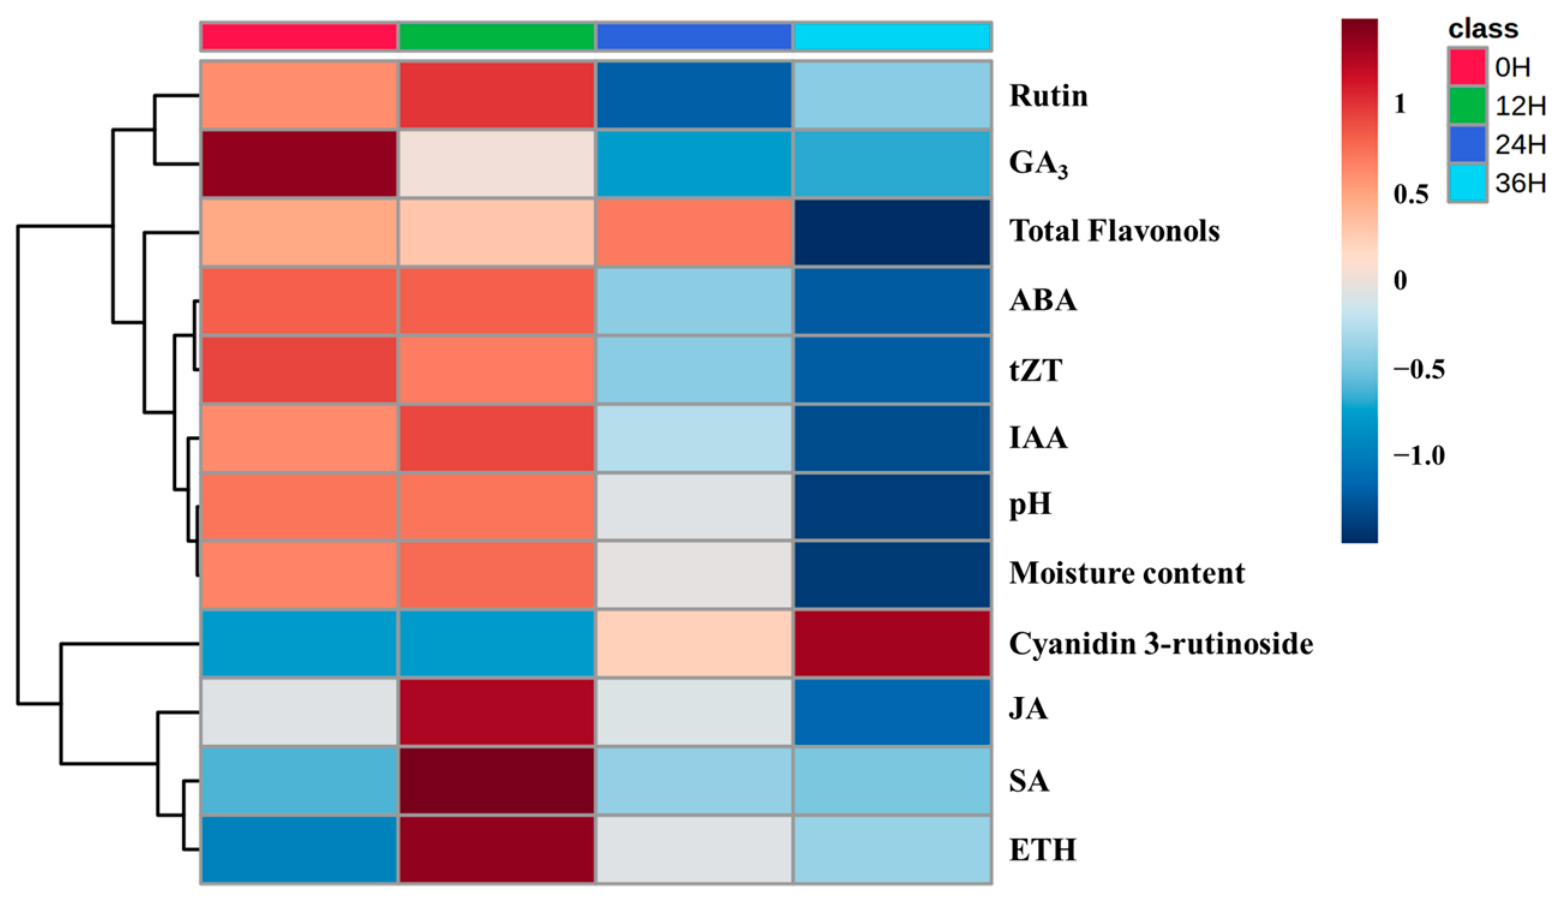
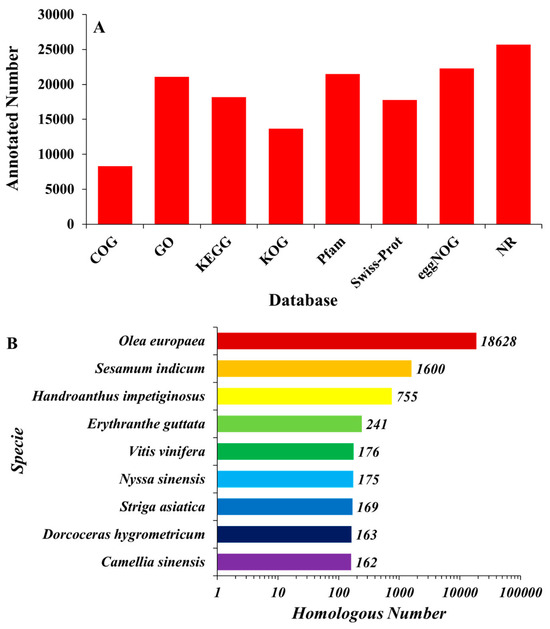
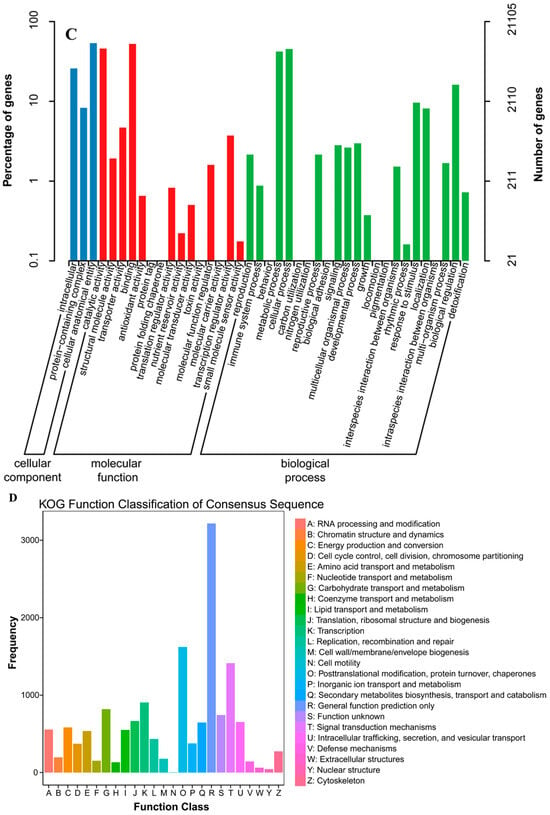
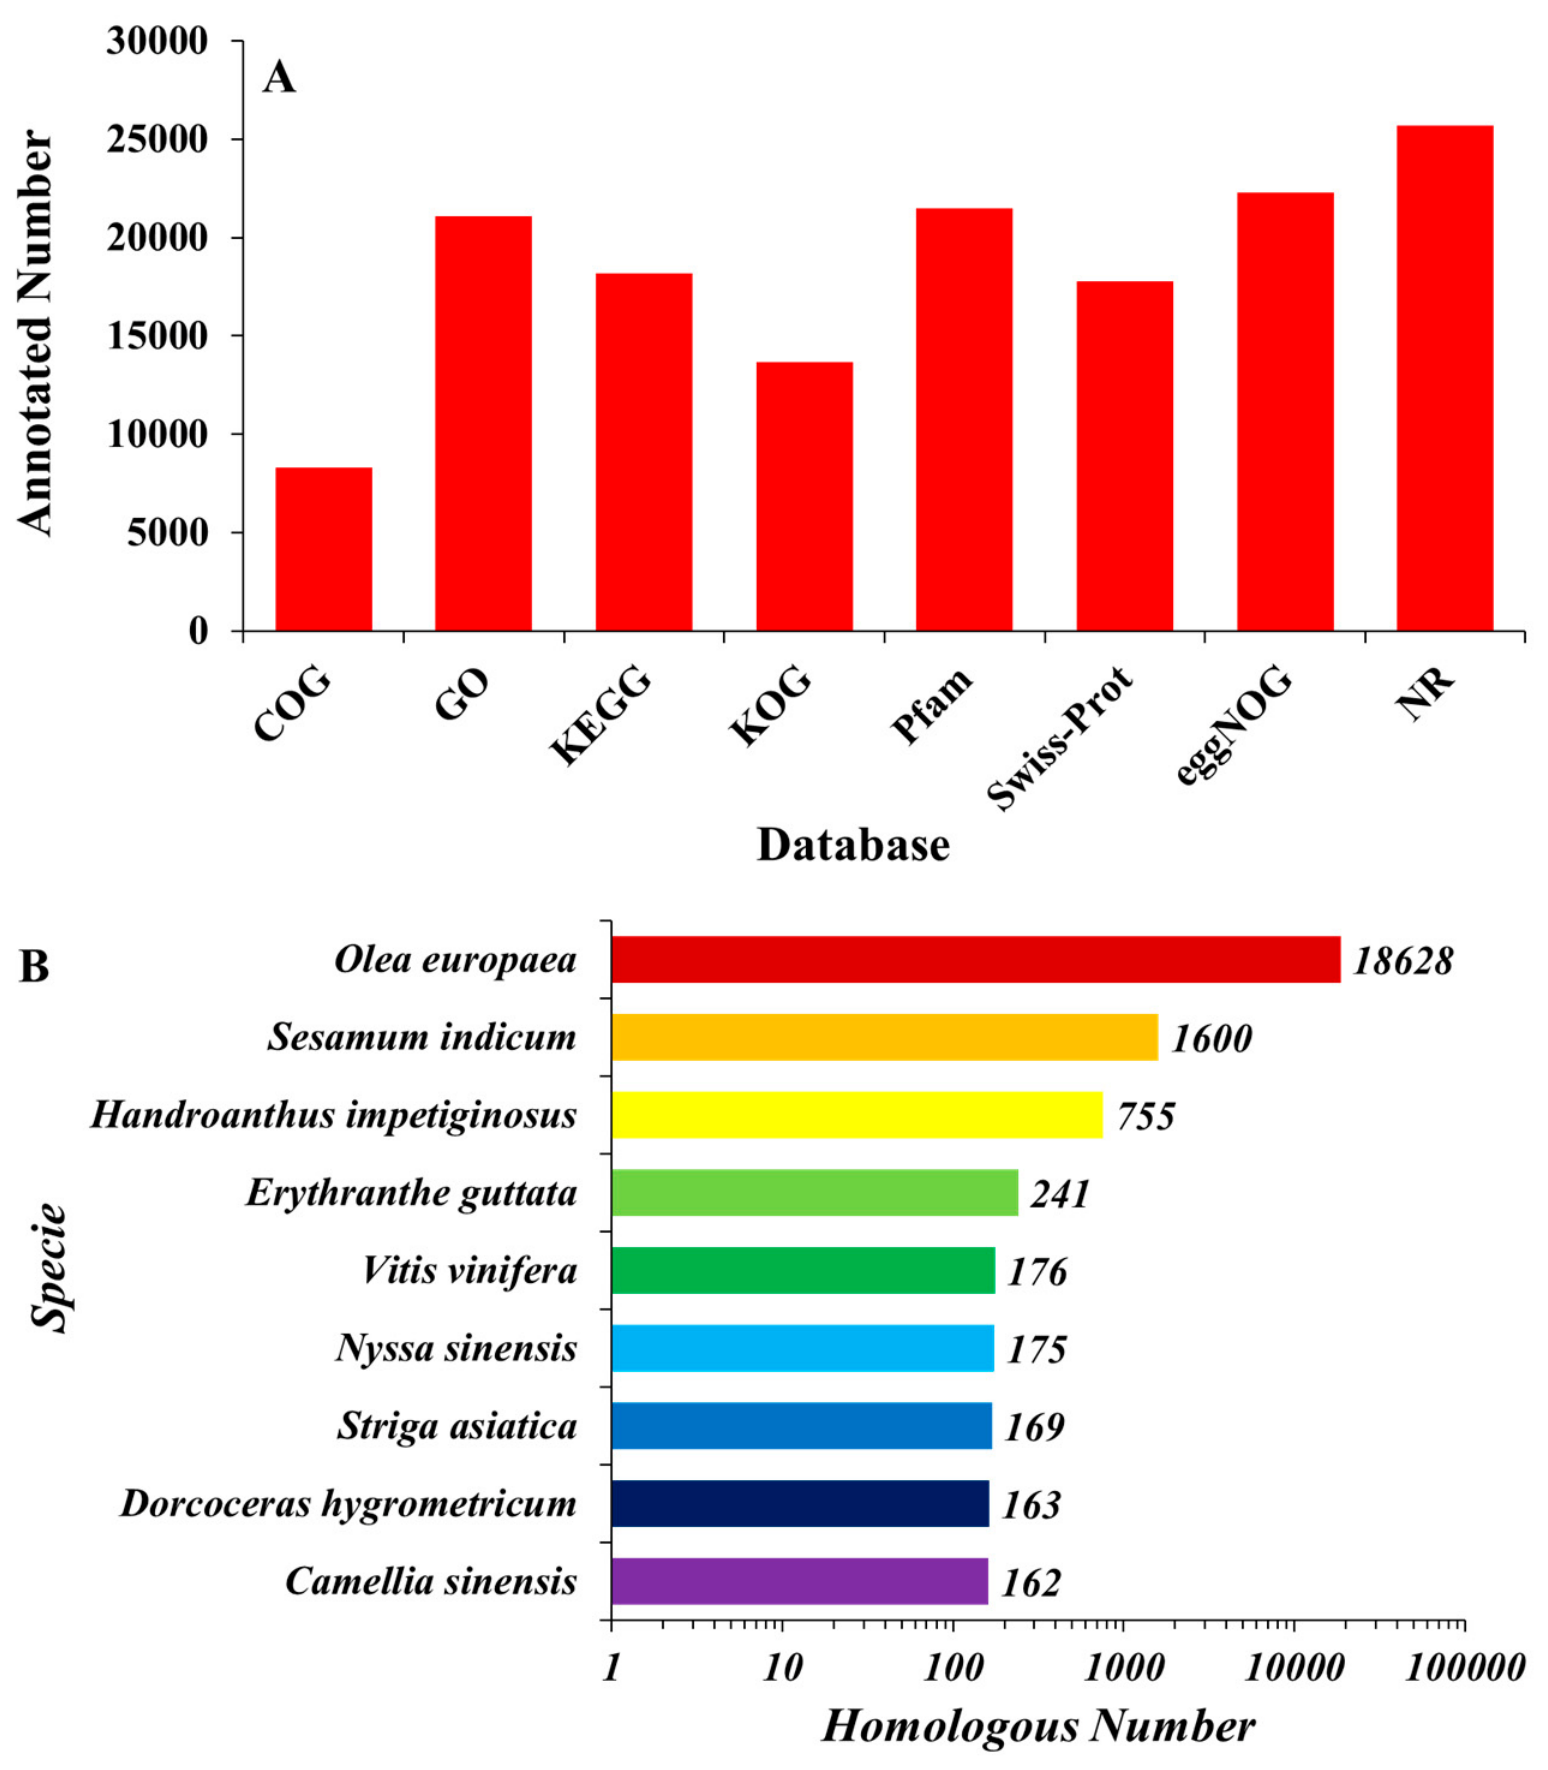
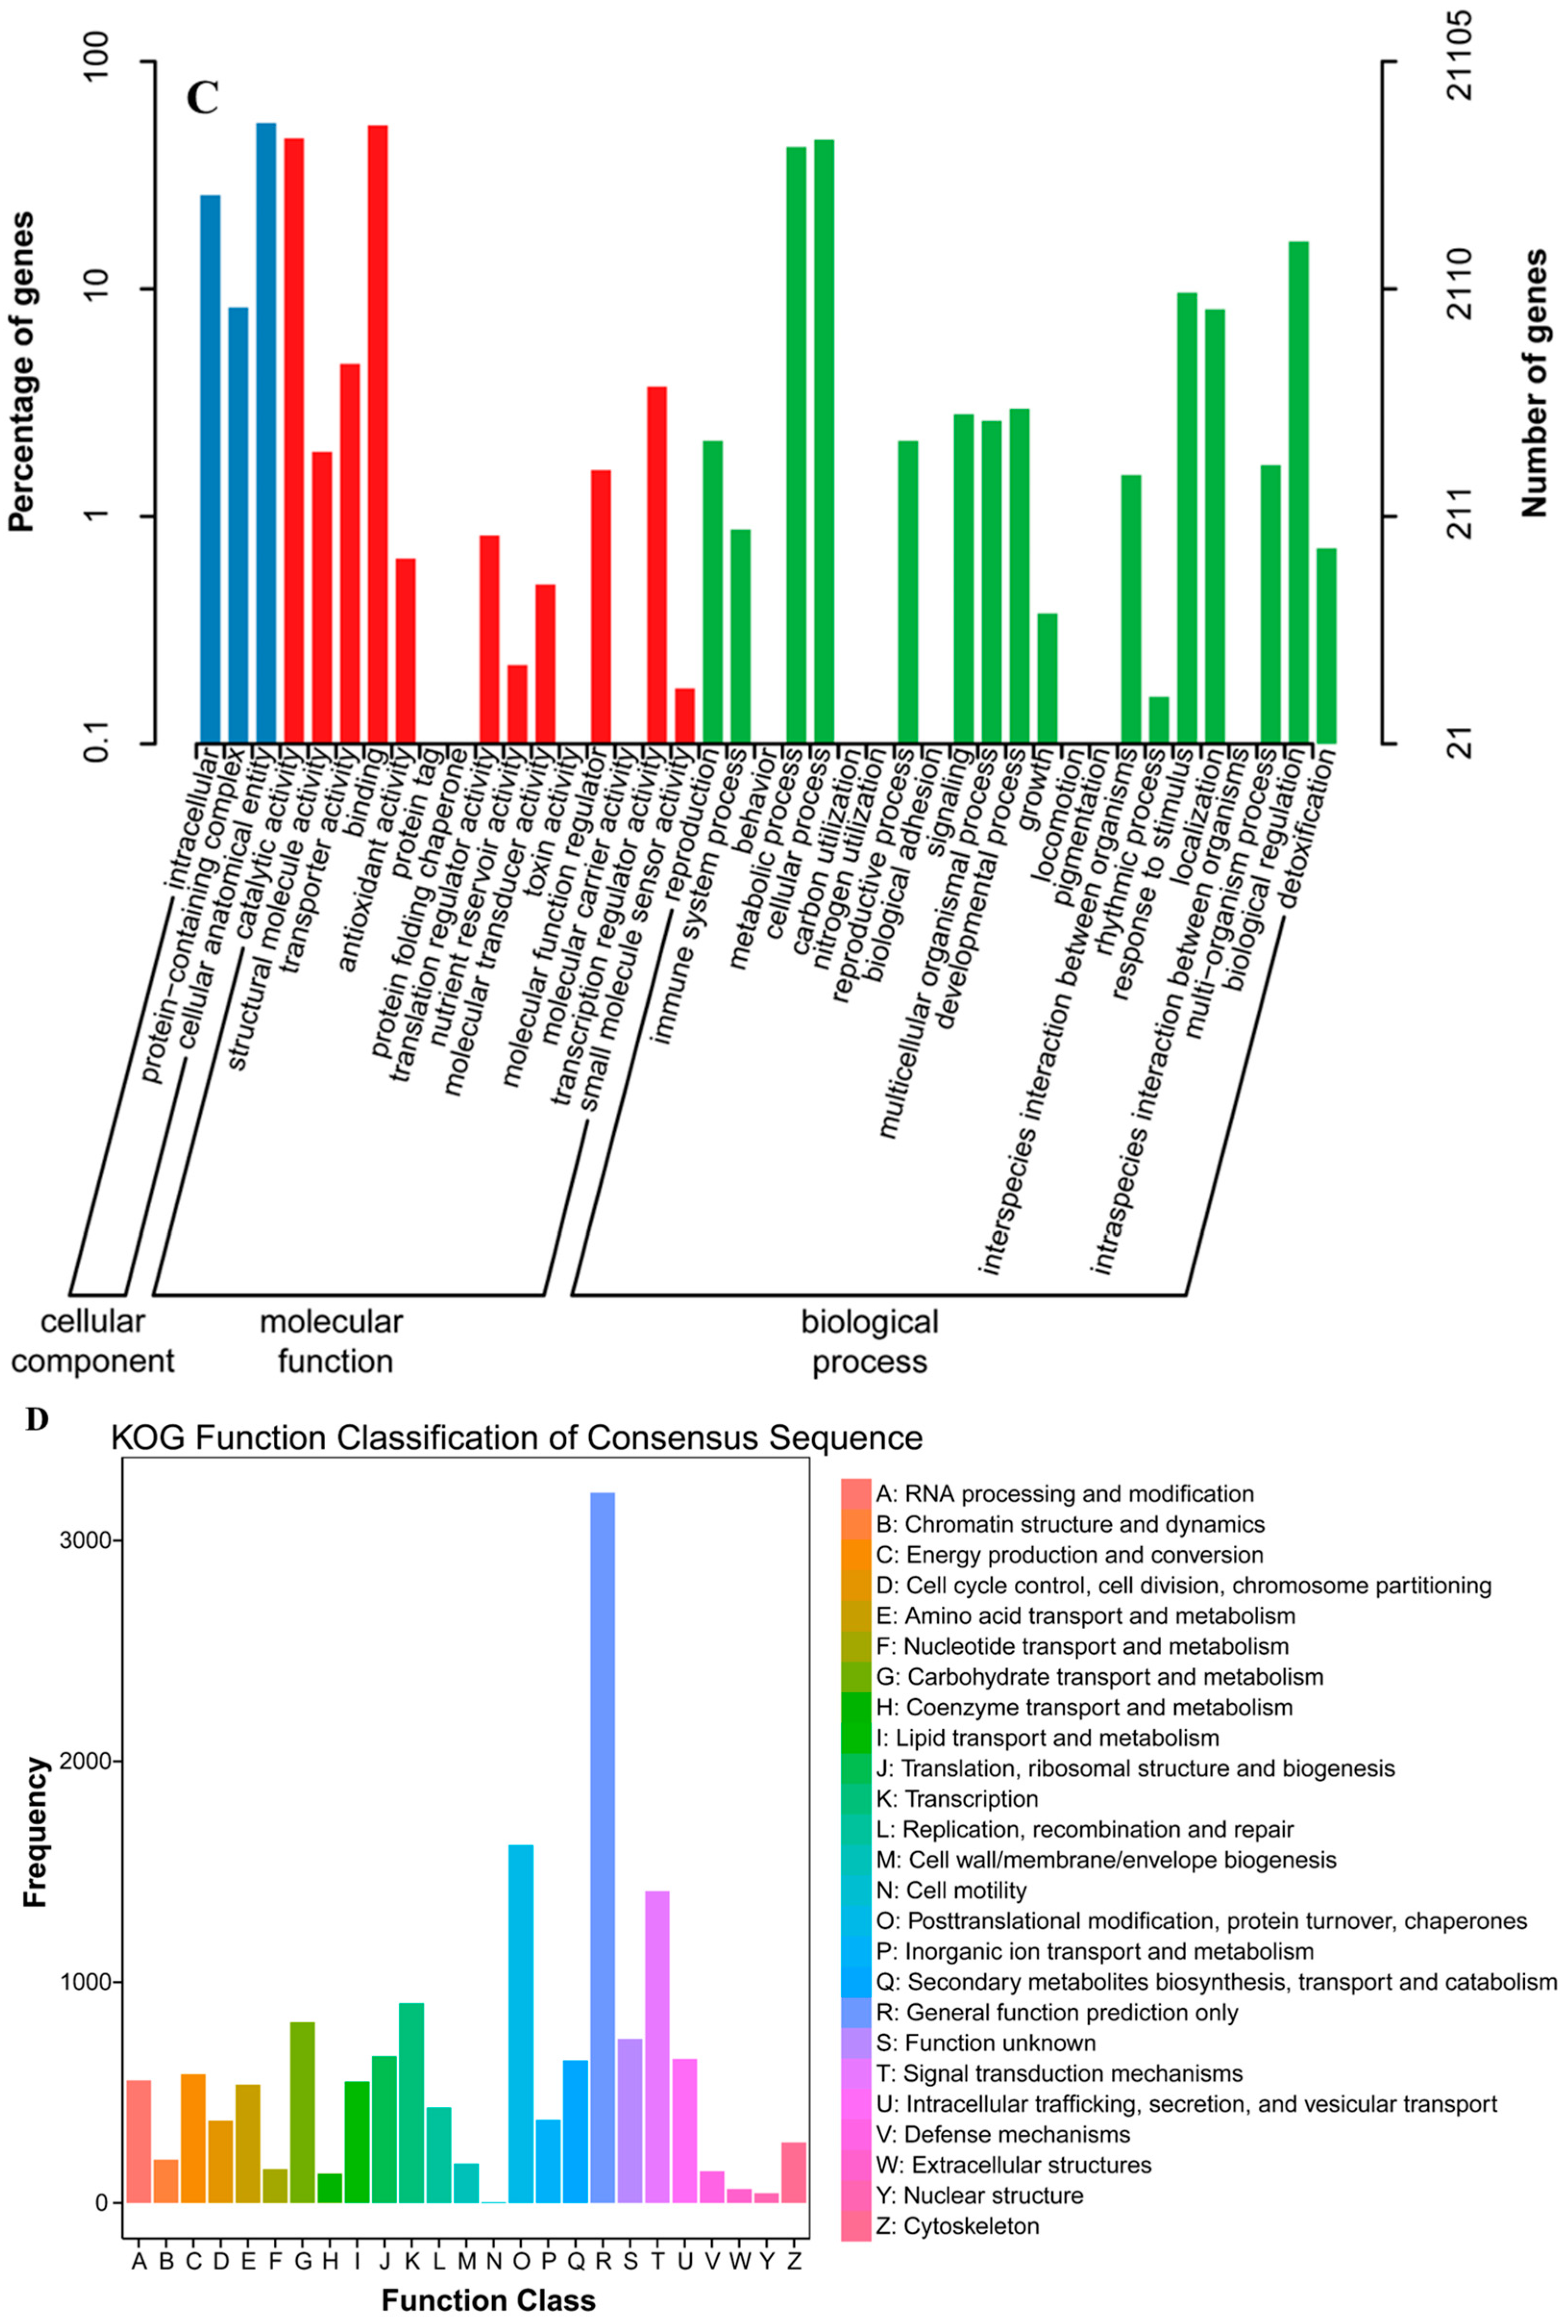
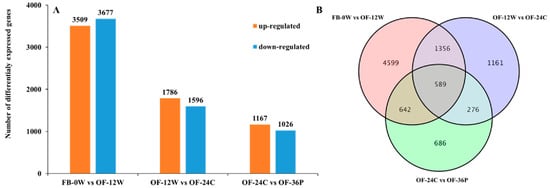
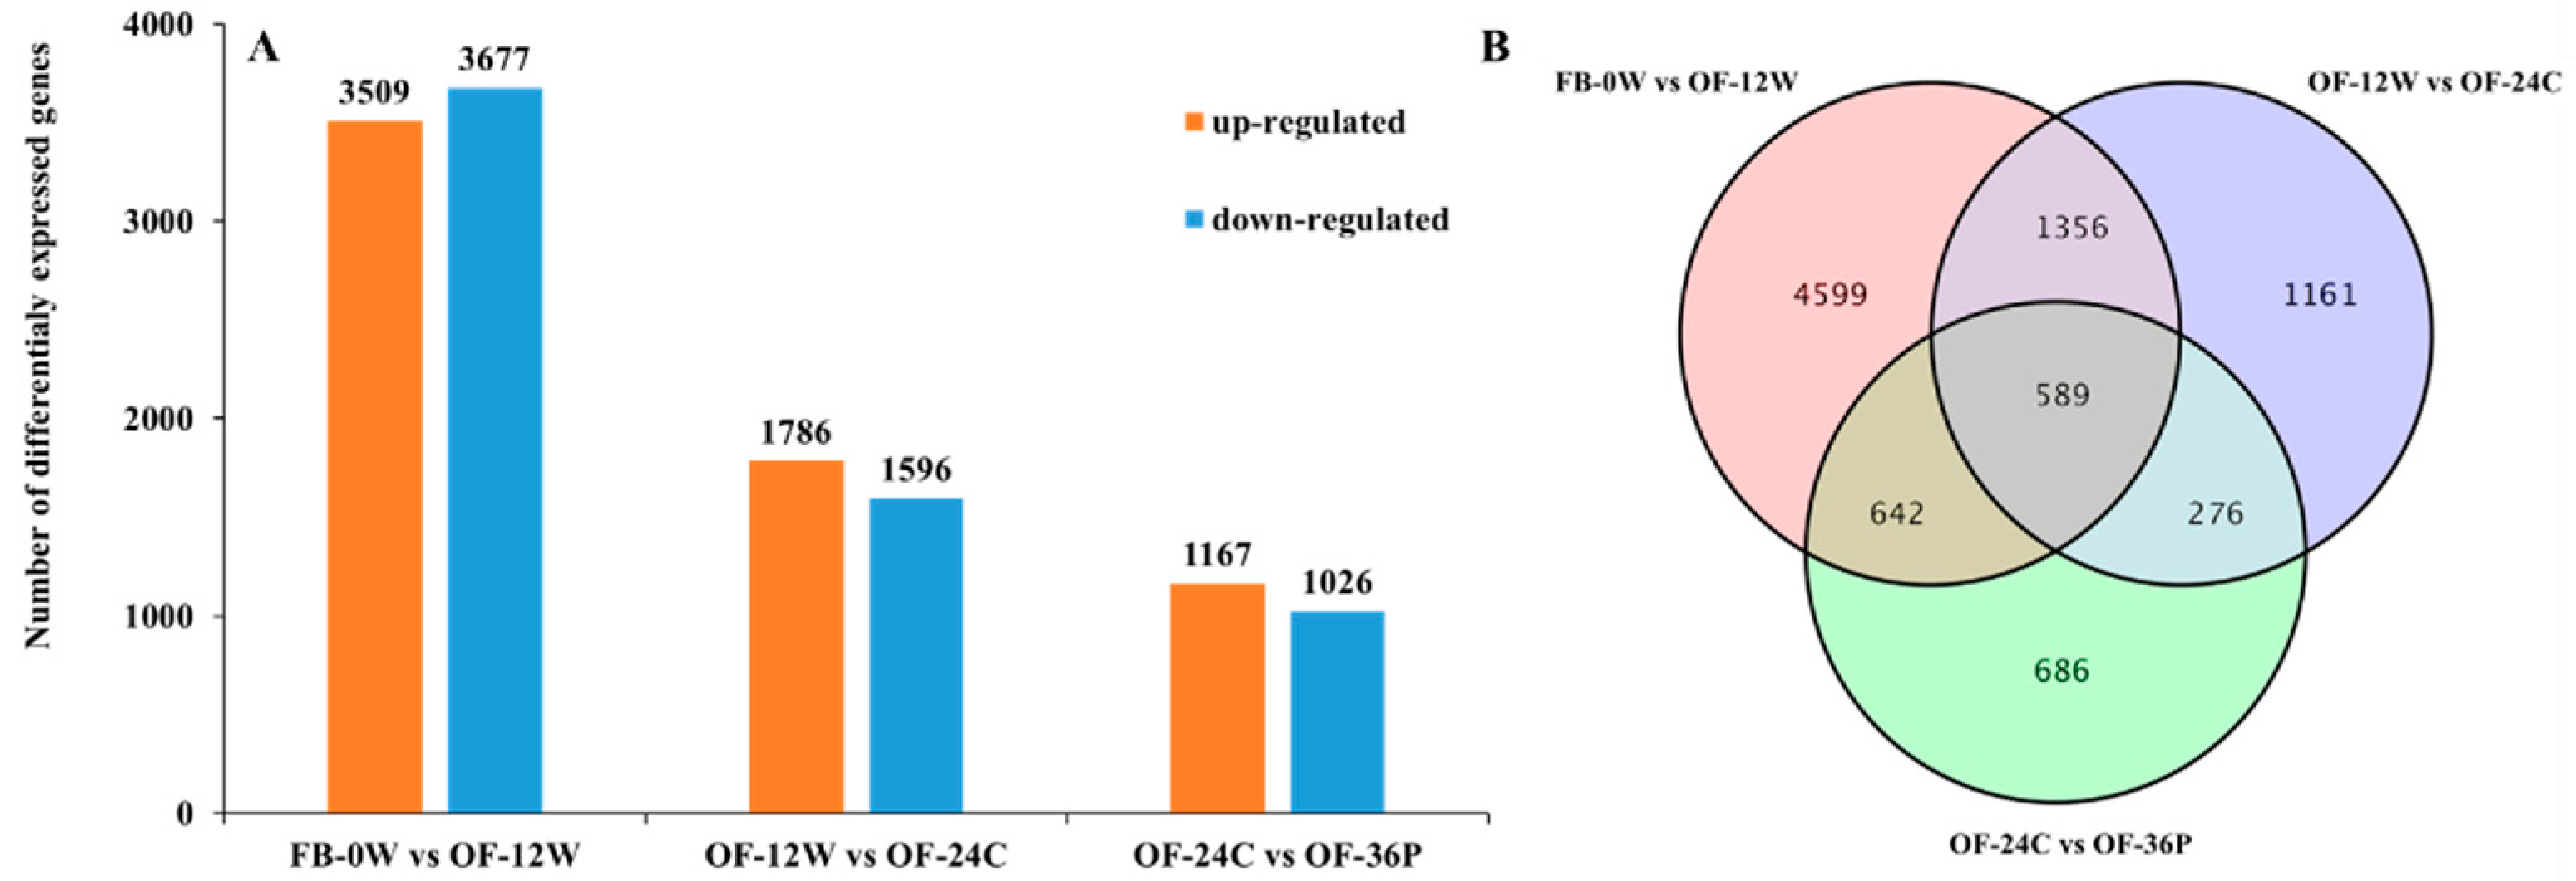
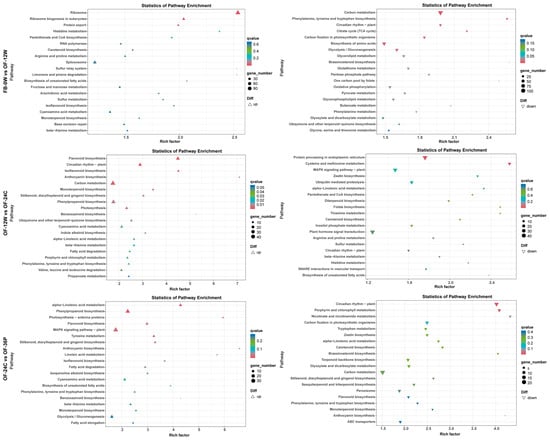
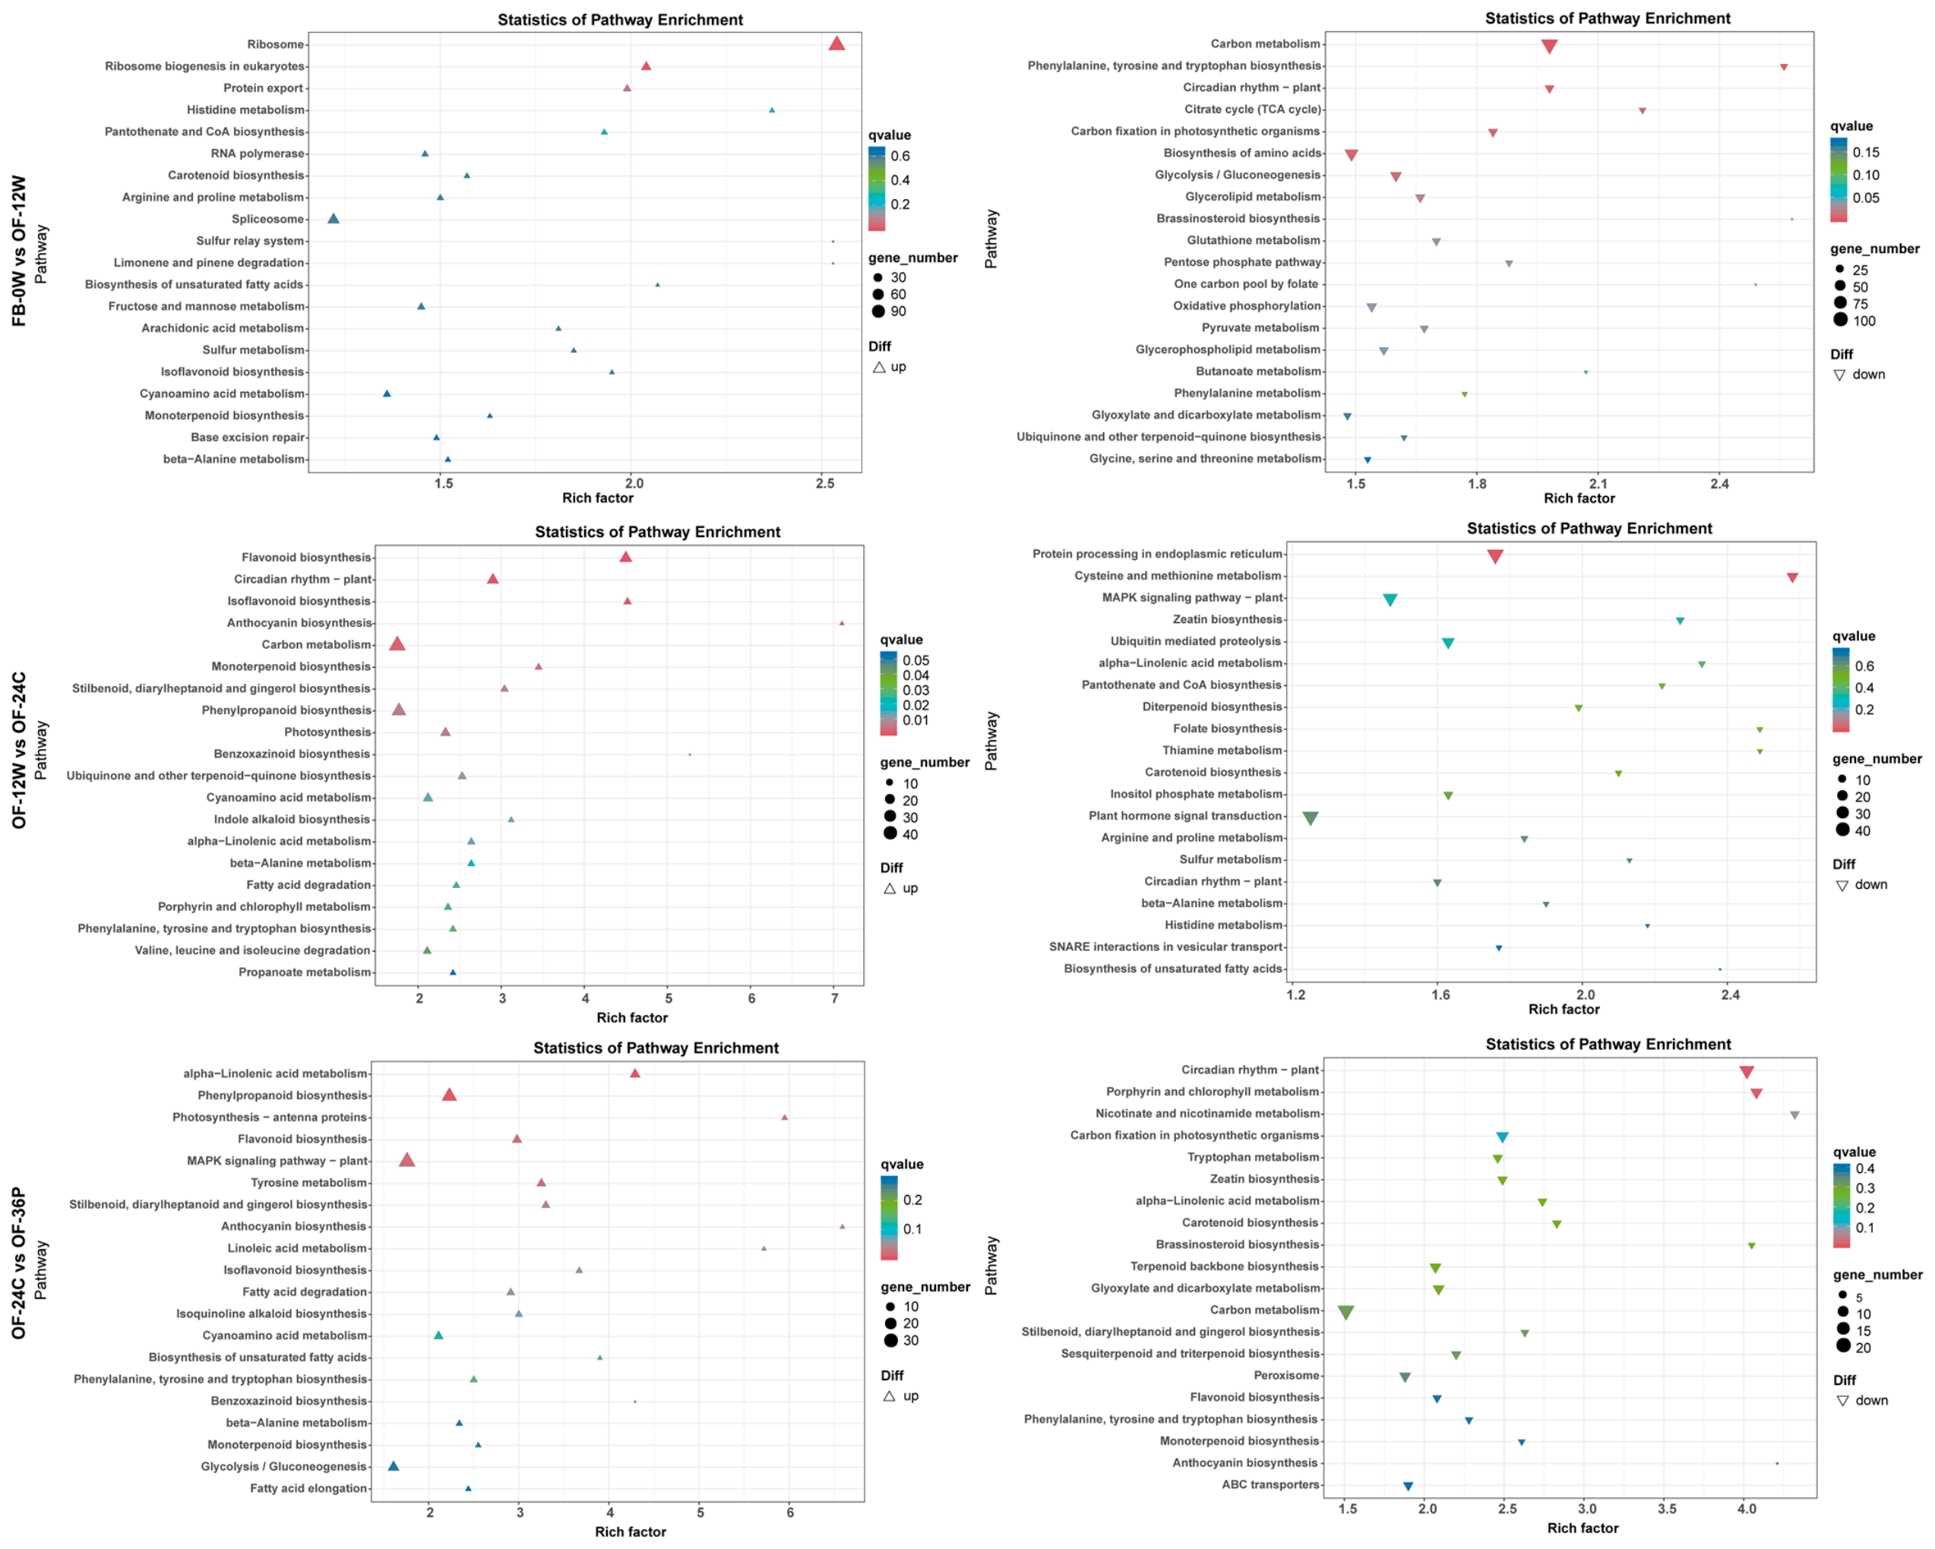
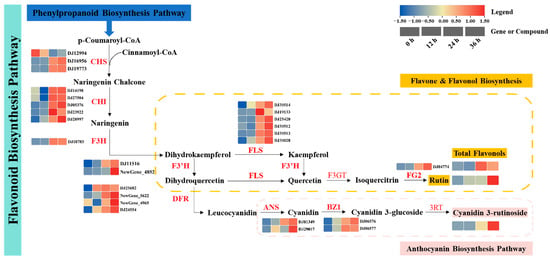
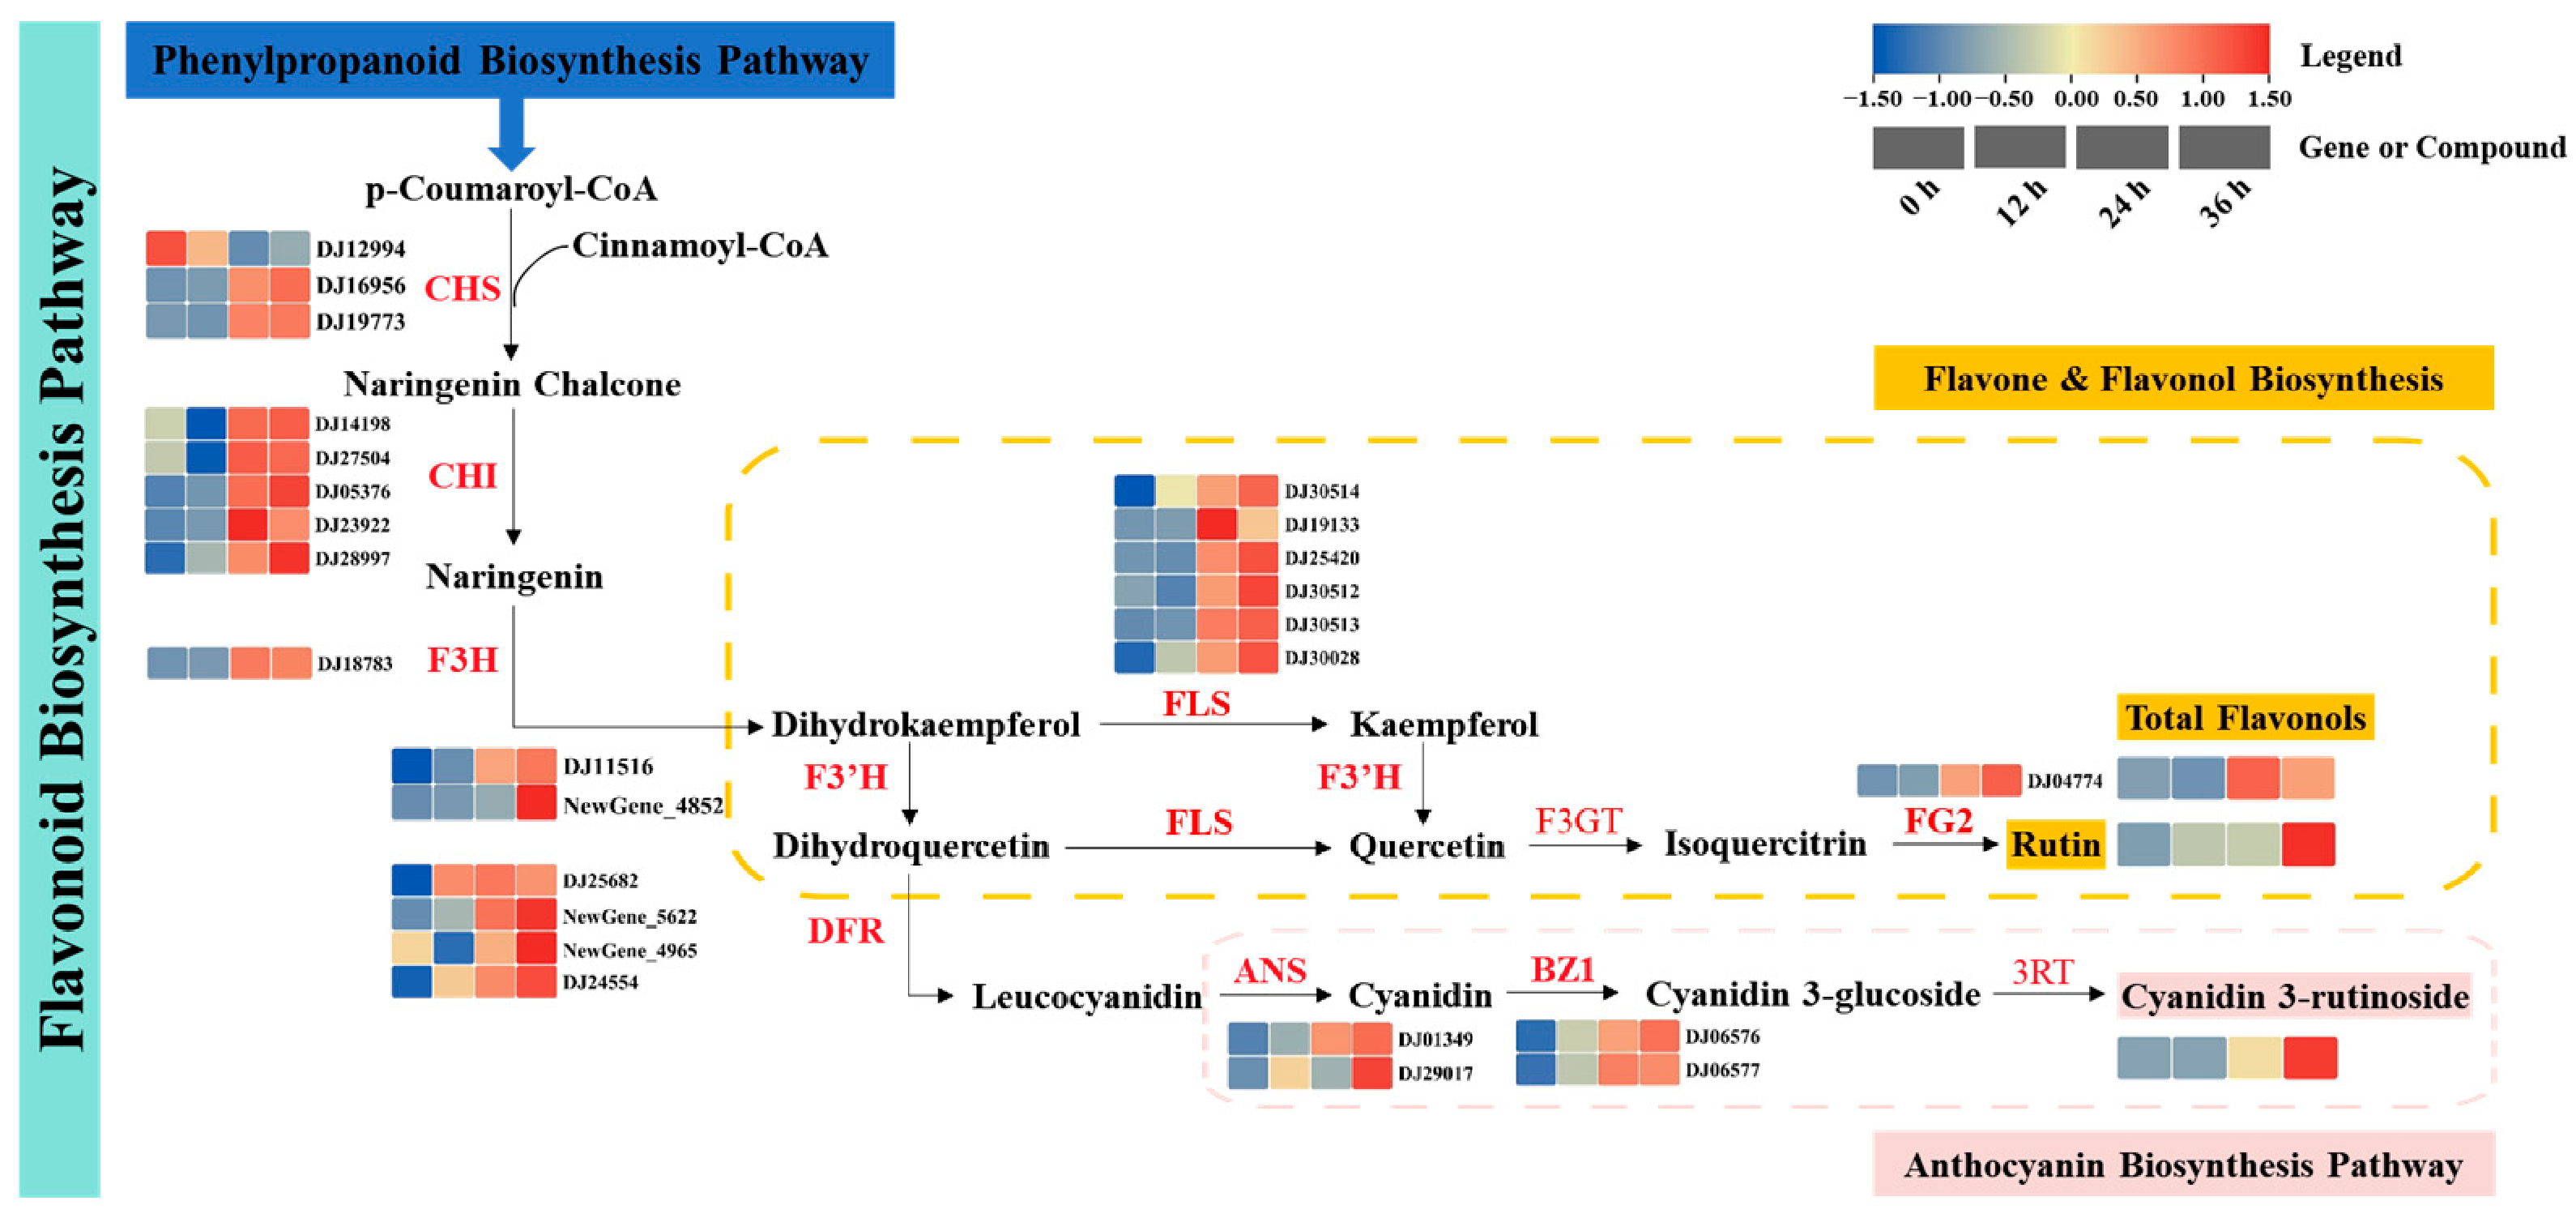
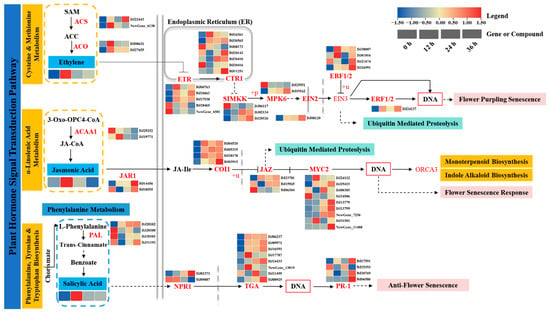
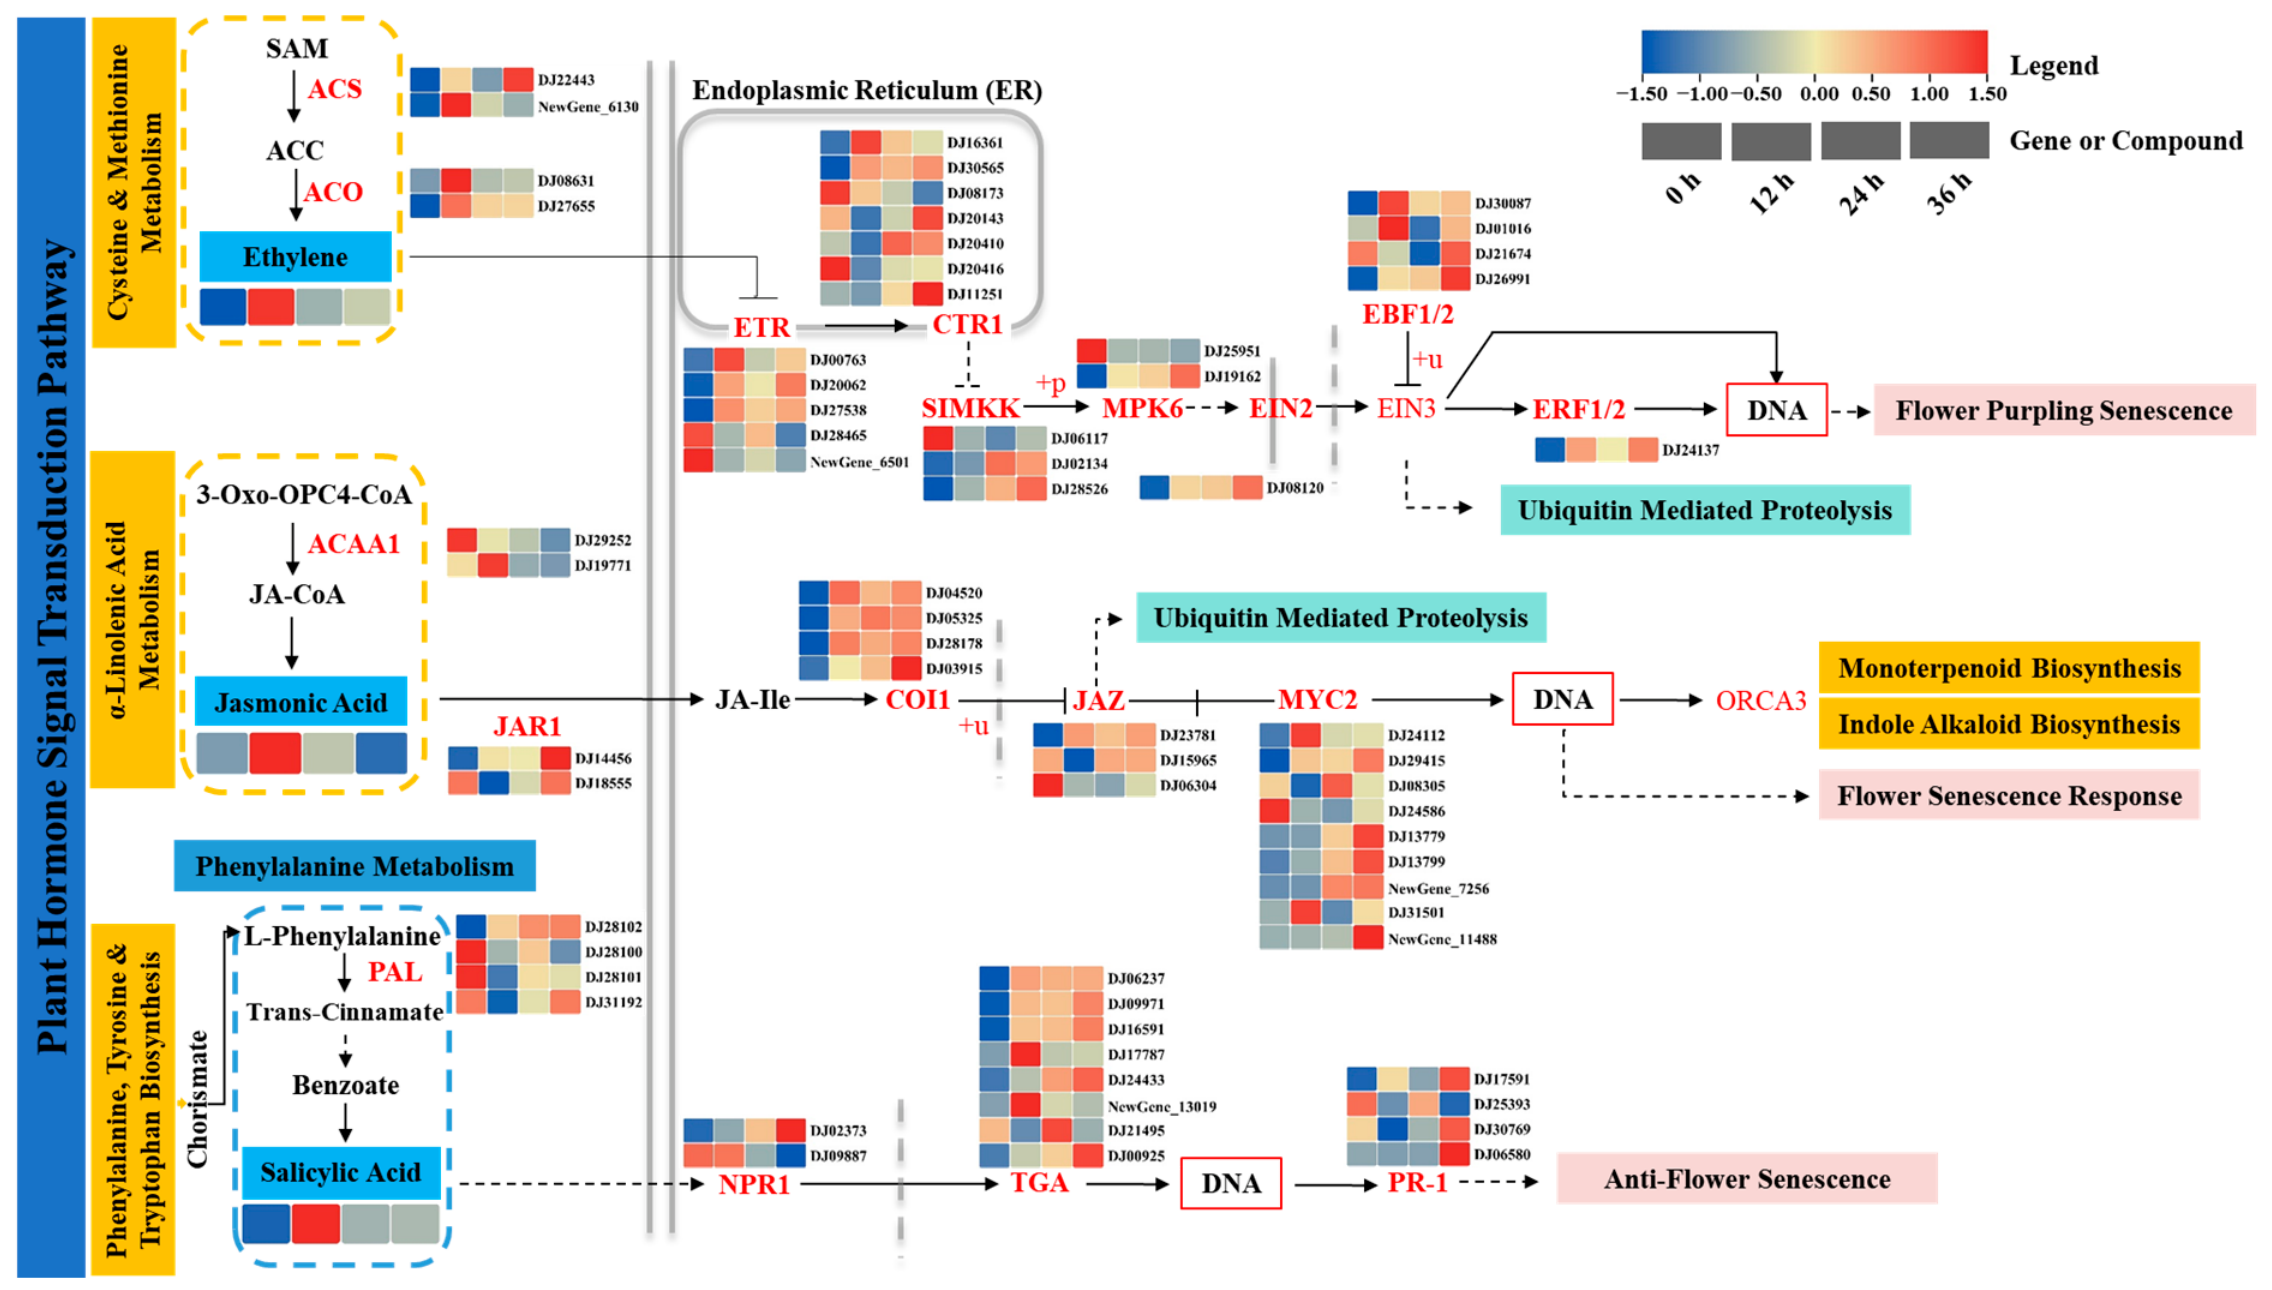
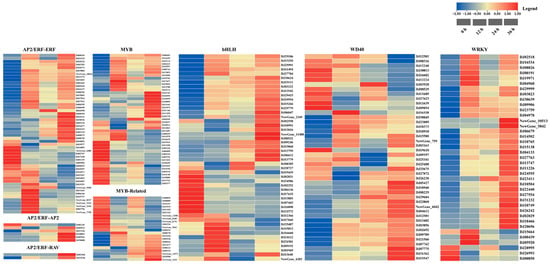
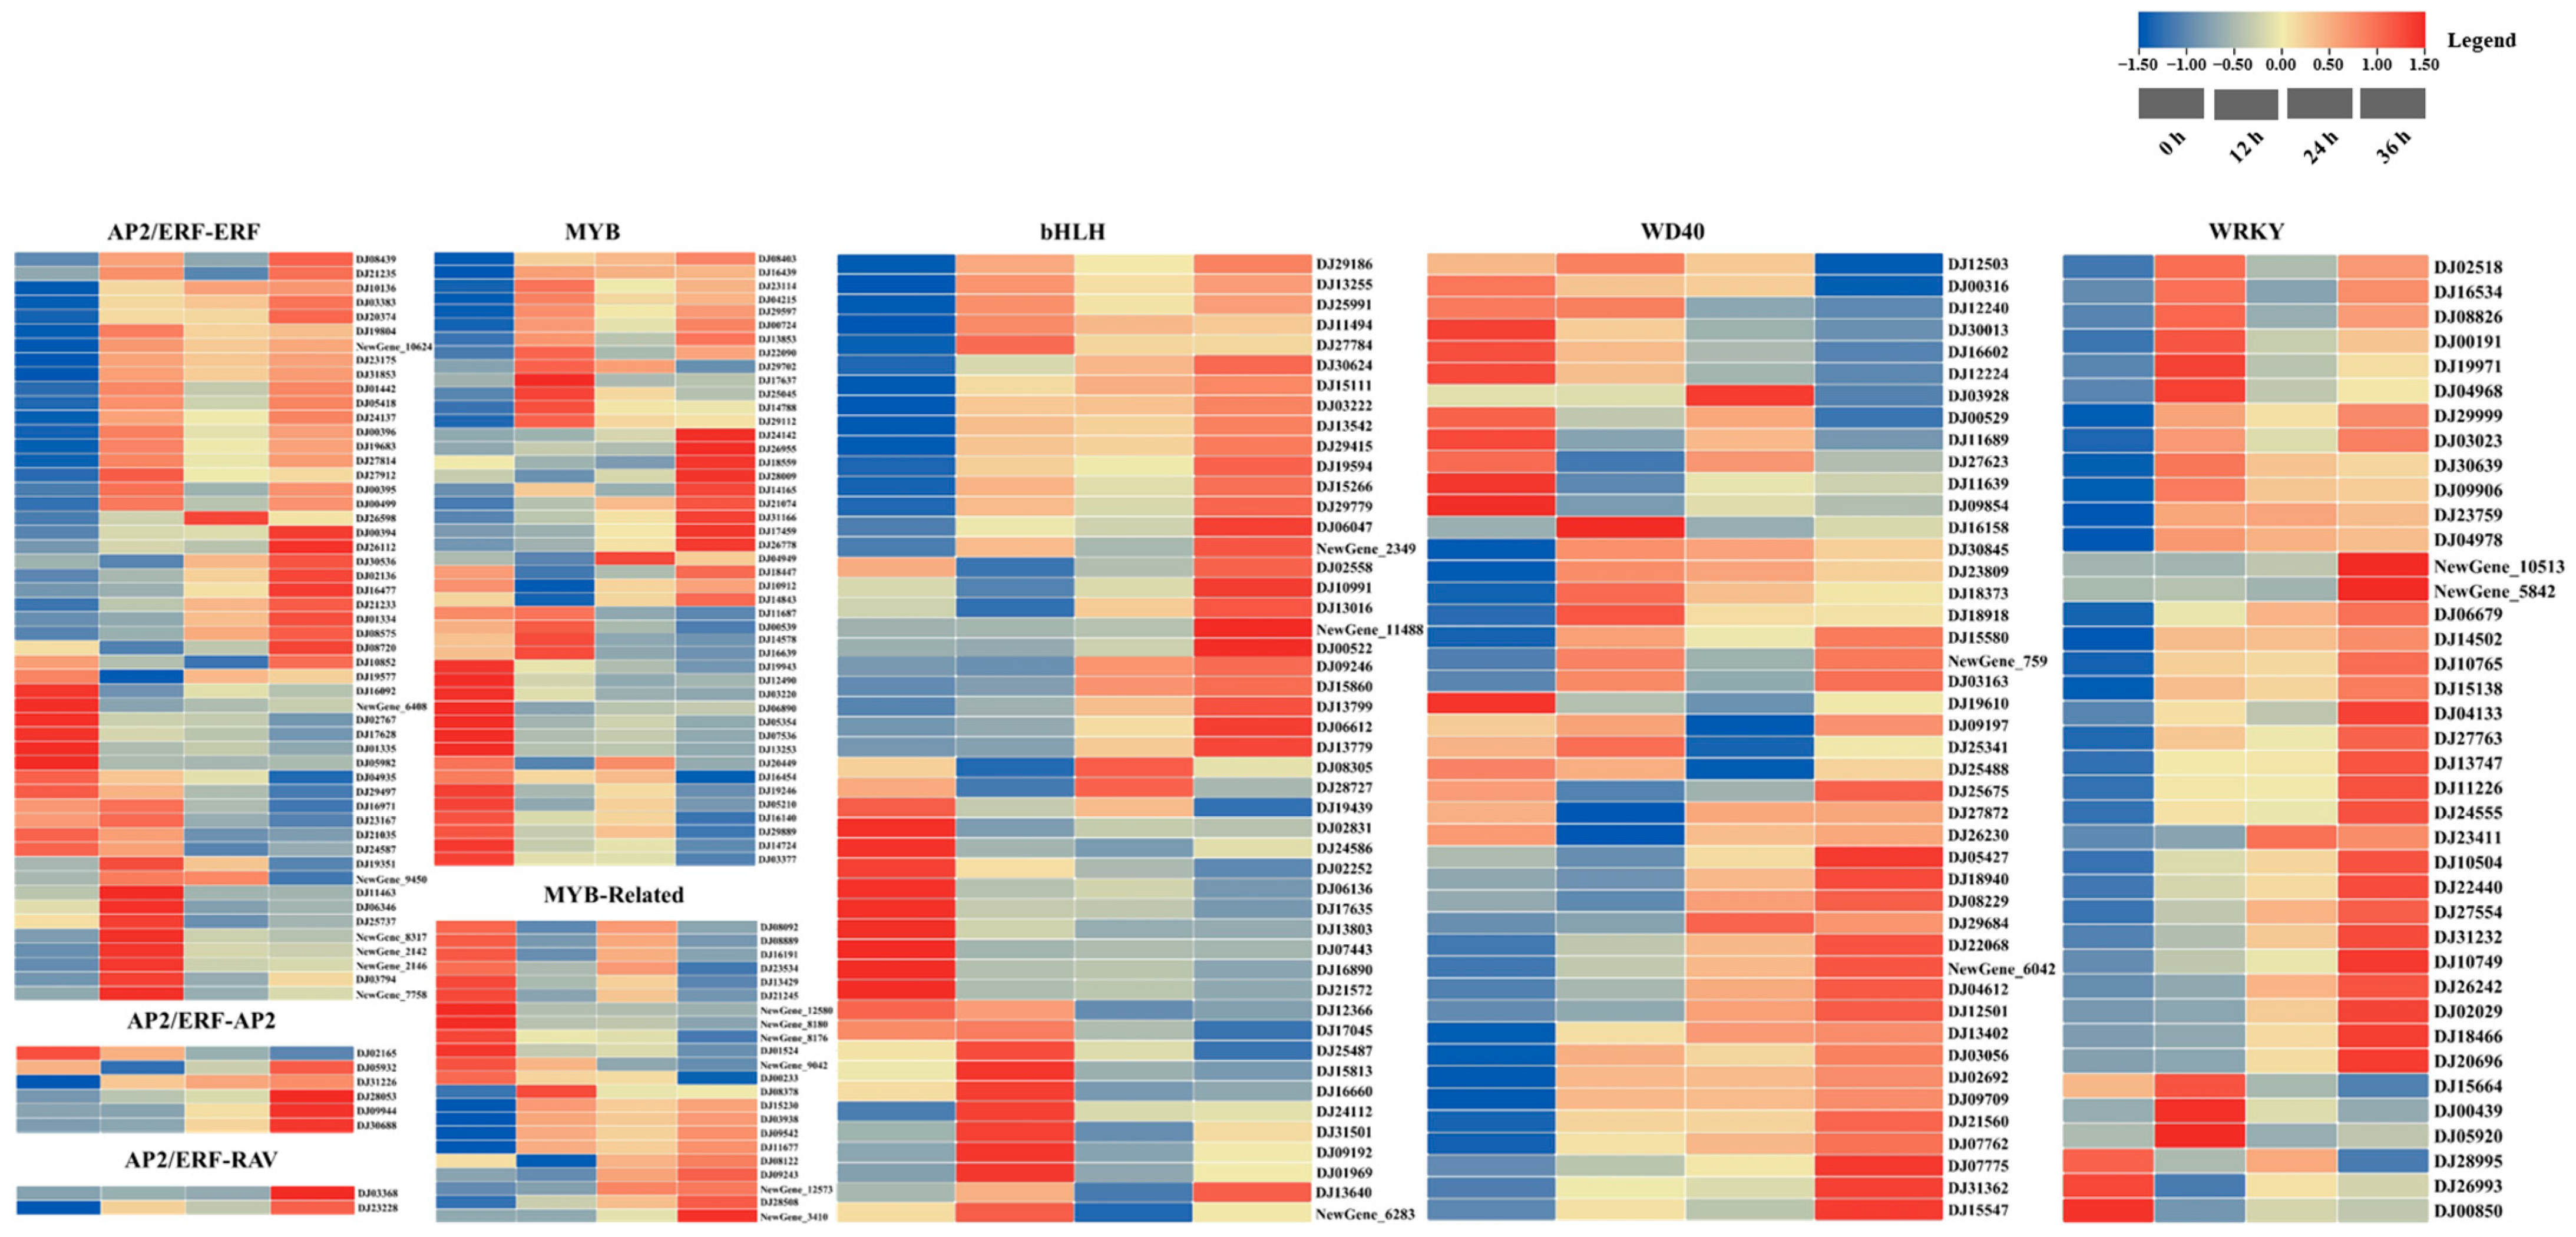
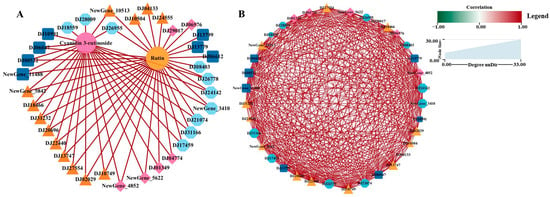
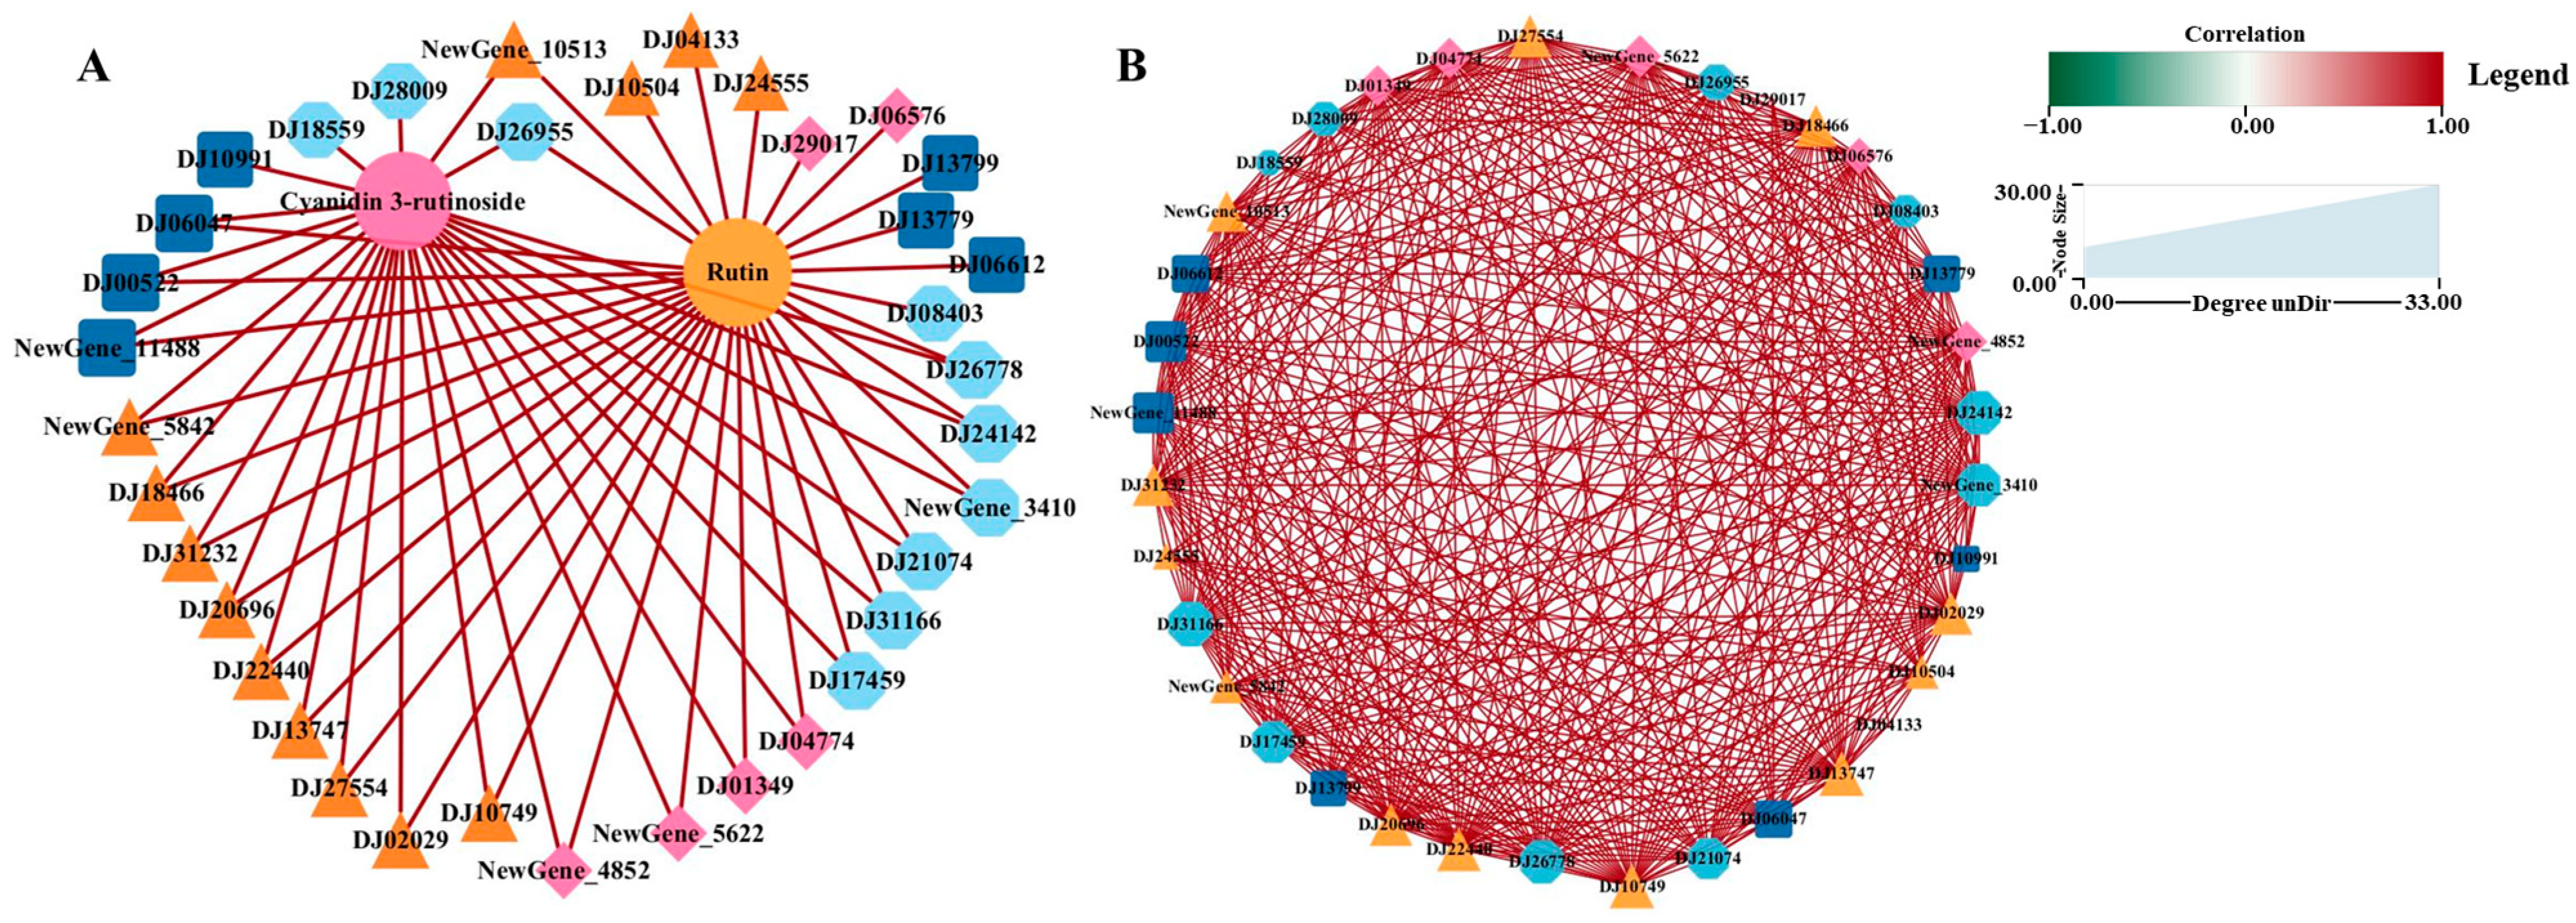
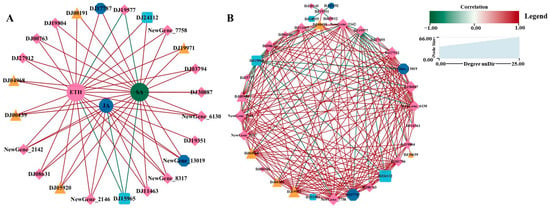
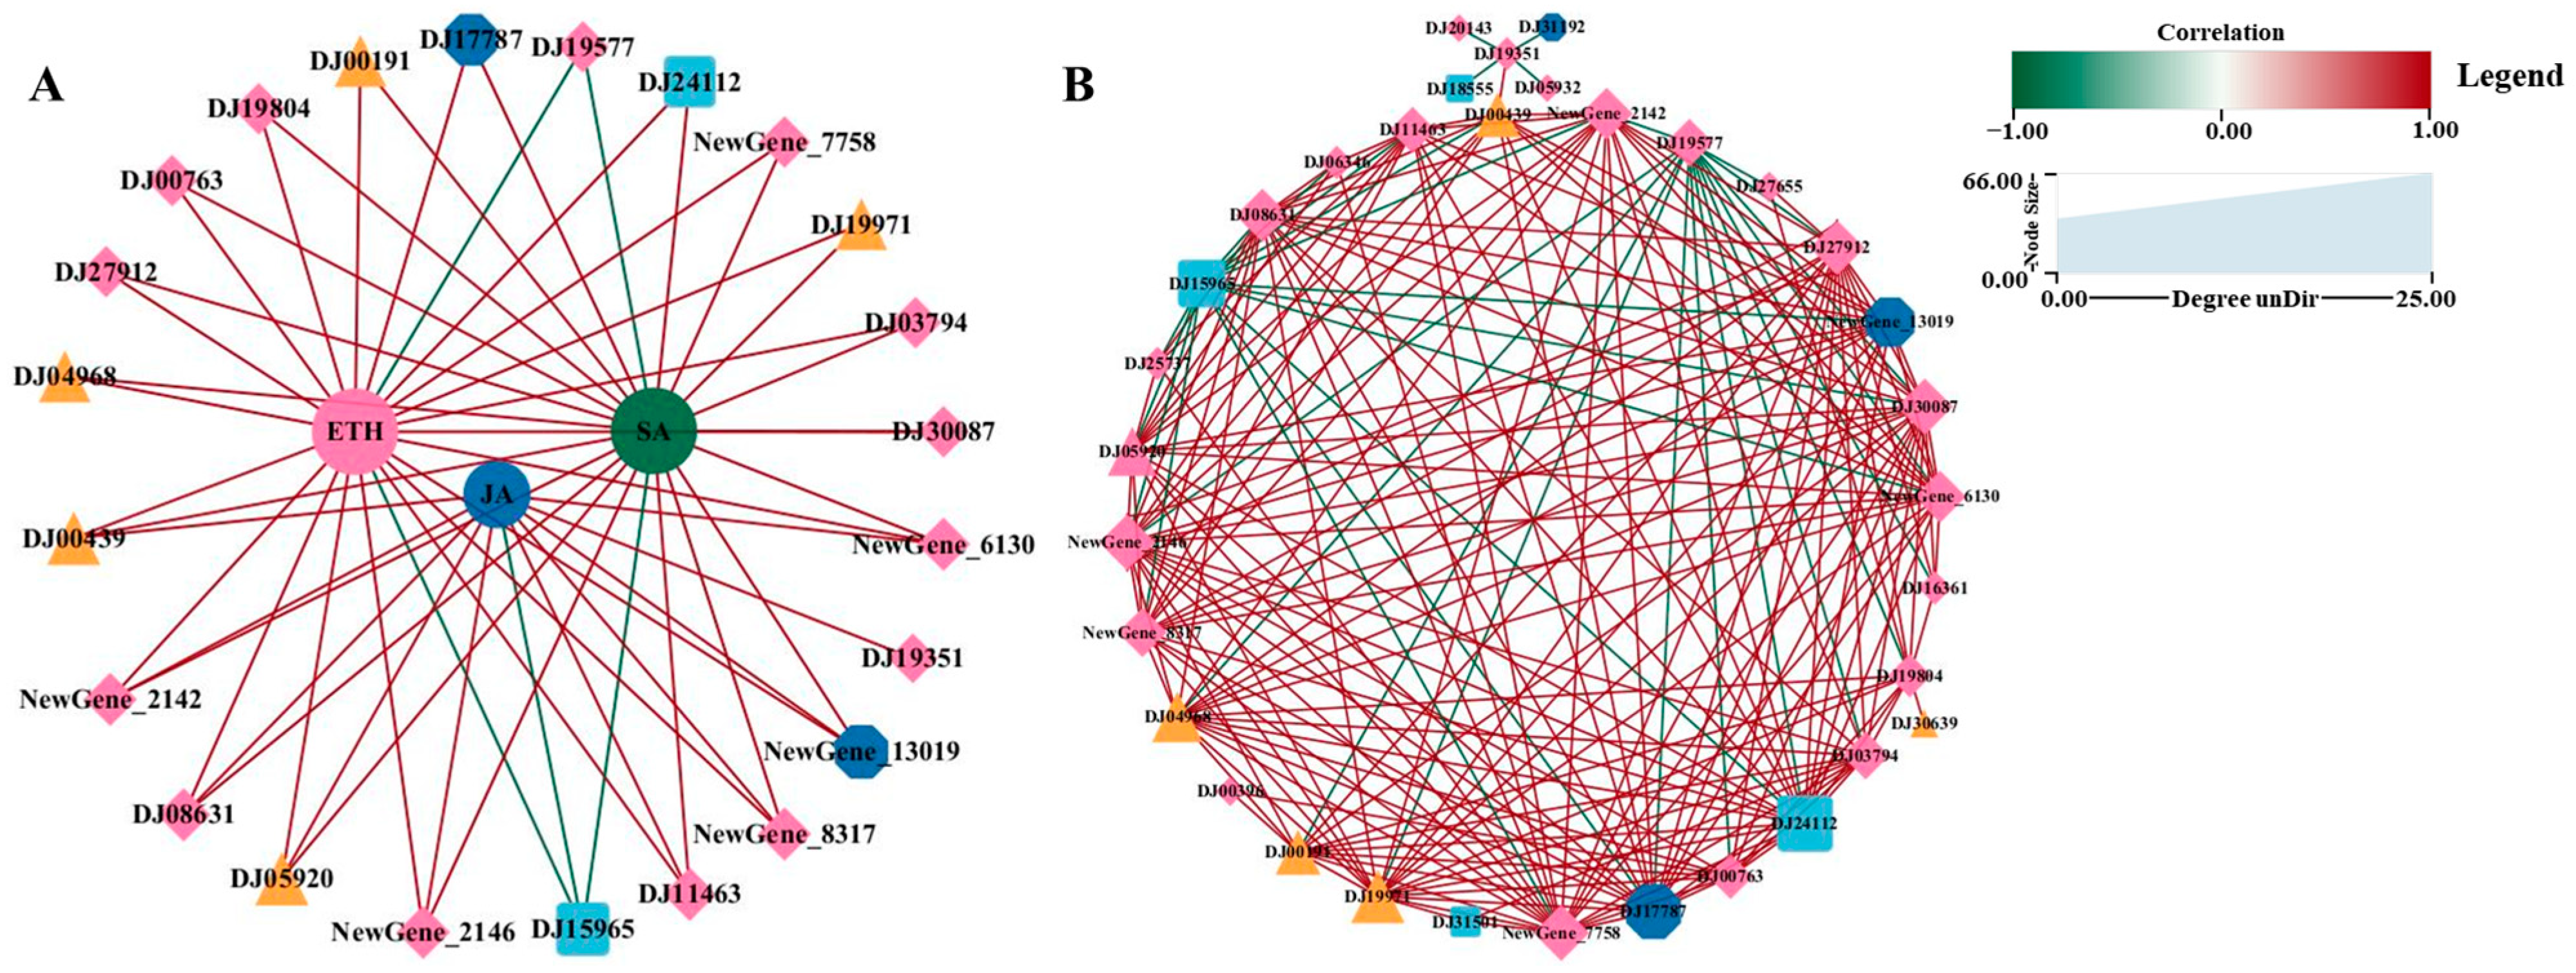

Disclaimer/Publisher’s Note: The statements, opinions and data contained in all publications are solely those of the individual author(s) and contributor(s) and not of MDPI and/or the editor(s). MDPI and/or the editor(s) disclaim responsibility for any injury to people or property resulting from any ideas, methods, instructions or products referred to in the content. |
© 2026 by the authors. Licensee MDPI, Basel, Switzerland. This article is an open access article distributed under the terms and conditions of the Creative Commons Attribution (CC BY) license.